Embed Size (px)
Citation preview
1
Femtosecond Laser Mass Spectroscopy of
Cyclic Aromatic Hydrocarbons
By
Amit Bagga
December 2017
Thesis submitted to the Faculty of Graduate Studies in partial fulfillment of
the requirements for a Master’s degree in Physics
Department of Physics Faculty of Science University of Ottawa
© Amit Bagga, Ottawa, Canada, 2017
ii
Contents
Table of Figures .............................................................................................................................. v
Table of Abbreviations ................................................................................................................. vii
Abstract ........................................................................................................................................... 1
Chapter 1: Background ................................................................................................................... 2
1.1 Overview ............................................................................................................................... 2
1.2 Motivation for the Experiment .............................................................................................. 3
1.3 Light – Matter Interaction ..................................................................................................... 3
1.4 Strong Field Laser Interaction with Molecules ..................................................................... 4
1.4.1 Ionization Regimes ......................................................................................................... 4
1.4.2 Multi-photon Ionization (MPI) ....................................................................................... 5
1.4.3 Tunnelling ....................................................................................................................... 6
1.4.4 Keldysh Parameter .......................................................................................................... 7
1.5 Multiply Charged Ions .......................................................................................................... 9
1.5.1 Sequential Ionization ...................................................................................................... 9
1.5.2 Non-Sequential Double Ionization (NSDI) .................................................................... 9
1.6 High Harmonic Generation Three Step Model ................................................................... 10
Chapter 2: Cyclic Aromatic Hydrocarbon Molecules .................................................................. 13
2.1 Contemporary Studies into Aromatic Molecules ................................................................ 14
2.2 Specific Aromatics under Study .......................................................................................... 15
Chapter 3: Experimental Setup ..................................................................................................... 17
3.1 Time-Of-Flight (TOF) Mass Spectroscopy ......................................................................... 17
3.2 Laser Used for the Experiment: .......................................................................................... 17
3.3 Achievement of Vacuum and Gas Sample .......................................................................... 18
iii
3.4 Time of Flight (TOF) .......................................................................................................... 19
3.4.1 Time Delay Calculation and Data Translation ............................................................. 21
3.4.2 Data Capture ................................................................................................................. 21
Chapter 4: Aromatic Hydrocarbons Experiment .......................................................................... 23
4.1 Alignment and Optimization ............................................................................................... 23
4.2 Variation of Pulse Energy ................................................................................................... 25
4.3 Polarization Control ............................................................................................................ 25
4.4 Wavelength Variation ......................................................................................................... 26
4.5 Discriminating TOF Peaks .................................................................................................. 27
4.5.1 Mass Calibration ........................................................................................................... 27
4.5.2 Confirmation of Parent Ions ......................................................................................... 28
Chapter 5: Photoionization of Aromatic Molecules ..................................................................... 31
5.1 Intensity Calibration ............................................................................................................ 31
5.2 Aromatic Molecule Saturation Intensities ........................................................................... 33
5.2.1 Plot 800nm, Linear Polarization ................................................................................... 34
5.2.2 Plot 800nm, Circular Polarization ................................................................................ 35
5.2.3 Plot 1866nm, Circular Polarization .............................................................................. 36
5.2.4 Plot 1866nm, Circular Polarization .............................................................................. 37
5.3 Polarization Variation: ........................................................................................................ 38
5.3.1 Photoionization with Linear and Circular Polarization ................................................ 39
5.3.2 Elliptical Polarization Variation ................................................................................... 41
5.3.3 Elliptical Polarization Variation at 9 μJ........................................................................ 42
5.3.4 Elliptical Polarization Variation at 7 μJ........................................................................ 44
5.3.5 Ellipticity Curve Peak Offset ........................................................................................ 45
5.4 Photoionization and Aromaticity ........................................................................................ 47
iv
5.4.1 Singly Charged Ionization ............................................................................................ 48
5.4.2 Doubly Charged Ionization .......................................................................................... 49
5.4.3 Non-Sequential Ionization ............................................................................................ 50
5.5 HHG Results Comparison ................................................................................................... 51
5.5.1 Pyrrole/Furan (800nm) ................................................................................................. 52
5.5.2 Thiophene/Furan (800nm) ............................................................................................ 53
5.6 Comparison to Theoretical Model....................................................................................... 55
5.7 Fragmentation Analysis ...................................................................................................... 58
Chapter 6: Future Work ................................................................................................................ 60
6.1 Two Colour Control ............................................................................................................ 60
6.2 Broader Ionization Studies .................................................................................................. 62
Chapter 7: Conclusions ................................................................................................................. 63
References ..................................................................................................................................... 65
v
Table of Figures
Figure 1: Effect of Variations in the Keldysh Parameter. ............................................................... 8
Figure 2: Non-Sequential Double Ionization and recolliding electron with the Parent Ion ......... 10
Figure 3: HHG 3-Step Model showing the tunnel ionization ....................................................... 11
Figure 4: Typical spectrum of High Harmonic Generation. ......................................................... 11
Figure 5: HHG Spectra of Furan ................................................................................................... 12
Figure 6: Aromatic molecule ordering comparison (values and relative ranking) ....................... 15
Table 1: Ionization Potentials for Aromatic Molecules of Interest ............................................... 16
Figure 7: Schematic of drift chamber (top) and actual lab setup photograph (bottom) ................ 20
Figure 8: Determining the intensity saturation point .................................................................... 22
Figure 9: Experimental setup of the laser, optics and drift chamber ............................................ 24
Table 2: Calculated Values for Keldysh parameter γ ................................................................... 26
Figure 11: Mass spectra for Xe ..................................................................................................... 28
Figure 12: Mass spectra of Thiophene. ......................................................................................... 29
Figure 13: Parent-Isotope ratio plotted as a function of intensity. ................................................ 30
Figure 14: Saturation Intensity for Xe. ......................................................................................... 31
Figure 15: Qualitative saturation observations. ............................................................................ 32
Figure 16: Saturation intensity curves at 800nm, Linear Polarization.......................................... 34
Figure 17: Saturation Intensity curves at 800nm, Circular Polarization ....................................... 35
Figure 18: Saturation Intensity Curves 1866nm, Linear Polarization. ......................................... 36
Figure 19: Saturation Intensity Curves 1866nm, Circular Polarization ........................................ 37
Figure 20: Visualization of electron wavepacket momentum spreading ...................................... 38
Figure 21: Degree of shift in linear vs. circular ionization results ................................................ 40
Figure 22: Non Sequential Doubly Ionization as a function of ellipticity .................................... 41
Figure 23: Ellipticity results at 9uJ, 1866 nm. .............................................................................. 42
Table 3: FWHM values for ellipticity dependence of NSDI at 9 μJ............................................. 43
Figure 24: Ellipticity results at 9uJ, 1866 nm. .............................................................................. 44
Table 4: FWHM Values for ellipticity dependence of NSDI at 7 μJ. ........................................... 45
Figure 25: Offset in the ellipticity dependent curves .................................................................... 46
vi
Table 5: Degree of offset for the aromatic molecules under study. .............................................. 46
Figure 26: Singly charged ion count as a function of intensity. ................................................... 48
Figure 27: Doubly charged ion count as a function of intensity. .................................................. 49
Figure 28: Normalized doubly charged as a function of intensity in a log-log plot. .................... 50
Figure 29: Ratio of Pyrrole/Furan for Photoionization ................................................................. 52
Figure 30: Ratio of Thiophene/Furan for Photoionization ........................................................... 53
Figure 31: Ratio of Pyrrole/Thiophene for Photoionization ......................................................... 54
Table 6: MO-ADK Ionization Rate Results.................................................................................. 57
Figure 32: Qualitative Fragmentation Observations ..................................................................... 58
Figure 34: Shows the optics necessary to generate and synchronize two coloured beams .......... 61
vii
Table of Abbreviations
ADK: Ionization rate function developed by Ammosov, Delone and Krainov
ASE: Aromatic Stabilization Energy
BBO: Beta-Barium Borate crystal
HWP: Half Wave Plate
HHG: High-order harmonic generation
HOMA: Harmonic Oscillator Model of Aromaticity
MCP: Micro-channel plate
MO-ADK: Particularized ADK model for molecules
MPI: Multi-Photon Ionization
NICS: Nucleus Independent Chemical Shift
NSDI: Non-Sequential Double Ionization
SAE: Single Active Electron Approximation
SFA: Strong Feld Approximation
SFI: Strong Field Ionization
QWP: Quarter Wave Plate
XUV: Extreme Ultra-Violet radiation
1
Abstract
Cyclic Aromatic molecules are the subject of continued research due to their highly
advantageous characteristics which can be exploited in the areas of pharmaceuticals, material
science and nano-electronics. While the defining properties and criteria for a molecule to be
considered aromatic are very specific and well established, the degree of aromaticity of these
molecules and their corresponding ordering remains a source of continued debate. Given that the
macroscopic aromatic properties are fundamentally rooted in the underlying electronic structure
and molecular dynamics, these properties can be probed in numerous ways. One such method is
to exploit the strong laser field as it pertains to non-linear light-matter interaction. More
specifically, the study of photoionization, as a direct resultant effect of strong field light-matter
interaction, gives us direct insight into electronic and spatial properties as captured via mass
spectroscopy. As a strong-field process, photoionization is effective because the variables that
influence its results are also the ones that define aromaticity thus a correlation can be postulated.
Other strong field advanced techniques to probe aromacity such as High Harmonic Generation
(HHG) have already been successful shown by our group to be effective spectroscopic tools. In
this way, photoionization provides supporting evidence to enhance the understanding of these
novel spectroscopic tools. This thesis demonstrates that photoionization mass spectroscopy can
be used as a probe into the aromaticity order of 5-membered cyclic aromatic molecules.
Furthermore, the thesis will show that photoionization results correlate with the previously
conducted HHG studies in this area thus further supporting these techniques as sensitive
spectroscopic tools into aromaticity. The first part of this thesis describes the characterization of
aromatic molecules and the corresponding process to obtain photoionization results that can be
correlated to aromaticity. In the second part, these results are compared to the theoretical model
and HHG demonstrating consistent results. The third and final component of this thesis describes
future work, namely two-colour control of photoionization which is intended to provide greater
resolution and variation of photoionization spectra thereby providing a more comprehensive and
conclusive understanding of the proposed correlation with aromaticity.
2
Chapter 1: Background
1.1 Overview
Cyclic Aromatic Hydrocarbon molecules, which are fully described in Chapter 2, have vitally
important applications in many diverse facets of contemporary industry and technology. Their
macroscopic chemical and physical properties are unique to other cyclic structures with similar
composition thus greater understanding of their makeup continues to be a focus of current
research permitting greater exploitation of their beneficial properties. As will be discussed in
Section 1.5, the problem with the current understanding of 5-membered aromatic molecules is
the lack of a cohesive approach to quantifying their aromaticity. Aromaticity is used to describe
molecules that are cyclic, planar and have resonance bonds resulting in a special stability in
comparison to other non-aromatic molecules with similar geometry. Contemporary work in the
field has approached aromaticity from the modelling and computational perspectives, using for
example, axioms such as bond lengths, magnetic susceptibility and stabilization energy to form
the basis of measuring aromaticity. While these approaches are diverse and provide qualitative
ordering, they lack conclusive correlation to the criteria that actually make these cyclic structures
aromatic to begin with, that is, their electronic structures and dynamics. To advance our
understanding of these structures, one of the principal tools we have at our disposition is the
interaction of light with matter. The advent of femtosecond lasers has enabled the study of
molecular interactions in the strong field regime with attosecond resolution capable of probing
dynamics at atomic timescales. The outcome of these atomic scale interactions can be effectively
gauged via spectroscopy which can be applied to the various stages and processes described by
strong field laser physics. Photoionization of molecules is one such process which under the
variable conditions of intensity, polarization and wavelength can provide us key insights into the
construct of aromatic molecules. Recent work by our group has also demonstrated advances in
the use of High Harmonic Generation (HHG) yield as an effective spectroscopic tool in
conclusively quantifying the order of molecular aromaticity. These recent advances are
introduced in Section 1.6 and are compared to our results on photoionization of aromatic
molecules in Section 5.5 of this thesis.
3
1.2 Motivation for the Experiment
Recently, HHG spectroscopy was used to quantify aromaticity. The motivation for this study is
to develop a conclusive basis for quantifying aromaticity by investigating photoionization, which
is the first of 3 steps in the HHG process. HHG also includes the steps of electron propagation
and recombination. The ability to precisely control photoionization via the accurate application
of laser intensity and polarization variation permit detailed studies of the unique properties
exhibited by aromatic molecules. For example, the variation of polarization can provide valuable
insight into the electronic structure of aromatics via the analysis of the transverse spreading of
the electron wave-function after tunnelling. This is described in detail in Section 5.3.
Furthermore, since the results of the HHG yield studies discussed in the previous Section involve
the combination of electronic and temporal dynamics from three unique steps, it is advantageous
to break these steps down and analyze the contribution of each to the overall process. The
specific result of electronic and temporal effects from photoionization is described in Section
5.4. Via this analysis, the distinct contribution of photoionization will ultimately permit greater
understanding of the correlation between the resultant spectra and our understanding of the
structural dynamics of cyclic aromatic molecules.
1.3 Light – Matter Interaction
The study of nonlinear light – matter interaction is possible as a result of the strong laser field
produced by ultra-short and highly intense pulses on the order of 1014
W/cm2. Nonlinear
interaction arises from the fact that the photon energy is significantly less (~ 1.5 eV) than the
ionization potential of the molecule (typically 8-12 eV). The laser field is comparable in strength
to the molecular binding field thereby altering the electronic properties of the molecule itself. In
contrast to high intensity, ionization under lower intensity laser fields can only occur if the
energy of the absorbed photon is higher than the ionization potential of the electron. Therefore,
application of the strong field laser directed upon the aromatic molecules of interest will generate
ionization of singly and multiply charged ions in only a few optical cycles. As will be shown in
chapter 3, the ions can then be channelled via a Time-of-Flight (TOF) for spectroscopic analysis.
4
Strong field ionization of molecules occurs via two distinct regimes, namely Multi-Photon
Ionization (MPI) and Tunnelling which are defined in Section 1.4. As these processes are
quantum mechanical in nature, both will be present to some degree during photoionization and
will vary in importance depending on the E-field variables and the phenomena being studied.
The application of these two areas to the experiment and the effects of variation in intensity,
polarization and wavelength are described in Chapter 4.
1.4 Strong Field Laser Interaction with Molecules
When compared with atoms, molecules are significantly more complex. The interaction of the
laser strong field with molecules has many influencing variables that when altered result in
changes to the electronic structure and dynamics. Therefore these variables need to be carefully
controlled and observations analyzed and compared to atoms and other molecules, both aromatic
and non-aromatic, to understand how they are impacted by light-matter interaction. The key
observables from the strong field interaction with the aromatic molecules include, for example,
their saturation intensities, ionization yields, ellipticity dependence and fragmentation. These are
described in detail in Chapter 5. To understand how the variables interplay with the molecule’s
potential barrier and corresponding electron wave-function to produce the observed effects, it is
important to first define the E-field and then define the regimes under which the E-field
interaction will provide different responses. This description is addressed in Sections 1.4.1
through 1.5.2.
1.4.1 Ionization Regimes
As introduced earlier, the focus of strong field experimentation with the aromatic molecules for
this thesis is photoionization. As delineated in Section 1.3, within this area of interest there are
two regimes, namely Multi-Photon Ionization (MPI) and Tunnelling. Before describing these
regimes however, it is important to make reference to the E-field variables that will describe the
transition between these regimes. The E-field of a laser is fundamental to the understanding of
light-matter interaction and is described as follows for few-cycle pulses [1]:
5
( ) ( ) (1.1)
Where is the envelope of the field, is the carrier frequency and is the carrier-envelope
phase. The equation is of importance because the pulse energy, wavelength and phase all have
significant roles in the outcome of the light-matter interaction. In the strong laser field, the E-
field applied per unit area needs is to be sufficient enough to absorb photons. Direct photon
absorption is possible via a high intensity and continuous rate laser thereby producing an E-field
intense enough to alter the binding energy of the molecule. The important relationship between
the E-field and intensity is as follows [1]:
[
]
(1.2)
where Ԑ0 is the permittivity of free space, c is the speed of light and I is the intensity. The
interaction of strong field radiation with molecules results in significant energy absorption by the
molecule. While ionization is the primary channel of energy release following absorption,
fragmentation of the molecule is also a possible mechanism that provides valuable insight on the
stability of aromatic molecules and is described in Section 5.8. Sections 1.4.2 through 1.5.2
describe the mechanism of strong field ionization, specifically the promotion of the electron into
the continuum via specific mechanisms.
1.4.2 Multi-photon Ionization (MPI)
MPI results from an electron gaining enough energy to become ionized by absorbing numerous
photons continuously. It is based on the deposition and absorption of N high intensity laser
photons onto the molecule in a time period defined by position-time uncertainty principle
permitting the electron to be ionized in a step-like process independent of molecular energy
levels. The number of photons needed to be deposited for the process of multi-photon ionization
to occur under the influence of the strong field is [1]:
6
( ) (1.3)
where EI is the binding energy of the electron. This describes that the number of photons
required depends on the photon energy such that their product is greater than the binding energy.
MPI is the predominant process observed at the 800nm wavelength and increases proportionally
with intensity given the distorting effect that high intensity has upon the potential barrier. Of
note, at longer wavelengths, tunnelling becomes more pronounced as described in Section 1.4.3.
As the number of photons absorbed by the molecule increases, the probability of MPI becomes
smaller as based on the following relationship [12]:
( ) (1.4)
Where ρ is the probability of absorbing n photons and σn is the cross sectional area of ionization
and I is the intensity. For example, ionization of the Xe atom (Ip=12.3) is an 8th
order non-linear
process since the typical photon energy is 1.55 eV (at 800nm).
1.4.3 Tunnelling
Tunnelling is a phenomenon described via the electron wave-function where there is a non-
vanishing probability for the electron to transition to the continuum. Under the right E-field
conditions, the quantum tunnelling regime will occur with higher probability as based on laser
frequency and tunnelling time. Firstly, a temporary deformation of the Coulomb potential well is
caused by the laser field. Ionization then results if the laser E-Field is comparable in strength to
the coulomb potential and is of a low enough frequency that the electron subjected to that field
has sufficient time to transit across the molecule’s potential barrier.
7
The Coulomb potential barrier (V) as a function of distance (r) from the core with respect to the
E-Field (E) is described as:
( ) (1.5)
A classical method to estimate the intensity required for tunnelling is based on the “Over-the-
Barrier” threshold (Ith) described as follows [1]:
( )⁄ (1.6)
Where Ip is the ionization potential and Z is the charge state of the ion. K is a constant and equals
1 when expressed in atomic units (or 6.4 x 10¹⁰
when Ip is expressed in eV) and Ith is in W/cm2.
Using the above expression for a singly charged state and corresponding ionization potentials of
8-20 eV, the threshold intensity (as it relates to the experiment) results in a minimum intensity of
2 x 10¹³
W/cm2 which is consider valid experimentally. Theoretically, the factor which
differentiates the two regimes is the Keldysh parameter which is explained in greater detail in
Section 1.4.4.
1.4.4 Keldysh Parameter
While the Ith expression provides a rough approximation of when tunnelling will occur, to obtain
a more accurate prediction, the quantum mechanical nature of the process must be taken into
account via the Keldysh parameter. The Keldysh parameter (γ) describes the likelihood of
ionization via the MPI or tunnelling regimes as per the following expression [2]:
γ = (Ip/2Up)1/2
(1.7)
8
Where Up is the ponderomotive energy and is described as [2]:
⁄ (1.8)
Where e, m and ω are the charge, mass and angular frequency respectively and E is the electric
field strength. Ponderomotive energy describes the oscillation energy that a free electron will
have in the E-field of the laser pulse.
A Keldysh parameter of less than 1 (γ<1), describes a depressed coulomb barrier and therefore
identifies the tunnelling regime. A Keldysh parameter of more than 1 (γ>1) describes absorption
of multiple photons permitting the electron to ionize directly. A Keldysh parameter of greater
than 1 does not necessarily imply that there is no contribution from the tunnelling regime
however the probability is significantly reduced. Therefore γ<<1 describes a predominant
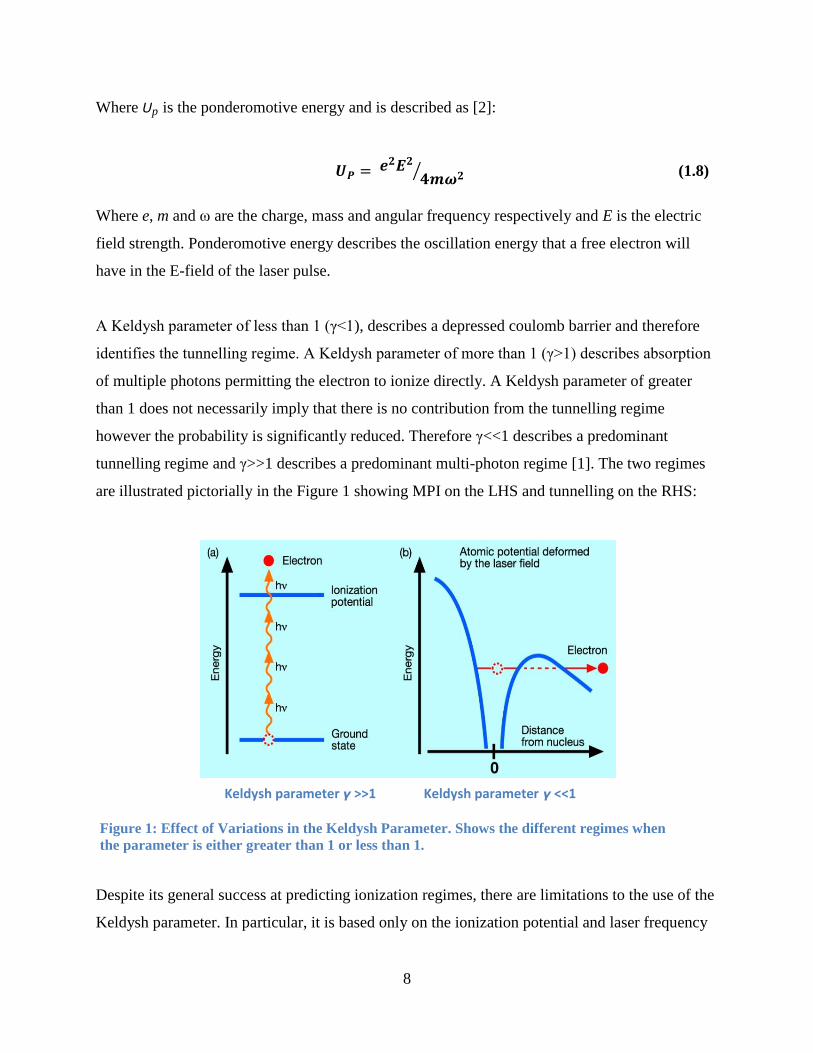
tunnelling regime and γ>>1 describes a predominant multi-photon regime [1]. The two regimes
are illustrated pictorially in the Figure 1 showing MPI on the LHS and tunnelling on the RHS:
Despite its general success at predicting ionization regimes, there are limitations to the use of the
Keldysh parameter. In particular, it is based only on the ionization potential and laser frequency
Keldysh parameter γ <<1 Keldysh parameter γ >>1
Figure 1: Effect of Variations in the Keldysh Parameter. Shows the different regimes when
the parameter is either greater than 1 or less than 1.
9
therefore its use as a predictor for the overall interaction of the laser field with complex
molecules is limited. Therefore, it is to be used as an approximation only for the contribution of
ionization from the two regimes.
1.5 Multiply Charged Ions
In the previous section, the ionization regimes are described for promoting an electron to the
continuum, firstly via MPI and secondly via tunnelling. Once ionized, under certain E-field
variables of intensity, polarization and optical phase, the molecule can undergo further ionization
via two mechanisms of sequential and non-sequential ionization. This is described in Sections
1.5.1 and 1.5.2.
1.5.1 Sequential Ionization
In sequential ionization, E-field strengths produced by the laser are sufficiently intense to
multiply ionize a singly charged molecule directly. The sequential nature of the ionization
processes is depicted in the two molecular equations:
~hω + M →M
+ + e
− ~hω + M
+ →M
2+ + e
−
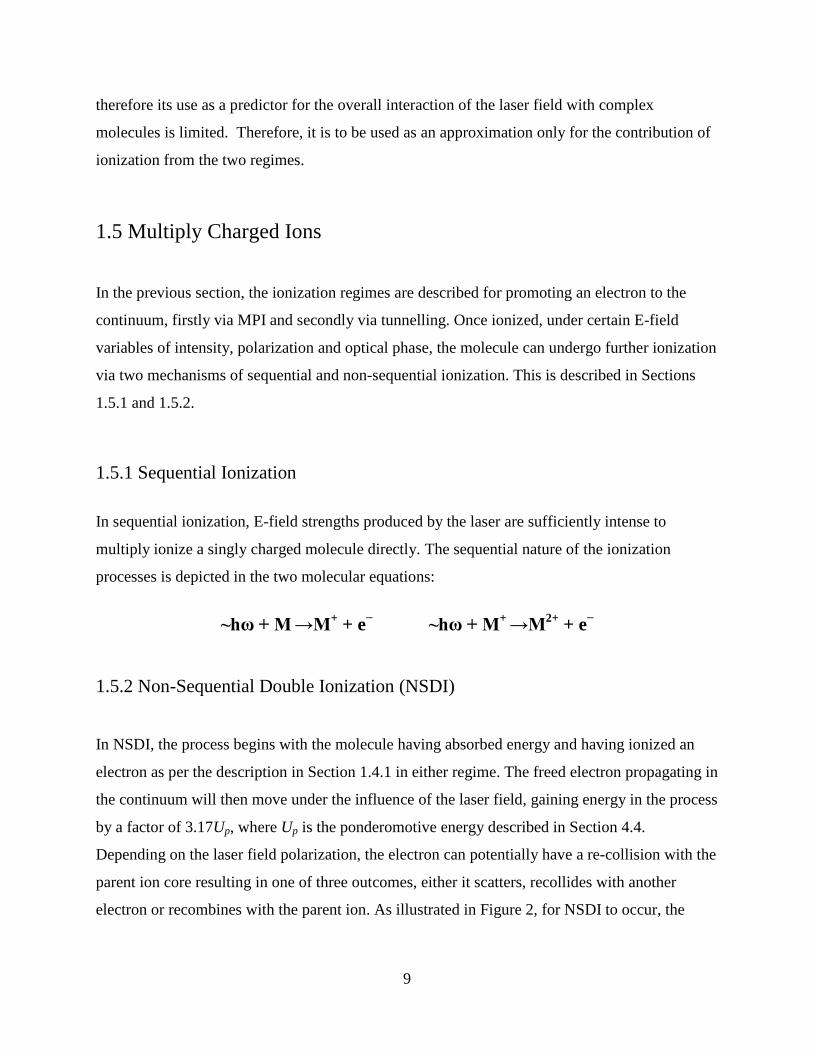
1.5.2 Non-Sequential Double Ionization (NSDI)
In NSDI, the process begins with the molecule having absorbed energy and having ionized an
electron as per the description in Section 1.4.1 in either regime. The freed electron propagating in
the continuum will then move under the influence of the laser field, gaining energy in the process
by a factor of 3.17Up, where Up is the ponderomotive energy described in Section 4.4.
Depending on the laser field polarization, the electron can potentially have a re-collision with the
parent ion core resulting in one of three outcomes, either it scatters, recollides with another
electron or recombines with the parent ion. As illustrated in Figure 2, for NSDI to occur, the
10
propagating electron recollides with the parent ion resulting in the ejection of a secondary
electron thereby doubly ionizing the parent molecule:
~hω + M → M
+ + e
− → M
2+
Figure 2: Non-Sequential Double Ionization as the result of a recolliding electron with the Parent
Ion
The electron trajectories can be controlled by laser polarization thereby influencing the
probability of recollision and hence NSDI. Therefore laser polarization is an effective method at
distinguishing between SI and NSI. For example, in linear polarization, both processes can be
active however in circular polarization NSDI disappears given that the electron is driven away
from the parent ion core. The physics surrounding this is explained in Section 5.3.
Notwithstanding this differentiation technique, it was noted that the presence of doubly charged
molecules in the experiment was the result of both SI and NSDI acting together. Therefore, these
two processes were fundamental to interpreting the photoionization results given their relative
contribution on the overall yield. As will be shown in Chapter 5, the contribution from both
mechanisms can be discriminated based on the relative slopes of doubly charged ions as a
function of singly charged ions.
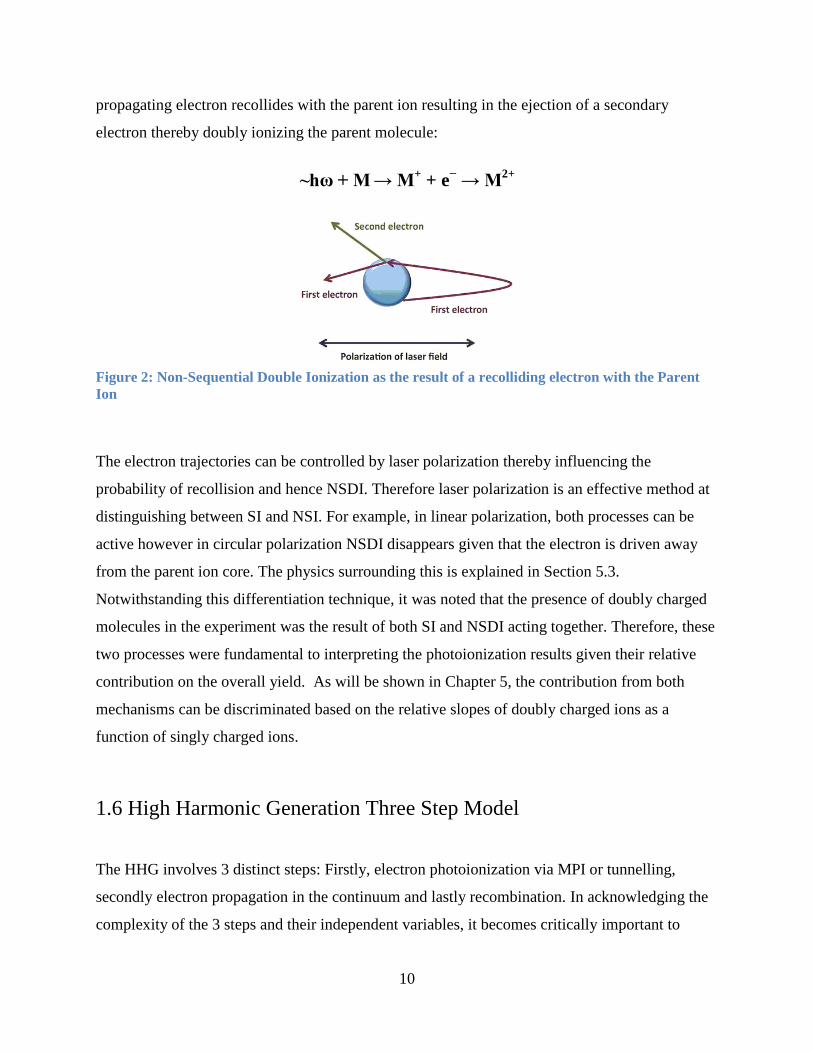
1.6 High Harmonic Generation Three Step Model
The HHG involves 3 distinct steps: Firstly, electron photoionization via MPI or tunnelling,
secondly electron propagation in the continuum and lastly recombination. In acknowledging the
complexity of the 3 steps and their independent variables, it becomes critically important to
11
properly distinguish and define the photoionization phase within the overall sequence of the
HHG model. A pictorial view of these steps is presented in Figure 3:
Figure 3: HHG 3-Step Model showing the tunnel ionization,
Propagation in the laser field (acceleration) and Recombination
Specifically, photoionization of the electron from the parent molecule results from the distortion
of the molecule’s atomic potential by the laser field followed by the electron tunnelling into the
continuum. Second, the electron will accelerate in the continuum under the influence of the laser
field, moving outward from the molecule and then returning based on the shift in polarity of the
laser E-field. In the third step, the electron recombines with the parent molecule along with the
resultant emission of XUV photons. This HHG emission can be characterized based on the
spatial and temporal observation characteristics resultant from the molecule’s properties and
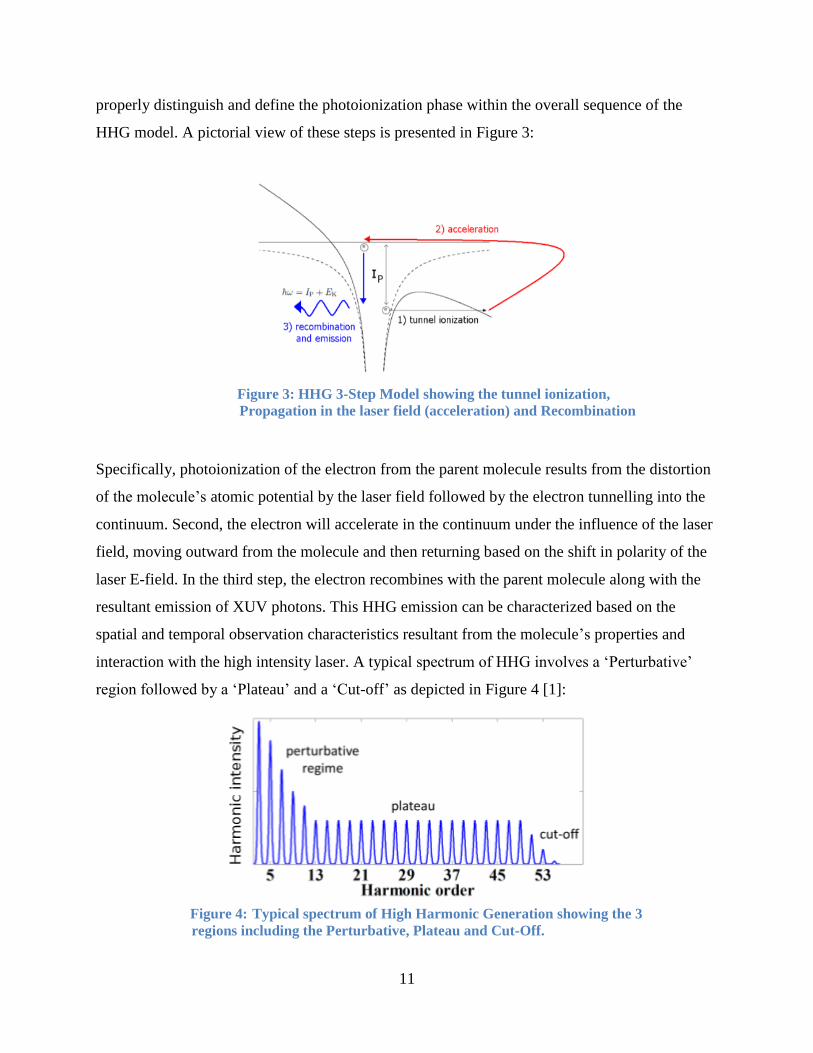
interaction with the high intensity laser. A typical spectrum of HHG involves a ‘Perturbative’
region followed by a ‘Plateau’ and a ‘Cut-off’ as depicted in Figure 4 [1]:
Figure 4: Typical spectrum of High Harmonic Generation showing the 3
regions including the Perturbative, Plateau and Cut-Off.
12
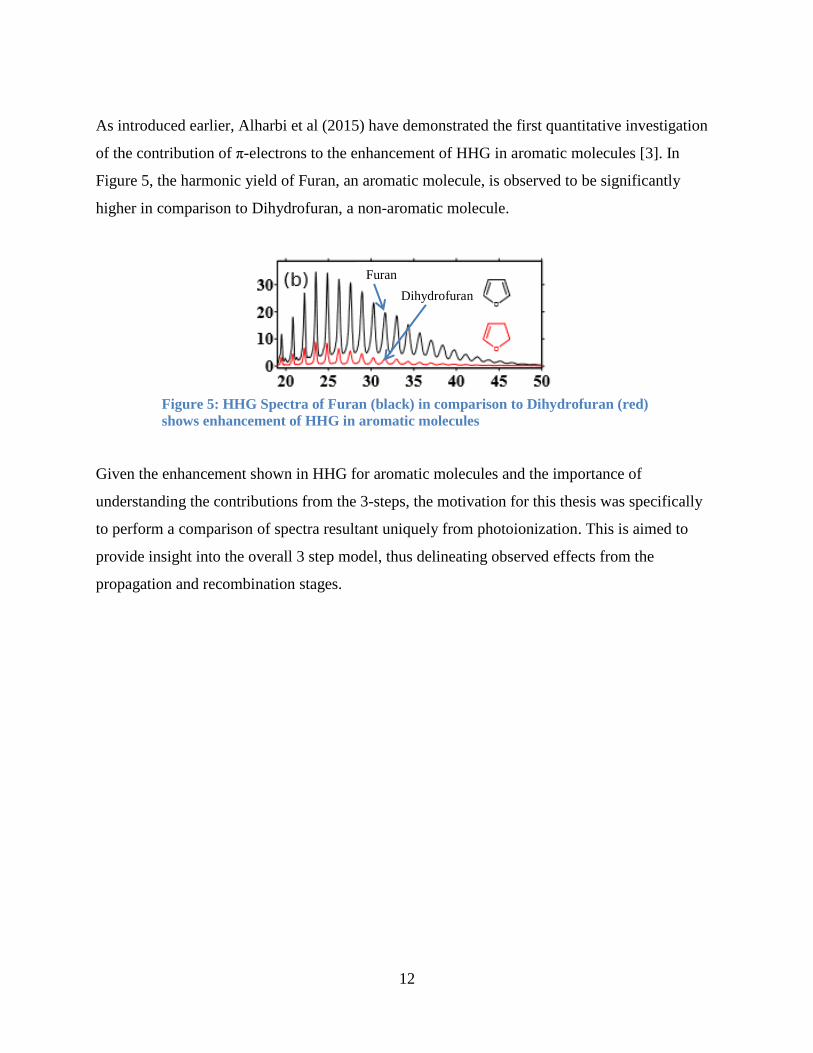
As introduced earlier, Alharbi et al (2015) have demonstrated the first quantitative investigation
of the contribution of π-electrons to the enhancement of HHG in aromatic molecules [3]. In
Figure 5, the harmonic yield of Furan, an aromatic molecule, is observed to be significantly
higher in comparison to Dihydrofuran, a non-aromatic molecule.
Given the enhancement shown in HHG for aromatic molecules and the importance of
understanding the contributions from the 3-steps, the motivation for this thesis was specifically
to perform a comparison of spectra resultant uniquely from photoionization. This is aimed to
provide insight into the overall 3 step model, thus delineating observed effects from the
propagation and recombination stages.
Figure 5: HHG Spectra of Furan (black) in comparison to Dihydrofuran (red)
shows enhancement of HHG in aromatic molecules
Furan
Dihydrofuran
13
Chapter 2: Cyclic Aromatic Hydrocarbon Molecules
Chapter 1 was focused on nonlinear light – matter interaction and the different strong field
regimes that arise from the interaction with molecules. Chapter 2 centres on the specific aromatic
molecules under study.
Aromatic molecules are cyclic structures in which each ring atom is a participant in a π-orbital
resulting in π electron delocalization. To be considered an aromatic molecule, there are very
specific conditions required. Firstly, the molecule must be cyclic meaning that the series of
atoms bond together to form a ring. Second, the molecule must follows Hückel’s rule requiring
that there be (4n+2) π-orbital electrons which results in electron de-localization. Third, the
molecule must be conjugated which requires that the de-localized electrons in the ring molecule
all participate in p-orbitals. Fourth, the molecule must be planar. If any one of these conditions is
not met, then the molecule cannot be considered aromatic.
Aromatic molecules are typically more stable than non-aromatic ones. This stability is
demonstrated when the molecule is undergoing multiply charged ionization. In stable molecules,
the yield of multiply charged yield will be greater and will not fragment as a result of the sharing
and uniformity of distribution of π-orbital electrons [39]. For the electrons to be shared in this
way, the molecule must be planer such that the p-oribitals can overlap. This can be explained by
looking within the cyclic ring of overlapped p-orbitals, each carbon atom may donate one
electron and two electrons are donated from the heteroatom to form a delocalized cloud [40].
Aromatic molecules have unique and distinct properties that motivate contemporary studies and
applications. Unique properties such as high stability, high resonance energy, low reactivity,
non-polarity and immiscibility in water are highly suitable for diverse applications such as in
nano-electronics, material science and pharmaceuticals. In biochemistry for example, aromatic
molecules form part of DNA strands and hence their complex interaction with other organic
compounds contained in DNA is an important are of research.
14
2.1 Contemporary Studies into Aromatic Molecules
While aromatic molecules have been the subject of numerous contemporary studies in modern
times, their classification in terms of degree of aromaticity order remains inconclusive. Examples
of investigations that have attempted to define aromaticity are as follows:
1) Nucleus Independent Chemical Shift (NICS) [6][31]: This computational model is used
to calculate the amount of magnetic shielding at the centre of the ring molecule which is
understood to contribute to aromatic properties. The more magnetic shielding around the
center of a molecule, the higher the degree of aromaticity in the molecule.
2) Harmonic Oscillator Model of Aromoaticity (HOMA) [7]: This is the sum of deviations
of the various bond lengths in the ring molecule. Since the bond lengths are stipulated to
have an ideal value, these deviations from the ideal define the relative aromaticity order.
A bond length of value 1 is considered the ideal therefore deviations away from this
value indicate lesser aromaticity order.
3) Ring-current Diamagnetic Susceptibility [8]: When subjected to magnetic fields,
molecules can have a current induced in them as based on their magnetic susceptibility.
Therefore this measures the degree that a molecule will be susceptible to magnetic field
as based on group additivity tables and measured values. The difference between
measured and calculated values provides insight into the degree of aromaticity.
4) Aromatic Stabilization Energy (ASE) [9]: This is a measure of π electron stability as
based on reaction energy of homodesmotic processes. Homodesmotic processes are
reactions in which the constituents form products that have equal numbers of carbon
atoms in the same state of hybridization.
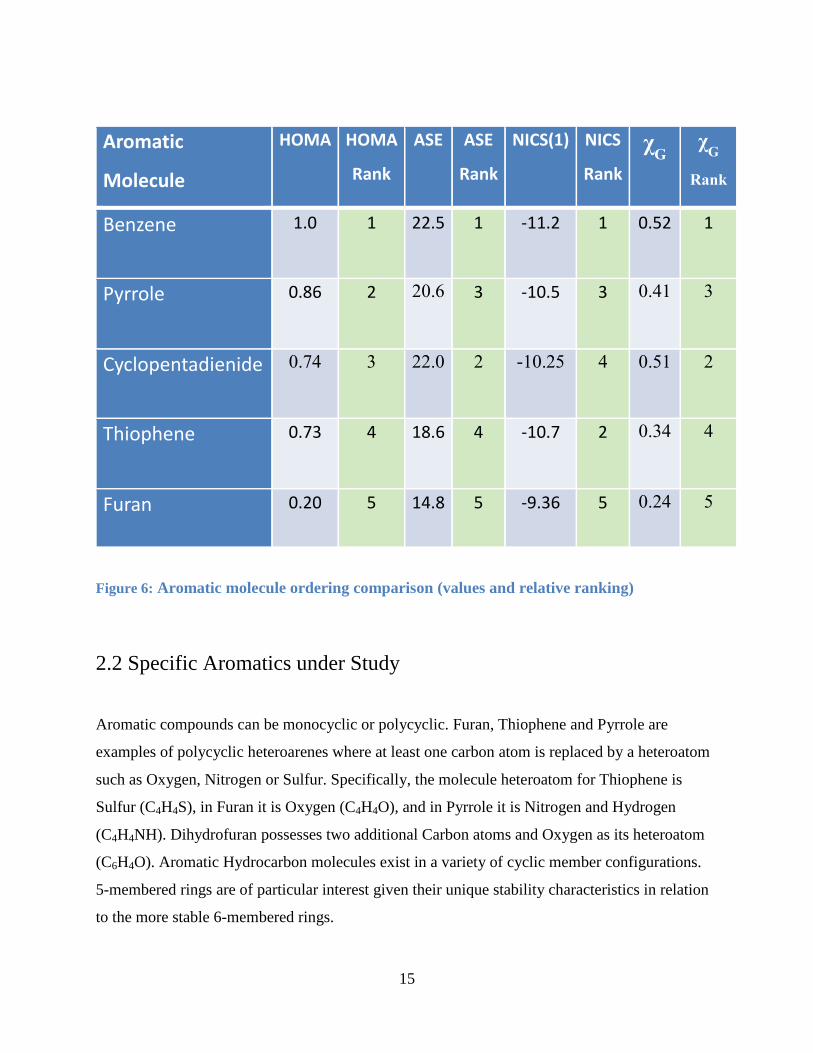
The problem with each of these various methods is that they present a different order of
aromaticity as depicted in Figure 6. Therefore the photoionization studies conducted in this thesis
project will provide supporting evidence in quantifying aromaticity order:
15
Aromatic
Molecule
HOMA HOMA
Rank
ASE ASE
Rank
NICS(1) NICS
Rank
χG χ
G
Rank
Benzene 1.0 1 22.5 1 -11.2 1 0.52 1
Pyrrole 0.86
2 20.6 3 -10.5 3 0.41 3
Cyclopentadienide 0.74 3 22.0 2 -10.25 4 0.51 2
Thiophene 0.73
4 18.6 4 -10.7 2 0.34 4
Furan 0.20 5 14.8 5 -9.36 5 0.24 5
Figure 6: Aromatic molecule ordering comparison (values and relative ranking)
2.2 Specific Aromatics under Study
Aromatic compounds can be monocyclic or polycyclic. Furan, Thiophene and Pyrrole are
examples of polycyclic heteroarenes where at least one carbon atom is replaced by a heteroatom
such as Oxygen, Nitrogen or Sulfur. Specifically, the molecule heteroatom for Thiophene is
Sulfur (C4H4S), in Furan it is Oxygen (C4H4O), and in Pyrrole it is Nitrogen and Hydrogen
(C4H4NH). Dihydrofuran possesses two additional Carbon atoms and Oxygen as its heteroatom
(C6H4O). Aromatic Hydrocarbon molecules exist in a variety of cyclic member configurations.
5-membered rings are of particular interest given their unique stability characteristics in relation
to the more stable 6-membered rings.
16
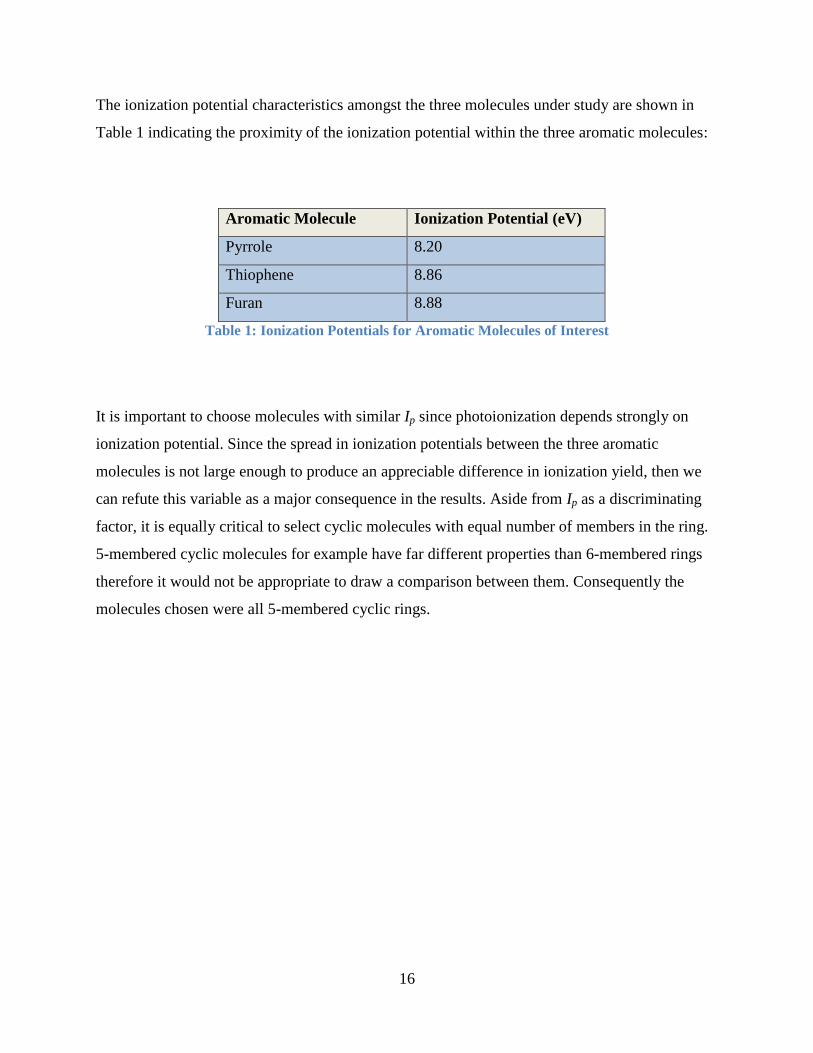
The ionization potential characteristics amongst the three molecules under study are shown in
Table 1 indicating the proximity of the ionization potential within the three aromatic molecules:
Aromatic Molecule Ionization Potential (eV)
Pyrrole 8.20
Thiophene 8.86
Furan 8.88
Table 1: Ionization Potentials for Aromatic Molecules of Interest
It is important to choose molecules with similar Ip since photoionization depends strongly on
ionization potential. Since the spread in ionization potentials between the three aromatic
molecules is not large enough to produce an appreciable difference in ionization yield, then we
can refute this variable as a major consequence in the results. Aside from Ip as a discriminating
factor, it is equally critical to select cyclic molecules with equal number of members in the ring.
5-membered cyclic molecules for example have far different properties than 6-membered rings
therefore it would not be appropriate to draw a comparison between them. Consequently the
molecules chosen were all 5-membered cyclic rings.
17
Chapter 3: Experimental Setup
3.1 Time-Of-Flight (TOF) Mass Spectroscopy
TOF permits the determination of ion spectra via the precise measurement of the time it takes for
the molecules under study to travel from extractor to detector. Once precise time is known, the
spectra obtained for the aromatic molecules can be calibrated by using the known m/z ratios of
H2, O2 or N2 ions which are present under atmospheric pressure in the drift chamber and whose
relative abundance is already known. Using the calculated m/z of the ions and fragments of
interest and their respective TOF, their relative abundance is determined and used for analysis.
Experimentally, the ions’ spectra are confirmed via verification of their respective isotope
abundance.
3.2 Laser Used for the Experiment:
The molecular ionization experiments were conducted with an 800nm wavelength Ti: Sapphire
laser system capable of producing femtosecond pulses. System components of the laser include a
Spectra Physics - Tsunami oscillator and a Spectra Physics – Spitfire Pro amplifier. After
amplification, the output power of the laser is 2.7 W (average) with pulse duration of 40 fs,
generating intensities between 1013
to 10
15 W/cm
2. Short laser pulse durations are critical to
permit MPI due to the time-energy uncertainty principle where the probability for absorption is
dependent on the number of photons deposited per unit time on to the molecule:
(3.1)
Ultra-short, few cycle laser pulses produced from mode-locked lasers will have pulse durations
of femtoseconds or less. For pulses of this duration, optical techniques are required for beam
characterization as there are no processes shorter than the pulse itself. Techniques such as
autocorrelation are used to measure the duration. During the experiment it was important to
18
regularly verify the pulse duration to ensure that it was maintained as low as possible (generally
below 40fs). This is achieved by a simple shot auto-correlator. In terms of photoionization, pulse
energy specifically deposited within the spot size and duration of the laser is of particular
importance. Pulse energy Ep is the optical power integrated over time whereas peak power Pp is
obtained as a result of the energy taken over the laser’s specific pulse duration time ( ) as
measured with the auto-correlator. The expression that describes this is as follows [1]:
(3.2)
where fS is a numerical factor which is a function of pulse shape (eg. 0.94 for a Gaussian
distribution).
3.3 Achievement of Vacuum and Gas Sample
In order to effectively discriminate the counts of ionized particles being produced in the chamber
we need to be able to differentiate m/z values down to approximately 50 counts precision over
the course of the observation period which is 1 minute; equating to 60 000 samples. This
represents an error tolerance of approximately 0.1%. Above this error rate, it was observed that
the systematic effects of system noise and statistical counting errors can combine to prevent the
precise measurement required to effectively differentiate between molecules and their fragments.
Preventing drift chamber contamination to discriminate the desired molecules is therefore critical
to the experiment and can only be achieved at chamber background vacuum levels of 10-9
torr
and below, as determined via experimentation and observation of error counts. Additionally,
above these vacuum levels, it is observed that previous molecules under study will still be
resident in the chamber and will alter observed m/z values if their singly or doubly ionized
parents and isotopes overlap with the molecules under study or their respective fragments.
The high vacuum is achieved via a two-step process using rough pumps to initially bring the
pressure down to 10-3
Torr and then Turbo pumps are used to bring the pressure down to 10-9
torr. Pumping the chamber down to this required level of vacuum necessitates at least 24 hours
of pumping operation (ideally 48 hours) prior to commencing the experiment. Once the vacuum
19
pressure has been achieved and is all settings are stable, it is important to monitor the pumps’
current regularly to ensure effective operation throughout the experiment.
Aromatic molecules were introduced into the chamber in the gas phase by connecting a test tube
into a directional flow control manifold built from copper pipe and valves. The gas is allowed to
enter the control manifold under its own vapour pressure given that all the aromatic molecules
had significantly higher vapour pressure than 1 atm. By using the directional control piping, the
gas is led into the chamber via a flexible PVC hose. As with the drift chamber itself, it is critical
that all hose components and related ball valves and fittings be pumped down before introducing
new chemicals as these components also contain residual traces of chemicals, either from
previous experiments or from the lab atmosphere. A separate rough pump is connected via the
control manifold to enable this and a pressure sensing gauge is attached to ensure that the correct
gas pressure is attained before shutting the valve leading to the test tube source. From there, two
additional valves lead to the entrance of the chamber that are sequentially opened to ensure slow
and accurate pressure build up in the chamber.
3.4 Time of Flight (TOF)
A Wiley-McClaren TOF system was used to obtain the mass spectra of the aromatic
hydrocarbons under study. The Wiley-McClaren system is based on a pulsed two-grid, double
field source with repeller and extractor dimensions optimized for resolution [11]. The repeller
and extractor generate E-fields of 2000 V/m and 1000 V/m respectively. These two accelerating
regions are followed by a field free drift tube. The applied E-fields direct all ions out of the
ionization region and into a drift region which is free of any E-field [11]. A Micro-Channel Plate
(MCP) located at the end of the TOF detects the ions. To permit the accelerated ions to reach the
detector, there is a slit positioned at the center of the extractor plate. The MCP detects particles
that come into contact with it via channel grooves that generate secondary electrons. These
electrons are then detected by an anode to then pass the signal to a timing discriminator after pre-
amplification [12].
20
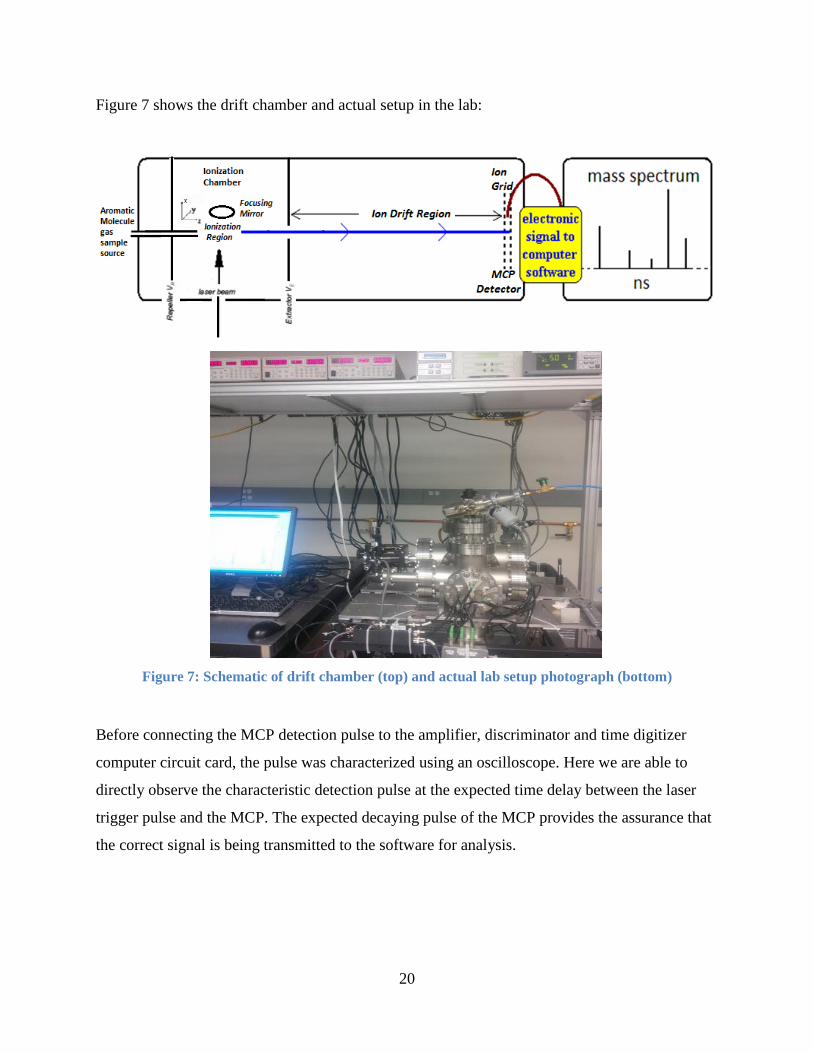
Figure 7 shows the drift chamber and actual setup in the lab:
Figure 7: Schematic of drift chamber (top) and actual lab setup photograph (bottom)
Before connecting the MCP detection pulse to the amplifier, discriminator and time digitizer
computer circuit card, the pulse was characterized using an oscilloscope. Here we are able to
directly observe the characteristic detection pulse at the expected time delay between the laser
trigger pulse and the MCP. The expected decaying pulse of the MCP provides the assurance that
the correct signal is being transmitted to the software for analysis.
21
3.4.1 Time Delay Calculation and Data Translation
The time it takes for the ions to travel from the interaction region to the MCP detector is based
on the simple relation shown at (3.3) where l is the TOF tube length, V is the MCP voltage
(4900V) and M/Z is the mass to charge ratio of the molecule:
√
⁄ (3.3)
In order to correlate and time sequence the ion impacts at the MCP, a Philips Scientific model
#6950 Constant Fraction Discriminator (CFM) is used. The CFM is used to detect the rising and
trailing pulses from the MCP as based on the point of zero slope between pulses. These changes
are then used by an analog to digital timing generator to obtain intervals relative to the laser
trigger. The anode signal from the MCP is amplified via a Philips Scientific amplifier.
3.4.2 Data Capture
The MCP will send a signal of ions detected to a multi-channel time digitizer (a time to digital
converter). The input/output ports of the digitizer will relay the ions detections to computer
software which captures the total count of ions per a specified time and generates a spectrum.
Once the ion detection data is captured, the software will display the time delay on the x-axis and
the spectrum in the y-axis. The TOF spectra is calibrated for m/q based on visually identifying
known peaks of H2, O2 or N2 which are known to exist in the chamber even at the extreme
vacuum levels. Verification of intensity calibration was done by comparing ionization saturation
values for molecules such as Ar and Xe gas against known values from the following reference
[15].
22
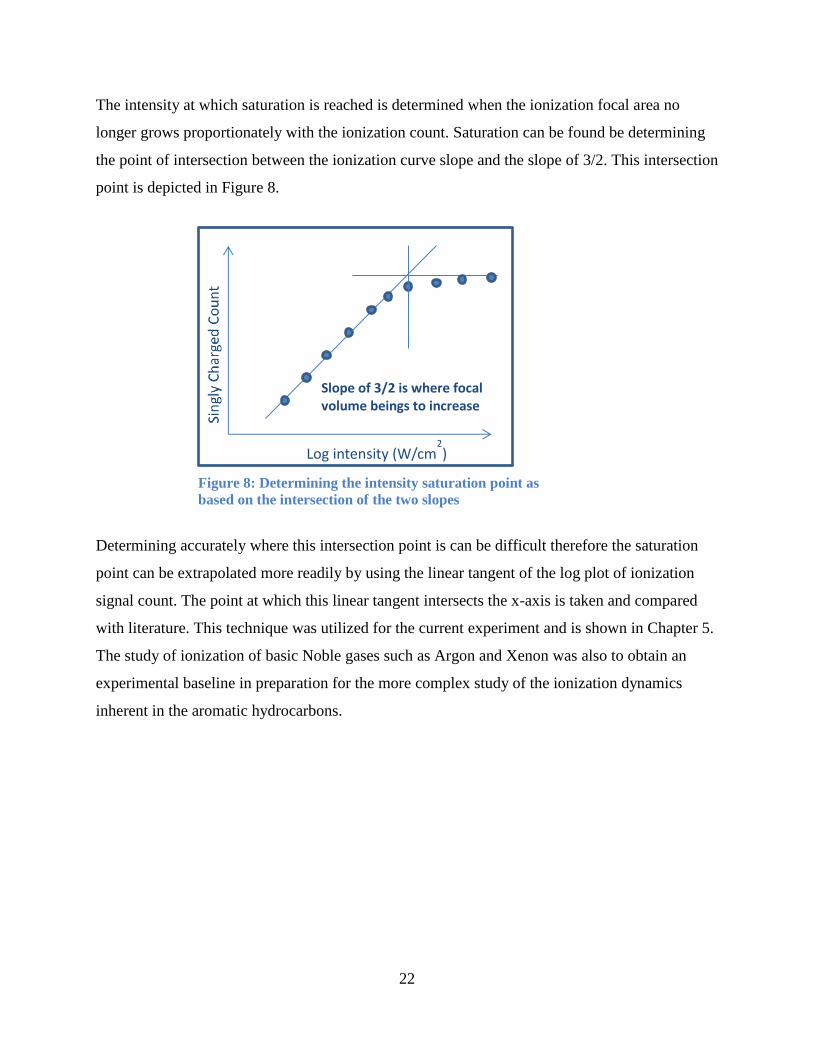
The intensity at which saturation is reached is determined when the ionization focal area no
longer grows proportionately with the ionization count. Saturation can be found be determining
the point of intersection between the ionization curve slope and the slope of 3/2. This intersection
point is depicted in Figure 8.
Determining accurately where this intersection point is can be difficult therefore the saturation
point can be extrapolated more readily by using the linear tangent of the log plot of ionization
signal count. The point at which this linear tangent intersects the x-axis is taken and compared
with literature. This technique was utilized for the current experiment and is shown in Chapter 5.
The study of ionization of basic Noble gases such as Argon and Xenon was also to obtain an
experimental baseline in preparation for the more complex study of the ionization dynamics
inherent in the aromatic hydrocarbons.
Slope of 3/2 is where focal volume beings to increase
Log intensity (W/cm2)
Figure 8: Determining the intensity saturation point as
based on the intersection of the two slopes
23
Chapter 4: Aromatic Hydrocarbons Experiment
As introduced in Chapter 1, the ionization of molecules under strong field conditions gives us
direct insight into their structural, orbital and bond properties. Using these principles and the
experimental setup discussed in Chapter 3, this project investigated the ionization and
fragmentation of Cyclic Aromatic Hydrocarbon molecules by varying the intensity, polarization
(linear, circular & elliptical) and laser wavelength to determine correlation with aromaticity
order. The project recorded and analyzed data related to the SI and NSDI in the five member-
ring aromatic heterocycles: Pyrrole, Thiophene and Furan.
4.1 Alignment and Optimization
Precise alignment of the beam from the amplification source to the chamber was critical in order
to have precise and effective ionization. Alignment was achieved via the placement of 5 iris and
aligned in the direction of source to the drift chamber in order to progressively reduce the about
of adjustment necessary and to ensure that the most important alignment stages are correct before
moving further down the beam line.
As there were three benches in use, one housing the laser, another with the applicable optics and
another with the chamber, it was preferable to only adjust alignment on the laser end, ensuring
that the incoming beam to the chamber bench arrived in parallel, thereby minimizing alignment
in the area that contained most of the sensitive optics.
24
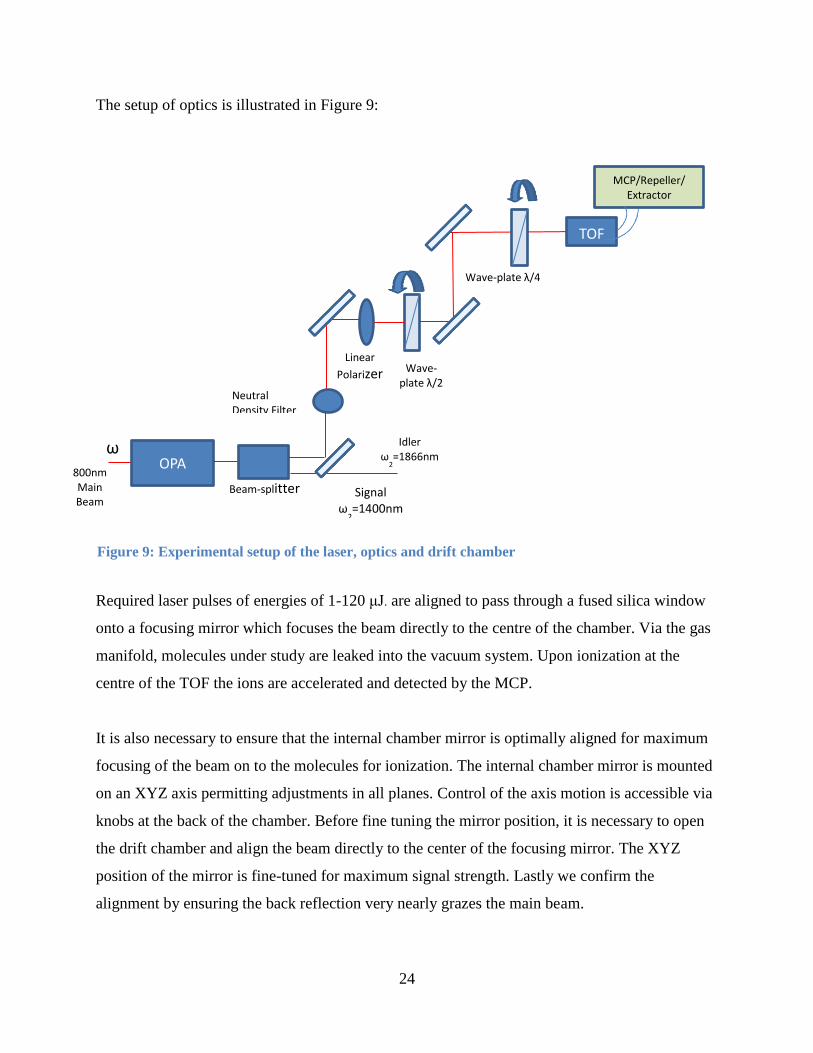
The setup of optics is illustrated in Figure 9:
Required laser pulses of energies of 1-120 μJ. are aligned to pass through a fused silica window
onto a focusing mirror which focuses the beam directly to the centre of the chamber. Via the gas
manifold, molecules under study are leaked into the vacuum system. Upon ionization at the
centre of the TOF the ions are accelerated and detected by the MCP.
It is also necessary to ensure that the internal chamber mirror is optimally aligned for maximum
focusing of the beam on to the molecules for ionization. The internal chamber mirror is mounted
on an XYZ axis permitting adjustments in all planes. Control of the axis motion is accessible via
knobs at the back of the chamber. Before fine tuning the mirror position, it is necessary to open
the drift chamber and align the beam directly to the center of the focusing mirror. The XYZ
position of the mirror is fine-tuned for maximum signal strength. Lastly we confirm the
alignment by ensuring the back reflection very nearly grazes the main beam.
Figure 9: Experimental setup of the laser, optics and drift chamber
Wave-plate λ/4
Wave-plate λ/2
TOF
Neutral Density Filter
Linear
Polarizer
OPA
Beam-splitter 800nm
Main Beam
ω
MCP/Repeller/ Extractor
Voltages
Signal ω
2=1400nm
Idler ω
2=1866nm
25
4.2 Variation of Pulse Energy
The pulse energy and polarization was precisely varied in order to assess the response on
ionization and fragmentation dynamics. Accurate energy control was essential to precisely meter
the energy entering the drift chamber and to ensure that energy levels are kept under saturation or
damage threshold levels.
In order to achieve precise energy control, specific optics were used for coarse and fine energy
control. For coarse energy control, a graded neutral density filter wheel was used allowing
energy to be reduced to the order of <100 μJ. For precise energy control below 100 μJ, a Half
Wave Plate (HWP) and polarizer were used in conjunction. While the neutral density filter wheel
could hypothetically reduce energy down to the levels required, the HWP/polarizer combination
was used instead as this method offered a more linear and consistent graduation in energy and
greater precision control. To understand this methodology specifically; the HWP rotates the
incoming polarization (by 2θ). Therefore, as the polarization direction of the linearly polarized
light is rotated, only the E-field vector that is aligned with the polarizer can be transmitted. By
adjusting the propagation of this variable linear component which matches the polarizer’s
direction, precise control is obtained. For example, when the polarizer’s plane of transmission is
precisely orthogonal to the beam, transmission can be completely cut off.
4.3 Polarization Control
To convert the polarization from linear to circular, a Quarter Wave Plate (QWP) was used. To
calibrate the QWP to the desired polarization, the maximum energy (Emax) and minimum
energy (Emin) of the beam was measured via a polarizer for a given position of the QWP. At the
QWP position that provided a maximum value of the Emin/Emax ratio (greatest spread between
Emax and Emin), linear polarization is obtained. At the minimum ratio value (Emax and Emin
almost equalling each other), we obtained circular polarization. Theoretically the maximum ratio
of Emax over Emin should equal 1 and the minimum ratio should equal 0 however these values
26
cannot be practically achieved. Elliptical polarization was attained at intermediate values of the
Emin/Emax ratio.
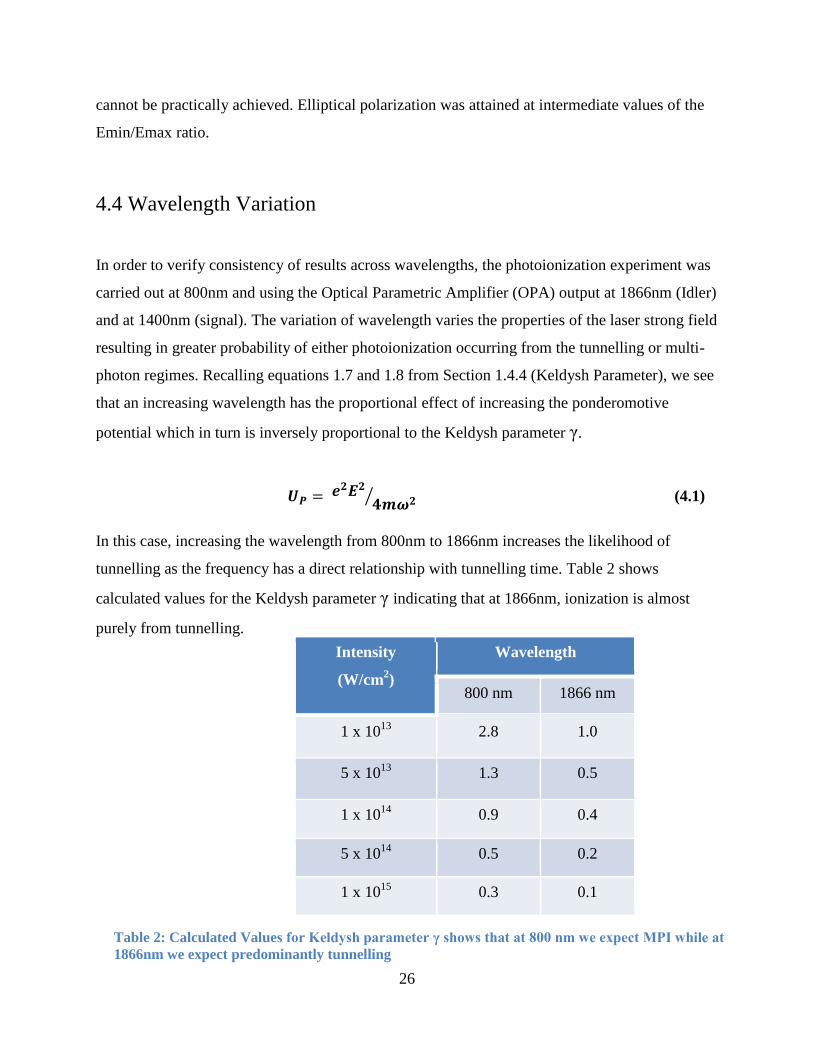
4.4 Wavelength Variation
In order to verify consistency of results across wavelengths, the photoionization experiment was
carried out at 800nm and using the Optical Parametric Amplifier (OPA) output at 1866nm (Idler)
and at 1400nm (signal). The variation of wavelength varies the properties of the laser strong field
resulting in greater probability of either photoionization occurring from the tunnelling or multi-
photon regimes. Recalling equations 1.7 and 1.8 from Section 1.4.4 (Keldysh Parameter), we see
that an increasing wavelength has the proportional effect of increasing the ponderomotive
potential which in turn is inversely proportional to the Keldysh parameter γ.
⁄ (4.1)
In this case, increasing the wavelength from 800nm to 1866nm increases the likelihood of
tunnelling as the frequency has a direct relationship with tunnelling time. Table 2 shows
calculated values for the Keldysh parameter γ indicating that at 1866nm, ionization is almost
purely from tunnelling.
Intensity
(W/cm2)
Wavelength
800 nm 1866 nm
1 x 10¹³
2.8 1.0
5 x 10¹³
1.3 0.5
1 x 10¹⁴
0.9 0.4
5 x 10¹⁴
0.5 0.2
1 x 10¹⁵
0.3 0.1
Table 2: Calculated Values for Keldysh parameter γ shows that at 800 nm we expect MPI while at
1866nm we expect predominantly tunnelling
27
By changing the dynamics of photoionization into a preferential tunnelling regime, we are
ensuring that our results are not specific to MPI. Furthermore, at 1866nm, the polarization
dependence of NSDI is increased given the longer frequency and therefore time duration that
electron wavepacket spends in the laser field. The longer the wavepacket spends in the laser field
the greater it is affected by it. Comparison of the ionization results at both wavelengths therefore
provides an opportunity to compare these effects in relation to aromaticity.
4.5 Discriminating TOF Peaks
When dealing with large molecules, the spectrum of ionized particles can be particularly
complex and difficult to discern accurately if using mass to charge ratio only. It is crucial
therefore that peaks are properly discriminated, firstly by conducting accurate mass calibration
and secondly by validating the exact ratio of parent molecules to their respective isotopes such
that singly and doubly charged parent ion peaks can be positively identified.
4.5.1 Mass Calibration
To permit detailed analysis of the ion spectra, molecular mass spectra must be calibrated from
raw TOF values to expected amu values. Given that precise beam alignment in the x,y and z-axes
are normally adjusted at the time of experiment to maximize ion yield, the precise distance from
the TOF ionization point to the MCP detector varies and must therefore be compensated in the
conversion of flight time to m/z. Mass calibration is therefore achieved using known mass
spectra obtained from reference [15]. Atoms, such as Xenon are used for calibration as their
ionization spectra are precisely known and stable doubly and triply ionized parent permit
accurate calibration.
28
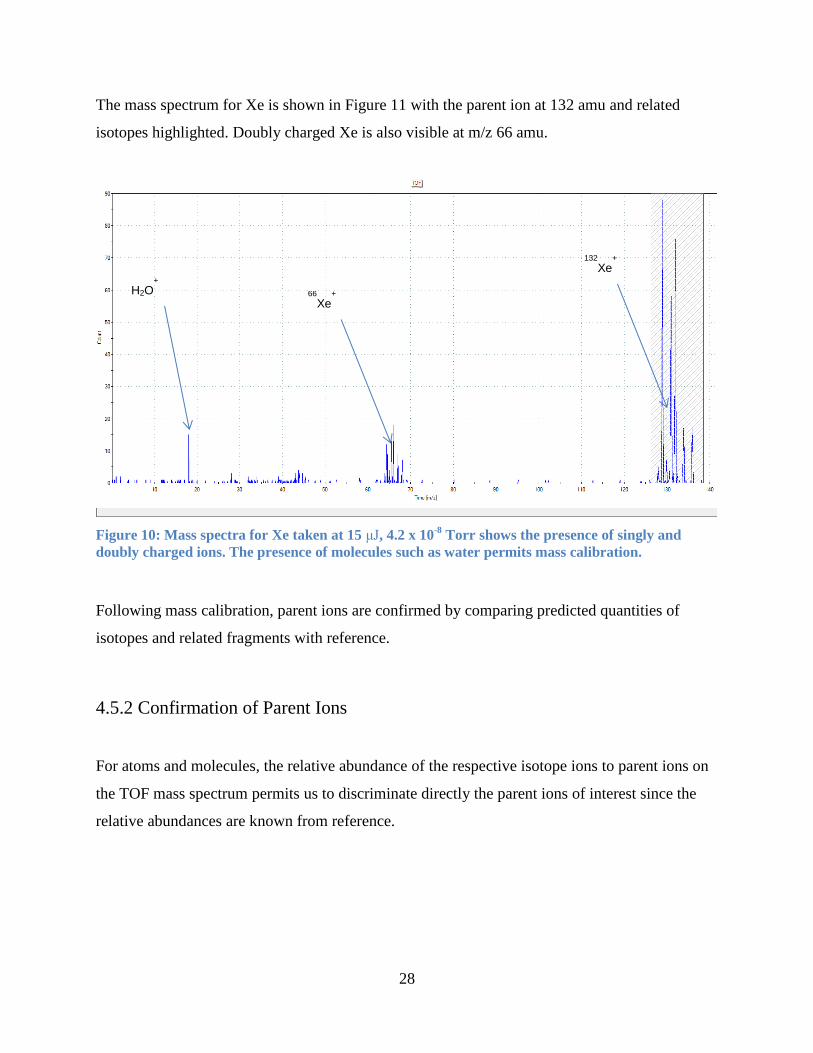
The mass spectrum for Xe is shown in Figure 11 with the parent ion at 132 amu and related
isotopes highlighted. Doubly charged Xe is also visible at m/z 66 amu.
Figure 10: Mass spectra for Xe taken at 15 μJ, 4.2 x 10⁻⁸
Torr shows the presence of singly and
doubly charged ions. The presence of molecules such as water permits mass calibration.
Following mass calibration, parent ions are confirmed by comparing predicted quantities of
isotopes and related fragments with reference.
4.5.2 Confirmation of Parent Ions
For atoms and molecules, the relative abundance of the respective isotope ions to parent ions on
the TOF mass spectrum permits us to discriminate directly the parent ions of interest since the
relative abundances are known from reference.
132
Xe+
66
Xe+
H2O+
29
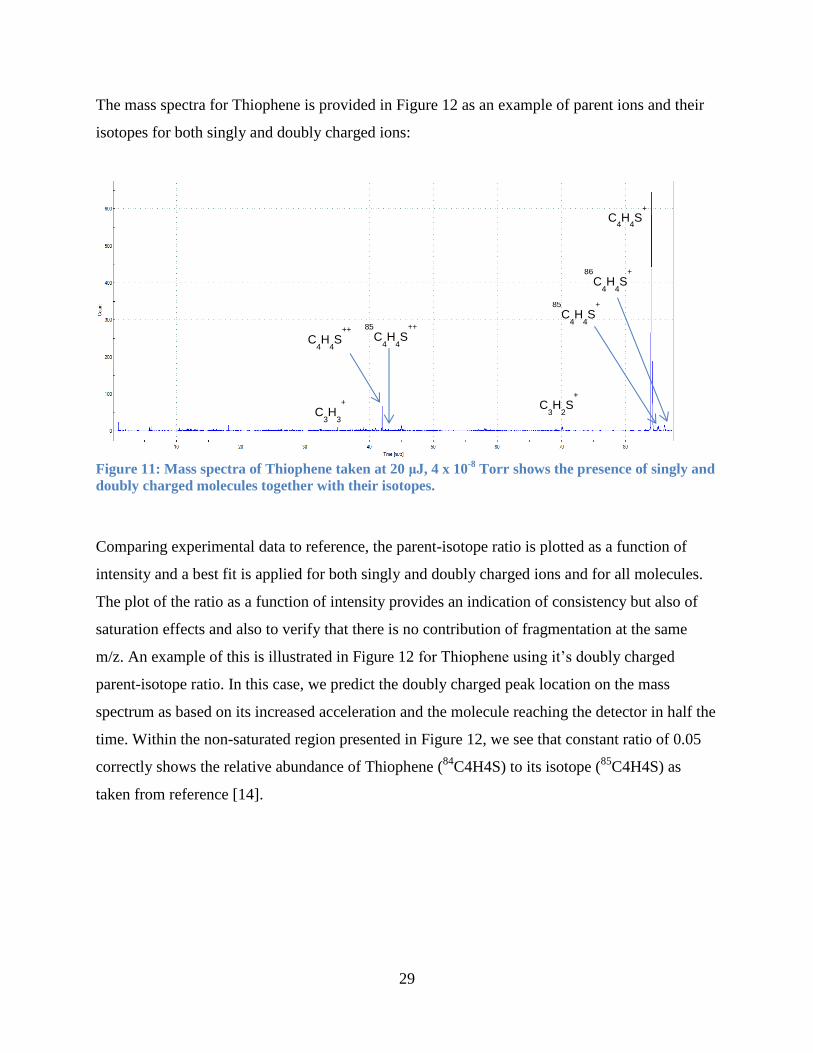
The mass spectra for Thiophene is provided in Figure 12 as an example of parent ions and their
isotopes for both singly and doubly charged ions:
Figure 11: Mass spectra of Thiophene taken at 20 μJ, 4 x 10
-8 Torr shows the presence of singly and
doubly charged molecules together with their isotopes.
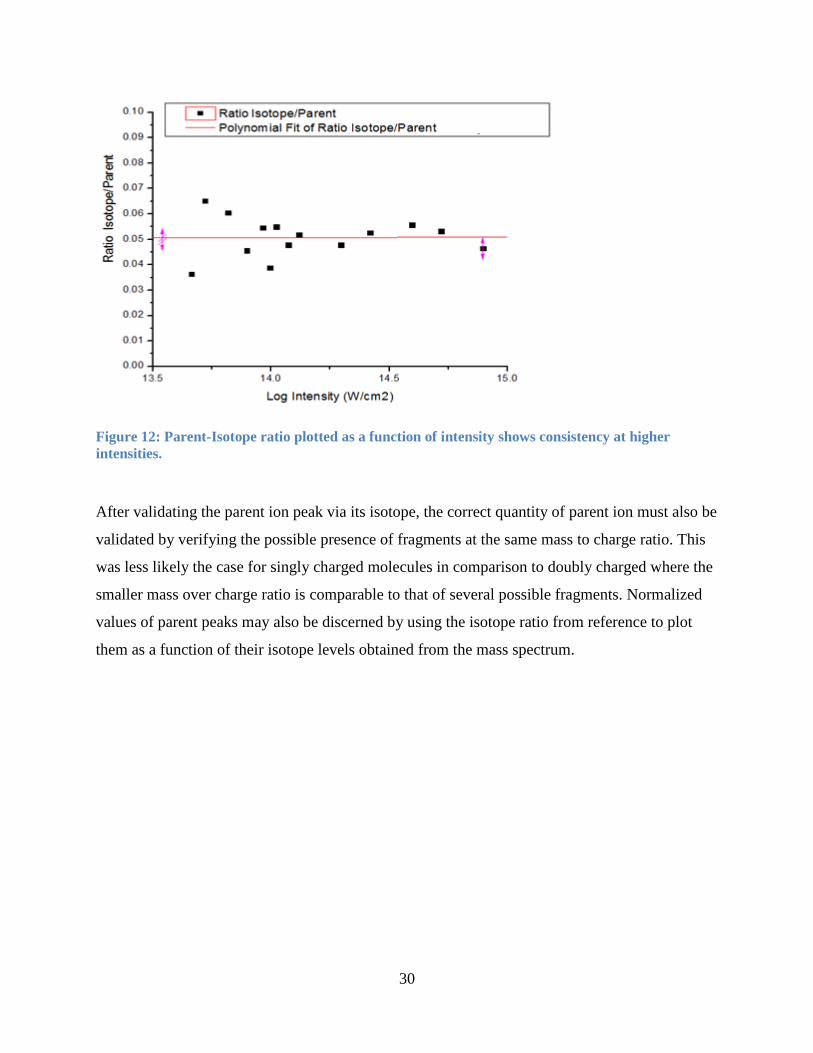
Comparing experimental data to reference, the parent-isotope ratio is plotted as a function of
intensity and a best fit is applied for both singly and doubly charged ions and for all molecules.
The plot of the ratio as a function of intensity provides an indication of consistency but also of
saturation effects and also to verify that there is no contribution of fragmentation at the same
m/z. An example of this is illustrated in Figure 12 for Thiophene using it’s doubly charged
parent-isotope ratio. In this case, we predict the doubly charged peak location on the mass
spectrum as based on its increased acceleration and the molecule reaching the detector in half the
time. Within the non-saturated region presented in Figure 12, we see that constant ratio of 0.05
correctly shows the relative abundance of Thiophene (84
C4H4S) to its isotope (85
C4H4S) as
taken from reference [14].
C4H
4S
+
85
C4H
4S
+
86
C4H
4S
+
C3H
2S
+
C4H
4S
++
85
C4H
4S
++
C3H
3
+
30
Figure 12: Parent-Isotope ratio plotted as a function of intensity shows consistency at higher
intensities.
After validating the parent ion peak via its isotope, the correct quantity of parent ion must also be
validated by verifying the possible presence of fragments at the same mass to charge ratio. This
was less likely the case for singly charged molecules in comparison to doubly charged where the
smaller mass over charge ratio is comparable to that of several possible fragments. Normalized
values of parent peaks may also be discerned by using the isotope ratio from reference to plot
them as a function of their isotope levels obtained from the mass spectrum.
31
Chapter 5: Photoionization of Aromatic Molecules
5.1 Intensity Calibration
Particular attention needs to be placed when measuring the ionization rate of molecules in the
high-intensity regime due to the uncertainty of the absolute intensity. Therefore, we need to
precisely know the intensity at which the ionization results are obtained so that comparisons can
be made amongst molecules. In order to accomplish a comparison of molecular ionization rates,
the laser intensity must therefore be calibrated for consistency. This is additionally important
due to the unique laser setup conditions and daily adjusted alignment which results in the amount
of energy required to saturate a molecule to vary at the time of experiment.
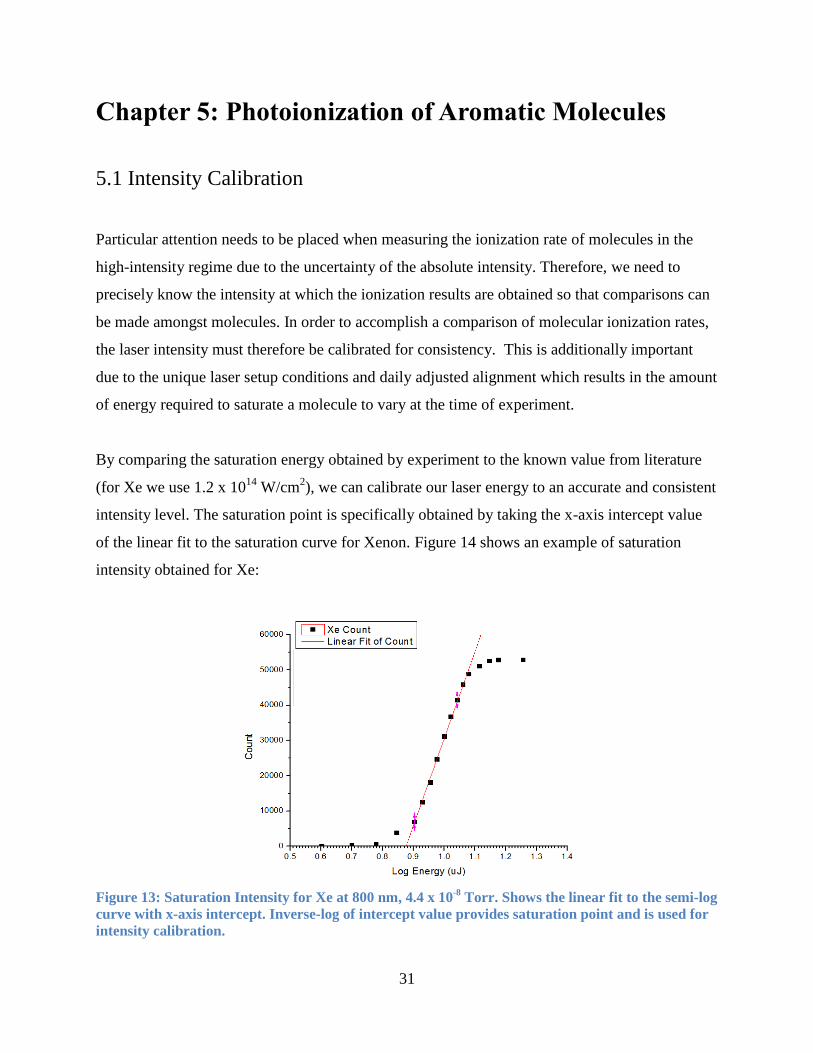
By comparing the saturation energy obtained by experiment to the known value from literature
(for Xe we use 1.2 x 10¹⁴
W/cm2), we can calibrate our laser energy to an accurate and consistent
intensity level. The saturation point is specifically obtained by taking the x-axis intercept value
of the linear fit to the saturation curve for Xenon. Figure 14 shows an example of saturation
intensity obtained for Xe:
Figure 13: Saturation Intensity for Xe at 800 nm, 4.4 x 10⁻⁸
Torr. Shows the linear fit to the semi-log
curve with x-axis intercept. Inverse-log of intercept value provides saturation point and is used for
intensity calibration.
32
Noting the saturation intensity value from literature and taking the inverse log of the saturation
energy from the above curve, we can calibrate the intensity accordingly. The linear fit to the
semi-log plot is taken between the points that have the least uncertainty between them as
indicated by the bars on the graph. In this particular case, 7 points are used for the linear fit and
the x-axis intercept provides the saturation point. This curve intercept corresponds to an energy
of 7.3 μJ when the inverse log is taken. This value is then used as a ratio with the energy being
applied and then multiplied by the intensity value from literature to obtain a calibrated intensity.
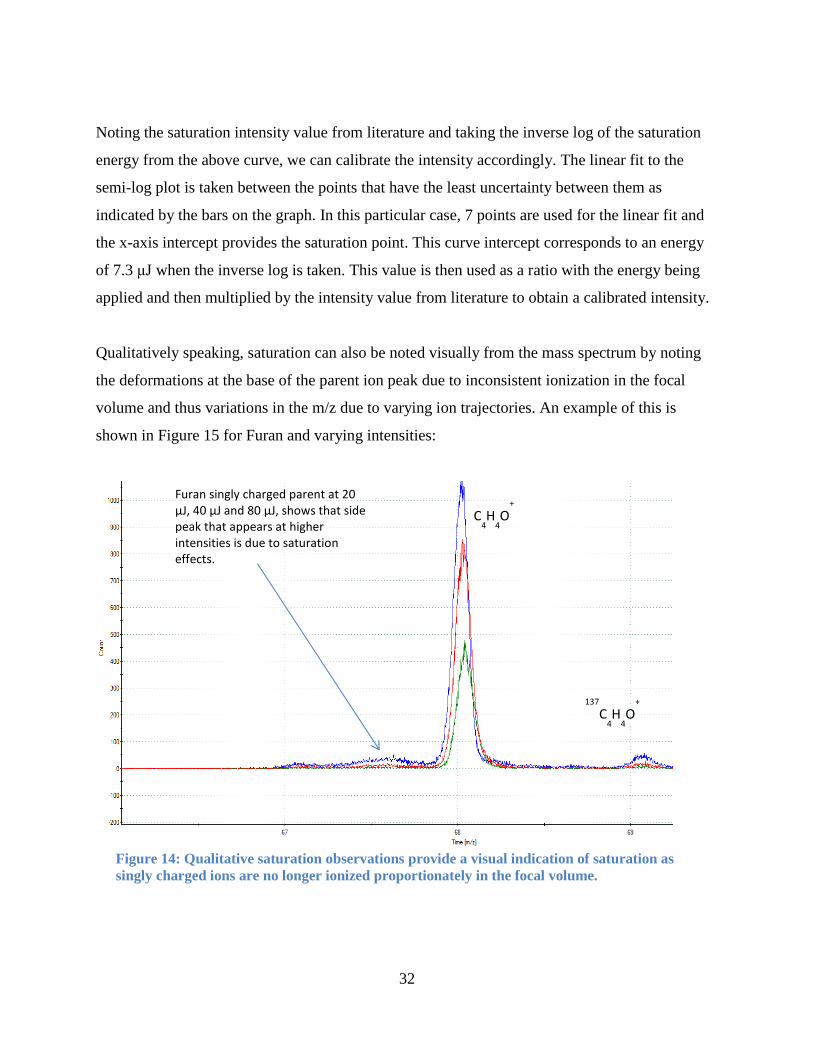
Qualitatively speaking, saturation can also be noted visually from the mass spectrum by noting
the deformations at the base of the parent ion peak due to inconsistent ionization in the focal
volume and thus variations in the m/z due to varying ion trajectories. An example of this is
shown in Figure 15 for Furan and varying intensities:
C4H
4O
+
137
C4H
4O
+
Furan singly charged parent at 20 μJ, 40 μJ and 80 μJ, shows that side peak that appears at higher intensities is due to saturation effects.
Figure 14: Qualitative saturation observations provide a visual indication of saturation as
singly charged ions are no longer ionized proportionately in the focal volume.
33
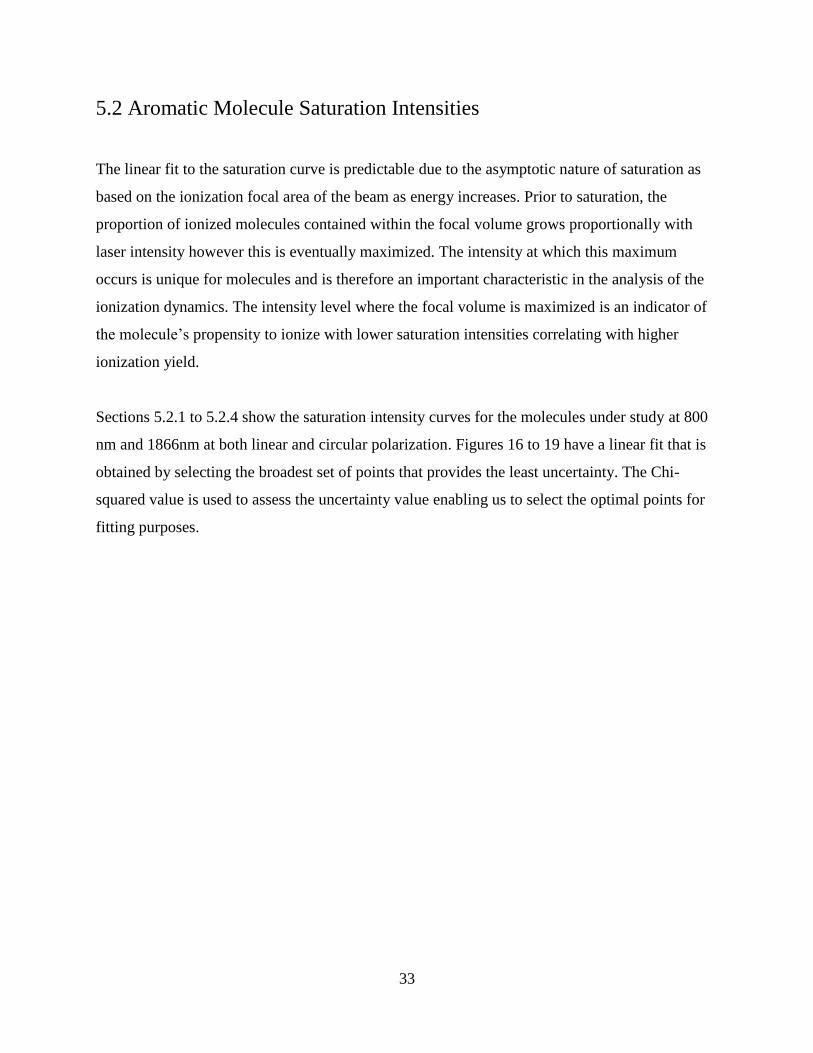
5.2 Aromatic Molecule Saturation Intensities
The linear fit to the saturation curve is predictable due to the asymptotic nature of saturation as
based on the ionization focal area of the beam as energy increases. Prior to saturation, the
proportion of ionized molecules contained within the focal volume grows proportionally with
laser intensity however this is eventually maximized. The intensity at which this maximum
occurs is unique for molecules and is therefore an important characteristic in the analysis of the
ionization dynamics. The intensity level where the focal volume is maximized is an indicator of
the molecule’s propensity to ionize with lower saturation intensities correlating with higher
ionization yield.
Sections 5.2.1 to 5.2.4 show the saturation intensity curves for the molecules under study at 800
nm and 1866nm at both linear and circular polarization. Figures 16 to 19 have a linear fit that is
obtained by selecting the broadest set of points that provides the least uncertainty. The Chi-
squared value is used to assess the uncertainty value enabling us to select the optimal points for
fitting purposes.
34
5.2.1 Plot 800nm, Linear Polarization
The saturation intensity order of the aromatic molecules using linear polarization is as follows (in
order of increasing intensity): 1. Pyrrole, 2. Thiophene, 3. Furan
Lower saturation intensity in Pyrrole permits us to conclude that the molecule requires less laser
intensity in the focal volume to ionize a given number of molecules. This correlates to the π
orbital electron delocalization inherent in aromatic molecules. Results suggest Pyrrole is more
aromatic followed by Thiophene and then Furan.
Pyrrole
2.6X10¹³
W/cm2
Furan
4.8X10¹³
W/cm2
Thiophene
3.8X10¹³
W/cm2
Dihydrofuran
3.4X10¹³
W/cm2
Figure 15: Saturation intensity curves at 800nm, Linear Polarization.
35
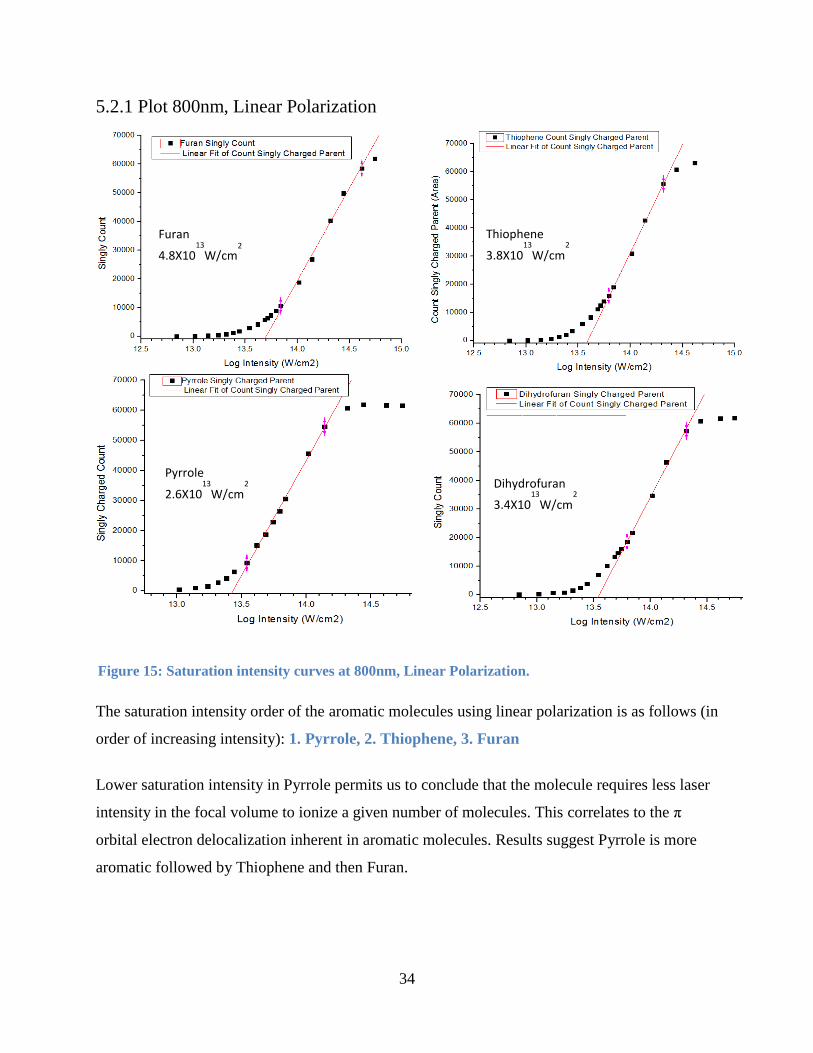
5.2.2 Plot 800nm, Circular Polarization
The saturation intensity order of the aromatic molecules using linear polarization is as follows (in
order of increasing intensity): 1. Pyrrole, 2. Thiophene, 3. Furan
Similar to the case of linear measurements taken at 800nm, the results for circular polarization
demonstrate that Pyrrole is more aromatic than Thiophene and Furan.
Furan
7.2X10¹³
W/cm2
Pyrrole
3.8X10¹³
W/cm2
Thiophene
4.4X10¹³
W/cm2
Dihydro
3.6X10¹³
W/cm2
Figure 16: Saturation Intensity curves at 800nm, Circular Polarization
36
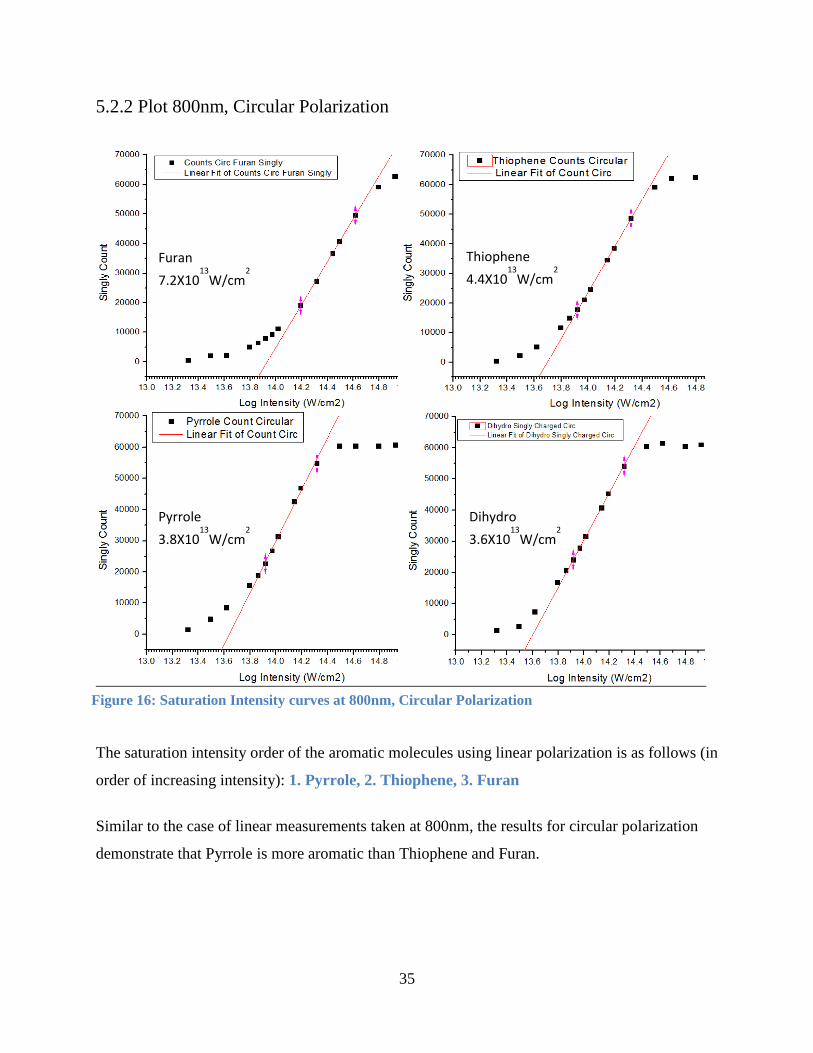
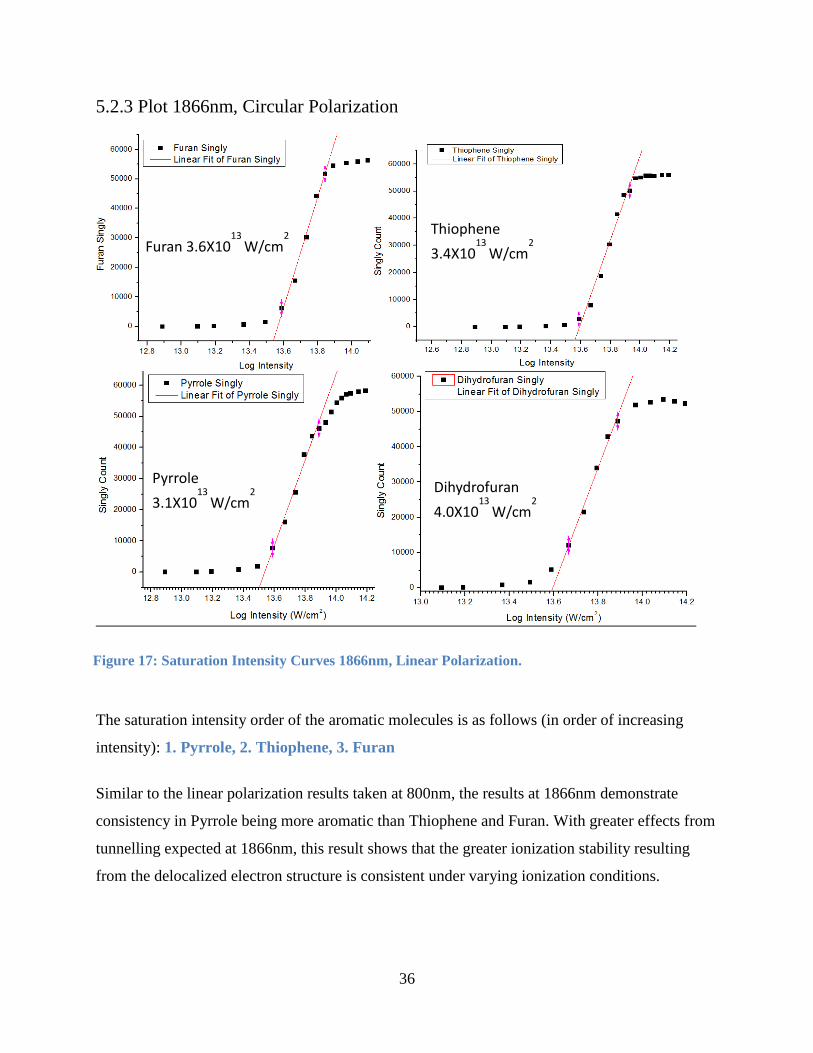
5.2.3 Plot 1866nm, Circular Polarization
The saturation intensity order of the aromatic molecules is as follows (in order of increasing
intensity): 1. Pyrrole, 2. Thiophene, 3. Furan
Similar to the linear polarization results taken at 800nm, the results at 1866nm demonstrate
consistency in Pyrrole being more aromatic than Thiophene and Furan. With greater effects from
tunnelling expected at 1866nm, this result shows that the greater ionization stability resulting
from the delocalized electron structure is consistent under varying ionization conditions.
Pyrrole
3.1X10¹³
W/cm2
Dihydrofuran
4.0X10¹³
W/cm2
Furan 3.6X10¹³
W/cm2
Thiophene
3.4X10¹³
W/cm2
Figure 17: Saturation Intensity Curves 1866nm, Linear Polarization.
37
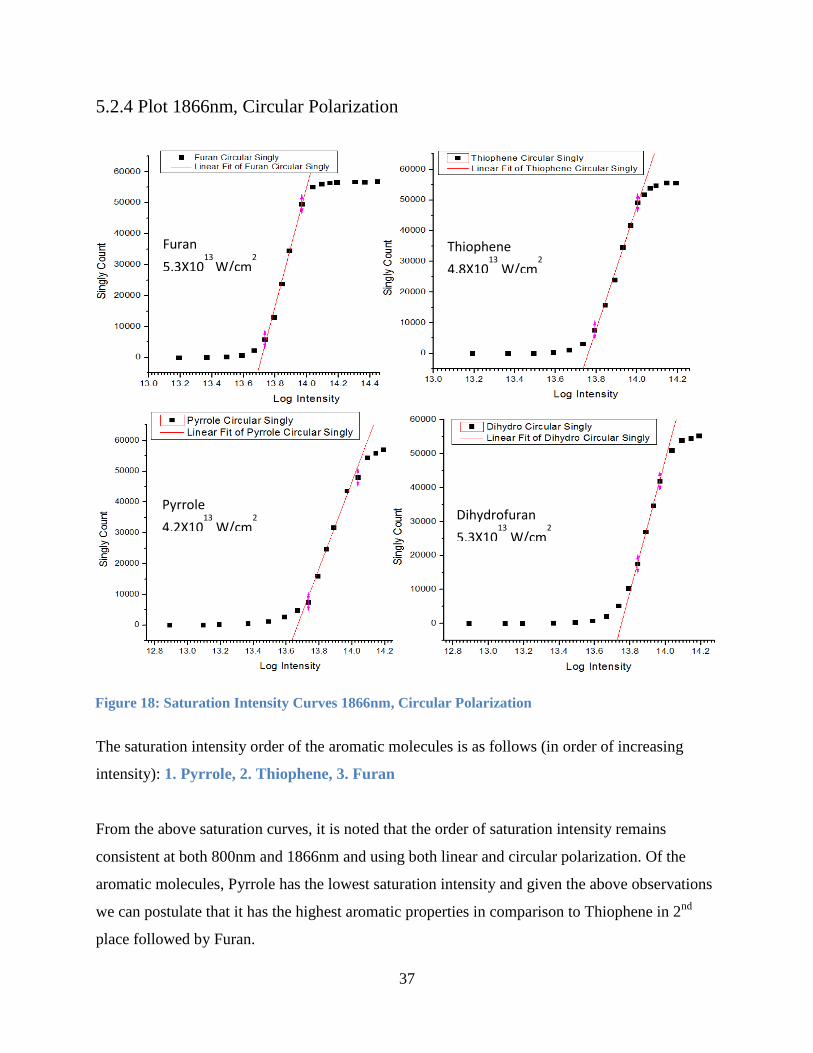
5.2.4 Plot 1866nm, Circular Polarization
The saturation intensity order of the aromatic molecules is as follows (in order of increasing
intensity): 1. Pyrrole, 2. Thiophene, 3. Furan
From the above saturation curves, it is noted that the order of saturation intensity remains
consistent at both 800nm and 1866nm and using both linear and circular polarization. Of the
aromatic molecules, Pyrrole has the lowest saturation intensity and given the above observations
we can postulate that it has the highest aromatic properties in comparison to Thiophene in 2nd
place followed by Furan.
Pyrrole
4.2X10¹³
W/cm2
Furan
5.3X10¹³
W/cm2
Thiophene
4.8X10¹³
W/cm2
Dihydrofuran
5.3X10¹³
W/cm2
Figure 18: Saturation Intensity Curves 1866nm, Circular Polarization
38
5.3 Polarization Variation:
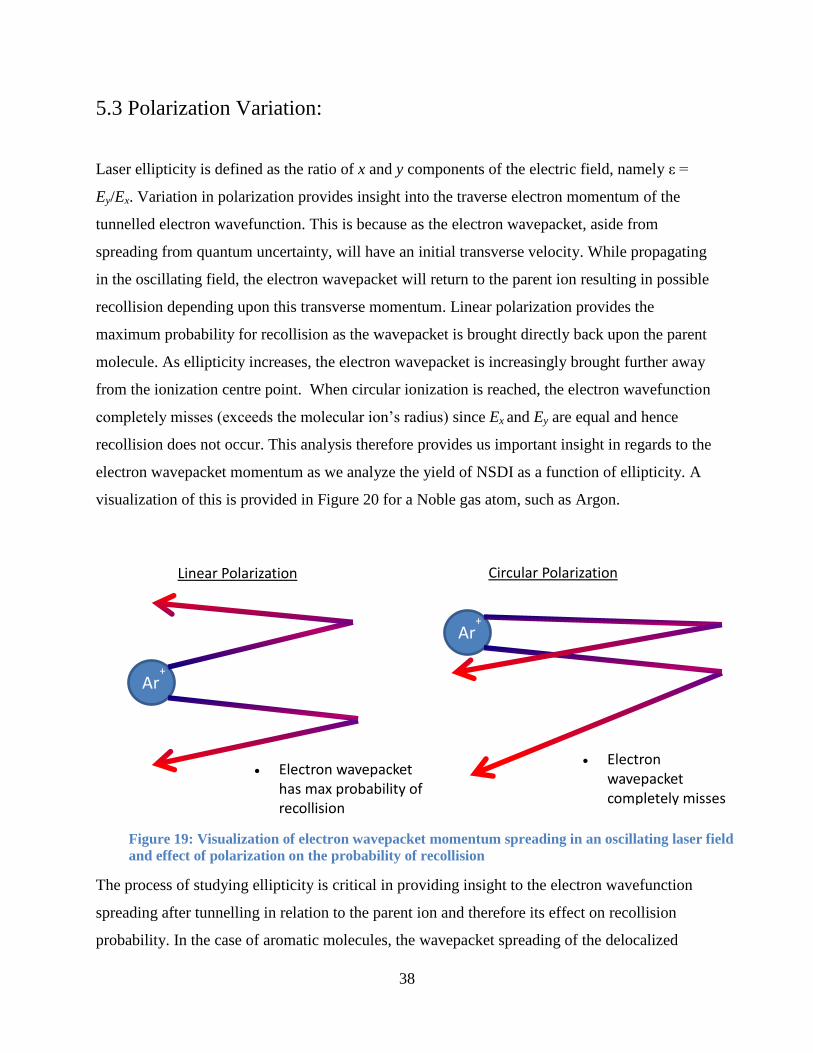
Laser ellipticity is defined as the ratio of x and y components of the electric field, namely ε =
Ey/Ex. Variation in polarization provides insight into the traverse electron momentum of the
tunnelled electron wavefunction. This is because as the electron wavepacket, aside from
spreading from quantum uncertainty, will have an initial transverse velocity. While propagating
in the oscillating field, the electron wavepacket will return to the parent ion resulting in possible
recollision depending upon this transverse momentum. Linear polarization provides the
maximum probability for recollision as the wavepacket is brought directly back upon the parent
molecule. As ellipticity increases, the electron wavepacket is increasingly brought further away
from the ionization centre point. When circular ionization is reached, the electron wavefunction
completely misses (exceeds the molecular ion’s radius) since Ex and Ey are equal and hence
recollision does not occur. This analysis therefore provides us important insight in regards to the
electron wavepacket momentum as we analyze the yield of NSDI as a function of ellipticity. A
visualization of this is provided in Figure 20 for a Noble gas atom, such as Argon.
The process of studying ellipticity is critical in providing insight to the electron wavefunction
spreading after tunnelling in relation to the parent ion and therefore its effect on recollision
probability. In the case of aromatic molecules, the wavepacket spreading of the delocalized
Linear Polarization
Circular Polarization
Ar+
Ar+
Electron wavepacket has max probability of recollision
Electron wavepacket completely misses parent ion
Figure 19: Visualization of electron wavepacket momentum spreading in an oscillating laser field
and effect of polarization on the probability of recollision
39
electrons contained within the π orbitals will depend on molecular structure and aromaticity as
will be see in this Section. Firstly, the comparison of linear to circular polarization is addressed
in Section 5.3.1
5.3.1 Photoionization with Linear and Circular Polarization
Besides the fact that electron wavepacket completely misses the parent ion in circularly polarized
light, photoionization by linear and circular polarized light can be different. For example, the E-
field of linearly polarized light will be greater than the circular polarization E-field, that is Elinear
> Ecircular. This is because the E-field amplitude for circular polarization is smaller than that for
linear by a factor of (reduction to approximately 0.71x10¹⁴
W/cm2).
On the other hand, in the tunnelling regime which is wavelength dependent, for a given pulse
energy we expect the tunnelling probability to be greater for circular than linear. This is because
of the oscillatory nature of the circular polarization field which is considered to be on at all times
resulting in increased probability of tunnelling. Therefore by studying the variations obtained in
singly ionization count of linear and circular polarization we gain insight into the intensity
dependence for ionization, namely the effects of ionization potential of the atom or molecule to
the laser intensity being applied.
Ionization of an atom/molecule results in slightly different yields for a given intensity with use of
linearly and circularly polarized light. So, to obtain similar yields for both laser polarizations the
intensity of circular polarized light has to be adjusted by a scaling factor that arises from the two
opposing effects discussed above. For atoms, the scaling factor is 0.65.
40
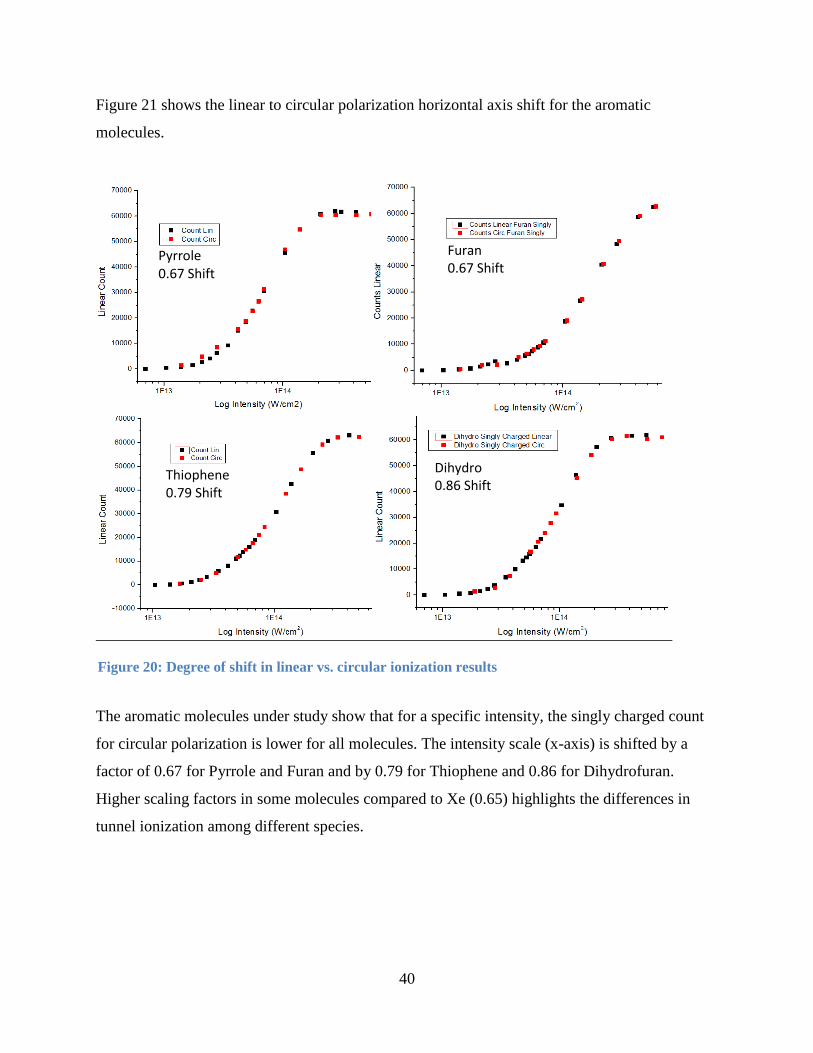
Figure 21 shows the linear to circular polarization horizontal axis shift for the aromatic
molecules.
The aromatic molecules under study show that for a specific intensity, the singly charged count
for circular polarization is lower for all molecules. The intensity scale (x-axis) is shifted by a
factor of 0.67 for Pyrrole and Furan and by 0.79 for Thiophene and 0.86 for Dihydrofuran.
Higher scaling factors in some molecules compared to Xe (0.65) highlights the differences in
tunnel ionization among different species.
Pyrrole
0.67 Shift
Thiophene
0.79 Shift
Dihydro
0.86 Shift
Furan
0.67 Shift
Figure 20: Degree of shift in linear vs. circular ionization results
41
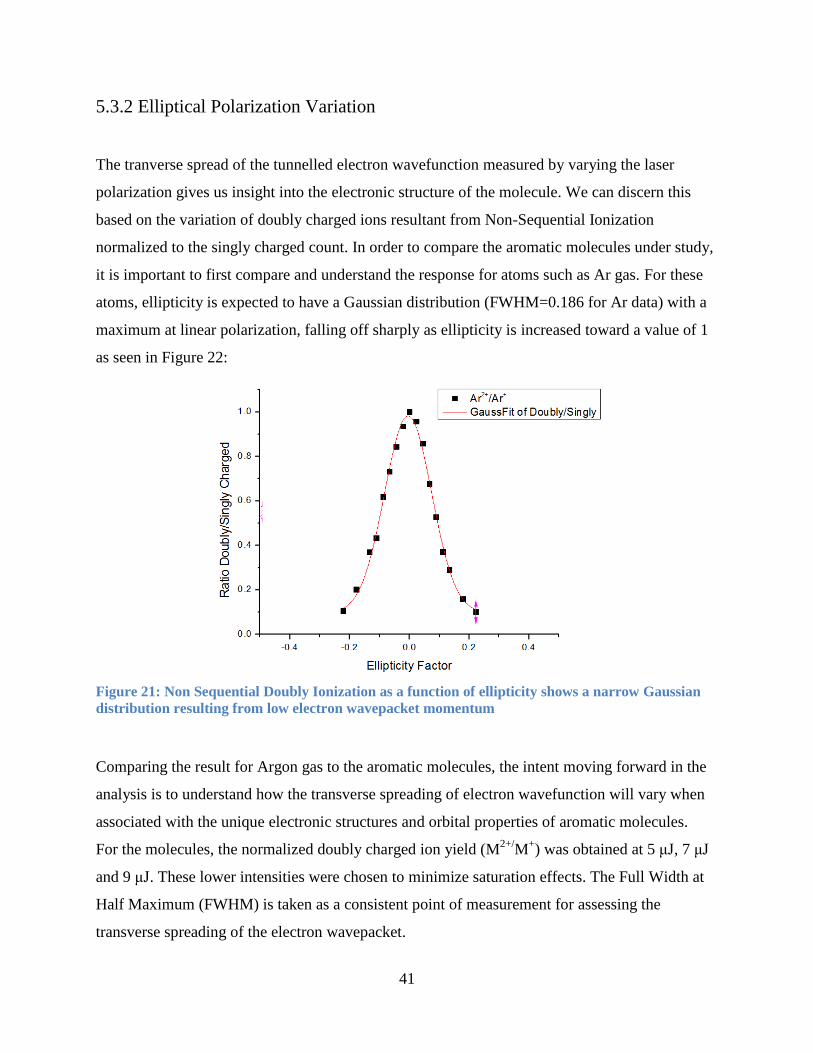
5.3.2 Elliptical Polarization Variation
The tranverse spread of the tunnelled electron wavefunction measured by varying the laser
polarization gives us insight into the electronic structure of the molecule. We can discern this
based on the variation of doubly charged ions resultant from Non-Sequential Ionization
normalized to the singly charged count. In order to compare the aromatic molecules under study,
it is important to first compare and understand the response for atoms such as Ar gas. For these
atoms, ellipticity is expected to have a Gaussian distribution (FWHM=0.186 for Ar data) with a
maximum at linear polarization, falling off sharply as ellipticity is increased toward a value of 1
as seen in Figure 22:
Figure 21: Non Sequential Doubly Ionization as a function of ellipticity shows a narrow Gaussian
distribution resulting from low electron wavepacket momentum
Comparing the result for Argon gas to the aromatic molecules, the intent moving forward in the
analysis is to understand how the transverse spreading of electron wavefunction will vary when
associated with the unique electronic structures and orbital properties of aromatic molecules.
For the molecules, the normalized doubly charged ion yield (M2+/
M+) was obtained at 5 μJ, 7 μJ
and 9 μJ. These lower intensities were chosen to minimize saturation effects. The Full Width at
Half Maximum (FWHM) is taken as a consistent point of measurement for assessing the
transverse spreading of the electron wavepacket.
42
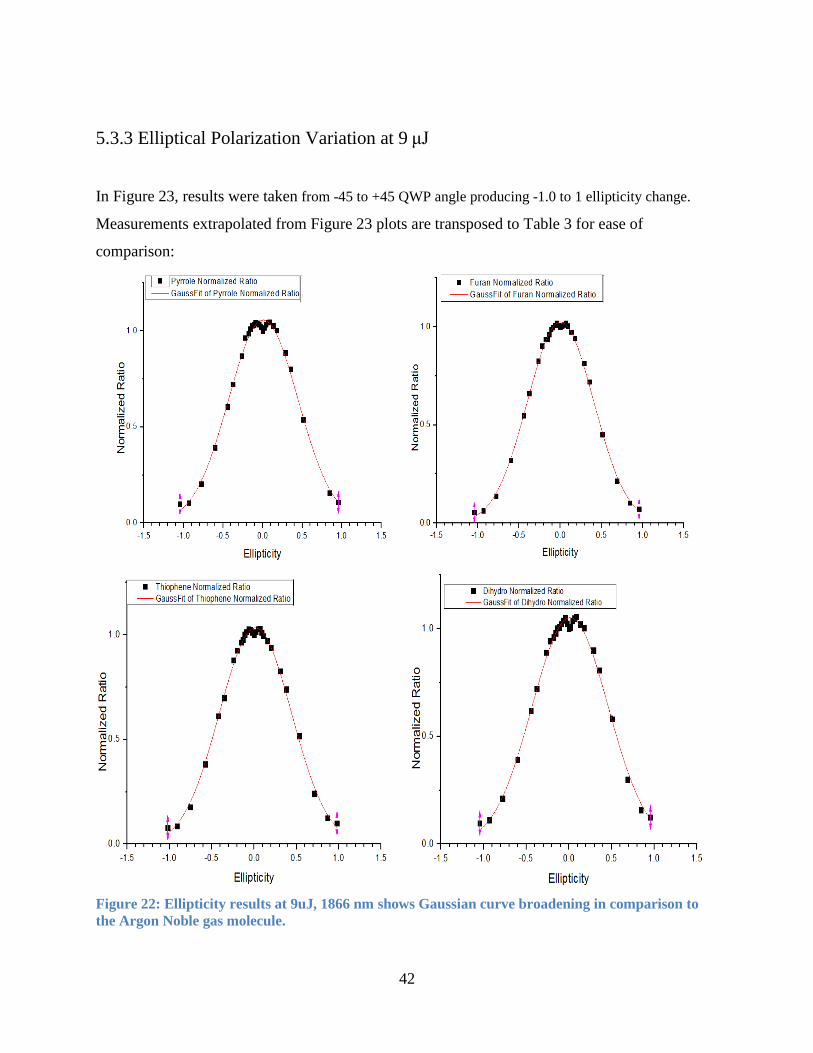
5.3.3 Elliptical Polarization Variation at 9 μJ
In Figure 23, results were taken from -45 to +45 QWP angle producing -1.0 to 1 ellipticity change.
Measurements extrapolated from Figure 23 plots are transposed to Table 3 for ease of
comparison:
Figure 22: Ellipticity results at 9uJ, 1866 nm shows Gaussian curve broadening in comparison to
the Argon Noble gas molecule.
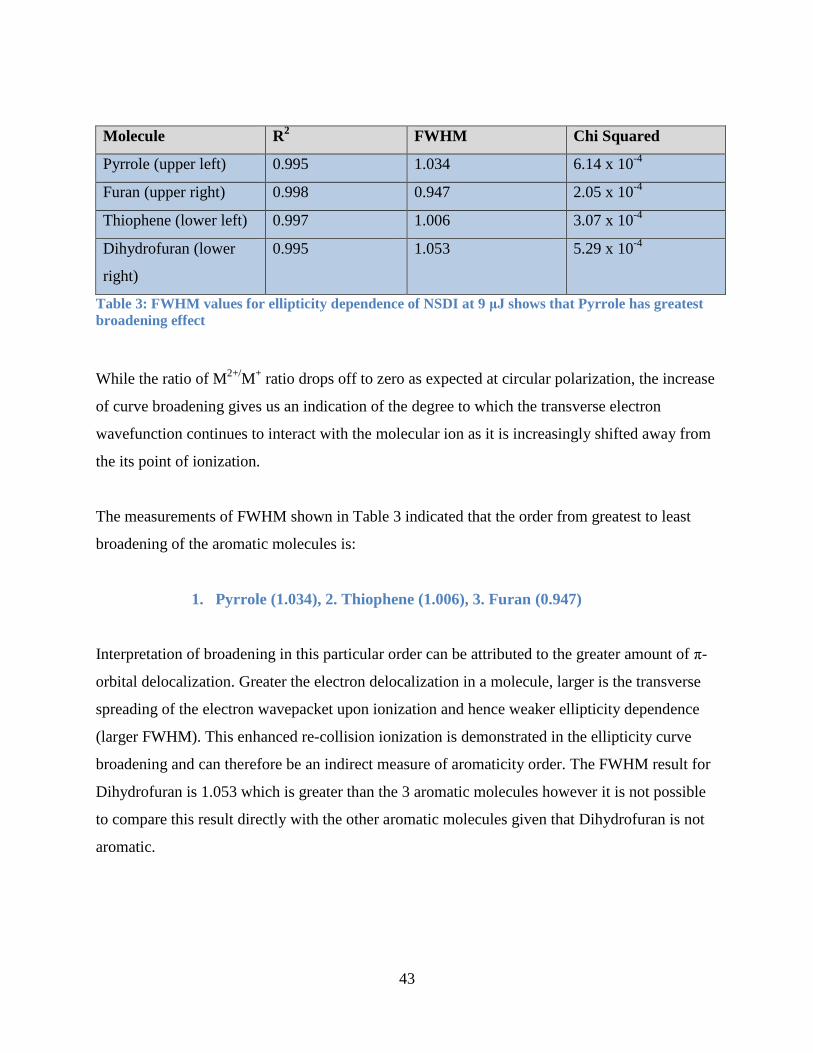
43
Molecule R2 FWHM Chi Squared
Pyrrole (upper left) 0.995 1.034 6.14 x 10⁻⁴
Furan (upper right) 0.998 0.947 2.05 x 10⁻⁴
Thiophene (lower left) 0.997 1.006 3.07 x 10⁻⁴
Dihydrofuran (lower
right)
0.995 1.053 5.29 x 10⁻⁴
Table 3: FWHM values for ellipticity dependence of NSDI at 9 μJ shows that Pyrrole has greatest
broadening effect
While the ratio of M2+/
M+ ratio drops off to zero as expected at circular polarization, the increase
of curve broadening gives us an indication of the degree to which the transverse electron
wavefunction continues to interact with the molecular ion as it is increasingly shifted away from
the its point of ionization.
The measurements of FWHM shown in Table 3 indicated that the order from greatest to least
broadening of the aromatic molecules is:
1. Pyrrole (1.034), 2. Thiophene (1.006), 3. Furan (0.947)
Interpretation of broadening in this particular order can be attributed to the greater amount of π-
orbital delocalization. Greater the electron delocalization in a molecule, larger is the transverse
spreading of the electron wavepacket upon ionization and hence weaker ellipticity dependence
(larger FWHM). This enhanced re-collision ionization is demonstrated in the ellipticity curve
broadening and can therefore be an indirect measure of aromaticity order. The FWHM result for
Dihydrofuran is 1.053 which is greater than the 3 aromatic molecules however it is not possible
to compare this result directly with the other aromatic molecules given that Dihydrofuran is not
aromatic.
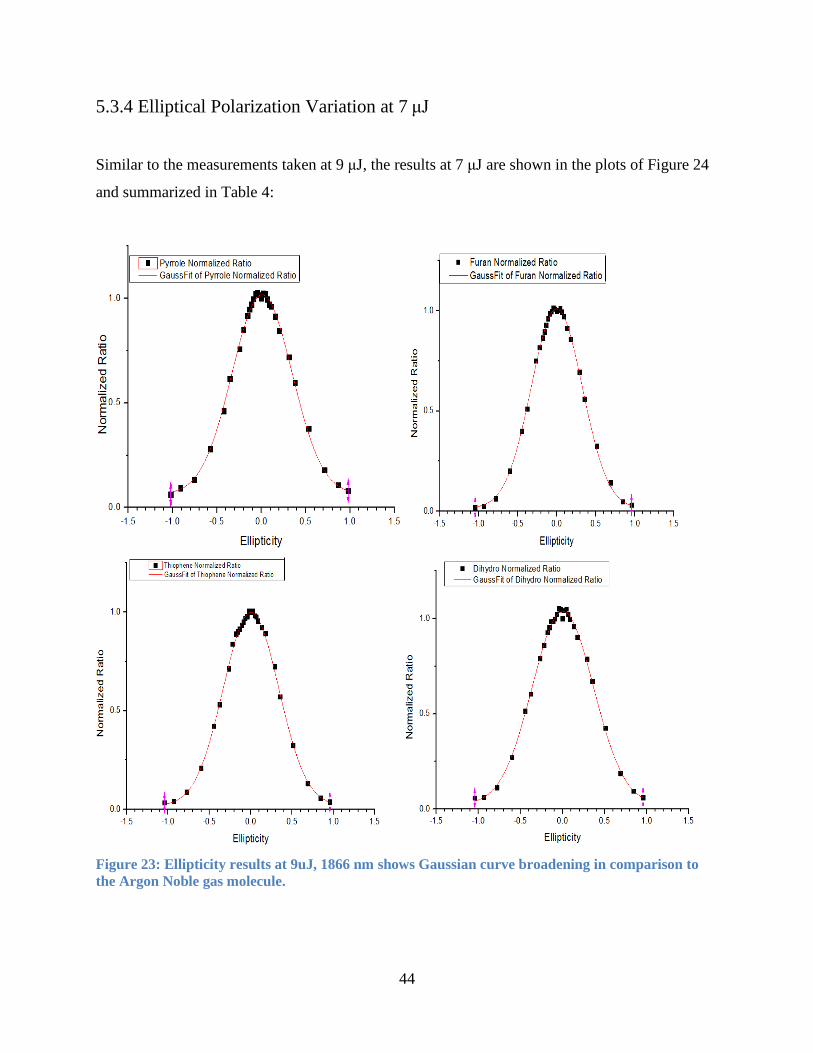
44
5.3.4 Elliptical Polarization Variation at 7 μJ
Similar to the measurements taken at 9 μJ, the results at 7 μJ are shown in the plots of Figure 24
and summarized in Table 4:
Figure 23: Ellipticity results at 9uJ, 1866 nm shows Gaussian curve broadening in comparison to
the Argon Noble gas molecule.
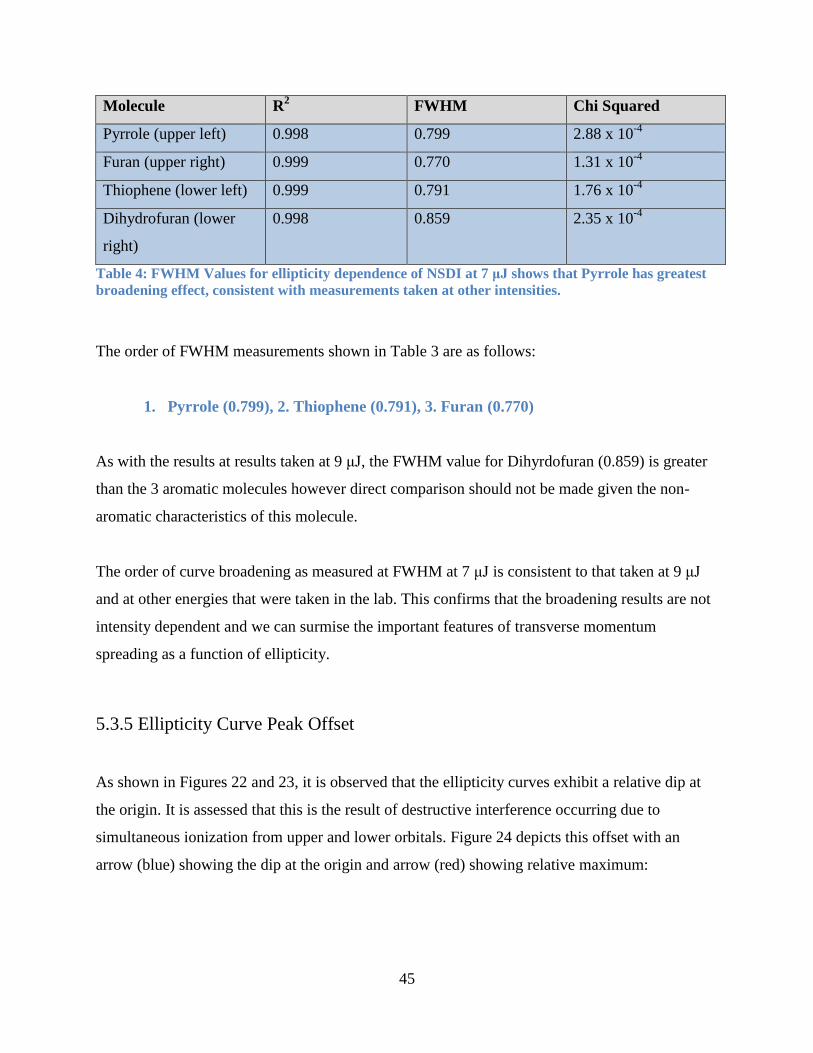
45
Molecule R2 FWHM Chi Squared
Pyrrole (upper left) 0.998 0.799 2.88 x 10⁻⁴
Furan (upper right) 0.999 0.770 1.31 x 10⁻⁴
Thiophene (lower left) 0.999 0.791 1.76 x 10⁻⁴
Dihydrofuran (lower
right)
0.998 0.859 2.35 x 10⁻⁴
Table 4: FWHM Values for ellipticity dependence of NSDI at 7 μJ shows that Pyrrole has greatest
broadening effect, consistent with measurements taken at other intensities.
The order of FWHM measurements shown in Table 3 are as follows:
1. Pyrrole (0.799), 2. Thiophene (0.791), 3. Furan (0.770)
As with the results at results taken at 9 μJ, the FWHM value for Dihyrdofuran (0.859) is greater
than the 3 aromatic molecules however direct comparison should not be made given the non-
aromatic characteristics of this molecule.
The order of curve broadening as measured at FWHM at 7 μJ is consistent to that taken at 9 μJ
and at other energies that were taken in the lab. This confirms that the broadening results are not
intensity dependent and we can surmise the important features of transverse momentum
spreading as a function of ellipticity.
5.3.5 Ellipticity Curve Peak Offset
As shown in Figures 22 and 23, it is observed that the ellipticity curves exhibit a relative dip at
the origin. It is assessed that this is the result of destructive interference occurring due to
simultaneous ionization from upper and lower orbitals. Figure 24 depicts this offset with an
arrow (blue) showing the dip at the origin and arrow (red) showing relative maximum:
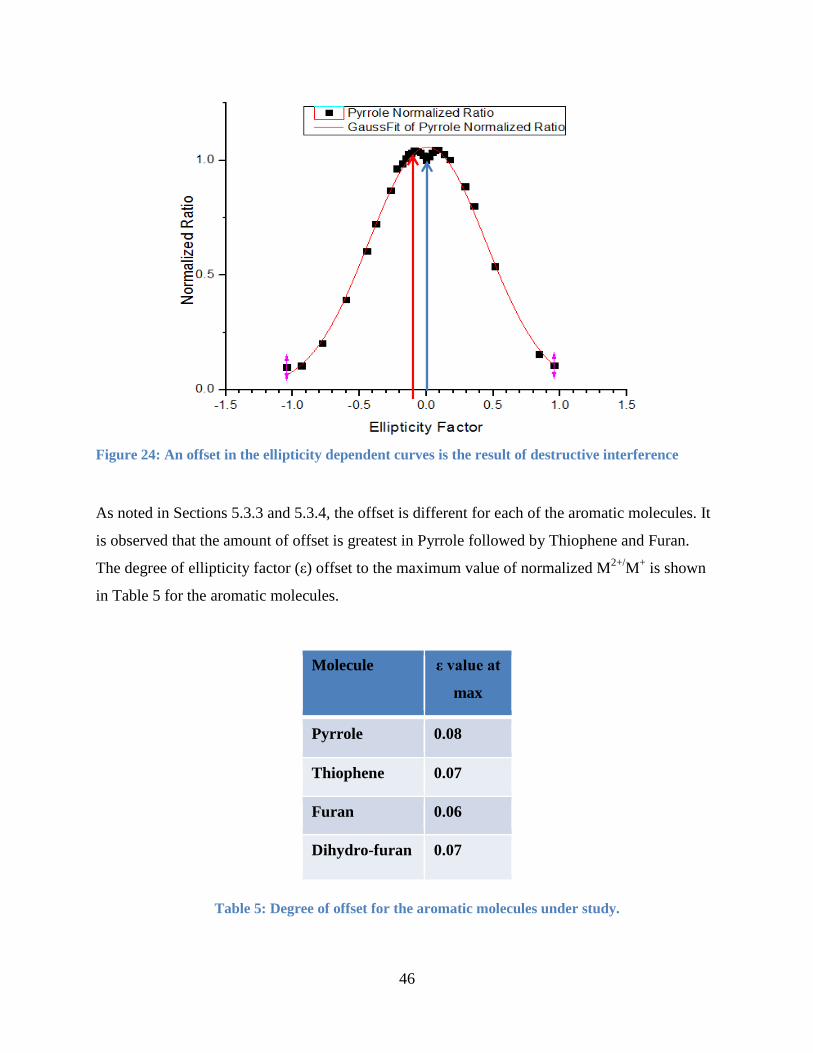
46
Figure 24: An offset in the ellipticity dependent curves is the result of destructive interference
As noted in Sections 5.3.3 and 5.3.4, the offset is different for each of the aromatic molecules. It
is observed that the amount of offset is greatest in Pyrrole followed by Thiophene and Furan.
The degree of ellipticity factor (ε) offset to the maximum value of normalized M2+/
M+ is shown
in Table 5 for the aromatic molecules.
Molecule ε value at
max
Pyrrole 0.08
Thiophene 0.07
Furan 0.06
Dihydro-furan 0.07
Table 5: Degree of offset for the aromatic molecules under study.
47
These differences are the result of destructive interference from simultaneous ionization from
upper and lower orbitals. Greater ellipticity permits a shift in the ionization direction thereby
eliminating this interference. The amount of offset gives us insight into the orbital extent of the
upper and lower lobes. The greatest offset noted in Pyrrole followed by Thiophene and then
Furan gives us additional knowledge of how orbital extent may play a role in electron
delocalization of aromatic molecules.
In summary, the ellipticity M2+/
M+ curves provide us insight into the correlation between the
transverse spread of the electron wavefunction and the π orbitals of the aromatic molecules.
Therefore, the hypothesis that aromatic molecules whose π orbitals result in the enhancement of
electron delocalization can be further confirmed by the order of curve broadening.
5.4 Photoionization and Aromaticity
The singly, doubly and normalized ionization plots provide insight into the ionization dynamics
of the aromatic molecules. Two separate data sets were collected for both 800 nm and 1866 nm
wavelengths shown in Figures 26 and 27. Data derived from these results was found to be
internally consistent at each wavelength and when comparing 800nm to 1866nm (OPA Beam).
The results suggest that photoionization rates are sensitive to the aromatic nature of the
molecules. Error-bars are for the respective plots are smaller than the pixel size hence are not
displayed.
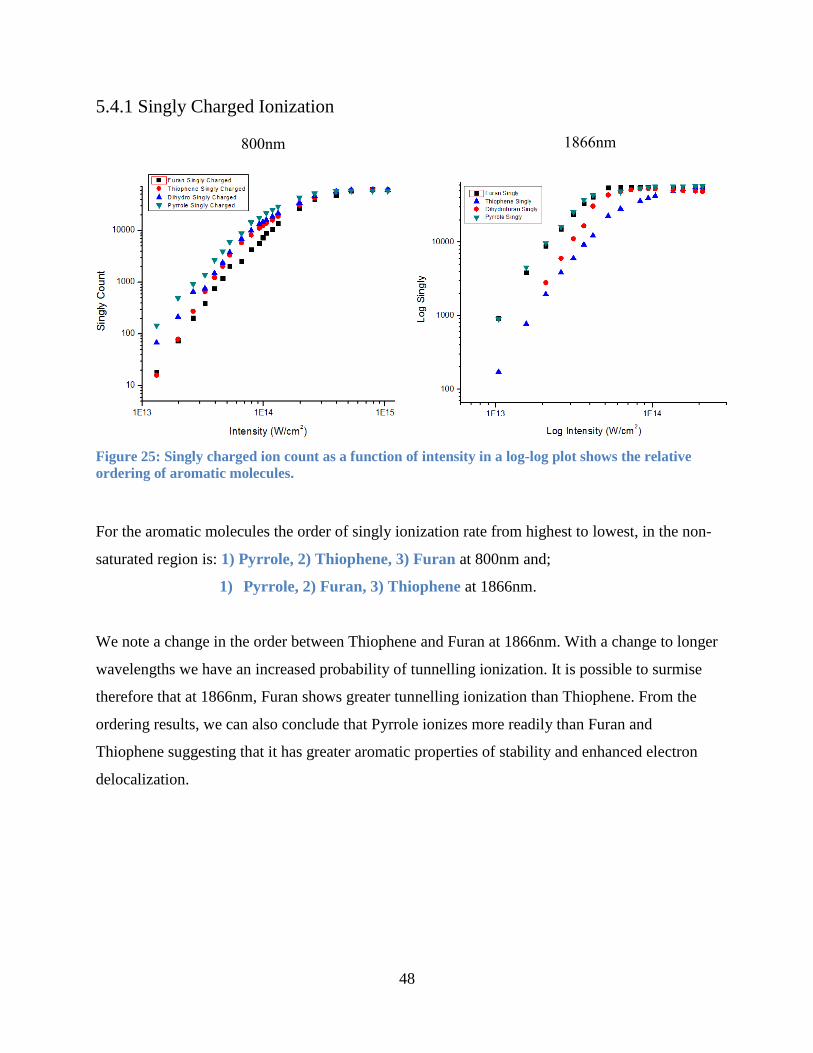
48
5.4.1 Singly Charged Ionization
Figure 25: Singly charged ion count as a function of intensity in a log-log plot shows the relative
ordering of aromatic molecules.
For the aromatic molecules the order of singly ionization rate from highest to lowest, in the non-
saturated region is: 1) Pyrrole, 2) Thiophene, 3) Furan at 800nm and;
1) Pyrrole, 2) Furan, 3) Thiophene at 1866nm.
We note a change in the order between Thiophene and Furan at 1866nm. With a change to longer
wavelengths we have an increased probability of tunnelling ionization. It is possible to surmise
therefore that at 1866nm, Furan shows greater tunnelling ionization than Thiophene. From the
ordering results, we can also conclude that Pyrrole ionizes more readily than Furan and
Thiophene suggesting that it has greater aromatic properties of stability and enhanced electron
delocalization.
800nm 1866nm
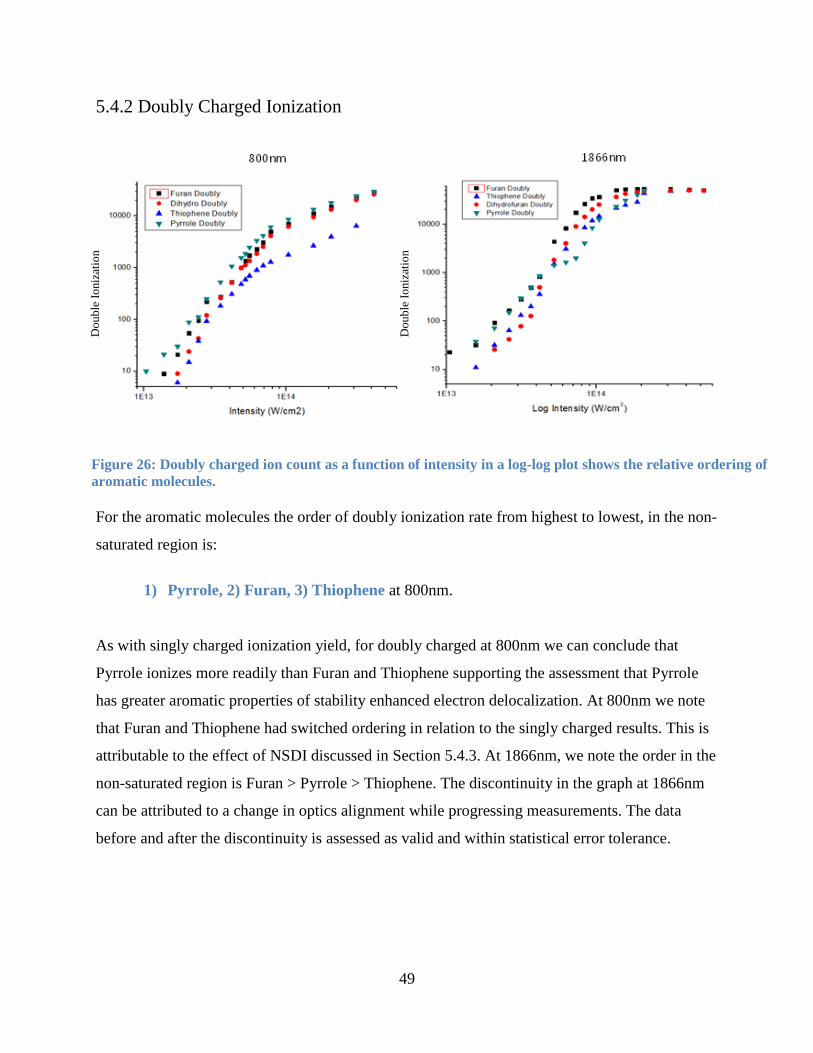
49
5.4.2 Doubly Charged Ionization
For the aromatic molecules the order of doubly ionization rate from highest to lowest, in the non-
saturated region is:
1) Pyrrole, 2) Furan, 3) Thiophene at 800nm.
As with singly charged ionization yield, for doubly charged at 800nm we can conclude that
Pyrrole ionizes more readily than Furan and Thiophene supporting the assessment that Pyrrole
has greater aromatic properties of stability enhanced electron delocalization. At 800nm we note
that Furan and Thiophene had switched ordering in relation to the singly charged results. This is
attributable to the effect of NSDI discussed in Section 5.4.3. At 1866nm, we note the order in the
non-saturated region is Furan > Pyrrole > Thiophene. The discontinuity in the graph at 1866nm
can be attributed to a change in optics alignment while progressing measurements. The data
before and after the discontinuity is assessed as valid and within statistical error tolerance.
Figure 26: Doubly charged ion count as a function of intensity in a log-log plot shows the relative ordering of
aromatic molecules.
Do
ub
le I
oniz
atio
n
Do
ub
le I
oniz
atio
n
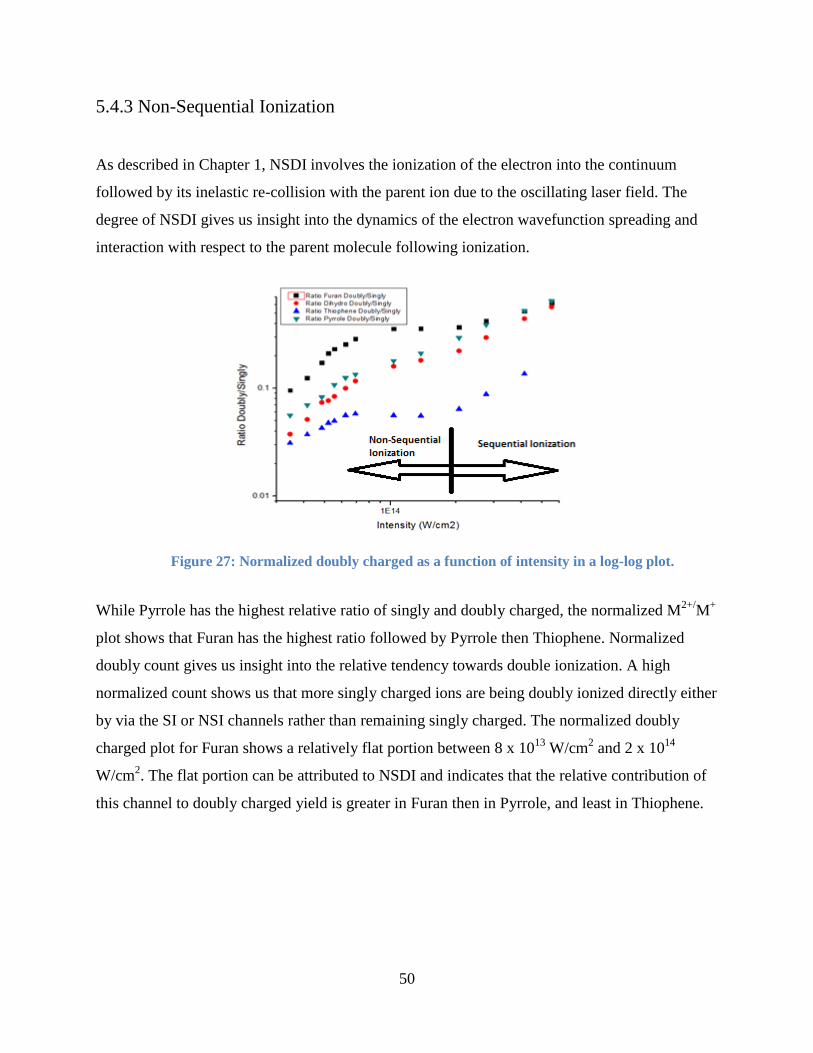
50
5.4.3 Non-Sequential Ionization
As described in Chapter 1, NSDI involves the ionization of the electron into the continuum
followed by its inelastic re-collision with the parent ion due to the oscillating laser field. The
degree of NSDI gives us insight into the dynamics of the electron wavefunction spreading and
interaction with respect to the parent molecule following ionization.
While Pyrrole has the highest relative ratio of singly and doubly charged, the normalized M
2+/M
+
plot shows that Furan has the highest ratio followed by Pyrrole then Thiophene. Normalized
doubly count gives us insight into the relative tendency towards double ionization. A high
normalized count shows us that more singly charged ions are being doubly ionized directly either
by via the SI or NSI channels rather than remaining singly charged. The normalized doubly
charged plot for Furan shows a relatively flat portion between 8 x 10¹³
W/cm2 and 2 x 10
14
W/cm2. The flat portion can be attributed to NSDI and indicates that the relative contribution of
this channel to doubly charged yield is greater in Furan then in Pyrrole, and least in Thiophene.
Figure 27: Normalized doubly charged as a function of intensity in a log-log plot.
51
Analysis of Figure 27 also provides an explanation why Furan had greater total yield of doubly
charged count than Thiophene in comparison to the singly count results where this order was
reversed. Consequently, it is proposed that the stated correlation with aromaticity stated in
Sections 5.4.1 and 5.4.2 remains the same as follows:
1) Pyrrole, 2) Thiophene, 3) Furan.
Contributions from NSI to double ionization in aromatic molecules Furan and Pyrrole are greater
than in the non-aromatic molecule Dihydrofuran. In terms of NSI, Pyrrole behaves similar to
Dihydrofuran.
5.5 HHG Results Comparison
As postulated in Chapter 1, the comparison of the photoionization yield from the aromatic
molecules to the HHG yield can provide insight into the contribution of this phase to the overall
3-step process. In this section we compare the photoionization results to the ratios of HHG yield
collected in previous studies conducted by Alharbi et al. The photoionization results together
with the HHG results are provided for comparison in Figures 29, 30 and 31. The photoionization
experiments were conducted at low energy values hence when conducting the comparison
between experiments, we consider only the lowest photon energies which are represented at the
origin of the HHG results. The HHG results were also conducted at two intensity values so this
needs to be taken into account when comparing the two plots, details of interpreting this is
provided within section 5.5.1 through 5.5.3.
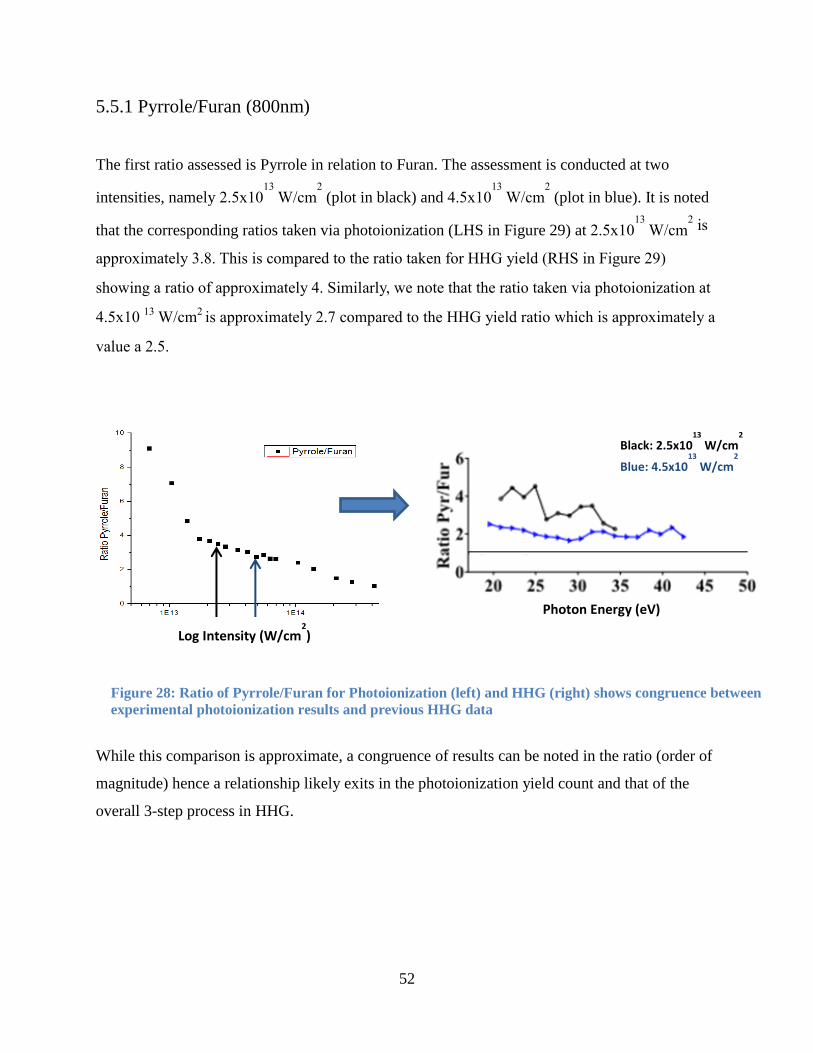
52
5.5.1 Pyrrole/Furan (800nm)
The first ratio assessed is Pyrrole in relation to Furan. The assessment is conducted at two
intensities, namely 2.5x10¹³
W/cm2
(plot in black) and 4.5x10¹³
W/cm2
(plot in blue). It is noted
that the corresponding ratios taken via photoionization (LHS in Figure 29) at 2.5x10¹³
W/cm2 is
approximately 3.8. This is compared to the ratio taken for HHG yield (RHS in Figure 29)
showing a ratio of approximately 4. Similarly, we note that the ratio taken via photoionization at
4.5x10 13
W/cm2 is approximately 2.7 compared to the HHG yield ratio which is approximately a
value a 2.5.
While this comparison is approximate, a congruence of results can be noted in the ratio (order of
magnitude) hence a relationship likely exits in the photoionization yield count and that of the
overall 3-step process in HHG.
Figure 28: Ratio of Pyrrole/Furan for Photoionization (left) and HHG (right) shows congruence between
experimental photoionization results and previous HHG data
Log Intensity (W/cm2)
Black: 2.5x10¹³
W/cm2
Blue: 4.5x10¹³
W/cm2
Photon Energy (eV)
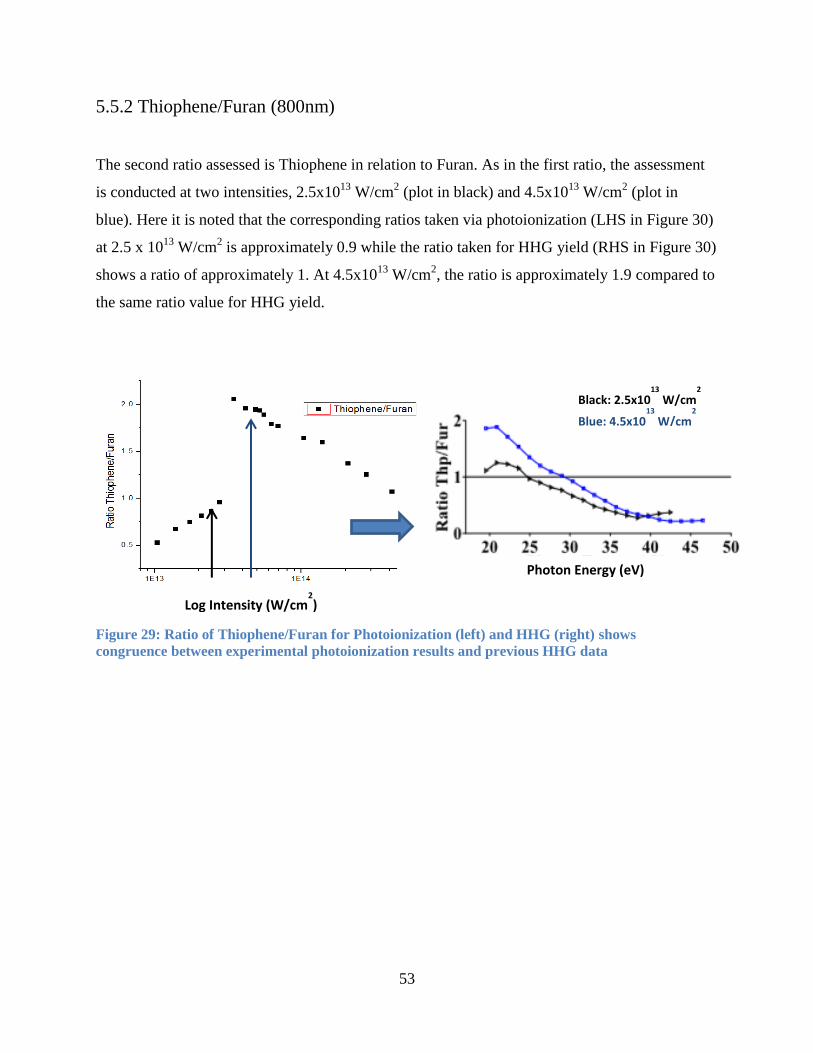
53
5.5.2 Thiophene/Furan (800nm)
The second ratio assessed is Thiophene in relation to Furan. As in the first ratio, the assessment
is conducted at two intensities, 2.5x10¹³
W/cm2 (plot in black) and 4.5x10
13 W/cm
2 (plot in
blue). Here it is noted that the corresponding ratios taken via photoionization (LHS in Figure 30)
at 2.5 x 10¹³
W/cm2 is approximately 0.9 while the ratio taken for HHG yield (RHS in Figure 30)
shows a ratio of approximately 1. At 4.5x10¹³
W/cm2, the ratio is approximately 1.9 compared to
the same ratio value for HHG yield.
Black: 2.5x10¹³
W/cm2
Blue: 4.5x10¹³
W/cm2
Log Intensity (W/cm2)
Figure 29: Ratio of Thiophene/Furan for Photoionization (left) and HHG (right) shows
congruence between experimental photoionization results and previous HHG data
Photon Energy (eV)
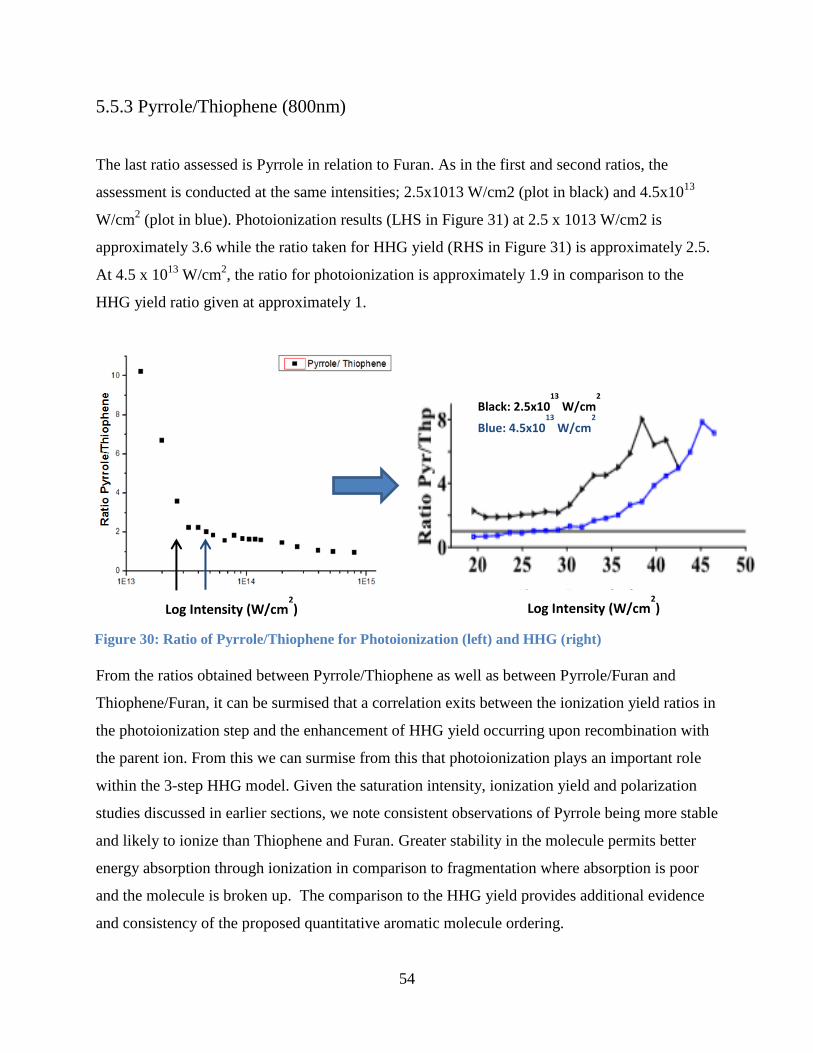
54
5.5.3 Pyrrole/Thiophene (800nm)
The last ratio assessed is Pyrrole in relation to Furan. As in the first and second ratios, the
assessment is conducted at the same intensities; 2.5x10¹³ W/cm2 (plot in black) and 4.5x10¹³
W/cm2 (plot in blue). Photoionization results (LHS in Figure 31) at 2.5 x 10¹³ W/cm2 is
approximately 3.6 while the ratio taken for HHG yield (RHS in Figure 31) is approximately 2.5.
At 4.5 x 10¹³
W/cm2, the ratio for photoionization is approximately 1.9 in comparison to the
HHG yield ratio given at approximately 1.
From the ratios obtained between Pyrrole/Thiophene as well as between Pyrrole/Furan and
Thiophene/Furan, it can be surmised that a correlation exits between the ionization yield ratios in
the photoionization step and the enhancement of HHG yield occurring upon recombination with
the parent ion. From this we can surmise from this that photoionization plays an important role
within the 3-step HHG model. Given the saturation intensity, ionization yield and polarization
studies discussed in earlier sections, we note consistent observations of Pyrrole being more stable
and likely to ionize than Thiophene and Furan. Greater stability in the molecule permits better
energy absorption through ionization in comparison to fragmentation where absorption is poor
and the molecule is broken up. The comparison to the HHG yield provides additional evidence
and consistency of the proposed quantitative aromatic molecule ordering.
Log Intensity (W/cm2)
Black: 2.5x10¹³
W/cm2
Blue: 4.5x10¹³
W/cm2
Photon Energy (eV)
Figure 30: Ratio of Pyrrole/Thiophene for Photoionization (left) and HHG (right)
Log Intensity (W/cm2)
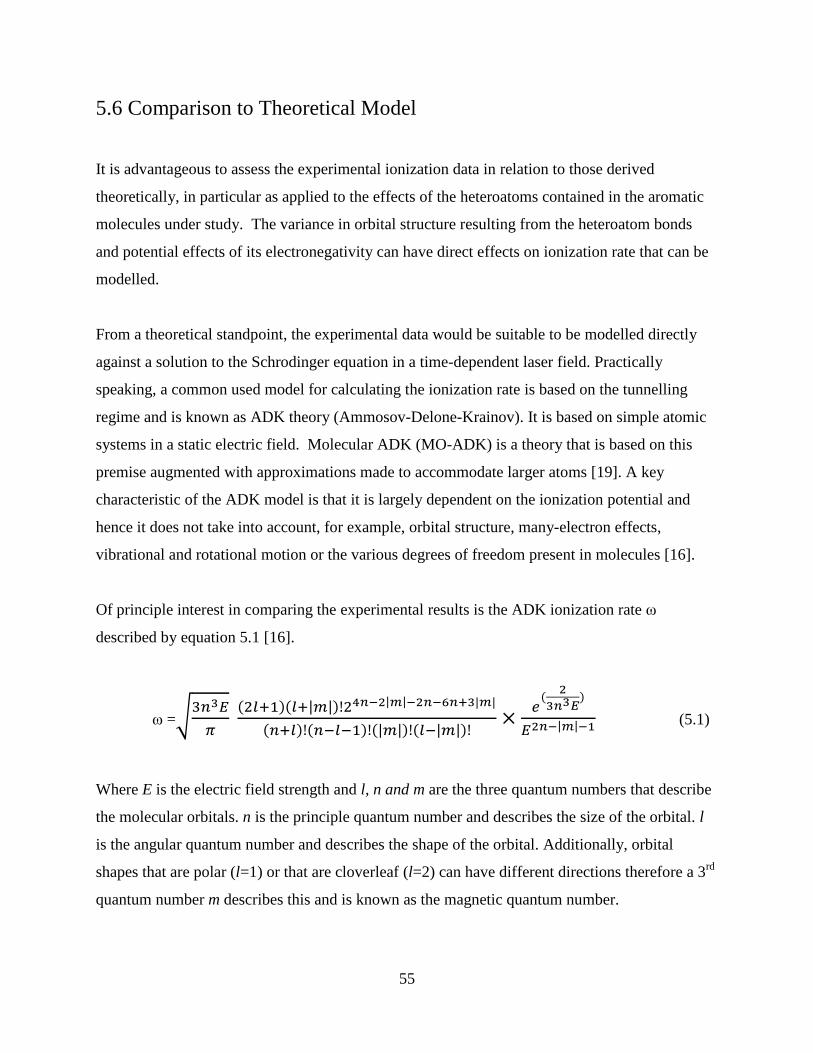
55
5.6 Comparison to Theoretical Model
It is advantageous to assess the experimental ionization data in relation to those derived
theoretically, in particular as applied to the effects of the heteroatoms contained in the aromatic
molecules under study. The variance in orbital structure resulting from the heteroatom bonds
and potential effects of its electronegativity can have direct effects on ionization rate that can be
modelled.
From a theoretical standpoint, the experimental data would be suitable to be modelled directly
against a solution to the Schrodinger equation in a time-dependent laser field. Practically
speaking, a common used model for calculating the ionization rate is based on the tunnelling
regime and is known as ADK theory (Ammosov-Delone-Krainov). It is based on simple atomic
systems in a static electric field. Molecular ADK (MO-ADK) is a theory that is based on this
premise augmented with approximations made to accommodate larger atoms [19]. A key
characteristic of the ADK model is that it is largely dependent on the ionization potential and
hence it does not take into account, for example, orbital structure, many-electron effects,
vibrational and rotational motion or the various degrees of freedom present in molecules [16].
Of principle interest in comparing the experimental results is the ADK ionization rate ω
described by equation 5.1 [16].
ω =√
( )( | |) | | | |
( ) ( ) (| |) ( | |)
(
)
| | (5.1)
Where E is the electric field strength and l, n and m are the three quantum numbers that describe
the molecular orbitals. n is the principle quantum number and describes the size of the orbital. l
is the angular quantum number and describes the shape of the orbital. Additionally, orbital
shapes that are polar (l=1) or that are cloverleaf (l=2) can have different directions therefore a 3rd
quantum number m describes this and is known as the magnetic quantum number.
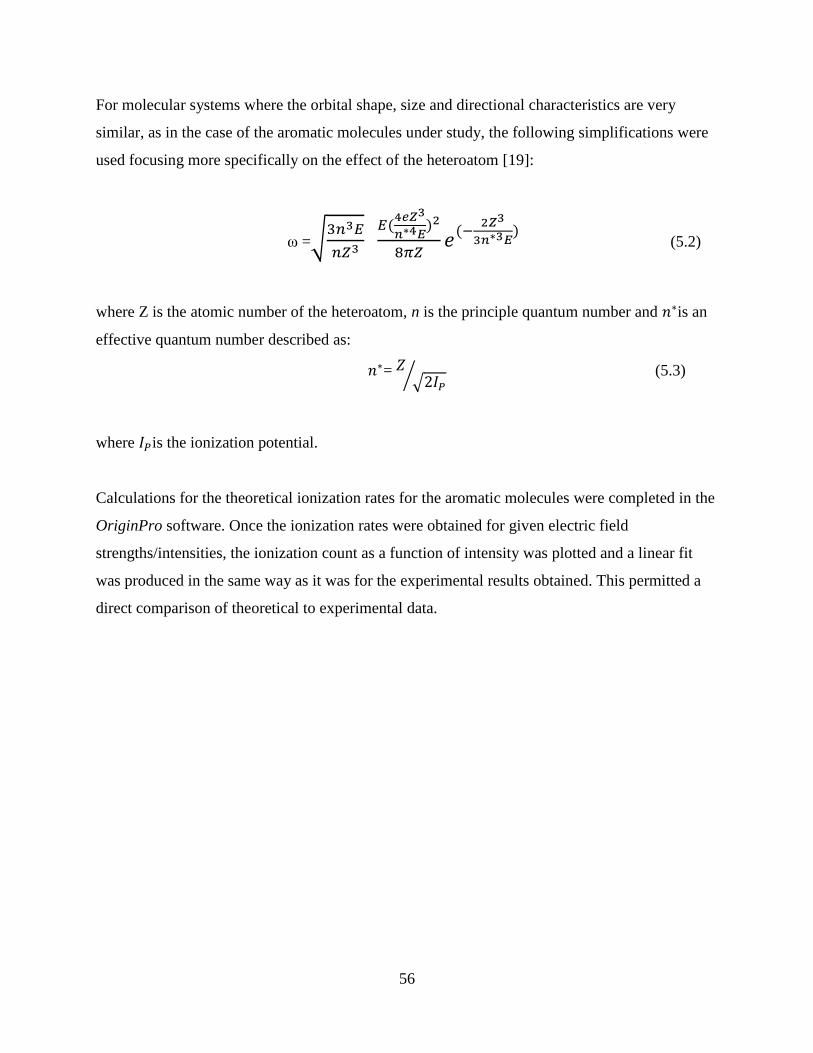
56
For molecular systems where the orbital shape, size and directional characteristics are very
similar, as in the case of the aromatic molecules under study, the following simplifications were
used focusing more specifically on the effect of the heteroatom [19]:
ω =√
(
)
(
) (5.2)
where Z is the atomic number of the heteroatom, n is the principle quantum number and is an
effective quantum number described as:
= √ ⁄ (5.3)
where is the ionization potential.
Calculations for the theoretical ionization rates for the aromatic molecules were completed in the
OriginPro software. Once the ionization rates were obtained for given electric field
strengths/intensities, the ionization count as a function of intensity was plotted and a linear fit
was produced in the same way as it was for the experimental results obtained. This permitted a
direct comparison of theoretical to experimental data.
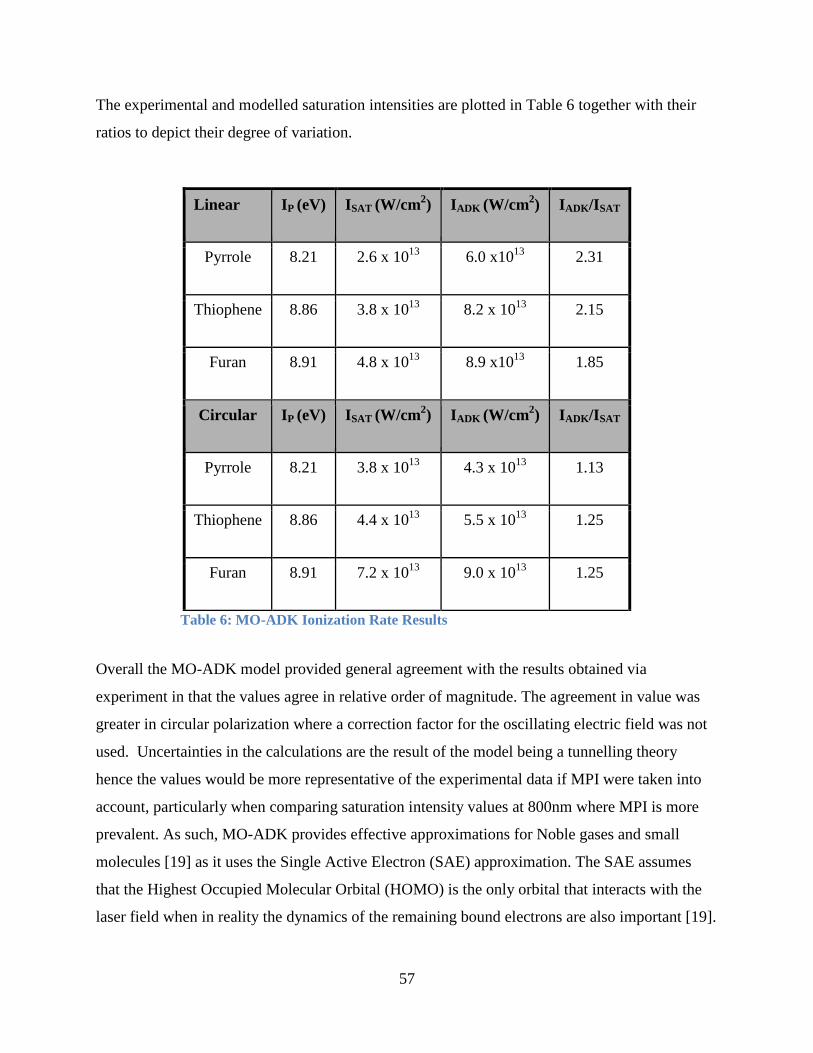
57
The experimental and modelled saturation intensities are plotted in Table 6 together with their
ratios to depict their degree of variation.
Linear IP (eV) ISAT (W/cm2) IADK (W/cm
2) IADK/ISAT
Pyrrole 8.21
2.6 x 10¹³
6.0 x10¹³
2.31
Thiophene 8.86
3.8 x 10¹³
8.2 x 10¹³
2.15
Furan 8.91 4.8 x 10¹³
8.9 x10¹³
1.85
Circular IP (eV) ISAT (W/cm2) IADK (W/cm
2) IADK/ISAT
Pyrrole 8.21 3.8 x 10¹³
4.3 x 10¹³
1.13
Thiophene 8.86 4.4 x 10¹³
5.5 x 10¹³
1.25
Furan 8.91
7.2 x 10¹³
9.0 x 10¹³
1.25
Table 6: MO-ADK Ionization Rate Results
Overall the MO-ADK model provided general agreement with the results obtained via
experiment in that the values agree in relative order of magnitude. The agreement in value was
greater in circular polarization where a correction factor for the oscillating electric field was not
used. Uncertainties in the calculations are the result of the model being a tunnelling theory
hence the values would be more representative of the experimental data if MPI were taken into
account, particularly when comparing saturation intensity values at 800nm where MPI is more
prevalent. As such, MO-ADK provides effective approximations for Noble gases and small
molecules [19] as it uses the Single Active Electron (SAE) approximation. The SAE assumes
that the Highest Occupied Molecular Orbital (HOMO) is the only orbital that interacts with the
laser field when in reality the dynamics of the remaining bound electrons are also important [19].
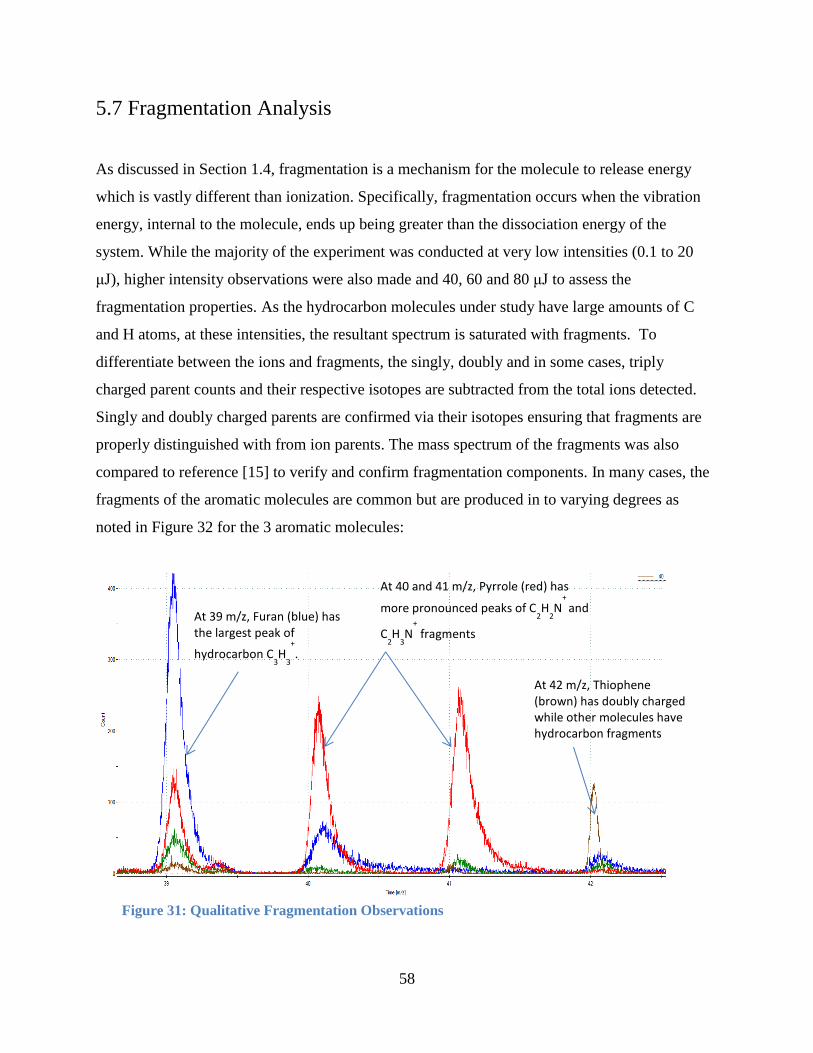
58
5.7 Fragmentation Analysis
As discussed in Section 1.4, fragmentation is a mechanism for the molecule to release energy
which is vastly different than ionization. Specifically, fragmentation occurs when the vibration
energy, internal to the molecule, ends up being greater than the dissociation energy of the
system. While the majority of the experiment was conducted at very low intensities (0.1 to 20
μJ), higher intensity observations were also made and 40, 60 and 80 μJ to assess the
fragmentation properties. As the hydrocarbon molecules under study have large amounts of C
and H atoms, at these intensities, the resultant spectrum is saturated with fragments. To
differentiate between the ions and fragments, the singly, doubly and in some cases, triply
charged parent counts and their respective isotopes are subtracted from the total ions detected.
Singly and doubly charged parents are confirmed via their isotopes ensuring that fragments are
properly distinguished with from ion parents. The mass spectrum of the fragments was also
compared to reference [15] to verify and confirm fragmentation components. In many cases, the
fragments of the aromatic molecules are common but are produced in to varying degrees as
noted in Figure 32 for the 3 aromatic molecules:
At 39 m/z, Furan (blue) has the largest peak of
hydrocarbon C3H
3
+
.
At 40 and 41 m/z, Pyrrole (red) has
more pronounced peaks of C2H
2N
+
and
C2H
3N
+
fragments
At 42 m/z, Thiophene (brown) has doubly charged while other molecules have hydrocarbon fragments
Figure 31: Qualitative Fragmentation Observations
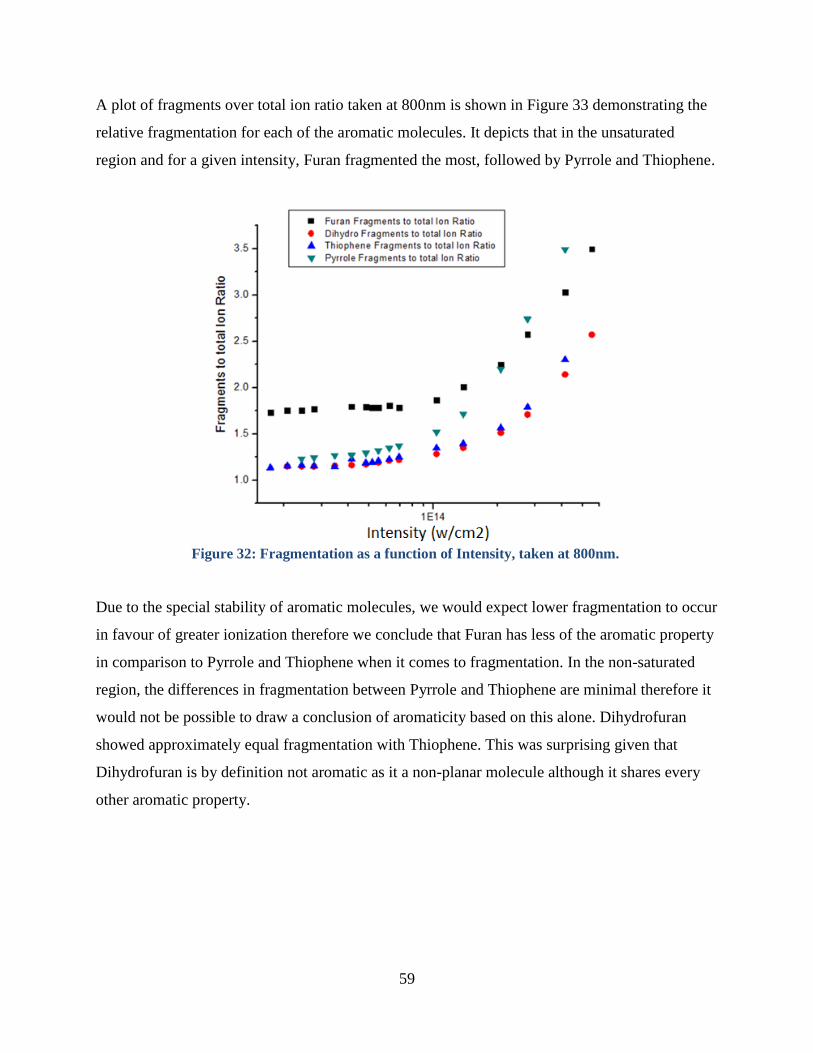
59
A plot of fragments over total ion ratio taken at 800nm is shown in Figure 33 demonstrating the
relative fragmentation for each of the aromatic molecules. It depicts that in the unsaturated
region and for a given intensity, Furan fragmented the most, followed by Pyrrole and Thiophene.
Figure 32: Fragmentation as a function of Intensity, taken at 800nm.
Due to the special stability of aromatic molecules, we would expect lower fragmentation to occur
in favour of greater ionization therefore we conclude that Furan has less of the aromatic property
in comparison to Pyrrole and Thiophene when it comes to fragmentation. In the non-saturated
region, the differences in fragmentation between Pyrrole and Thiophene are minimal therefore it
would not be possible to draw a conclusion of aromaticity based on this alone. Dihydrofuran
showed approximately equal fragmentation with Thiophene. This was surprising given that
Dihydrofuran is by definition not aromatic as it a non-planar molecule although it shares every
other aromatic property.
60
Chapter 6: Future Work
6.1 Two Colour Control
The goal of this future experimental work will be to achieve two beams, spread in wavelength,
such that increased photoionization control is possible via the individual properties of the two
beams that are orthogonal to each other. The addition of the orthogonal beam will permit
transverse control of the electron wavepacket thereby providing greater resolution for the motion
of the electron in the laser field. The additional control beam will enable greater insight into the
dynamics of the electron after photoionization and thus permit an improved understanding of
NSDI and recollision dynamics as it pertains to aromaticity. To that end, the concept of
understanding the contribution of the various steps involved in electron dynamics will be further
enhanced via this technique.
The principle of two-colour control is based on the generation of a second harmonic to the
800nm fundamental beam thereby producing an orthogonal 400nm beam. This is possible via the
non-linear properties of the BBO crystal used. For two colour control to work correctly, it is
critical to ensure that both beams arrive simultaneously at the point of ionization within the drift
chamber. There are several areas that this will become a key consideration factor. Firstly, as the
phase of the shorter wavelength propagates faster than the longer, proper compensation for this
must be achieved. Delay compensation is partially achieved by permitting the faster beam to
travel a longer distance. Since the beams are travelling collinearly, birefringent materials such as
a BBO crystal will be used to bring the phases of the two beams into close proximity. To permit
crystal selection and to verify sufficient compensation, the exact measurement of the distance
between the conversion point and ionization point will need to be measured. This precise
measurement will permit the amount of phase delay required to be calculated. Fine delay control
will be achieved by minutely varying the optical path and by the insertion of FS plates. Also, fine
adjustment for simultaneous phase of arrival will be obtained by varying the angle of a calcite
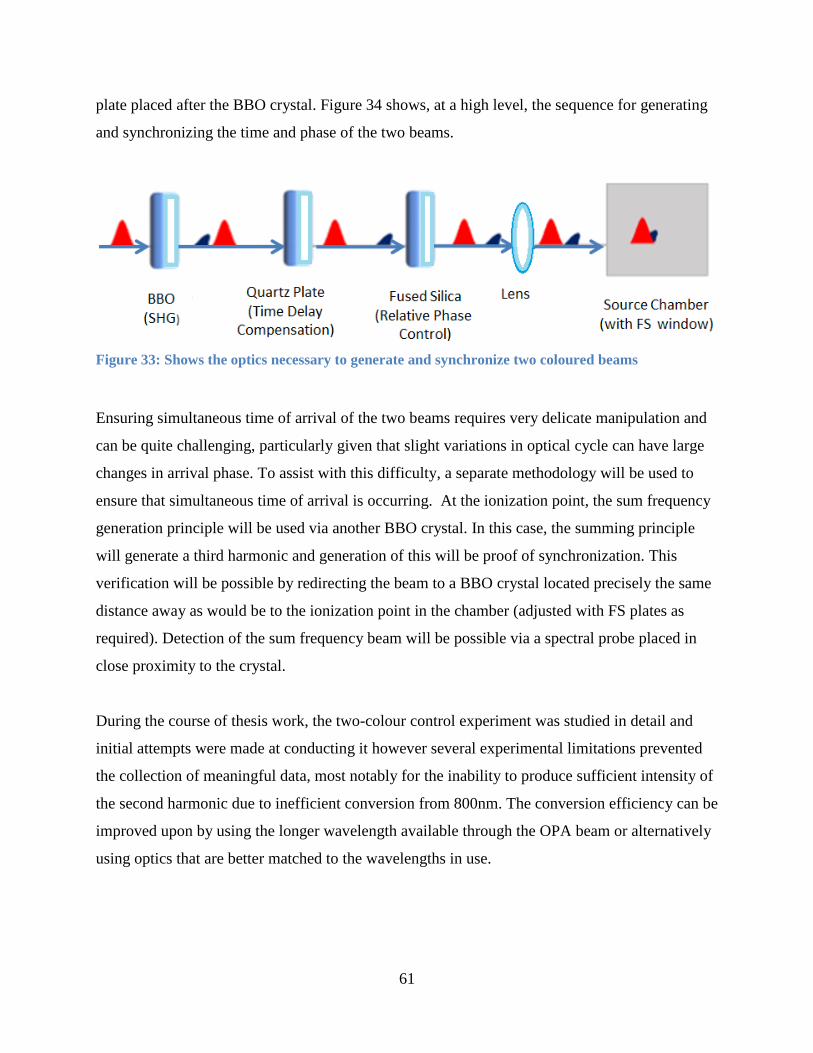
61
plate placed after the BBO crystal. Figure 34 shows, at a high level, the sequence for generating
and synchronizing the time and phase of the two beams.
Figure 33: Shows the optics necessary to generate and synchronize two coloured beams
Ensuring simultaneous time of arrival of the two beams requires very delicate manipulation and
can be quite challenging, particularly given that slight variations in optical cycle can have large
changes in arrival phase. To assist with this difficulty, a separate methodology will be used to
ensure that simultaneous time of arrival is occurring. At the ionization point, the sum frequency
generation principle will be used via another BBO crystal. In this case, the summing principle
will generate a third harmonic and generation of this will be proof of synchronization. This
verification will be possible by redirecting the beam to a BBO crystal located precisely the same
distance away as would be to the ionization point in the chamber (adjusted with FS plates as
required). Detection of the sum frequency beam will be possible via a spectral probe placed in
close proximity to the crystal.
During the course of thesis work, the two-colour control experiment was studied in detail and
initial attempts were made at conducting it however several experimental limitations prevented
the collection of meaningful data, most notably for the inability to produce sufficient intensity of
the second harmonic due to inefficient conversion from 800nm. The conversion efficiency can be
improved upon by using the longer wavelength available through the OPA beam or alternatively
using optics that are better matched to the wavelengths in use.
62
6.2 Broader Ionization Studies
Further studies in this area would also include experiments with other aromatic molecules via
photoionization and comparing these to HHG yield. Future molecules for study should be
selected for their variation in structural and electronic differences to ensure consistency across
cyclic and planar aromatic compounds. Bringing greater focus on the dynamics specific to the
propagation and recombination steps will further delineate the differences in the contribution of
these steps to the harmonic yield as it pertains to aromatic molecules. These studies would build
our understanding of the correlation between aromaticity and HHG.
63
Chapter 7: Conclusions
The aromatic molecules under study were five-membered cyclic compounds with distinct hetero-
atoms, namely Furan (C4H4O), Pyrrole (C4H4NH) and Thiophene (C4H4S). Aromatic molecules
continue to have important implications in material science research and industry applications in
nano-electronics and pharmaceuticals.
Delocalization of π-electrons, as an essential property of aromaticity, is an electronic structure
characteristic that can be probed via the strong field interaction and therefore it is possible for a
connection to be established between this interaction and aromaticity. The degree to which a
compound is aromatic and it’s ordering against other molecules is an important discrimination as
it directly translates to the special properties of high stability, high resonance energy, low
reactivity, immiscibility in water and non-polarity.
Despite numerous contemporary studies to categorize aromoaticity such as NICS, HOMA, ASE
and others, these have been inconclusive. The recent study by Alharbi et al demonstrated HHG
as a discriminant and quantitative mechanism for ordering aromaticity based on the relative yield
of plateau harmonics. This study, which focused specifically on the photoionzation phase
demonstrated a connection between the ionization response of the aromatic molecules and their
aromaticity thereby further supporting the work conducted by our group. The key conclusions
are summarized in four key areas:
i) Consistently increased quantitative yield of singly and doubly charged ions in the
following order: 1) Pyrrole, 2) Thiophene 3) Furan demonstrates a connection
between ionization yield and the electronic structure and electron dynamics of the
aromatic molecules.
ii) Saturation intensities from lowest to highest in the above stated order permits us to
conclude that the Pyrrole in relation to Thiophene and Furan requires less laser
intensity in the focal volume to ionize a given number of molecules. This speaks to
64
the relative ionization stability of Pyrrole in relation to the other aromatic molecules
and is resultant from the π orbital electron delocalization.
iii) Greater FWHM broadening as seen in polarization dependent curves relates to the
higher transverse electron momentum of the electron wavefunction. The order of
broadening correlates to the above stated order.
iv) Agreement of relative ionization yield ratios of Pyrrole/Thiophene, Pyrrole/Furan and
Furan/Thiophene to the results obtained from HHG studies. The consistency between
these results suggests that the photoionization phase plays a crucial role in the
contribution of harmonic yield as it pertains to aromaticity in relation to the
propagation and recombination steps.
In addition to direct ionization studies, future work will focus on the generation of a second
harmonic to support a two colour control experiment which will aim at increasing the spatial
control of ionization. By varying the polarization and strength of the second colour field new
insights will be possible into the connection of electron dynamics and aromaticity order. From a
HHG perspective, two colour control will also permit us to ascertain the contribution from the
propagation and recombination phases thereby further building enhancing our understanding of
these processes.
65
References
1) Brabec, T., Strong Laser Fields and Ultrashort Laser Pulses, Springer Optical Sciences,
Georgia USA, 2009.
2) L. V. Keldysh, “Ionization in the Feld of a Strong Electromagnetic Wave,” Soviet
Physics JETP, vol. 20, pp. 1307–1314, 1965.
3) A. F. Alharbi, A. E. Boguslavskiy, N. Thire, S. Patchkovskii, B. E. Schmidt, F. Legare,
T. Brabec, V. R. Bhardwaj and M. Spanner, “Sensitivity of High-Order Harmonic
Generation to Aromaticity”, Physical Review A, 92, 2015.
4) Soderberg, Tim, Molecular Orbital Theory, “Conjugation and Aromaticity”, Libretexts
(Chemistry), Mar 2017.
5) Najmidin K, J Mol Model. A Comparative Study of the Aromaticity of Pyrrole, Furan,
Thiophene, and their Aza-derivatives, 2013
6) Ragué Schleyer P.V, Nucleus-Independent Chemical Shifts: A Simple and Efficient
Aromaticity Probe, 118 (26), 1996.
7) Frizzo, C., “Aromaticity in Heterocycles: A New HOMA Index Parametrization”,
Structural Chemistry, Apr 2012, Volume 23, pp 375–380
8) Gomes, J., “Aromaticity and Ring Currents”, American Chemical Society, England, UK
2001
9) Thanh, T., “Aromatic Stabilization Energy”, https://voer.edu.vn/pdf/d01be50a, accessed
Jun 2015
66
10) Time-of-Flight Mass Spectrometry, Price, D. and Williams, J.E., Eds., Pergamon Press,
Oxford, England, 1969.
11) W. C. Wiley and I. H. McLaren, “Time-Of-Flight Mass Spectrometer with Improved
Resolution,” Rev. Sci. Instr., vol. 26, pp. 1150–1157, 1955.
12) Hakansson, Per, Time of Flight Technique, Angstrom Laboratory, Upsala Sweden, May
1999, http://www.scielo.br/scielo.php?script=sci_arttext&pid=S0103-97331999000300004,
accessed Oct 2016.
13) Model 9353 100-picosecond Time Digitizer Hardware and Software User’s Manual
Software Version 2 Revision E, ORTEC reference No. 791220 1004, Advanced
Measurement Technology, 2003.
14) D Charalambidis, D Xenakis, C J G J Uiterwaal, “Multiphoton Ionization Saturation
Intensities and Generalized Cross Sections”, Journal of Physics B: Atomic, Molecular and
Optical Physics, Vol 30, 2015.
15) P. Linstrom and W. Mallard, NIST Chemistry WebBook, NIST Standard Reference
Database Number 69. Gaithersburg MD, 20899: National Institute of Standards and
Technology, retrieved April 26, 2015. http://webbook.nist.gov.
16) X. M. Tong, Z. X. Zhao, and C. D. Lin, “Theory of Molecular Tunnelling Ionization,”
Phys. Rev. A, vol. 66, pp. 33402–33412, 2002.
17) V. Popov, “Tunnel and Multiphoton Ionization of Atoms and Ions in a Strong Laser
Fields (Keldysh theory),” Phy. Usp., vol. 47, pp. 855–885, 2004.
18) V. R. Bhardwaj, S. A. Aseyev, M. Mehendale, G. L. Yudin, D. M. Villeneuve, D. M.
Rayner, M. Y. Ivanov, and P. B. Corkum, “Few cycle dynamics of multiphoton double
ionization,” Phys. Rev. Lett., vol. 86, p. 3522, 2001.
67
19) A. M. Perelomov, V. S. Popov, and M. V. Terentev. Soviet Physics JETP, 23, 924, 1965.
20) T. Brabec, M. Cote, P. Boulanger, and L. Ramunno, “Theory of tunnel ionization
in complex systems,” Phys. Rev. Lett., vol. 95, pp. 073001–073004, 2005.
21) A. H. Zewail, “Femtochemistry. Past, Present, and Future,” Pure Appl. Chem., vol. 72, p.
2219, 2000.
22) J. W. Cooper, “Photoionization from outer atomic subshells, A Model Study,” Phys.
Rev., vol. 128, pp. 681–693, 1962.
23) S. Augst, D. Strickland, D. D. Meyerhofer, S. L. Chin, and J. H. Eberly, “Tunneling
ionization of noble gases in a high-intensity laser field,” Phys. Rev. Lett., vol. 63,
pp. 2212–2215, 1989.
24) D. Shafir, Y. Mairesse, D. M. Villeneuve, P. B. Corkum, and N. Dudovich, “Atomic
Wavefunctions Probed Through Strong-field Light-Matter Interaction”, Nat. Phys.,
vol. 5, pp. 412 – 416, 2009.
25) J. C. Kieffer, R. Dorner, D. M. Villeneuve, and P. B. Corkum, “Laser-induced Electron
Tunneling and Diffraction”, Science, vol. 320, pp. 1478–1482, 2008.
26) P. W. Atkins and S. F. Ronald, Molecular Quantum Mechanics. New York: Oxford
University Press, 2011.
27) Z. Chen, C. S. Wannere, C. Corminboeuf, R. Puchta, and P. Schleyer, “Nucleus
Independent Chemical Shifts (NICS) as an Aromaticity Criterion.,” Chem. Rev.,
vol. 105, pp. 3842–3888, 2005.
28) J. Kruszewski and T. Krygowski, “Definition of Aromaticity basing on the Harmonic
68
Oscillator model,” Tetrahedron Lett., vol. 13, pp. 3839–3842, 1972.
29) K. Horner and P. Karadakov, “Chemical Bonding and Aromaticity in Furan, Pyrrole,
and Thiophene: a Magnetic Shielding Study.,” J. Org. Chem., vol. 78, pp. 8037–43,
2013.
30) S. Hankin, D. Villeneuve, P. Corkum, and D. Rayner, “Intense-field Laser Ionization
rates in Atoms and Molecules,” Phys. Rev. A, vol. 64, pp. 13405–13416, 2001.
31) S. Pierrefixe and F. Bickelhaupt, “Aromaticity: Molecular-Orbital Picture of an Intuitive
Concept,” Chem. Eur. J., vol. 13, pp. 6321–6328, 2007.
32) V. R. Bhardwaj, D. M. Rayner, D. M. Villeneuve, and P. B. Corkum, “Quantum
Interference in Double Ionization and Fragmentation of C6H6 in Intense Laser Fields,”
Phys. Rev. Lett., vol. 87, p. 253003, 2001.
33) Boyd, R., Nonlinear Optics, 3rd
Edition, Rochester New York, 2008