Embed Size (px)
DESCRIPTION
respirologi journal
Citation preview
European Journal of Cancer (2013) 49, 1374– 1403
A v a i l a b l e a t w w w . s c i e nc e d i r e c t . c o m
journa l homepage : www.e j cancer . in fo
Cancer incidence and mortality patterns in Europe: Estimatesfor 40 countries in 2012
J. Ferlay a,⇑, E. Steliarova-Foucher a, J. Lortet-Tieulent a, S. Rosso b,J.W.W. Coebergh c,d, H. Comber e, D. Forman a, F. Bray a
a Section of Cancer Information, International Agency for Research on Cancer (IARC), Franceb Piedmont Cancer Registry, CPO – Centre for Epidemiology and Prevention in Oncology in Piedmont, Turin, Italyc Department of Public Health, Erasmus MC, Rotterdam, The Netherlandsd Comprehensive Cancer Centre South (IKZ), Eindhoven, The Netherlandse National Cancer Registry, Cork, Ireland
Available online 26 February 2013
09
ht
⇑L
KEYWORDS
CancerEuropeIncidenceMortalityPredictions
59-8049/$ - see front matter
tp://dx.doi.org/10.1016/j.ejca.
Corresponding author: Addryon Cedex 08, France.
E-mail address: ferlayj@iarc
� 2013 E
2012.12.0
ess: Secti
.fr (J. Fe
Abstract Introduction: Cancer incidence and mortality estimates for 25 cancers are presentedfor the 40 countries in the four United Nations-defined areas of Europe and for the EuropeanUnion (EU-27) for 2012.Methods: We used statistical models to estimate national incidence and mortality rates in 2012from recently-published data, predicting incidence and mortality rates for the year 2012 fromrecent trends, wherever possible. The estimated rates in 2012 were applied to the correspond-ing population estimates to obtain the estimated numbers of new cancer cases and deaths inEurope in 2012.Results: There were an estimated 3.45 million new cases of cancer (excluding non-melanomaskin cancer) and 1.75 million deaths from cancer in Europe in 2012. The most common cancersites were cancers of the female breast (464,000 cases), followed by colorectal (447,000), pros-tate (417,000) and lung (410,000). These four cancers represent half of the overall burden ofcancer in Europe. The most common causes of death from cancer were cancers of the lung(353,000 deaths), colorectal (215,000), breast (131,000) and stomach (107,000). In the Euro-pean Union, the estimated numbers of new cases of cancer were approximately 1.4 million
lsevier Ltd. All rights reserved.
27
on of Cancer Information, International Agency for Research on Cancer, 150 cours Albert Thomas, 69372
rlay).
J. Ferlay et al. / European Journal of Cancer 49 (2013) 1374–1403 1375
in males and 1.2 million in females, and around 707,000 men and 555,000 women died fromcancer in the same year.Conclusion: These up-to-date estimates of the cancer burden in Europe alongside the descrip-tion of the varying distribution of common cancers at both the regional and country level pro-vide a basis for establishing priorities to cancer control actions in Europe. The important roleof cancer registries in disease surveillance and in planning and evaluating national cancerplans is becoming increasingly recognised, but needs to be further advocated. The estimatesand software tools for further analysis (EUCAN 2012) are available online as part of theEuropean Cancer Observatory (ECO) (http://eco.iarc.fr).
� 2013 Elsevier Ltd. All rights reserved.
1. Introduction
Up-to-date cancer incidence and mortality data inEurope are a key resource in both planning and assessingthe impact of cancer control programmes at the countryand regional level. Europe carries a significant load of theglobal burden, with one quarter of the global burden ofcancer observed in Europe in 2008 despite a total popu-lation that comprises one-ninth of the world’s popula-tion.1,2 The International Agency for Research onCancer (IARC), through its programmes of collabora-tion with population-based cancer registries in Europe,members of the European Network of Cancer Registries(ENCR, http://www.encr.com.fr/) has provided esti-mates of cancer burden at the European and EuropeanUnion (EU) member state level over the last 25 years.3–8
In this paper, we provide estimates of the incidence of,and the mortality from cancer for 25 sites in 40 Europeancountries in 2012, using the most recently available data.The reported estimates are based on the latest incidencedata provided by the ENCR member registries, the WorldHealth Organisation (WHO) mortality database9 andUN population estimates.2 The results are also presentedfor four areas as defined by the UN (Eastern, Northern,Southern and Western Europe),2 and the EuropeanUnion 27 Member States (EU-27). The complete set ofestimates is available through the European CancerObservatory (ECO) website (http://eco.iarc.fr).10.
2. Data sources and methods
Cancer incidence and mortality for 2012 by sex and16 age groups (0–4, 5–9,. . ., 70–74, 75 and over) are esti-mated for each of the 39 European countries defined bythe United Nations2 and Cyprus. Results are presentedfor the following cancer sites as defined by the 10th edi-tion of the International Classification of Diseases(ICD-10)11: lip, oral cavity and pharynx (ICD-10 C00–14), oesophagus (C15), stomach (C16), colorectal(including anus C18–21), liver (C22), gallbladder(C23–24), pancreas (C25), larynx (C32), lung (includingtrachea, C33–34), melanoma of skin (C43), femalebreast (C50), cervix uteri (C53), corpus uteri (C54),ovary (C56), prostate (C61), kidney (including renal pel-vis and ureter, C64–66), bladder (C67), brain and central
nervous system (C70–72), thyroid (C73), Hodgkin lym-phoma (C81), non-Hodgkin lymphoma (C82–85, C96),multiple myeloma (C88 + C90), leukaemia (C91–95)and all cancers combined, excluding non-melanoma skincancer (C00–96, except C44). This last category was cal-culated by summing the estimated counts for each indi-vidual cancer site, and the corresponding estimate of theresidual category “other and unspecified cancers”. Noattempt was made to estimate incidence and mortalityfrom non-melanoma skin cancer given the non-system-atic registration of these cases in most cancer registries.
2.1. Development of the estimates
The methods used to estimate country-specific inci-dence and mortality rates for 2012 are based on previouswork,8 and involve projections of the most recent nationalrates available prior to 2012. For countries with fifteen ormore years of recent incidence or mortality data available,corresponding rates for 2012 were predicted using theNORDPRED program based on age-period-cohortmodelling12 separately for each cancer site and sex. Whenthe available information was for less than 15 years, orwhen data up to 2010 were available, a programme devel-oped at IARC (DEPPRED) based on the simple time-lin-ear prediction models of Dyba and Hakulinen13 was usedto make the short-term predictions. To reduce the pros-pect of erroneous predictions as a result of inherently largerandom variation due to small numbers (rare cancers,small populations), cancer-, sex-specific prediction modelswere fitted only when at least 50 cancer cases or cancerdeaths (all ages) were recorded per year for DEPPRED,and when at least 100 cancer cases or deaths (all ages) wererecorded per 5-year period for NORDPRED. For the sexand cancer combinations where these criteria were notsatisfied, the rates for 2012 were derived from the annualaverage rates recorded in the most recent 5-year periodavailable. For countries where no historical nationalincidence or mortality data existed, the most recent dis-ease rates available were used as proxy for 2012. ForFrance, we used the published estimates of national inci-dence rates for 2011.14 Since no data were available forMontenegro, incidence and mortality rates were estimatedas the simple average of the rates (age-, sex- and site-specific) of those of Bosnia Herzegovina and Serbia.
Table 1Data availability and method of estimation.
Country Mortality Incidence
Albania 1995–2004a > 2012(DEPPRED)
Estimated mortality! incidence (I:M ratio from cancer registries of Bulgaria and centralSerbia)
Austria 1990–2009 > 2012(NORDPRED)
National incidence 1990–2009 > 2012 (NORDPRED)
Belarus 2008–2009 = 2012b National incidence 1978–2007 > 2012 (NORDPRED)Belgium 2005–2006 = 2012 National incidence 2008–2009 = 2012Bosnia
HerzegovinaBosnia Herzegovina 2009 and Republika Srpska 2004–2005 = 2012
Bulgaria 1990–2009 > 2012(NORDPRED)
National incidence 1994–2008 > 2012 (NORDPRED)
Croatia 1990–2009 > 2012(NORDPRED)
National incidence 1988–2007 > 2012 (NORDPRED)
Cyprus 2008–2009 = 2012 National incidence 2006–2007 = 2012Czech Republic 1990–2009 > 2012
(NORDPRED)National incidence 1989–2008 > 2012 (NORDPRED)
Denmark 1987–2006 > 2012(NORDPRED)
National incidence 1990–2009 > 2012 (NORDPRED)
Estonia 1990–2009 > 2012(NORDPRED)
National incidence 1988–2007 > 2012 (NORDPRED)
Finland 1990–2009 > 2012(NORDPRED)
National incidence 1990–2009 > 2012 (NORDPRED)
France 2001–2009 > 2012(DEPPRED)
National incidence 2011 (estimated) = 2012
Germany 1990–2009 > 2012(NORDPRED)
Local incidence from 9 pooled German cancer registries 2000–2008 > 2012 (DEPPRED) andapplied to 2012 population
Greece 1990–2009 > 2012(NORDPRED)
Estimated mortality! incidence (I:M ratio from cancer registries of Bulgaria, Cyprus andcentral Serbia)
Hungary 1990–2009 > 2012(NORDPRED)
Estimated mortality! incidence (I:M ratio from cancer registries of Austria, Croatia,Slovakia, Slovenia and central Serbia)
Iceland 1990–2009 > 2012(NORDPRED)
National incidence 1990–2009 > 2012 (NORDPRED)
Ireland 1990–2009 > 2012(NORDPRED)
National incidence 1994–2007 > 2012 (NORDPRED)
Italy 2000–2009 > 2012(DEPPRED)
Estimated mortality! incidence (I:M ratio from 17 Italian cancer registries).
Latvia 2001–2010 > 2012(DEPPRED)
National incidence 1988–2007 > 2012 (NORDPRED)
Lithuania 2001–2010 > 2012(DEPPRED)
National incidence 1988–2007 > 2012 (NORDPRED)
Luxembourg 1990–2009 > 2012(NORDPRED)
Estimated mortality! incidence (I:M ratio from 11 French and 9 German cancer registries)
FYR Macedonia 2004–2010a>2012(DEPPRED)
Estimated mortality! incidence (I:M ratio from cancer registries of Bulgaria and centralSerbia)
Malta 1990–2009 > 2012(NORDPRED)
National incidence 2000–2009 > 2012 (DEPPRED)
Moldova 2001–2010 > 2012(DEPPRED)
Estimated mortality! incidence (I:M ratio from Ukrainian cancer registry)
Montenegro Simple mean of Bosnia and Serbia ratesNorway 1990–2009 > 2012
(NORDPRED)National incidence 1990–2009 > 2012 (NORDPRED)
Poland 2001–2010 > 2012(DEPPRED)
Estimated mortality! incidence (I:M ratio from 3 Polish cancer registries).
Portugal 2000–2009 > 2012(DEPPRED)
Estimated mortality! incidence (I:M ratio from 2 Portuguese and 12 Spanish cancerregistries)
Romania 2001–2010 > 2012(DEPPRED)
Estimated mortality! incidence (I:M ratio from cancer registries of Bulgaria, Slovakia andRomania, Cluj county)
RussianFederation
2000–2009 > 2012(DEPPRED)
National incidence 1994–2008 > 2012 (NORDPRED)
Serbia 2001–2010 > 2012(DEPPRED)
Estimated mortality! incidence (I:M ratio from cancer registries of Croatia, Slovenia andcentral Serbia)
Slovakia 1990–2009 > 2012(NORDPRED)
National incidence 1988–2007 > 2012 (NORDPRED)
1376 J. Ferlay et al. / European Journal of Cancer 49 (2013) 1374–1403
Table 1 (continued)
Country Mortality Incidence
Slovenia 1990–2009 > 2012(NORDPRED)
National incidence 1989–2008 > 2012 (NORDPRED)
Spain 1990–2009 > 2012(NORDPRED)
Estimated mortality! incidence (I:M ratio from 12 Spanish cancer registries)
Sweden 1990–2009 > 2012(NORDPRED)
National incidence 1990–2009 > 2012 (NORDPRED)
Switzerland 2000–2007c>2012(DEPPRED)
Local incidence from 7 pooled Swiss cancer registries 1988–2007 > 2012 (NORDPRED) andapplied to 2012 population
The Netherlands 1990–2009 > 2012(NORDPRED)
National incidence 1989–2008 > 2012 (NORDPRED)
Ukraine 2009 = 2012c National incidence 2009 = 2012United Kingdom 1990–2009 > 2012
(NORDPRED)National incidence 1993–2007 > 2012 (NORDPRED)
“>” projected to.“!” converted to incidence.“=” applied to.
a Corrected for under-reporting. Missing sites: mean average of the estimated mortality rates for Bulgaria and Serbia.b Main category (ICD special list) only. Other category partitioned using mortality data from Ukrainian cancer registry.c Main category (ICD-10 special list) only. Other category partitioned using mortality data from local (Switzerland) or national (Ukraine) cancer
registries.
J. Ferlay et al. / European Journal of Cancer 49 (2013) 1374–1403 1377
Random fluctuations in the predicted age-specificincidence and mortality rates were smoothed using aloess function by country, sex and cancer site. Thederived age-, sex- and site-specific rates were age-stand-ardised (ASRs per 100,000 person-years) using theEuropean standard population.15 The number of cancercases and deaths in 2012 was computed for each countryand cancer site by multiplying the predicted 2012 age-and sex-specific incidence and mortality rates by the cor-responding 2012 population estimates from the UNPopulation Division (the 2010 revision).2 The datasources available for the estimation of the 2012 rates,and the methods applied in the incidence and mortalityestimations are summarised in Table 1.
2.2. Mortality
For 38 European countries, cancer mortality datafrom 1990 to 2010 and corresponding population figureswere available through the WHO mortality database.9
For Bosnia Herzegovina, the data were extracted fromthe federal cancer registry.16 For Albania and Macedo-nia, vital registration is known to be incomplete duringthe period under study9; the source data were thereforecorrected using the estimated percentage of under-reporting estimated by the WHO. The changes in theuse of ICD in 2000 in France and in 1995 in Switzerlandresulted in discontinuity in trends17,18 and thus theFrench and Swiss mortality estimates are derived usingshort-term predictions based on the period from 2000using DEPPRED (Table 1). For Italy and Portugal,mortality data were missing for one or more calendaryears in the period 2004–2006, and the nearest availabledata (generally that of the previous or subsequent year)were replicated to replace the missing values.
There are large variations in the accuracy of deathcertificates related to cancer of the uterus, with manydeaths recorded as “uterus cancer, not otherwise speci-fied” (ICD-10 C55). By default, the cancer deaths codedas “uterus unspecified category” were reallocated toeither cervix uteri or corpus uteri cancer according tothe observed age-specific proportions of each when theall age proportion of uterine cancer deaths coded tothe unspecified category was considered to be low(<25% of the total).19 For the other countries (Austria,Belgium, France, Germany, Ireland, Italy, Portugal,Slovenia, Sweden and Switzerland) we estimated theall-age proportions of deaths from cervix and corpusuteri cancers using the recorded incidence in local ornational cancer registries around 2000 and the corre-sponding 5-year relative survival probabilities extractedfrom the EUROCARE 4 study.20 The total number ofcancer deaths from uterine cancers (ICD-10 C53–55)estimated in 2012 were then partitioned into cervixand corpus uteri cancers using the proportions obtainedfrom the survival analysis, and then further stratified byage using age-specific death counts of the two sitesextracted from the WHO mortality database. Finally,for the countries with large proportion (more than25%) of unspecified uterine cancers and no incidenceand survival data (Albania, FYR Macedonia, Greeceand Luxembourg) we used pooled incidence and sur-vival data from Belgium and France to reallocate theuterine cancer deaths in Luxembourg and a pool fromMalta, Slovenia and Portugal was used for the otherlisted countries. In addition, for Belarus and theUkraine, the deaths from “corpus uteri and uterus, nototherwise specified” (ICD-10 C54–55) were first parti-tioned into two components using proportions fromthe Ukrainian National Cancer Registry mortality data
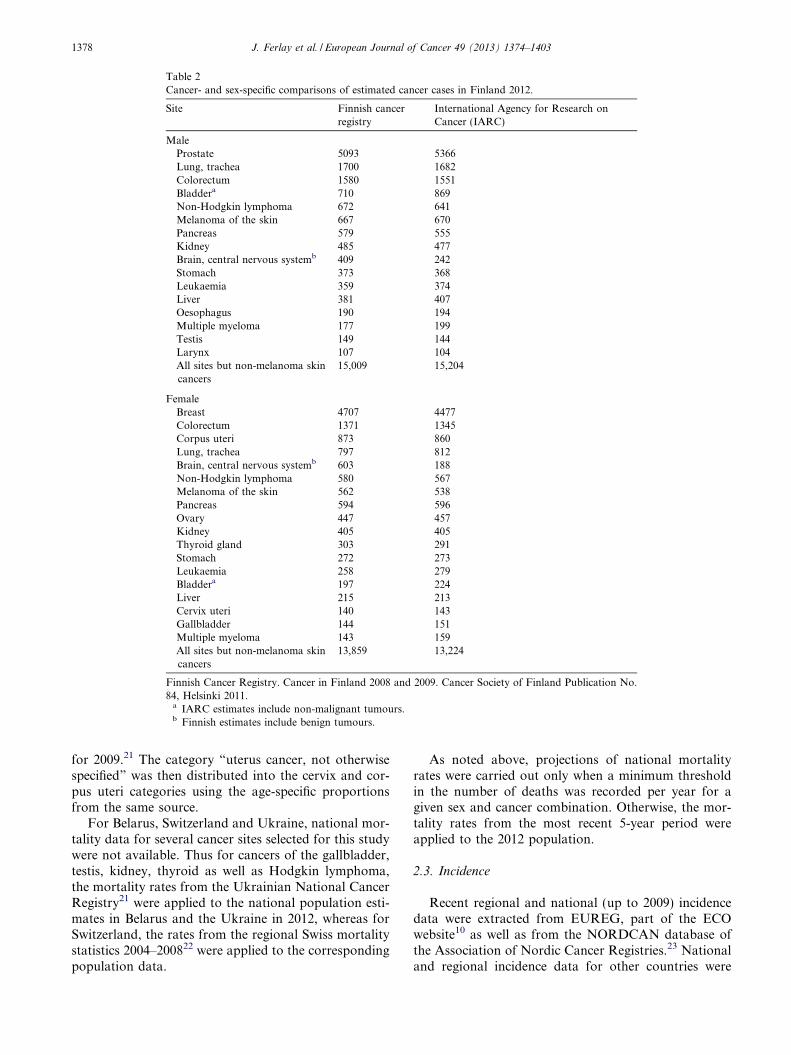
Table 2Cancer- and sex-specific comparisons of estimated cancer cases in Finland 2012.
Site Finnish cancerregistry
International Agency for Research onCancer (IARC)
MaleProstate 5093 5366Lung, trachea 1700 1682Colorectum 1580 1551Bladdera 710 869Non-Hodgkin lymphoma 672 641Melanoma of the skin 667 670Pancreas 579 555Kidney 485 477Brain, central nervous systemb 409 242Stomach 373 368Leukaemia 359 374Liver 381 407Oesophagus 190 194Multiple myeloma 177 199Testis 149 144Larynx 107 104All sites but non-melanoma skincancers
15,009 15,204
FemaleBreast 4707 4477Colorectum 1371 1345Corpus uteri 873 860Lung, trachea 797 812Brain, central nervous systemb 603 188Non-Hodgkin lymphoma 580 567Melanoma of the skin 562 538Pancreas 594 596Ovary 447 457Kidney 405 405Thyroid gland 303 291Stomach 272 273Leukaemia 258 279Bladdera 197 224Liver 215 213Cervix uteri 140 143Gallbladder 144 151Multiple myeloma 143 159All sites but non-melanoma skincancers
13,859 13,224
Finnish Cancer Registry. Cancer in Finland 2008 and 2009. Cancer Society of Finland Publication No.84, Helsinki 2011.
a IARC estimates include non-malignant tumours.b Finnish estimates include benign tumours.
1378 J. Ferlay et al. / European Journal of Cancer 49 (2013) 1374–1403
for 2009.21 The category “uterus cancer, not otherwisespecified” was then distributed into the cervix and cor-pus uteri categories using the age-specific proportionsfrom the same source.
For Belarus, Switzerland and Ukraine, national mor-tality data for several cancer sites selected for this studywere not available. Thus for cancers of the gallbladder,testis, kidney, thyroid as well as Hodgkin lymphoma,the mortality rates from the Ukrainian National CancerRegistry21 were applied to the national population esti-mates in Belarus and the Ukraine in 2012, whereas forSwitzerland, the rates from the regional Swiss mortalitystatistics 2004–200822 were applied to the correspondingpopulation data.
As noted above, projections of national mortalityrates were carried out only when a minimum thresholdin the number of deaths was recorded per year for agiven sex and cancer combination. Otherwise, the mor-tality rates from the most recent 5-year period wereapplied to the 2012 population.
2.3. Incidence
Recent regional and national (up to 2009) incidencedata were extracted from EUREG, part of the ECOwebsite10 as well as from the NORDCAN database ofthe Association of Nordic Cancer Registries.23 Nationaland regional incidence data for other countries were
0
30
60
90
120
150
1990 1995 2000 2005 2010 2015 2020
ASR
(E) p
er 1
00,0
0
(b) Prostate cancer
0
20
40
60
80
100
1990 1995 2000 2005 2010 2015 2020
ASR
(E) p
er 1
00,0
0
(a) Breast cancer
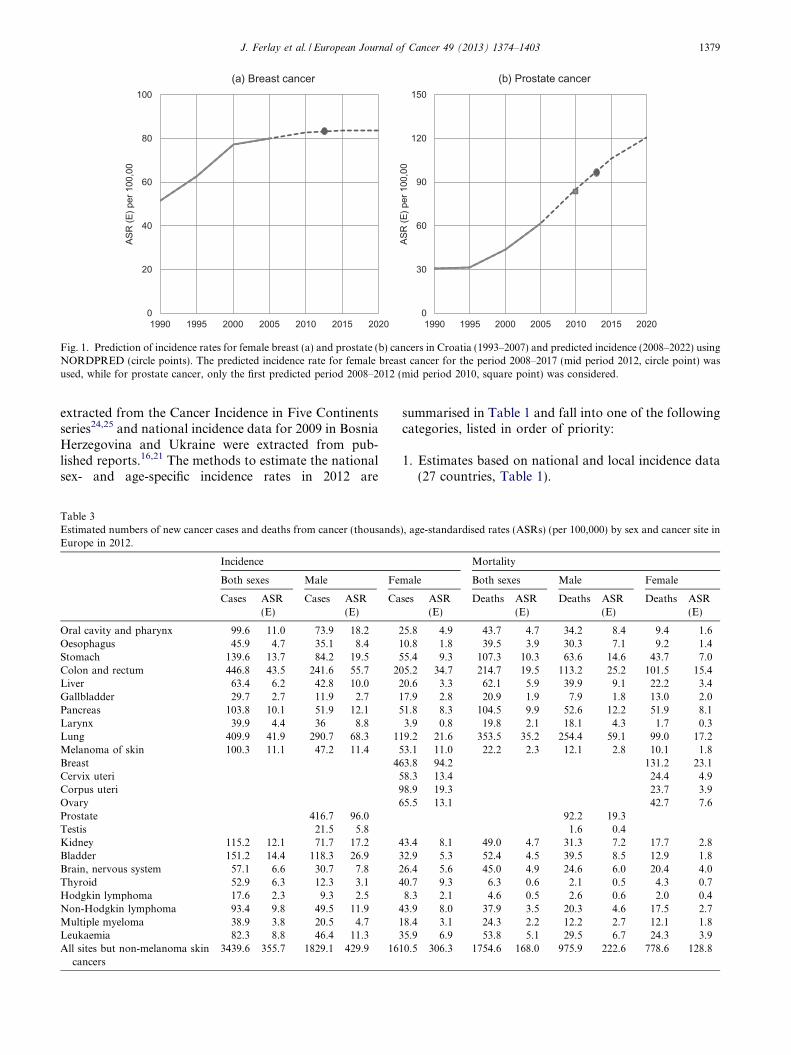
Fig. 1. Prediction of incidence rates for female breast (a) and prostate (b) cancers in Croatia (1993–2007) and predicted incidence (2008–2022) usingNORDPRED (circle points). The predicted incidence rate for female breast cancer for the period 2008–2017 (mid period 2012, circle point) wasused, while for prostate cancer, only the first predicted period 2008–2012 (mid period 2010, square point) was considered.
J. Ferlay et al. / European Journal of Cancer 49 (2013) 1374–1403 1379
extracted from the Cancer Incidence in Five Continentsseries24,25 and national incidence data for 2009 in BosniaHerzegovina and Ukraine were extracted from pub-lished reports.16,21 The methods to estimate the nationalsex- and age-specific incidence rates in 2012 are
Table 3Estimated numbers of new cancer cases and deaths from cancer (thousandsEurope in 2012.
Incidence
Both sexes Male Fe
Cases ASR(E)
Cases ASR(E)
Ca
Oral cavity and pharynx 99.6 11.0 73.9 18.2 2Oesophagus 45.9 4.7 35.1 8.4 1Stomach 139.6 13.7 84.2 19.5 5Colon and rectum 446.8 43.5 241.6 55.7 20Liver 63.4 6.2 42.8 10.0 2Gallbladder 29.7 2.7 11.9 2.7 1Pancreas 103.8 10.1 51.9 12.1 5Larynx 39.9 4.4 36 8.8Lung 409.9 41.9 290.7 68.3 11Melanoma of skin 100.3 11.1 47.2 11.4 5Breast 46Cervix uteri 5Corpus uteri 9Ovary 6Prostate 416.7 96.0Testis 21.5 5.8Kidney 115.2 12.1 71.7 17.2 4Bladder 151.2 14.4 118.3 26.9 3Brain, nervous system 57.1 6.6 30.7 7.8 2Thyroid 52.9 6.3 12.3 3.1 4Hodgkin lymphoma 17.6 2.3 9.3 2.5Non-Hodgkin lymphoma 93.4 9.8 49.5 11.9 4Multiple myeloma 38.9 3.8 20.5 4.7 1Leukaemia 82.3 8.8 46.4 11.3 3All sites but non-melanoma skin
cancers3439.6 355.7 1829.1 429.9 161
summarised in Table 1 and fall into one of the followingcategories, listed in order of priority:
1. Estimates based on national and local incidence data(27 countries, Table 1).
), age-standardised rates (ASRs) (per 100,000) by sex and cancer site in
Mortality
male Both sexes Male Female
ses ASR(E)
Deaths ASR(E)
Deaths ASR(E)
Deaths ASR(E)
5.8 4.9 43.7 4.7 34.2 8.4 9.4 1.60.8 1.8 39.5 3.9 30.3 7.1 9.2 1.45.4 9.3 107.3 10.3 63.6 14.6 43.7 7.05.2 34.7 214.7 19.5 113.2 25.2 101.5 15.40.6 3.3 62.1 5.9 39.9 9.1 22.2 3.47.9 2.8 20.9 1.9 7.9 1.8 13.0 2.01.8 8.3 104.5 9.9 52.6 12.2 51.9 8.13.9 0.8 19.8 2.1 18.1 4.3 1.7 0.39.2 21.6 353.5 35.2 254.4 59.1 99.0 17.23.1 11.0 22.2 2.3 12.1 2.8 10.1 1.83.8 94.2 131.2 23.18.3 13.4 24.4 4.98.9 19.3 23.7 3.95.5 13.1 42.7 7.6
92.2 19.31.6 0.4
3.4 8.1 49.0 4.7 31.3 7.2 17.7 2.82.9 5.3 52.4 4.5 39.5 8.5 12.9 1.86.4 5.6 45.0 4.9 24.6 6.0 20.4 4.00.7 9.3 6.3 0.6 2.1 0.5 4.3 0.78.3 2.1 4.6 0.5 2.6 0.6 2.0 0.43.9 8.0 37.9 3.5 20.3 4.6 17.5 2.78.4 3.1 24.3 2.2 12.2 2.7 12.1 1.85.9 6.9 53.8 5.1 29.5 6.7 24.3 3.90.5 306.3 1754.6 168.0 975.9 222.6 778.6 128.8
Other and unspecified Prostate
Lung
ColorectumBladder
Stomach
678
417
291
24211884
37.0%
22.8%
15.9%
13.2%6.5%
4.6%
Incidencea
b
Other and unspecified Lung
Colorectum
Prostate
StomachPancreas
400
254
113
926453
41.0%
26.1%
11.6%
9.5%
6.5%5.4%
Mortality
Other and unspecifiedBreast
Colorectum
Lung
Corpus uteri
Ovary
658
464
205
1199966
40.8%
28.8%
12.7%
7.4%
6.1%
4.1%
Incidence
Other and unspecified
Breast
Colorectum
Lung
PancreasStomach
351
131
102
995244
45.1%
16.8%
13.0%
12.7%
6.7%5.6%
Mortality
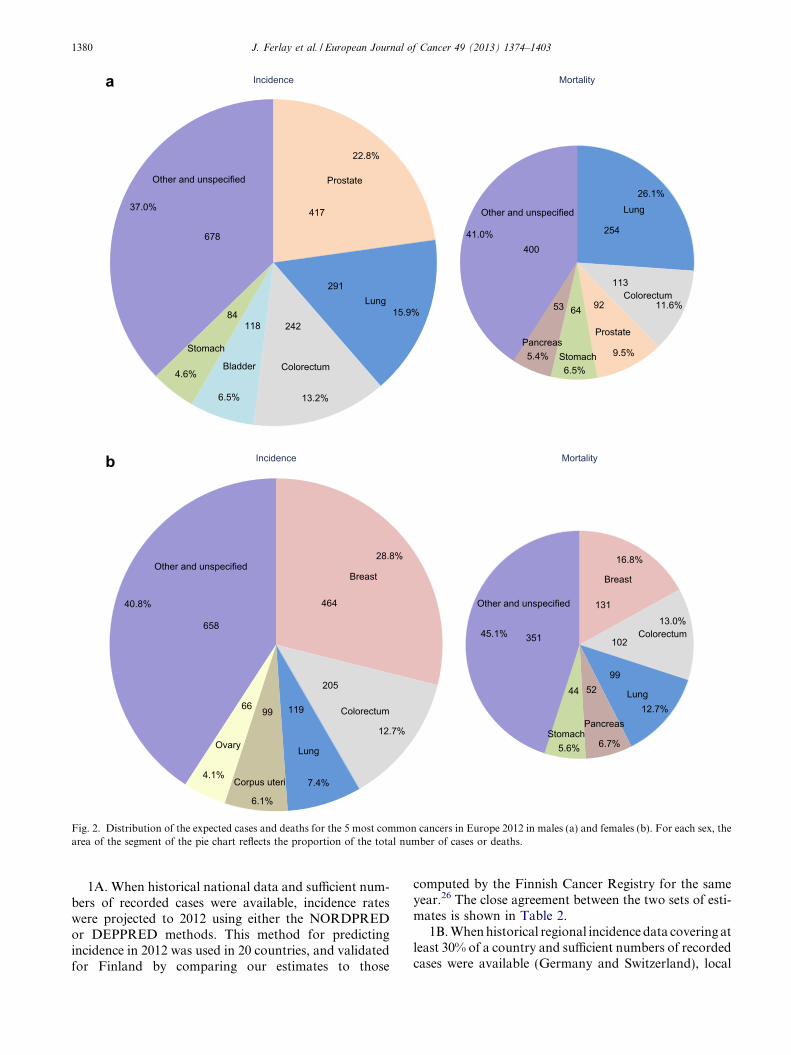
Fig. 2. Distribution of the expected cases and deaths for the 5 most common cancers in Europe 2012 in males (a) and females (b). For each sex, thearea of the segment of the pie chart reflects the proportion of the total number of cases or deaths.
1380 J. Ferlay et al. / European Journal of Cancer 49 (2013) 1374–1403
1A. When historical national data and sufficient num-bers of recorded cases were available, incidence rateswere projected to 2012 using either the NORDPREDor DEPPRED methods. This method for predictingincidence in 2012 was used in 20 countries, and validatedfor Finland by comparing our estimates to those
computed by the Finnish Cancer Registry for the sameyear.26 The close agreement between the two sets of esti-mates is shown in Table 2.
1B. When historical regional incidence data covering atleast 30% of a country and sufficient numbers of recordedcases were available (Germany and Switzerland), local
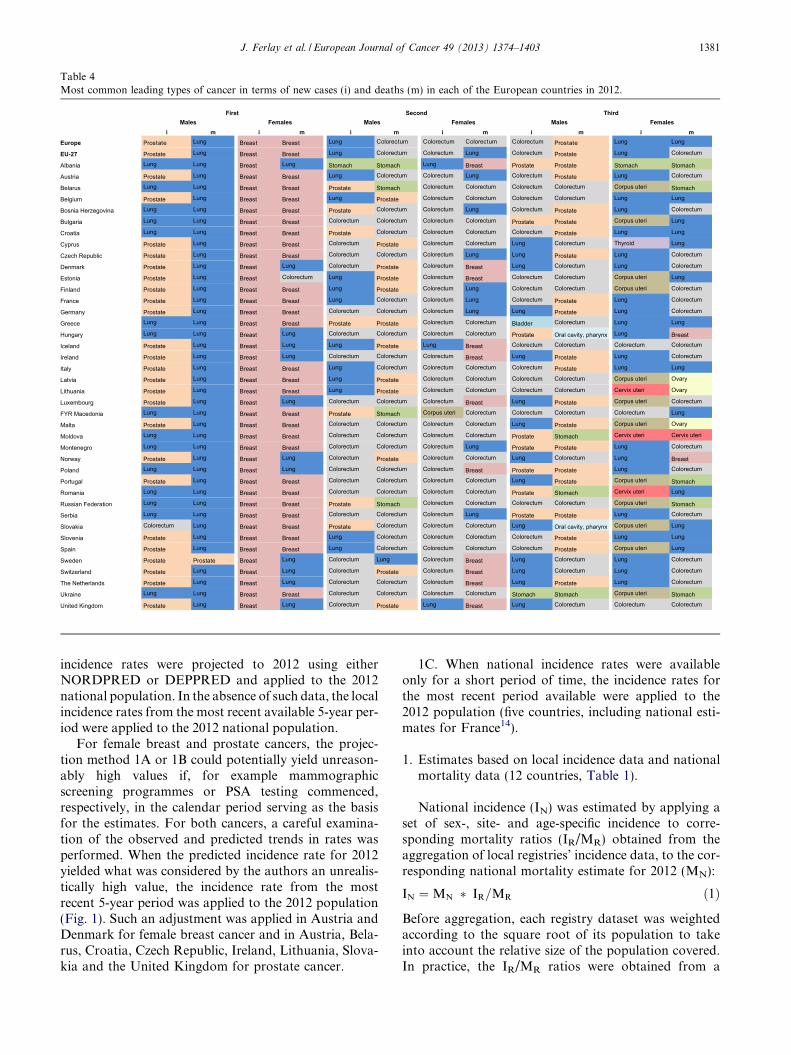
Table 4Most common leading types of cancer in terms of new cases (i) and deaths (m) in each of the European countries in 2012.
i m i m i m i m i m i mEurope Prostate Lung Breast Breast Lung Colorectum Colorectum Colorectum Colorectum Prostate Lung Lung
EU-27 Prostate Lung Breast Breast Lung Colorectum Colorectum Lung Colorectum Prostate Lung Colorectum
Albania Lung Lung Breast Lung Stomach Stomach Lung Breast Prostate Prostate Stomach Stomach
Austria Prostate Lung Breast Breast Lung Colorectum Colorectum Lung Colorectum Prostate Lung Colorectum
Belarus Lung Lung Breast Breast Prostate Stomach Colorectum Colorectum Colorectum Colorectum Corpus uteri Stomach
Belgium Prostate Lung Breast Breast Lung Prostate Colorectum Colorectum Colorectum Colorectum Lung Lung
Bosnia Herzegovina Lung Lung Breast Breast Prostate Colorectum Colorectum Lung Colorectum Prostate Lung Colorectum
Bulgaria Lung Lung Breast Breast Colorectum Colorectum Colorectum Colorectum Prostate Prostate Corpus uteri Lung
Croatia Lung Lung Breast Breast Prostate Colorectum Colorectum Colorectum Colorectum Prostate Lung Lung
Cyprus Prostate Lung Breast Breast Colorectum Prostate Colorectum Colorectum Lung Colorectum Thyroid Lung
Czech Republic Prostate Lung Breast Breast Colorectum Colorectum Colorectum Lung Lung Prostate Lung Colorectum
Denmark Prostate Lung Breast Lung Colorectum Prostate Colorectum Breast Lung Colorectum Lung Colorectum
Estonia Prostate Lung Breast Colorectum Lung Prostate Colorectum Breast Colorectum Colorectum Corpus uteri Lung
Finland Prostate Lung Breast Breast Lung Prostate Colorectum Lung Colorectum Colorectum Corpus uteri Colorectum
France Prostate Lung Breast Breast Lung Colorectum Colorectum Lung Colorectum Prostate Lung Colorectum
Germany Prostate Lung Breast Breast Colorectum Colorectum Colorectum Lung Lung Prostate Lung Colorectum
Greece Lung Lung Breast Breast Prostate Prostate Colorectum Colorectum Bladder Colorectum Lung Lung
Hungary Lung Lung Breast Lung Colorectum Colorectum Colorectum Colorectum Prostate Oral cavity, pharynx Lung Breast
Iceland Prostate Lung Breast Lung Lung Prostate Lung Breast Colorectum Colorectum Colorectum Colorectum
Ireland Prostate Lung Breast Lung Colorectum Colorectum Colorectum Breast Lung Prostate Lung Colorectum
Italy Prostate Lung Breast Breast Lung Colorectum Colorectum Colorectum Colorectum Prostate Lung Lung
Latvia Prostate Lung Breast Breast Lung Prostate Colorectum Colorectum Colorectum Colorectum Corpus uteri Ovary
Lithuania Prostate Lung Breast Breast Lung Prostate Colorectum Colorectum Colorectum Colorectum Cervix uteri Ovary
Luxembourg Prostate Lung Breast Lung Colorectum Colorectum Colorectum Breast Lung Prostate Corpus uteri Colorectum
FYR Macedonia Lung Lung Breast Breast Prostate Stomach Corpus uteri Colorectum Colorectum Colorectum Colorectum Lung
Malta Prostate Lung Breast Breast Colorectum Colorectum Colorectum Colorectum Lung Prostate Corpus uteri Ovary
Moldova Lung Lung Breast Breast Colorectum Colorectum Colorectum Colorectum Prostate Stomach Cervix uteri Cervix uteri
Montenegro Lung Lung Breast Breast Colorectum Colorectum Colorectum Lung Prostate Prostate Lung Colorectum
Norway Prostate Lung Breast Lung Colorectum Prostate Colorectum Colorectum Lung Colorectum Lung Breast
Poland Lung Lung Breast Lung Colorectum Colorectum Colorectum Breast Prostate Prostate Lung Colorectum
Portugal Prostate Lung Breast Breast Colorectum Colorectum Colorectum Colorectum Lung Prostate Corpus uteri Stomach
Romania Lung Lung Breast Breast Colorectum Colorectum Colorectum Colorectum Prostate Stomach Cervix uteri Lung
Russian Federation Lung Lung Breast Breast Prostate Stomach Colorectum Colorectum Colorectum Colorectum Corpus uteri Stomach
Serbia Lung Lung Breast Breast Colorectum Colorectum Colorectum Lung Prostate Prostate Lung Colorectum
Slovakia Colorectum Lung Breast Breast Prostate Colorectum Colorectum Colorectum Lung Oral cavity, pharynx Corpus uteri Lung
Slovenia Prostate Lung Breast Breast Lung Colorectum Colorectum Colorectum Colorectum Prostate Lung Lung
Spain Prostate Lung Breast Breast Lung Colorectum Colorectum Colorectum Colorectum Prostate Corpus uteri Lung
Sweden Prostate Prostate Breast Lung Colorectum Lung Colorectum Breast Lung Colorectum Lung Colorectum
Switzerland Prostate Lung Breast Lung Colorectum Prostate Colorectum Breast Lung Colorectum Lung Colorectum
The Netherlands Prostate Lung Breast Lung Colorectum Colorectum Colorectum Breast Lung Prostate Lung Colorectum
Ukraine Lung Lung Breast Breast Colorectum Colorectum Colorectum Colorectum Stomach Stomach Corpus uteri Stomach
United Kingdom Prostate Lung Breast Lung Colorectum Prostate Lung Breast Lung Colorectum Colorectum Colorectum
First Second ThirdFemalesMales Females Males Females Males
J. Ferlay et al. / European Journal of Cancer 49 (2013) 1374–1403 1381
incidence rates were projected to 2012 using eitherNORDPRED or DEPPRED and applied to the 2012national population. In the absence of such data, the localincidence rates from the most recent available 5-year per-iod were applied to the 2012 national population.
For female breast and prostate cancers, the projec-tion method 1A or 1B could potentially yield unreason-ably high values if, for example mammographicscreening programmes or PSA testing commenced,respectively, in the calendar period serving as the basisfor the estimates. For both cancers, a careful examina-tion of the observed and predicted trends in rates wasperformed. When the predicted incidence rate for 2012yielded what was considered by the authors an unrealis-tically high value, the incidence rate from the mostrecent 5-year period was applied to the 2012 population(Fig. 1). Such an adjustment was applied in Austria andDenmark for female breast cancer and in Austria, Bela-rus, Croatia, Czech Republic, Ireland, Lithuania, Slova-kia and the United Kingdom for prostate cancer.
1C. When national incidence rates were availableonly for a short period of time, the incidence rates forthe most recent period available were applied to the2012 population (five countries, including national esti-mates for France14).
1. Estimates based on local incidence data and nationalmortality data (12 countries, Table 1).
National incidence (IN) was estimated by applying aset of sex-, site- and age-specific incidence to corre-sponding mortality ratios (IR/MR) obtained from theaggregation of local registries’ incidence data, to the cor-responding national mortality estimate for 2012 (MN):
IN ¼MN � IR=MR ð1Þ
Before aggregation, each registry dataset was weightedaccording to the square root of its population to takeinto account the relative size of the population covered.In practice, the IR/MR ratios were obtained from a
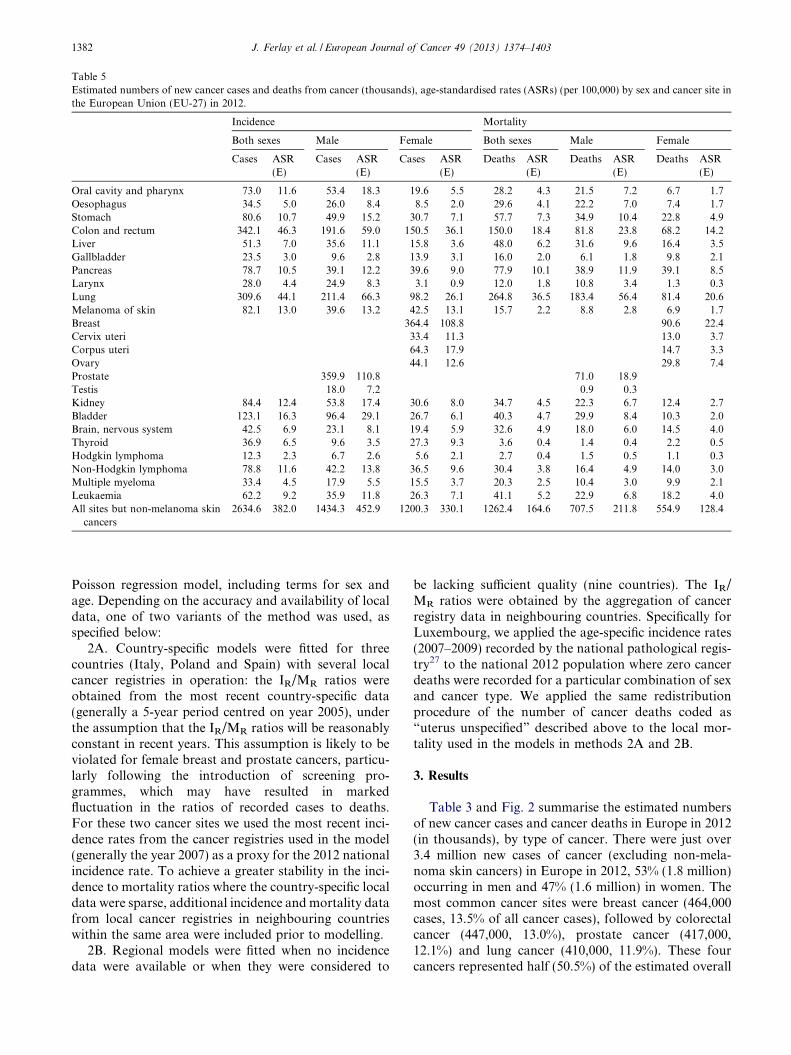
Table 5Estimated numbers of new cancer cases and deaths from cancer (thousands), age-standardised rates (ASRs) (per 100,000) by sex and cancer site inthe European Union (EU-27) in 2012.
Incidence Mortality
Both sexes Male Female Both sexes Male Female
Cases ASR(E)
Cases ASR(E)
Cases ASR(E)
Deaths ASR(E)
Deaths ASR(E)
Deaths ASR(E)
Oral cavity and pharynx 73.0 11.6 53.4 18.3 19.6 5.5 28.2 4.3 21.5 7.2 6.7 1.7Oesophagus 34.5 5.0 26.0 8.4 8.5 2.0 29.6 4.1 22.2 7.0 7.4 1.7Stomach 80.6 10.7 49.9 15.2 30.7 7.1 57.7 7.3 34.9 10.4 22.8 4.9Colon and rectum 342.1 46.3 191.6 59.0 150.5 36.1 150.0 18.4 81.8 23.8 68.2 14.2Liver 51.3 7.0 35.6 11.1 15.8 3.6 48.0 6.2 31.6 9.6 16.4 3.5Gallbladder 23.5 3.0 9.6 2.8 13.9 3.1 16.0 2.0 6.1 1.8 9.8 2.1Pancreas 78.7 10.5 39.1 12.2 39.6 9.0 77.9 10.1 38.9 11.9 39.1 8.5Larynx 28.0 4.4 24.9 8.3 3.1 0.9 12.0 1.8 10.8 3.4 1.3 0.3Lung 309.6 44.1 211.4 66.3 98.2 26.1 264.8 36.5 183.4 56.4 81.4 20.6Melanoma of skin 82.1 13.0 39.6 13.2 42.5 13.1 15.7 2.2 8.8 2.8 6.9 1.7Breast 364.4 108.8 90.6 22.4Cervix uteri 33.4 11.3 13.0 3.7Corpus uteri 64.3 17.9 14.7 3.3Ovary 44.1 12.6 29.8 7.4Prostate 359.9 110.8 71.0 18.9Testis 18.0 7.2 0.9 0.3Kidney 84.4 12.4 53.8 17.4 30.6 8.0 34.7 4.5 22.3 6.7 12.4 2.7Bladder 123.1 16.3 96.4 29.1 26.7 6.1 40.3 4.7 29.9 8.4 10.3 2.0Brain, nervous system 42.5 6.9 23.1 8.1 19.4 5.9 32.6 4.9 18.0 6.0 14.5 4.0Thyroid 36.9 6.5 9.6 3.5 27.3 9.3 3.6 0.4 1.4 0.4 2.2 0.5Hodgkin lymphoma 12.3 2.3 6.7 2.6 5.6 2.1 2.7 0.4 1.5 0.5 1.1 0.3Non-Hodgkin lymphoma 78.8 11.6 42.2 13.8 36.5 9.6 30.4 3.8 16.4 4.9 14.0 3.0Multiple myeloma 33.4 4.5 17.9 5.5 15.5 3.7 20.3 2.5 10.4 3.0 9.9 2.1Leukaemia 62.2 9.2 35.9 11.8 26.3 7.1 41.1 5.2 22.9 6.8 18.2 4.0All sites but non-melanoma skin
cancers2634.6 382.0 1434.3 452.9 1200.3 330.1 1262.4 164.6 707.5 211.8 554.9 128.4
1382 J. Ferlay et al. / European Journal of Cancer 49 (2013) 1374–1403
Poisson regression model, including terms for sex andage. Depending on the accuracy and availability of localdata, one of two variants of the method was used, asspecified below:
2A. Country-specific models were fitted for threecountries (Italy, Poland and Spain) with several localcancer registries in operation: the IR/MR ratios wereobtained from the most recent country-specific data(generally a 5-year period centred on year 2005), underthe assumption that the IR/MR ratios will be reasonablyconstant in recent years. This assumption is likely to beviolated for female breast and prostate cancers, particu-larly following the introduction of screening pro-grammes, which may have resulted in markedfluctuation in the ratios of recorded cases to deaths.For these two cancer sites we used the most recent inci-dence rates from the cancer registries used in the model(generally the year 2007) as a proxy for the 2012 nationalincidence rate. To achieve a greater stability in the inci-dence to mortality ratios where the country-specific localdata were sparse, additional incidence and mortality datafrom local cancer registries in neighbouring countrieswithin the same area were included prior to modelling.
2B. Regional models were fitted when no incidencedata were available or when they were considered to
be lacking sufficient quality (nine countries). The IR/MR ratios were obtained by the aggregation of cancerregistry data in neighbouring countries. Specifically forLuxembourg, we applied the age-specific incidence rates(2007–2009) recorded by the national pathological regis-try27 to the national 2012 population where zero cancerdeaths were recorded for a particular combination of sexand cancer type. We applied the same redistributionprocedure of the number of cancer deaths coded as“uterus unspecified” described above to the local mor-tality used in the models in methods 2A and 2B.
3. Results
Table 3 and Fig. 2 summarise the estimated numbersof new cancer cases and cancer deaths in Europe in 2012(in thousands), by type of cancer. There were just over3.4 million new cases of cancer (excluding non-mela-noma skin cancers) in Europe in 2012, 53% (1.8 million)occurring in men and 47% (1.6 million) in women. Themost common cancer sites were breast cancer (464,000cases, 13.5% of all cancer cases), followed by colorectalcancer (447,000, 13.0%), prostate cancer (417,000,12.1%) and lung cancer (410,000, 11.9%). These fourcancers represented half (50.5%) of the estimated overall
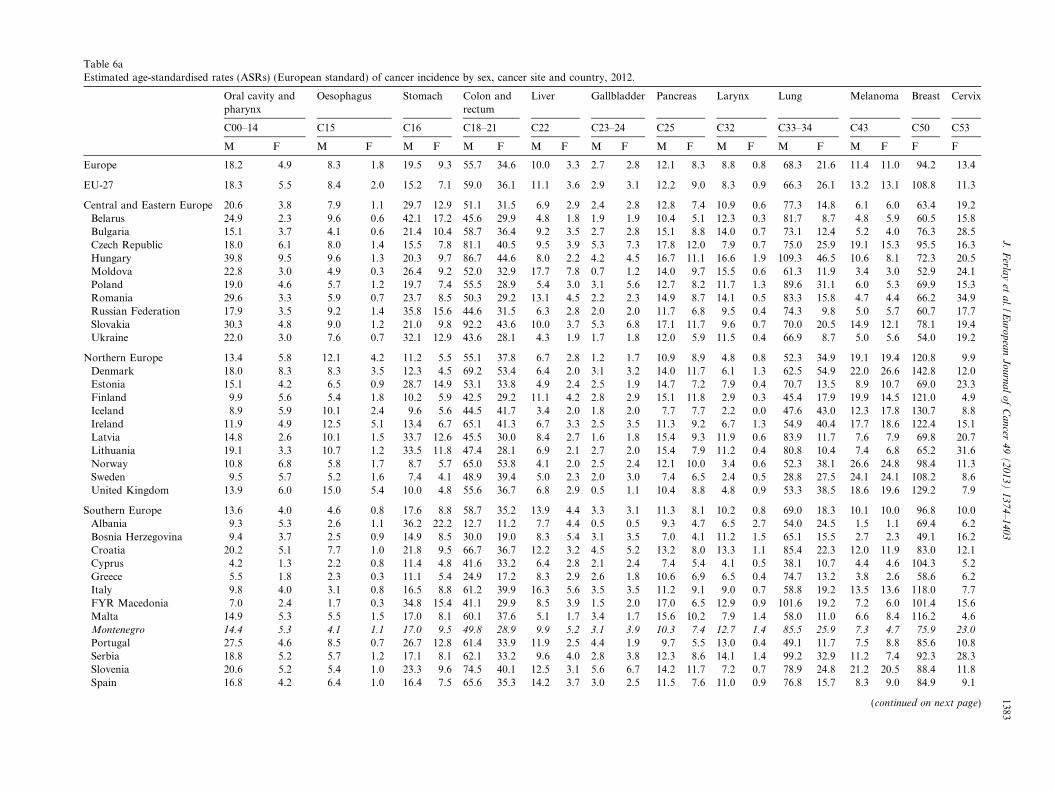
Table 6aEstimated age-standardised rates (ASRs) (European standard) of cancer incidence by sex, cancer site and country, 2012.
Oral cavity andpharynx
Oesophagus Stomach Colon andrectum
Liver Gallbladder Pancreas Larynx Lung Melanoma Breast Cervix
C00–14 C15 C16 C18–21 C22 C23–24 C25 C32 C33–34 C43 C50 C53
M F M F M F M F M F M F M F M F M F M F F F
Europe 18.2 4.9 8.3 1.8 19.5 9.3 55.7 34.6 10.0 3.3 2.7 2.8 12.1 8.3 8.8 0.8 68.3 21.6 11.4 11.0 94.2 13.4
EU-27 18.3 5.5 8.4 2.0 15.2 7.1 59.0 36.1 11.1 3.6 2.9 3.1 12.2 9.0 8.3 0.9 66.3 26.1 13.2 13.1 108.8 11.3
Central and Eastern Europe 20.6 3.8 7.9 1.1 29.7 12.9 51.1 31.5 6.9 2.9 2.4 2.8 12.8 7.4 10.9 0.6 77.3 14.8 6.1 6.0 63.4 19.2Belarus 24.9 2.3 9.6 0.6 42.1 17.2 45.6 29.9 4.8 1.8 1.9 1.9 10.4 5.1 12.3 0.3 81.7 8.7 4.8 5.9 60.5 15.8Bulgaria 15.1 3.7 4.1 0.6 21.4 10.4 58.7 36.4 9.2 3.5 2.7 2.8 15.1 8.8 14.0 0.7 73.1 12.4 5.2 4.0 76.3 28.5Czech Republic 18.0 6.1 8.0 1.4 15.5 7.8 81.1 40.5 9.5 3.9 5.3 7.3 17.8 12.0 7.9 0.7 75.0 25.9 19.1 15.3 95.5 16.3Hungary 39.8 9.5 9.6 1.3 20.3 9.7 86.7 44.6 8.0 2.2 4.2 4.5 16.7 11.1 16.6 1.9 109.3 46.5 10.6 8.1 72.3 20.5Moldova 22.8 3.0 4.9 0.3 26.4 9.2 52.0 32.9 17.7 7.8 0.7 1.2 14.0 9.7 15.5 0.6 61.3 11.9 3.4 3.0 52.9 24.1Poland 19.0 4.6 5.7 1.2 19.7 7.4 55.5 28.9 5.4 3.0 3.1 5.6 12.7 8.2 11.7 1.3 89.6 31.1 6.0 5.3 69.9 15.3Romania 29.6 3.3 5.9 0.7 23.7 8.5 50.3 29.2 13.1 4.5 2.2 2.3 14.9 8.7 14.1 0.5 83.3 15.8 4.7 4.4 66.2 34.9Russian Federation 17.9 3.5 9.2 1.4 35.8 15.6 44.6 31.5 6.3 2.8 2.0 2.0 11.7 6.8 9.5 0.4 74.3 9.8 5.0 5.7 60.7 17.7Slovakia 30.3 4.8 9.0 1.2 21.0 9.8 92.2 43.6 10.0 3.7 5.3 6.8 17.1 11.7 9.6 0.7 70.0 20.5 14.9 12.1 78.1 19.4Ukraine 22.0 3.0 7.6 0.7 32.1 12.9 43.6 28.1 4.3 1.9 1.7 1.8 12.0 5.9 11.5 0.4 66.9 8.7 5.0 5.6 54.0 19.2
Northern Europe 13.4 5.8 12.1 4.2 11.2 5.5 55.1 37.8 6.7 2.8 1.2 1.7 10.9 8.9 4.8 0.8 52.3 34.9 19.1 19.4 120.8 9.9Denmark 18.0 8.3 8.3 3.5 12.3 4.5 69.2 53.4 6.4 2.0 3.1 3.2 14.0 11.7 6.1 1.3 62.5 54.9 22.0 26.6 142.8 12.0Estonia 15.1 4.2 6.5 0.9 28.7 14.9 53.1 33.8 4.9 2.4 2.5 1.9 14.7 7.2 7.9 0.4 70.7 13.5 8.9 10.7 69.0 23.3Finland 9.9 5.6 5.4 1.8 10.2 5.9 42.5 29.2 11.1 4.2 2.8 2.9 15.1 11.8 2.9 0.3 45.4 17.9 19.9 14.5 121.0 4.9Iceland 8.9 5.9 10.1 2.4 9.6 5.6 44.5 41.7 3.4 2.0 1.8 2.0 7.7 7.7 2.2 0.0 47.6 43.0 12.3 17.8 130.7 8.8Ireland 11.9 4.9 12.5 5.1 13.4 6.7 65.1 41.3 6.7 3.3 2.5 3.5 11.3 9.2 6.7 1.3 54.9 40.4 17.7 18.6 122.4 15.1Latvia 14.8 2.6 10.1 1.5 33.7 12.6 45.5 30.0 8.4 2.7 1.6 1.8 15.4 9.3 11.9 0.6 83.9 11.7 7.6 7.9 69.8 20.7Lithuania 19.1 3.3 10.7 1.2 33.5 11.8 47.4 28.1 6.9 2.1 2.7 2.0 15.4 7.9 11.2 0.4 80.8 10.4 7.4 6.8 65.2 31.6Norway 10.8 6.8 5.8 1.7 8.7 5.7 65.0 53.8 4.1 2.0 2.5 2.4 12.1 10.0 3.4 0.6 52.3 38.1 26.6 24.8 98.4 11.3Sweden 9.5 5.7 5.2 1.6 7.4 4.1 48.9 39.4 5.0 2.3 2.0 3.0 7.4 6.5 2.4 0.5 28.8 27.5 24.1 24.1 108.2 8.6United Kingdom 13.9 6.0 15.0 5.4 10.0 4.8 55.6 36.7 6.8 2.9 0.5 1.1 10.4 8.8 4.8 0.9 53.3 38.5 18.6 19.6 129.2 7.9
Southern Europe 13.6 4.0 4.6 0.8 17.6 8.8 58.7 35.2 13.9 4.4 3.3 3.1 11.3 8.1 10.2 0.8 69.0 18.3 10.1 10.0 96.8 10.0Albania 9.3 5.3 2.6 1.1 36.2 22.2 12.7 11.2 7.7 4.4 0.5 0.5 9.3 4.7 6.5 2.7 54.0 24.5 1.5 1.1 69.4 6.2Bosnia Herzegovina 9.4 3.7 2.5 0.9 14.9 8.5 30.0 19.0 8.3 5.4 3.1 3.5 7.0 4.1 11.2 1.5 65.1 15.5 2.7 2.3 49.1 16.2Croatia 20.2 5.1 7.7 1.0 21.8 9.5 66.7 36.7 12.2 3.2 4.5 5.2 13.2 8.0 13.3 1.1 85.4 22.3 12.0 11.9 83.0 12.1Cyprus 4.2 1.3 2.2 0.8 11.4 4.8 41.6 33.2 6.4 2.8 2.1 2.4 7.4 5.4 4.1 0.5 38.1 10.7 4.4 4.6 104.3 5.2Greece 5.5 1.8 2.3 0.3 11.1 5.4 24.9 17.2 8.3 2.9 2.6 1.8 10.6 6.9 6.5 0.4 74.7 13.2 3.8 2.6 58.6 6.2Italy 9.8 4.0 3.1 0.8 16.5 8.8 61.2 39.9 16.3 5.6 3.5 3.5 11.2 9.1 9.0 0.7 58.8 19.2 13.5 13.6 118.0 7.7FYR Macedonia 7.0 2.4 1.7 0.3 34.8 15.4 41.1 29.9 8.5 3.9 1.5 2.0 17.0 6.5 12.9 0.9 101.6 19.2 7.2 6.0 101.4 15.6Malta 14.9 5.3 5.5 1.5 17.0 8.1 60.1 37.6 5.1 1.7 3.4 1.7 15.6 10.2 7.9 1.4 58.0 11.0 6.6 8.4 116.2 4.6Montenegro 14.4 5.3 4.1 1.1 17.0 9.5 49.8 28.9 9.9 5.2 3.1 3.9 10.3 7.4 12.7 1.4 85.5 25.9 7.3 4.7 75.9 23.0
Portugal 27.5 4.6 8.5 0.7 26.7 12.8 61.4 33.9 11.9 2.5 4.4 1.9 9.7 5.5 13.0 0.4 49.1 11.7 7.5 8.8 85.6 10.8Serbia 18.8 5.2 5.7 1.2 17.1 8.1 62.1 33.2 9.6 4.0 2.8 3.8 12.3 8.6 14.1 1.4 99.2 32.9 11.2 7.4 92.3 28.3Slovenia 20.6 5.2 5.4 1.0 23.3 9.6 74.5 40.1 12.5 3.1 5.6 6.7 14.2 11.7 7.2 0.7 78.9 24.8 21.2 20.5 88.4 11.8Spain 16.8 4.2 6.4 1.0 16.4 7.5 65.6 35.3 14.2 3.7 3.0 2.5 11.5 7.6 11.0 0.9 76.8 15.7 8.3 9.0 84.9 9.1
(continued on next page)
J.
Ferla
yet
al./E
uro
pea
nJ
ou
rna
lo
fC
an
cer4
9(
20
13
)1
37
4–
14
03
1383
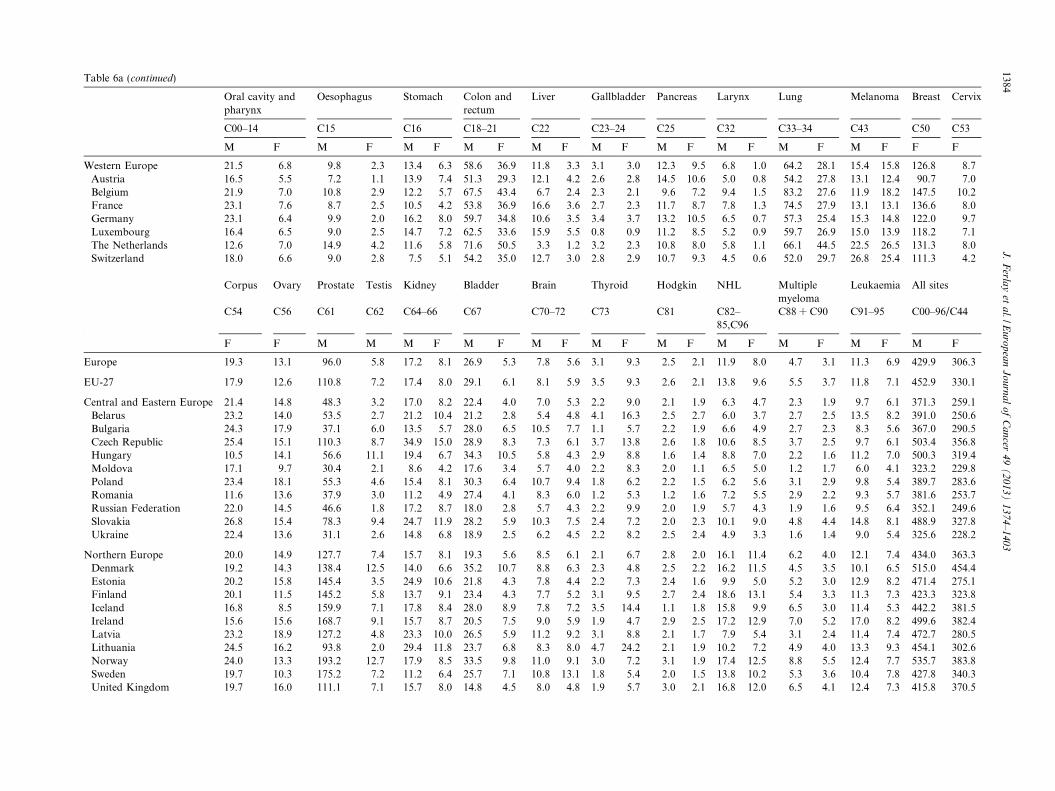
Table 6a (continued)
Oral cavity andpharynx
Oesophagus Stomach Colon andrectum
Liver Gallbladder Pancreas Larynx Lung Melanoma Breast Cervix
C00–14 C15 C16 C18–21 C22 C23–24 C25 C32 C33–34 C43 C50 C53
M F M F M F M F M F M F M F M F M F M F F F
Western Europe 21.5 6.8 9.8 2.3 13.4 6.3 58.6 36.9 11.8 3.3 3.1 3.0 12.3 9.5 6.8 1.0 64.2 28.1 15.4 15.8 126.8 8.7Austria 16.5 5.5 7.2 1.1 13.9 7.4 51.3 29.3 12.1 4.2 2.6 2.8 14.5 10.6 5.0 0.8 54.2 27.8 13.1 12.4 90.7 7.0Belgium 21.9 7.0 10.8 2.9 12.2 5.7 67.5 43.4 6.7 2.4 2.3 2.1 9.6 7.2 9.4 1.5 83.2 27.6 11.9 18.2 147.5 10.2France 23.1 7.6 8.7 2.5 10.5 4.2 53.8 36.9 16.6 3.6 2.7 2.3 11.7 8.7 7.8 1.3 74.5 27.9 13.1 13.1 136.6 8.0Germany 23.1 6.4 9.9 2.0 16.2 8.0 59.7 34.8 10.6 3.5 3.4 3.7 13.2 10.5 6.5 0.7 57.3 25.4 15.3 14.8 122.0 9.7Luxembourg 16.4 6.5 9.0 2.5 14.7 7.2 62.5 33.6 15.9 5.5 0.8 0.9 11.2 8.5 5.2 0.9 59.7 26.9 15.0 13.9 118.2 7.1The Netherlands 12.6 7.0 14.9 4.2 11.6 5.8 71.6 50.5 3.3 1.2 3.2 2.3 10.8 8.0 5.8 1.1 66.1 44.5 22.5 26.5 131.3 8.0Switzerland 18.0 6.6 9.0 2.8 7.5 5.1 54.2 35.0 12.7 3.0 2.8 2.9 10.7 9.3 4.5 0.6 52.0 29.7 26.8 25.4 111.3 4.2
Corpus Ovary Prostate Testis Kidney Bladder Brain Thyroid Hodgkin NHL Multiplemyeloma
Leukaemia All sites
C54 C56 C61 C62 C64–66 C67 C70–72 C73 C81 C82–85,C96
C88 + C90 C91–95 C00–96/C44
F F M M M F M F M F M F M F M F M F M F M F
Europe 19.3 13.1 96.0 5.8 17.2 8.1 26.9 5.3 7.8 5.6 3.1 9.3 2.5 2.1 11.9 8.0 4.7 3.1 11.3 6.9 429.9 306.3
EU-27 17.9 12.6 110.8 7.2 17.4 8.0 29.1 6.1 8.1 5.9 3.5 9.3 2.6 2.1 13.8 9.6 5.5 3.7 11.8 7.1 452.9 330.1
Central and Eastern Europe 21.4 14.8 48.3 3.2 17.0 8.2 22.4 4.0 7.0 5.3 2.2 9.0 2.1 1.9 6.3 4.7 2.3 1.9 9.7 6.1 371.3 259.1Belarus 23.2 14.0 53.5 2.7 21.2 10.4 21.2 2.8 5.4 4.8 4.1 16.3 2.5 2.7 6.0 3.7 2.7 2.5 13.5 8.2 391.0 250.6Bulgaria 24.3 17.9 37.1 6.0 13.5 5.7 28.0 6.5 10.5 7.7 1.1 5.7 2.2 1.9 6.6 4.9 2.7 2.3 8.3 5.6 367.0 290.5Czech Republic 25.4 15.1 110.3 8.7 34.9 15.0 28.9 8.3 7.3 6.1 3.7 13.8 2.6 1.8 10.6 8.5 3.7 2.5 9.7 6.1 503.4 356.8Hungary 10.5 14.1 56.6 11.1 19.4 6.7 34.3 10.5 5.8 4.3 2.9 8.8 1.6 1.4 8.8 7.0 2.2 1.6 11.2 7.0 500.3 319.4Moldova 17.1 9.7 30.4 2.1 8.6 4.2 17.6 3.4 5.7 4.0 2.2 8.3 2.0 1.1 6.5 5.0 1.2 1.7 6.0 4.1 323.2 229.8Poland 23.4 18.1 55.3 4.6 15.4 8.1 30.3 6.4 10.7 9.4 1.8 6.2 2.2 1.5 6.2 5.6 3.1 2.9 9.8 5.4 389.7 283.6Romania 11.6 13.6 37.9 3.0 11.2 4.9 27.4 4.1 8.3 6.0 1.2 5.3 1.2 1.6 7.2 5.5 2.9 2.2 9.3 5.7 381.6 253.7Russian Federation 22.0 14.5 46.6 1.8 17.2 8.7 18.0 2.8 5.7 4.3 2.2 9.9 2.0 1.9 5.7 4.3 1.9 1.6 9.5 6.4 352.1 249.6Slovakia 26.8 15.4 78.3 9.4 24.7 11.9 28.2 5.9 10.3 7.5 2.4 7.2 2.0 2.3 10.1 9.0 4.8 4.4 14.8 8.1 488.9 327.8Ukraine 22.4 13.6 31.1 2.6 14.8 6.8 18.9 2.5 6.2 4.5 2.2 8.2 2.5 2.4 4.9 3.3 1.6 1.4 9.0 5.4 325.6 228.2
Northern Europe 20.0 14.9 127.7 7.4 15.7 8.1 19.3 5.6 8.5 6.1 2.1 6.7 2.8 2.0 16.1 11.4 6.2 4.0 12.1 7.4 434.0 363.3Denmark 19.2 14.3 138.4 12.5 14.0 6.6 35.2 10.7 8.8 6.3 2.3 4.8 2.5 2.2 16.2 11.5 4.5 3.5 10.1 6.5 515.0 454.4Estonia 20.2 15.8 145.4 3.5 24.9 10.6 21.8 4.3 7.8 4.4 2.2 7.3 2.4 1.6 9.9 5.0 5.2 3.0 12.9 8.2 471.4 275.1Finland 20.1 11.5 145.2 5.8 13.7 9.1 23.4 4.3 7.7 5.2 3.1 9.5 2.7 2.4 18.6 13.1 5.4 3.3 11.3 7.3 423.3 323.8Iceland 16.8 8.5 159.9 7.1 17.8 8.4 28.0 8.9 7.8 7.2 3.5 14.4 1.1 1.8 15.8 9.9 6.5 3.0 11.4 5.3 442.2 381.5Ireland 15.6 15.6 168.7 9.1 15.7 8.7 20.5 7.5 9.0 5.9 1.9 4.7 2.9 2.5 17.2 12.9 7.0 5.2 17.0 8.2 499.6 382.4Latvia 23.2 18.9 127.2 4.8 23.3 10.0 26.5 5.9 11.2 9.2 3.1 8.8 2.1 1.7 7.9 5.4 3.1 2.4 11.4 7.4 472.7 280.5Lithuania 24.5 16.2 93.8 2.0 29.4 11.8 23.7 6.8 8.3 8.0 4.7 24.2 2.1 1.9 10.2 7.2 4.9 4.0 13.3 9.3 454.1 302.6Norway 24.0 13.3 193.2 12.7 17.9 8.5 33.5 9.8 11.0 9.1 3.0 7.2 3.1 1.9 17.4 12.5 8.8 5.5 12.4 7.7 535.7 383.8Sweden 19.7 10.3 175.2 7.2 11.2 6.4 25.7 7.1 10.8 13.1 1.8 5.4 2.0 1.5 13.8 10.2 5.3 3.6 10.4 7.8 427.8 340.3United Kingdom 19.7 16.0 111.1 7.1 15.7 8.0 14.8 4.5 8.0 4.8 1.9 5.7 3.0 2.1 16.8 12.0 6.5 4.1 12.4 7.3 415.8 370.5
1384J
.F
erlay
eta
l./Eu
rop
ean
Jo
urn
al
of
Ca
ncer
49
(2
01
3)
13
74
–1
40
3
uth
ern
Eu
rop
e18
.012
.088
.36.
015
.86.
333
.15.
88.
56.
04.
510
.82.
72.
213
.58.
94.
93.
511
.47.
042
8.7
297.
4A
lban
ia14
.94.
224
.84.
410
.95.
322
.97.
315
.410
.71.
22.
61.
90.
61.
30.
80.
30.
66.
95.
726
2.9
234.
4B
osn
iaH
erze
govi
na
13.3
10.4
32.7
3.0
8.8
5.1
18.0
3.8
8.1
6.1
0.9
2.7
1.2
1.6
3.2
2.5
1.2
0.7
4.3
3.3
254.
019
5.6
Cro
atia
17.7
13.8
72.8
8.9
20.1
8.8
27.8
7.9
12.2
9.4
4.7
17.6
3.6
3.1
10.4
8.9
4.0
3.4
10.2
6.2
462.
431
6.9
Cyp
rus
15.4
9.4
85.9
4.2
5.5
2.7
35.7
3.8
5.4
4.6
3.8
16.7
2.0
1.5
10.8
9.1
4.5
3.2
15.9
9.7
322.
327
0.3
Gre
ece
10.0
11.2
34.2
2.6
9.4
3.8
26.7
4.1
10.1
7.7
0.7
3.1
2.7
2.4
3.4
2.2
3.4
2.4
14.3
9.0
289.
019
2.0
Ital
y19
.213
.310
0.9
8.8
18.4
6.8
32.3
5.9
7.4
5.0
8.0
18.7
3.0
2.1
18.0
11.4
6.4
4.8
12.1
7.4
447.
834
1.6
FY
RM
aced
on
ia39
.414
.843
.74.
55.
34.
431
.64.
013
.86.
61.
32.
72.
01.
15.
22.
11.
20.
88.
24.
337
7.1
299.
4M
alta
21.8
16.2
78.4
7.0
15.0
7.5
39.8
9.7
7.3
4.6
2.9
10.7
1.8
2.7
9.6
8.6
4.3
2.4
11.7
7.0
396.
731
4.4
Mo
nte
neg
ro2
0.5
14
.94
8.6
4.3
11
.56
.42
2.9
6.5
11
.88
.20
.33
.92
.21
.56
.44
.22
.21
.48
.45
.83
54
.92
83
.1
Po
rtu
gal
18.0
8.2
95.1
5.9
10.2
4.0
33.4
5.4
8.1
6.2
2.2
6.4
2.7
2.7
16.4
10.6
3.9
2.8
9.8
6.8
429.
726
3.0
Ser
bia
24.5
16.4
55.7
5.6
13.8
6.4
25.1
7.1
13.2
9.8
1.3
4.0
2.8
2.4
9.2
7.1
3.0
2.1
10.7
6.9
417.
233
0.3
Slo
ven
ia20
.813
.812
4.9
10.6
20.9
9.8
28.1
6.5
8.3
5.3
3.6
13.3
2.2
1.5
11.9
9.4
6.0
3.6
10.3
7.0
514.
033
9.1
Sp
ain
16.3
10.3
96.8
3.4
15.7
6.4
39.0
5.5
7.7
5.3
2.7
4.8
2.6
2.2
12.1
8.0
4.3
2.8
10.7
6.3
449.
926
4.5
este
rnE
uro
pe
16.5
10.4
140.
09.
018
.99.
130
.16.
67.
65.
43.
810
.32.
72.
315
.010
.76.
54.
112
.47.
649
2.3
356.
5A
ust
ria
14.7
10.2
110.
08.
515
.77.
629
.57.
66.
15.
57.
017
.62.
11.
611
.98.
54.
63.
211
.37.
642
3.9
304.
0B
elgi
um
18.9
11.0
134.
65.
916
.97.
947
.69.
47.
75.
74.
010
.23.
32.
316
.612
.06.
64.
313
.48.
052
5.1
388.
0F
ran
ce15
.210
.718
7.5
7.8
19.6
8.1
22.8
3.3
7.6
5.2
5.0
14.7
2.8
2.8
16.5
10.7
8.3
5.3
14.0
7.9
550.
736
9.8
Ger
man
y16
.910
.211
4.1
10.0
19.9
10.5
34.7
8.3
7.8
5.5
3.1
7.6
2.5
2.1
13.5
10.2
5.4
3.5
12.1
7.4
463.
234
4.5
Lu
xem
bo
urg
35.3
10.5
118.
38.
017
.36.
423
.56.
59.
34.
15.
716
.61.
12.
712
.510
.53.
14.
211
.17.
945
1.6
358.
6T
he
Net
her
lan
ds
17.7
9.2
124.
58.
916
.48.
620
.85.
87.
34.
81.
74.
22.
82.
117
.512
.86.
64.
010
.17.
447
4.2
394.
1S
wit
zerl
and
18.0
11.1
158.
712
.013
.55.
031
.38.
37.
25.
53.
58.
53.
32.
416
.312
.76.
54.
012
.88.
048
4.6
335.
2
ou
ntr
ies
for
wh
ich
no
dat
aw
ere
avai
lab
lear
ein
ital
ics.
J. Ferlay et al. / European Journal of Cancer 49 (2013) 1374–1403 1385
So
W C
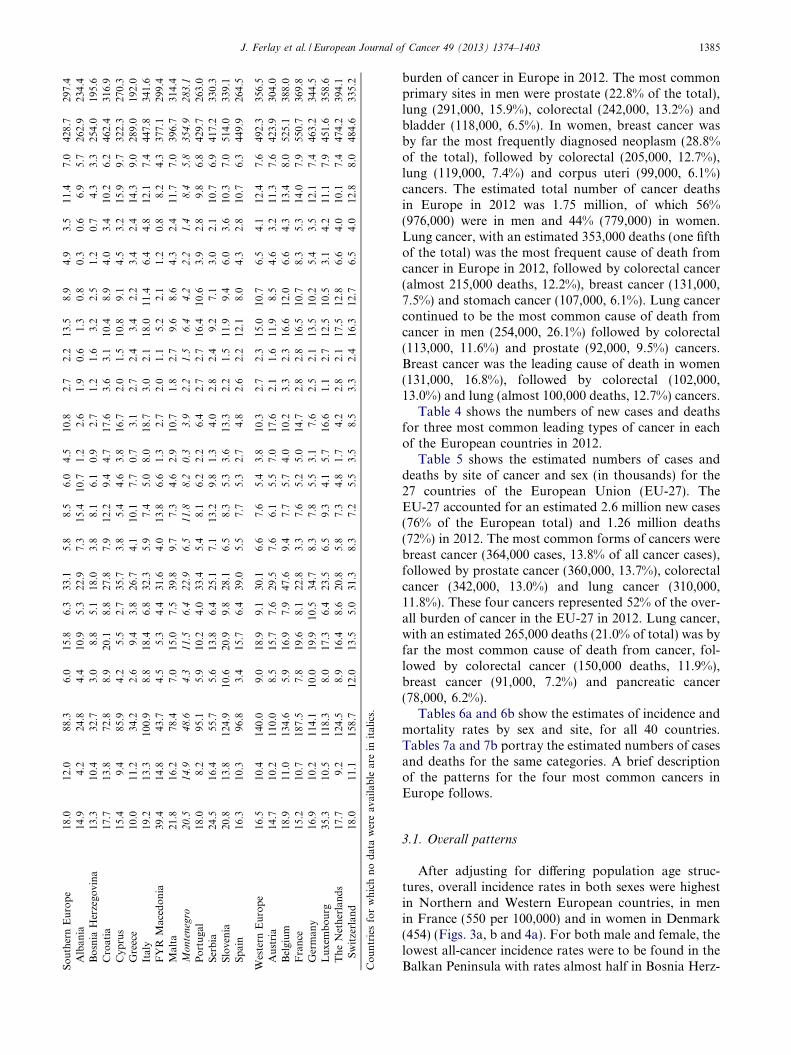
burden of cancer in Europe in 2012. The most commonprimary sites in men were prostate (22.8% of the total),lung (291,000, 15.9%), colorectal (242,000, 13.2%) andbladder (118,000, 6.5%). In women, breast cancer wasby far the most frequently diagnosed neoplasm (28.8%of the total), followed by colorectal (205,000, 12.7%),lung (119,000, 7.4%) and corpus uteri (99,000, 6.1%)cancers. The estimated total number of cancer deathsin Europe in 2012 was 1.75 million, of which 56%(976,000) were in men and 44% (779,000) in women.Lung cancer, with an estimated 353,000 deaths (one fifthof the total) was the most frequent cause of death fromcancer in Europe in 2012, followed by colorectal cancer(almost 215,000 deaths, 12.2%), breast cancer (131,000,7.5%) and stomach cancer (107,000, 6.1%). Lung cancercontinued to be the most common cause of death fromcancer in men (254,000, 26.1%) followed by colorectal(113,000, 11.6%) and prostate (92,000, 9.5%) cancers.Breast cancer was the leading cause of death in women(131,000, 16.8%), followed by colorectal (102,000,13.0%) and lung (almost 100,000 deaths, 12.7%) cancers.
Table 4 shows the numbers of new cases and deathsfor three most common leading types of cancer in eachof the European countries in 2012.
Table 5 shows the estimated numbers of cases anddeaths by site of cancer and sex (in thousands) for the27 countries of the European Union (EU-27). TheEU-27 accounted for an estimated 2.6 million new cases(76% of the European total) and 1.26 million deaths(72%) in 2012. The most common forms of cancers werebreast cancer (364,000 cases, 13.8% of all cancer cases),followed by prostate cancer (360,000, 13.7%), colorectalcancer (342,000, 13.0%) and lung cancer (310,000,11.8%). These four cancers represented 52% of the over-all burden of cancer in the EU-27 in 2012. Lung cancer,with an estimated 265,000 deaths (21.0% of total) was byfar the most common cause of death from cancer, fol-lowed by colorectal cancer (150,000 deaths, 11.9%),breast cancer (91,000, 7.2%) and pancreatic cancer(78,000, 6.2%).
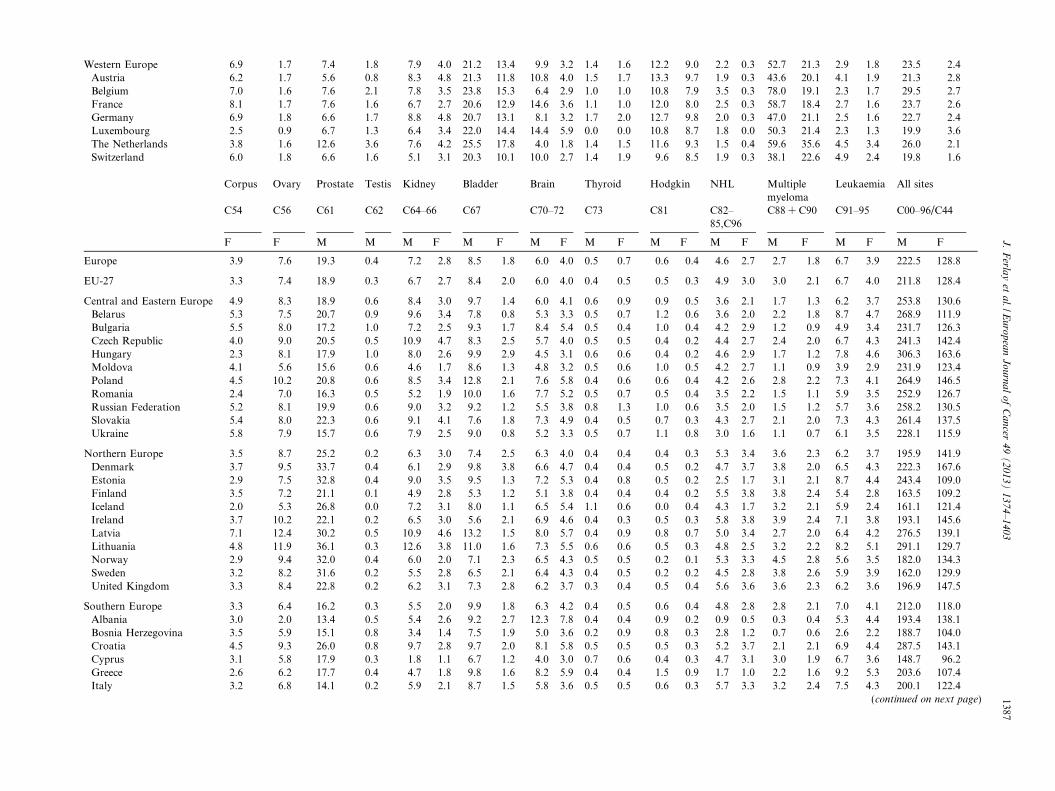
Tables 6a and 6b show the estimates of incidence andmortality rates by sex and site, for all 40 countries.Tables 7a and 7b portray the estimated numbers of casesand deaths for the same categories. A brief descriptionof the patterns for the four most common cancers inEurope follows.
3.1. Overall patterns
After adjusting for differing population age struc-tures, overall incidence rates in both sexes were highestin Northern and Western European countries, in menin France (550 per 100,000) and in women in Denmark(454) (Figs. 3a, b and 4a). For both male and female, thelowest all-cancer incidence rates were to be found in theBalkan Peninsula with rates almost half in Bosnia Herz-
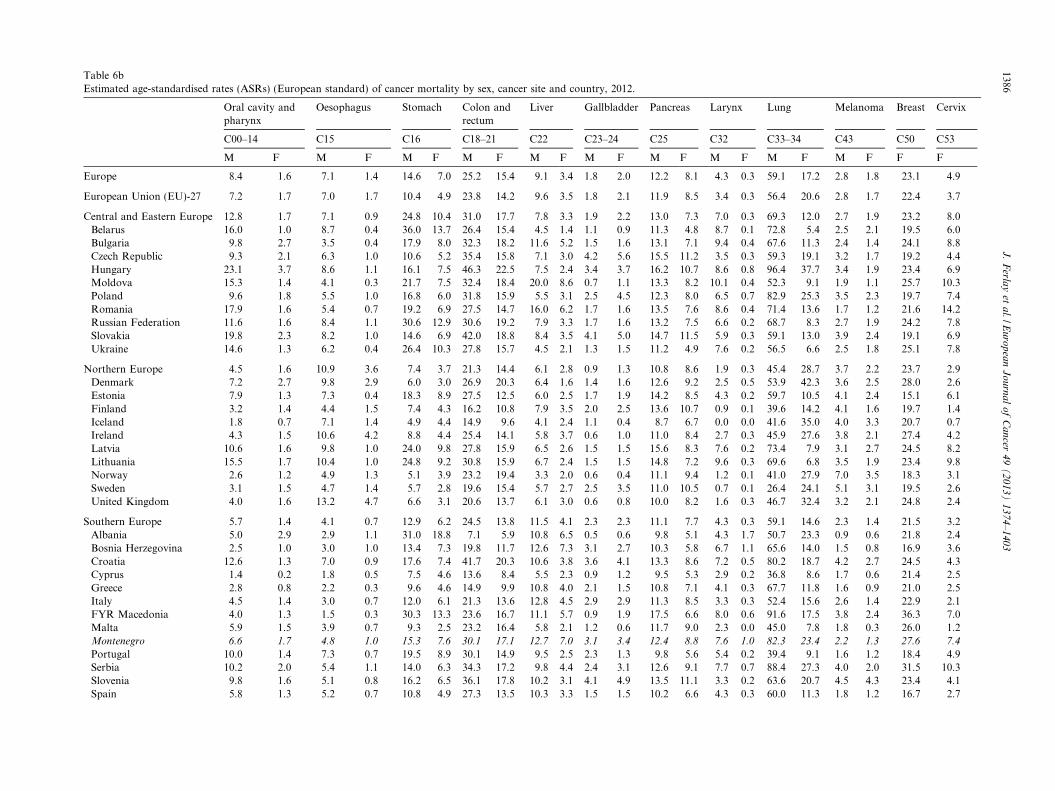
Table 6bEstimated age-standardised rates (ASRs) (European standard) of cancer mortality by sex, cancer site and country, 2012.
Oral cavity andpharynx
Oesophagus Stomach Colon andrectum
Liver Gallbladder Pancreas Larynx Lung Melanoma Breast Cervix
C00–14 C15 C16 C18–21 C22 C23–24 C25 C32 C33–34 C43 C50 C53
M F M F M F M F M F M F M F M F M F M F F F
Europe 8.4 1.6 7.1 1.4 14.6 7.0 25.2 15.4 9.1 3.4 1.8 2.0 12.2 8.1 4.3 0.3 59.1 17.2 2.8 1.8 23.1 4.9
European Union (EU)-27 7.2 1.7 7.0 1.7 10.4 4.9 23.8 14.2 9.6 3.5 1.8 2.1 11.9 8.5 3.4 0.3 56.4 20.6 2.8 1.7 22.4 3.7
Central and Eastern Europe 12.8 1.7 7.1 0.9 24.8 10.4 31.0 17.7 7.8 3.3 1.9 2.2 13.0 7.3 7.0 0.3 69.3 12.0 2.7 1.9 23.2 8.0Belarus 16.0 1.0 8.7 0.4 36.0 13.7 26.4 15.4 4.5 1.4 1.1 0.9 11.3 4.8 8.7 0.1 72.8 5.4 2.5 2.1 19.5 6.0Bulgaria 9.8 2.7 3.5 0.4 17.9 8.0 32.3 18.2 11.6 5.2 1.5 1.6 13.1 7.1 9.4 0.4 67.6 11.3 2.4 1.4 24.1 8.8Czech Republic 9.3 2.1 6.3 1.0 10.6 5.2 35.4 15.8 7.1 3.0 4.2 5.6 15.5 11.2 3.5 0.3 59.3 19.1 3.2 1.7 19.2 4.4Hungary 23.1 3.7 8.6 1.1 16.1 7.5 46.3 22.5 7.5 2.4 3.4 3.7 16.2 10.7 8.6 0.8 96.4 37.7 3.4 1.9 23.4 6.9Moldova 15.3 1.4 4.1 0.3 21.7 7.5 32.4 18.4 20.0 8.6 0.7 1.1 13.3 8.2 10.1 0.4 52.3 9.1 1.9 1.1 25.7 10.3Poland 9.6 1.8 5.5 1.0 16.8 6.0 31.8 15.9 5.5 3.1 2.5 4.5 12.3 8.0 6.5 0.7 82.9 25.3 3.5 2.3 19.7 7.4Romania 17.9 1.6 5.4 0.7 19.2 6.9 27.5 14.7 16.0 6.2 1.7 1.6 13.5 7.6 8.6 0.4 71.4 13.6 1.7 1.2 21.6 14.2Russian Federation 11.6 1.6 8.4 1.1 30.6 12.9 30.6 19.2 7.9 3.3 1.7 1.6 13.2 7.5 6.6 0.2 68.7 8.3 2.7 1.9 24.2 7.8Slovakia 19.8 2.3 8.2 1.0 14.6 6.9 42.0 18.8 8.4 3.5 4.1 5.0 14.7 11.5 5.9 0.3 59.1 13.0 3.9 2.4 19.1 6.9Ukraine 14.6 1.3 6.2 0.4 26.4 10.3 27.8 15.7 4.5 2.1 1.3 1.5 11.2 4.9 7.6 0.2 56.5 6.6 2.5 1.8 25.1 7.8
Northern Europe 4.5 1.6 10.9 3.6 7.4 3.7 21.3 14.4 6.1 2.8 0.9 1.3 10.8 8.6 1.9 0.3 45.4 28.7 3.7 2.2 23.7 2.9Denmark 7.2 2.7 9.8 2.9 6.0 3.0 26.9 20.3 6.4 1.6 1.4 1.6 12.6 9.2 2.5 0.5 53.9 42.3 3.6 2.5 28.0 2.6Estonia 7.9 1.3 7.3 0.4 18.3 8.9 27.5 12.5 6.0 2.5 1.7 1.9 14.2 8.5 4.3 0.2 59.7 10.5 4.1 2.4 15.1 6.1Finland 3.2 1.4 4.4 1.5 7.4 4.3 16.2 10.8 7.9 3.5 2.0 2.5 13.6 10.7 0.9 0.1 39.6 14.2 4.1 1.6 19.7 1.4Iceland 1.8 0.7 7.1 1.4 4.9 4.4 14.9 9.6 4.1 2.4 1.1 0.4 8.7 6.7 0.0 0.0 41.6 35.0 4.0 3.3 20.7 0.7Ireland 4.3 1.5 10.6 4.2 8.8 4.4 25.4 14.1 5.8 3.7 0.6 1.0 11.0 8.4 2.7 0.3 45.9 27.6 3.8 2.1 27.4 4.2Latvia 10.6 1.6 9.8 1.0 24.0 9.8 27.8 15.9 6.5 2.6 1.5 1.5 15.6 8.3 7.6 0.2 73.4 7.9 3.1 2.7 24.5 8.2Lithuania 15.5 1.7 10.4 1.0 24.8 9.2 30.8 15.9 6.7 2.4 1.5 1.5 14.8 7.2 9.6 0.3 69.6 6.8 3.5 1.9 23.4 9.8Norway 2.6 1.2 4.9 1.3 5.1 3.9 23.2 19.4 3.3 2.0 0.6 0.4 11.1 9.4 1.2 0.1 41.0 27.9 7.0 3.5 18.3 3.1Sweden 3.1 1.5 4.7 1.4 5.7 2.8 19.6 15.4 5.7 2.7 2.5 3.5 11.0 10.5 0.7 0.1 26.4 24.1 5.1 3.1 19.5 2.6United Kingdom 4.0 1.6 13.2 4.7 6.6 3.1 20.6 13.7 6.1 3.0 0.6 0.8 10.0 8.2 1.6 0.3 46.7 32.4 3.2 2.1 24.8 2.4
Southern Europe 5.7 1.4 4.1 0.7 12.9 6.2 24.5 13.8 11.5 4.1 2.3 2.3 11.1 7.7 4.3 0.3 59.1 14.6 2.3 1.4 21.5 3.2Albania 5.0 2.9 2.9 1.1 31.0 18.8 7.1 5.9 10.8 6.5 0.5 0.6 9.8 5.1 4.3 1.7 50.7 23.3 0.9 0.6 21.8 2.4Bosnia Herzegovina 2.5 1.0 3.0 1.0 13.4 7.3 19.8 11.7 12.6 7.3 3.1 2.7 10.3 5.8 6.7 1.1 65.6 14.0 1.5 0.8 16.9 3.6Croatia 12.6 1.3 7.0 0.9 17.6 7.4 41.7 20.3 10.6 3.8 3.6 4.1 13.3 8.6 7.2 0.5 80.2 18.7 4.2 2.7 24.5 4.3Cyprus 1.4 0.2 1.8 0.5 7.5 4.6 13.6 8.4 5.5 2.3 0.9 1.2 9.5 5.3 2.9 0.2 36.8 8.6 1.7 0.6 21.4 2.5Greece 2.8 0.8 2.2 0.3 9.6 4.6 14.9 9.9 10.8 4.0 2.1 1.5 10.8 7.1 4.1 0.3 67.7 11.8 1.6 0.9 21.0 2.5Italy 4.5 1.4 3.0 0.7 12.0 6.1 21.3 13.6 12.8 4.5 2.9 2.9 11.3 8.5 3.3 0.3 52.4 15.6 2.6 1.4 22.9 2.1FYR Macedonia 4.0 1.3 1.5 0.3 30.3 13.3 23.6 16.7 11.1 5.7 0.9 1.9 17.5 6.6 8.0 0.6 91.6 17.5 3.8 2.4 36.3 7.0Malta 5.9 1.5 3.9 0.7 9.3 2.5 23.2 16.4 5.8 2.1 1.2 0.6 11.7 9.0 2.3 0.0 45.0 7.8 1.8 0.3 26.0 1.2Montenegro 6.6 1.7 4.8 1.0 15.3 7.6 30.1 17.1 12.7 7.0 3.1 3.4 12.4 8.8 7.6 1.0 82.3 23.4 2.2 1.3 27.6 7.4
Portugal 10.0 1.4 7.3 0.7 19.5 8.9 30.1 14.9 9.5 2.5 2.3 1.3 9.8 5.6 5.4 0.2 39.4 9.1 1.6 1.2 18.4 4.9Serbia 10.2 2.0 5.4 1.1 14.0 6.3 34.3 17.2 9.8 4.4 2.4 3.1 12.6 9.1 7.7 0.7 88.4 27.3 4.0 2.0 31.5 10.3Slovenia 9.8 1.6 5.1 0.8 16.2 6.5 36.1 17.8 10.2 3.1 4.1 4.9 13.5 11.1 3.3 0.2 63.6 20.7 4.5 4.3 23.4 4.1Spain 5.8 1.3 5.2 0.7 10.8 4.9 27.3 13.5 10.3 3.3 1.5 1.5 10.2 6.6 4.3 0.3 60.0 11.3 1.8 1.2 16.7 2.7
1386J
.F
erlay
eta
l./Eu
rop
ean
Jo
urn
al
of
Ca
ncer
49
(2
01
3)
13
74
–1
40
3
Western Europe 6.9 1.7 7.4 1.8 7.9 4.0 21.2 13.4 9.9 3.2 1.4 1.6 12.2 9.0 2.2 0.3 52.7 21.3 2.9 1.8 23.5 2.4Austria 6.2 1.7 5.6 0.8 8.3 4.8 21.3 11.8 10.8 4.0 1.5 1.7 13.3 9.7 1.9 0.3 43.6 20.1 4.1 1.9 21.3 2.8Belgium 7.0 1.6 7.6 2.1 7.8 3.5 23.8 15.3 6.4 2.9 1.0 1.0 10.8 7.9 3.5 0.3 78.0 19.1 2.3 1.7 29.5 2.7France 8.1 1.7 7.6 1.6 6.7 2.7 20.6 12.9 14.6 3.6 1.1 1.0 12.0 8.0 2.5 0.3 58.7 18.4 2.7 1.6 23.7 2.6Germany 6.9 1.8 6.6 1.7 8.8 4.8 20.7 13.1 8.1 3.2 1.7 2.0 12.7 9.8 2.0 0.3 47.0 21.1 2.5 1.6 22.7 2.4Luxembourg 2.5 0.9 6.7 1.3 6.4 3.4 22.0 14.4 14.4 5.9 0.0 0.0 10.8 8.7 1.8 0.0 50.3 21.4 2.3 1.3 19.9 3.6The Netherlands 3.8 1.6 12.6 3.6 7.6 4.2 25.5 17.8 4.0 1.8 1.4 1.5 11.6 9.3 1.5 0.4 59.6 35.6 4.5 3.4 26.0 2.1Switzerland 6.0 1.8 6.6 1.6 5.1 3.1 20.3 10.1 10.0 2.7 1.4 1.9 9.6 8.5 1.9 0.3 38.1 22.6 4.9 2.4 19.8 1.6
Corpus Ovary Prostate Testis Kidney Bladder Brain Thyroid Hodgkin NHL Multiplemyeloma
Leukaemia All sites
C54 C56 C61 C62 C64–66 C67 C70–72 C73 C81 C82–85,C96
C88 + C90 C91–95 C00–96/C44
F F M M M F M F M F M F M F M F M F M F M F
Europe 3.9 7.6 19.3 0.4 7.2 2.8 8.5 1.8 6.0 4.0 0.5 0.7 0.6 0.4 4.6 2.7 2.7 1.8 6.7 3.9 222.5 128.8
EU-27 3.3 7.4 18.9 0.3 6.7 2.7 8.4 2.0 6.0 4.0 0.4 0.5 0.5 0.3 4.9 3.0 3.0 2.1 6.7 4.0 211.8 128.4
Central and Eastern Europe 4.9 8.3 18.9 0.6 8.4 3.0 9.7 1.4 6.0 4.1 0.6 0.9 0.9 0.5 3.6 2.1 1.7 1.3 6.2 3.7 253.8 130.6Belarus 5.3 7.5 20.7 0.9 9.6 3.4 7.8 0.8 5.3 3.3 0.5 0.7 1.2 0.6 3.6 2.0 2.2 1.8 8.7 4.7 268.9 111.9Bulgaria 5.5 8.0 17.2 1.0 7.2 2.5 9.3 1.7 8.4 5.4 0.5 0.4 1.0 0.4 4.2 2.9 1.2 0.9 4.9 3.4 231.7 126.3Czech Republic 4.0 9.0 20.5 0.5 10.9 4.7 8.3 2.5 5.7 4.0 0.5 0.5 0.4 0.2 4.4 2.7 2.4 2.0 6.7 4.3 241.3 142.4Hungary 2.3 8.1 17.9 1.0 8.0 2.6 9.9 2.9 4.5 3.1 0.6 0.6 0.4 0.2 4.6 2.9 1.7 1.2 7.8 4.6 306.3 163.6Moldova 4.1 5.6 15.6 0.6 4.6 1.7 8.6 1.3 4.8 3.2 0.5 0.6 1.0 0.5 4.2 2.7 1.1 0.9 3.9 2.9 231.9 123.4Poland 4.5 10.2 20.8 0.6 8.5 3.4 12.8 2.1 7.6 5.8 0.4 0.6 0.6 0.4 4.2 2.6 2.8 2.2 7.3 4.1 264.9 146.5Romania 2.4 7.0 16.3 0.5 5.2 1.9 10.0 1.6 7.7 5.2 0.5 0.7 0.5 0.4 3.5 2.2 1.5 1.1 5.9 3.5 252.9 126.7Russian Federation 5.2 8.1 19.9 0.6 9.0 3.2 9.2 1.2 5.5 3.8 0.8 1.3 1.0 0.6 3.5 2.0 1.5 1.2 5.7 3.6 258.2 130.5Slovakia 5.4 8.0 22.3 0.6 9.1 4.1 7.6 1.8 7.3 4.9 0.4 0.5 0.7 0.3 4.3 2.7 2.1 2.0 7.3 4.3 261.4 137.5Ukraine 5.8 7.9 15.7 0.6 7.9 2.5 9.0 0.8 5.2 3.3 0.5 0.7 1.1 0.8 3.0 1.6 1.1 0.7 6.1 3.5 228.1 115.9
Northern Europe 3.5 8.7 25.2 0.2 6.3 3.0 7.4 2.5 6.3 4.0 0.4 0.4 0.4 0.3 5.3 3.4 3.6 2.3 6.2 3.7 195.9 141.9Denmark 3.7 9.5 33.7 0.4 6.1 2.9 9.8 3.8 6.6 4.7 0.4 0.4 0.5 0.2 4.7 3.7 3.8 2.0 6.5 4.3 222.3 167.6Estonia 2.9 7.5 32.8 0.4 9.0 3.5 9.5 1.3 7.2 5.3 0.4 0.8 0.5 0.2 2.5 1.7 3.1 2.1 8.7 4.4 243.4 109.0Finland 3.5 7.2 21.1 0.1 4.9 2.8 5.3 1.2 5.1 3.8 0.4 0.4 0.4 0.2 5.5 3.8 3.8 2.4 5.4 2.8 163.5 109.2Iceland 2.0 5.3 26.8 0.0 7.2 3.1 8.0 1.1 6.5 5.4 1.1 0.6 0.0 0.4 4.3 1.7 3.2 2.1 5.9 2.4 161.1 121.4Ireland 3.7 10.2 22.1 0.2 6.5 3.0 5.6 2.1 6.9 4.6 0.4 0.3 0.5 0.3 5.8 3.8 3.9 2.4 7.1 3.8 193.1 145.6Latvia 7.1 12.4 30.2 0.5 10.9 4.6 13.2 1.5 8.0 5.7 0.4 0.9 0.8 0.7 5.0 3.4 2.7 2.0 6.4 4.2 276.5 139.1Lithuania 4.8 11.9 36.1 0.3 12.6 3.8 11.0 1.6 7.3 5.5 0.6 0.6 0.5 0.3 4.8 2.5 3.2 2.2 8.2 5.1 291.1 129.7Norway 2.9 9.4 32.0 0.4 6.0 2.0 7.1 2.3 6.5 4.3 0.5 0.5 0.2 0.1 5.3 3.3 4.5 2.8 5.6 3.5 182.0 134.3Sweden 3.2 8.2 31.6 0.2 5.5 2.8 6.5 2.1 6.4 4.3 0.4 0.5 0.2 0.2 4.5 2.8 3.8 2.6 5.9 3.9 162.0 129.9United Kingdom 3.3 8.4 22.8 0.2 6.2 3.1 7.3 2.8 6.2 3.7 0.3 0.4 0.5 0.4 5.6 3.6 3.6 2.3 6.2 3.6 196.9 147.5
Southern Europe 3.3 6.4 16.2 0.3 5.5 2.0 9.9 1.8 6.3 4.2 0.4 0.5 0.6 0.4 4.8 2.8 2.8 2.1 7.0 4.1 212.0 118.0Albania 3.0 2.0 13.4 0.5 5.4 2.6 9.2 2.7 12.3 7.8 0.4 0.4 0.9 0.2 0.9 0.5 0.3 0.4 5.3 4.4 193.4 138.1Bosnia Herzegovina 3.5 5.9 15.1 0.8 3.4 1.4 7.5 1.9 5.0 3.6 0.2 0.9 0.8 0.3 2.8 1.2 0.7 0.6 2.6 2.2 188.7 104.0Croatia 4.5 9.3 26.0 0.8 9.7 2.8 9.7 2.0 8.1 5.8 0.5 0.5 0.5 0.3 5.2 3.7 2.1 2.1 6.9 4.4 287.5 143.1Cyprus 3.1 5.8 17.9 0.3 1.8 1.1 6.7 1.2 4.0 3.0 0.7 0.6 0.4 0.3 4.7 3.1 3.0 1.9 6.7 3.6 148.7 96.2Greece 2.6 6.2 17.7 0.4 4.7 1.8 9.8 1.6 8.2 5.9 0.4 0.4 1.5 0.9 1.7 1.0 2.2 1.6 9.2 5.3 203.6 107.4Italy 3.2 6.8 14.1 0.2 5.9 2.1 8.7 1.5 5.8 3.6 0.5 0.5 0.6 0.3 5.7 3.3 3.2 2.4 7.5 4.3 200.1 122.4
(continued on next page)
J.
Ferla
yet
al./E
uro
pea
nJ
ou
rna
lo
fC
an
cer4
9(
20
13
)1
37
4–
14
03
1387
Tab
le6b
(co
nti
nu
ed)
Co
rpu
sO
vary
Pro
stat
eT
esti
sK
idn
eyB
lad
der
Bra
inT
hyr
oid
Ho
dgk
inN
HL
Mu
ltip
lem
yelo
ma
Leu
kae
mia
All
site
s
C54
C56
C61
C62
C64
–66
C67
C70
–72
C73
C81
C82
–85
,C96
C88
+C
90C
91–9
5C
00–9
6/C
44
FF
MM
MF
MF
MF
MF
MF
MF
MF
MF
MF
FY
RM
aced
on
ia8.
27.
623
.50.
93.
01.
912
.01.
79.
95.
30.
30.
40.
70.
52.
71.
21.
10.
66.
33.
327
1.4
153.
7M
alta
4.8
10.3
13.6
0.0
6.5
3.0
7.3
8.1
4.8
2.4
0.0
0.2
0.0
0.0
7.4
3.7
2.4
2.1
6.2
2.2
173.
411
5.7
Mo
nte
neg
ro4
.27
.72
2.1
0.0
5.0
2.2
9.5
2.8
7.6
5.3
0.0
0.8
0.0
0.0
4.2
2.2
1.6
1.1
5.7
3.9
24
8.6
15
1.3
Po
rtu
gal
3.1
4.4
19.0
0.3
3.3
1.3
8.4
1.6
5.8
4.4
0.5
0.6
0.5
0.3
5.4
3.3
2.4
1.9
5.6
3.8
202.
010
3.5
Ser
bia
4.4
8.6
22.6
0.7
6.1
2.5
8.7
2.3
9.4
6.7
0.4
0.7
0.9
0.6
4.7
3.2
2.4
1.6
8.0
4.8
272.
216
4.9
Slo
ven
ia3.
99.
332
.50.
59.
03.
310
.82.
97.
23.
70.
60.
30.
50.
16.
44.
03.
92.
68.
14.
125
9.1
142.
8S
pai
n2.
95.
315
.20.
25.
01.
912
.51.
95.
33.
60.
30.
40.
40.
34.
12.
52.
61.
85.
83.
320
7.8
99.5
Wes
tern
Eu
rop
e3.
07.
018
.70.
37.
12.
86.
61.
95.
53.
60.
40.
40.
40.
25.
03.
03.
12.
16.
74.
120
1.2
125.
5A
ust
ria
3.0
6.9
18.1
0.5
5.6
2.7
5.5
1.8
5.0
3.5
0.5
0.5
0.4
0.1
5.3
3.5
2.9
2.0
7.3
4.4
199.
412
6.4
Bel
giu
m3.
48.
122
.70.
26.
12.
79.
22.
25.
13.
60.
40.
50.
60.
35.
03.
23.
22.
27.
64.
523
4.1
132.
7F
ran
ce3.
76.
417
.70.
36.
92.
28.
21.
65.
33.
10.
40.
40.
50.
35.
43.
13.
22.
27.
44.
221
8.3
118.
1G
erm
any
2.5
7.0
17.8
0.3
7.3
3.2
5.2
1.9
5.6
3.8
0.4
0.4
0.3
0.2
4.6
2.9
3.0
2.0
6.2
4.0
187.
112
5.7
Lu
xem
bo
urg
8.1
7.6
18.4
0.0
2.6
0.7
5.7
1.8
7.1
3.5
0.3
0.0
0.0
0.0
4.7
2.6
2.3
2.0
7.4
4.7
184.
712
4.8
Th
eN
eth
erla
nd
s3.
18.
223
.70.
39.
03.
87.
82.
86.
24.
10.
30.
50.
50.
35.
13.
43.
22.
06.
44.
121
3.5
153.
2S
wit
zerl
and
3.3
7.1
21.8
0.4
5.6
2.3
6.0
2.0
5.9
4.0
0.5
0.7
0.4
0.2
4.5
3.3
3.2
2.3
6.3
3.3
174.
511
5.1
Co
un
trie
sfo
rw
hic
hn
od
ata
wer
eav
aila
ble
are
init
alic
s.
1388 J. Ferlay et al. / European Journal of Cancer 49 (2013) 1374–1403
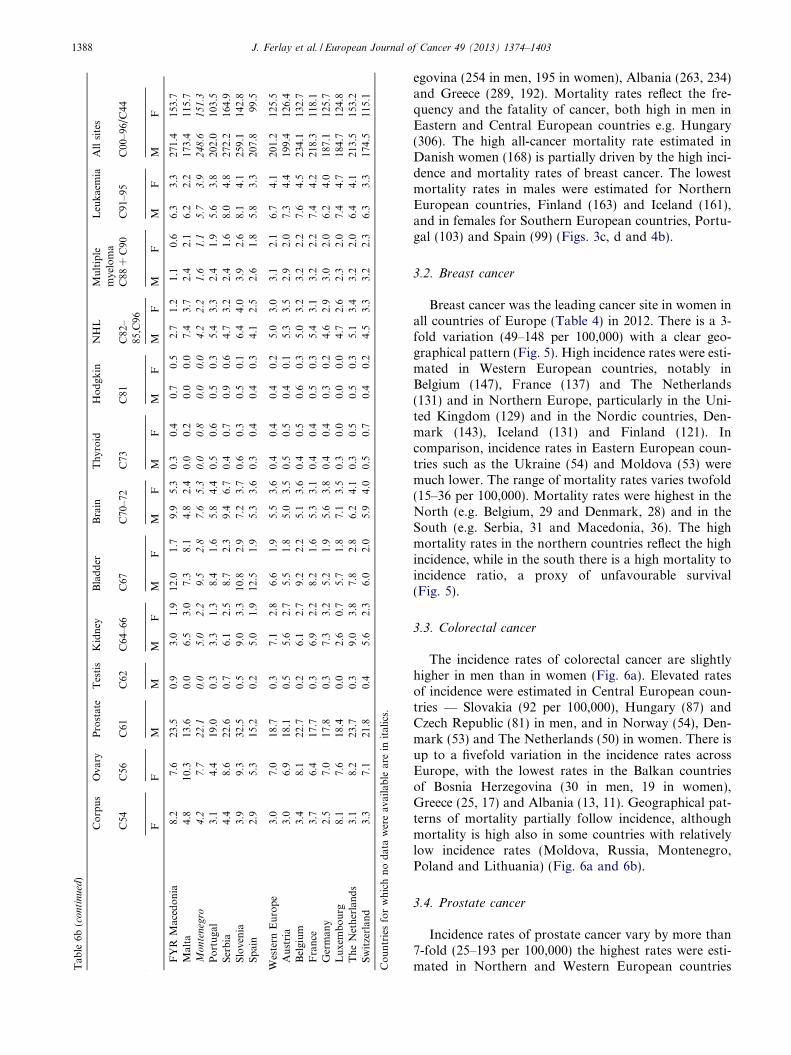
egovina (254 in men, 195 in women), Albania (263, 234)and Greece (289, 192). Mortality rates reflect the fre-quency and the fatality of cancer, both high in men inEastern and Central European countries e.g. Hungary(306). The high all-cancer mortality rate estimated inDanish women (168) is partially driven by the high inci-dence and mortality rates of breast cancer. The lowestmortality rates in males were estimated for NorthernEuropean countries, Finland (163) and Iceland (161),and in females for Southern European countries, Portu-gal (103) and Spain (99) (Figs. 3c, d and 4b).
3.2. Breast cancer
Breast cancer was the leading cancer site in women inall countries of Europe (Table 4) in 2012. There is a 3-fold variation (49–148 per 100,000) with a clear geo-graphical pattern (Fig. 5). High incidence rates were esti-mated in Western European countries, notably inBelgium (147), France (137) and The Netherlands(131) and in Northern Europe, particularly in the Uni-ted Kingdom (129) and in the Nordic countries, Den-mark (143), Iceland (131) and Finland (121). Incomparison, incidence rates in Eastern European coun-tries such as the Ukraine (54) and Moldova (53) weremuch lower. The range of mortality rates varies twofold(15–36 per 100,000). Mortality rates were highest in theNorth (e.g. Belgium, 29 and Denmark, 28) and in theSouth (e.g. Serbia, 31 and Macedonia, 36). The highmortality rates in the northern countries reflect the highincidence, while in the south there is a high mortality toincidence ratio, a proxy of unfavourable survival(Fig. 5).
3.3. Colorectal cancer
The incidence rates of colorectal cancer are slightlyhigher in men than in women (Fig. 6a). Elevated ratesof incidence were estimated in Central European coun-tries — Slovakia (92 per 100,000), Hungary (87) andCzech Republic (81) in men, and in Norway (54), Den-mark (53) and The Netherlands (50) in women. There isup to a fivefold variation in the incidence rates acrossEurope, with the lowest rates in the Balkan countriesof Bosnia Herzegovina (30 in men, 19 in women),Greece (25, 17) and Albania (13, 11). Geographical pat-terns of mortality partially follow incidence, althoughmortality is high also in some countries with relativelylow incidence rates (Moldova, Russia, Montenegro,Poland and Lithuania) (Fig. 6a and 6b).
3.4. Prostate cancer
Incidence rates of prostate cancer vary by more than7-fold (25–193 per 100,000) the highest rates were esti-mated in Northern and Western European countries
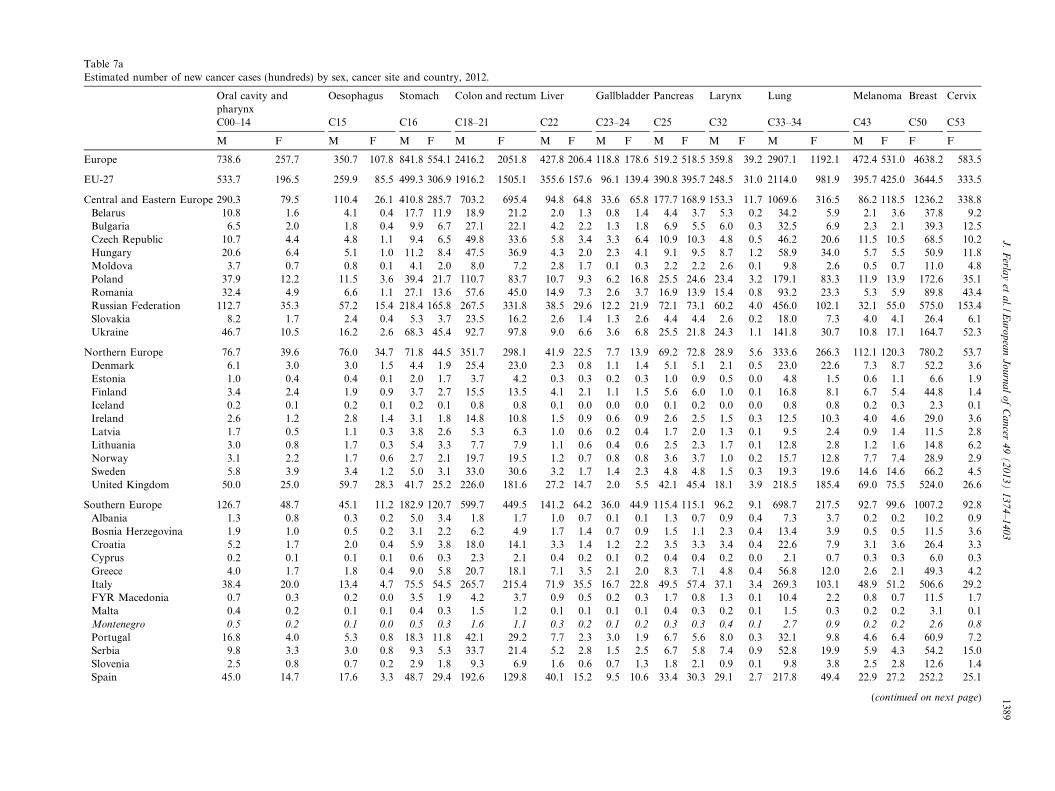
Table 7aEstimated number of new cancer cases (hundreds) by sex, cancer site and country, 2012.
Oral cavity andpharynx
Oesophagus Stomach Colon and rectum Liver Gallbladder Pancreas Larynx Lung Melanoma Breast Cervix
C00–14 C15 C16 C18–21 C22 C23–24 C25 C32 C33–34 C43 C50 C53
M F M F M F M F M F M F M F M F M F M F F F
Europe 738.6 257.7 350.7 107.8 841.8 554.1 2416.2 2051.8 427.8 206.4 118.8 178.6 519.2 518.5 359.8 39.2 2907.1 1192.1 472.4 531.0 4638.2 583.5
EU-27 533.7 196.5 259.9 85.5 499.3 306.9 1916.2 1505.1 355.6 157.6 96.1 139.4 390.8 395.7 248.5 31.0 2114.0 981.9 395.7 425.0 3644.5 333.5
Central and Eastern Europe 290.3 79.5 110.4 26.1 410.8 285.7 703.2 695.4 94.8 64.8 33.6 65.8 177.7 168.9 153.3 11.7 1069.6 316.5 86.2 118.5 1236.2 338.8Belarus 10.8 1.6 4.1 0.4 17.7 11.9 18.9 21.2 2.0 1.3 0.8 1.4 4.4 3.7 5.3 0.2 34.2 5.9 2.1 3.6 37.8 9.2Bulgaria 6.5 2.0 1.8 0.4 9.9 6.7 27.1 22.1 4.2 2.2 1.3 1.8 6.9 5.5 6.0 0.3 32.5 6.9 2.3 2.1 39.3 12.5Czech Republic 10.7 4.4 4.8 1.1 9.4 6.5 49.8 33.6 5.8 3.4 3.3 6.4 10.9 10.3 4.8 0.5 46.2 20.6 11.5 10.5 68.5 10.2Hungary 20.6 6.4 5.1 1.0 11.2 8.4 47.5 36.9 4.3 2.0 2.3 4.1 9.1 9.5 8.7 1.2 58.9 34.0 5.7 5.5 50.9 11.8Moldova 3.7 0.7 0.8 0.1 4.1 2.0 8.0 7.2 2.8 1.7 0.1 0.3 2.2 2.2 2.6 0.1 9.8 2.6 0.5 0.7 11.0 4.8Poland 37.9 12.2 11.5 3.6 39.4 21.7 110.7 83.7 10.7 9.3 6.2 16.8 25.5 24.6 23.4 3.2 179.1 83.3 11.9 13.9 172.6 35.1Romania 32.4 4.9 6.6 1.1 27.1 13.6 57.6 45.0 14.9 7.3 2.6 3.7 16.9 13.9 15.4 0.8 93.2 23.3 5.3 5.9 89.8 43.4Russian Federation 112.7 35.3 57.2 15.4 218.4 165.8 267.5 331.8 38.5 29.6 12.2 21.9 72.1 73.1 60.2 4.0 456.0 102.1 32.1 55.0 575.0 153.4Slovakia 8.2 1.7 2.4 0.4 5.3 3.7 23.5 16.2 2.6 1.4 1.3 2.6 4.4 4.4 2.6 0.2 18.0 7.3 4.0 4.1 26.4 6.1Ukraine 46.7 10.5 16.2 2.6 68.3 45.4 92.7 97.8 9.0 6.6 3.6 6.8 25.5 21.8 24.3 1.1 141.8 30.7 10.8 17.1 164.7 52.3
Northern Europe 76.7 39.6 76.0 34.7 71.8 44.5 351.7 298.1 41.9 22.5 7.7 13.9 69.2 72.8 28.9 5.6 333.6 266.3 112.1 120.3 780.2 53.7Denmark 6.1 3.0 3.0 1.5 4.4 1.9 25.4 23.0 2.3 0.8 1.1 1.4 5.1 5.1 2.1 0.5 23.0 22.6 7.3 8.7 52.2 3.6Estonia 1.0 0.4 0.4 0.1 2.0 1.7 3.7 4.2 0.3 0.3 0.2 0.3 1.0 0.9 0.5 0.0 4.8 1.5 0.6 1.1 6.6 1.9Finland 3.4 2.4 1.9 0.9 3.7 2.7 15.5 13.5 4.1 2.1 1.1 1.5 5.6 6.0 1.0 0.1 16.8 8.1 6.7 5.4 44.8 1.4Iceland 0.2 0.1 0.2 0.1 0.2 0.1 0.8 0.8 0.1 0.0 0.0 0.0 0.1 0.2 0.0 0.0 0.8 0.8 0.2 0.3 2.3 0.1Ireland 2.6 1.2 2.8 1.4 3.1 1.8 14.8 10.8 1.5 0.9 0.6 0.9 2.6 2.5 1.5 0.3 12.5 10.3 4.0 4.6 29.0 3.6Latvia 1.7 0.5 1.1 0.3 3.8 2.6 5.3 6.3 1.0 0.6 0.2 0.4 1.7 2.0 1.3 0.1 9.5 2.4 0.9 1.4 11.5 2.8Lithuania 3.0 0.8 1.7 0.3 5.4 3.3 7.7 7.9 1.1 0.6 0.4 0.6 2.5 2.3 1.7 0.1 12.8 2.8 1.2 1.6 14.8 6.2Norway 3.1 2.2 1.7 0.6 2.7 2.1 19.7 19.5 1.2 0.7 0.8 0.8 3.6 3.7 1.0 0.2 15.7 12.8 7.7 7.4 28.9 2.9Sweden 5.8 3.9 3.4 1.2 5.0 3.1 33.0 30.6 3.2 1.7 1.4 2.3 4.8 4.8 1.5 0.3 19.3 19.6 14.6 14.6 66.2 4.5United Kingdom 50.0 25.0 59.7 28.3 41.7 25.2 226.0 181.6 27.2 14.7 2.0 5.5 42.1 45.4 18.1 3.9 218.5 185.4 69.0 75.5 524.0 26.6
Southern Europe 126.7 48.7 45.1 11.2 182.9 120.7 599.7 449.5 141.2 64.2 36.0 44.9 115.4 115.1 96.2 9.1 698.7 217.5 92.7 99.6 1007.2 92.8Albania 1.3 0.8 0.3 0.2 5.0 3.4 1.8 1.7 1.0 0.7 0.1 0.1 1.3 0.7 0.9 0.4 7.3 3.7 0.2 0.2 10.2 0.9Bosnia Herzegovina 1.9 1.0 0.5 0.2 3.1 2.2 6.2 4.9 1.7 1.4 0.7 0.9 1.5 1.1 2.3 0.4 13.4 3.9 0.5 0.5 11.5 3.6Croatia 5.2 1.7 2.0 0.4 5.9 3.8 18.0 14.1 3.3 1.4 1.2 2.2 3.5 3.3 3.4 0.4 22.6 7.9 3.1 3.6 26.4 3.3Cyprus 0.2 0.1 0.1 0.1 0.6 0.3 2.3 2.1 0.4 0.2 0.1 0.2 0.4 0.4 0.2 0.0 2.1 0.7 0.3 0.3 6.0 0.3Greece 4.0 1.7 1.8 0.4 9.0 5.8 20.7 18.1 7.1 3.5 2.1 2.0 8.3 7.1 4.8 0.4 56.8 12.0 2.6 2.1 49.3 4.2Italy 38.4 20.0 13.4 4.7 75.5 54.5 265.7 215.4 71.9 35.5 16.7 22.8 49.5 57.4 37.1 3.4 269.3 103.1 48.9 51.2 506.6 29.2FYR Macedonia 0.7 0.3 0.2 0.0 3.5 1.9 4.2 3.7 0.9 0.5 0.2 0.3 1.7 0.8 1.3 0.1 10.4 2.2 0.8 0.7 11.5 1.7Malta 0.4 0.2 0.1 0.1 0.4 0.3 1.5 1.2 0.1 0.1 0.1 0.1 0.4 0.3 0.2 0.1 1.5 0.3 0.2 0.2 3.1 0.1Montenegro 0.5 0.2 0.1 0.0 0.5 0.3 1.6 1.1 0.3 0.2 0.1 0.2 0.3 0.3 0.4 0.1 2.7 0.9 0.2 0.2 2.6 0.8
Portugal 16.8 4.0 5.3 0.8 18.3 11.8 42.1 29.2 7.7 2.3 3.0 1.9 6.7 5.6 8.0 0.3 32.1 9.8 4.6 6.4 60.9 7.2Serbia 9.8 3.3 3.0 0.8 9.3 5.3 33.7 21.4 5.2 2.8 1.5 2.5 6.7 5.8 7.4 0.9 52.8 19.9 5.9 4.3 54.2 15.0Slovenia 2.5 0.8 0.7 0.2 2.9 1.8 9.3 6.9 1.6 0.6 0.7 1.3 1.8 2.1 0.9 0.1 9.8 3.8 2.5 2.8 12.6 1.4Spain 45.0 14.7 17.6 3.3 48.7 29.4 192.6 129.8 40.1 15.2 9.5 10.6 33.4 30.3 29.1 2.7 217.8 49.4 22.9 27.2 252.2 25.1
(continued on next page)
J.
Ferla
yet
al./E
uro
pea
nJ
ou
rna
lo
fC
an
cer4
9(
20
13
)1
37
4–
14
03
1389
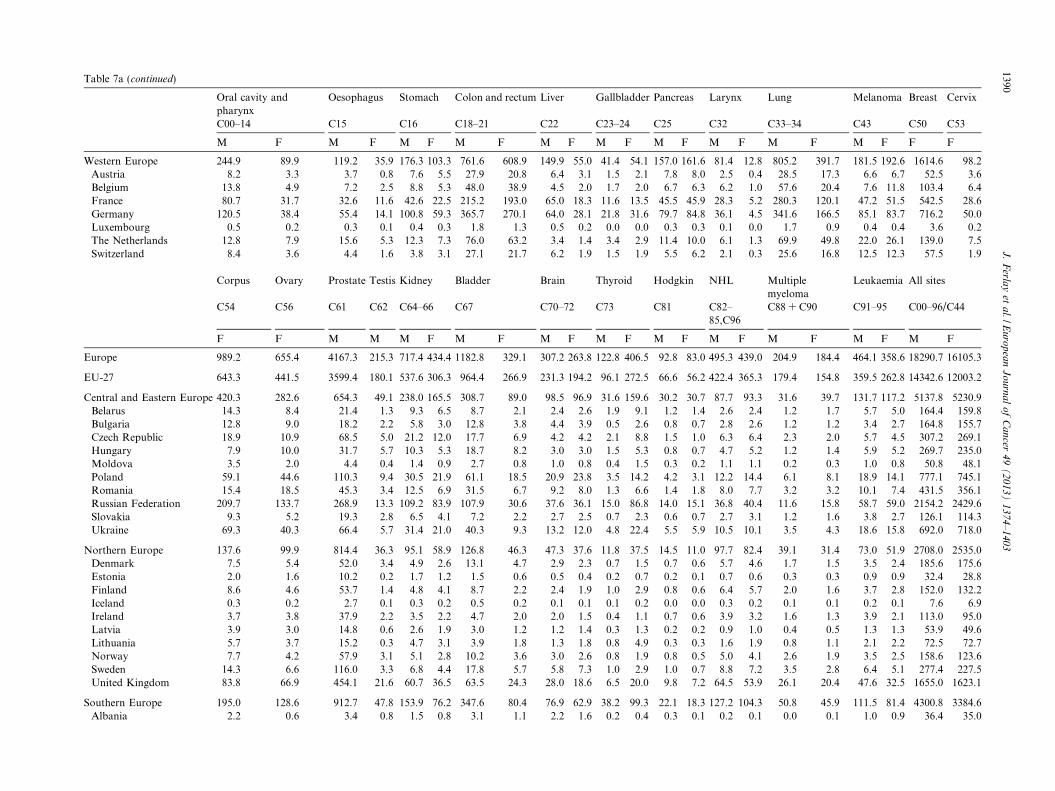
Table 7a (continued)
Oral cavity andpharynx
Oesophagus Stomach Colon and rectum Liver Gallbladder Pancreas Larynx Lung Melanoma Breast Cervix
C00–14 C15 C16 C18–21 C22 C23–24 C25 C32 C33–34 C43 C50 C53
M F M F M F M F M F M F M F M F M F M F F F
Western Europe 244.9 89.9 119.2 35.9 176.3 103.3 761.6 608.9 149.9 55.0 41.4 54.1 157.0 161.6 81.4 12.8 805.2 391.7 181.5 192.6 1614.6 98.2Austria 8.2 3.3 3.7 0.8 7.6 5.5 27.9 20.8 6.4 3.1 1.5 2.1 7.8 8.0 2.5 0.4 28.5 17.3 6.6 6.7 52.5 3.6Belgium 13.8 4.9 7.2 2.5 8.8 5.3 48.0 38.9 4.5 2.0 1.7 2.0 6.7 6.3 6.2 1.0 57.6 20.4 7.6 11.8 103.4 6.4France 80.7 31.7 32.6 11.6 42.6 22.5 215.2 193.0 65.0 18.3 11.6 13.5 45.5 45.9 28.3 5.2 280.3 120.1 47.2 51.5 542.5 28.6Germany 120.5 38.4 55.4 14.1 100.8 59.3 365.7 270.1 64.0 28.1 21.8 31.6 79.7 84.8 36.1 4.5 341.6 166.5 85.1 83.7 716.2 50.0Luxembourg 0.5 0.2 0.3 0.1 0.4 0.3 1.8 1.3 0.5 0.2 0.0 0.0 0.3 0.3 0.1 0.0 1.7 0.9 0.4 0.4 3.6 0.2The Netherlands 12.8 7.9 15.6 5.3 12.3 7.3 76.0 63.2 3.4 1.4 3.4 2.9 11.4 10.0 6.1 1.3 69.9 49.8 22.0 26.1 139.0 7.5Switzerland 8.4 3.6 4.4 1.6 3.8 3.1 27.1 21.7 6.2 1.9 1.5 1.9 5.5 6.2 2.1 0.3 25.6 16.8 12.5 12.3 57.5 1.9
Corpus Ovary Prostate Testis Kidney Bladder Brain Thyroid Hodgkin NHL Multiplemyeloma
Leukaemia All sites
C54 C56 C61 C62 C64–66 C67 C70–72 C73 C81 C82–85,C96
C88 + C90 C91–95 C00–96/C44
F F M M M F M F M F M F M F M F M F M F M F
Europe 989.2 655.4 4167.3 215.3 717.4 434.4 1182.8 329.1 307.2 263.8 122.8 406.5 92.8 83.0 495.3 439.0 204.9 184.4 464.1 358.6 18290.7 16105.3
EU-27 643.3 441.5 3599.4 180.1 537.6 306.3 964.4 266.9 231.3 194.2 96.1 272.5 66.6 56.2 422.4 365.3 179.4 154.8 359.5 262.8 14342.6 12003.2
Central and Eastern Europe 420.3 282.6 654.3 49.1 238.0 165.5 308.7 89.0 98.5 96.9 31.6 159.6 30.2 30.7 87.7 93.3 31.6 39.7 131.7 117.2 5137.8 5230.9Belarus 14.3 8.4 21.4 1.3 9.3 6.5 8.7 2.1 2.4 2.6 1.9 9.1 1.2 1.4 2.6 2.4 1.2 1.7 5.7 5.0 164.4 159.8Bulgaria 12.8 9.0 18.2 2.2 5.8 3.0 12.8 3.8 4.4 3.9 0.5 2.6 0.8 0.7 2.8 2.6 1.2 1.2 3.4 2.7 164.8 155.7Czech Republic 18.9 10.9 68.5 5.0 21.2 12.0 17.7 6.9 4.2 4.2 2.1 8.8 1.5 1.0 6.3 6.4 2.3 2.0 5.7 4.5 307.2 269.1Hungary 7.9 10.0 31.7 5.7 10.3 5.3 18.7 8.2 3.0 3.0 1.5 5.3 0.8 0.7 4.7 5.2 1.2 1.4 5.9 5.2 269.7 235.0Moldova 3.5 2.0 4.4 0.4 1.4 0.9 2.7 0.8 1.0 0.8 0.4 1.5 0.3 0.2 1.1 1.1 0.2 0.3 1.0 0.8 50.8 48.1Poland 59.1 44.6 110.3 9.4 30.5 21.9 61.1 18.5 20.9 23.8 3.5 14.2 4.2 3.1 12.2 14.4 6.1 8.1 18.9 14.1 777.1 745.1Romania 15.4 18.5 45.3 3.4 12.5 6.9 31.5 6.7 9.2 8.0 1.3 6.6 1.4 1.8 8.0 7.7 3.2 3.2 10.1 7.4 431.5 356.1Russian Federation 209.7 133.7 268.9 13.3 109.2 83.9 107.9 30.6 37.6 36.1 15.0 86.8 14.0 15.1 36.8 40.4 11.6 15.8 58.7 59.0 2154.2 2429.6Slovakia 9.3 5.2 19.3 2.8 6.5 4.1 7.2 2.2 2.7 2.5 0.7 2.3 0.6 0.7 2.7 3.1 1.2 1.6 3.8 2.7 126.1 114.3Ukraine 69.3 40.3 66.4 5.7 31.4 21.0 40.3 9.3 13.2 12.0 4.8 22.4 5.5 5.9 10.5 10.1 3.5 4.3 18.6 15.8 692.0 718.0
Northern Europe 137.6 99.9 814.4 36.3 95.1 58.9 126.8 46.3 47.3 37.6 11.8 37.5 14.5 11.0 97.7 82.4 39.1 31.4 73.0 51.9 2708.0 2535.0Denmark 7.5 5.4 52.0 3.4 4.9 2.6 13.1 4.7 2.9 2.3 0.7 1.5 0.7 0.6 5.7 4.6 1.7 1.5 3.5 2.4 185.6 175.6Estonia 2.0 1.6 10.2 0.2 1.7 1.2 1.5 0.6 0.5 0.4 0.2 0.7 0.2 0.1 0.7 0.6 0.3 0.3 0.9 0.9 32.4 28.8Finland 8.6 4.6 53.7 1.4 4.8 4.1 8.7 2.2 2.4 1.9 1.0 2.9 0.8 0.6 6.4 5.7 2.0 1.6 3.7 2.8 152.0 132.2Iceland 0.3 0.2 2.7 0.1 0.3 0.2 0.5 0.2 0.1 0.1 0.1 0.2 0.0 0.0 0.3 0.2 0.1 0.1 0.2 0.1 7.6 6.9Ireland 3.7 3.8 37.9 2.2 3.5 2.2 4.7 2.0 2.0 1.5 0.4 1.1 0.7 0.6 3.9 3.2 1.6 1.3 3.9 2.1 113.0 95.0Latvia 3.9 3.0 14.8 0.6 2.6 1.9 3.0 1.2 1.2 1.4 0.3 1.3 0.2 0.2 0.9 1.0 0.4 0.5 1.3 1.3 53.9 49.6Lithuania 5.7 3.7 15.2 0.3 4.7 3.1 3.9 1.8 1.3 1.8 0.8 4.9 0.3 0.3 1.6 1.9 0.8 1.1 2.1 2.2 72.5 72.7Norway 7.7 4.2 57.9 3.1 5.1 2.8 10.2 3.6 3.0 2.6 0.8 1.9 0.8 0.5 5.0 4.1 2.6 1.9 3.5 2.5 158.6 123.6Sweden 14.3 6.6 116.0 3.3 6.8 4.4 17.8 5.7 5.8 7.3 1.0 2.9 1.0 0.7 8.8 7.2 3.5 2.8 6.4 5.1 277.4 227.5United Kingdom 83.8 66.9 454.1 21.6 60.7 36.5 63.5 24.3 28.0 18.6 6.5 20.0 9.8 7.2 64.5 53.9 26.1 20.4 47.6 32.5 1655.0 1623.1
Southern Europe 195.0 128.6 912.7 47.8 153.9 76.2 347.6 80.4 76.9 62.9 38.2 99.3 22.1 18.3 127.2 104.3 50.8 45.9 111.5 81.4 4300.8 3384.6Albania 2.2 0.6 3.4 0.8 1.5 0.8 3.1 1.1 2.2 1.6 0.2 0.4 0.3 0.1 0.2 0.1 0.0 0.1 1.0 0.9 36.4 35.0
1390J
.F
erlay
eta
l./Eu
rop
ean
Jo
urn
al
of
Ca
ncer
49
(2
01
3)
13
74
–1
40
3
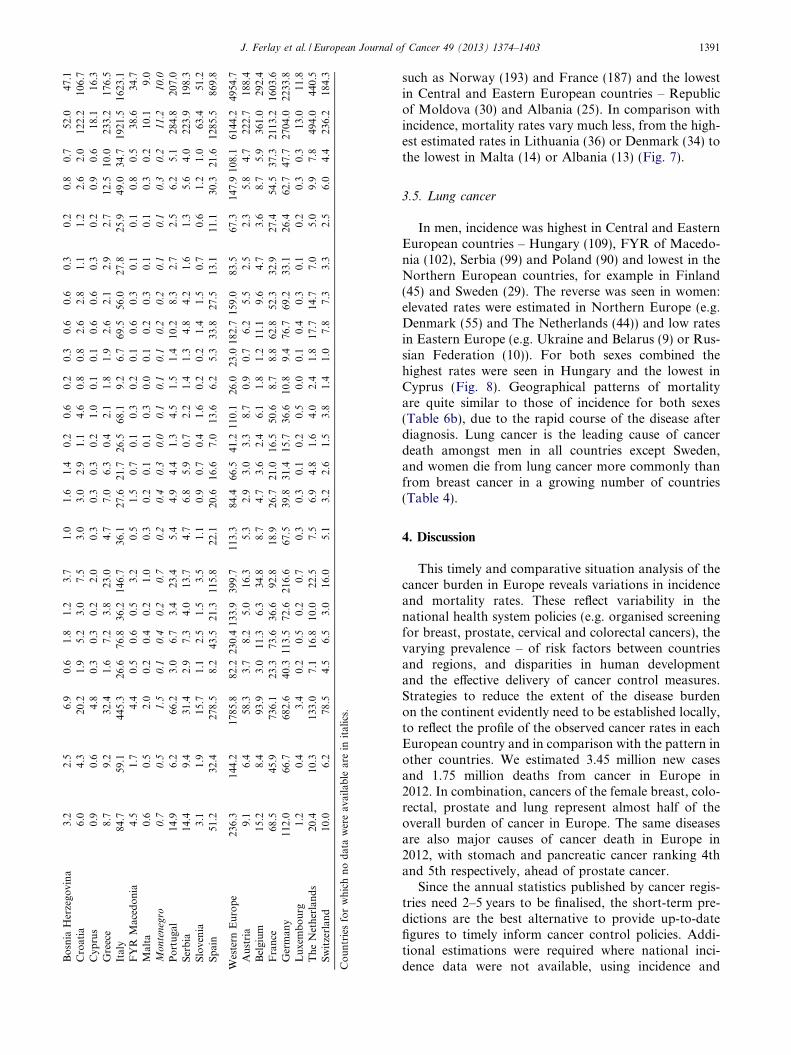
Bo
snia
Her
zego
vin
a3.
22.
56.
90.
61.
81.
23.
71.
01.
61.
40.
20.
60.
20.
30.
60.
60.
30.
20.
80.
752
.047
.1C
roat
ia6.
04.
320
.21.
95.
23.
07.
53.
03.
02.
91.
14.
60.
80.
82.
62.
81.
11.
22.
62.
012
2.2
106.
7C
ypru
s0.
90.
64.
80.
30.
30.
22.
00.
30.
30.
30.
21.
00.
10.
10.
60.
60.
30.
20.
90.
618
.116
.3G
reec
e8.
79.
232
.41.
67.
23.
823
.04.
77.
06.
30.
42.
11.
81.
92.
62.
12.
92.
712
.510
.023
3.2
176.
5It
aly
84.7
59.1
445.
326
.676
.836
.214
6.7
36.1
27.6
21.7
26.5
68.1
9.2
6.7
69.5
56.0
27.8
25.9
49.0
34.7
1921
.516
23.1
FY
RM
aced
on
ia4.
51.
74.
40.
50.
60.
53.
20.
51.
50.
70.
10.
30.
20.
10.
60.
30.
10.
10.
80.
538
.634
.7M
alta
0.6
0.5
2.0
0.2
0.4
0.2
1.0
0.3
0.2
0.1
0.1
0.3
0.0
0.1
0.2
0.3
0.1
0.1
0.3
0.2
10.1
9.0
Mo
nte
neg
ro0
.70
.51
.50
.10
.40
.20
.70
.20
.40
.30
.00
.10
.10
.10
.20
.20
.10
.10
.30
.21
1.2
10
.0
Po
rtu
gal
14.9
6.2
66.2
3.0
6.7
3.4
23.4
5.4
4.9
4.4
1.3
4.5
1.5
1.4
10.2
8.3
2.7
2.5
6.2
5.1
284.
820
7.0
Ser
bia
14.4
9.4
31.4
2.9
7.3
4.0
13.7
4.7
6.8
5.9
0.7
2.2
1.4
1.3
4.8
4.2
1.6
1.3
5.6
4.0
223.
919
8.3
Slo
ven
ia3.
11.
915
.71.
12.
51.
53.
51.
10.
90.
70.
41.
60.
20.
21.
41.
50.
70.
61.
21.
063
.451
.2S
pai
n51
.232
.427
8.5
8.2
43.5
21.3
115.
822
.120
.616
.67.
013
.66.
25.
333
.827
.513
.111
.130
.321
.612
85.5
869.
8
Wes
tern
Eu
rop
e23
6.3
144.
217
85.8
82.2
230.
413
3.9
399.
711
3.3
84.4
66.5
41.2
110.
126
.023
.018
2.7
159.
083
.567
.314
7.9
108.
161
44.2
4954
.7A
ust
ria
9.1
6.4
58.3
3.7
8.2
5.0
16.3
5.3
2.9
3.0
3.3
8.7
0.9
0.7
6.2
5.5
2.5
2.3
5.8
4.7
222.
718
8.4
Bel
giu
m15
.28.
493
.93.
011
.36.
334
.88.
74.
73.
62.
46.
11.
81.
211
.19.
64.
73.
68.
75.
936
1.0
292.
4F
ran
ce68
.545
.973
6.1
23.3
73.6
36.6
92.8
18.9
26.7
21.0
16.5
50.6
8.7
8.8
62.8
52.3
32.9
27.4
54.5
37.3
2113
.216
03.6
Ger
man
y11
2.0
66.7
682.
640
.311
3.5
72.6
216.
667
.539
.831
.415
.736
.610
.89.
476
.769
.233
.126
.462
.747
.727
04.0
2233
.8L
uxe
mb
ou
rg1.
20.
43.
40.
20.
50.
20.
70.
30.
30.
10.
20.
50.
00.
10.
40.
30.
10.
20.
30.
313
.011
.8T
he
Net
her
lan
ds
20.4
10.3
133.
07.
116
.810
.022
.57.
56.
94.
81.
64.
02.
41.
817
.714
.77.
05.
09.
97.
849
4.0
440.
5S
wit
zerl
and
10.0
6.2
78.5
4.5
6.5
3.0
16.0
5.1
3.2
2.6
1.5
3.8
1.4
1.0
7.8
7.3
3.3
2.5
6.0
4.4
236.
218
4.3
Co
un
trie
sfo
rw
hic
hn
od
ata
wer
eav
aila
ble
are
init
alic
s.
J. Ferlay et al. / European Journal of Cancer 49 (2013) 1374–1403 1391
such as Norway (193) and France (187) and the lowestin Central and Eastern European countries – Republicof Moldova (30) and Albania (25). In comparison withincidence, mortality rates vary much less, from the high-est estimated rates in Lithuania (36) or Denmark (34) tothe lowest in Malta (14) or Albania (13) (Fig. 7).
3.5. Lung cancer
In men, incidence was highest in Central and EasternEuropean countries – Hungary (109), FYR of Macedo-nia (102), Serbia (99) and Poland (90) and lowest in theNorthern European countries, for example in Finland(45) and Sweden (29). The reverse was seen in women:elevated rates were estimated in Northern Europe (e.g.Denmark (55) and The Netherlands (44)) and low ratesin Eastern Europe (e.g. Ukraine and Belarus (9) or Rus-sian Federation (10)). For both sexes combined thehighest rates were seen in Hungary and the lowest inCyprus (Fig. 8). Geographical patterns of mortalityare quite similar to those of incidence for both sexes(Table 6b), due to the rapid course of the disease afterdiagnosis. Lung cancer is the leading cause of cancerdeath amongst men in all countries except Sweden,and women die from lung cancer more commonly thanfrom breast cancer in a growing number of countries(Table 4).
4. Discussion
This timely and comparative situation analysis of thecancer burden in Europe reveals variations in incidenceand mortality rates. These reflect variability in thenational health system policies (e.g. organised screeningfor breast, prostate, cervical and colorectal cancers), thevarying prevalence – of risk factors between countriesand regions, and disparities in human developmentand the effective delivery of cancer control measures.Strategies to reduce the extent of the disease burdenon the continent evidently need to be established locally,to reflect the profile of the observed cancer rates in eachEuropean country and in comparison with the pattern inother countries. We estimated 3.45 million new casesand 1.75 million deaths from cancer in Europe in2012. In combination, cancers of the female breast, colo-rectal, prostate and lung represent almost half of theoverall burden of cancer in Europe. The same diseasesare also major causes of cancer death in Europe in2012, with stomach and pancreatic cancer ranking 4thand 5th respectively, ahead of prostate cancer.
Since the annual statistics published by cancer regis-tries need 2–5 years to be finalised, the short-term pre-dictions are the best alternative to provide up-to-datefigures to timely inform cancer control policies. Addi-tional estimations were required where national inci-dence data were not available, using incidence and
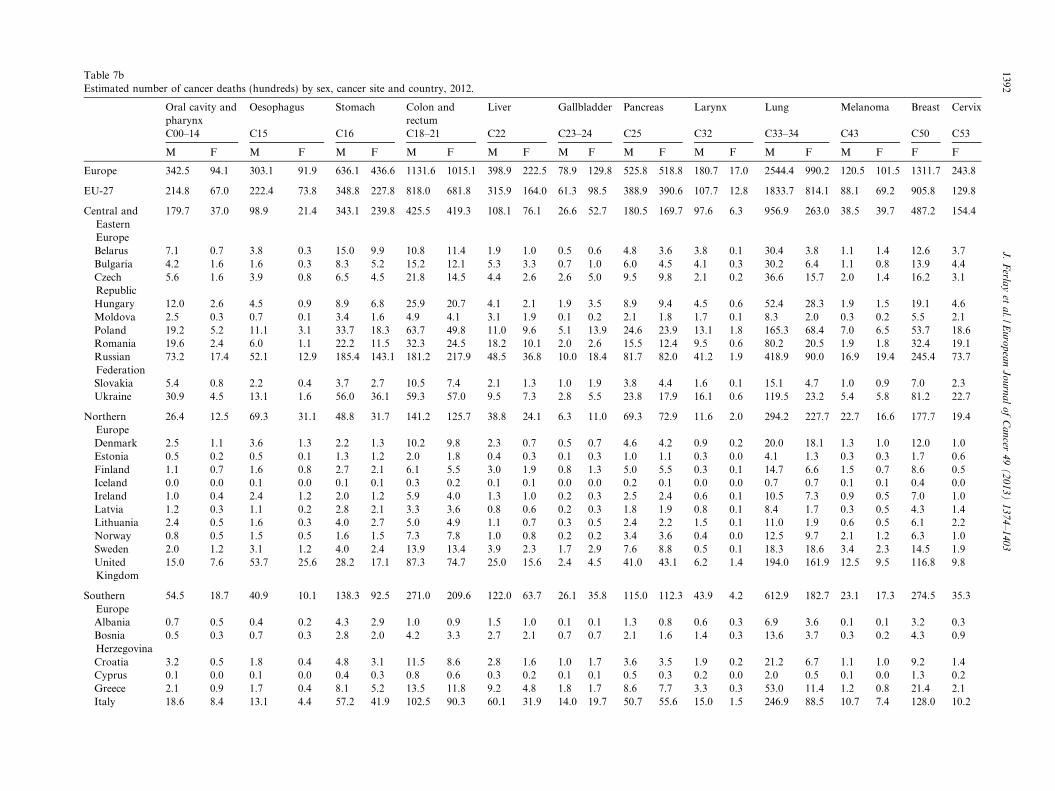
Table 7bEstimated number of cancer deaths (hundreds) by sex, cancer site and country, 2012.
Oral cavity andpharynx
Oesophagus Stomach Colon andrectum
Liver Gallbladder Pancreas Larynx Lung Melanoma Breast Cervix
C00–14 C15 C16 C18–21 C22 C23–24 C25 C32 C33–34 C43 C50 C53
M F M F M F M F M F M F M F M F M F M F F F
Europe 342.5 94.1 303.1 91.9 636.1 436.6 1131.6 1015.1 398.9 222.5 78.9 129.8 525.8 518.8 180.7 17.0 2544.4 990.2 120.5 101.5 1311.7 243.8
EU-27 214.8 67.0 222.4 73.8 348.8 227.8 818.0 681.8 315.9 164.0 61.3 98.5 388.9 390.6 107.7 12.8 1833.7 814.1 88.1 69.2 905.8 129.8
Central andEasternEurope
179.7 37.0 98.9 21.4 343.1 239.8 425.5 419.3 108.1 76.1 26.6 52.7 180.5 169.7 97.6 6.3 956.9 263.0 38.5 39.7 487.2 154.4
Belarus 7.1 0.7 3.8 0.3 15.0 9.9 10.8 11.4 1.9 1.0 0.5 0.6 4.8 3.6 3.8 0.1 30.4 3.8 1.1 1.4 12.6 3.7Bulgaria 4.2 1.6 1.6 0.3 8.3 5.2 15.2 12.1 5.3 3.3 0.7 1.0 6.0 4.5 4.1 0.3 30.2 6.4 1.1 0.8 13.9 4.4CzechRepublic
5.6 1.6 3.9 0.8 6.5 4.5 21.8 14.5 4.4 2.6 2.6 5.0 9.5 9.8 2.1 0.2 36.6 15.7 2.0 1.4 16.2 3.1
Hungary 12.0 2.6 4.5 0.9 8.9 6.8 25.9 20.7 4.1 2.1 1.9 3.5 8.9 9.4 4.5 0.6 52.4 28.3 1.9 1.5 19.1 4.6Moldova 2.5 0.3 0.7 0.1 3.4 1.6 4.9 4.1 3.1 1.9 0.1 0.2 2.1 1.8 1.7 0.1 8.3 2.0 0.3 0.2 5.5 2.1Poland 19.2 5.2 11.1 3.1 33.7 18.3 63.7 49.8 11.0 9.6 5.1 13.9 24.6 23.9 13.1 1.8 165.3 68.4 7.0 6.5 53.7 18.6Romania 19.6 2.4 6.0 1.1 22.2 11.5 32.3 24.5 18.2 10.1 2.0 2.6 15.5 12.4 9.5 0.6 80.2 20.5 1.9 1.8 32.4 19.1RussianFederation
73.2 17.4 52.1 12.9 185.4 143.1 181.2 217.9 48.5 36.8 10.0 18.4 81.7 82.0 41.2 1.9 418.9 90.0 16.9 19.4 245.4 73.7
Slovakia 5.4 0.8 2.2 0.4 3.7 2.7 10.5 7.4 2.1 1.3 1.0 1.9 3.8 4.4 1.6 0.1 15.1 4.7 1.0 0.9 7.0 2.3Ukraine 30.9 4.5 13.1 1.6 56.0 36.1 59.3 57.0 9.5 7.3 2.8 5.5 23.8 17.9 16.1 0.6 119.5 23.2 5.4 5.8 81.2 22.7
NorthernEurope
26.4 12.5 69.3 31.1 48.8 31.7 141.2 125.7 38.8 24.1 6.3 11.0 69.3 72.9 11.6 2.0 294.2 227.7 22.7 16.6 177.7 19.4
Denmark 2.5 1.1 3.6 1.3 2.2 1.3 10.2 9.8 2.3 0.7 0.5 0.7 4.6 4.2 0.9 0.2 20.0 18.1 1.3 1.0 12.0 1.0Estonia 0.5 0.2 0.5 0.1 1.3 1.2 2.0 1.8 0.4 0.3 0.1 0.3 1.0 1.1 0.3 0.0 4.1 1.3 0.3 0.3 1.7 0.6Finland 1.1 0.7 1.6 0.8 2.7 2.1 6.1 5.5 3.0 1.9 0.8 1.3 5.0 5.5 0.3 0.1 14.7 6.6 1.5 0.7 8.6 0.5Iceland 0.0 0.0 0.1 0.0 0.1 0.1 0.3 0.2 0.1 0.1 0.0 0.0 0.2 0.1 0.0 0.0 0.7 0.7 0.1 0.1 0.4 0.0Ireland 1.0 0.4 2.4 1.2 2.0 1.2 5.9 4.0 1.3 1.0 0.2 0.3 2.5 2.4 0.6 0.1 10.5 7.3 0.9 0.5 7.0 1.0Latvia 1.2 0.3 1.1 0.2 2.8 2.1 3.3 3.6 0.8 0.6 0.2 0.3 1.8 1.9 0.8 0.1 8.4 1.7 0.3 0.5 4.3 1.4Lithuania 2.4 0.5 1.6 0.3 4.0 2.7 5.0 4.9 1.1 0.7 0.3 0.5 2.4 2.2 1.5 0.1 11.0 1.9 0.6 0.5 6.1 2.2Norway 0.8 0.5 1.5 0.5 1.6 1.5 7.3 7.8 1.0 0.8 0.2 0.2 3.4 3.6 0.4 0.0 12.5 9.7 2.1 1.2 6.3 1.0Sweden 2.0 1.2 3.1 1.2 4.0 2.4 13.9 13.4 3.9 2.3 1.7 2.9 7.6 8.8 0.5 0.1 18.3 18.6 3.4 2.3 14.5 1.9UnitedKingdom
15.0 7.6 53.7 25.6 28.2 17.1 87.3 74.7 25.0 15.6 2.4 4.5 41.0 43.1 6.2 1.4 194.0 161.9 12.5 9.5 116.8 9.8
SouthernEurope
54.5 18.7 40.9 10.1 138.3 92.5 271.0 209.6 122.0 63.7 26.1 35.8 115.0 112.3 43.9 4.2 612.9 182.7 23.1 17.3 274.5 35.3
Albania 0.7 0.5 0.4 0.2 4.3 2.9 1.0 0.9 1.5 1.0 0.1 0.1 1.3 0.8 0.6 0.3 6.9 3.6 0.1 0.1 3.2 0.3BosniaHerzegovina
0.5 0.3 0.7 0.3 2.8 2.0 4.2 3.3 2.7 2.1 0.7 0.7 2.1 1.6 1.4 0.3 13.6 3.7 0.3 0.2 4.3 0.9
Croatia 3.2 0.5 1.8 0.4 4.8 3.1 11.5 8.6 2.8 1.6 1.0 1.7 3.6 3.5 1.9 0.2 21.2 6.7 1.1 1.0 9.2 1.4Cyprus 0.1 0.0 0.1 0.0 0.4 0.3 0.8 0.6 0.3 0.2 0.1 0.1 0.5 0.3 0.2 0.0 2.0 0.5 0.1 0.0 1.3 0.2Greece 2.1 0.9 1.7 0.4 8.1 5.2 13.5 11.8 9.2 4.8 1.8 1.7 8.6 7.7 3.3 0.3 53.0 11.4 1.2 0.8 21.4 2.1Italy 18.6 8.4 13.1 4.4 57.2 41.9 102.5 90.3 60.1 31.9 14.0 19.7 50.7 55.6 15.0 1.5 246.9 88.5 10.7 7.4 128.0 10.2
1392J
.F
erlay
eta
l./Eu
rop
ean
Jo
urn
al
of
Ca
ncer
49
(2
01
3)
13
74
–1
40
3
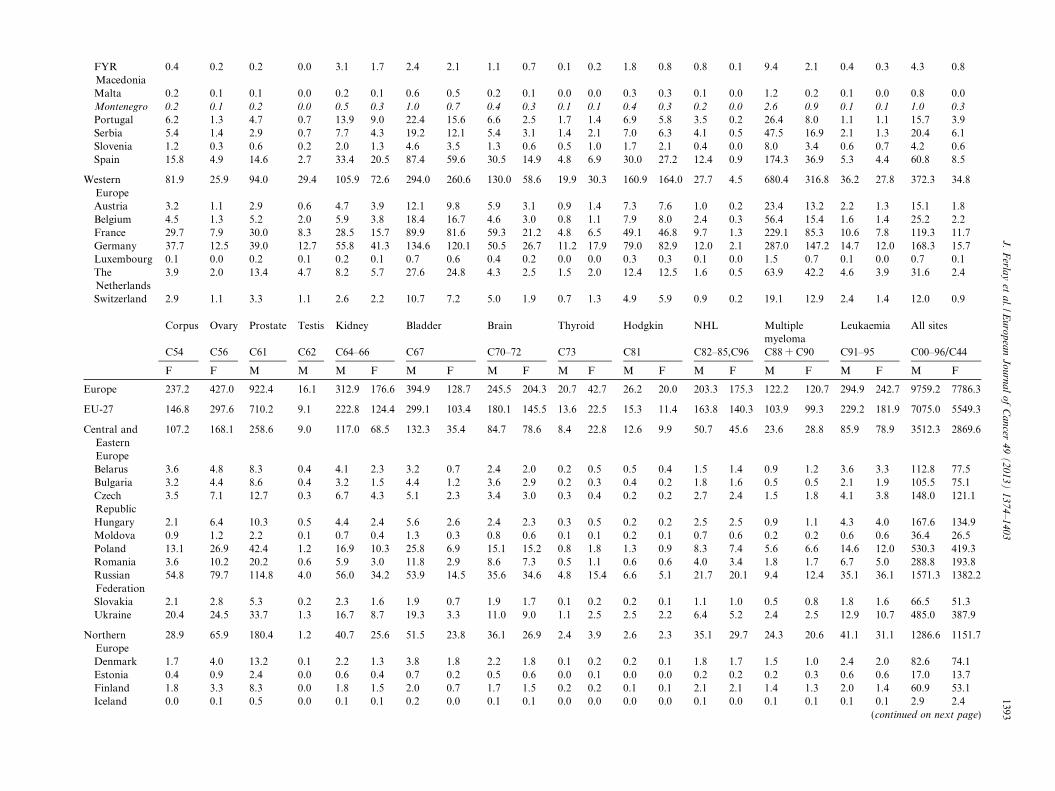
FYRMacedonia
0.4 0.2 0.2 0.0 3.1 1.7 2.4 2.1 1.1 0.7 0.1 0.2 1.8 0.8 0.8 0.1 9.4 2.1 0.4 0.3 4.3 0.8
Malta 0.2 0.1 0.1 0.0 0.2 0.1 0.6 0.5 0.2 0.1 0.0 0.0 0.3 0.3 0.1 0.0 1.2 0.2 0.1 0.0 0.8 0.0Montenegro 0.2 0.1 0.2 0.0 0.5 0.3 1.0 0.7 0.4 0.3 0.1 0.1 0.4 0.3 0.2 0.0 2.6 0.9 0.1 0.1 1.0 0.3
Portugal 6.2 1.3 4.7 0.7 13.9 9.0 22.4 15.6 6.6 2.5 1.7 1.4 6.9 5.8 3.5 0.2 26.4 8.0 1.1 1.1 15.7 3.9Serbia 5.4 1.4 2.9 0.7 7.7 4.3 19.2 12.1 5.4 3.1 1.4 2.1 7.0 6.3 4.1 0.5 47.5 16.9 2.1 1.3 20.4 6.1Slovenia 1.2 0.3 0.6 0.2 2.0 1.3 4.6 3.5 1.3 0.6 0.5 1.0 1.7 2.1 0.4 0.0 8.0 3.4 0.6 0.7 4.2 0.6Spain 15.8 4.9 14.6 2.7 33.4 20.5 87.4 59.6 30.5 14.9 4.8 6.9 30.0 27.2 12.4 0.9 174.3 36.9 5.3 4.4 60.8 8.5
WesternEurope
81.9 25.9 94.0 29.4 105.9 72.6 294.0 260.6 130.0 58.6 19.9 30.3 160.9 164.0 27.7 4.5 680.4 316.8 36.2 27.8 372.3 34.8
Austria 3.2 1.1 2.9 0.6 4.7 3.9 12.1 9.8 5.9 3.1 0.9 1.4 7.3 7.6 1.0 0.2 23.4 13.2 2.2 1.3 15.1 1.8Belgium 4.5 1.3 5.2 2.0 5.9 3.8 18.4 16.7 4.6 3.0 0.8 1.1 7.9 8.0 2.4 0.3 56.4 15.4 1.6 1.4 25.2 2.2France 29.7 7.9 30.0 8.3 28.5 15.7 89.9 81.6 59.3 21.2 4.8 6.5 49.1 46.8 9.7 1.3 229.1 85.3 10.6 7.8 119.3 11.7Germany 37.7 12.5 39.0 12.7 55.8 41.3 134.6 120.1 50.5 26.7 11.2 17.9 79.0 82.9 12.0 2.1 287.0 147.2 14.7 12.0 168.3 15.7Luxembourg 0.1 0.0 0.2 0.1 0.2 0.1 0.7 0.6 0.4 0.2 0.0 0.0 0.3 0.3 0.1 0.0 1.5 0.7 0.1 0.0 0.7 0.1TheNetherlands
3.9 2.0 13.4 4.7 8.2 5.7 27.6 24.8 4.3 2.5 1.5 2.0 12.4 12.5 1.6 0.5 63.9 42.2 4.6 3.9 31.6 2.4
Switzerland 2.9 1.1 3.3 1.1 2.6 2.2 10.7 7.2 5.0 1.9 0.7 1.3 4.9 5.9 0.9 0.2 19.1 12.9 2.4 1.4 12.0 0.9
Corpus Ovary Prostate Testis Kidney Bladder Brain Thyroid Hodgkin NHL Multiplemyeloma
Leukaemia All sites
C54 C56 C61 C62 C64–66 C67 C70–72 C73 C81 C82–85,C96 C88 + C90 C91–95 C00–96/C44
F F M M M F M F M F M F M F M F M F M F M F
Europe 237.2 427.0 922.4 16.1 312.9 176.6 394.9 128.7 245.5 204.3 20.7 42.7 26.2 20.0 203.3 175.3 122.2 120.7 294.9 242.7 9759.2 7786.3
EU-27 146.8 297.6 710.2 9.1 222.8 124.4 299.1 103.4 180.1 145.5 13.6 22.5 15.3 11.4 163.8 140.3 103.9 99.3 229.2 181.9 7075.0 5549.3
Central andEasternEurope
107.2 168.1 258.6 9.0 117.0 68.5 132.3 35.4 84.7 78.6 8.4 22.8 12.6 9.9 50.7 45.6 23.6 28.8 85.9 78.9 3512.3 2869.6
Belarus 3.6 4.8 8.3 0.4 4.1 2.3 3.2 0.7 2.4 2.0 0.2 0.5 0.5 0.4 1.5 1.4 0.9 1.2 3.6 3.3 112.8 77.5Bulgaria 3.2 4.4 8.6 0.4 3.2 1.5 4.4 1.2 3.6 2.9 0.2 0.3 0.4 0.2 1.8 1.6 0.5 0.5 2.1 1.9 105.5 75.1CzechRepublic
3.5 7.1 12.7 0.3 6.7 4.3 5.1 2.3 3.4 3.0 0.3 0.4 0.2 0.2 2.7 2.4 1.5 1.8 4.1 3.8 148.0 121.1
Hungary 2.1 6.4 10.3 0.5 4.4 2.4 5.6 2.6 2.4 2.3 0.3 0.5 0.2 0.2 2.5 2.5 0.9 1.1 4.3 4.0 167.6 134.9Moldova 0.9 1.2 2.2 0.1 0.7 0.4 1.3 0.3 0.8 0.6 0.1 0.1 0.2 0.1 0.7 0.6 0.2 0.2 0.6 0.6 36.4 26.5Poland 13.1 26.9 42.4 1.2 16.9 10.3 25.8 6.9 15.1 15.2 0.8 1.8 1.3 0.9 8.3 7.4 5.6 6.6 14.6 12.0 530.3 419.3Romania 3.6 10.2 20.2 0.6 5.9 3.0 11.8 2.9 8.6 7.3 0.5 1.1 0.6 0.6 4.0 3.4 1.8 1.7 6.7 5.0 288.8 193.8RussianFederation
54.8 79.7 114.8 4.0 56.0 34.2 53.9 14.5 35.6 34.6 4.8 15.4 6.6 5.1 21.7 20.1 9.4 12.4 35.1 36.1 1571.3 1382.2
Slovakia 2.1 2.8 5.3 0.2 2.3 1.6 1.9 0.7 1.9 1.7 0.1 0.2 0.2 0.1 1.1 1.0 0.5 0.8 1.8 1.6 66.5 51.3Ukraine 20.4 24.5 33.7 1.3 16.7 8.7 19.3 3.3 11.0 9.0 1.1 2.5 2.5 2.2 6.4 5.2 2.4 2.5 12.9 10.7 485.0 387.9
NorthernEurope
28.9 65.9 180.4 1.2 40.7 25.6 51.5 23.8 36.1 26.9 2.4 3.9 2.6 2.3 35.1 29.7 24.3 20.6 41.1 31.1 1286.6 1151.7
Denmark 1.7 4.0 13.2 0.1 2.2 1.3 3.8 1.8 2.2 1.8 0.1 0.2 0.2 0.1 1.8 1.7 1.5 1.0 2.4 2.0 82.6 74.1Estonia 0.4 0.9 2.4 0.0 0.6 0.4 0.7 0.2 0.5 0.6 0.0 0.1 0.0 0.0 0.2 0.2 0.2 0.3 0.6 0.6 17.0 13.7Finland 1.8 3.3 8.3 0.0 1.8 1.5 2.0 0.7 1.7 1.5 0.2 0.2 0.1 0.1 2.1 2.1 1.4 1.3 2.0 1.4 60.9 53.1Iceland 0.0 0.1 0.5 0.0 0.1 0.1 0.2 0.0 0.1 0.1 0.0 0.0 0.0 0.0 0.1 0.0 0.1 0.1 0.1 0.1 2.9 2.4
(continued on next page)
J.
Ferla
yet
al./E
uro
pea
nJ
ou
rna
lo
fC
an
cer4
9(
20
13
)1
37
4–
14
03
1393
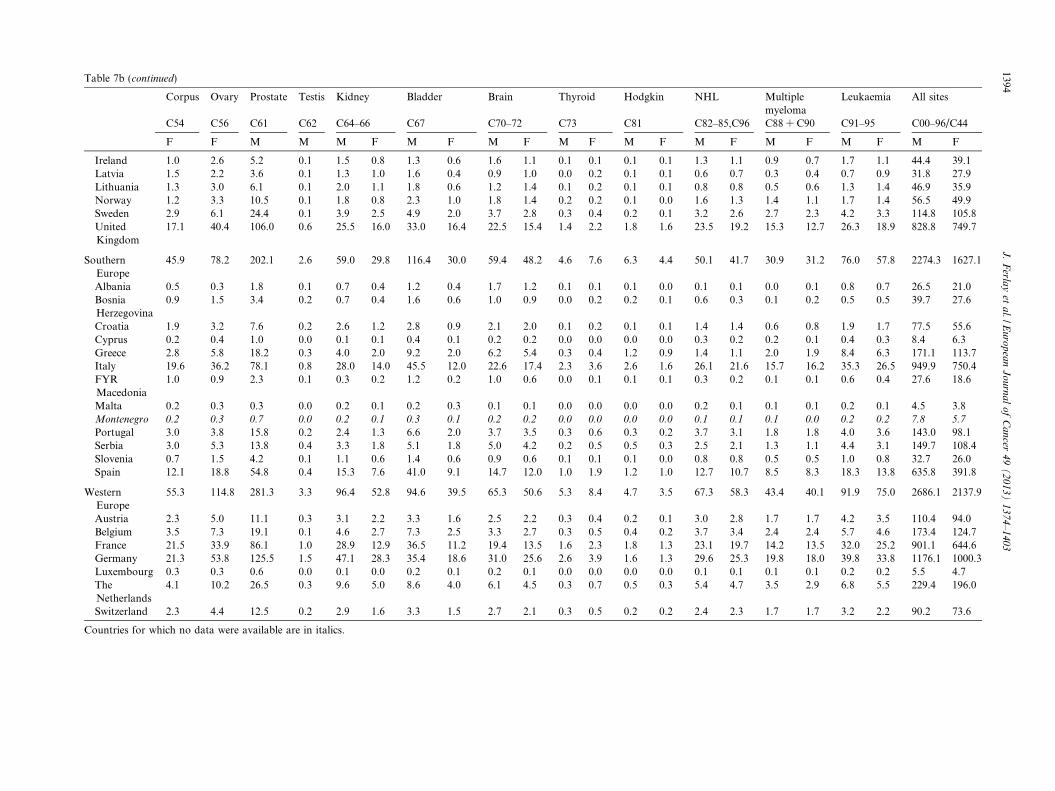
Table 7b (continued)
Corpus Ovary Prostate Testis Kidney Bladder Brain Thyroid Hodgkin NHL Multiplemyeloma
Leukaemia All sites
C54 C56 C61 C62 C64–66 C67 C70–72 C73 C81 C82–85,C96 C88 + C90 C91–95 C00–96/C44
F F M M M F M F M F M F M F M F M F M F M F
Ireland 1.0 2.6 5.2 0.1 1.5 0.8 1.3 0.6 1.6 1.1 0.1 0.1 0.1 0.1 1.3 1.1 0.9 0.7 1.7 1.1 44.4 39.1Latvia 1.5 2.2 3.6 0.1 1.3 1.0 1.6 0.4 0.9 1.0 0.0 0.2 0.1 0.1 0.6 0.7 0.3 0.4 0.7 0.9 31.8 27.9Lithuania 1.3 3.0 6.1 0.1 2.0 1.1 1.8 0.6 1.2 1.4 0.1 0.2 0.1 0.1 0.8 0.8 0.5 0.6 1.3 1.4 46.9 35.9Norway 1.2 3.3 10.5 0.1 1.8 0.8 2.3 1.0 1.8 1.4 0.2 0.2 0.1 0.0 1.6 1.3 1.4 1.1 1.7 1.4 56.5 49.9Sweden 2.9 6.1 24.4 0.1 3.9 2.5 4.9 2.0 3.7 2.8 0.3 0.4 0.2 0.1 3.2 2.6 2.7 2.3 4.2 3.3 114.8 105.8UnitedKingdom
17.1 40.4 106.0 0.6 25.5 16.0 33.0 16.4 22.5 15.4 1.4 2.2 1.8 1.6 23.5 19.2 15.3 12.7 26.3 18.9 828.8 749.7
SouthernEurope
45.9 78.2 202.1 2.6 59.0 29.8 116.4 30.0 59.4 48.2 4.6 7.6 6.3 4.4 50.1 41.7 30.9 31.2 76.0 57.8 2274.3 1627.1
Albania 0.5 0.3 1.8 0.1 0.7 0.4 1.2 0.4 1.7 1.2 0.1 0.1 0.1 0.0 0.1 0.1 0.0 0.1 0.8 0.7 26.5 21.0BosniaHerzegovina
0.9 1.5 3.4 0.2 0.7 0.4 1.6 0.6 1.0 0.9 0.0 0.2 0.2 0.1 0.6 0.3 0.1 0.2 0.5 0.5 39.7 27.6
Croatia 1.9 3.2 7.6 0.2 2.6 1.2 2.8 0.9 2.1 2.0 0.1 0.2 0.1 0.1 1.4 1.4 0.6 0.8 1.9 1.7 77.5 55.6Cyprus 0.2 0.4 1.0 0.0 0.1 0.1 0.4 0.1 0.2 0.2 0.0 0.0 0.0 0.0 0.3 0.2 0.2 0.1 0.4 0.3 8.4 6.3Greece 2.8 5.8 18.2 0.3 4.0 2.0 9.2 2.0 6.2 5.4 0.3 0.4 1.2 0.9 1.4 1.1 2.0 1.9 8.4 6.3 171.1 113.7Italy 19.6 36.2 78.1 0.8 28.0 14.0 45.5 12.0 22.6 17.4 2.3 3.6 2.6 1.6 26.1 21.6 15.7 16.2 35.3 26.5 949.9 750.4FYRMacedonia
1.0 0.9 2.3 0.1 0.3 0.2 1.2 0.2 1.0 0.6 0.0 0.1 0.1 0.1 0.3 0.2 0.1 0.1 0.6 0.4 27.6 18.6
Malta 0.2 0.3 0.3 0.0 0.2 0.1 0.2 0.3 0.1 0.1 0.0 0.0 0.0 0.0 0.2 0.1 0.1 0.1 0.2 0.1 4.5 3.8Montenegro 0.2 0.3 0.7 0.0 0.2 0.1 0.3 0.1 0.2 0.2 0.0 0.0 0.0 0.0 0.1 0.1 0.1 0.0 0.2 0.2 7.8 5.7
Portugal 3.0 3.8 15.8 0.2 2.4 1.3 6.6 2.0 3.7 3.5 0.3 0.6 0.3 0.2 3.7 3.1 1.8 1.8 4.0 3.6 143.0 98.1Serbia 3.0 5.3 13.8 0.4 3.3 1.8 5.1 1.8 5.0 4.2 0.2 0.5 0.5 0.3 2.5 2.1 1.3 1.1 4.4 3.1 149.7 108.4Slovenia 0.7 1.5 4.2 0.1 1.1 0.6 1.4 0.6 0.9 0.6 0.1 0.1 0.1 0.0 0.8 0.8 0.5 0.5 1.0 0.8 32.7 26.0Spain 12.1 18.8 54.8 0.4 15.3 7.6 41.0 9.1 14.7 12.0 1.0 1.9 1.2 1.0 12.7 10.7 8.5 8.3 18.3 13.8 635.8 391.8
WesternEurope
55.3 114.8 281.3 3.3 96.4 52.8 94.6 39.5 65.3 50.6 5.3 8.4 4.7 3.5 67.3 58.3 43.4 40.1 91.9 75.0 2686.1 2137.9
Austria 2.3 5.0 11.1 0.3 3.1 2.2 3.3 1.6 2.5 2.2 0.3 0.4 0.2 0.1 3.0 2.8 1.7 1.7 4.2 3.5 110.4 94.0Belgium 3.5 7.3 19.1 0.1 4.6 2.7 7.3 2.5 3.3 2.7 0.3 0.5 0.4 0.2 3.7 3.4 2.4 2.4 5.7 4.6 173.4 124.7France 21.5 33.9 86.1 1.0 28.9 12.9 36.5 11.2 19.4 13.5 1.6 2.3 1.8 1.3 23.1 19.7 14.2 13.5 32.0 25.2 901.1 644.6Germany 21.3 53.8 125.5 1.5 47.1 28.3 35.4 18.6 31.0 25.6 2.6 3.9 1.6 1.3 29.6 25.3 19.8 18.0 39.8 33.8 1176.1 1000.3Luxembourg 0.3 0.3 0.6 0.0 0.1 0.0 0.2 0.1 0.2 0.1 0.0 0.0 0.0 0.0 0.1 0.1 0.1 0.1 0.2 0.2 5.5 4.7TheNetherlands
4.1 10.2 26.5 0.3 9.6 5.0 8.6 4.0 6.1 4.5 0.3 0.7 0.5 0.3 5.4 4.7 3.5 2.9 6.8 5.5 229.4 196.0
Switzerland 2.3 4.4 12.5 0.2 2.9 1.6 3.3 1.5 2.7 2.1 0.3 0.5 0.2 0.2 2.4 2.3 1.7 1.7 3.2 2.2 90.2 73.6
Countries for which no data were available are in italics.
1394J
.F
erlay
eta
l./Eu
rop
ean
Jo
urn
al
of
Ca
ncer
49
(2
01
3)
13
74
–1
40
3
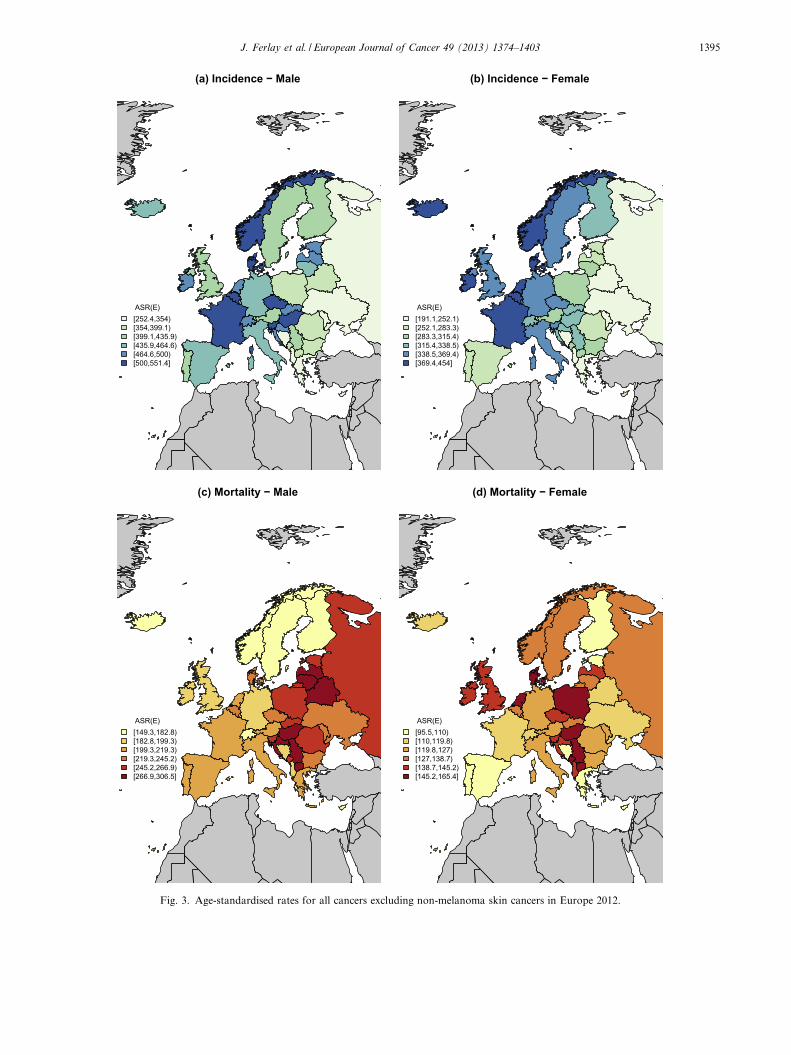
(a) Incidence − Male
ASR(E)[252.4,354)[354,399.1)[399.1,435.9)[435.9,464.6)[464.6,500)[500,551.4]
(b) Incidence − Female
ASR(E)[191.1,252.1)[252.1,283.3)[283.3,315.4)[315.4,338.5)[338.5,369.4)[369.4,454]
(c) Mortality − Male
ASR(E)[149.3,182.8)[182.8,199.3)[199.3,219.3)[219.3,245.2)[245.2,266.9)[266.9,306.5]
(d) Mortality − Female
ASR(E)[95.5,110)[110,119.8)[119.8,127)[127,138.7)[138.7,145.2)[145.2,165.4]
Fig. 3. Age-standardised rates for all cancers excluding non-melanoma skin cancers in Europe 2012.
J. Ferlay et al. / European Journal of Cancer 49 (2013) 1374–1403 1395
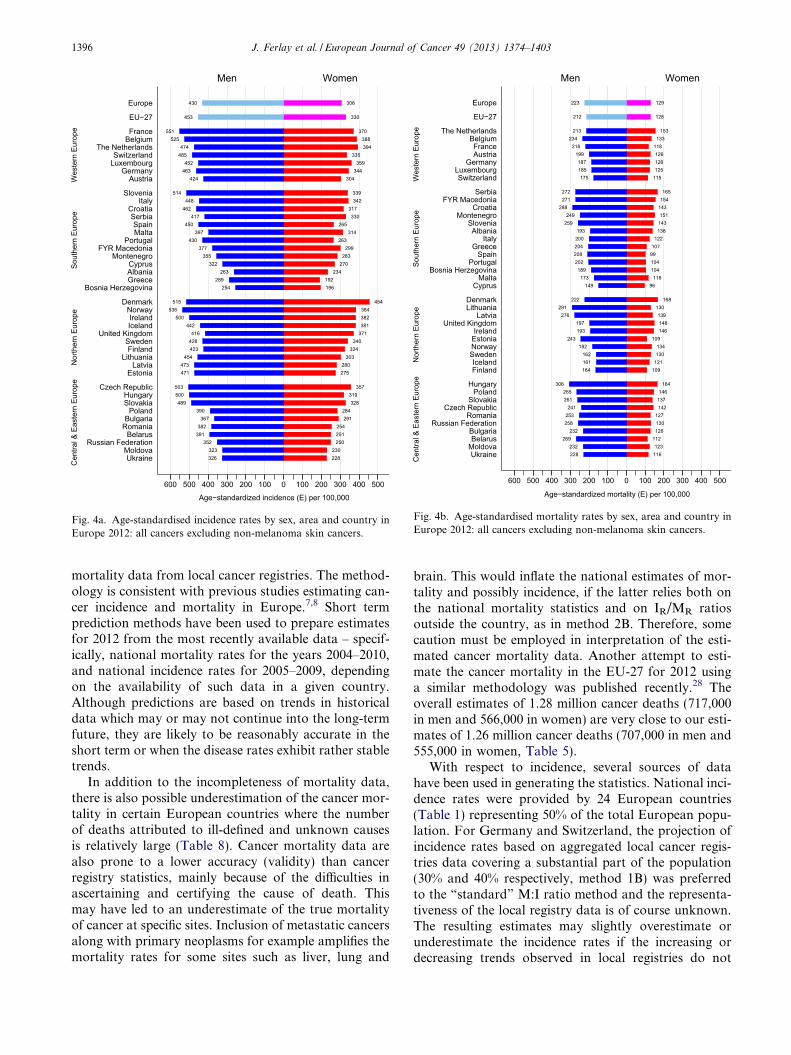
306430
330453
370551388525394474
335485359452
344463304424
339514342448
317462330417
265450314397
263430299377
283355270322
234263192289196254
454515384536382500381442
371416340428
324423303454
280473275471
357503319500328489
284390291367
254382251391250352
230323228326
Men Women
600 500 400 300 200 100 0 100 200 300 400 500
Age−standardized incidence (E) per 100,000
Wes
tern
Eur
ope
Sout
hern
Eur
ope
Nor
ther
n Eu
rope
Cen
tral &
Eas
tern
Eur
ope
Europe
EU−27
FranceBelgium
The NetherlandsSwitzerland
LuxembourgGermany
Austria
SloveniaItaly
CroatiaSerbiaSpainMalta
PortugalFYR Macedonia
MontenegroCyprusAlbaniaGreece
Bosnia Herzegovina
DenmarkNorwayIrelandIceland
United KingdomSwedenFinland
LithuaniaLatvia
Estonia
Czech RepublicHungarySlovakia
PolandBulgaria
RomaniaBelarus
Russian FederationMoldovaUkraine
Fig. 4a. Age-standardised incidence rates by sex, area and country inEurope 2012: all cancers excluding non-melanoma skin cancers.
129223
128212
153213133234
118218126199126187125185
115175
165272154271
143288151249
143259138193
122200107204
99208104202104189116173
96149
168222130291139276148197146193
109243134182130162
121161109164
164306146265
137261142241
127253130258126232
112269123232
116228
Men Women
600 500 400 300 200 100 0 100 200 300 400 500
Age−standardized mortality (E) per 100,000
Wes
tern
Eur
ope
Sout
hern
Eur
ope
Nor
ther
n Eu
rope
Cen
tral &
Eas
tern
Eur
ope
Europe
EU−27
The NetherlandsBelgiumFranceAustria
GermanyLuxembourgSwitzerland
SerbiaFYR Macedonia
CroatiaMontenegro
SloveniaAlbania
ItalyGreece
SpainPortugal
Bosnia HerzegovinaMalta
Cyprus
DenmarkLithuania
LatviaUnited Kingdom
IrelandEstoniaNorwaySwedenIcelandFinland
HungaryPoland
SlovakiaCzech Republic
RomaniaRussian Federation
BulgariaBelarus
MoldovaUkraine
Fig. 4b. Age-standardised mortality rates by sex, area and country inEurope 2012: all cancers excluding non-melanoma skin cancers.
1396 J. Ferlay et al. / European Journal of Cancer 49 (2013) 1374–1403
mortality data from local cancer registries. The method-ology is consistent with previous studies estimating can-cer incidence and mortality in Europe.7,8 Short termprediction methods have been used to prepare estimatesfor 2012 from the most recently available data – specif-ically, national mortality rates for the years 2004–2010,and national incidence rates for 2005–2009, dependingon the availability of such data in a given country.Although predictions are based on trends in historicaldata which may or may not continue into the long-termfuture, they are likely to be reasonably accurate in theshort term or when the disease rates exhibit rather stabletrends.
In addition to the incompleteness of mortality data,there is also possible underestimation of the cancer mor-tality in certain European countries where the numberof deaths attributed to ill-defined and unknown causesis relatively large (Table 8). Cancer mortality data arealso prone to a lower accuracy (validity) than cancerregistry statistics, mainly because of the difficulties inascertaining and certifying the cause of death. Thismay have led to an underestimate of the true mortalityof cancer at specific sites. Inclusion of metastatic cancersalong with primary neoplasms for example amplifies themortality rates for some sites such as liver, lung and
brain. This would inflate the national estimates of mor-tality and possibly incidence, if the latter relies both onthe national mortality statistics and on IR/MR ratiosoutside the country, as in method 2B. Therefore, somecaution must be employed in interpretation of the esti-mated cancer mortality data. Another attempt to esti-mate the cancer mortality in the EU-27 for 2012 usinga similar methodology was published recently.28 Theoverall estimates of 1.28 million cancer deaths (717,000in men and 566,000 in women) are very close to our esti-mates of 1.26 million cancer deaths (707,000 in men and555,000 in women, Table 5).
With respect to incidence, several sources of datahave been used in generating the statistics. National inci-dence rates were provided by 24 European countries(Table 1) representing 50% of the total European popu-lation. For Germany and Switzerland, the projection ofincidence rates based on aggregated local cancer regis-tries data covering a substantial part of the population(30% and 40% respectively, method 1B) was preferredto the “standard” M:I ratio method and the representa-tiveness of the local registry data is of course unknown.The resulting estimates may slightly overestimate orunderestimate the incidence rates if the increasing ordecreasing trends observed in local registries do not
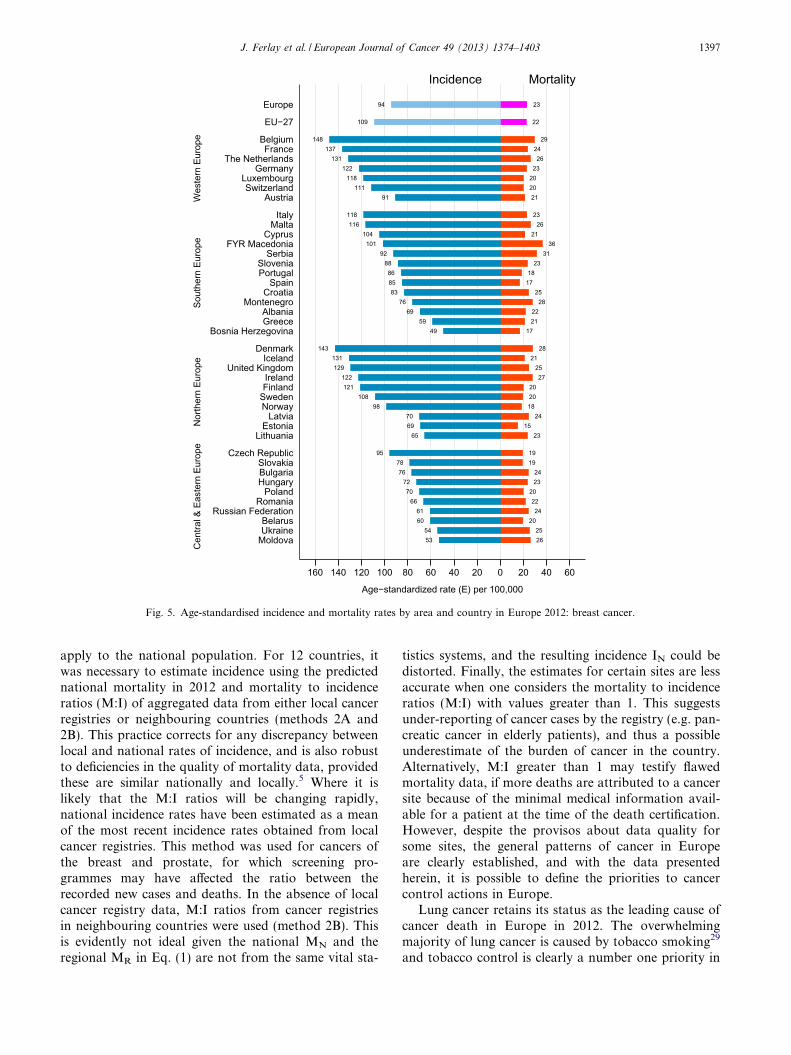
2394
22109
291482413726131
2312220118201112191
2311826116
2110436101
31922388
18861785
25832876
22692159
1749
2814321131
2512927122
20121201081898
24701569
2365
19951978
24762372
207022662461
206025542653
Incidence Mortality
160 140 120 100 80 60 40 20 0 20 40 60
Age−standardized rate (E) per 100,000
Wes
tern
Eur
ope
Sout
hern
Eur
ope
Nor
ther
n Eu
rope
Cen
tral &
Eas
tern
Eur
ope
Europe
EU−27
BelgiumFrance
The NetherlandsGermany
LuxembourgSwitzerland
Austria
ItalyMalta
CyprusFYR Macedonia
SerbiaSloveniaPortugal
SpainCroatia
MontenegroAlbaniaGreece
Bosnia Herzegovina
DenmarkIceland
United KingdomIrelandFinland
SwedenNorway
LatviaEstonia
Lithuania
Czech RepublicSlovakiaBulgariaHungary
PolandRomania
Russian FederationBelarusUkraine
Moldova
Fig. 5. Age-standardised incidence and mortality rates by area and country in Europe 2012: breast cancer.
J. Ferlay et al. / European Journal of Cancer 49 (2013) 1374–1403 1397
apply to the national population. For 12 countries, itwas necessary to estimate incidence using the predictednational mortality in 2012 and mortality to incidenceratios (M:I) of aggregated data from either local cancerregistries or neighbouring countries (methods 2A and2B). This practice corrects for any discrepancy betweenlocal and national rates of incidence, and is also robustto deficiencies in the quality of mortality data, providedthese are similar nationally and locally.5 Where it islikely that the M:I ratios will be changing rapidly,national incidence rates have been estimated as a meanof the most recent incidence rates obtained from localcancer registries. This method was used for cancers ofthe breast and prostate, for which screening pro-grammes may have affected the ratio between therecorded new cases and deaths. In the absence of localcancer registry data, M:I ratios from cancer registriesin neighbouring countries were used (method 2B). Thisis evidently not ideal given the national MN and theregional MR in Eq. (1) are not from the same vital sta-
tistics systems, and the resulting incidence IN could bedistorted. Finally, the estimates for certain sites are lessaccurate when one considers the mortality to incidenceratios (M:I) with values greater than 1. This suggestsunder-reporting of cancer cases by the registry (e.g. pan-creatic cancer in elderly patients), and thus a possibleunderestimate of the burden of cancer in the country.Alternatively, M:I greater than 1 may testify flawedmortality data, if more deaths are attributed to a cancersite because of the minimal medical information avail-able for a patient at the time of the death certification.However, despite the provisos about data quality forsome sites, the general patterns of cancer in Europeare clearly established, and with the data presentedherein, it is possible to define the priorities to cancercontrol actions in Europe.
Lung cancer retains its status as the leading cause ofcancer death in Europe in 2012. The overwhelmingmajority of lung cancer is caused by tobacco smoking29
and tobacco control is clearly a number one priority in
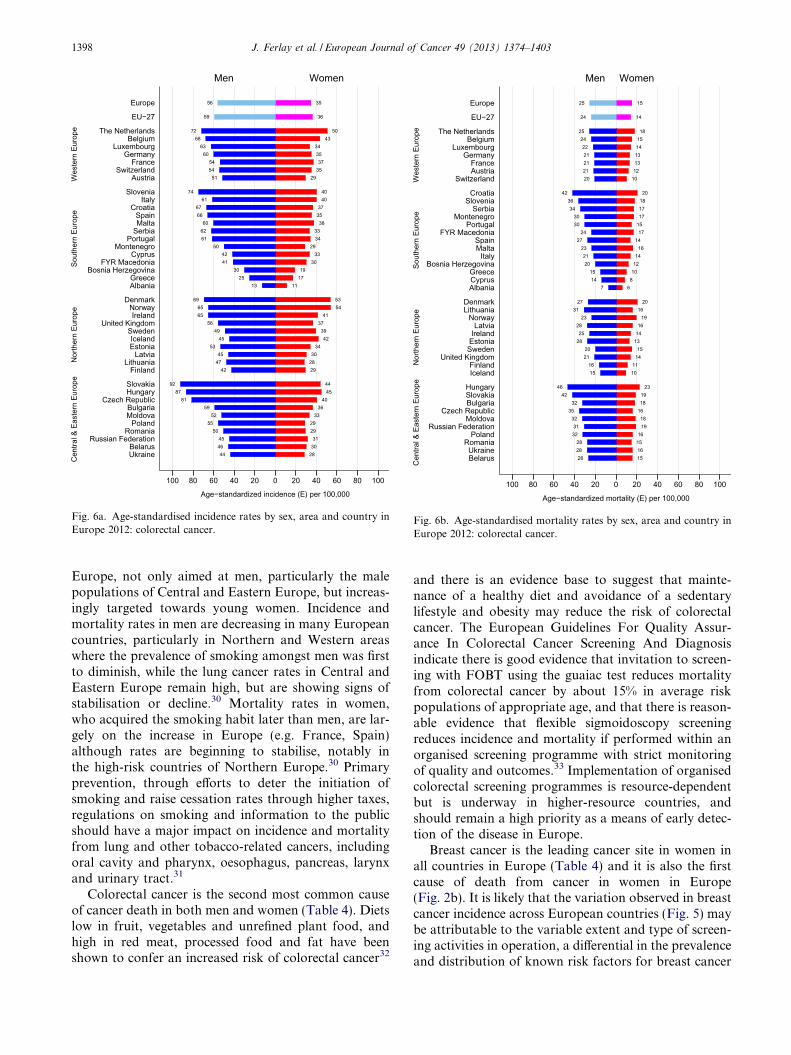
3556
3659
50724368
346335603754
35542951
40744061
376735663860
33623461
29503342
30411930
17251113
53695465
41653756
39494245
34533045
28472942
44924587
40813659
3352295529503145
30462844
Men Women
100 80 60 40 20 0 20 40 60 80 100
Age−standardized incidence (E) per 100,000
Wes
tern
Eur
ope
Sout
hern
Eur
ope
Nor
ther
n Eu
rope
Cen
tral &
Eas
tern
Eur
ope
Europe
EU−27
The NetherlandsBelgium
LuxembourgGermany
FranceSwitzerland
Austria
SloveniaItaly
CroatiaSpainMalta
SerbiaPortugal
MontenegroCyprus
FYR MacedoniaBosnia Herzegovina
GreeceAlbania
DenmarkNorwayIreland
United KingdomSwedenIcelandEstonia
LatviaLithuania
Finland
SlovakiaHungary
Czech RepublicBulgariaMoldova
PolandRomania
Russian FederationBelarusUkraine
Fig. 6a. Age-standardised incidence rates by sex, area and country inEurope 2012: colorectal cancer.
1525
1424
182515241422132113211221
1020
2042183617341730
15301724
14271623
14211220
1015814
67
20271631
19231628
14251328
15201421
11161015
234619421832
163518321931
1632152816281526
Men Women
100 80 60 40 20 0 20 40 60 80 100
Age−standardized mortality (E) per 100,000
Wes
tern
Eur
ope
Sout
hern
Eur
ope
Nor
ther
n Eu
rope
Cen
tral &
Eas
tern
Eur
ope
Europe
EU−27
The NetherlandsBelgium
LuxembourgGermany
FranceAustria
Switzerland
CroatiaSlovenia
SerbiaMontenegro
PortugalFYR Macedonia
SpainMalta
ItalyBosnia Herzegovina
GreeceCyprusAlbania
DenmarkLithuania
NorwayLatvia
IrelandEstonia
SwedenUnited Kingdom
FinlandIceland
HungarySlovakiaBulgaria
Czech RepublicMoldova
Russian FederationPoland
RomaniaUkraineBelarus
Fig. 6b. Age-standardised mortality rates by sex, area and country inEurope 2012: colorectal cancer.
1398 J. Ferlay et al. / European Journal of Cancer 49 (2013) 1374–1403
Europe, not only aimed at men, particularly the malepopulations of Central and Eastern Europe, but increas-ingly targeted towards young women. Incidence andmortality rates in men are decreasing in many Europeancountries, particularly in Northern and Western areaswhere the prevalence of smoking amongst men was firstto diminish, while the lung cancer rates in Central andEastern Europe remain high, but are showing signs ofstabilisation or decline.30 Mortality rates in women,who acquired the smoking habit later than men, are lar-gely on the increase in Europe (e.g. France, Spain)although rates are beginning to stabilise, notably inthe high-risk countries of Northern Europe.30 Primaryprevention, through efforts to deter the initiation ofsmoking and raise cessation rates through higher taxes,regulations on smoking and information to the publicshould have a major impact on incidence and mortalityfrom lung and other tobacco-related cancers, includingoral cavity and pharynx, oesophagus, pancreas, larynxand urinary tract.31
Colorectal cancer is the second most common causeof cancer death in both men and women (Table 4). Dietslow in fruit, vegetables and unrefined plant food, andhigh in red meat, processed food and fat have beenshown to confer an increased risk of colorectal cancer32
and there is an evidence base to suggest that mainte-nance of a healthy diet and avoidance of a sedentarylifestyle and obesity may reduce the risk of colorectalcancer. The European Guidelines For Quality Assur-ance In Colorectal Cancer Screening And Diagnosisindicate there is good evidence that invitation to screen-ing with FOBT using the guaiac test reduces mortalityfrom colorectal cancer by about 15% in average riskpopulations of appropriate age, and that there is reason-able evidence that flexible sigmoidoscopy screeningreduces incidence and mortality if performed within anorganised screening programme with strict monitoringof quality and outcomes.33 Implementation of organisedcolorectal screening programmes is resource-dependentbut is underway in higher-resource countries, andshould remain a high priority as a means of early detec-tion of the disease in Europe.
Breast cancer is the leading cancer site in women inall countries in Europe (Table 4) and it is also the firstcause of death from cancer in women in Europe(Fig. 2b). It is likely that the variation observed in breastcancer incidence across European countries (Fig. 5) maybe attributable to the variable extent and type of screen-ing activities in operation, a differential in the prevalenceand distribution of known risk factors for breast cancer
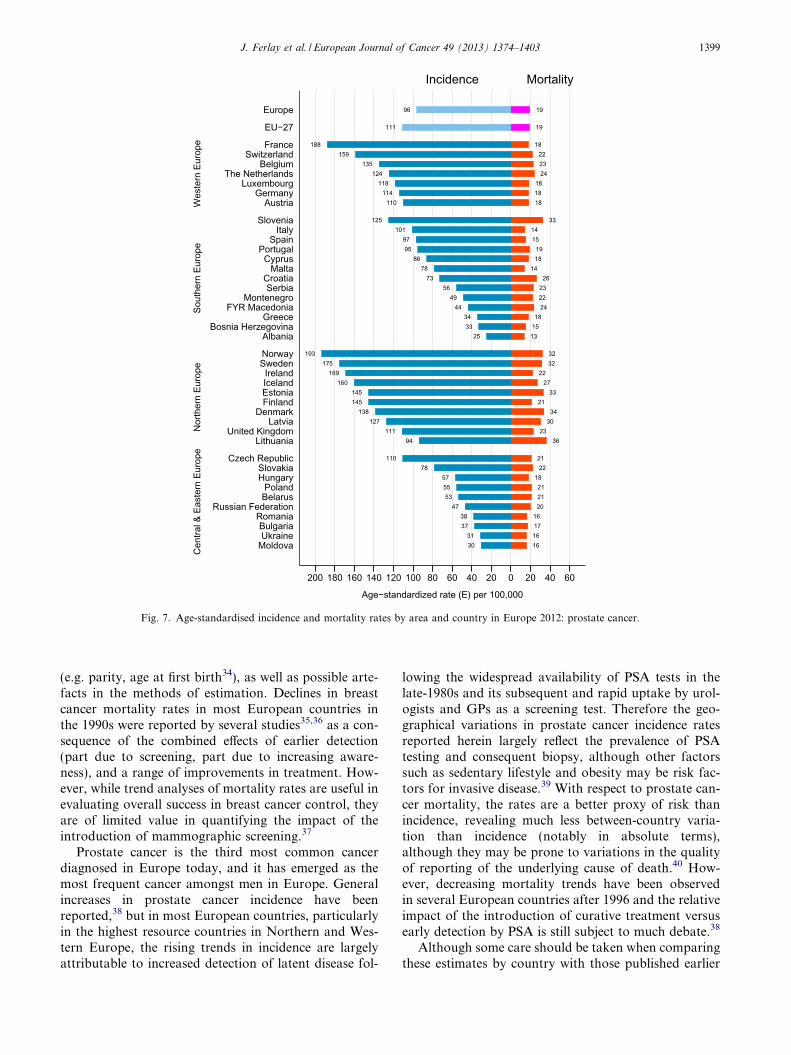
1996
19111
18188221592313524124
181181811418110
33125141011597
19951886
14782673
235622492444
183415331325
3219332175
2216927160
3314521145
3413830127
231113694
211102278
1857215521532047
1638173716311630
Incidence Mortality
200 180 160 140 120 100 80 60 40 20 0 20 40 60
Age−standardized rate (E) per 100,000
Wes
tern
Eur
ope
Sout
hern
Eur
ope
Nor
ther
n Eu
rope
Cen
tral &
Eas
tern
Eur
ope
Europe
EU−27
FranceSwitzerland
BelgiumThe Netherlands
LuxembourgGermany
Austria
SloveniaItaly
SpainPortugal
CyprusMalta
CroatiaSerbia
MontenegroFYR Macedonia
GreeceBosnia Herzegovina
Albania
NorwaySweden
IrelandIcelandEstoniaFinland
DenmarkLatvia
United KingdomLithuania
Czech RepublicSlovakiaHungary
PolandBelarus
Russian FederationRomaniaBulgariaUkraine
Moldova
Fig. 7. Age-standardised incidence and mortality rates by area and country in Europe 2012: prostate cancer.
J. Ferlay et al. / European Journal of Cancer 49 (2013) 1374–1403 1399
(e.g. parity, age at first birth34), as well as possible arte-facts in the methods of estimation. Declines in breastcancer mortality rates in most European countries inthe 1990s were reported by several studies35,36 as a con-sequence of the combined effects of earlier detection(part due to screening, part due to increasing aware-ness), and a range of improvements in treatment. How-ever, while trend analyses of mortality rates are useful inevaluating overall success in breast cancer control, theyare of limited value in quantifying the impact of theintroduction of mammographic screening.37
Prostate cancer is the third most common cancerdiagnosed in Europe today, and it has emerged as themost frequent cancer amongst men in Europe. Generalincreases in prostate cancer incidence have beenreported,38 but in most European countries, particularlyin the highest resource countries in Northern and Wes-tern Europe, the rising trends in incidence are largelyattributable to increased detection of latent disease fol-
lowing the widespread availability of PSA tests in thelate-1980s and its subsequent and rapid uptake by urol-ogists and GPs as a screening test. Therefore the geo-graphical variations in prostate cancer incidence ratesreported herein largely reflect the prevalence of PSAtesting and consequent biopsy, although other factorssuch as sedentary lifestyle and obesity may be risk fac-tors for invasive disease.39 With respect to prostate can-cer mortality, the rates are a better proxy of risk thanincidence, revealing much less between-country varia-tion than incidence (notably in absolute terms),although they may be prone to variations in the qualityof reporting of the underlying cause of death.40 How-ever, decreasing mortality trends have been observedin several European countries after 1996 and the relativeimpact of the introduction of curative treatment versusearly detection by PSA is still subject to much debate.38
Although some care should be taken when comparingthese estimates by country with those published earlier
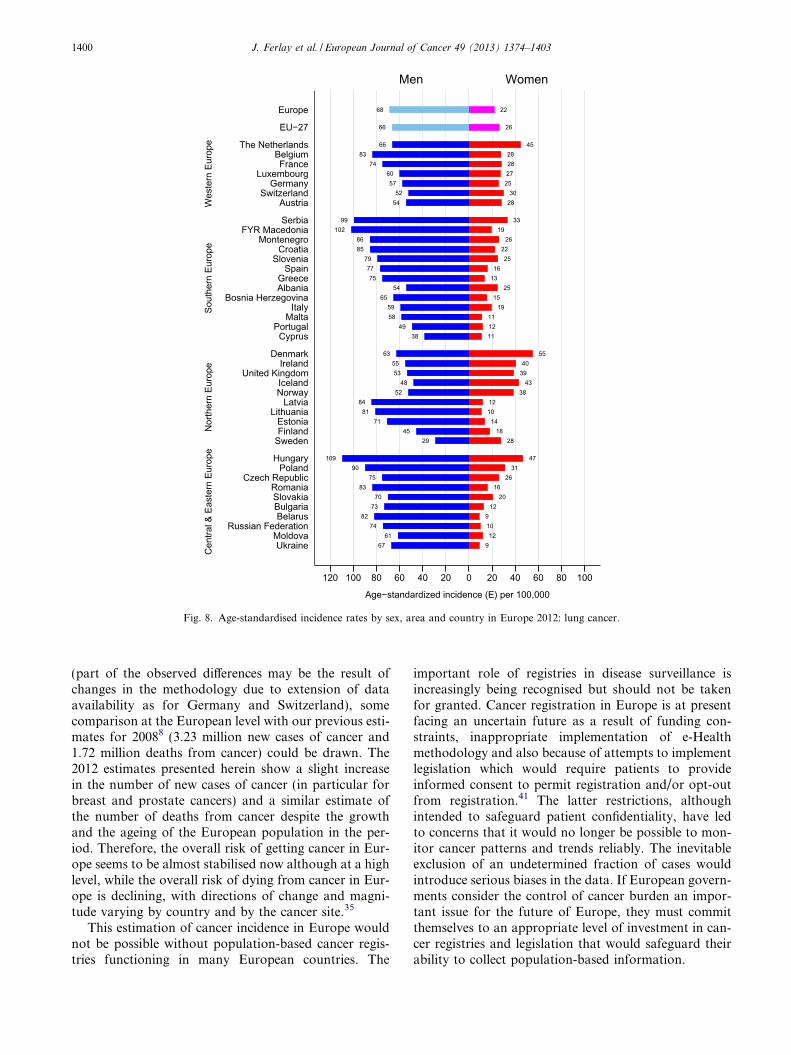
2268
2666
4566288328742760
25573052
2854
339919102
268622852579
16771375
25541565
1959115812491138
55634055
39534348
385212841081
14711845
2829
471093190
26751683
20701273
98210741261
967
Men Women
120 100 80 60 40 20 0 20 40 60 80 100
Age−standardized incidence (E) per 100,000
Wes
tern
Eur
ope
Sout
hern
Eur
ope
Nor
ther
n Eu
rope
Cen
tral &
Eas
tern
Eur
ope
Europe
EU−27
The NetherlandsBelgiumFrance
LuxembourgGermany
SwitzerlandAustria
SerbiaFYR Macedonia
MontenegroCroatia
SloveniaSpain
GreeceAlbania
Bosnia HerzegovinaItaly
MaltaPortugal
Cyprus
DenmarkIreland
United KingdomIcelandNorway
LatviaLithuania
EstoniaFinland
Sweden
HungaryPoland
Czech RepublicRomaniaSlovakiaBulgariaBelarus
Russian FederationMoldovaUkraine
Fig. 8. Age-standardised incidence rates by sex, area and country in Europe 2012: lung cancer.
1400 J. Ferlay et al. / European Journal of Cancer 49 (2013) 1374–1403
(part of the observed differences may be the result ofchanges in the methodology due to extension of dataavailability as for Germany and Switzerland), somecomparison at the European level with our previous esti-mates for 20088 (3.23 million new cases of cancer and1.72 million deaths from cancer) could be drawn. The2012 estimates presented herein show a slight increasein the number of new cases of cancer (in particular forbreast and prostate cancers) and a similar estimate ofthe number of deaths from cancer despite the growthand the ageing of the European population in the per-iod. Therefore, the overall risk of getting cancer in Eur-ope seems to be almost stabilised now although at a highlevel, while the overall risk of dying from cancer in Eur-ope is declining, with directions of change and magni-tude varying by country and by the cancer site.35
This estimation of cancer incidence in Europe wouldnot be possible without population-based cancer regis-tries functioning in many European countries. The
important role of registries in disease surveillance isincreasingly being recognised but should not be takenfor granted. Cancer registration in Europe is at presentfacing an uncertain future as a result of funding con-straints, inappropriate implementation of e-Healthmethodology and also because of attempts to implementlegislation which would require patients to provideinformed consent to permit registration and/or opt-outfrom registration.41 The latter restrictions, althoughintended to safeguard patient confidentiality, have ledto concerns that it would no longer be possible to mon-itor cancer patterns and trends reliably. The inevitableexclusion of an undetermined fraction of cases wouldintroduce serious biases in the data. If European govern-ments consider the control of cancer burden an impor-tant issue for the future of Europe, they must committhemselves to an appropriate level of investment in can-cer registries and legislation that would safeguard theirability to collect population-based information.
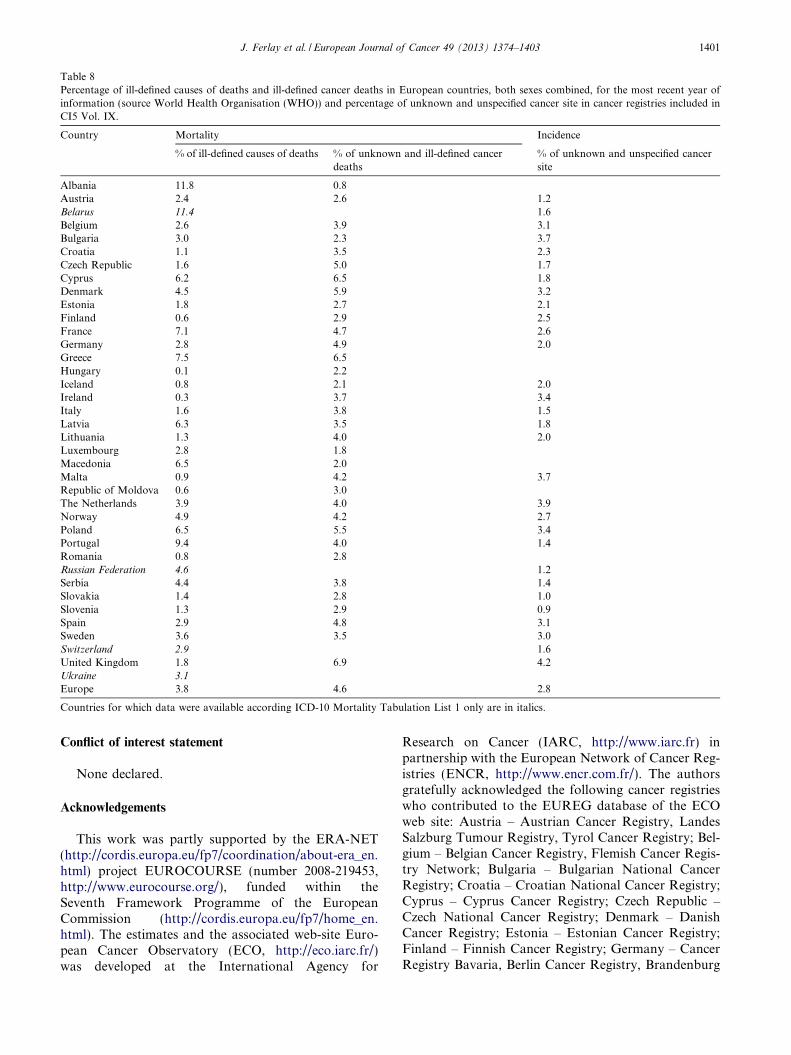
Table 8Percentage of ill-defined causes of deaths and ill-defined cancer deaths in European countries, both sexes combined, for the most recent year ofinformation (source World Health Organisation (WHO)) and percentage of unknown and unspecified cancer site in cancer registries included inCI5 Vol. IX.
Country Mortality Incidence
% of ill-defined causes of deaths % of unknown and ill-defined cancerdeaths
% of unknown and unspecified cancersite
Albania 11.8 0.8Austria 2.4 2.6 1.2Belarus 11.4 1.6Belgium 2.6 3.9 3.1Bulgaria 3.0 2.3 3.7Croatia 1.1 3.5 2.3Czech Republic 1.6 5.0 1.7Cyprus 6.2 6.5 1.8Denmark 4.5 5.9 3.2Estonia 1.8 2.7 2.1Finland 0.6 2.9 2.5France 7.1 4.7 2.6Germany 2.8 4.9 2.0Greece 7.5 6.5Hungary 0.1 2.2Iceland 0.8 2.1 2.0Ireland 0.3 3.7 3.4Italy 1.6 3.8 1.5Latvia 6.3 3.5 1.8Lithuania 1.3 4.0 2.0Luxembourg 2.8 1.8Macedonia 6.5 2.0Malta 0.9 4.2 3.7Republic of Moldova 0.6 3.0The Netherlands 3.9 4.0 3.9Norway 4.9 4.2 2.7Poland 6.5 5.5 3.4Portugal 9.4 4.0 1.4Romania 0.8 2.8Russian Federation 4.6 1.2Serbia 4.4 3.8 1.4Slovakia 1.4 2.8 1.0Slovenia 1.3 2.9 0.9Spain 2.9 4.8 3.1Sweden 3.6 3.5 3.0Switzerland 2.9 1.6United Kingdom 1.8 6.9 4.2Ukraine 3.1
Europe 3.8 4.6 2.8
Countries for which data were available according ICD-10 Mortality Tabulation List 1 only are in italics.
J. Ferlay et al. / European Journal of Cancer 49 (2013) 1374–1403 1401
Conflict of interest statement
None declared.
Acknowledgements
This work was partly supported by the ERA-NET(http://cordis.europa.eu/fp7/coordination/about-era_en.html) project EUROCOURSE (number 2008-219453,http://www.eurocourse.org/), funded within theSeventh Framework Programme of the EuropeanCommission (http://cordis.europa.eu/fp7/home_en.html). The estimates and the associated web-site Euro-pean Cancer Observatory (ECO, http://eco.iarc.fr/)was developed at the International Agency for
Research on Cancer (IARC, http://www.iarc.fr) inpartnership with the European Network of Cancer Reg-istries (ENCR, http://www.encr.com.fr/). The authorsgratefully acknowledged the following cancer registrieswho contributed to the EUREG database of the ECOweb site: Austria – Austrian Cancer Registry, LandesSalzburg Tumour Registry, Tyrol Cancer Registry; Bel-gium – Belgian Cancer Registry, Flemish Cancer Regis-try Network; Bulgaria – Bulgarian National CancerRegistry; Croatia – Croatian National Cancer Registry;Cyprus – Cyprus Cancer Registry; Czech Republic –Czech National Cancer Registry; Denmark – DanishCancer Registry; Estonia – Estonian Cancer Registry;Finland – Finnish Cancer Registry; Germany – CancerRegistry Bavaria, Berlin Cancer Registry, Brandenburg
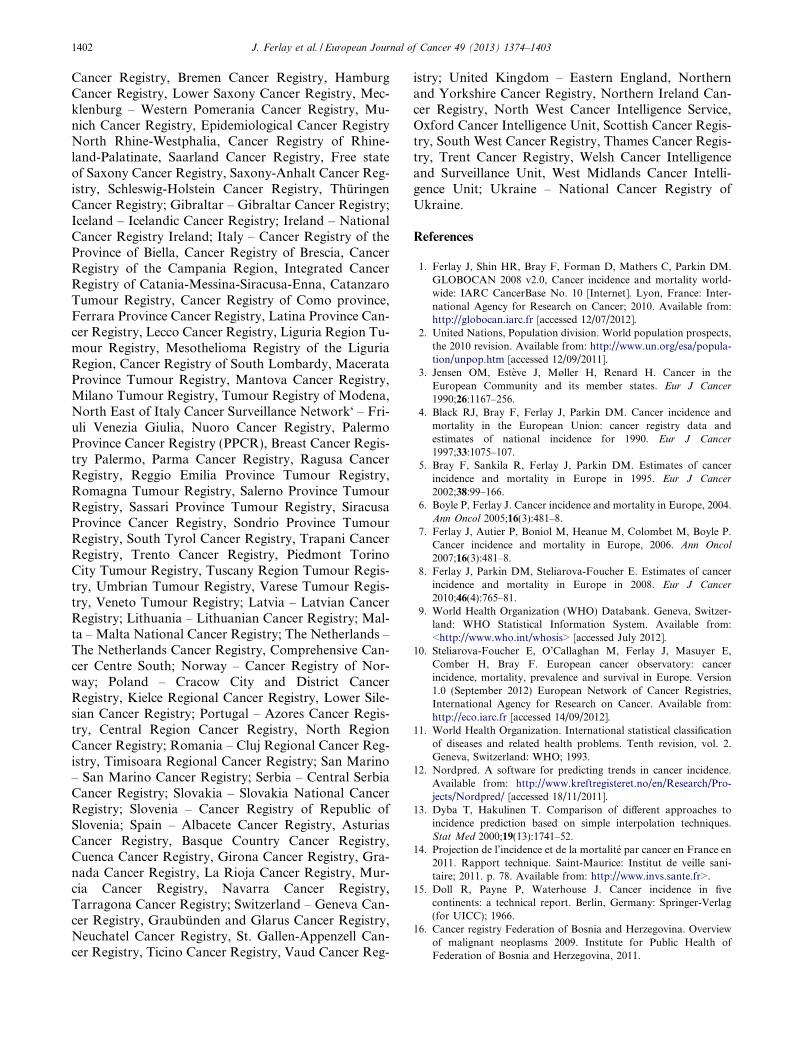
1402 J. Ferlay et al. / European Journal of Cancer 49 (2013) 1374–1403
Cancer Registry, Bremen Cancer Registry, HamburgCancer Registry, Lower Saxony Cancer Registry, Mec-klenburg – Western Pomerania Cancer Registry, Mu-nich Cancer Registry, Epidemiological Cancer RegistryNorth Rhine-Westphalia, Cancer Registry of Rhine-land-Palatinate, Saarland Cancer Registry, Free stateof Saxony Cancer Registry, Saxony-Anhalt Cancer Reg-istry, Schleswig-Holstein Cancer Registry, ThuringenCancer Registry; Gibraltar – Gibraltar Cancer Registry;Iceland – Icelandic Cancer Registry; Ireland – NationalCancer Registry Ireland; Italy – Cancer Registry of theProvince of Biella, Cancer Registry of Brescia, CancerRegistry of the Campania Region, Integrated CancerRegistry of Catania-Messina-Siracusa-Enna, CatanzaroTumour Registry, Cancer Registry of Como province,Ferrara Province Cancer Registry, Latina Province Can-cer Registry, Lecco Cancer Registry, Liguria Region Tu-mour Registry, Mesothelioma Registry of the LiguriaRegion, Cancer Registry of South Lombardy, MacerataProvince Tumour Registry, Mantova Cancer Registry,Milano Tumour Registry, Tumour Registry of Modena,North East of Italy Cancer Surveillance Network‘ – Fri-uli Venezia Giulia, Nuoro Cancer Registry, PalermoProvince Cancer Registry (PPCR), Breast Cancer Regis-try Palermo, Parma Cancer Registry, Ragusa CancerRegistry, Reggio Emilia Province Tumour Registry,Romagna Tumour Registry, Salerno Province TumourRegistry, Sassari Province Tumour Registry, SiracusaProvince Cancer Registry, Sondrio Province TumourRegistry, South Tyrol Cancer Registry, Trapani CancerRegistry, Trento Cancer Registry, Piedmont TorinoCity Tumour Registry, Tuscany Region Tumour Regis-try, Umbrian Tumour Registry, Varese Tumour Regis-try, Veneto Tumour Registry; Latvia – Latvian CancerRegistry; Lithuania – Lithuanian Cancer Registry; Mal-ta – Malta National Cancer Registry; The Netherlands –The Netherlands Cancer Registry, Comprehensive Can-cer Centre South; Norway – Cancer Registry of Nor-way; Poland – Cracow City and District CancerRegistry, Kielce Regional Cancer Registry, Lower Sile-sian Cancer Registry; Portugal – Azores Cancer Regis-try, Central Region Cancer Registry, North RegionCancer Registry; Romania – Cluj Regional Cancer Reg-istry, Timisoara Regional Cancer Registry; San Marino– San Marino Cancer Registry; Serbia – Central SerbiaCancer Registry; Slovakia – Slovakia National CancerRegistry; Slovenia – Cancer Registry of Republic ofSlovenia; Spain – Albacete Cancer Registry, AsturiasCancer Registry, Basque Country Cancer Registry,Cuenca Cancer Registry, Girona Cancer Registry, Gra-nada Cancer Registry, La Rioja Cancer Registry, Mur-cia Cancer Registry, Navarra Cancer Registry,Tarragona Cancer Registry; Switzerland – Geneva Can-cer Registry, Graubunden and Glarus Cancer Registry,Neuchatel Cancer Registry, St. Gallen-Appenzell Can-cer Registry, Ticino Cancer Registry, Vaud Cancer Reg-
istry; United Kingdom – Eastern England, Northernand Yorkshire Cancer Registry, Northern Ireland Can-cer Registry, North West Cancer Intelligence Service,Oxford Cancer Intelligence Unit, Scottish Cancer Regis-try, South West Cancer Registry, Thames Cancer Regis-try, Trent Cancer Registry, Welsh Cancer Intelligenceand Surveillance Unit, West Midlands Cancer Intelli-gence Unit; Ukraine – National Cancer Registry ofUkraine.
References
1. Ferlay J, Shin HR, Bray F, Forman D, Mathers C, Parkin DM.GLOBOCAN 2008 v2.0, Cancer incidence and mortality world-wide: IARC CancerBase No. 10 [Internet]. Lyon, France: Inter-national Agency for Research on Cancer; 2010. Available from:http://globocan.iarc.fr [accessed 12/07/2012].
2. United Nations, Population division. World population prospects,the 2010 revision. Available from: http://www.un.org/esa/popula-tion/unpop.htm [accessed 12/09/2011].
3. Jensen OM, Esteve J, Møller H, Renard H. Cancer in theEuropean Community and its member states. Eur J Cancer
1990;26:1167–256.4. Black RJ, Bray F, Ferlay J, Parkin DM. Cancer incidence and
mortality in the European Union: cancer registry data andestimates of national incidence for 1990. Eur J Cancer
1997;33:1075–107.5. Bray F, Sankila R, Ferlay J, Parkin DM. Estimates of cancer
incidence and mortality in Europe in 1995. Eur J Cancer
2002;38:99–166.6. Boyle P, Ferlay J. Cancer incidence and mortality in Europe, 2004.
Ann Oncol 2005;16(3):481–8.7. Ferlay J, Autier P, Boniol M, Heanue M, Colombet M, Boyle P.
Cancer incidence and mortality in Europe, 2006. Ann Oncol
2007;16(3):481–8.8. Ferlay J, Parkin DM, Steliarova-Foucher E. Estimates of cancer
incidence and mortality in Europe in 2008. Eur J Cancer
2010;46(4):765–81.9. World Health Organization (WHO) Databank. Geneva, Switzer-
land: WHO Statistical Information System. Available from:<http://www.who.int/whosis> [accessed July 2012].
10. Steliarova-Foucher E, O’Callaghan M, Ferlay J, Masuyer E,Comber H, Bray F. European cancer observatory: cancerincidence, mortality, prevalence and survival in Europe. Version1.0 (September 2012) European Network of Cancer Registries,International Agency for Research on Cancer. Available from:http://eco.iarc.fr [accessed 14/09/2012].
11. World Health Organization. International statistical classificationof diseases and related health problems. Tenth revision, vol. 2.Geneva, Switzerland: WHO; 1993.
12. Nordpred. A software for predicting trends in cancer incidence.Available from: http://www.kreftregisteret.no/en/Research/Pro-jects/Nordpred/ [accessed 18/11/2011].
13. Dyba T, Hakulinen T. Comparison of different approaches toincidence prediction based on simple interpolation techniques.Stat Med 2000;19(13):1741–52.
14. Projection de l’incidence et de la mortalite par cancer en France en2011. Rapport technique. Saint-Maurice: Institut de veille sani-taire; 2011. p. 78. Available from: http://www.invs.sante.fr>.
15. Doll R, Payne P, Waterhouse J. Cancer incidence in fivecontinents: a technical report. Berlin, Germany: Springer-Verlag(for UICC); 1966.
16. Cancer registry Federation of Bosnia and Herzegovina. Overviewof malignant neoplasms 2009. Institute for Public Health ofFederation of Bosnia and Herzegovina, 2011.
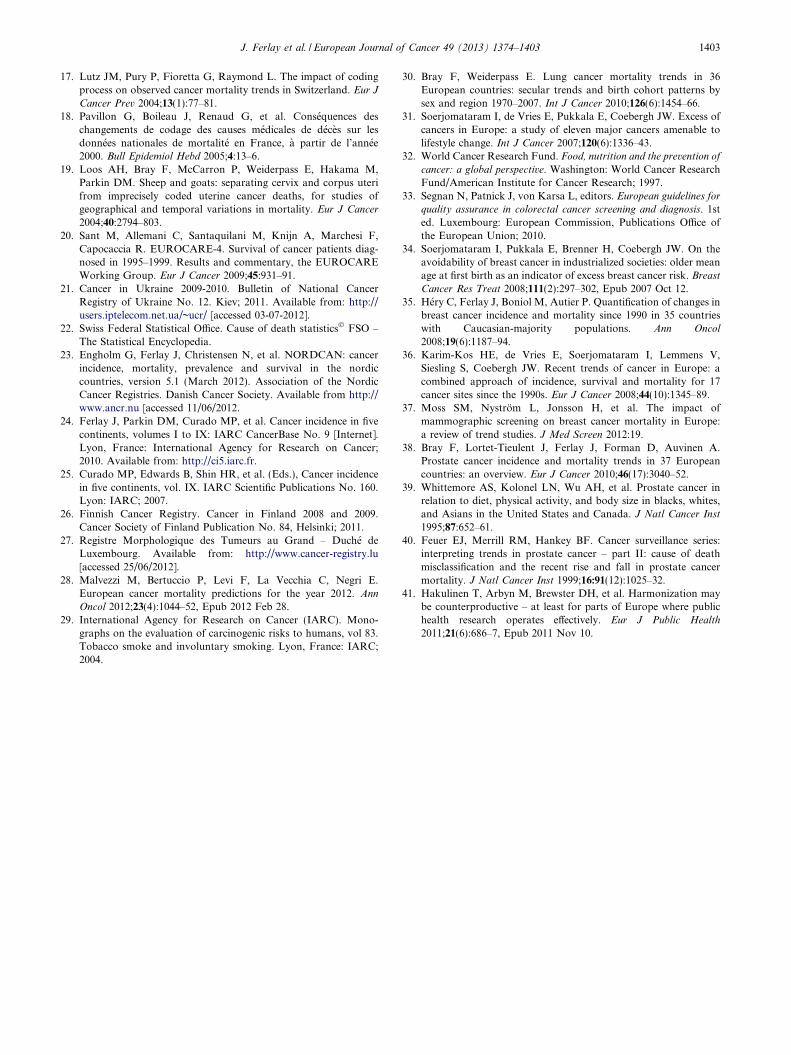
J. Ferlay et al. / European Journal of Cancer 49 (2013) 1374–1403 1403
17. Lutz JM, Pury P, Fioretta G, Raymond L. The impact of codingprocess on observed cancer mortality trends in Switzerland. Eur J
Cancer Prev 2004;13(1):77–81.18. Pavillon G, Boileau J, Renaud G, et al. Consequences des
changements de codage des causes medicales de deces sur lesdonnees nationales de mortalite en France, a partir de l’annee2000. Bull Epidemiol Hebd 2005;4:13–6.
19. Loos AH, Bray F, McCarron P, Weiderpass E, Hakama M,Parkin DM. Sheep and goats: separating cervix and corpus uterifrom imprecisely coded uterine cancer deaths, for studies ofgeographical and temporal variations in mortality. Eur J Cancer
2004;40:2794–803.20. Sant M, Allemani C, Santaquilani M, Knijn A, Marchesi F,
Capocaccia R. EUROCARE-4. Survival of cancer patients diag-nosed in 1995–1999. Results and commentary, the EUROCAREWorking Group. Eur J Cancer 2009;45:931–91.
21. Cancer in Ukraine 2009-2010. Bulletin of National CancerRegistry of Ukraine No. 12. Kiev; 2011. Available from: http://users.iptelecom.net.ua/~ucr/ [accessed 03-07-2012].
22. Swiss Federal Statistical Office. Cause of death statistics� FSO –The Statistical Encyclopedia.
23. Engholm G, Ferlay J, Christensen N, et al. NORDCAN: cancerincidence, mortality, prevalence and survival in the nordiccountries, version 5.1 (March 2012). Association of the NordicCancer Registries. Danish Cancer Society. Available from http://www.ancr.nu [accessed 11/06/2012.
24. Ferlay J, Parkin DM, Curado MP, et al. Cancer incidence in fivecontinents, volumes I to IX: IARC CancerBase No. 9 [Internet].Lyon, France: International Agency for Research on Cancer;2010. Available from: http://ci5.iarc.fr.
25. Curado MP, Edwards B, Shin HR, et al. (Eds.), Cancer incidencein five continents, vol. IX. IARC Scientific Publications No. 160.Lyon: IARC; 2007.
26. Finnish Cancer Registry. Cancer in Finland 2008 and 2009.Cancer Society of Finland Publication No. 84, Helsinki; 2011.
27. Registre Morphologique des Tumeurs au Grand – Duche deLuxembourg. Available from: http://www.cancer-registry.lu[accessed 25/06/2012].
28. Malvezzi M, Bertuccio P, Levi F, La Vecchia C, Negri E.European cancer mortality predictions for the year 2012. Ann
Oncol 2012;23(4):1044–52, Epub 2012 Feb 28.29. International Agency for Research on Cancer (IARC). Mono-
graphs on the evaluation of carcinogenic risks to humans, vol 83.Tobacco smoke and involuntary smoking. Lyon, France: IARC;2004.
30. Bray F, Weiderpass E. Lung cancer mortality trends in 36European countries: secular trends and birth cohort patterns bysex and region 1970–2007. Int J Cancer 2010;126(6):1454–66.
31. Soerjomataram I, de Vries E, Pukkala E, Coebergh JW. Excess ofcancers in Europe: a study of eleven major cancers amenable tolifestyle change. Int J Cancer 2007;120(6):1336–43.
32. World Cancer Research Fund. Food, nutrition and the prevention of
cancer: a global perspective. Washington: World Cancer ResearchFund/American Institute for Cancer Research; 1997.
33. Segnan N, Patnick J, von Karsa L, editors. European guidelines for
quality assurance in colorectal cancer screening and diagnosis. 1sted. Luxembourg: European Commission, Publications Office ofthe European Union; 2010.
34. Soerjomataram I, Pukkala E, Brenner H, Coebergh JW. On theavoidability of breast cancer in industrialized societies: older meanage at first birth as an indicator of excess breast cancer risk. Breast
Cancer Res Treat 2008;111(2):297–302, Epub 2007 Oct 12.35. Hery C, Ferlay J, Boniol M, Autier P. Quantification of changes in
breast cancer incidence and mortality since 1990 in 35 countrieswith Caucasian-majority populations. Ann Oncol
2008;19(6):1187–94.36. Karim-Kos HE, de Vries E, Soerjomataram I, Lemmens V,
Siesling S, Coebergh JW. Recent trends of cancer in Europe: acombined approach of incidence, survival and mortality for 17cancer sites since the 1990s. Eur J Cancer 2008;44(10):1345–89.
37. Moss SM, Nystrom L, Jonsson H, et al. The impact ofmammographic screening on breast cancer mortality in Europe:a review of trend studies. J Med Screen 2012:19.
38. Bray F, Lortet-Tieulent J, Ferlay J, Forman D, Auvinen A.Prostate cancer incidence and mortality trends in 37 Europeancountries: an overview. Eur J Cancer 2010;46(17):3040–52.
39. Whittemore AS, Kolonel LN, Wu AH, et al. Prostate cancer inrelation to diet, physical activity, and body size in blacks, whites,and Asians in the United States and Canada. J Natl Cancer Inst
1995;87:652–61.40. Feuer EJ, Merrill RM, Hankey BF. Cancer surveillance series:
interpreting trends in prostate cancer – part II: cause of deathmisclassification and the recent rise and fall in prostate cancermortality. J Natl Cancer Inst 1999;16:91(12):1025–32.
41. Hakulinen T, Arbyn M, Brewster DH, et al. Harmonization maybe counterproductive – at least for parts of Europe where publichealth research operates effectively. Eur J Public Health
2011;21(6):686–7, Epub 2011 Nov 10.