Embed Size (px)
Citation preview
Fidelity PLANNING
Retirement Income INVESTING
Advantage INCOME MANAGEMENT
FIMA v1
Income Management Account – What’s my Spending and Income? Asset Withdrawal (Current Period)
Current Period Year to DateBeginning Balance $39,528.05 $54,038.10Non-Investment Income
Social Security 2,650.00 7,950.00Pension 1,400.00 4,200.00Other Income 89.56 798.24
Total Non-Investment Income $4,139.56 $12,948.24Spending -$7,853.37 -$31,752.39Reinvestments to Your Portfolio $26.35 $278.05
Ending Balance $35,969.24 $35,969.24
If the number below is positive (surplus), you are adding toyour Income Management Account. If it is negative (withdrawal), you are reducing it.
Non-Investment Income $4,139.56- Spending -$7,853.37= Asset Withdrawal -$3,713.81
or Surplus
To see how your monthly asset withdrawal may affectyour retirement income portfolio and the months ofspending remaining in your Income Management
Account, please review Asset Withdrawal Trends on page 3.
* For certain assets, the beginning and ending dates maynot be the same as the period of this IncomeManagement Report. See "Retirement Income Portfolio –Detail" for details on beginning and ending dates.
** Assets Not at Fidelity are provided at your requestas a service to you. Fidelity is not responsible for theaccuracy of this information. If your RetirementIncome Portfolio includes data you entered eithermanually or through FullView, this data may be out ofdate or incorrect.
Income Management ReportMarch 1, 2005 – March 31, 2005
Customer Service Information
Retirement Income Portfolio Summary – How much is in my Retirement Income Portfolio?
ENV# BWW F001S055061502John DoeMary Doe123 Main Street Anytown, ST 12345
Online Fidelity.comFAST® –Automated Telephone 1-800-544-5555Customer Service 1-800-544-6666
Beginning Value* Ending Value* Net ChangeIncome Management Account Balance $39,528.05 $35,969.24 -$3,558.81Invested AssetsAssets at Fidelity $567,131.51 $584,876.96 $17,745.45Assets Not at Fidelity ** $164,156.57 $151,393.57 -$2,762.00Total Invested Assets $731.287.08 $746,270.53 $14,963.45Total Retirement Income Portfolio $770,815.13 $732,239.77 $11,424.64
The content in this Income Management Report is general in nature and should not be construed as investment advice. This isnot intended to serve as the primary basis for investment or planning decisions. You are solely responsible for the accuracyand appropriateness of the information you provide. Notify Fidelity of any inaccuracies or corrections which should be made.
Page 1For Illustrative Purposes Only
Market Value $0.00 $0.00
SM
incorrect. To the extent such data is included in your portfolio information in this report, Asset Allocation information and keymeasures such as Asset Withdrawal Rate may not be accurate.
Non-Investment Income represents inflow of money into your IMA, generally from sources outside your Retirement Income Portfolio, such as pensions, Social Security, and income annuities. Dividend & Interest Income and Additions from Your Portfolio are considered investment income and are not included in this total. Non-investment income may include transfers of principal. The amounts listed may not be taxable income and may not reflect adjustments necessary for tax reporting purposes.
Plan of Record refers to the Retirement Income Plan data youasked Fidelity to use for comparison purposes. You can view yourRetirement Income Plan of Record from the Online Monitor. Youcan update your Plan of Record by entering new information in theRetirement Income Planning tool and electing to save this in thePlan of Record.
Reinvestments to Your Portfolio represents assets from yourIMA moved to any other account in your Retirement IncomePortfolio either by internal transfers to Fidelity accounts or by bank wire or direct debit transfers to non-Fidelity accounts. (Direct debit transactions are initiated at the institution you are moving money into.)
Retirement Income Portfolio refers to the set of accounts andunderlying assets you indicated you plan to use to fund your retirement. You designate the accounts you choose to plan with andmonitor in the Retirement Income Planning tool and establish aRetirement Income Portfolio when you enroll into the IMA. All theaccounts in your Retirement Income Portfolio are listed on your IMA Report.
Spending represents all the outflows from your IMA except transfers to other accounts in your IMA Retirement Income Portfolio(see Reinvestments to Your Portfolio above). Spending may includechecks, bill payments, debit card purchases, and other withdrawals.Spending also includes MoneyLine transfers our of your IMA (suchas into your bank).
Record. This number will only appear if your account has beenactive for at least seven full months.
Asset Withdrawal – 12 Month Average. This is an average ofyour monthly asset withdrawal for the most recent 12 months.Averaging helps reduce the distortion in reporting that can occurdue to normal monthly variations in actual spending and incomeamounts. If your account has been open less than 12 months, it isonly the average since the account was opened.
Asset Withdrawal Rate – Annualized is calculated by annualizing (multiplying by 12) your Asset Withdrawal – 12 MonthAverage and dividing that number by your Retirement IncomePortfolio's ending value for the current period.
Asset Withdrawal Rate – Planned. Fidelity’s Retirement IncomePlanning Tool calculated this annualized asset withdrawal ratebased upon information in your Plan of Record. This does not meanthat it is a sustainable rate. To assess the risks of this asset withdrawal rate, you should revisit your Retirement Income Plan.You can view your Retirement Income Plan of Record in the Online Monitor at Fidelity.com. Fidelity recommends that you update this Plan in the tool at least annually or whenever your circumstances change.
Change in Market Value is the effect of market action on thevalue of an account or portfolio.
Dividend & Interest Income is money moved into the IMA fromother Fidelity Retail accounts using a dividend and interest PersonalWithdrawal Service Plan plus dividend and interest income accruingto any position(s) held in your IMA.
Invested Assets. Total Invested Assets includes all the assets inyour Retirement Income Portfolio that are not held in your IMA.
Invested Assets at Fidelity includes assets held at Fidelity inmutual fund, brokerage, trust, and workplace savings accounts, aswell as deferred annuity assets in contracts issued by FidelityInvestments Life Insurance Co. (FILI) that you have included in yourRetirement Income Portfolio.
Invested Assets not at Fidelity are held in accounts held outsideFidelity that you have included in your IMA Retirement Income Planof Record using Fidelity’s FullView aggregation capability or throughmanual entry. Data on assets not at Fidelity may be out of date or
Additions from Your Portfolio represents assets transferred intoyour IMA from other accounts in your Retirement Income Portfolio,including direct deposit or Moneyline transfers from non-Fidelityaccounts and internal transfers or PWS plan transfers from Fidelityaccounts.
Allocation of your Retirement Income Portfolio reports the allocation of your Retirement Income Portfolio among differenttypes of investments, including Stocks, Bonds, Short Term,Unknown, and Other. Classes of holdings, including underlyingholdings of mutual funds and deferred annuities, is based oninformation from independent providers of financial information,including Morningstar, Inc. A more complete description of thisprocess is described in the Income Management Account UserGuide. If you have included manually-entered or FullView accountdata in your Retirement Income Portfolio, this data may be out ofdate or incorrect. To the extent such data is included in your portfolio, the current Asset Allocation reported and the comparisonof that asset allocation to your Plan of Record Target Asset Mix maynot be accurate. Be sure that you are fully satisfied with the accuracy of non-Fidelity financial data prior to taking any actionbased on the asset allocation reported. Information in this sectioncomparing your current, actual asset allocation and the TargetAsset Allocation you selected and saved with your RetirementIncome Plan of Record compares only the stock (foreign anddomestic) portion of the allocations. The comparison does notinclude the Bonds or Short Term portion of these asset allocations.
Asset Withdrawal. Asset withdrawal is the process of drawing onyour Retirement Income Portfolio to fund your retirement. It is calculated by subtracting your spending from your non-investmentincome. If the number is positive it represents a surplus rather than
Asset Withdrawal – Current Period. Represents current periodNon-Investment Income less current period Spending.
Asset Withdrawal – Months of Spending. This is an estimateof how many future months your current IMA balance may lastbased on your average asset withdrawal amount. It is calculatedby dividing your IMA balance at the end of this report’s period bythe Asset Withdrawal – 12 Month Average on this report. It is suggested that you maintain enough assets in your IMA to cover sixmonths of spending to cushion against unforeseen expenses.
Asset Withdrawal – Planned. This is the amount you planned towithdraw this period based on your Retirement Income Plan of
Income Management ReportMarch 1, 2005 – March 31, 2005
FIMA v1Page 2
Income Management Account (IMA) Glossary
For Illustrative Purposes Only
a withdrawal.
Fidelity PLANNING
Retirement Income INVESTING
Advantage INCOME MANAGEMENTSM
Asset Withdrawal Trends
How much have I taken from Assets to fundmy Expenses? Your average asset withdrawalamount exceeded your plan by 33%. This may be
due to a large expense or you may generally be spendingmore than anticipated. If your financial circumstances havechanged, review and update your plan.
Asset WithdrawalCurrent Period -$3,713.81 12 month Average -$3,457.20 Planned -$2,587.50
Do I have enough in my Income ManagementAccount for the year/period? We estimate 10.4months of money remaining in your Income
Management Account, given your average monthly assetwithdrawal amount over the last 12 months.
Estimated months of spendingat 12 month average amount 10.4 months
Have I spent my Retirement Income Portfolioassets faster than I planned? Your averageasset withdrawal rate over the last 12 months is
33% higher than your planned rate. Consider your actualspending and income in comparison to your plan assumptions, and update your plan as needed.
Annualized Asset Withdrawal Rate 5.30%Planned Asset Withdrawal Rate 4.00%
Page 3
Income Management ReportMarch 1, 2005 – March 31, 2005
FIMA v1
Retirement Income Portfolio Detail – Where are my assets held?
Beginning Value Ending ValueAccount Number As of 03/01/2005 As of 03/31/2005
Income Management Account X01-793333 $39,528.05 $35,969.24Invested Assets at Fidelity
Joint Z03-868602 $179,657.21 $175,965.02IRA X02-126793 $57,957.24 $58,658.42401k* GM-Saver $329,517.06 $350,253.52(as of 02/27/2005 and 03/28/2005)
Total Invested Assets at Fidelity $567,131.51 $584,876.96
Total Fidelity Accounts $606,659.56 $620,846.20
Invested Assets Not at FidelityMerrill Lynch* 029-483928 $98,453.08 $95,845,12(as of 02/27/2005 and 03/28/2005)
Vanguard* Saver-1023 $65,702.49 $65,548.45(as of 02/27/2005 and 03/28/2005)
Total Invested Assets Not at Fidelity $164,155.57 $161,393.57
Total Retirement Income Portfolio Value $770,815.13 $782,239.77
This symbol indicates a taxable account.
* Represents beginning and ending value for non-month end account.
Information about Assets held in your Fidelity Workplace Savings is provided by Fidelity Investments Institutional Operations Co.,an affiliated broker-dealer, as a service to you at your request. Information about Annuities is provided by Fidelity InvestmentsLife Insurance Co. as a service to you at your request. Assets Not at Fidelity are provided solely as a service to you at yourrequest. Assets in accounts held outside Fidelity Brokerage may not be covered by SIPC (Securities Investor ProtectionCorporation). You can obtain information about these accounts by calling the institution holding these accounts. FidelityWorkplace Savings amounts exclude BrokerageLink assets, which are reported with the Retail Account holding them.
For Illustrative Purposes Only
Fidelity PLANNING
Retirement Income INVESTING
Advantage INCOME MANAGEMENTSM
Are my investments on track with themodel target asset allocation* I selected?Based on the information you provided and our
records, the total domestic and foreign stock hold-ings in your Retirement Income Portfolio are within10% (+ or -) of what you planned, based on yourselected model target asset mix. You can visit theRetirement Income Planning tool online to learnmore about your current and model target assetmixes.
* Based upon a target asset allocation for a hypotheticalinvestor similar to you.
** Totals may not be exact due to rounding.
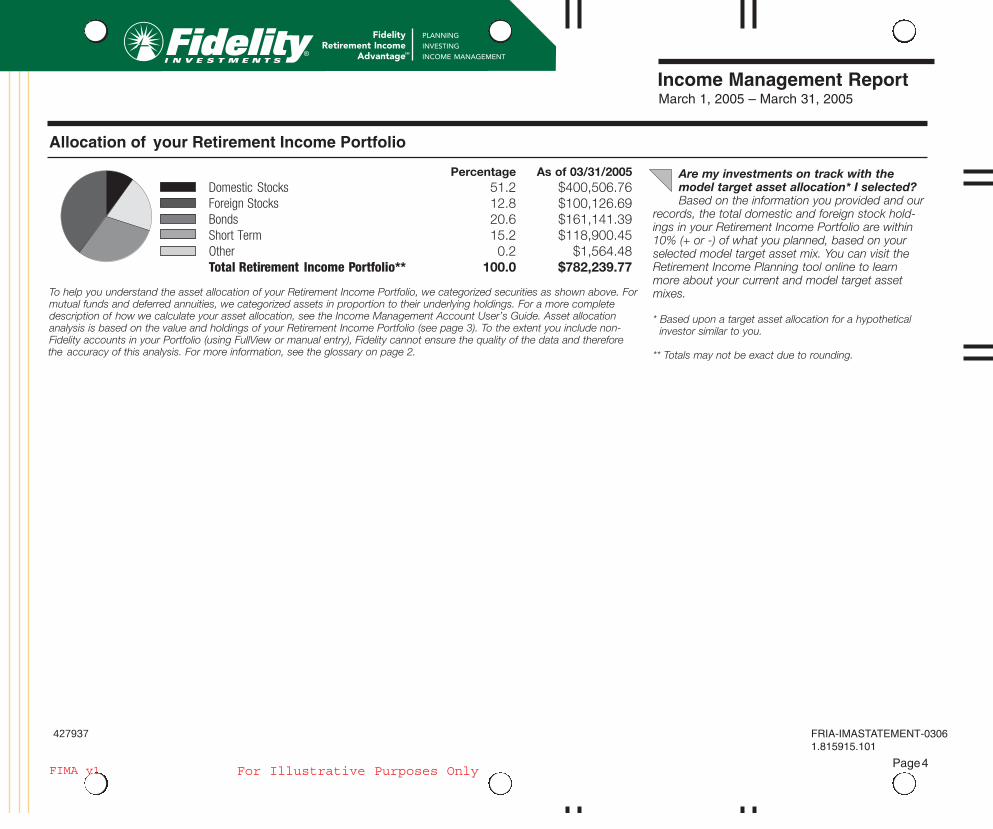
Allocation of your Retirement Income Portfolio
Percentage As of 03/31/2005 Domestic Stocks 51.2 $400,506.76Foreign Stocks 12.8 $100,126.69Bonds 20.6 $161,141.39Short Term 15.2 $118,900.45Other 0.2 $1,564.48Total Retirement Income Portfolio** 100.0 $782,239.77
To help you understand the asset allocation of your Retirement Income Portfolio, we categorized securities as shown above. Formutual funds and deferred annuities, we categorized assets in proportion to their underlying holdings. For a more completedescription of how we calculate your asset allocation, see the Income Management Account User’s Guide. Asset allocationanalysis is based on the value and holdings of your Retirement Income Portfolio (see page 3). To the extent you include non-Fidelity accounts in your Portfolio (using FullView or manual entry), Fidelity cannot ensure the quality of the data and therefore the accuracy of this analysis. For more information, see the glossary on page 2.
Income Management Report
Page 4FIMA v1 For Illustrative Purposes Only
FRIA-IMASTATEMENT-03061.815915.101
427937
Fidelity PLANNING
Retirement Income INVESTING
Advantage INCOME MANAGEMENTSM
March 1, 2005 – March 31, 2005