Embed Size (px)
Citation preview
Final Publishable Summary Report
Project Type: ICT - STREP Contract Nº: 318035 Period: Oct 2012 – Dec 2015 Revision: July 2016
1. Executive Summary
The small or medium scale focused research project (STREP) Bloch electromagnetic surface
wave bio-sensors for early cancer diagnosis (BILOBA) developed and pre-clinically validated
a multifunctional point-of-care platform capable of performing real-time cancer biomarker
detection in a tandem configuration. The configuration exploits a label-free detection based on
the resonance shifts, and the spectral analysis of enhanced fluorescence emitted by
biomolecules immobilized on the surface. Utilizing both labelled and label-free analysis on one
sensor increases the sensitivity and the reliability of optically read-out surface bound assays.
The standard optical label-free detection is the surface plasmon resonance (SPR) method. Its
sensitivity suffers from the strong absorption of waves bound to the metal surface. Here, a
similar concept has been advantageously implemented by applying the unique properties of
Bloch Surface Waves (BSW) sustained on 1D Photonic Crystals (1DPC). Therein, a surface wave
without absorption is excited, giving rise to a pronounced narrowing of resonances and an
associated increase in sensitivity. Furthermore, fluorescence enhancement due to near field
effects is exploited. By engineering the BSW dispersion both detection schemes are combined
in the same platform.
The project has explored, designed, and set-up BSW systems optimized for analytical sensing,
and developed a corresponding instrument. Immobilization protocols and biochemical assays
have been established for optimizing the binding site surface density and for detecting the
target biomarkers. The development of a sophisticated, robust fluidic system to ensure a high
signal-to-noise ratio even in the case of lowest analyte concentrations accompanied this work.
The biosensing platform developed by the project partners has been applied to cancer
biomarker detection and validated in tests in a pre-clinical environment. The target application
is the detection of Angiopoietin-1, Angiopoietin-2 and Vascular Endothelial Growth Factor with
these proteins being indicative of angiogenesis associated to human cancer progression.
The project started in October 2012 and lasted 39 months until December 2015. BILOBA was
implemented by a consortium of nine European beneficiaries with particular competence in
the field, consisting of four universities, one large research institution, and four enterprises
from four different countries.
The main project achievements are reported on a dedicated website available at www.biloba-
project.eu and continuously updated with new details.
2. Summary Description of project context and objectives
2.1 Project Context
Cancer is one of the major devastating diseases worldwide, and the astonishing impact of this
plague at the global level is testified by the fact that this year over 7 million people will die
worldwide, and at least 10 million will be diagnosed with this pathology.1,2
Prevention, early diagnosis and more effective treatments are the natural recipe to counteract
this spreading pandemic; while prevention and identification of healthy lifestyles with
mitigation of risk factors is something that mostly requires focused communication activities
and mass sensitisation campaigns. A strong research effort is needed to push the diagnostic
performances of current methodologies used to detect cancer beyond their current limitations,
and to devise more effective and less harmful therapeutic approaches.
Although equally important, these two research lines should be analysed also from another
point of view, starting from two surprising evidences:
Several studies report that cancer misdiagnosis occur in around 10% of cases, with tremendous consequences in terms of patient morbidity and cost.3
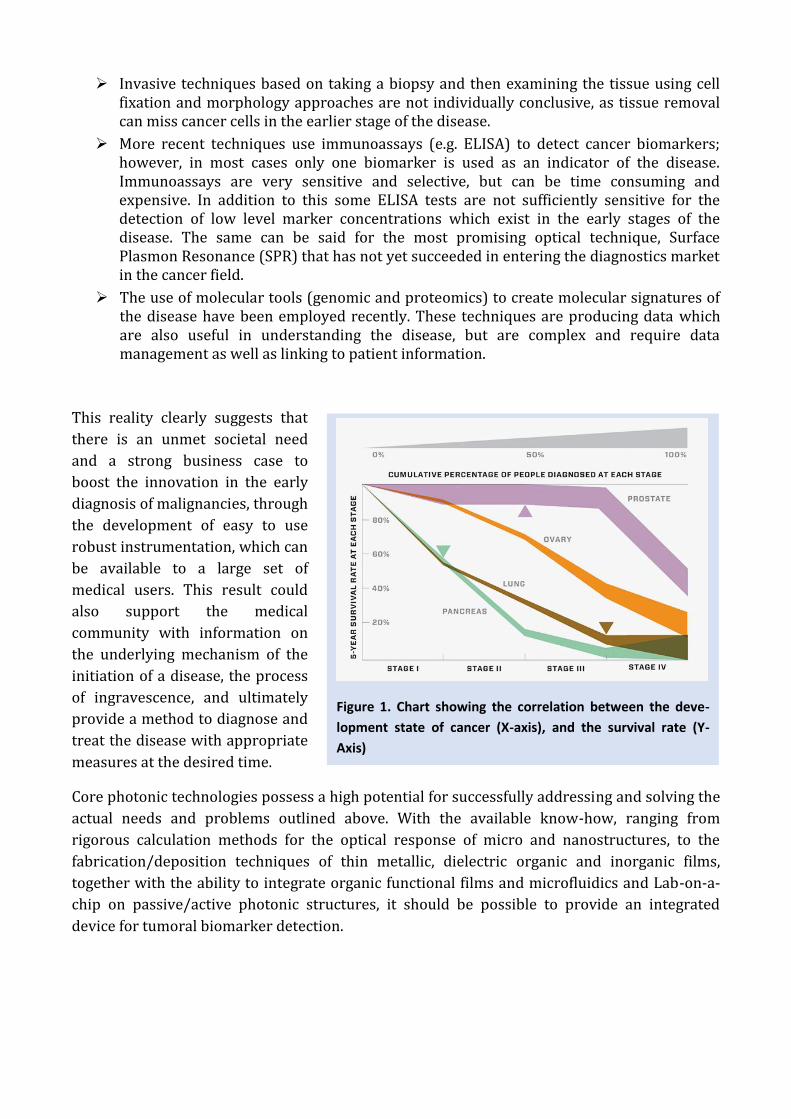
At the same time, timely and accurate detection of cancer is associated with increased patients’ life expectancy and quality of life; the survival rate for many cancers in fact approaches 90% if one is able to detect the pathology in its first stage of development.4,5,6
Although a care driven approach with an emphasis on new drugs has dominated the scene in the last 30 years, with scant results in terms of drop in mortality rate, the real problem is that we currently lack the capability to systematically detect cancer at its very early stage, due to the technological limitations of the diagnostic approaches currently available; these are clearly evident in well-established and validated systems such as imaging techniques (Magnetic Resonance Imaging, X-Rays, Computer Aided Tomography) as well as in biomarkers based analysis, where the performances in terms of detection limit and accuracy still have to be improved.
Other elements confirm the need to improve state of the art cancer screening techniques:
1 World Health Organization, Cancer Fact Sheet, October 2011, available online:
http://www.who.int/mediacentre/factsheets/fs297/en/ 2 World Health Organization, “Global cancer rates could increase by 50% to 15 million by 2020”, 2003 3 Hardeep Singh, Saurabh Sethi, Martin Raber, and Laura A. Petersen, Errors in Cancer Diagnosis: Current
Understanding and Future Directions, Journal of Clinical Oncology, vol. 25 N.31, November 2007 4 Horner MJ, Ries LAG, Krapcho M, Neyman N, Aminou R, Howlader N, Altekruse SF, Feuer EJ, Huang L, Mariotto A,
Miller BA, Lewis DR, Eisner MP, Stinchcomb DG, Edwards BK (eds). SEER Cancer Statistics Review, 1975-2006,
National Cancer Institute. Bethesda, MD, http://seer.cancer.gov/csr/1975_2006/, based on November 2008 SEER data
submission, posted to the SEER web site, 2009 5 American Cancer Society. Cancer Facts & Figures 2009. Atlanta: American Cancer Society, 2009. 6 http://seer.cancer.gov/statfacts/
Invasive techniques based on taking a biopsy and then examining the tissue using cell fixation and morphology approaches are not individually conclusive, as tissue removal can miss cancer cells in the earlier stage of the disease.
More recent techniques use immunoassays (e.g. ELISA) to detect cancer biomarkers; however, in most cases only one biomarker is used as an indicator of the disease. Immunoassays are very sensitive and selective, but can be time consuming and expensive. In addition to this some ELISA tests are not sufficiently sensitive for the detection of low level marker concentrations which exist in the early stages of the disease. The same can be said for the most promising optical technique, Surface Plasmon Resonance (SPR) that has not yet succeeded in entering the diagnostics market in the cancer field.
The use of molecular tools (genomic and proteomics) to create molecular signatures of the disease have been employed recently. These techniques are producing data which are also useful in understanding the disease, but are complex and require data management as well as linking to patient information.
This reality clearly suggests that
there is an unmet societal need
and a strong business case to
boost the innovation in the early
diagnosis of malignancies, through
the development of easy to use
robust instrumentation, which can
be available to a large set of
medical users. This result could
also support the medical
community with information on
the underlying mechanism of the
initiation of a disease, the process
of ingravescence, and ultimately
provide a method to diagnose and
treat the disease with appropriate
measures at the desired time.
Core photonic technologies possess a high potential for successfully addressing and solving the
actual needs and problems outlined above. With the available know-how, ranging from
rigorous calculation methods for the optical response of micro and nanostructures, to the
fabrication/deposition techniques of thin metallic, dielectric organic and inorganic films,
together with the ability to integrate organic functional films and microfluidics and Lab-on-a-
chip on passive/active photonic structures, it should be possible to provide an integrated
device for tumoral biomarker detection.
Figure 1. Chart showing the correlation between the deve-
lopment state of cancer (X-axis), and the survival rate (Y-
Axis)
2.2 Project Objectives
BILOBA aimed to achieve the ambitious mission to reveal the cancer before it reveals itself by
developing and pre-clinically validating a compact and multifunctional point-of-care platform
that is capable of performing real-time cancer biomarker detection in a tandem configuration.
The bio-sensing platform consists of disposable and low cost dielectric one dimensional
photonic crystal (1DPC) biochips and an analytical instrument. The breakthrough is the
capability of properly designed 1DPC to sustain Bloch electromagnetic Surface Waves (BSW) at
their surface, whose peculiar properties can be exploited for overtaking the limitations to
sensitivity, selectivity, and resolution of present point-of-care cancer diagnostic tools and
leading to a new class of advanced industrial products.
The target application of the proposed sensing platform was the detection of biomarker
proteins for early cancer diagnosis. In particular the project was focused on the detection at a
very low concentration of angiopoietin -1 and -2 and vascular endothelial growth factor, which
have been identified as tumor inducers7. Before the project start, such markers had already
been studied by some of the project partners both from the medical and from the sensing
application point of view. In particular at a medical level, the partners had set up preclinical
and clinical strategies to correlate disease progression and disease-free survival with
molecular and biological markers of angiogenesis.
BILOBA’s main goal was to set a new standard in point-of-care cancer diagnosis, where Europe
has a leading position, by developing an alternative to surface plasmon polaritons (SPP),
currently used in surface polariton resonance (SPR) devices, by exploiting the potential of
Bloch surface electromagnetic waves (BSW) at the surface of finite dielectric stacks. For cancer
biomarkers’ detection at a very low concentration, where superior sensing performance is
needed, the absence of damping in dielectrics with resulting narrower resonances and the
possibility to engineer the dielectric stack to tailor the surface waves’ dispersion provides a
relevant and significant improvement. New performances, otherwise impossible with SPP in
metal based sensors, were made available, such as both polarizations accessibility (TM and
TE), the pronounced dispersion of BSW for fluorescence detection and the exploitation of the
variety of dielectrics’ surface chemistry in order to improve the selectivity of the sensors.
2.3 Project Partners
The BILOBA project started in October 2012 and lasted 39 months until December 2015. It was implemented by a consortium of nine European beneficiaries (Table 1 and Figure 2) from four different countries with particular competence in the field, consisting on four universities, one large research institution, and four enterprises.
7 J.Folkman, Angiogenesis, Ann. Rev. Med., 57, 1-8 (2006); J.Folkman, Angiogenesis: an organizing principle for drug discovery?,
Nat. Rev. Drug Discov., 6, 273-286 (2007).
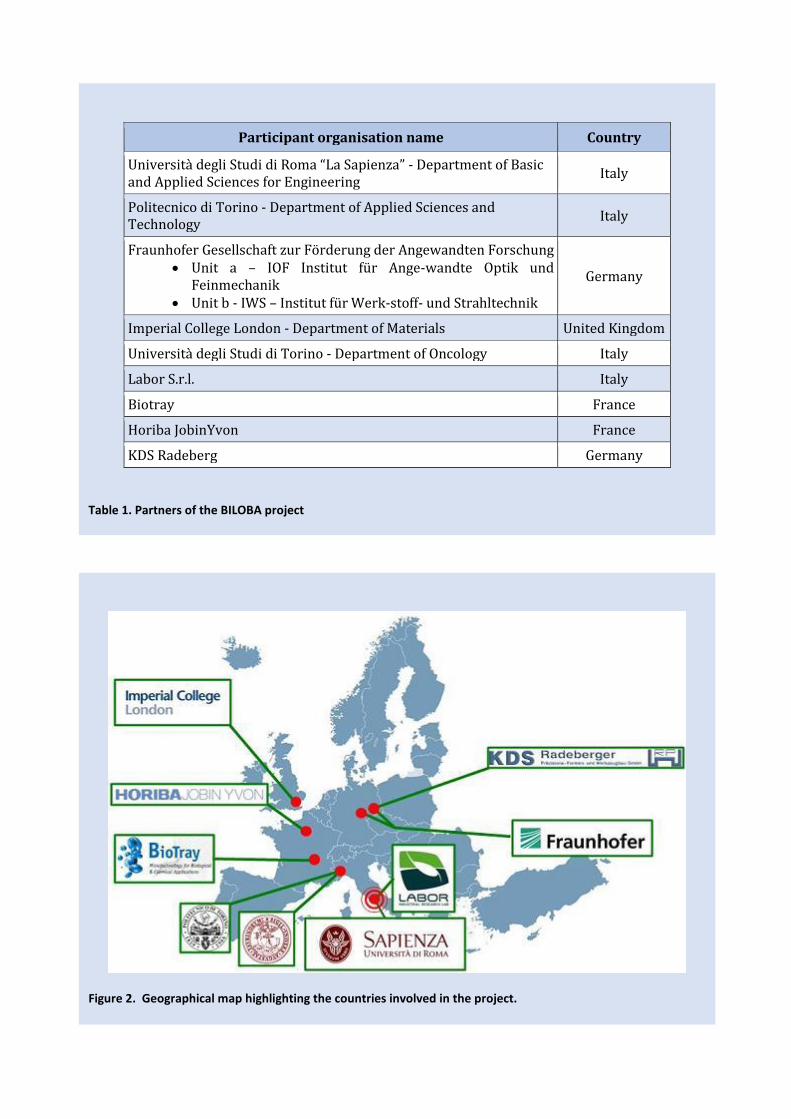
Participant organisation name Country
Università degli Studi di Roma “La Sapienza” - Department of Basic and Applied Sciences for Engineering
Italy
Politecnico di Torino - Department of Applied Sciences and Technology
Italy
Fraunhofer Gesellschaft zur Förderung der Angewandten Forschung Unit a – IOF Institut für Ange-wandte Optik und
Feinmechanik Unit b - IWS – Institut für Werk-stoff- und Strahltechnik
Germany
Imperial College London - Department of Materials United Kingdom
Università degli Studi di Torino - Department of Oncology Italy
Labor S.r.l. Italy
Biotray France
Horiba JobinYvon France
KDS Radeberg Germany
Table 1. Partners of the BILOBA project
Figure 2. Geographical map highlighting the countries involved in the project.
3. Description of the main S&T results/foregrounds
BILOBA developed and pre-clinically validated a compact and multifunctional point-of-care
platform for real-time detection of cancer biomarkers in biological fluids with high sensitivity
in a tandem configuration. The biosensing platform consists of disposable and low cost
dielectric one-dimensional photonic crystal (1DPC) biochips and a reading device. A properly
designed 1DPC sustains Bloch electromagnetic surface waves (BSW) at its surface. The ability
of BSW to overcome the limitations of selectivity and resolution of the conventional point-of-
care cancer diagnostic tools is a major breakthrough of the BILOBA platform, which would lead
to a new class of advanced diagnostics. In addition, the BILOBA biochips are capable of
analyzing 1D spot arrays, increasing the assay multiplicity and redundancy.
While the BILOBA platform enables efficient detection of diverse analytes, we targeted the
detection of biomarker proteins for early cancer diagnosis. In particular, the project was
focused on the ultrasensitive detection of vascular endothelial growth factor, angiopoietin 1
and 2 proteins, which are known to induce angiogenesis, thus providing important tumor
markers.
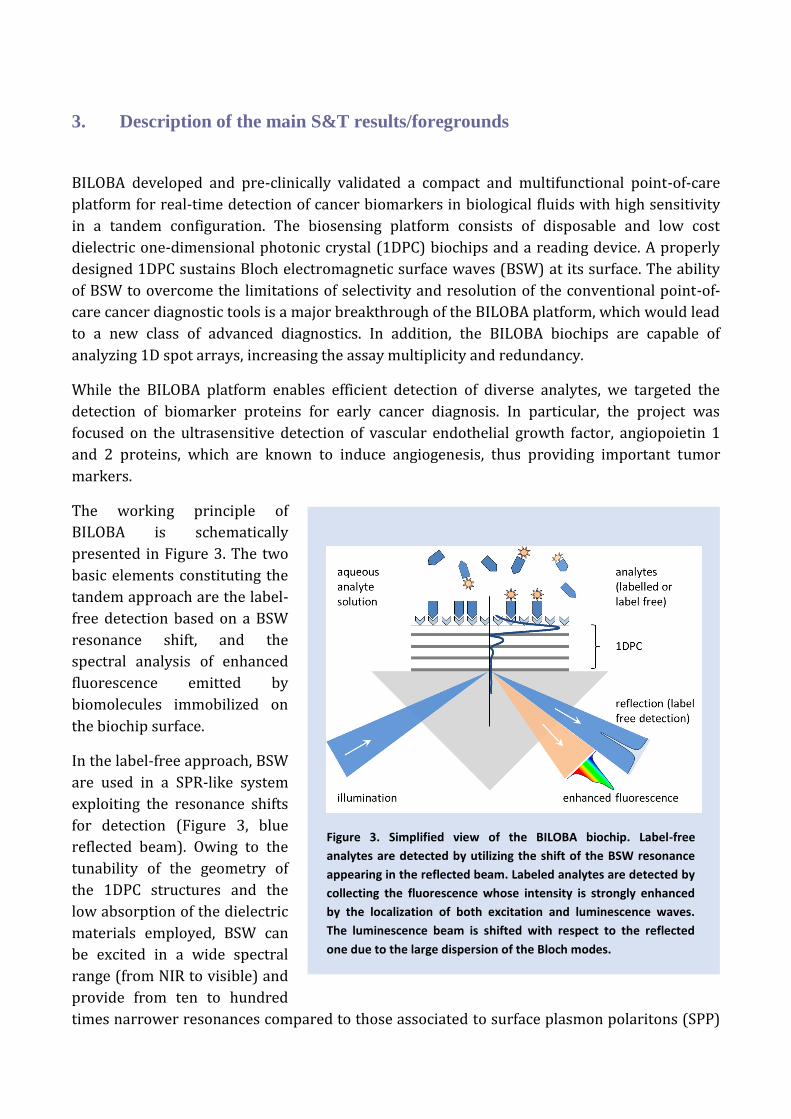
The working principle of
BILOBA is schematically
presented in Figure 3. The two
basic elements constituting the
tandem approach are the label-
free detection based on a BSW
resonance shift, and the
spectral analysis of enhanced
fluorescence emitted by
biomolecules immobilized on
the biochip surface.
In the label-free approach, BSW
are used in a SPR-like system
exploiting the resonance shifts
for detection (Figure 3, blue
reflected beam). Owing to the
tunability of the geometry of
the 1DPC structures and the
low absorption of the dielectric
materials employed, BSW can
be excited in a wide spectral
range (from NIR to visible) and
provide from ten to hundred
times narrower resonances compared to those associated to surface plasmon polaritons (SPP)
Figure 3. Simplified view of the BILOBA biochip. Label-free
analytes are detected by utilizing the shift of the BSW resonance
appearing in the reflected beam. Labeled analytes are detected by
collecting the fluorescence whose intensity is strongly enhanced
by the localization of both excitation and luminescence waves.
The luminescence beam is shifted with respect to the reflected
one due to the large dispersion of the Bloch modes.
and five to fifty times better resolution for surface modifications.
These advantageous features of BSW enable detection of low concentration of biomarker,
leading to earlier cancer detection.
On the other hand, the fluorescence mode utilizes a strong field confinement at the very last
interface of the photonic crystal to enhance the excitation of fluorescent labels placed in close
proximity of the surface by 2 to 3 orders of magnitude. Again, this enhancement should enable
detection of smaller concentrations of cancer biomarkers. As a complementary mechanism, the
Stokes-shifted fluorescence emission from labels immobilized at the surface is preferentially
coupled to BSW sustained by the 1DPC and leaks back into the prism, as shown in Figure 3
(pink beam). This results in a further improvement of fluorescence collection. The angular
separation between the reflected and the fluorescence beam is guaranteed by the strong
dispersion of BSW modes.
A crucial requirement of cancer diagnostics is to attain specific binding of a biomarker to the
sensor surface. Therefore, functionalisation of the sensor biochips was a key point and was
efficiently achieved by BILOBA, leading to the fabrication of a sensitive and selective biosensor
device. Different surface functionalization routes were developed in the project to achieve
broader applicability.
Apart from the BSW biochips, the BILOBA platform includes a purposely designed and
fabricated analytical instrument that carries out the optical detection process in a microfluidic
environment. The fluidic chamber allows the automated and uniform mixing of the assay
solutions to facilitate interaction of the biomarker with the properly functionalized biochip
surface.
3.1 Description of the work performed since the beginning of the project and
the main results achieved
The BILOBA project has concluded its technical activities after 39 months, and throughout the
project duration an outstanding collaborative effort has been dedicated under the supervision
of the Executive Committee, the Coordinator, the Management Support Team and the work
package Leaders, making it a smooth and successful STREP project.
During the initial phase of the project, all RTD activities were carried out in the frame of a
“System Requirements” work package. All partners worked in close collaboration to define
system specifications related to the three key elements of the BILOBA project: biomarkers
recognition protocol, analytical instrument, and disposable BSW biochips. The System
Requirements work package ended producing the three related deliverables and the BILOBA
requirements/specifications matrix. Such deliverables aimed at building a user friendly
decision support system for the design phase that started subsequently.
The three core BILOBA work packages attributed to the preparation of BSW Chips, the
Analytical Instrument and the Interfaces and Biochemistry started following this common

specifications. Target of these three work packages was the development and set-up of
technical hard- and software, patterned surface functionalization and workflows for
performing biomarker detection assays.
In the work package related to BSW Biochips, the partners carried out the following work and
achieved the related results:
Development of physical/mathematical tools and related software to be used to design
and optimize 1DPC sustaining BSW for optical bio-sensing
Design, fabrication and integration of optimized plastic substrates for the final biochips
Design and test of optimized low loss, BSW supporting thin film systems on polymers
Fabrication of the biochips operating at several different wavelengths
Test of the BSW biochips performance for label-free and fluorescence operation
The work package related to the development of the Analytical Instrument was focused on the
following major tasks and obtained the related results:
Design, fabrication and testing of BSW biochips working with a preliminary optical
system for the label-free and fluorescence operation
Final design and fabrication of an optical system capable of working in both label-free
and fluorescence modes
Development and fabrication of an integrated analytes handling system
Fabrication of two types of microfluidic cells (two components injection molded and
multilayer) to be integrated with the plastic biochip
Development and fabrication of the system electronics including firmware and user
software;
The partners involved in the Interfaces and Biochemistry work package carried out the
following work with the related results:
Development of two different routes to deposit functional coatings on the surface of the
BSW biochips by means of plasma-polymerisation and of wet functionalisation
protocols
Optimization of the assays based on standard fluorescence readout
Production of functionalized BSW biochips by plasma-polymerization
Production of functionalized BSW biochips by optimized wet techniques
Following the initial tasks, a test phase completed the development of the Analytical System. It
was devoted to carry out the physical and chemical characterization of the complete BILOBA
platform utilizing the technical solutions developed in the core technical work packages BSW
Chips, Analytical Instrument, and Interfaces and Biochemistry. Moreover, comparative
measurements were performed with the aim of testing the performance of the BILOBA
platform versus state of the art commercial SPR assays. The significant results obtained were:
Determination of the overall system performance on standard samples, in terms of
label-free and fluorescence detection;
Comparison and rating of the results from the BSW platform with those of a standard
SPR platform;
Implementation of first assays on the BILOBA platform.
The work package related to Pre-Clinical Tests started its activities already at an early stage of
the project. It was focused in its initial period on the ethical management of the project
activities and on the design of the assay protocol to be used for detecting the bio-markers
targeted by BILOBA. During the second period, the work package operated in parallel to the
core technical work packages and produced the following results:
Setting up procedures to concentrate analytes and to eliminate albumin and
immunoglobulin from plasma that could interfere in the measurements
Preparation of ELISA assays for VEGF, Ang-1 and Ang-2
Genetically engineer tumor cell lines overexpressing Ang-1, Ang-2 and VEGF
Once the BILOBA platform was finalized, it was used in performing the pre-clinical assays for
cancer biomarker detection and validating the system. For this purpose the growth factors
VEGF, Ang-1 and Ang-2 have been analyzed in
buffered solutions
cell cultures
plasma from transgenic mouse models
sera from patients with metastatic colorectal cancer
All the research work in the project was accompanied by a work package devoted to the
Dissemination and Exploitation of the results. The scientific results were disseminated through
publication of articles in peer-reviewed journals and participation at scientific conferences. A
list of accepted/submitted papers and conference proceedings has been regularly updated on
the BILOBA web-site (www.biloba-project.eu). BILOBA published Project Fact Sheets and a
foldable flyer was distributed at conferences focusing on biosensing. A complete Plan for the
Use, Dissemination and Exploitation of the Foreground of the project BILOBA was prepared.
3.1.1 1DPC stacks and biochips
During the project, the partners SAPIENZA, POLITO and FRAUNHOFER purposely developed
numerical simulation tools that were used to design and optimize 1DPC, in order to
simultaneously maximize the performance of the complete biochips for both the label-free and
fluorescence operation. Several different families of 1DPC were designed, fabricated and tested
during the first period of the project before getting to a final optimized performance.
Two different 1DPC deposition
technologies were developed in
parallel in the frame of the
project, one based on Ta2O5, SiO2,
TiO2 dielectrics deposited by
plasma ion assisted deposition
under high vacuum conditions
(PIAD, FRAUNHOFER) and one
based on binary and ternary
silicon alloys deposited by plasma
enhanced chemical vapor
deposition (PECVD, POLITO).
These technologies produced
families of high quality 1DPC
biochips operating at several
different wavelengths (532 nm,
546 nm, 632 nm, 670 nm, and
804 nm), demonstrating the flexibility of the 1DPC approach to electromagnetic surface wave
propagation.
At the end of the first period, the project activities converged to one deposition technology
(PIAD) and one specific 1DPC design, giving rise to a final generation of optimized biochips that
were used, during the second period, in comparative experiments with a state-of-the-art SPR
biosensing platform and in the final cancer biomarker detection assays carried out in a pre-
clinical environment.
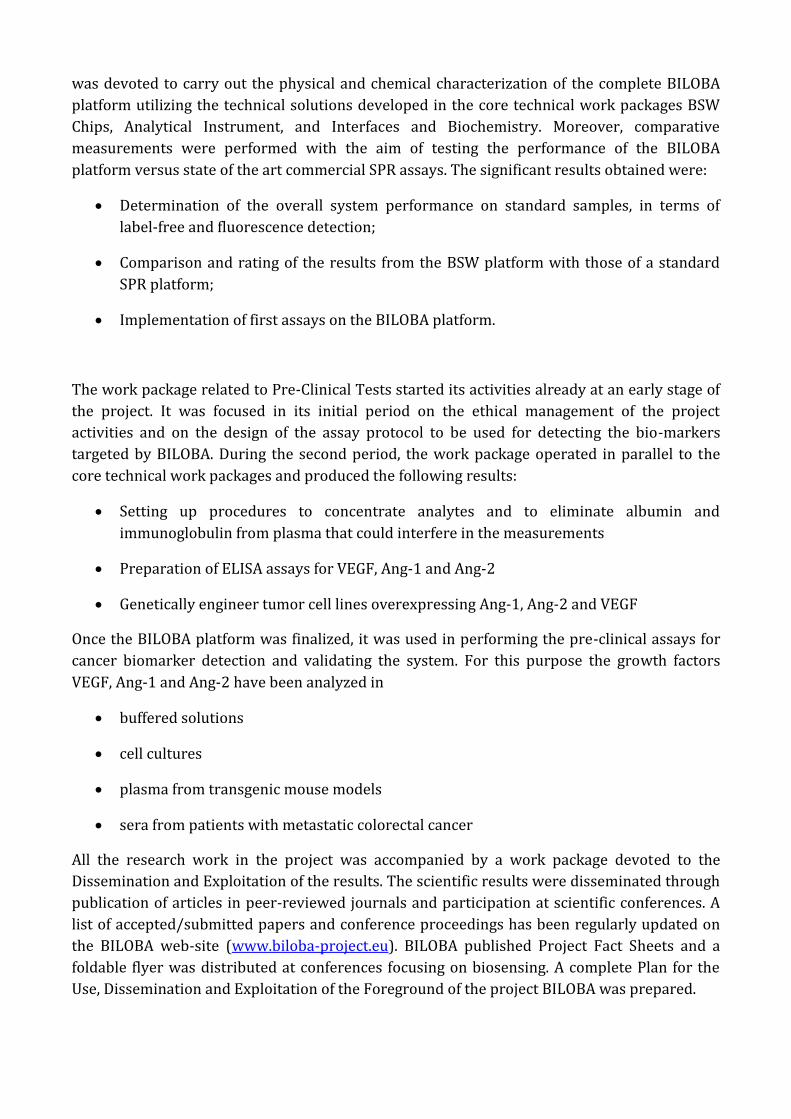
Injection molded polymer chips made of TOPAS® were purposely developed and manufactured
by KDS (Figure 4). These comprise a prism shaped cross section in order to excite the surface
wave in Kretschmann configuration. Additionally, a two-component flow cell has been molded.
It consists of a hard polymer cover that can be clicked by hand onto the chip. Inside this cover
an elastomer defines a straight micro channel of 800 µm x 100 µm cross section as well as
perpendicularly aligned fluid connectors.
The injection molded chips were coated by PIAD with 1DPC sustaining BSW at their surface in
aqueous environment, at the label-free wavelength of operation λ0=670 nm. The final structure
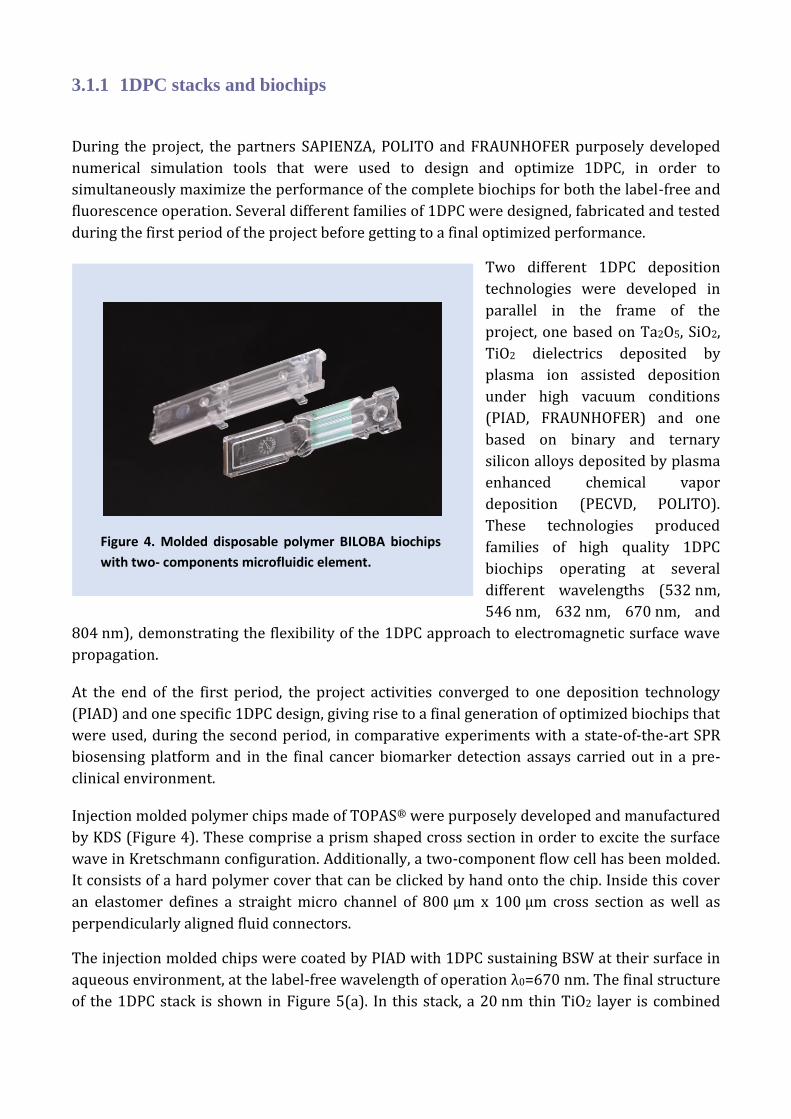
of the 1DPC stack is shown in Figure 5(a). In this stack, a 20 nm thin TiO2 layer is combined
Figure 4. Molded disposable polymer BILOBA biochips
with two- components microfluidic element.
with a periodic SiO2 / Ta2O5 stack comprising 275 nm and 120 nm thicknesses, respectively
(nSiO2 = 1.474 + i 5×10⁻⁶, nTa2O5 = 2.160 + i 5×10⁻⁵, nTiO2 = 2.28 + i 1.8×10⁻³.
Depending on the chemical surface functionalization route, the last layer terminating the 1DPC
can be either a 20 nm thin SiO2 layer, providing the starting surface for silane based
functionalization protocols, or a 40 nm thin plasma polymerized poly-acrylic-acid layer,
directly providing the carboxylic groups needed to bind biomolecules at the surface. In Figure
5(a) the case of biochips fabricated for silane based functionalization is shown.
As it can be seen from Figure 5(a) under resonant conditions the electromagnetic field is
strongly confined at the biochip surface. The field shows an evanescent tail in the external
medium, with a penetration depth of the order of one hundred nanometers, which is used for
biosensing. Figure 5(b) illustrates the dispersion of the resonance in the wavelength-angle-
plane. Two surface modes exhibiting different polarization are apparent. The TE resonance has
been optimized for label-free sensing, but the stack design supports a rather wide and shallow
TM mode at lower angles (wavelengths). Only the TE polarized mode is utilized for label-free
operation, although both polarizations might be exploited, for example in ellipsometric
approaches.
The fluorescence emitted by randomly oriented dye labels located on top of such stack was
simulated rigorously by means of a transfer-matrix algorithm frequently applied for the
modelling of Organic LED. In Figure 5(c) we show the results when the emission spectrum of
the DyLight650 dye (Abcam, UK) is assumed. It is observed that the fluorescence energy is
coupled preferentially into the surface modes, giving rise to a sharp resonance enhancement.
The dispersion of such spontaneous emission is identical to the dispersion of the resonance.
Thus, each wavelength is emitted at a slightly different angle as defined by the thin film stack’s
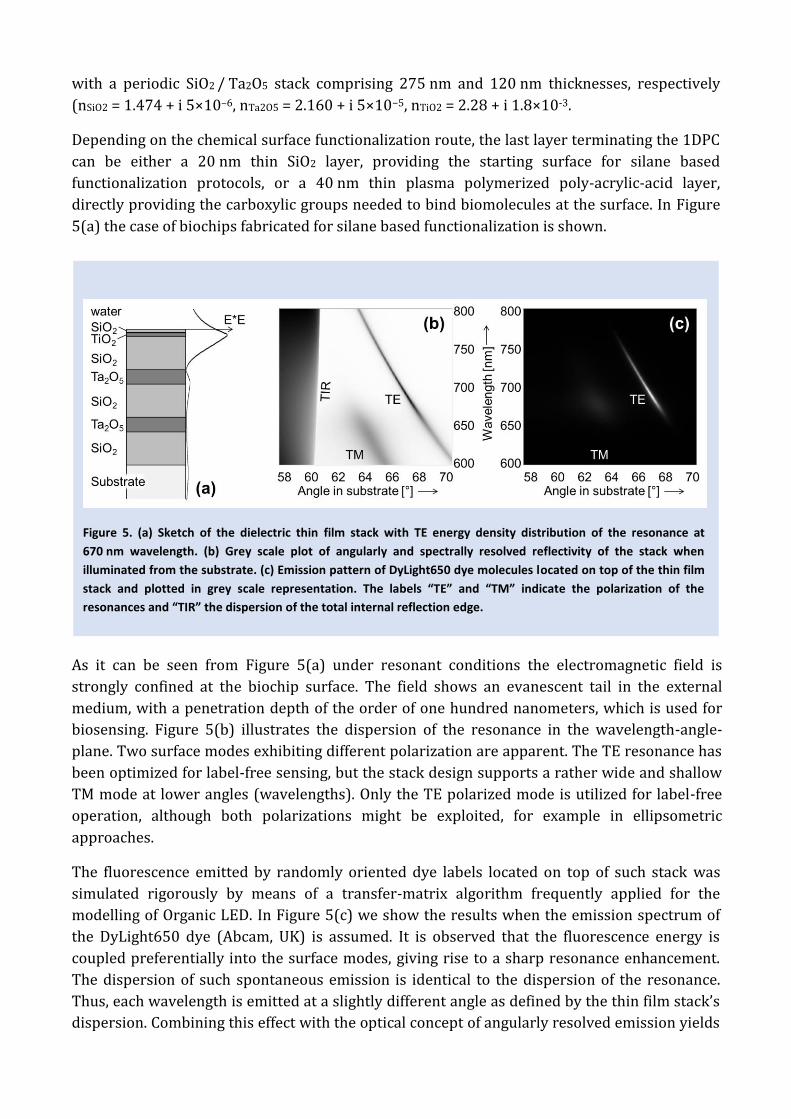
dispersion. Combining this effect with the optical concept of angularly resolved emission yields
Figure 5. (a) Sketch of the dielectric thin film stack with TE energy density distribution of the resonance at
670 nm wavelength. (b) Grey scale plot of angularly and spectrally resolved reflectivity of the stack when
illuminated from the substrate. (c) Emission pattern of DyLight650 dye molecules located on top of the thin film
stack and plotted in grey scale representation. The labels “TE” and “TM” indicate the polarization of the
resonances and “TIR” the dispersion of the total internal reflection edge.
an expected fluorescence
angular distribution as
shown in Figure 6. Each
polarized component of
the emission (TE or TM) is
detected as a separate
peak, comprising an
angularly dependent
wavelength as given by
the dispersion of the
surface wave in Figure
5(c). It should be noted
that the angular
dispersion as well as the
angular separation of
polarized emission is due
to stack design and might
be altered by adapting the
thin film system.
3.1.2 Analytical Instrument
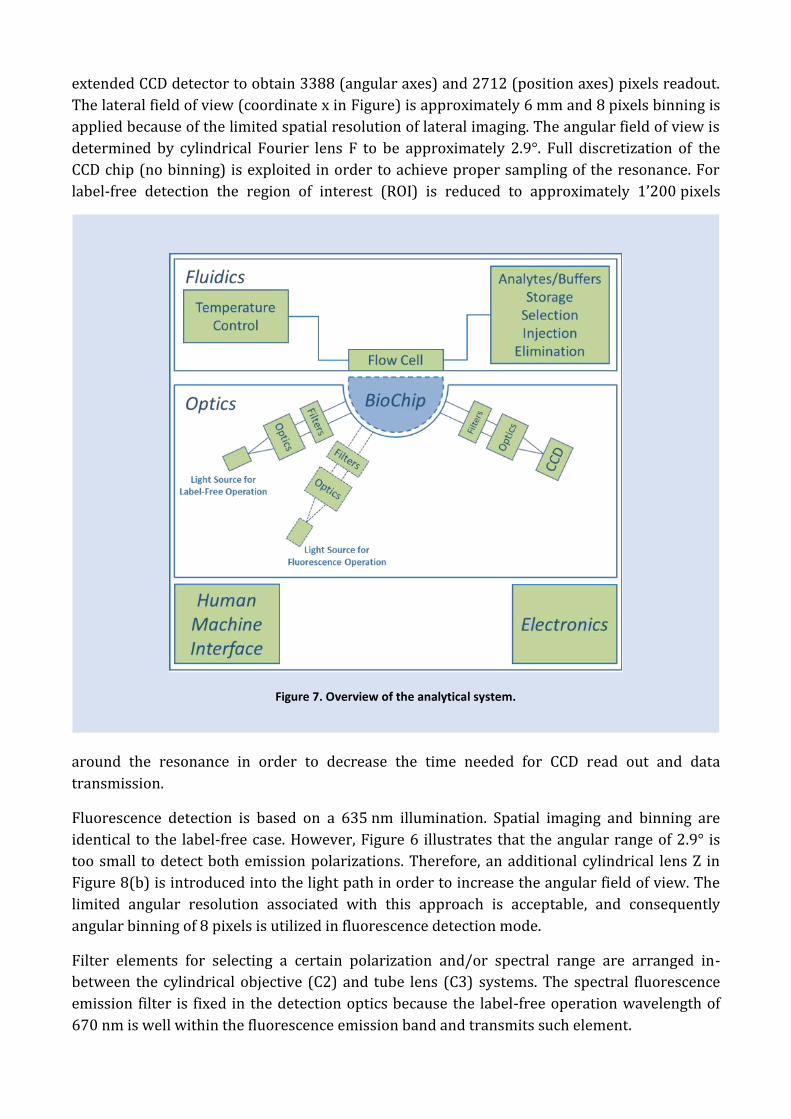
The general sketch of the analytical instrument is depicted in Figure 7. It illustrates that the
biochip is the key element to integrate the functionalities of fluidics (top, BIOTRAY and
FRAUNHOFER) and optics (bottom, FRAUNHOFER) by combining the optical chip (POLITO,
FRAUNHOFER, SAPIENZA, KDS) with an appropriate microfluidic flow cell (KDS).
Supplementary electronics and human machine interface components are supporting the
operation of the instrument and making it user friendly (LABOR). All the different hardware
components have been developed in their respective tasks.
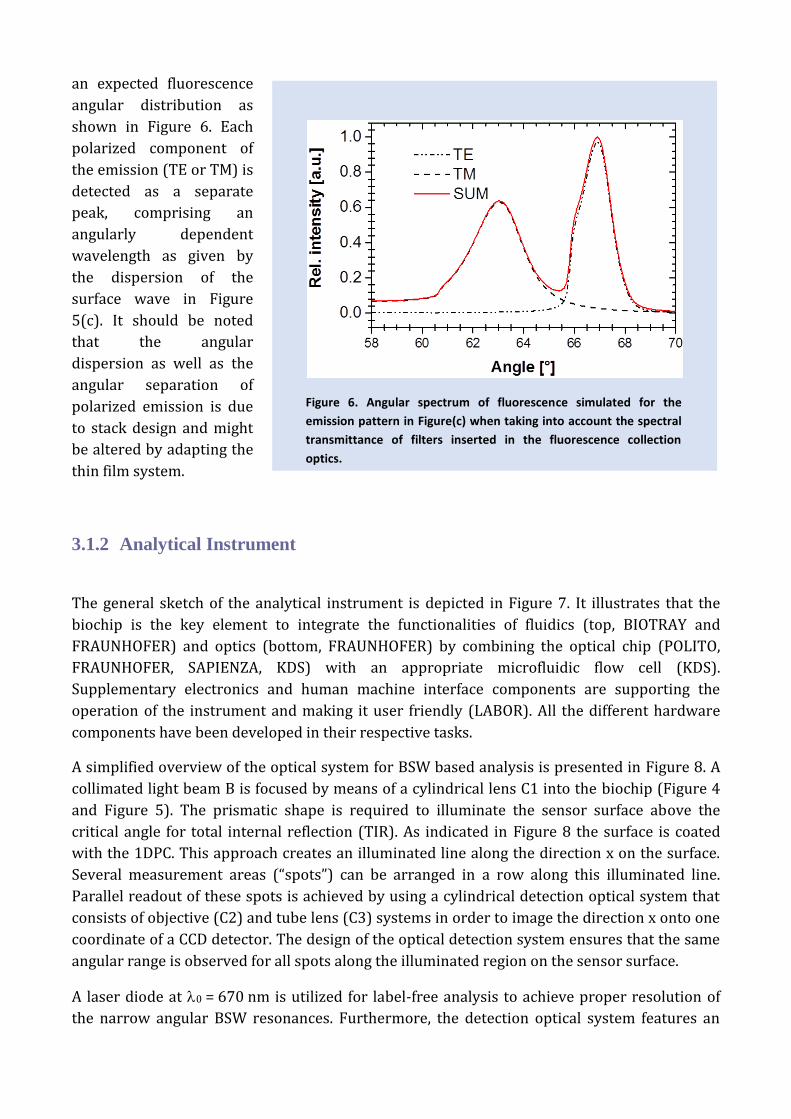
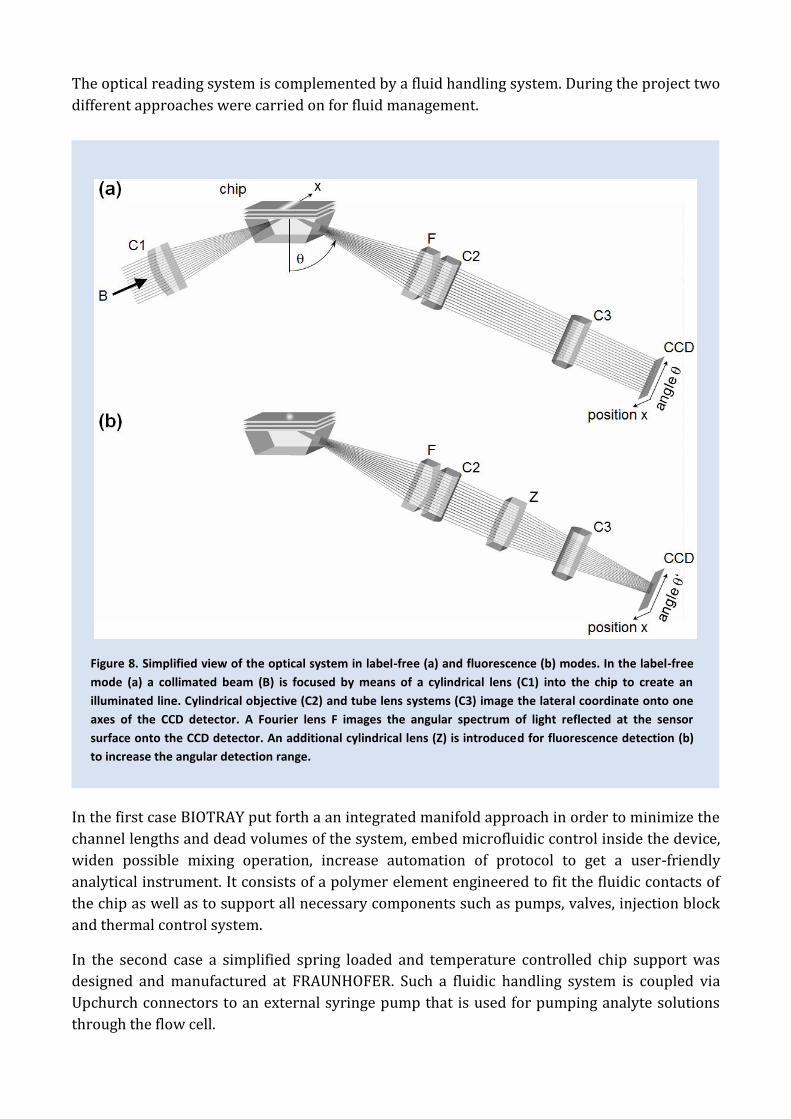
A simplified overview of the optical system for BSW based analysis is presented in Figure 8. A
collimated light beam B is focused by means of a cylindrical lens C1 into the biochip (Figure 4
and Figure 5). The prismatic shape is required to illuminate the sensor surface above the
critical angle for total internal reflection (TIR). As indicated in Figure 8 the surface is coated
with the 1DPC. This approach creates an illuminated line along the direction x on the surface.
Several measurement areas (“spots”) can be arranged in a row along this illuminated line.
Parallel readout of these spots is achieved by using a cylindrical detection optical system that
consists of objective (C2) and tube lens (C3) systems in order to image the direction x onto one
coordinate of a CCD detector. The design of the optical detection system ensures that the same
angular range is observed for all spots along the illuminated region on the sensor surface.
A laser diode at 0 = 670 nm is utilized for label-free analysis to achieve proper resolution of
the narrow angular BSW resonances. Furthermore, the detection optical system features an
Figure 6. Angular spectrum of fluorescence simulated for the
emission pattern in Figure(c) when taking into account the spectral
transmittance of filters inserted in the fluorescence collection
optics.
extended CCD detector to obtain 3388 (angular axes) and 2712 (position axes) pixels readout.
The lateral field of view (coordinate x in Figure) is approximately 6 mm and 8 pixels binning is
applied because of the limited spatial resolution of lateral imaging. The angular field of view is
determined by cylindrical Fourier lens F to be approximately 2.9°. Full discretization of the
CCD chip (no binning) is exploited in order to achieve proper sampling of the resonance. For
label-free detection the region of interest (ROI) is reduced to approximately 1’200 pixels
around the resonance in order to decrease the time needed for CCD read out and data
transmission.
Fluorescence detection is based on a 635 nm illumination. Spatial imaging and binning are
identical to the label-free case. However, Figure 6 illustrates that the angular range of 2.9° is
too small to detect both emission polarizations. Therefore, an additional cylindrical lens Z in
Figure 8(b) is introduced into the light path in order to increase the angular field of view. The
limited angular resolution associated with this approach is acceptable, and consequently
angular binning of 8 pixels is utilized in fluorescence detection mode.
Filter elements for selecting a certain polarization and/or spectral range are arranged in-
between the cylindrical objective (C2) and tube lens (C3) systems. The spectral fluorescence
emission filter is fixed in the detection optics because the label-free operation wavelength of
670 nm is well within the fluorescence emission band and transmits such element.
Figure 7. Overview of the analytical system.
The optical reading system is complemented by a fluid handling system. During the project two
different approaches were carried on for fluid management.
In the first case BIOTRAY put forth a an integrated manifold approach in order to minimize the
channel lengths and dead volumes of the system, embed microfluidic control inside the device,
widen possible mixing operation, increase automation of protocol to get a user-friendly
analytical instrument. It consists of a polymer element engineered to fit the fluidic contacts of
the chip as well as to support all necessary components such as pumps, valves, injection block
and thermal control system.
In the second case a simplified spring loaded and temperature controlled chip support was
designed and manufactured at FRAUNHOFER. Such a fluidic handling system is coupled via
Upchurch connectors to an external syringe pump that is used for pumping analyte solutions
through the flow cell.
Figure 8. Simplified view of the optical system in label-free (a) and fluorescence (b) modes. In the label-free
mode (a) a collimated beam (B) is focused by means of a cylindrical lens (C1) into the chip to create an
illuminated line. Cylindrical objective (C2) and tube lens systems (C3) image the lateral coordinate onto one
axes of the CCD detector. A Fourier lens F images the angular spectrum of light reflected at the sensor
surface onto the CCD detector. An additional cylindrical lens (Z) is introduced for fluorescence detection (b)
to increase the angular detection range.
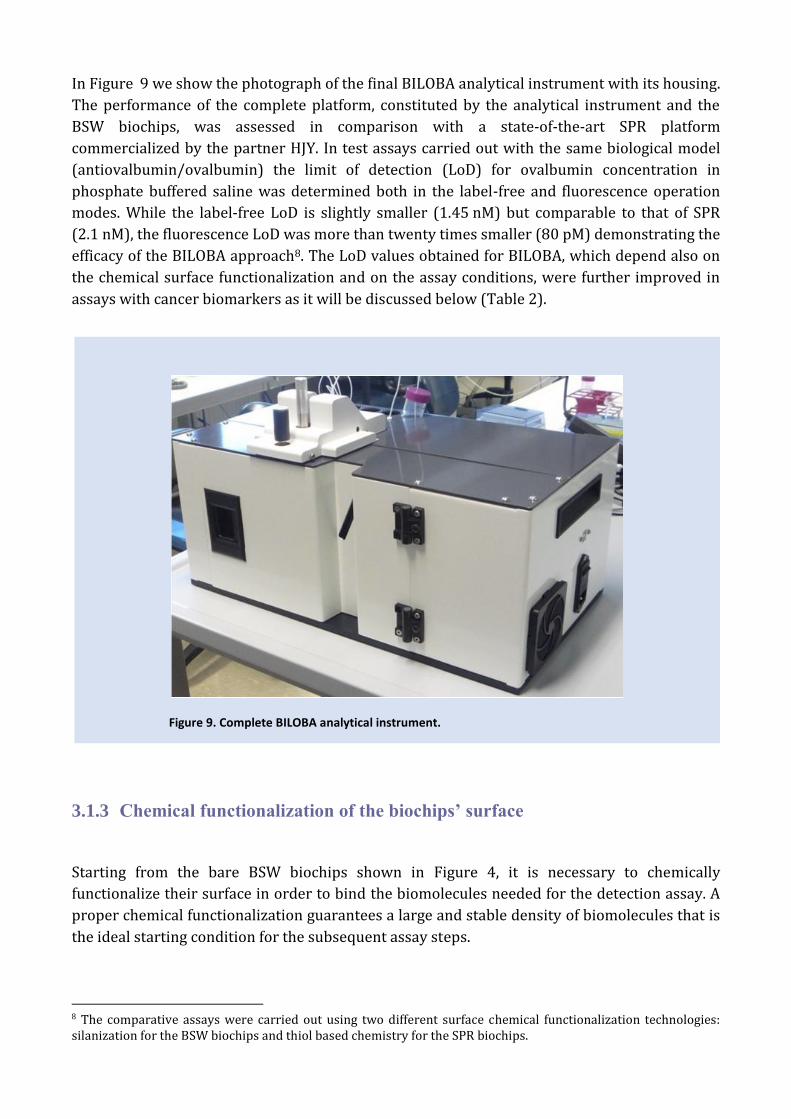
In Figure 9 we show the photograph of the final BILOBA analytical instrument with its housing.
The performance of the complete platform, constituted by the analytical instrument and the
BSW biochips, was assessed in comparison with a state-of-the-art SPR platform
commercialized by the partner HJY. In test assays carried out with the same biological model
(antiovalbumin/ovalbumin) the limit of detection (LoD) for ovalbumin concentration in
phosphate buffered saline was determined both in the label-free and fluorescence operation
modes. While the label-free LoD is slightly smaller (1.45 nM) but comparable to that of SPR
(2.1 nM), the fluorescence LoD was more than twenty times smaller (80 pM) demonstrating the
efficacy of the BILOBA approach8. The LoD values obtained for BILOBA, which depend also on
the chemical surface functionalization and on the assay conditions, were further improved in
assays with cancer biomarkers as it will be discussed below (Table 2).
3.1.3 Chemical functionalization of the biochips’ surface
Starting from the bare BSW biochips shown in Figure 4, it is necessary to chemically
functionalize their surface in order to bind the biomolecules needed for the detection assay. A
proper chemical functionalization guarantees a large and stable density of biomolecules that is
the ideal starting condition for the subsequent assay steps.
8 The comparative assays were carried out using two different surface chemical functionalization technologies: silanization for the BSW biochips and thiol based chemistry for the SPR biochips.
Figure 9. Complete BILOBA analytical instrument.
During the project duration, the partners developed in parallel several different surface
chemical functionalization routes. In particular they worked on wet techniques (IMPERIAL)
and dry techniques (POLITO). In the first case, procedures for the wet deposition of nanometric
chemical functionalization layers based on APTES ((3-Aminopropyl)-triethoxysilane) were
developed by adapting to the case of the BSW biochips. In the second case, dry chemical
functionalization with thin (40 nm) poly-acrylic-acid layers (ppAA) was achieved by plasma
assisted deposition.
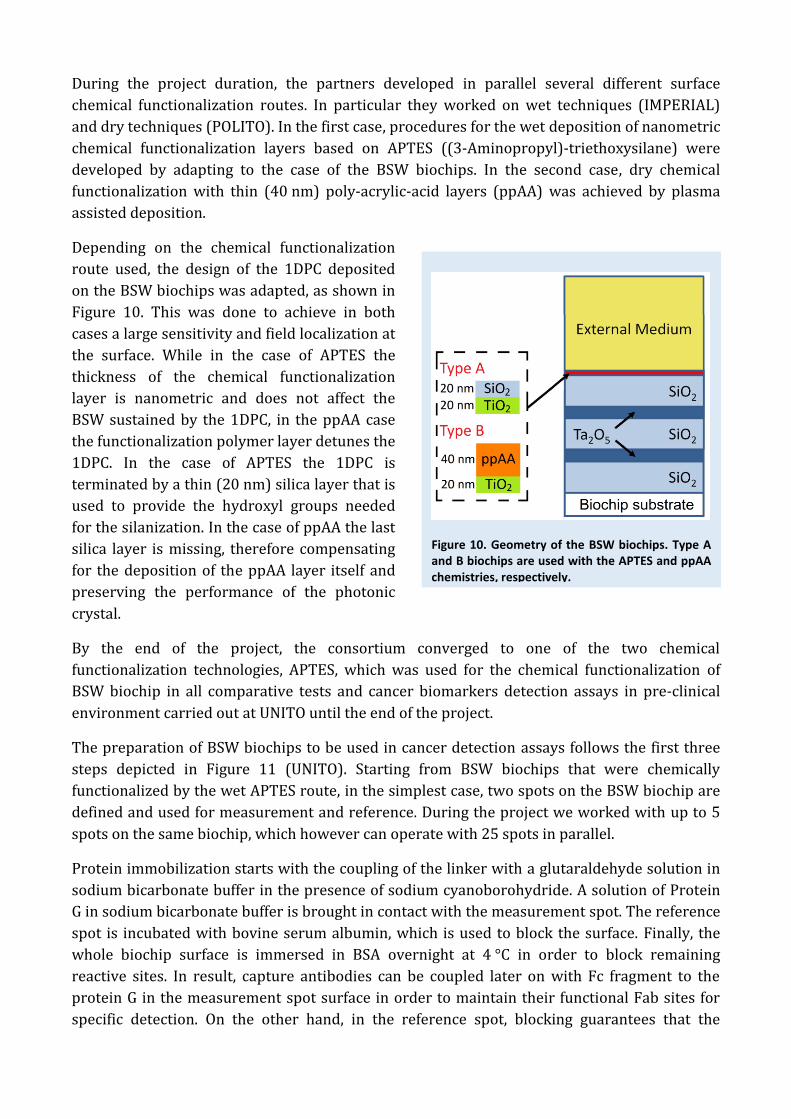
Depending on the chemical functionalization
route used, the design of the 1DPC deposited
on the BSW biochips was adapted, as shown in
Figure 10. This was done to achieve in both
cases a large sensitivity and field localization at
the surface. While in the case of APTES the
thickness of the chemical functionalization
layer is nanometric and does not affect the
BSW sustained by the 1DPC, in the ppAA case
the functionalization polymer layer detunes the
1DPC. In the case of APTES the 1DPC is
terminated by a thin (20 nm) silica layer that is
used to provide the hydroxyl groups needed
for the silanization. In the case of ppAA the last
silica layer is missing, therefore compensating
for the deposition of the ppAA layer itself and
preserving the performance of the photonic
crystal.
By the end of the project, the consortium converged to one of the two chemical
functionalization technologies, APTES, which was used for the chemical functionalization of
BSW biochip in all comparative tests and cancer biomarkers detection assays in pre-clinical
environment carried out at UNITO until the end of the project.
The preparation of BSW biochips to be used in cancer detection assays follows the first three
steps depicted in Figure 11 (UNITO). Starting from BSW biochips that were chemically
functionalized by the wet APTES route, in the simplest case, two spots on the BSW biochip are
defined and used for measurement and reference. During the project we worked with up to 5
spots on the same biochip, which however can operate with 25 spots in parallel.
Protein immobilization starts with the coupling of the linker with a glutaraldehyde solution in
sodium bicarbonate buffer in the presence of sodium cyanoborohydride. A solution of Protein
G in sodium bicarbonate buffer is brought in contact with the measurement spot. The reference
spot is incubated with bovine serum albumin, which is used to block the surface. Finally, the
whole biochip surface is immersed in BSA overnight at 4 °C in order to block remaining
reactive sites. In result, capture antibodies can be coupled later on with Fc fragment to the
protein G in the measurement spot surface in order to maintain their functional Fab sites for
specific detection. On the other hand, in the reference spot, blocking guarantees that the
Figure 10. Geometry of the BSW biochips. Type A and B biochips are used with the APTES and ppAA chemistries, respectively.
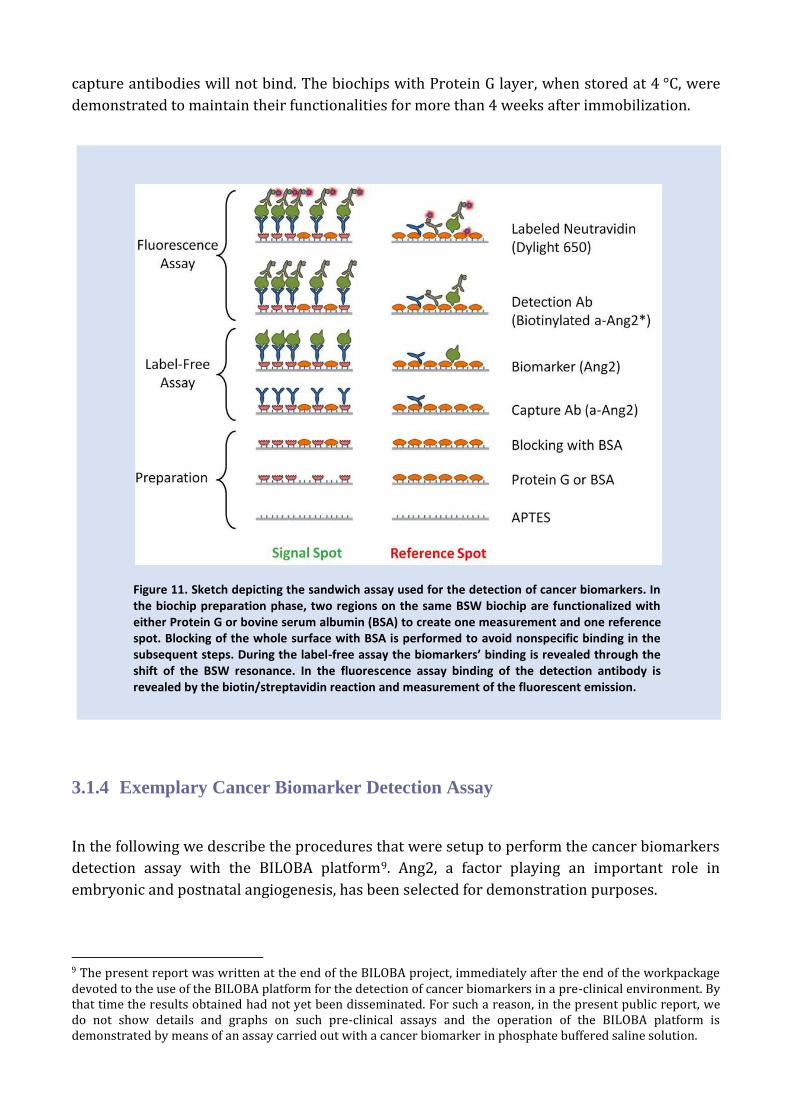
capture antibodies will not bind. The biochips with Protein G layer, when stored at 4 °C, were
demonstrated to maintain their functionalities for more than 4 weeks after immobilization.
3.1.4 Exemplary Cancer Biomarker Detection Assay
In the following we describe the procedures that were setup to perform the cancer biomarkers
detection assay with the BILOBA platform9. Ang2, a factor playing an important role in
embryonic and postnatal angiogenesis, has been selected for demonstration purposes.
9 The present report was written at the end of the BILOBA project, immediately after the end of the workpackage devoted to the use of the BILOBA platform for the detection of cancer biomarkers in a pre-clinical environment. By that time the results obtained had not yet been disseminated. For such a reason, in the present public report, we do not show details and graphs on such pre-clinical assays and the operation of the BILOBA platform is demonstrated by means of an assay carried out with a cancer biomarker in phosphate buffered saline solution.
Figure 11. Sketch depicting the sandwich assay used for the detection of cancer biomarkers. In the biochip preparation phase, two regions on the same BSW biochip are functionalized with either Protein G or bovine serum albumin (BSA) to create one measurement and one reference spot. Blocking of the whole surface with BSA is performed to avoid nonspecific binding in the subsequent steps. During the label-free assay the biomarkers’ binding is revealed through the shift of the BSW resonance. In the fluorescence assay binding of the detection antibody is revealed by the biotin/streptavidin reaction and measurement of the fluorescent emission.
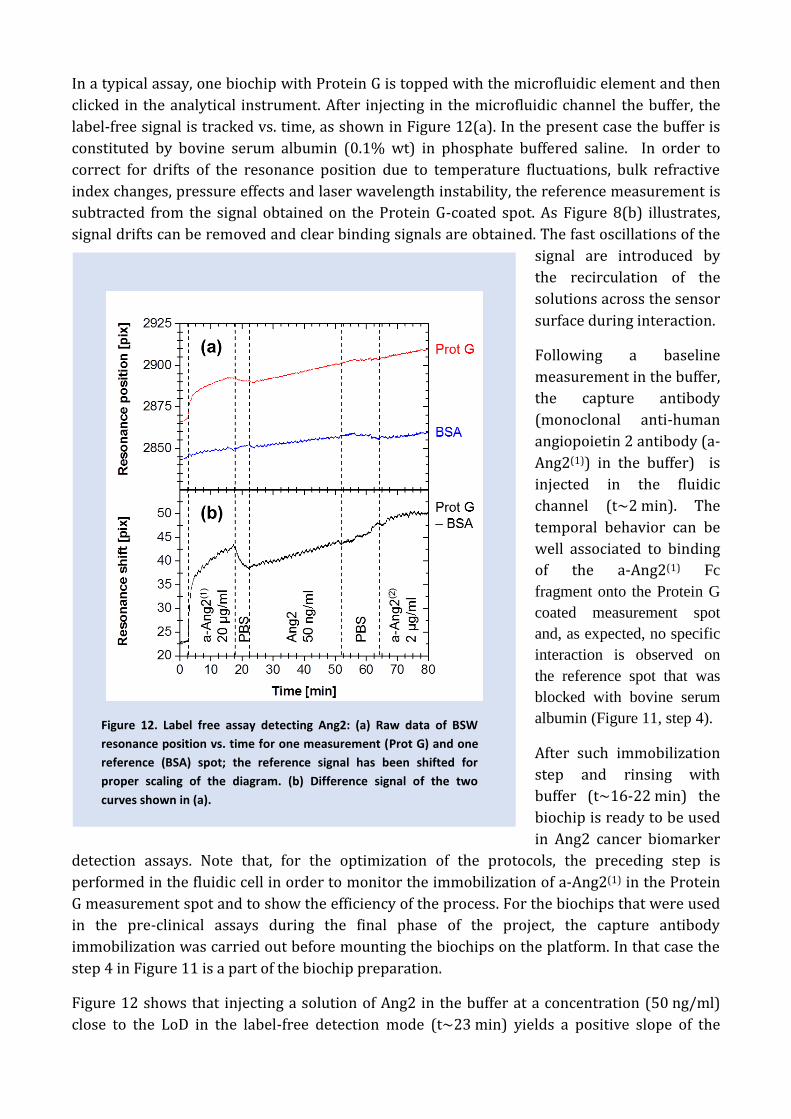
In a typical assay, one biochip with Protein G is topped with the microfluidic element and then
clicked in the analytical instrument. After injecting in the microfluidic channel the buffer, the
label-free signal is tracked vs. time, as shown in Figure 12(a). In the present case the buffer is
constituted by bovine serum albumin (0.1% wt) in phosphate buffered saline. In order to
correct for drifts of the resonance position due to temperature fluctuations, bulk refractive
index changes, pressure effects and laser wavelength instability, the reference measurement is
subtracted from the signal obtained on the Protein G-coated spot. As Figure 8(b) illustrates,
signal drifts can be removed and clear binding signals are obtained. The fast oscillations of the
signal are introduced by
the recirculation of the
solutions across the sensor
surface during interaction.
Following a baseline
measurement in the buffer,
the capture antibody
(monoclonal anti-human
angiopoietin 2 antibody (a-
Ang2(1)) in the buffer) is
injected in the fluidic
channel (t~2 min). The
temporal behavior can be
well associated to binding
of the a-Ang2(1) Fc
fragment onto the Protein G
coated measurement spot
and, as expected, no specific
interaction is observed on
the reference spot that was
blocked with bovine serum
albumin (Figure 11, step 4).
After such immobilization
step and rinsing with
buffer (t~16-22 min) the
biochip is ready to be used
in Ang2 cancer biomarker
detection assays. Note that, for the optimization of the protocols, the preceding step is
performed in the fluidic cell in order to monitor the immobilization of a-Ang2(1) in the Protein
G measurement spot and to show the efficiency of the process. For the biochips that were used
in the pre-clinical assays during the final phase of the project, the capture antibody
immobilization was carried out before mounting the biochips on the platform. In that case the
step 4 in Figure 11 is a part of the biochip preparation.
Figure 12 shows that injecting a solution of Ang2 in the buffer at a concentration (50 ng/ml)
close to the LoD in the label-free detection mode (t~23 min) yields a positive slope of the
Figure 12. Label free assay detecting Ang2: (a) Raw data of BSW
resonance position vs. time for one measurement (Prot G) and one
reference (BSA) spot; the reference signal has been shifted for
proper scaling of the diagram. (b) Difference signal of the two
curves shown in (a).
differential signal, which might indicate a net increase of mass density at the measurement
surface due to the specific detection of Ang2 via the capture antibody. However such signal can
be hardly distinguished from the baseline drift, replicating a situation that is typical, for
example in SPR, in optical label-free assays. This is the situation in which the fluorescence
operation of the BILOBA platform, carried out according to the last three steps depicted in
Figure 11, permits to increase the resolution and to give a clear response.
In order to carry out the fluorescence assay (Figure 11), a solution of a further specific
monoclonal detection human angiopoietin 2 biotinylated antibody (a-Ang2(2)) in the buffer is
injected in order to recognize the surface bound antigen. Biotinylation enables one to introduce
fluorescent labels in a last step by injecting a solution of a dye (DyLight 650) conjugated
neutravidin in phosphate buffered saline. Thus, fluorescence emission will indicate the
presence of antigen at the
biochip surface. In
between all steps, the
sensor surface is typically
washed with the buffer to
remove any proteins or
antibodies that are non-
specifically bound.
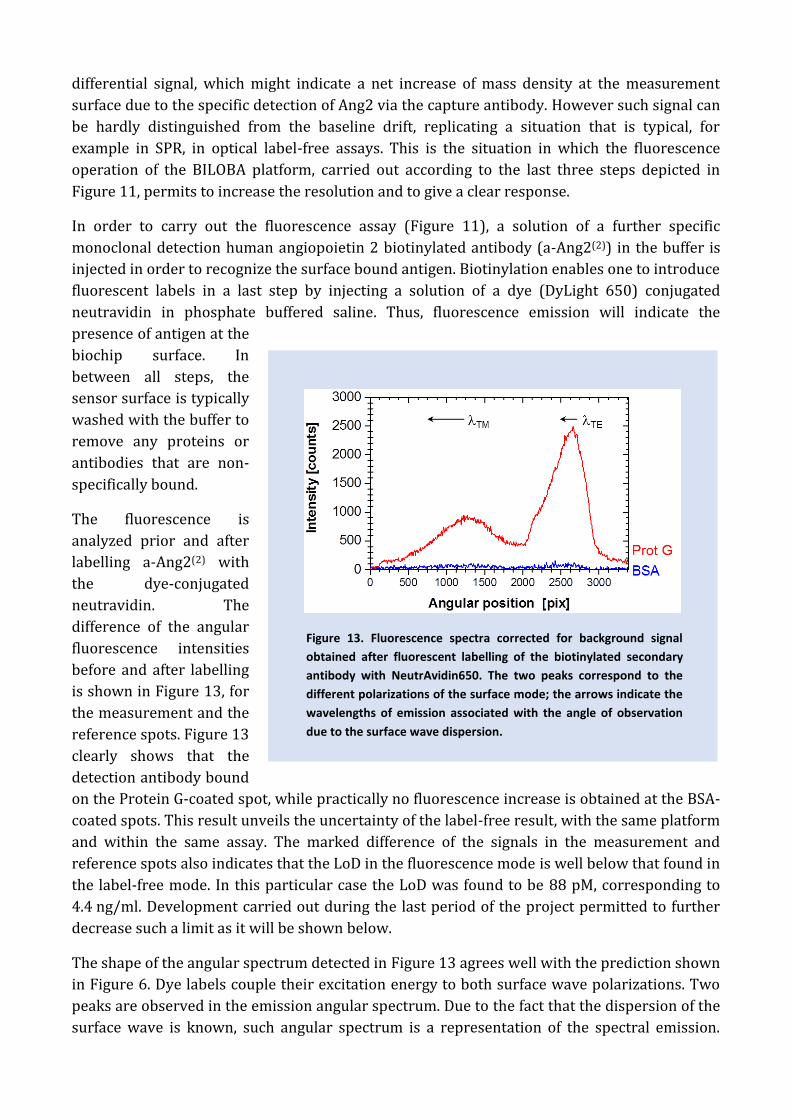
The fluorescence is
analyzed prior and after
labelling a-Ang2(2) with
the dye-conjugated
neutravidin. The
difference of the angular
fluorescence intensities
before and after labelling
is shown in Figure 13, for
the measurement and the
reference spots. Figure 13
clearly shows that the
detection antibody bound
on the Protein G-coated spot, while practically no fluorescence increase is obtained at the BSA-
coated spots. This result unveils the uncertainty of the label-free result, with the same platform
and within the same assay. The marked difference of the signals in the measurement and
reference spots also indicates that the LoD in the fluorescence mode is well below that found in
the label-free mode. In this particular case the LoD was found to be 88 pM, corresponding to
4.4 ng/ml. Development carried out during the last period of the project permitted to further
decrease such a limit as it will be shown below.
The shape of the angular spectrum detected in Figure 13 agrees well with the prediction shown
in Figure 6. Dye labels couple their excitation energy to both surface wave polarizations. Two
peaks are observed in the emission angular spectrum. Due to the fact that the dispersion of the
surface wave is known, such angular spectrum is a representation of the spectral emission.
Figure 13. Fluorescence spectra corrected for background signal
obtained after fluorescent labelling of the biotinylated secondary
antibody with NeutrAvidin650. The two peaks correspond to the
different polarizations of the surface mode; the arrows indicate the
wavelengths of emission associated with the angle of observation
due to the surface wave dispersion.
Note, that the wavelength – angle relation is not similar for both polarizations. Furthermore, it
is in general non-linear (compare Figure 5). That’s why the two arrows indicate the wavelength
scale direction only, without showing a second axis.
We point out that the last two steps of the fluorescence assay (Figure 11) can be coupled by directly using dye-conjugated detection antibodies. This route was not followed during the project to maintain a certain degree of flexibility of the protocols. However in an industrial application this is the route to be implemented, since it reduces the duration of the assay and the complexity of the procedures.
During the BILOBA project, assays for the detection of the three target cancer biomarkers (angiopoietin 1 and 2 and vascular endothelial growth factor) were carried out in several different laboratories of the consortium with preliminary versions of the platform and at UNITO with the final platform and protocols. This permitted to determine the specifications of the final platform that we report in the next section. It was particularly important the last phase of the project that permitted to test the performance of the platform with pre-clinical models, namely buffered solutions, cell cultures, plasma from transgenic mouse models, sera from patients with metastatic colorectal cancer10.
3.2 Platform Specifications
At the end of the BILOBA project the consortium successfully achieved the following results:
On a single biochip platform, integration of label-free detection based on the BSW
resonance shift, and enhanced spectral intensity of fluorescence emitted by
biomolecules immobilized on the surface
Design and fabrication of biochips with increased sensitivity and resolution;
Development of surface functionalization techniques to obtain biochips that are
selective for specific cancer biomarkers;
Design and fabrication of a user-friendly analytical instrument for biosensing assays;
Validation of the performance of the point-of-care platform for the detection of specific
cancer biomarkers at a pre-clinical stage.
The objectives that were pursued and achieved by the consortium are summarized in Table 2.
The results obtained at the end of the project with the BILOBA system have been compared to
the target values for the relevant parameters, and to the performance of the SPR platforms.
10 Collection, processing, storage and use of human blood samples strictly adhered to the BILOBA protocol approved by the Ethical Committees and reported in the Ethical Manual. The protocol complies with national and European Union legislation, and respects international conventions and declarations. The protocol respects the fundamental ethical principles applicable to the study, considering in particular the importance of patient autonomy and privacy.
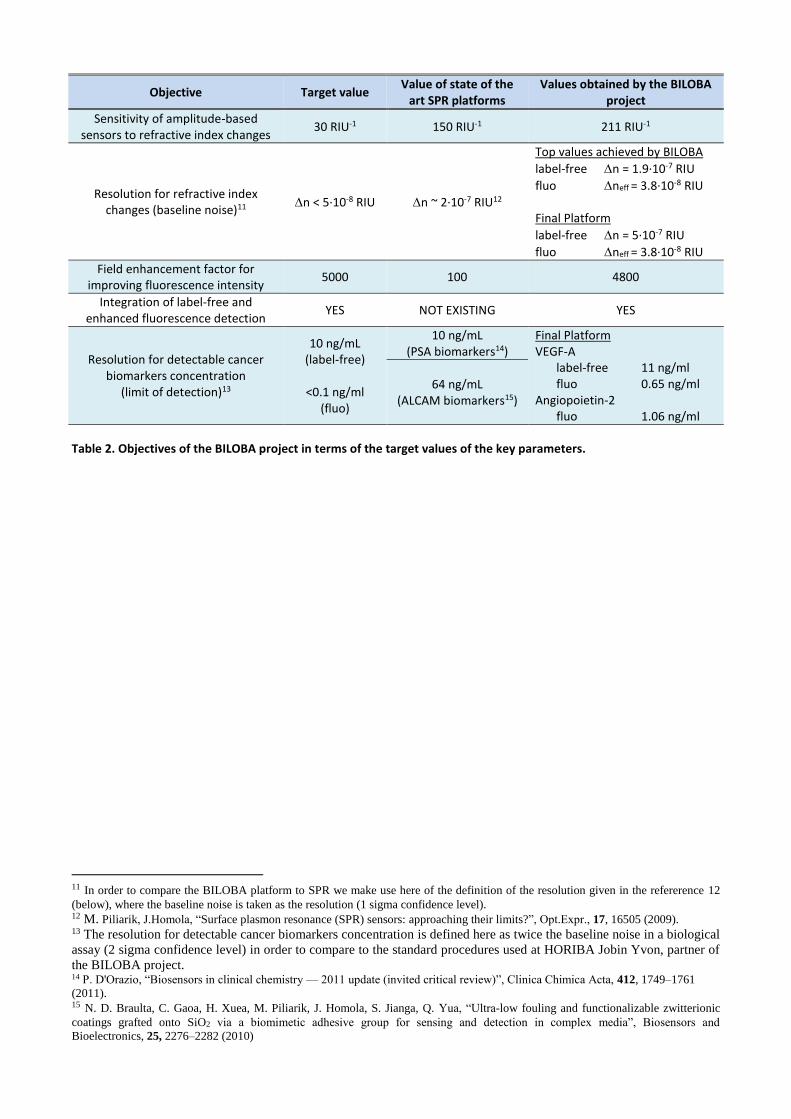
Objective Target value Value of state of the
art SPR platforms Values obtained by the BILOBA
project
Sensitivity of amplitude-based sensors to refractive index changes
30 RIU-1 150 RIU-1 211 RIU-1
Resolution for refractive index changes (baseline noise)11
n < 5·10-8 RIU n ~ 2·10-7 RIU12
Top values achieved by BILOBA
label-free n = 1.9·10-7 RIU
fluo neff = 3.8·10-8 RIU Final Platform
label-free n = 5·10-7 RIU
fluo neff = 3.8·10-8 RIU
Field enhancement factor for improving fluorescence intensity
5000 100 4800
Integration of label-free and enhanced fluorescence detection
YES NOT EXISTING YES
Resolution for detectable cancer biomarkers concentration
(limit of detection)13
10 ng/mL (label-free)
<0.1 ng/ml
(fluo)
10 ng/mL (PSA biomarkers14)
Final Platform VEGF-A label-free 11 ng/ml fluo 0.65 ng/ml Angiopoietin-2 fluo 1.06 ng/ml
64 ng/mL (ALCAM biomarkers15)
Table 2. Objectives of the BILOBA project in terms of the target values of the key parameters.
11 In order to compare the BILOBA platform to SPR we make use here of the definition of the resolution given in the refererence 12
(below), where the baseline noise is taken as the resolution (1 sigma confidence level). 12 M. Piliarik, J.Homola, “Surface plasmon resonance (SPR) sensors: approaching their limits?”, Opt.Expr., 17, 16505 (2009). 13 The resolution for detectable cancer biomarkers concentration is defined here as twice the baseline noise in a biological
assay (2 sigma confidence level) in order to compare to the standard procedures used at HORIBA Jobin Yvon, partner of
the BILOBA project. 14 P. D'Orazio, “Biosensors in clinical chemistry — 2011 update (invited critical review)”, Clinica Chimica Acta, 412, 1749–1761
(2011). 15 N. D. Braulta, C. Gaoa, H. Xuea, M. Piliarik, J. Homola, S. Jianga, Q. Yua, “Ultra-low fouling and functionalizable zwitterionic
coatings grafted onto SiO2 via a biomimetic adhesive group for sensing and detection in complex media”, Biosensors and
Bioelectronics, 25, 2276–2282 (2010)