Embed Size (px)
Citation preview
Final Report to
GVPesquisa
Fundação Getulio Vargas
EAESP
Strategic Options Development and Analysis: The Case of the Brazilian Railways
August 2007-February 2008
Dr. Phokion ‘Ion’ Georgiou Associate Professor (NDP)
FGV-EAESP/IMQ
Research Assistant:
Pedro Stevaux Curso de Graduação
EAESP


FINAL REPORT Strategic Options Development and Analysis: The Case of the Brazilian Railways
Dr ION GEORGIOU & PEDRO STEVAUX FGV-EAESP/IMQ
This has been the most difficult paper I have ever written.
The very first words of the 2004 report Privatizing British Railways: Are There Lessons for the World Bank and its Borrowers? by Louis S Thompson, Chief Railway Advisor, World Bank, 1986-2003.

FINAL REPORT Strategic Options Development and Analysis: The Case of the Brazilian Railways
Dr ION GEORGIOU & PEDRO STEVAUX FGV-EAESP/IMQ
Table of Contents Technical Note ______________________________________________________ 9
Abstract ___________________________________________________________ 11
Executive Summary _________________________________________________ 12
Introduction _______________________________________________________ 15
Chapter 1: Which Way to Macapá? ____________________________________ 19
Chapter 2: Constructs, Maps and Loops _________________________________ 31
Chapter 3: Mapping the Railways – the Process __________________________ 45
Chapter 4: Mapping the Railways – Initial Results ________________________ 59
The identification and preliminary exploration of prime causes ________________ 63
The identification and preliminary exploration of objectives ___________________ 68
The identification and preliminary exploration of the highly affected constructs __ 74
The identification and preliminary exploration of the highly affecting constructs __ 78
The identification and preliminary exploration of the most cited constructs ______ 85
The identification of constructs with high domain grade, and critical interpretation 87
Chapter 5: Mapping the Railways – The Feedback Loops ___________________ 91
Feedback Loop I: Targeting the Government’s Resources _____________________ 92
Feedback Loop II: Attacking the Degenerative Effects of Truck-Dependency _____ 93
Feedback Loop III: Knowledge Management and Organizational Learning ______ 96
Feedback Loop IV: False Stimuli or False Model? ___________________________ 98
Feedback Loops: Preliminary Opinion on their Influence ____________________ 101
Chapter 6: Critical Reflections _______________________________________ 104
Appendix 1 – scanned copies of all articles used _________________________ 105
Appendix 2 – list of all elicited constructs _______________________________ 129
Appendix 3 – distribution of all constructs according to identified issues _____ 131
Appendix 4 – maps of all individual actors’ articles with supplementary data __ 135
Neves ________________________________________________________________ 137
De Lima _____________________________________________________________ 139
Dreckmann ___________________________________________________________ 141
Da Silveira ___________________________________________________________ 143
FINAL REPORT Strategic Options Development and Analysis: The Case of the Brazilian Railways
Dr ION GEORGIOU & PEDRO STEVAUX FGV-EAESP/IMQ
6
Vilaça _______________________________________________________________ 145
Hees _________________________________________________________________ 147
Passos _______________________________________________________________ 150
Steinbruch ___________________________________________________________ 151
Bollinger _____________________________________________________________ 153
Reis _________________________________________________________________ 155
Appendix 5 – maps of all identified issues with supplementary data __________ 157
Concessionarias _______________________________________________________ 159
Consequencia _________________________________________________________ 161
Governo _____________________________________________________________ 162
Intermodal ___________________________________________________________ 163
Logistica _____________________________________________________________ 164
Malha _______________________________________________________________ 165
Manutenção __________________________________________________________ 166
Portos _______________________________________________________________ 167
Trans Rodoviario ______________________________________________________ 168
Urbano ______________________________________________________________ 169
References________________________________________________________ 171
FINAL REPORT Strategic Options Development and Analysis: The Case of the Brazilian Railways
Dr ION GEORGIOU & PEDRO STEVAUX FGV-EAESP/IMQ
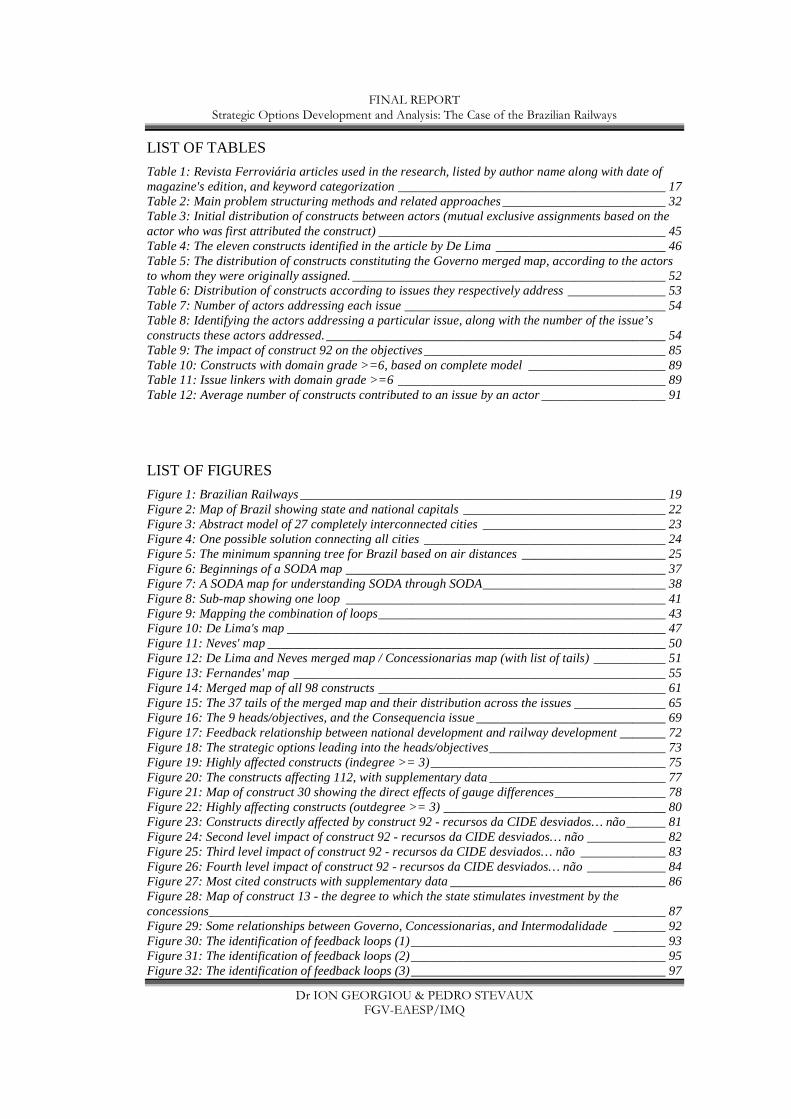
LIST OF TABLES
Table 1: Revista Ferroviária articles used in the research, listed by author name along with date of magazine's edition, and keyword categorization _________________________________________ 17 Table 2: Main problem structuring methods and related approaches _________________________ 32 Table 3: Initial distribution of constructs between actors (mutual exclusive assignments based on the actor who was first attributed the construct) ____________________________________________ 45 Table 4: The eleven constructs identified in the article by De Lima __________________________ 46 Table 5: The distribution of constructs constituting the Governo merged map, according to the actors to whom they were originally assigned. ________________________________________________ 52 Table 6: Distribution of constructs according to issues they respectively address _______________ 53 Table 7: Number of actors addressing each issue ________________________________________ 54 Table 8: Identifying the actors addressing a particular issue, along with the number of the issue’s constructs these actors addressed. ____________________________________________________ 54 Table 9: The impact of construct 92 on the objectives _____________________________________ 85 Table 10: Constructs with domain grade >=6, based on complete model _____________________ 89 Table 11: Issue linkers with domain grade >=6 _________________________________________ 89 Table 12: Average number of constructs contributed to an issue by an actor ___________________ 91
LIST OF FIGURES
Figure 1: Brazilian Railways ________________________________________________________ 19 Figure 2: Map of Brazil showing state and national capitals _______________________________ 22 Figure 3: Abstract model of 27 completely interconnected cities ____________________________ 23 Figure 4: One possible solution connecting all cities _____________________________________ 24 Figure 5: The minimum spanning tree for Brazil based on air distances ______________________ 25 Figure 6: Beginnings of a SODA map _________________________________________________ 37 Figure 7: A SODA map for understanding SODA through SODA ____________________________ 38 Figure 8: Sub-map showing one loop _________________________________________________ 41 Figure 9: Mapping the combination of loops ____________________________________________ 43 Figure 10: De Lima's map __________________________________________________________ 47 Figure 11: Neves' map _____________________________________________________________ 50 Figure 12: De Lima and Neves merged map / Concessionarias map (with list of tails) ___________ 51 Figure 13: Fernandes' map _________________________________________________________ 55 Figure 14: Merged map of all 98 constructs ____________________________________________ 61 Figure 15: The 37 tails of the merged map and their distribution across the issues ______________ 65 Figure 16: The 9 heads/objectives, and the Consequencia issue _____________________________ 69 Figure 17: Feedback relationship between national development and railway development _______ 72 Figure 18: The strategic options leading into the heads/objectives ___________________________ 73 Figure 19: Highly affected constructs (indegree >= 3) ____________________________________ 75 Figure 20: The constructs affecting 112, with supplementary data ___________________________ 77 Figure 21: Map of construct 30 showing the direct effects of gauge differences _________________ 78 Figure 22: Highly affecting constructs (outdegree >= 3) __________________________________ 80 Figure 23: Constructs directly affected by construct 92 - recursos da CIDE desviados… não ______ 81 Figure 24: Second level impact of construct 92 - recursos da CIDE desviados… não ____________ 82 Figure 25: Third level impact of construct 92 - recursos da CIDE desviados… não _____________ 83 Figure 26: Fourth level impact of construct 92 - recursos da CIDE desviados… não ____________ 84 Figure 27: Most cited constructs with supplementary data _________________________________ 86 Figure 28: Map of construct 13 - the degree to which the state stimulates investment by the concessions ______________________________________________________________________ 87 Figure 29: Some relationships between Governo, Concessionarias, and Intermodalidade ________ 92 Figure 30: The identification of feedback loops (1) _______________________________________ 93 Figure 31: The identification of feedback loops (2) _______________________________________ 95 Figure 32: The identification of feedback loops (3) _______________________________________ 97
FINAL REPORT Strategic Options Development and Analysis: The Case of the Brazilian Railways
Dr ION GEORGIOU & PEDRO STEVAUX FGV-EAESP/IMQ
8
Figure 33: Factors impacting upon transparency and consistency ___________________________ 99 Figure 34: The identification of feedback loops (4) ______________________________________ 100 Figure 35: The complexity of issues impacting upon a desired objective _____________________ 103
LIST OF SODA RULES
SODA Rule 1: Heads as objectives or facts _____________________________________________ 48 SODA Rule 2: Feedback loops and the role of the analyst _________________________________ 49 SODA Rule 3: Categorizing constructs ________________________________________________ 52 SODA Rule 4: Analyzing the relevance of an actor and their constructs_______________________ 57 SODA Rule 5: Layout of a merged map ________________________________________________ 63 SODA Rule 6: The tails of a merged map ______________________________________________ 68 SODA Rule 7: The heads of a merged map _____________________________________________ 68 SODA Rule 8: Strategic options ______________________________________________________ 74 SODA Rule 9: SODA's descriptive power in relation to problem's need for prescription __________ 76 SODA Rule 10: On the significance of small maps _______________________________________ 79 SODA Rule 11: Domain, explosion, and implosion grades _________________________________ 79 SODA Rule 12: On the significance of mapping the most cited constructs _____________________ 85 SODA Rule 13: Domain grade (node degree) and complexity_______________________________ 90

FINAL REPORT Strategic Options Development and Analysis: The Case of the Brazilian Railways
Dr ION GEORGIOU & PEDRO STEVAUX FGV-EAESP/IMQ
Technical Note The design, manipulation and analysis of SODA maps require technical decision support tools. This is not only due to the nature of mapping itself but also due to the quantity of individual maps, and their mergers, proposed in the research. In addition, effective decision support tools provide a repository for all map data, enabling the joint analysis of particular features from otherwise different maps.
The research made extensive use of Decision Explorer®, a software especially built to support the methodology used. The authors are grateful to GVPesquisa for funding the acquisition of this software, which greatly assisted in versatile map design and the discovery of significant analytical results. For more information on this and similar products see www.banxia.com

FINAL REPORT Strategic Options Development and Analysis: The Case of the Brazilian Railways
Dr ION GEORGIOU & PEDRO STEVAUX FGV-EAESP/IMQ
11
Abstract Judging by their success in Europe, Asia and North America, passenger and cargo railways are appreciated as the key to infrastructural development in Brazil. The issues are complex and steeped in uncertainty, as well as political and economic agendas, and a wide array of intersecting issues such as business and unionized interests, agricultural and industrial geographical spreads, as well as the emergence of alternative power sources. Not only are the issues systemic, but railway development itself always comes as a physical network structure. The situation under consideration, in other words, is systemic from both the soft and hard systems point of view, thus promising a rich context for systems studies. As an initial attempt in understanding the situation at hand, the research reported here applied the problem structuring approach known as Strategic Options Development and Analysis (SODA) in order to map and analyze issues facing the Brazilian railways. Strategic options for the future development of the railways were identified and analyzed, and ways forward for future research are proposed. In addition, the report serves as an initial knowledge base that can guide future systemic planning studies in the industry.
FINAL REPORT Strategic Options Development and Analysis: The Case of the Brazilian Railways
Dr ION GEORGIOU & PEDRO STEVAUX FGV-EAESP/IMQ
12
Executive Summary The report highlights major findings of a methodological investigation into Brazilian railway development. A general result is that the top four issues in railway development are the role of government, the future of the concessions, the state of the track system, and the development of intermodal services.
The government plays a key role. Key items that need to be addressed include the manner in which the government stimulates investment from the concessions, and the manner in which it uses the resources from CIDE - Contribuição de Intervenção no Domínio Econômico. The analysis indicates that key government objectives must include: offering more resources to the concessions, meeting previously agreed upon governmental obligations, and improving the national infrastructure. Overall, the analysis indicates that the government needs a long-term plan for the railways that cuts across political divisions, tackles short-term interests, and offers the country a lasting and promising railway system.
The concessions face the task of balancing their own corporate needs with those imposed by the government. Their main objective is to ensure continuity of service. This can be accomplished through investment in expansion and maintenance. The latter, in particular, calls for the design of a new implementation and control system that can effectively address maintenance issues. Overall, railway concessions will never have complete autonomy over their activities due to governmental oversight. This might sound somewhat discouraging, and perhaps autonomy is too strong a term. The essential requirement here is for a strong and lasting partnership between the concessions and government, one that cuts across electoral victories or losses and ensures continuity at the state, as opposed to governmental (or party), level. Research shows that railway development and sustainability under the stewardship of such a partnership enables the fostering of the long steps toward the ideal of privately owned and market-based railways systems (Moyer and Thompson, 1992).
The current track system faces a number of interlinked problems. It is old and in need of maintenance. It must be expanded to key industrial and geographic areas. Its reliability is variable, as is the track width itself. Due to the convergence of the system around the area of São Paulo, this particular geographic area requires urgent attention, either to amplify the current configuration or to move it away from the capital. Finally, the concessions that operate on the track leading to the port of Santos face a much-needed overhaul of the track system in this part of the country. A main complaint from the concessionarias is that lack of government investment in the track system is forcing them to use resources for this purpose that could otherwise be used for the improvement of their own corporate operations. This signals that effective track management requires a holistic approach incorporating the governmental and concessionary issues highlighted above.
Relative to the other three, intermodality does not appear to be very complex. The main objective is reduce the competition between modes and ensure greater integration that serves the carriers as well as their clients more effectively. The present lack of intermodality is traceable to previous governmental preference for air and road transport, as well as concentration on established routes instead of the

FINAL REPORT Strategic Options Development and Analysis: The Case of the Brazilian Railways
Dr ION GEORGIOU & PEDRO STEVAUX FGV-EAESP/IMQ
13
development of new ones. Between the lines, one reads that the problems of intermodality are rooted in strong contemporary interests for the maintenance of the status quo. These interests may include those of trucking unions, governmental agendas, and regional industrial interests. It must be stressed, however, that more is required to confirm these conclusions analytically.

FINAL REPORT Strategic Options Development and Analysis: The Case of the Brazilian Railways
Dr ION GEORGIOU & PEDRO STEVAUX FGV-EAESP/IMQ
15
Introduction Strategic Options Development and Analysis (SODA) is a problem structuring method (PSM) with an established theoretical and practical history (Rosenhead and Mingers, 2001; Mingers and Rosenhead, 2004; Shaw et al, 2003). One of its main contributions has been the development of a distinctly systemic approach to cognitive mapping based upon Kelly’s theory of personal constructs (Eden, 1988; Kelly 1955/1991, 1963, 1970). The approach has lent itself to a variety of strategic planning applications whereby problematic situations are literally mapped as systems (Eden and Ackermann, 1998; Bryson et al, 2004; Bougon, 1992; Ackermann and Eden, 2005). The maps are then analyzed using a mixture of qualitative and graph theoretic tools (Montibeller and Belton, 2006; Eden et al, 1992; Eden, 2004; Langfield-Smith and Wirth, 1992; Wang, 1996). The basic result is that the analysis enables the identification of the strategic options available in a situation, and how such options relate to the wider context of operational issues and goals. As will be discussed in this report, the usefulness of SODA analyses extends far beyond this.
The objective of this project was to apply SODA to issues facing the Brazilian railways in order to (1) learn about the complex situation in question, and (2) identify and analyze the strategic options available for their development. The report presents the research methodology, the application of SODA, and the ensuing results. It proposes future research actions, and comments on the possible ways forward in the development of the Brazilian railways.
The research enabled learning not only about the railways but also about the SODA methodology itself. Indeed, as the application of SODA proceeded, much was learnt through practice that is not reported in the SODA literature. As a result, the manipulation of the raw data underwent a series of changes from that proposed initially. In order to appreciate these changes later on in the report, below is the approach to the raw data as initially proposed.
The proposed research aims to develop:
• pairs of maps for each of seven issues facing the Brazilian railways: national development, government role, operating companies, urban rail, investment, logistics, and maintenance (the issues have been chosen due to their relatively high frequencies in debates surrounding the Brazilian railways); and,
• an additional merged map of the aforementioned pair for each of the respective issues.
A total of twenty-one maps will therefore become the basis of the analysis. The content of the maps will be sourced from the Brazilian railway industry’s prime magazine, Revista Ferroviária. The magazine has proved to be a rich source of quality information, with contributions from members of the industry, consultants, and government. A direct intervention by way of interviews, surveys, or consultancy is not part of the proposed research. Indeed, the investigation proposed here aims to provide the knowledge base from which a future wider investigation can draw.
As noted above, the raw data were articles from the Revista Ferroviária, a quality magazine that reports on all aspects of the Brazilian national railway industry. A fixture in each issue is an article, written by an acknowledged authority, that reports on a specific challenge facing the industry. The collection of these articles over the years reads like a history of past and present problems and opportunities facing the
FINAL REPORT Strategic Options Development and Analysis: The Case of the Brazilian Railways
Dr ION GEORGIOU & PEDRO STEVAUX FGV-EAESP/IMQ
16
Brazilian railways. Readily available and authoritative in nature, the articles offer an excellent source of information for the problem structuring investigation envisaged by this project.
What changed from the initial approach was the following: (1) more than seven issues were eventually identified and used; (2) more than fourteen individual maps were eventually designed and used; (3) the individual maps that contributed to an issue were merged to create the merged map of that issue, but such merged maps were not necessarily based on pairs individual maps, but on more than two such maps; and, (4) a complete merged map of all the data was designed. As it turned out, the complete merged map raised insightful methodological issues. It also substituted the raw data as the prime source for detailed analyses.
Tackling the vastness of a topic such as railway development is a daunting prospect. No one piece of research can pretend to provide either the complete picture or the level of detail ultimately required. The difficulties are compounded when the researchers (in this case, the author along with the research assistant) are experts neither in railway industry issues, nor in infrastructure policy. Indeed, the entire motivation to embark upon this research in the first place, was a seemingly innocent conviction in the central role railway development must play in the future of the nation. It was hoped that the relatively selective nature of the research undertaken would enable learning as much as it would enable insight. In other words, it was hoped that the research would eventually benefit the academics involved, as well as provide tangible benefits to the industry. Based on hope and conviction, the level of learning and insight that eventually emerged surpassed all initial expectations, as is reported in what follows.
Although the researchers lacked concrete knowledge of the railway industry, the complex nature of the issues involved did not escape them. Reading through any newspaper article that addresses infrastructure, one quickly savors the seemingly impossible task faced by professional planners. The researchers, especially the lead author, specialize in the investigation of complex, multi-agency problems strewn with uncertainty. And it was this methodological expertise that was brought to bear upon the issues facing the railway industry.
The first task was to identify the concrete issues themselves. It thus involved basic data collection, or more exactly, information collection. Thought was given to personally interviewing major stakeholders in the industry, from directors of the various concessions, to government ministers, to engineers, to final users. An interviewer, however, should always approach an interviewee with some degree of knowledge of the field. Interviewees understandably have neither the time nor the inclination to act as elementary school teachers. Given the researchers’ lack of specific knowledge of the railway industry - knowledge that would otherwise have rendered them as credible interviewers - a different approach was required. As mentioned earlier, a documentation analysis was chosen – an approach that could eventually lead to the formation of a solid knowledge basis from which to conduct professional interviews in the future.
FINAL REPORT Strategic Options Development and Analysis: The Case of the Brazilian Railways
Dr ION GEORGIOU & PEDRO STEVAUX FGV-EAESP/IMQ
17
The Revista Ferroviária is an obvious prime source of information. The World Bank also publishes quality reports on railway development, with no shortage of a Brazilian focus. There are also regular articles on railway development printed in the major Brazilian newspapers. With so many sources available, a choice was made that could balance the time available to do the research with the perceived quality of raw information. For this reason, the research concentrated upon the Revista Ferroviária.
It is interesting to note that the Revista Ferroviária has been in circulation ever since 1940. No other privately published Brazilian monthly magazine has been in circulation longer. Recently, the magazine reorganized its content structure as well as its presentation, making for a very high quality publication. Indeed, it is a shame that the reality of Brazilian railways does not reflect the dynamism, excitement, and lively debate that emerge from the magazine’s color-filled pages. The magazine is available in the FGV-EAESP library.
As mentioned earlier, in the final pages of each edition there is an article written by an authority in the industry that addresses some specific issue or issues. Thirty-six of these articles were consulted, covering the years 2004-2007. An initial reading identified seventeen articles as providing original, interesting, and potentially fruitful information for the purposes of the research. Of these, twelve were finally selected based upon a second reading and some preliminary analysis using the SODA methodology to be described later. In all cases, reasons for discarding articles included unwanted repetition, heavy focus on advertising successes rather than tackling problems, and regional or industrial concentration (for example, articles focused on the Rio de Janeiro metro system, a topic deemed too specialized for the nature of the research considered here).
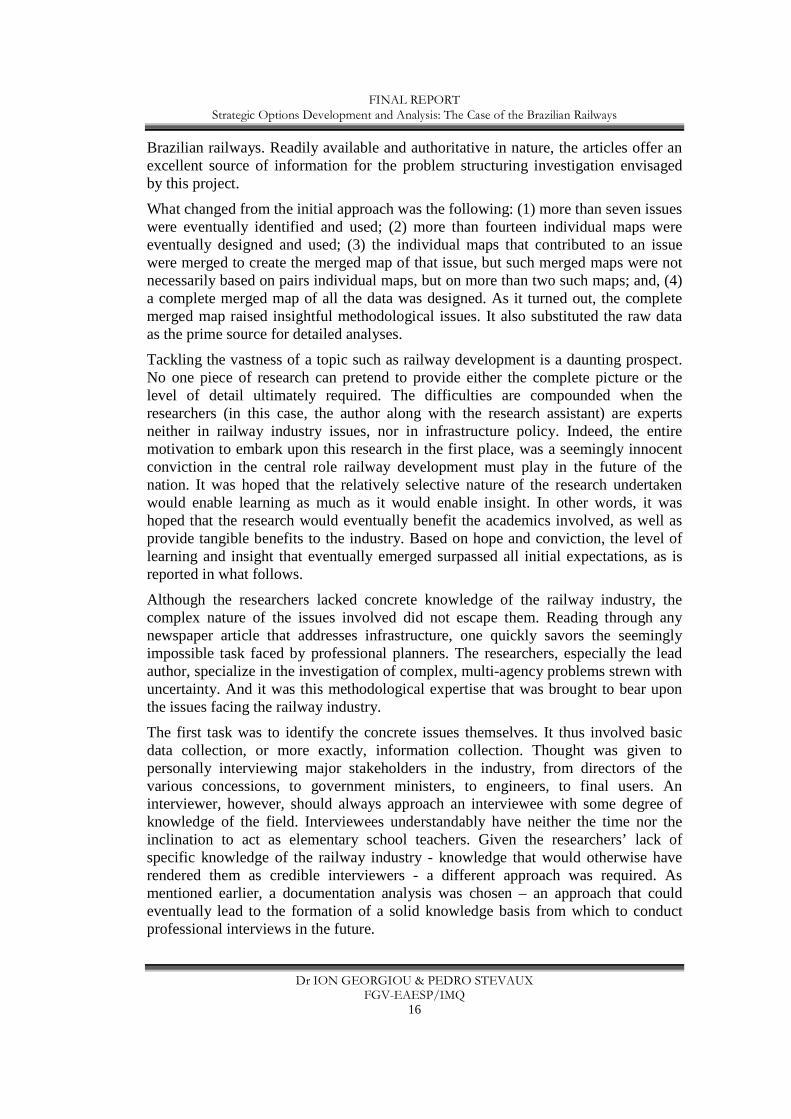
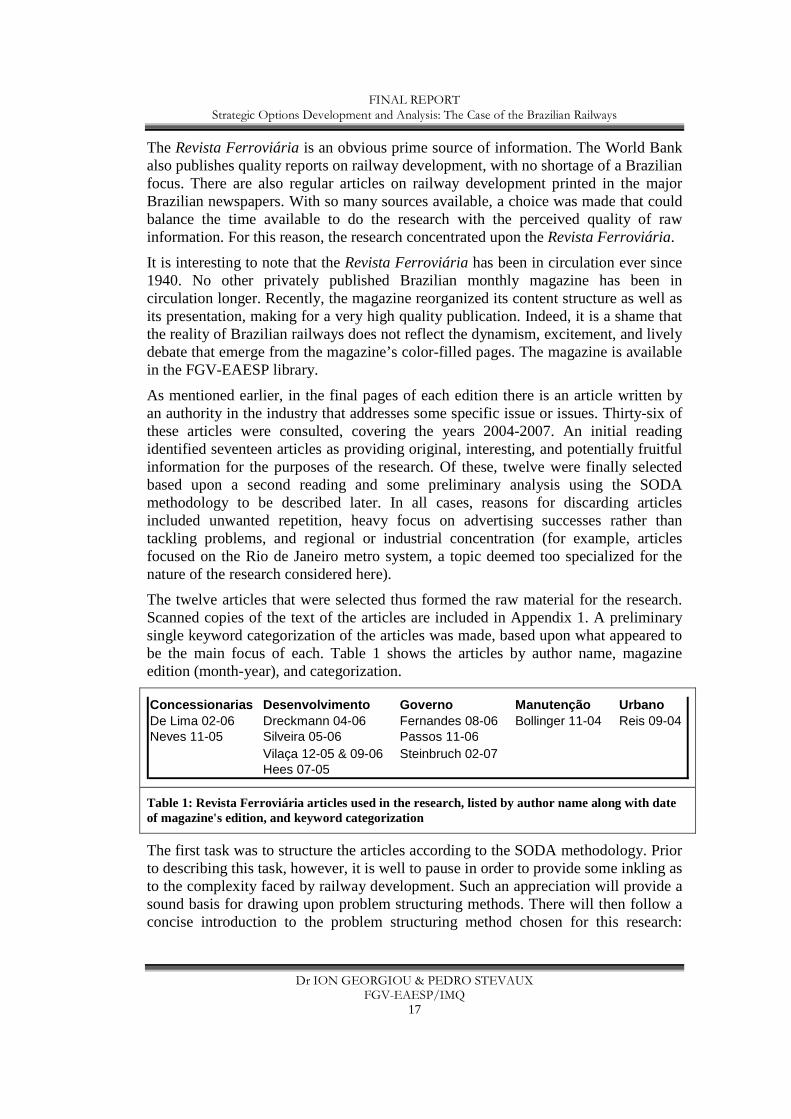
The twelve articles that were selected thus formed the raw material for the research. Scanned copies of the text of the articles are included in Appendix 1. A preliminary single keyword categorization of the articles was made, based upon what appeared to be the main focus of each. Table 1 shows the articles by author name, magazine edition (month-year), and categorization.
Concessionarias Desenvolvimento Governo Manutenção UrbanoDe Lima 02-06 Dreckmann 04-06 Fernandes 08-06 Bollinger 11-04 Reis 09-04Neves 11-05 Silveira 05-06 Passos 11-06
Vilaça 12-05 & 09-06 Steinbruch 02-07Hees 07-05
Table 1: Revista Ferroviária articles used in the research, listed by author name along with date of magazine's edition, and keyword categorization
The first task was to structure the articles according to the SODA methodology. Prior to describing this task, however, it is well to pause in order to provide some inkling as to the complexity faced by railway development. Such an appreciation will provide a sound basis for drawing upon problem structuring methods. There will then follow a concise introduction to the problem structuring method chosen for this research:

FINAL REPORT Strategic Options Development and Analysis: The Case of the Brazilian Railways
Dr ION GEORGIOU & PEDRO STEVAUX FGV-EAESP/IMQ
18
SODA. Only then can the report begin to describe the application of SODA to railway development in Brazil.
FINAL REPORT Strategic Options Development and Analysis: The Case of the Brazilian Railways
Dr ION GEORGIOU & PEDRO STEVAUX FGV-EAESP/IMQ
19
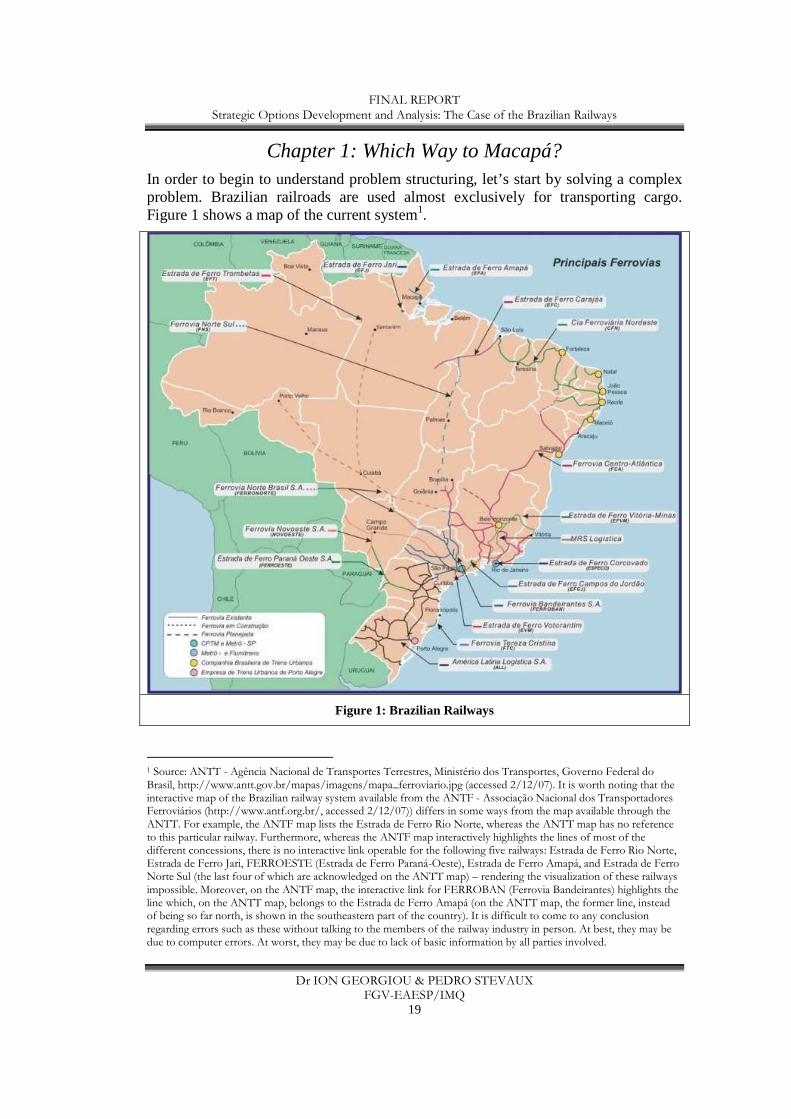
Chapter 1: Which Way to Macapá? In order to begin to understand problem structuring, let’s start by solving a complex problem. Brazilian railroads are used almost exclusively for transporting cargo. Figure 1 shows a map of the current system1.
Figure 1: Brazilian Railways
1 Source: ANTT - Agência Nacional de Transportes Terrestres, Ministério dos Transportes, Governo Federal do Brasil, http://www.antt.gov.br/mapas/imagens/mapa_ferroviario.jpg (accessed 2/12/07). It is worth noting that the interactive map of the Brazilian railway system available from the ANTF - Associação Nacional dos Transportadores Ferroviários (http://www.antf.org.br/, accessed 2/12/07)) differs in some ways from the map available through the ANTT. For example, the ANTF map lists the Estrada de Ferro Rio Norte, whereas the ANTT map has no reference to this particular railway. Furthermore, whereas the ANTF map interactively highlights the lines of most of the different concessions, there is no interactive link operable for the following five railways: Estrada de Ferro Rio Norte, Estrada de Ferro Jari, FERROESTE (Estrada de Ferro Paraná-Oeste), Estrada de Ferro Amapá, and Estrada de Ferro Norte Sul (the last four of which are acknowledged on the ANTT map) – rendering the visualization of these railways impossible. Moreover, on the ANTF map, the interactive link for FERROBAN (Ferrovia Bandeirantes) highlights the line which, on the ANTT map, belongs to the Estrada de Ferro Amapá (on the ANTT map, the former line, instead of being so far north, is shown in the southeastern part of the country). It is difficult to come to any conclusion regarding errors such as these without talking to the members of the railway industry in person. At best, they may be due to computer errors. At worst, they may be due to lack of basic information by all parties involved.
FINAL REPORT Strategic Options Development and Analysis: The Case of the Brazilian Railways
Dr ION GEORGIOU & PEDRO STEVAUX FGV-EAESP/IMQ
20
What is notable is that the railroad presently connects only a small subset of the state capitals. Let’s say that the government is interested in developing national infrastructure, and that part of this plan is to connect all capitals, including Brasília, by rail. This brings us to our problem. How much track should be laid that ensures all capitals are connected at minimum cost?
The answer to this question is far from simple. One reason is that we have yet to define the term cost? Since we are talking about laying track, and since track spans distance, we could define cost accordingly – in which case, the problem is actually: what is the shortest span of track that can be laid across Brazil that ensures that all of its capitals (including the national capital) are connected?
In order to solve this problem, we need two things: information, and a method. The key item of information is distance measurements between all Brazilian capitals. Here we face our first hurdle, for it quickly becomes obvious that the acquisition of this information is not a simple task. Rail moves on land, and Brazil’s geographical configuration guarantees that we will find all types of land surface imaginable – from desert to swamp, from jungle to highlands. There is no telling where track can effectively be laid, or how many detours and contours we will have to calculate in order to come to some acceptable measurement between all cities. We could consult a road atlas and use road distances as a good measure.
Here we face another hurdle: one of the capitals, Macapá, does not figure in the table of road distances between capitals! A quick look at a topographical map of Brazil reveals that Macapá, due to its location north of the Amazon rainforest, is not connected by road to the rest of the country, let alone to any of the capitals – one can only fly there, or try a boat. Using a road atlas, therefore, will give us only partial information. Consulting it, however, begins to raise a series of questions. If roads have yet to reach Macapá, what chance is there for a railroad2? Should the government be advised to exclude Macapá from its development project? What political repercussions would this incur?
What to do with Macapá is already taking us beyond what was initially a focused question – and it has hinted at the complexity we must eventually face. But let’s stay focused. Our search for distances between capitals has so far yielded nothing but questions. Can we just get a good idea of where to lay the track? Let’s worry about land, soil and environmental configurations later. Instead of road distances, how about air distances? They measure a more or less direct path between points. That simplifies our context greatly. If we use air distances, the resultant solution will undoubtedly fail to reflect the situation on the ground. It could, however, provide us with a model that can be used to guide detailed problem solving later on. For instance, at least we will obtain an indication that city X should be connected to city Y rather than city Z – at the moment we don’t even know which cities to connect with each other!
2 A railway line within the state of Amapá exists - the Estrada de Ferro Amapá (see the map in Figure 1). The question here concerns railway connections that cross state boundaries.
FINAL REPORT Strategic Options Development and Analysis: The Case of the Brazilian Railways
Dr ION GEORGIOU & PEDRO STEVAUX FGV-EAESP/IMQ
21
Air distances between all Brazilian capitals are publicly available3, so we have found the first thing we sought: information. It’s not exactly the information we want, but it can be useful for the provision of an initial answer to our question. In order to get that answer, we need the second thing: a method.
By method we mean a means that offers us an effective way to the answer. For many situations, more than one method is available. For example, in order to figure out how to get from A to B, you can consult a map or ask someone. For some situations, only one method is available. When this is the case, the method is usually an algorithm, that is, a set of steps that, if followed, guarantee a resultant solution. As long as you can provide the information required by the algorithm, and as long as you are asking the exact question that the algorithm was designed to solve, there should be no problems. Many such algorithms guarantee finding an optimal solution, usually one that maximizes or minimizes some variable of interest (profit, say, or cost). We have exactly such a situation here: we want to minimize cost in the form of distance. What methods do we have available to solve this problem?
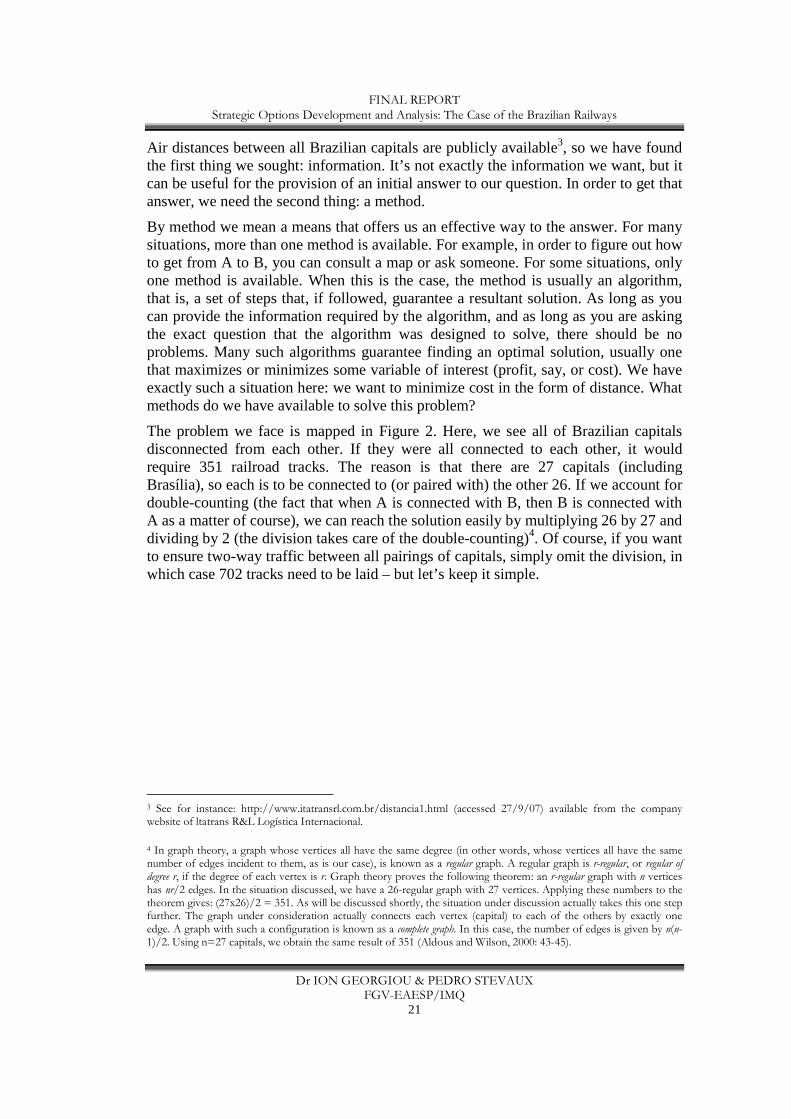
The problem we face is mapped in Figure 2. Here, we see all of Brazilian capitals disconnected from each other. If they were all connected to each other, it would require 351 railroad tracks. The reason is that there are 27 capitals (including Brasília), so each is to be connected to (or paired with) the other 26. If we account for double-counting (the fact that when A is connected with B, then B is connected with A as a matter of course), we can reach the solution easily by multiplying 26 by 27 and dividing by 2 (the division takes care of the double-counting)4. Of course, if you want to ensure two-way traffic between all pairings of capitals, simply omit the division, in which case 702 tracks need to be laid – but let’s keep it simple.
3 See for instance: http://www.itatransrl.com.br/distancia1.html (accessed 27/9/07) available from the company website of ltatrans R&L Logística Internacional.
4 In graph theory, a graph whose vertices all have the same degree (in other words, whose vertices all have the same number of edges incident to them, as is our case), is known as a regular graph. A regular graph is r-regular, or regular of degree r, if the degree of each vertex is r. Graph theory proves the following theorem: an r-regular graph with n vertices has nr/2 edges. In the situation discussed, we have a 26-regular graph with 27 vertices. Applying these numbers to the theorem gives: (27x26)/2 = 351. As will be discussed shortly, the situation under discussion actually takes this one step further. The graph under consideration actually connects each vertex (capital) to each of the others by exactly one edge. A graph with such a configuration is known as a complete graph. In this case, the number of edges is given by n(n-1)/2. Using n=27 capitals, we obtain the same result of 351 (Aldous and Wilson, 2000: 43-45).
FINAL REPORT Strategic Options Development and Analysis: The Case of the Brazilian Railways
Dr ION GEORGIOU & PEDRO STEVAUX FGV-EAESP/IMQ
22
Figure 2: Map of Brazil showing state and national capitals
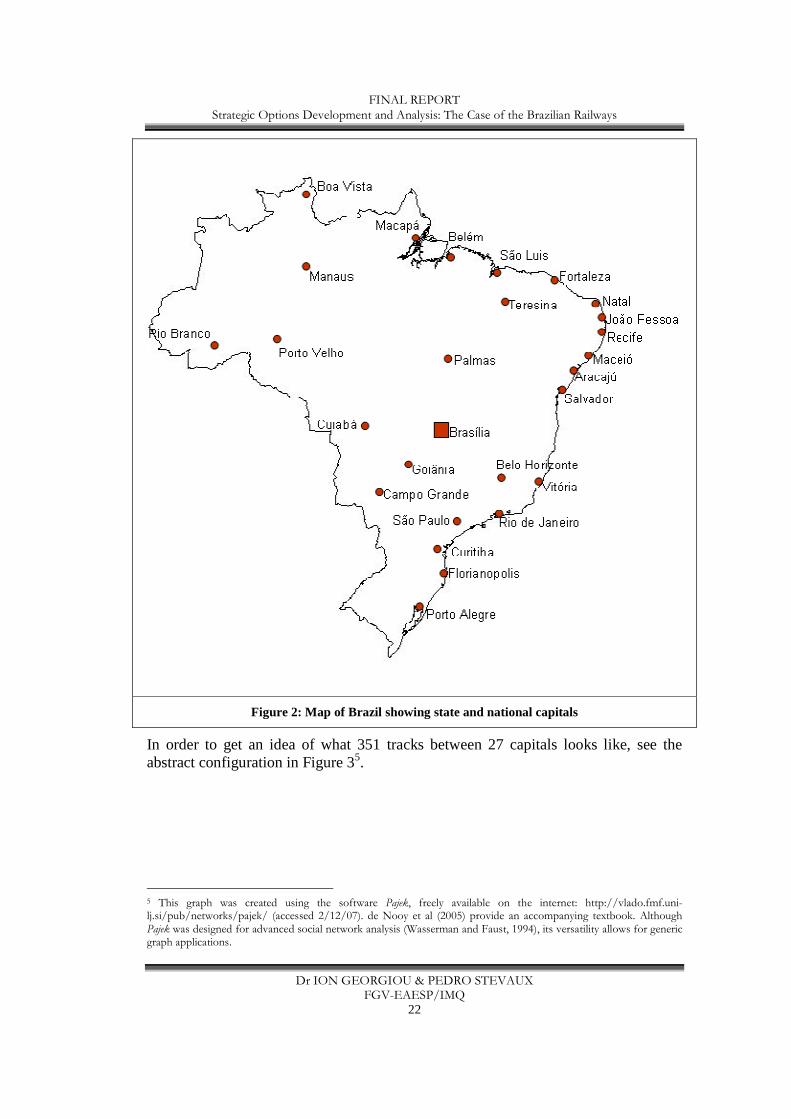
In order to get an idea of what 351 tracks between 27 capitals looks like, see the abstract configuration in Figure 35.
5 This graph was created using the software Pajek, freely available on the internet: http://vlado.fmf.uni-lj.si/pub/networks/pajek/ (accessed 2/12/07). de Nooy et al (2005) provide an accompanying textbook. Although Pajek was designed for advanced social network analysis (Wasserman and Faust, 1994), its versatility allows for generic graph applications.
FINAL REPORT Strategic Options Development and Analysis: The Case of the Brazilian Railways
Dr ION GEORGIOU & PEDRO STEVAUX FGV-EAESP/IMQ
23
Figure 3: Abstract model of 27 completely interconnected cities
You can appreciate why an abstract was used if you consider the mess we would create around the northeastern coast of Brazil, between Salvador and Natal, where six capitals are situated in a relatively small area. Needless to say, the idea of connecting everything to everything else does not look appealing, nor does it sound like a viable infrastructure project! In fact, we have gone beyond our initial remit. The project calls for the shortest span of track that will ensure all capitals are connected. No constraints have been given as to which pairings are required. All we want is for the capitals to be reachable, one from the other, in some way that minimizes the total track laid.
Figure 3 is an abstract of what would be the complete network, the one that connects all capitals to each other. Mathematicians call such an abstract model of our situation a complete graph (because it is completely connected), and they designate it by the letter K with a subscript of the number of nodes in question. In our case it is the K27 graph – we can call it KBrazil.
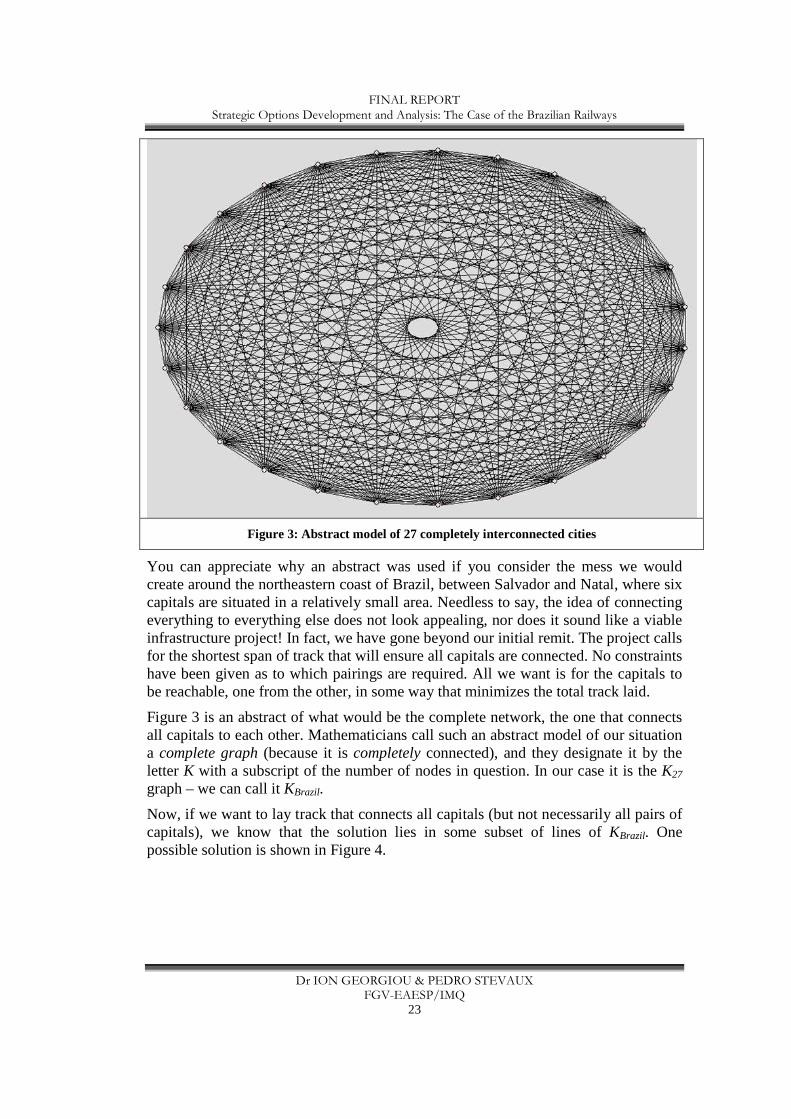
Now, if we want to lay track that connects all capitals (but not necessarily all pairs of capitals), we know that the solution lies in some subset of lines of KBrazil. One possible solution is shown in Figure 4.
FINAL REPORT Strategic Options Development and Analysis: The Case of the Brazilian Railways
Dr ION GEORGIOU & PEDRO STEVAUX FGV-EAESP/IMQ
24
Figure 4: One possible solution connecting all cities
The problem is this: there are 608,266,787,713,358,000,000,000,000,000,000,000 such configurations for KBrazil!
6 Which one is the one that ensures we have minimized cost/distance?
Trial and error is out of the question. We must find the method that can give us the solution. Thankfully, for our problem, mathematics has discovered the method in question. It is an algorithm named after its founder, Kruskal (Harris et al, 2000: 20-23). It affords an astonishingly simple way through the maze of the huge number of possibilities noted above. Simply begin with the pairing that is of minimum distance, 6 The answer here is the result of counting the total number of trees available in a graph of n vertices. Cayley’s Tree Formula is the one that provides the result. It states that there are nn-2 distinct labeled tress of order n. In the present case, simply take the number of capitals, 27, and raise it to the power of 27 minus 2: 2727-2 (Harris et al, 2000: 24-25).
FINAL REPORT Strategic Options Development and Analysis: The Case of the Brazilian Railways
Dr ION GEORGIOU & PEDRO STEVAUX FGV-EAESP/IMQ
25
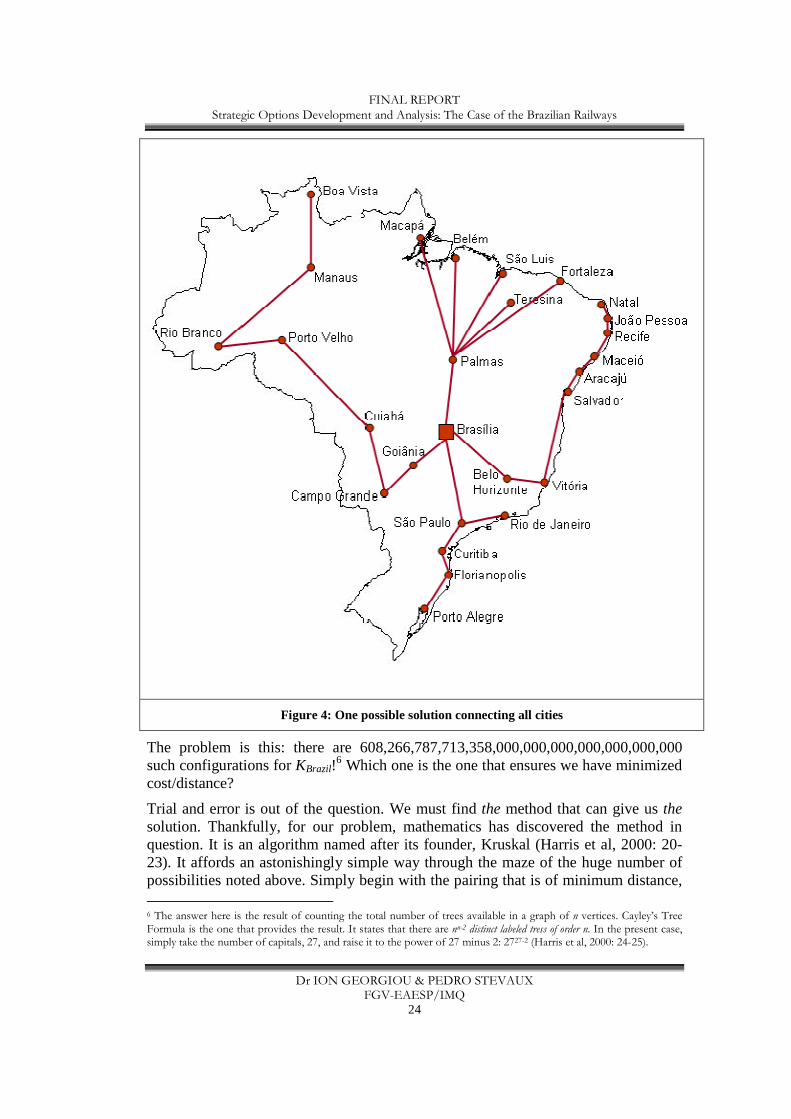
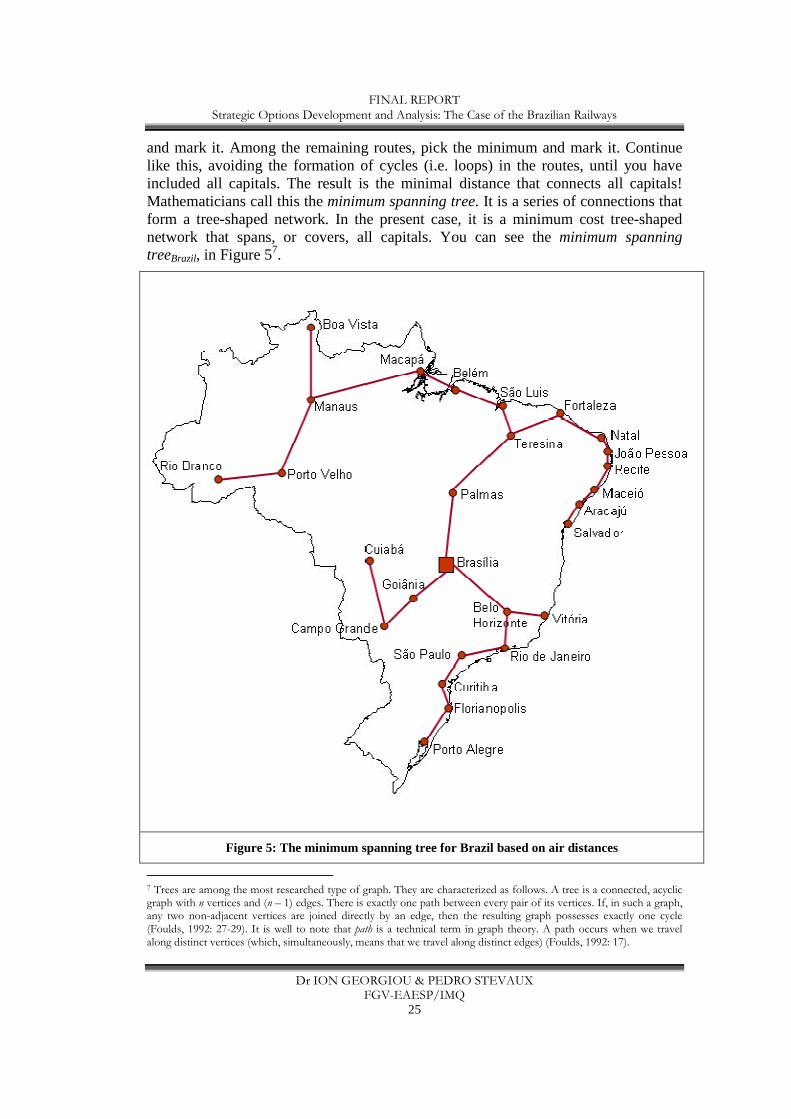
and mark it. Among the remaining routes, pick the minimum and mark it. Continue like this, avoiding the formation of cycles (i.e. loops) in the routes, until you have included all capitals. The result is the minimal distance that connects all capitals! Mathematicians call this the minimum spanning tree. It is a series of connections that form a tree-shaped network. In the present case, it is a minimum cost tree-shaped network that spans, or covers, all capitals. You can see the minimum spanning treeBrazil, in Figure 57.
Figure 5: The minimum spanning tree for Brazil based on air distances
7 Trees are among the most researched type of graph. They are characterized as follows. A tree is a connected, acyclic graph with n vertices and (n – 1) edges. There is exactly one path between every pair of its vertices. If, in such a graph, any two non-adjacent vertices are joined directly by an edge, then the resulting graph possesses exactly one cycle (Foulds, 1992: 27-29). It is well to note that path is a technical term in graph theory. A path occurs when we travel along distinct vertices (which, simultaneously, means that we travel along distinct edges) (Foulds, 1992: 17).
FINAL REPORT Strategic Options Development and Analysis: The Case of the Brazilian Railways
Dr ION GEORGIOU & PEDRO STEVAUX FGV-EAESP/IMQ
26
We seem to have an answer to our question regarding the quantity of track that should be laid that ensures all capitals are connected at minimum cost. Figure 5 tells us where to lay the track, and if we read off our distance measures for the pairings, we will know how much track to lay.
Of course, all this is false. The map in Figure 5 does not tell us where to lay the track at all – it simply gives us an indication of which pairings of capitals will most probably allow for minimum cost. Once on the ground, a multitude of factors will wake us up to the reality of the geographical configuration which will greatly constrain our ability to follow the neatness of our model. Indeed, the constraints imposed by geography may render some routes of the minimum spanning tree inviable, whilst suggesting other routes. Moreover, our choice of distance measures was clearly less than satisfactory. Comparing air miles to land miles is like comparing apples with oranges. At best, all we can say is that we have a better idea of the real minimum spanning treeBrazil about which our efforts so far have yielded only a theoretical version. The real spanning tree will demand much more of everything: time, people, money, ideas, politics, economics, socio-cultural variables; not to mention profound knowledge of railroad dynamics, development, financing, operations, strategic planning, market analysis, suppliers; and let’s not forget the impact on employment, trucking unions, and the battle of each capital to realign itself in the new power struggle for national rail dominance (after all, the more central a node you are in the network, the more influence and power you exert over the network). Indeed, the real spanning tree will most probably not be a minimum spanning tree at all.
Clearly, in the wider scheme of the Brazilian railway development project, our neat, mathematically provable model, is but a raindrop in a very choppy ocean. We began by saying that we would solve a complex problem. But, in fact, the problem only exhibited enumerative complexity – and that was easily overcome thanks to the past efforts of some brilliant mathematicians. As a result, our problem, although being far from simple, proved to be, let us say, unsophisticated. The lack of sophistication is proportional to the richness in detail that we have had to sacrifice. And being unsophisticated, the relevance of the solution is appreciable as merely another piece of information that might contribute something to the eventual realization of the development of the railways. Not really a solution at all.
The process by which we have arrived at it, however, has been very fruitful. After all, we have learnt a lot about our situation, especially when we thought about information requirements – just think of how valuable our knowledge of Macapá will prove to be when we get down to the ground of real-world planning. We also learnt something about mathematics and its fertile field called graph theory – which is actually very relevant to transportation planning (Roberts, 1978; Rodrigue et al, 2006). Perhaps most importantly, as we explored our way toward a solution, we kept getting reminded of a complexity we would eventually have to face. It came in various guises: geographical, informational, political, economical, socio-cultural – notwithstanding the operational and strategic issues specific to railway development that we have yet to consider.
FINAL REPORT Strategic Options Development and Analysis: The Case of the Brazilian Railways
Dr ION GEORGIOU & PEDRO STEVAUX FGV-EAESP/IMQ
27
A simple question, such as finding the minimum spanning tree of Brazil, is mathematically challenging only in that it demands much more than we can actually give – just think of the concessions we made to finally be allowed to use our neat mathematics. The more complex questions, and their interrelationships, will be much more challenging, not only on the mathematical level but on the more mundane, day-to-day conceptual level. The relevance of singularly adhering to a mathematical approach when faced with increasingly complex questions reduces proportionally. We need to substitute it with something else. In essence, we need to move from problem solving to problem structuring.
Now that we have solved what we thought was a complex problem, we can outline the fundamental difference between problem solving and problem structuring. This will serve as a good foundation for deepening our understanding of the relevance of problem structuring and what it can offer.
Let’s think back to what was involved in finding the minimum spanning treeBrazil. To begin with, the problem was definitively formulated for us as a single objective: in brief, to find the minimum spanning tree. It so happened that this particular formulation was amenable to optimization: given the data and a proven algorithm, we found the solution. It was possible to use an algorithm because the situation exhibited generic characteristics for which mathematics has uncovered the essential relationships. We could have used the same algorithm for the same question in any country.
The algorithm, being mathematical, was thirsty for data. Thus our approach depended greatly on providing the most accurate data available. We quickly found that this posed a problem in itself. We found a way round this, but quickly acknowledged our dissatisfaction with the distorting concession we made (using air miles to measure land miles is a big distortion!). The algorithm, however, was welcomed, for it injected a scientific approach. Perhaps it was welcomed with some relief: at last, we could counter-balance the distortion that we had inflicted upon the situation thus far. Uncertainty was tamed to a much-needed degree, and we were simultaneously presented with an approach that dealt with only one variable: the distances between cities. There was no question: the algorithm would answer the question posed. Moreover, given our incorporation of mathematics, data, and algorithms, mistakes could be corrected prior to any real-world implementation of the solution – just like drugs are tested and re-tested prior to being launched into the human world.
Of course, we implicitly assumed that there was broad consensus that the question posed was the correct question, and that the algorithm was the proper method to resolve the issue. We soon saw, however, that such consensus could not be taken for granted – just think back to the geographical, social, political, economic, and cultural factors alluded to as we crept toward the solution (think of all the people who would want to be heard on these issues). If in doubt, look back at the minimum spanning tree solution and imagine the frustration of someone who wants to ship their goods from Salvador to Belo Horizonte! The question fails to address their needs, and this failure renders the algorithmic approach irrelevant to them. No, we are a long way
FINAL REPORT Strategic Options Development and Analysis: The Case of the Brazilian Railways
Dr ION GEORGIOU & PEDRO STEVAUX FGV-EAESP/IMQ
28
from consensus. And if you examine the solution, in many ways it does not even accommodate common sense!
The scientific injection, however, did provide one advantage: it gave us a stopping rule. Once you have connected all the capitals, you can stop and admire your accomplishment. Moreover, it was a scientific stopping rule. We did not stop because we felt like it, or because we ran out of time, or because of other pressures. We stopped because science, nay, mathematics – the backbone of science – showed us when to stop. In other words, we were able to happily maintain a degree of objectivity to what was, by now, a scientific solution strewn with subjectivity.
And talking of subjectivity, we consulted no one as we pursued our solution. As far as we were concerned, other people did not matter. Someone gave us a straightforward problem and we proceeded to tackle it, without questioning whether it was relevant to anyone else – or anything else, for that matter. Other people were treated as passive objects that would eventually be presented with the network and be instructed on how to use it. Boxcars and people were all of the same, as far as our approach was concerned. We had an identifiable discrepancy between the present state of the system, say S0, and the desired state, S1. Our job was simply to get to S1. Someone else would take care of other people’s opinions. Perhaps that someone – or some representative decision-making body - was the one who gave us the problem in the first place. Perhaps that someone was at the top of a hierarchical chain of command that facilitates implementation. Perhaps… Whatever happened to the certainty afforded by our mathematical injection?
In brief, our approach implicitly assumed some necessary conditions for its relevance: the pre-formulation of, and consensus around, the problem; quantitative measurement as the defining dimension for a solution; optimization as the defining approach for the solution; the availability of technical expertise to find the solution; and the existence of some central authority powerful enough to define questions and implement solutions. That’s a tall order given that everyone these days is talking about how complex the world has become - and they are not referring to enumerative complexity, otherwise we would all be trained mathematicians by now.
Indeed, the complexity on everyone’s lips has already been touched upon during our discussion. It refers to the characteristics of real situations, situations we face everyday as human beings in our private and public lives. Situations that require us to make decisions regarding multiple, simultaneous and equally necessary objectives, measurable in respectively different dimensions. Situations constituted by multiple variable-types, indicating the impossibility of overall optimization. Situations in which we lack explicit information on what needs to be done, and on which there is possibly little agreement. Situations that do not allow for a technical solution because they are full of human interests with associated opinions and judgments whose viability must be taken into account. Situations that undoubtedly require a systematic approach, but for which the scientific methodology of quantitative methods is found wanting. Situations constituted by actors who are not necessarily hierarchically related, and not necessarily in agreement with each other, and whose decisions impact in various degrees and in different aspects. In brief, situations constituted by a
FINAL REPORT Strategic Options Development and Analysis: The Case of the Brazilian Railways
Dr ION GEORGIOU & PEDRO STEVAUX FGV-EAESP/IMQ
29
dynamic interaction of non-independent problems, indicating the presence of a complex system requiring conceptual structure in a manner that permits analysis without ignoring systemic integrity (Ackoff, 1979).
So, you may ask, what were we doing playing around with spanning trees? Well, we must not take the argument too far and deny the relevance of mathematics and science to our decision making. Indeed, that would be foolish. But we must appreciate that the complexity of our modern world - with our global aspirations, with our need to maintain the authentically local whilst simultaneously recognizing the advantages of participating in a wider world – requires us to search for solutions that are not mutually exclusive, and that are acceptable in different dimensions. It requires us to tame our infatuation with, and combat our weakness in, data-dependency, and to attain greater integration between quantitative and qualitative data within socio-political, cultural and economic processes. Our problem-solving processes and modeling must be sophisticated in order to account for the richness of the issues involved. They must, however, also be transparent enough for laypersons to engage with them, and so avoid the treatment of people as passive objects. Furthermore, uncertainty is a fact that cannot be abolished through even the most mathematically accurate model. We need processes and methods that can incorporate uncertainty without necessarily mathematizing it, where people can envisage possibilities instead of trying to rack their brains on the meaning of a statistical probability; approaches that maintain options open for future resolution according to the element of uncertainty perceptible in each of them. And if we are to be faithful to our claims that we live in the age of complexity, in the age of interdependence, then we need processes and methods that can help us incorporate this complexity and this interdependence, so that we can at least have a fair shot at the ideal of truly systemic planning.
The essential difficulty with complexity is not in its resolution. For complexity is not irresolvable. Complexity is irresolvable only when accompanied by disorder. Hence, the road toward resolving complexity does not lie with approaches focused upon problem solving. The road lies with approaches that can, first and foremost, transform the disorder into some order. This implies the imposition of structure. Ergo: the need for problem structuring.

FINAL REPORT Strategic Options Development and Analysis: The Case of the Brazilian Railways
Dr ION GEORGIOU & PEDRO STEVAUX FGV-EAESP/IMQ
30
FINAL REPORT Strategic Options Development and Analysis: The Case of the Brazilian Railways
Dr ION GEORGIOU & PEDRO STEVAUX FGV-EAESP/IMQ
31
Chapter 2: Constructs, Maps and Loops Complexity implies uncertainty about what problem is to be resolved. Thus, formulating the problem is a main objective of problem structuring. More exactly, problem structuring can help formulate the various interdependent problems that are impacting upon a current undesirable situation – precisely by structuring the dependencies. And where there is interdependence, there is a system. Hence, problem structuring can help us map out the system of problems. Moreover, if there is a system of problems, a systemic solution would be well-advised; otherwise we risk tackling the situation on terms different to those that it demands. Systems thinking is the field concerned with approaching situations systemically, and it maintains a two-way dialogue with problem structuring.
In addition, given the uncertainty inherent in complex situations, a major task for those involved is to learn about the problematic situation as they tackle it. Learning, and especially group or organizational learning, is fundamentally addressed and facilitated by problem structuring methods. The methods are especially tuned to surface knowledge that no one stakeholder could know on their own.
The involvement of numerous stakeholders, multiple agents or agencies (also known collectively as actors) means that some degree of final accommodation must be reached between them if the situation is to be resolved at all. There may be opportunities to agree upon certain objective results – a minimum spanning tree is a case in point. More often than not, however, the inherent value of the decisions taken will depend less on objective truth and more on values or policies arising from a mix of politics, economics, and social and environmental concerns. In the face of sophisticated complexity, a solution outside of such influences is not possible.
Another reason for this is that the discrepancy between the current undesirable state and the future desirable state can be explained in numerous and equally plausible ways. There is no numerable set of potential solutions, as there was in the case of the spanning tree. There may be no solution. We will know only once some structure has been imposed, analyzed, and used by the actors themselves. Furthermore, there is no telling in how many ways the disorder can be structured or explained: not only are there numerous agents involved with particular explanatory perspectives; there are numerous problem structuring approaches as well. Choice of explanation and structuring will inevitably shape the eventual resolution.
This might be alarming but it is unavoidable. Why not dispense with it, one might ask, and revert to the minimum spanning tree solution? After all, it is a mathematical truth, it is objective. Yes, but it is a solution based upon a minimum cost structuring approach and the choice of explaining the situation mathematically. As we saw, this leads to a seemingly scientific solution strewn with subjectivity. Furthermore, we found that the person wanting to ship goods from Salvador has an equally plausible angle to contribute. The best that one can hope for is using a combination of approaches that enable quantitative and qualitative variables to be considered simultaneously in order to reach a satisfactory decision about any one element of a

FINAL REPORT Strategic Options Development and Analysis: The Case of the Brazilian Railways
Dr ION GEORGIOU & PEDRO STEVAUX FGV-EAESP/IMQ
32
situation – a form of triangulation that management science calls multimethodology (Mingers and Gill, 1997).
The common denominator of all this is the involvement of multiple and equally relevant perspectives. A basic step in problem structuring, therefore, is to map out such perspectives. In this way, you structure an understanding of the problematic situation that highlights what people see as causes, consequences and ultimate objectives. As we shall see, this not only enables one to learn about the situation and identify its objectives; it also offers analytical insights.
Faced with the task of exploring perspectives, one must first go out and collect them. Interviews, brainstorming, questionnaires, documentation analysis or any of the other various forms of collecting information is equally plausible. A vast literature exists on such topics and, as discussed, the present research chose documentation analysis. What is more important than the sources of information is the manner in which one can make best sense of it. Meaning is a prime concern since ambiguity of meaning only serves to exacerbate complexity and uncertainty. If problem structuring methods are to be used in the present research, the question is which one of these methods best addresses the management of meaning. Table 2 lists the main problem structuring methods, as well as related approaches based upon the standard text in the field (Rosenhead and Mingers, 2001).
Main Problem Structuring Methods Related Approaches
Strategic Options Development and Analysis (SODA).
Analytic Hierarchy Process Decision Analysis Nominal Group Technique Delphi Method System Dynamics, including influence diagrams and other systems thinking qualitative tools Choice Theory Capability Approach Viable Systems Model Decision Conferencing Rapid Rural Appraisal / Participative Rural Appraisal Critical Systems Heuristics Interactive Planning Strategic Assumption Surfacing and Testing Total Systems Intervention Concept Mapping
Soft Systems Methodology (SSM)
Robustness Analysis
Strategic Choice Approach
Drama Theory (including Conflict and Cooperation Analysis, Metagames, and Hypergames)
Table 2: Main problem structuring methods and related approaches
Surveys point to SODA and SSM as the most developed, and most applied, problem structuring methods (Mingers and Rosenhead, 2004). Interestingly, they are also the
FINAL REPORT Strategic Options Development and Analysis: The Case of the Brazilian Railways
Dr ION GEORGIOU & PEDRO STEVAUX FGV-EAESP/IMQ
33
ones most focused on managing meaning. Drama Theory and Strategic Choice Approach both require interactive involvement with stakeholders, rendering them impracticable to the present research. Robustness Analysis also requires this, especially due to the attribution of quantitative variables to central aspects of the situation. The choice for the present research, therefore, lay with SODA and SSM. The first author of this report has considerable experience in the use of SSM, as well as in its development (Georgiou 2006, 2008). His research shows that SSM enables the effective interpretation of meanings for the purpose of facilitating planning. The present project, however, is not concerned with planning but with investigating the interrelationships of the issues involved through the manner in which they are understood. SODA was designed exactly for this purpose.
SODA is a cognitive mapping methodology that allows quite intricate analyses of the maps that are generated. What differentiates it from other cognitive mapping approaches, such as concept mapping (Kane and Trochim, 2007), is its basis in George Kelly’s (1955/1991, 1963, 1970) psychological theory of personal constructs. In order to appreciate SODA, therefore, a word is required on Kelly’s theory.
As is well known, George Kelly’s theory is highly developed, so much so that there exists an international journal dedicated singularly to his psychological approach, the International Journal of Personal Construct Psychology8. As the title indicates, the central theme of Kelly’s theory is the manner in which human beings understand the world through mental constructs. Technically, constructs are not concepts - as discussed, say, in concept mapping. In order to understand their constitution and their usefulness, consider a basic example of sense-making discussed by Fransella et al (2004: 16) in their exposition of Kelly’s theory.
It is tempting to infer that , because the ideal self is related to kindness, sincerity, honesty and general wholesomeness, it is definitely undesirable to be unkind, dishonest and generally unwholesome. This inference may be correct, but there are indications that this is not always so. […] Because the construct kind-unkind is significantly correlated with sincere-insincere, the assumption is that kind people are sincere and unkind people are insincere. There is no way in which the person can say that kind people are sincere but unkind people can be both sincere and insincere.
The above provides an example of a construct: kind-unkind. This illustrates the first rule of construct construction: constructs are always bipolar. The first pole is usually what the person says explicitly. The second pole is usually elicited in order to pin down the manner in which the first pole was used. The above also argues that the idea that unkind people are insincere may not always be correct. Tom says that Harry is unkind. We ask Tom: in what way is Harry unkind? Tom says: Harry is unkind because he is too sincere; if you look a mess, Harry will tell you. In this case, Tom’s construct about Harry is, quite correctly, unkind-sincere. The point is, unless the second pole is not elicited, Harry’s unkindness will always be in question: is he unkind because he is insincere? Or is he unkind because he does not spare your feelings in being forthrightly sincere? Or is he unkind for any other number of
8 The Journal of Constructivist Psychology also addresses Kelly’s theory.
FINAL REPORT Strategic Options Development and Analysis: The Case of the Brazilian Railways
Dr ION GEORGIOU & PEDRO STEVAUX FGV-EAESP/IMQ
34
reasons? The general question is: in what way is Harry’s unkindness to be understood. Only with an answer to this question can the ambiguity be resolved.
Someone tells you that Tom is pleasant. What exactly have you understood from that statement? The options are far more numerous than you might think. Are you to understand that Tom is agreeable, polite, entertaining, boring, run of the mill, amusing, charming, delightful, pleasurable, nice, friendly, amiable, sweet, genial, cordial, good-natured, personable, or hospitable? With only ‘pleasant’ to go on, any one of these is an equal candidate. Undoubtedly, some terms are synonymous (polite and cordial, for example), whilst others are quite distinct (entertaining and boring). So how exactly is Tom pleasant? Someone says: well, he’s polite, you know. Now you begin to paint a picture: Tom is pleasant in that he is not rude or uncivilized. By what process have you reached this conclusion? You have understood the idea pleasant in view of some contrast that enhances your understanding of this idea.
Say you are out with your friend Harry. He is taking you to meet his friend Tom. On the way, Harry describes what Tom is like. When you eventually do meet Tom, some aspects of Harry’s description do not quite fit the picture Harry had painted of him to your mind’s eye. Perhaps Harry is not good at describing people. On the other hand, while Harry was describing him, perhaps you made sense of certain aspects of the description by mentally referring to erroneous contrasts. Again, you make sense of what is said by grasping hold of a contrast. And this is the basis of Kelly’s psychological theory of personal constructs. It is a theory that, in psychology, enables analysts to understand how their patients make sense of the world.
George Kelly was interested in uncovering the meaning behind what we say, and thus minimize ambiguity. He noted that problems tended to be analyzed or interpreted according to the type of analyst one consulted. So, for example, if you took your problem to a Freudian analyst, it would be structured and analyzed according to Freudian principles. The same would be expected in the case of a Jungian. A Behaviorist, in turn, would most probably analyze the situation and draw conclusions in terms of conditioning. All of this implies that the frame of reference of the analyst delimits what is perceived, how it is described, and what the ultimate prescription might be. Kelly’s objective was to devise a theory, coupled with an analytical technique, which would remove (as far as possible) the analyst’s frame of reference, and so undertake problem description and resolution from the client’s point of view. This implies a significant change in the role of the analyst. Where once the analyst was seen as some type of specialist in the contents of the mind, s/he would now be appreciated more as a process facilitator specializing in structuring the client’s thoughts as the client sees them. This view of analysis and the role of the analyst underpins SODA.
Kelly designed a valuable tool for recording and analyzing constructs: the repertory grid. It is literally a grid that the psychologist designs, along with a client, in order to uncover the latter’s sense-making repertory when describing aspects of the world. Although repertory grids have been tried by SODA as a problem structuring tool, they have proved cumbersome. In the first place, stakeholders faced with complex and highly uncertain situations tend to generate an inordinate amount of constructs
FINAL REPORT Strategic Options Development and Analysis: The Case of the Brazilian Railways
Dr ION GEORGIOU & PEDRO STEVAUX FGV-EAESP/IMQ
35
when discussing such situations. Repertory grids prove unwieldy at this level, both as tools for recording the constructs as well as for analyzing them. The attempted use of repertory grids can therefore limit the amount of detail, or richness, that can be recorded about a problematic situation. One repercussion of this is that complexity is inadvertently simplified and we risk missing crucial information in our problem structuring attempts. The case can also be made that repertory grids are difficult for busy decision makers to begin to understand, let alone eventually use.
SODA essentially borrows only the idea of constructs from Kelly. It couples this with the idea of networks in order to design the system of constructs used by a stakeholder, thus making explicit their interrelations, their causes, their effects and their ultimate consequences. The final product is a map of a person’s constructs which can then be merged with other individuals’ maps in order to obtain a group understanding of a situation. The possibilities this opens will be explored in the following pages.
The maps considered in this research are called SODA maps. The SODA literature also calls them cognitive maps (which they essentially are), and it also commonly fails to include the second pole of a construct. For the present purposes, the term SODA map will be used strictly to indicate the process and content of cognitive maps constituted by bipolar constructs. In order to become familiar with SODA mapping as quickly as possible, consider a short written description of the usefulness of SODA maps. It is followed by the manner in which it may be translated into a map. In this way, one can simultaneously learn about SODA and practical mapping – one can understand SODA through SODA, so to speak.
We often think of a person as having a train of thought. Literary modernism, however, has shown us that a person’s mind is usually filled with storms of simultaneous information. Proust’s Remembrance of Things Past and Joyce’s Ulysses are reflections of the tornado of thought that tends to occupy our minds twenty four hours a day. A person’s thoughts, therefore, are rarely linear or logical; they jump from one subject to another and back in flashes, and one can even observe this in other people’s leisurely conversations. Imagine, therefore, what a storm of information you might face when someone is trying to describe their perspective of a complex and uncertain problematic situation. Furthermore, being a perspective, it contains perhaps arbitrary, skewed or even unreliable content. This might be due to a variety of reasons: the person speaks from their own selective experience, they are ignorant of a number of relevant issues, they have been to some degree misinformed, or they are living according to a set perspective (be it religious, political, or otherwise influenced from their own upbringing). You soon find yourself wanting to impose some order that minimizes the distortion and speaks in clearer terms. This is not unlike the work of cartographers. They seek to impose a projection that minimizes the distortion of representing the spherical Earth on a flat sheet of paper, a distortion that can communicate a view of the world powerfully enough for some purpose. Thus Mercator’s projection is especially suited to navigation whilst the Peters projection focuses on representing comparable land masses.
But if someone hits you with a tornado of thought, you don’t just want to impose structure willy-nilly. You need to represent the complexity of a person’s thinking in a way that allows you to methodologically manipulate their thoughts. Only methodological guidance can promise the possibility of seeing a situation in a new light. And if knowledge of a situation is indeed seen in a new light, then the methodology has been useful. For the present purposes, a SODA map will be more or less useful depending upon the degree of new light it has shed on our knowledge of the situation.
FINAL REPORT Strategic Options Development and Analysis: The Case of the Brazilian Railways
Dr ION GEORGIOU & PEDRO STEVAUX FGV-EAESP/IMQ
36
If knowledge of our situation is seen in a new light, this opens the way for considering more questions or possibilities toward resolution. A SODA map will be more or less useful depending upon the degree to which it allows for such new considerations. For once a SODA map stops to stimulate new ideas, we can say that we have learnt all we could from it. Its usefulness thus diminishes and we gradually move on to other methodological tools that can help us apply our new-found knowledge to problem resolution.
As long as more questions and possibilities begin to emerge, a person will inevitably be drawn to understanding other people’s perspectives, and thus grow beyond the confines of his/her own. SODA mapping can thus incorporate a person’s developing beliefs and hence be rendered even more useful. In addition, new considerations will enable a person to begin to view the world from a changed perspective, one that can contribute to diminishing any initial arbitrariness, skewness and unreliability.
The text above provides certain information about SODA mapping. It also fails to mention quite a bit. For example, it does not inform on how to map (this will be done shortly). The text focuses on a particular perspective of SODA maps: their degree of usefulness. Talking about degrees of usefulness is a particularly interesting perspective because it gives an idea of how such usefulness oscillates. In other words, the text addresses dynamics. Complexity and uncertainty always arise in dynamic contexts, and people’s descriptions of them will address such dynamics in varying degrees of accuracy. So the question is: how can we map out the logic of the description as well as the dynamics of the situation being described? Where best to begin?
Quite simply, review the description and begin to pick out constructs. For example, the first paragraph begins by discussing a person’s thought processes. We are told that a person provides a storm of information, a tornado of thought, as opposed to providing (or even thinking along) a train of thought. We have our first construct:
person provides a storm of information / a tornado of thought… provides more of a train of thought
Notice that the two poles are separated by three dots, in accordance with the SODA methodology. Which of the two pieces of information are put into which pole is neither here nor there, although conventionally it is advisable to place what is explicitly said in the first pole. The reason is because, upon approaching a map, one can follow a string of primary poles in order to see what was actually said. But that’s merely a recommendation, not a rule.
Looking back at the text, soon afterwards we are told that a person’s thoughts are rarely linear or logical. This gives us another construct:
person’s thoughts rarely linear and logical… more often linear and logical
We have now identified two constructs and are well on our way to drawing up a construct list of the discussion. But already, we have to think about dynamics, for even with these two constructs at hand, the description points to a dynamic between them. It says that a person provides a storm of information and therefore a person’s thoughts are rarely linear and logical. It would appear, then, that the first construct leads to the second. But, are a person’s thoughts rarely linear and logical because he/she provides a storm of information, or does their non-linearity and skewed logic
FINAL REPORT Strategic Options Development and Analysis: The Case of the Brazilian Railways
Dr ION GEORGIOU & PEDRO STEVAUX FGV-EAESP/IMQ
37
cause the provision of a storm of information? If we accept that it is the thought processes that eventually lead to externalized description, then we should choose the second option: our thoughts are rarely linear and logical and this causes us to provide a storm of information, or a tornado of externalized thought, when describing problematic situations.
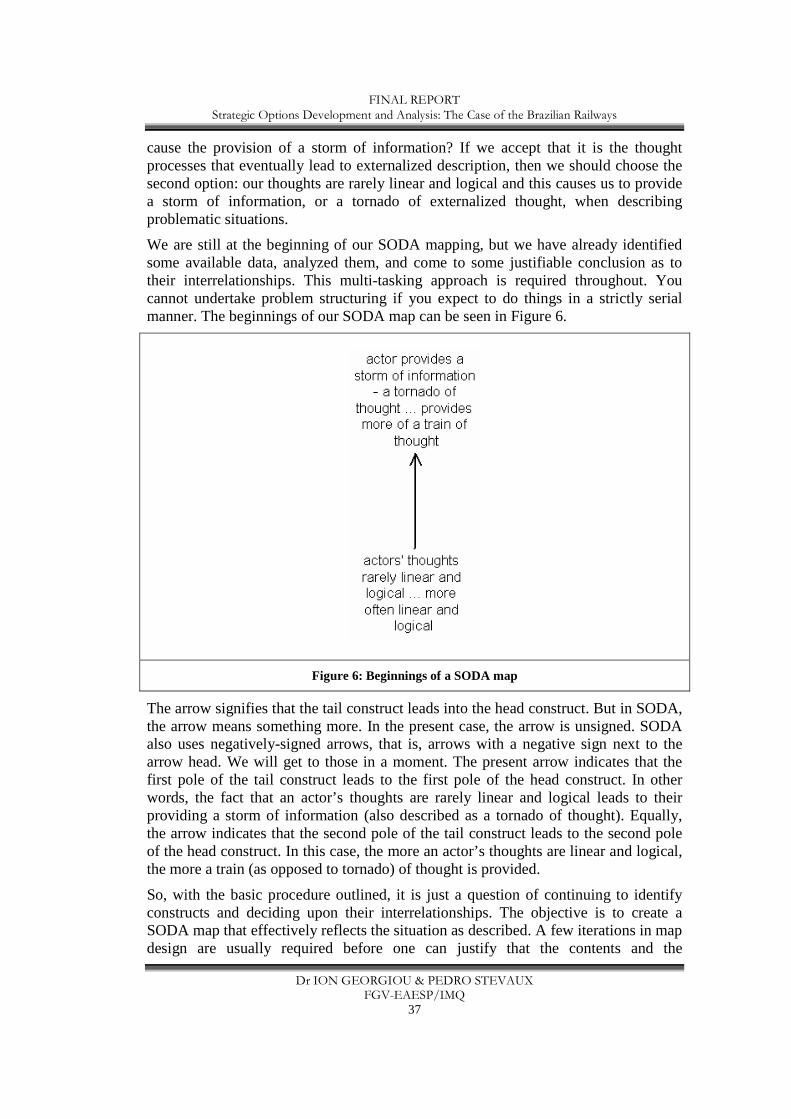
We are still at the beginning of our SODA mapping, but we have already identified some available data, analyzed them, and come to some justifiable conclusion as to their interrelationships. This multi-tasking approach is required throughout. You cannot undertake problem structuring if you expect to do things in a strictly serial manner. The beginnings of our SODA map can be seen in Figure 6.
Figure 6: Beginnings of a SODA map
The arrow signifies that the tail construct leads into the head construct. But in SODA, the arrow means something more. In the present case, the arrow is unsigned. SODA also uses negatively-signed arrows, that is, arrows with a negative sign next to the arrow head. We will get to those in a moment. The present arrow indicates that the first pole of the tail construct leads to the first pole of the head construct. In other words, the fact that an actor’s thoughts are rarely linear and logical leads to their providing a storm of information (also described as a tornado of thought). Equally, the arrow indicates that the second pole of the tail construct leads to the second pole of the head construct. In this case, the more an actor’s thoughts are linear and logical, the more a train (as opposed to tornado) of thought is provided.
So, with the basic procedure outlined, it is just a question of continuing to identify constructs and deciding upon their interrelationships. The objective is to create a SODA map that effectively reflects the situation as described. A few iterations in map design are usually required before one can justify that the contents and the
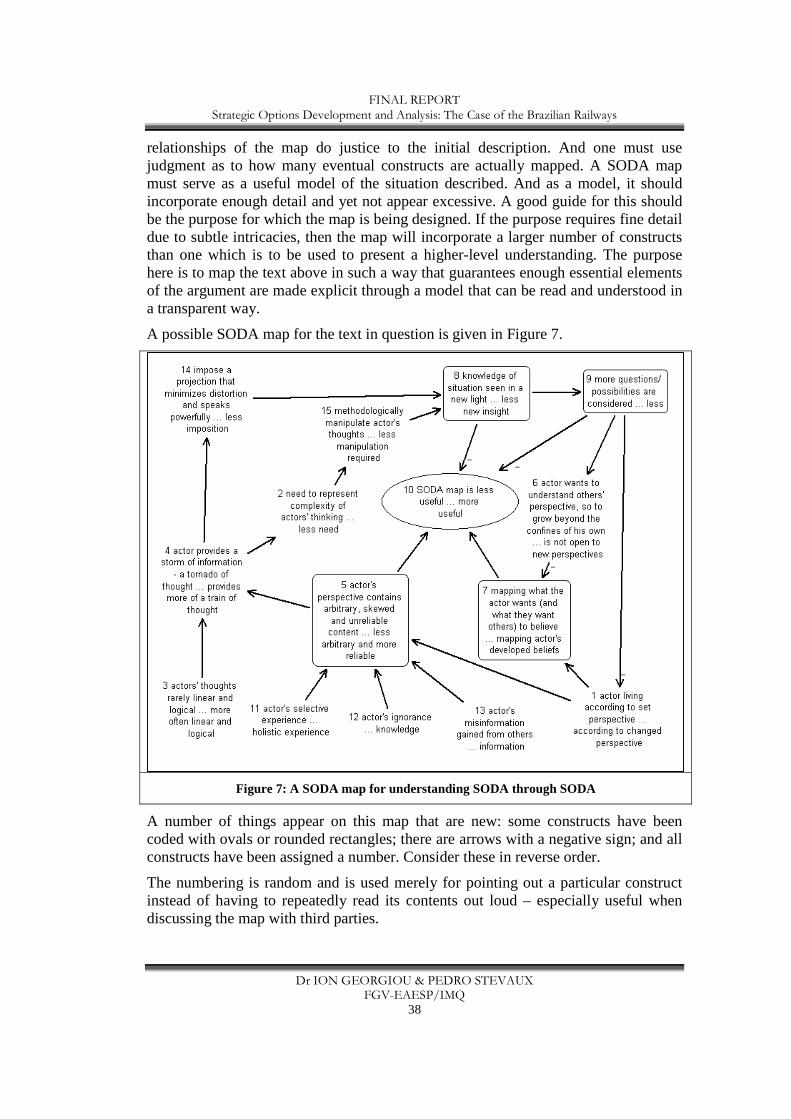
FINAL REPORT Strategic Options Development and Analysis: The Case of the Brazilian Railways
Dr ION GEORGIOU & PEDRO STEVAUX FGV-EAESP/IMQ
38
relationships of the map do justice to the initial description. And one must use judgment as to how many eventual constructs are actually mapped. A SODA map must serve as a useful model of the situation described. And as a model, it should incorporate enough detail and yet not appear excessive. A good guide for this should be the purpose for which the map is being designed. If the purpose requires fine detail due to subtle intricacies, then the map will incorporate a larger number of constructs than one which is to be used to present a higher-level understanding. The purpose here is to map the text above in such a way that guarantees enough essential elements of the argument are made explicit through a model that can be read and understood in a transparent way.
A possible SODA map for the text in question is given in Figure 7.
Figure 7: A SODA map for understanding SODA through SODA
A number of things appear on this map that are new: some constructs have been coded with ovals or rounded rectangles; there are arrows with a negative sign; and all constructs have been assigned a number. Consider these in reverse order.
The numbering is random and is used merely for pointing out a particular construct instead of having to repeatedly read its contents out loud – especially useful when discussing the map with third parties.
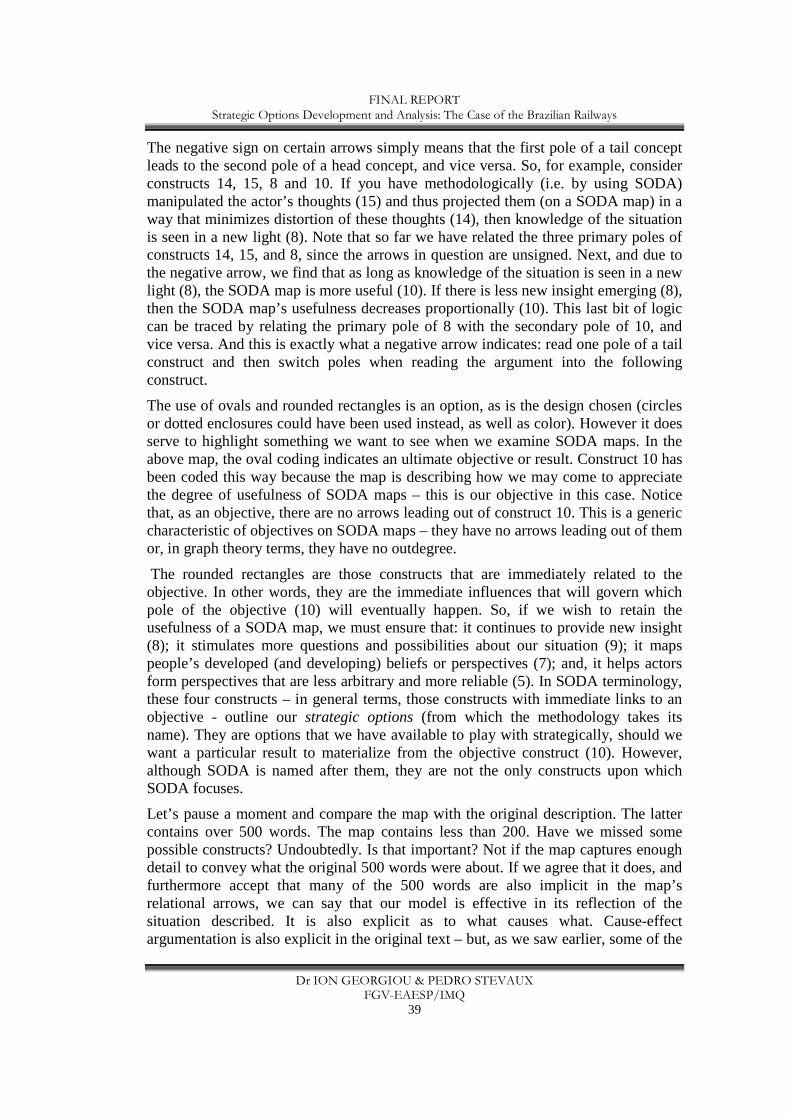
FINAL REPORT Strategic Options Development and Analysis: The Case of the Brazilian Railways
Dr ION GEORGIOU & PEDRO STEVAUX FGV-EAESP/IMQ
39
The negative sign on certain arrows simply means that the first pole of a tail concept leads to the second pole of a head concept, and vice versa. So, for example, consider constructs 14, 15, 8 and 10. If you have methodologically (i.e. by using SODA) manipulated the actor’s thoughts (15) and thus projected them (on a SODA map) in a way that minimizes distortion of these thoughts (14), then knowledge of the situation is seen in a new light (8). Note that so far we have related the three primary poles of constructs 14, 15, and 8, since the arrows in question are unsigned. Next, and due to the negative arrow, we find that as long as knowledge of the situation is seen in a new light (8), the SODA map is more useful (10). If there is less new insight emerging (8), then the SODA map’s usefulness decreases proportionally (10). This last bit of logic can be traced by relating the primary pole of 8 with the secondary pole of 10, and vice versa. And this is exactly what a negative arrow indicates: read one pole of a tail construct and then switch poles when reading the argument into the following construct.
The use of ovals and rounded rectangles is an option, as is the design chosen (circles or dotted enclosures could have been used instead, as well as color). However it does serve to highlight something we want to see when we examine SODA maps. In the above map, the oval coding indicates an ultimate objective or result. Construct 10 has been coded this way because the map is describing how we may come to appreciate the degree of usefulness of SODA maps – this is our objective in this case. Notice that, as an objective, there are no arrows leading out of construct 10. This is a generic characteristic of objectives on SODA maps – they have no arrows leading out of them or, in graph theory terms, they have no outdegree.
The rounded rectangles are those constructs that are immediately related to the objective. In other words, they are the immediate influences that will govern which pole of the objective (10) will eventually happen. So, if we wish to retain the usefulness of a SODA map, we must ensure that: it continues to provide new insight (8); it stimulates more questions and possibilities about our situation (9); it maps people’s developed (and developing) beliefs or perspectives (7); and, it helps actors form perspectives that are less arbitrary and more reliable (5). In SODA terminology, these four constructs – in general terms, those constructs with immediate links to an objective - outline our strategic options (from which the methodology takes its name). They are options that we have available to play with strategically, should we want a particular result to materialize from the objective construct (10). However, although SODA is named after them, they are not the only constructs upon which SODA focuses.
Let’s pause a moment and compare the map with the original description. The latter contains over 500 words. The map contains less than 200. Have we missed some possible constructs? Undoubtedly. Is that important? Not if the map captures enough detail to convey what the original 500 words were about. If we agree that it does, and furthermore accept that many of the 500 words are also implicit in the map’s relational arrows, we can say that our model is effective in its reflection of the situation described. It is also explicit as to what causes what. Cause-effect argumentation is also explicit in the original text – but, as we saw earlier, some of the

FINAL REPORT Strategic Options Development and Analysis: The Case of the Brazilian Railways
Dr ION GEORGIOU & PEDRO STEVAUX FGV-EAESP/IMQ
40
apparent logic of that text was debatable, and our mapping has clarified it, or at least allowed us to take a justifiable position on the issue. Most importantly, however, instead of having someone read, or listen to, 500 words of prose, what is offered is a picture that is easy to read and understand in half the time. And interested parties can begin exploring sections of it straight away, much like one would explore an atlas. And things can be pointed to and debated with a degree of clarity not available in text form. And the map can be used with others as a base for discussion and negotiation, and… and this is already pointing to the usefulness of having the SODA map.
Might not someone else have probably created a different map of the situation, using different constructs? Of course. In the same way that there exist different maps of any one geographical region, published by different cartographers, and serving to highlight different aspects of the terrain. The important thing is not the potential variety available: it is which one of these maps serves the purpose better. One might object: that leaves a lot of leeway for cloak-and-dagger tactics. If we want to make someone think something, we design a map in a particular way. Yes, of course, the door is always open to manipulation of all sorts – as it is, interestingly, in cartography (Wood, 1992). We would also be manipulating someone if we insisted that we build a mathematical model of the situation, claiming that only quantitative variables are true reflections of a situation. One cannot escape manipulation in problem structuring – as one cannot escape it in most other activities in life. The dialogue between the analyst and the client group serves as an effective recourse, as does the degree of effectively justifying a map’s contents and relationships. If there is one key word in problem structuring practice, it is justification. Can you justify the content of your structure to a third party? Can you trace your reasoning back to the raw information? Basically, can you account for yourself and your structuring?
Alongside this, it is always good practice to pursue some form of triangulation (to use a cartographic term). This means that we should bring other models or methodologies to bear upon our problematic situation. The reason behind this is that the degree of accuracy that we can confer upon any one of our models of reality is proportional to the variety of models we use to reflect the variety inherent in that reality (Phillips, 1984). There is no doubt, however, that problem structuring through SODA mapping is a good way to start understanding some of the inherent complexity and uncertainty of a problematic situation – as will be illustrated when SODA is applied to the Brazilian railways situation.
But what about the dynamics of the situation? Let’s take a closer look at the map in Figure 7 and work through some of them. This will serve us well when we come to look at more complex dynamics later. Looking back at the SODA map, we can easily identify some simple dynamics. For example, we can trace the argument of constructs 3, 4, 14, 8, and 10 and read it as follows:
The more an actor’s thoughts are non-linear or illogical, the more the actor tends to provide a storm of information and, therefore, the more we require the imposition of some projection (a SODA map) that clarifies the distortion, thus allowing knowledge of the situation to be seen in a new light and so rendering a SODA map more useful.
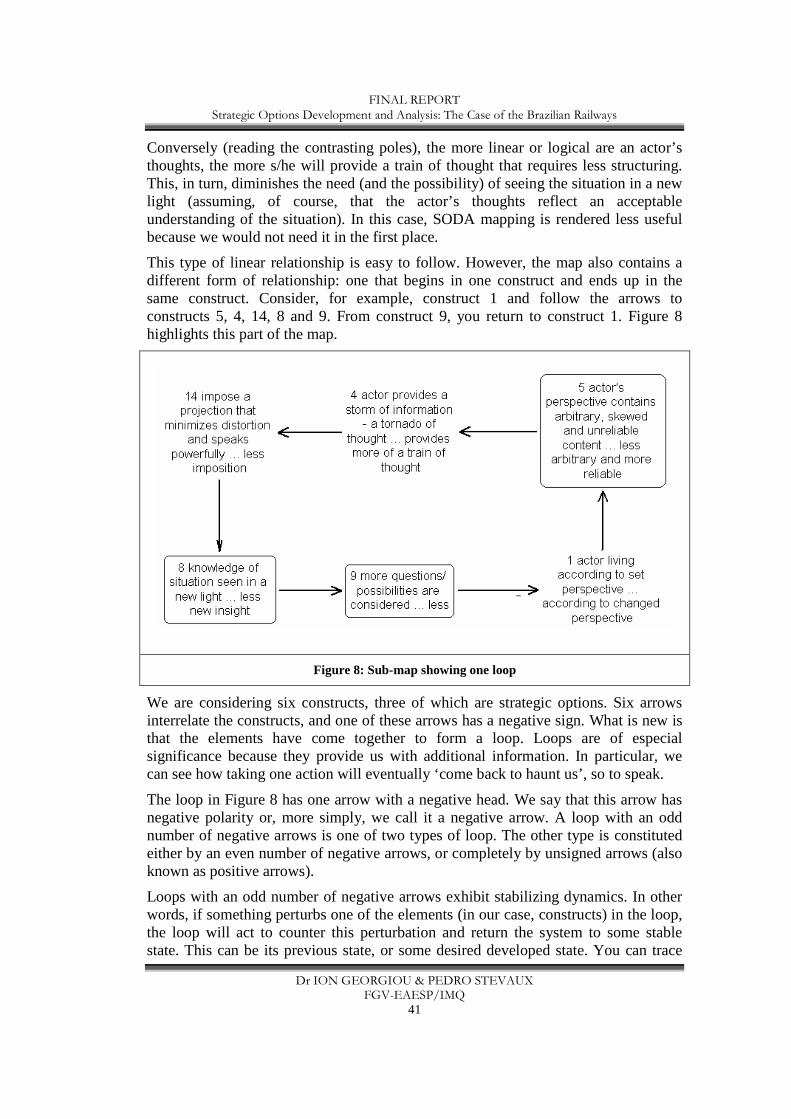
FINAL REPORT Strategic Options Development and Analysis: The Case of the Brazilian Railways
Dr ION GEORGIOU & PEDRO STEVAUX FGV-EAESP/IMQ
41
Conversely (reading the contrasting poles), the more linear or logical are an actor’s thoughts, the more s/he will provide a train of thought that requires less structuring. This, in turn, diminishes the need (and the possibility) of seeing the situation in a new light (assuming, of course, that the actor’s thoughts reflect an acceptable understanding of the situation). In this case, SODA mapping is rendered less useful because we would not need it in the first place.
This type of linear relationship is easy to follow. However, the map also contains a different form of relationship: one that begins in one construct and ends up in the same construct. Consider, for example, construct 1 and follow the arrows to constructs 5, 4, 14, 8 and 9. From construct 9, you return to construct 1. Figure 8 highlights this part of the map.
Figure 8: Sub-map showing one loop
We are considering six constructs, three of which are strategic options. Six arrows interrelate the constructs, and one of these arrows has a negative sign. What is new is that the elements have come together to form a loop. Loops are of especial significance because they provide us with additional information. In particular, we can see how taking one action will eventually ‘come back to haunt us’, so to speak.
The loop in Figure 8 has one arrow with a negative head. We say that this arrow has negative polarity or, more simply, we call it a negative arrow. A loop with an odd number of negative arrows is one of two types of loop. The other type is constituted either by an even number of negative arrows, or completely by unsigned arrows (also known as positive arrows).
Loops with an odd number of negative arrows exhibit stabilizing dynamics. In other words, if something perturbs one of the elements (in our case, constructs) in the loop, the loop will act to counter this perturbation and return the system to some stable state. This can be its previous state, or some desired developed state. You can trace
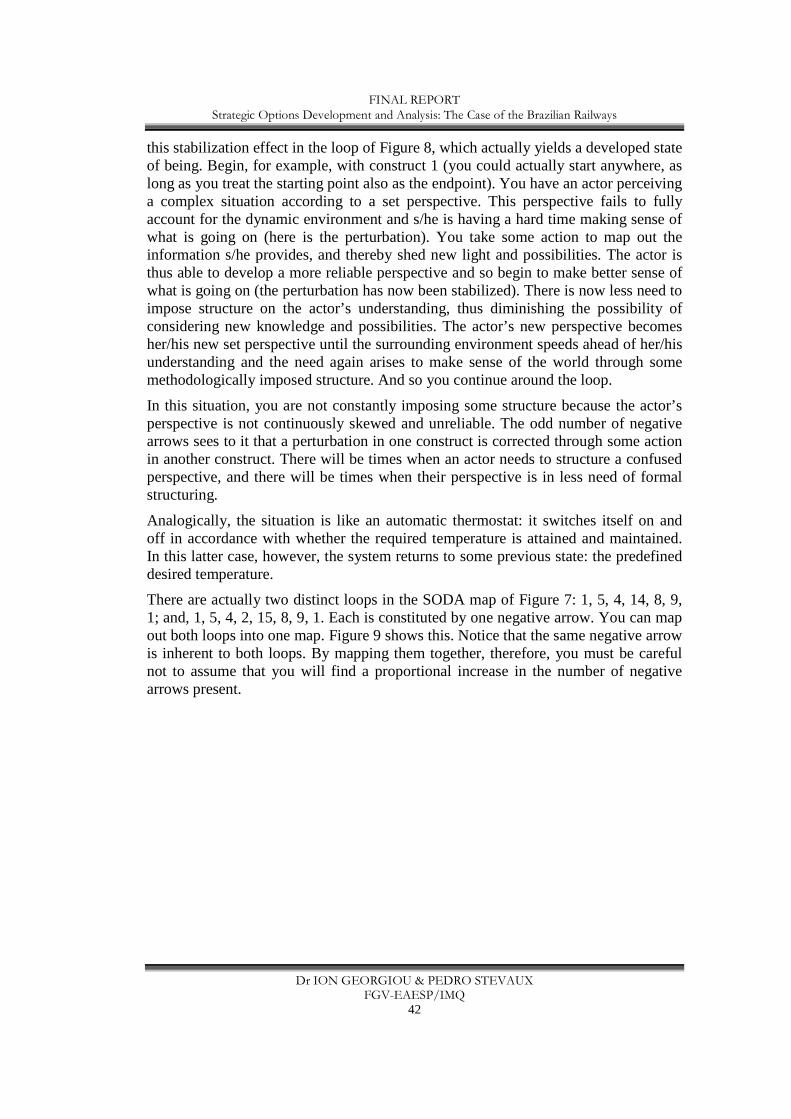
FINAL REPORT Strategic Options Development and Analysis: The Case of the Brazilian Railways
Dr ION GEORGIOU & PEDRO STEVAUX FGV-EAESP/IMQ
42
this stabilization effect in the loop of Figure 8, which actually yields a developed state of being. Begin, for example, with construct 1 (you could actually start anywhere, as long as you treat the starting point also as the endpoint). You have an actor perceiving a complex situation according to a set perspective. This perspective fails to fully account for the dynamic environment and s/he is having a hard time making sense of what is going on (here is the perturbation). You take some action to map out the information s/he provides, and thereby shed new light and possibilities. The actor is thus able to develop a more reliable perspective and so begin to make better sense of what is going on (the perturbation has now been stabilized). There is now less need to impose structure on the actor’s understanding, thus diminishing the possibility of considering new knowledge and possibilities. The actor’s new perspective becomes her/his new set perspective until the surrounding environment speeds ahead of her/his understanding and the need again arises to make sense of the world through some methodologically imposed structure. And so you continue around the loop.
In this situation, you are not constantly imposing some structure because the actor’s perspective is not continuously skewed and unreliable. The odd number of negative arrows sees to it that a perturbation in one construct is corrected through some action in another construct. There will be times when an actor needs to structure a confused perspective, and there will be times when their perspective is in less need of formal structuring.
Analogically, the situation is like an automatic thermostat: it switches itself on and off in accordance with whether the required temperature is attained and maintained. In this latter case, however, the system returns to some previous state: the predefined desired temperature.
There are actually two distinct loops in the SODA map of Figure 7: 1, 5, 4, 14, 8, 9, 1; and, 1, 5, 4, 2, 15, 8, 9, 1. Each is constituted by one negative arrow. You can map out both loops into one map. Figure 9 shows this. Notice that the same negative arrow is inherent to both loops. By mapping them together, therefore, you must be careful not to assume that you will find a proportional increase in the number of negative arrows present.
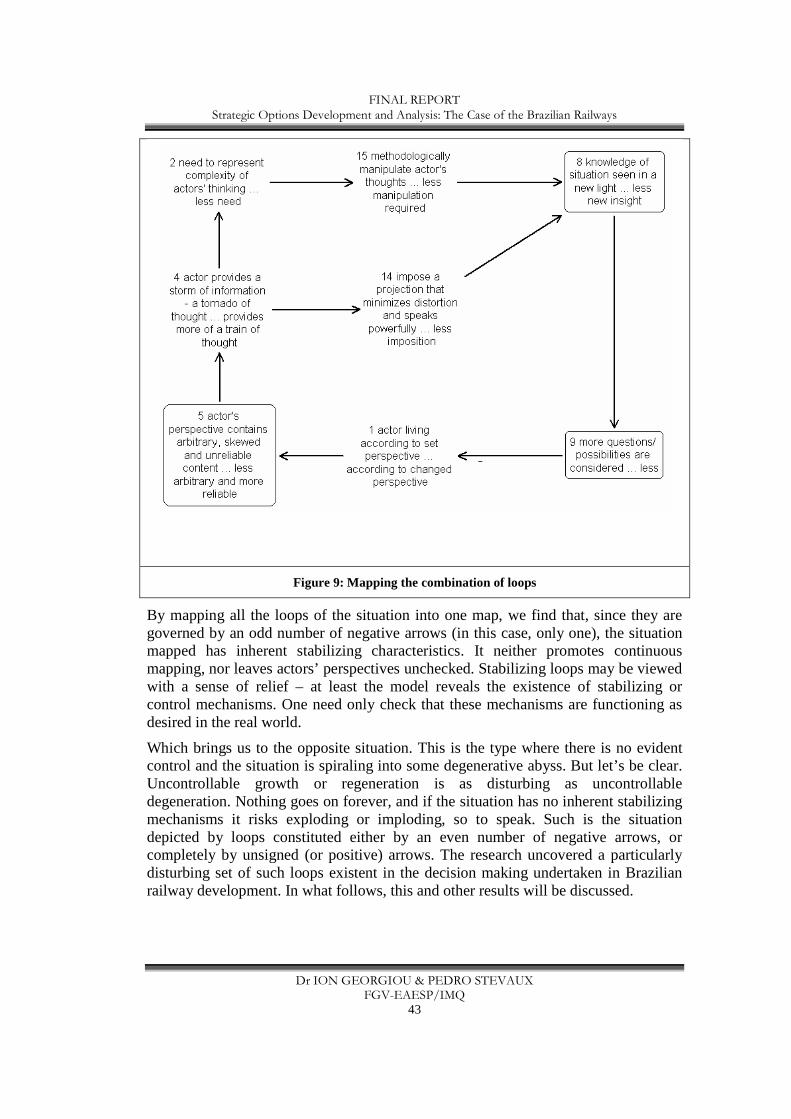
FINAL REPORT Strategic Options Development and Analysis: The Case of the Brazilian Railways
Dr ION GEORGIOU & PEDRO STEVAUX FGV-EAESP/IMQ
43
Figure 9: Mapping the combination of loops
By mapping all the loops of the situation into one map, we find that, since they are governed by an odd number of negative arrows (in this case, only one), the situation mapped has inherent stabilizing characteristics. It neither promotes continuous mapping, nor leaves actors’ perspectives unchecked. Stabilizing loops may be viewed with a sense of relief – at least the model reveals the existence of stabilizing or control mechanisms. One need only check that these mechanisms are functioning as desired in the real world.
Which brings us to the opposite situation. This is the type where there is no evident control and the situation is spiraling into some degenerative abyss. But let’s be clear. Uncontrollable growth or regeneration is as disturbing as uncontrollable degeneration. Nothing goes on forever, and if the situation has no inherent stabilizing mechanisms it risks exploding or imploding, so to speak. Such is the situation depicted by loops constituted either by an even number of negative arrows, or completely by unsigned (or positive) arrows. The research uncovered a particularly disturbing set of such loops existent in the decision making undertaken in Brazilian railway development. In what follows, this and other results will be discussed.

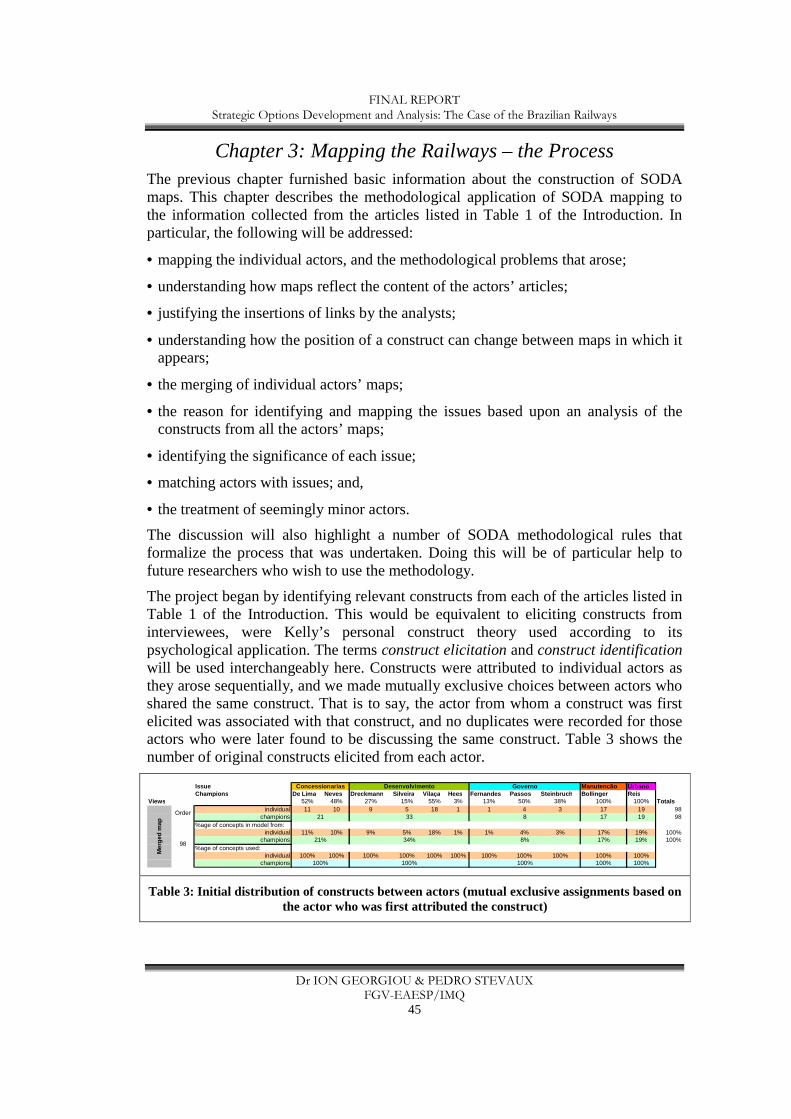
FINAL REPORT Strategic Options Development and Analysis: The Case of the Brazilian Railways
Dr ION GEORGIOU & PEDRO STEVAUX FGV-EAESP/IMQ
45
Chapter 3: Mapping the Railways – the Process The previous chapter furnished basic information about the construction of SODA maps. This chapter describes the methodological application of SODA mapping to the information collected from the articles listed in Table 1 of the Introduction. In particular, the following will be addressed:
• mapping the individual actors, and the methodological problems that arose;
• understanding how maps reflect the content of the actors’ articles;
• justifying the insertions of links by the analysts;
• understanding how the position of a construct can change between maps in which it appears;
• the merging of individual actors’ maps;
• the reason for identifying and mapping the issues based upon an analysis of the constructs from all the actors’ maps;
• identifying the significance of each issue;
• matching actors with issues; and,
• the treatment of seemingly minor actors.
The discussion will also highlight a number of SODA methodological rules that formalize the process that was undertaken. Doing this will be of particular help to future researchers who wish to use the methodology.
The project began by identifying relevant constructs from each of the articles listed in Table 1 of the Introduction. This would be equivalent to eliciting constructs from interviewees, were Kelly’s personal construct theory used according to its psychological application. The terms construct elicitation and construct identification will be used interchangeably here. Constructs were attributed to individual actors as they arose sequentially, and we made mutually exclusive choices between actors who shared the same construct. That is to say, the actor from whom a construct was first elicited was associated with that construct, and no duplicates were recorded for those actors who were later found to be discussing the same construct. Table 3 shows the number of original constructs elicited from each actor.
Issue Manutenção UrbanoChampions De Lima Neves Dreckmann Silveira Vilaça Hees Fernandes Passos Steinbruch Bollinger Reis
Views 52% 48% 27% 15% 55% 3% 13% 50% 38% 100% 100% Totalsindividual 11 10 9 5 18 1 1 4 3 17 19 98
champions 17 19 98%age of concepts in model from:
individual 11% 10% 9% 5% 18% 1% 1% 4% 3% 17% 19% 100%champions 17% 19% 100%
%age of concepts used:individual 100% 100% 100% 100% 100% 100% 100% 100% 100% 100% 100%
champions 100% 100%
Concessionarias Desenvolvimento Governo
8
Mer
ged
map
Order21 33
9821% 34% 8%
100% 100% 100%
Table 3: Initial distribution of constructs between actors (mutual exclusive assignments based on the actor who was first attributed the construct)
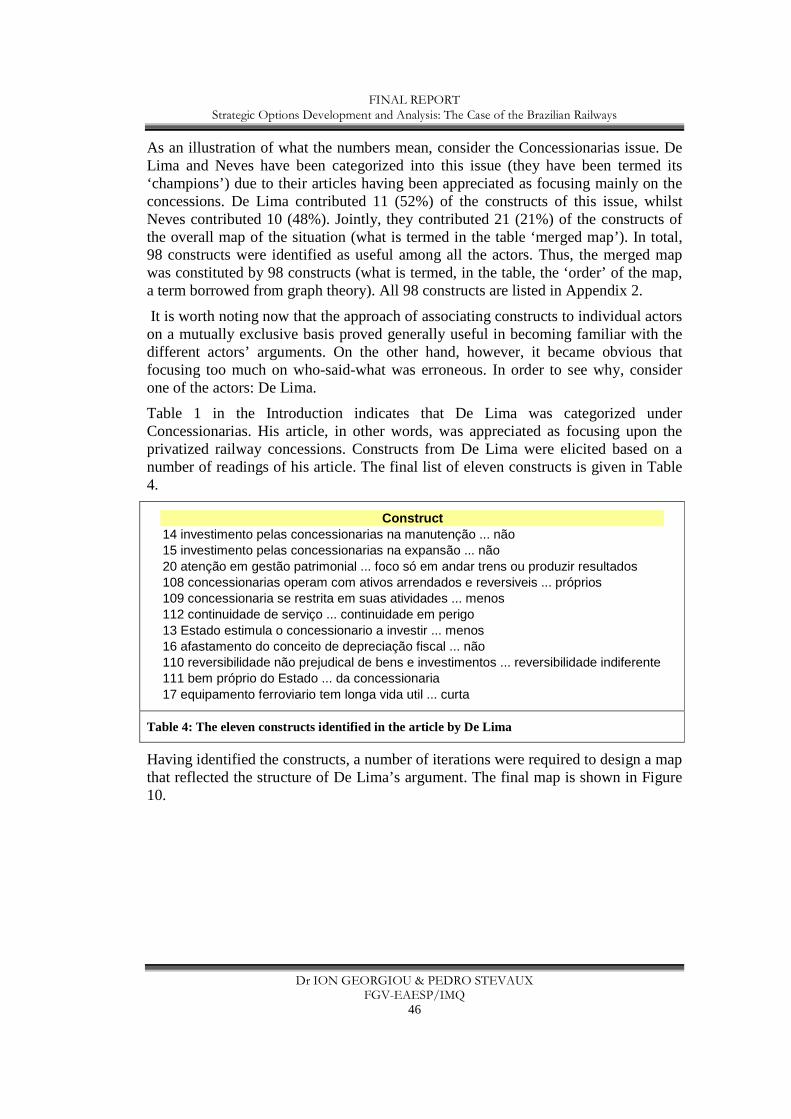
FINAL REPORT Strategic Options Development and Analysis: The Case of the Brazilian Railways
Dr ION GEORGIOU & PEDRO STEVAUX FGV-EAESP/IMQ
46
As an illustration of what the numbers mean, consider the Concessionarias issue. De Lima and Neves have been categorized into this issue (they have been termed its ‘champions’) due to their articles having been appreciated as focusing mainly on the concessions. De Lima contributed 11 (52%) of the constructs of this issue, whilst Neves contributed 10 (48%). Jointly, they contributed 21 (21%) of the constructs of the overall map of the situation (what is termed in the table ‘merged map’). In total, 98 constructs were identified as useful among all the actors. Thus, the merged map was constituted by 98 constructs (what is termed, in the table, the ‘order’ of the map, a term borrowed from graph theory). All 98 constructs are listed in Appendix 2.
It is worth noting now that the approach of associating constructs to individual actors on a mutually exclusive basis proved generally useful in becoming familiar with the different actors’ arguments. On the other hand, however, it became obvious that focusing too much on who-said-what was erroneous. In order to see why, consider one of the actors: De Lima.
Table 1 in the Introduction indicates that De Lima was categorized under Concessionarias. His article, in other words, was appreciated as focusing upon the privatized railway concessions. Constructs from De Lima were elicited based on a number of readings of his article. The final list of eleven constructs is given in Table 4.
Construct14 investimento pelas concessionarias na manutenção ... não15 investimento pelas concessionarias na expansão ... não20 atenção em gestão patrimonial ... foco só em andar trens ou produzir resultados108 concessionarias operam com ativos arrendados e reversiveis ... próprios109 concessionaria se restrita em suas atividades ... menos112 continuidade de serviço ... continuidade em perigo13 Estado estimula o concessionario a investir ... menos16 afastamento do conceito de depreciação fiscal ... não110 reversibilidade não prejudical de bens e investimentos ... reversibilidade indiferente111 bem próprio do Estado ... da concessionaria17 equipamento ferroviario tem longa vida util ... curta
Table 4: The eleven constructs identified in the article by De Lima
Having identified the constructs, a number of iterations were required to design a map that reflected the structure of De Lima’s argument. The final map is shown in Figure 10.
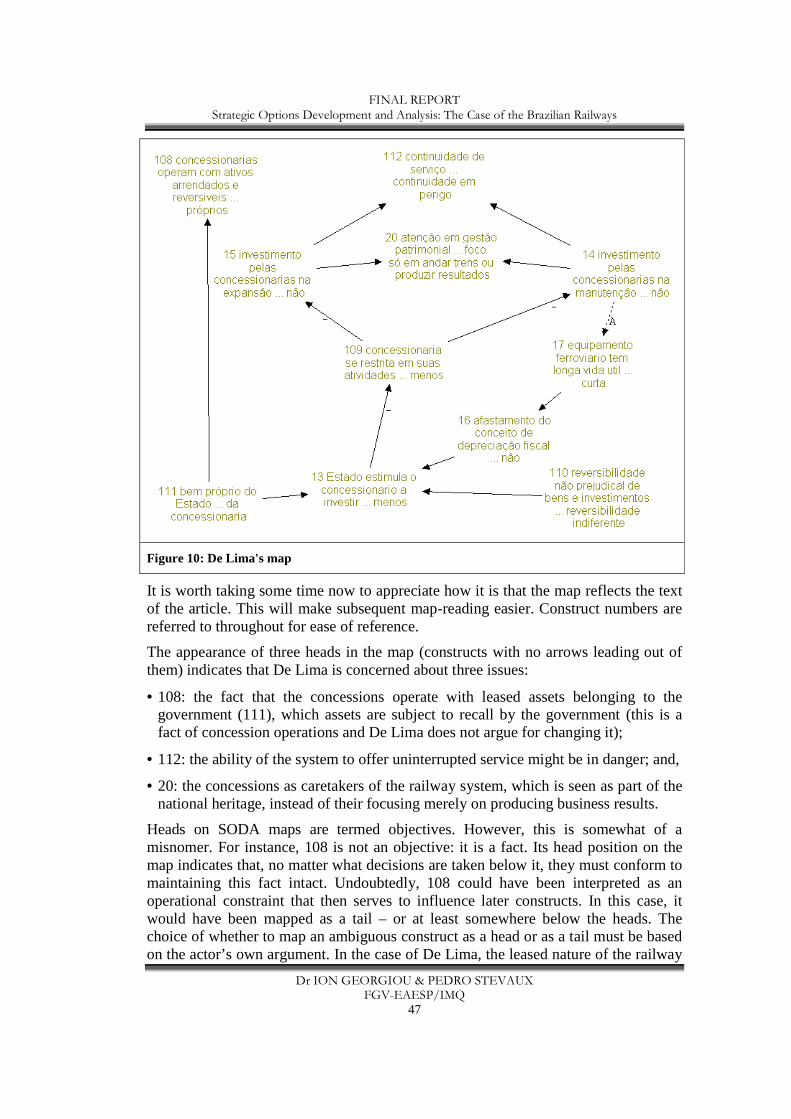
FINAL REPORT Strategic Options Development and Analysis: The Case of the Brazilian Railways
Dr ION GEORGIOU & PEDRO STEVAUX FGV-EAESP/IMQ
47
Figure 10: De Lima's map
It is worth taking some time now to appreciate how it is that the map reflects the text of the article. This will make subsequent map-reading easier. Construct numbers are referred to throughout for ease of reference.
The appearance of three heads in the map (constructs with no arrows leading out of them) indicates that De Lima is concerned about three issues:
• 108: the fact that the concessions operate with leased assets belonging to the government (111), which assets are subject to recall by the government (this is a fact of concession operations and De Lima does not argue for changing it);
• 112: the ability of the system to offer uninterrupted service might be in danger; and,
• 20: the concessions as caretakers of the railway system, which is seen as part of the national heritage, instead of their focusing merely on producing business results.
Heads on SODA maps are termed objectives. However, this is somewhat of a misnomer. For instance, 108 is not an objective: it is a fact. Its head position on the map indicates that, no matter what decisions are taken below it, they must conform to maintaining this fact intact. Undoubtedly, 108 could have been interpreted as an operational constraint that then serves to influence later constructs. In this case, it would have been mapped as a tail – or at least somewhere below the heads. The choice of whether to map an ambiguous construct as a head or as a tail must be based on the actor’s own argument. In the case of De Lima, the leased nature of the railway
FINAL REPORT Strategic Options Development and Analysis: The Case of the Brazilian Railways
Dr ION GEORGIOU & PEDRO STEVAUX FGV-EAESP/IMQ
48
assets is not put forth as a constraint, but as a result of the policy instituted by the government. Hence, 108 appears as a head in the map. The main methodological lesson here is that heads on SODA maps can reflect objectives as well as facts to which subordinate decisions must conform. This leads us to our first methodological rule.
Heads on SODA maps can reflect objectives, or facts to which subordinate decisions must conform. A construct that indicates a fact can also be interpreted as an operational constraint, in which case it would appear at some level below the heads. Its position on the map, however, should be based less on interpretation and more on the actor’s explicit argument.
SODA Rule 1: Heads as objectives or facts
Turning to the other two heads, according to De Lima, service continuity (112) is secured in proportion to the level of investments made by the concessions in operational expansion (15) and operational maintenance (14). Should such investments be made, furthermore, it will enable the concessions to meet an objective set by the government: that concessions should not merely focus on operational results, but also act as caretakers of the railway system which is seen as part of the national heritage (20).
The level of investments, however, depends on the degree to which the government stimulates the concessions to invest (13). For De Lima, there are three existent stimulation mechanisms:
• 111: the fact that the assets belong to the government implies that it is in the interest of the government that they be put to effective use;
• 16: the fact that the government has waived the requirement to record depreciation on the value of the assets (to some extent, this is acceptable since railway assets do tend to have a long appreciable life – between 25-50 years);
• 110: the fact that if the government decides to recall the assets, it is contractually obliged that it does so without adversely affecting the concessions.
Should these stimulation mechanisms be managed properly, the activities of the concessions will be subject to minimal restrictions (109), which would then pave the way for increased investments in expansion (15) and operational maintenance (14).
One arrow on the De Lima map – between 14 and 17 - is designed with a dotted line, and accompanied by the letter ‘A’. This indicates a link placed by the analysts (the authors of the report). Links such as this should, as a rule, be used sparingly. They are used when an actor has not explicitly argued for the link, but where the argument, along with the map, render such a link justifiable. In the present case, De Lima explicitly mentions the need for concessions to invest in maintenance (14) and the fact that railway equipment, once installed, can be used for a relatively long time (17). He does not, however, explicitly link the two ideas. The analysts’ link appears
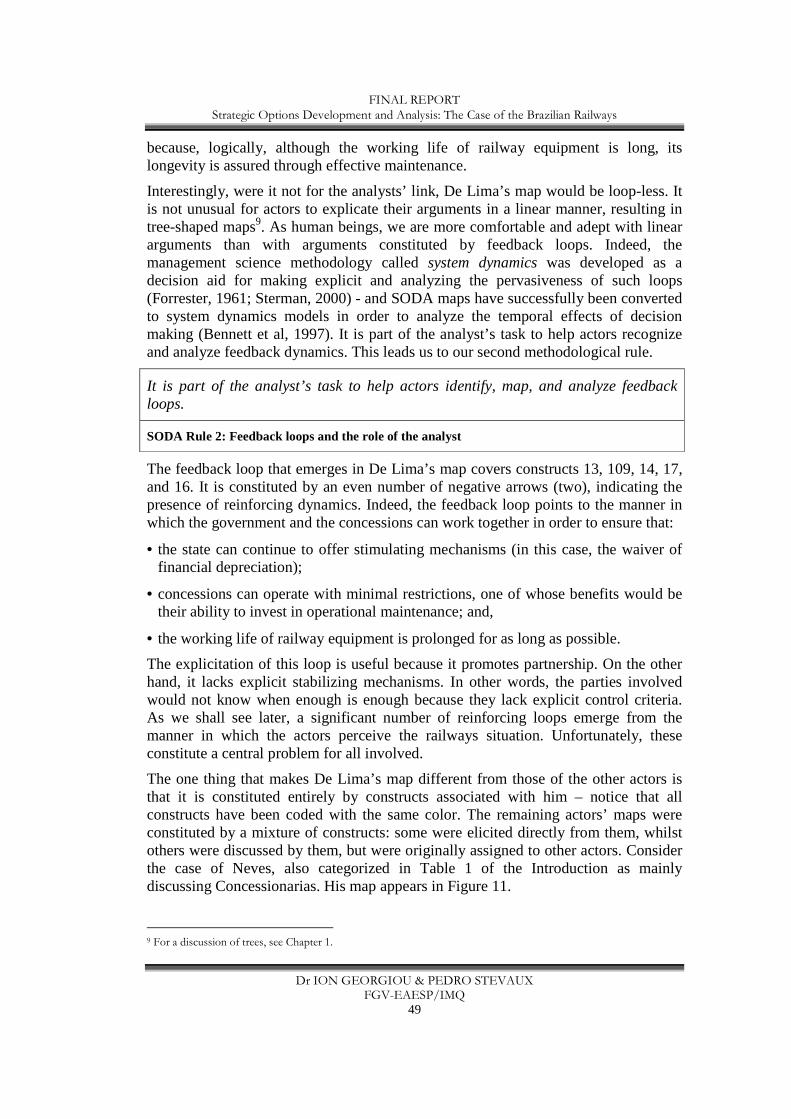
FINAL REPORT Strategic Options Development and Analysis: The Case of the Brazilian Railways
Dr ION GEORGIOU & PEDRO STEVAUX FGV-EAESP/IMQ
49
because, logically, although the working life of railway equipment is long, its longevity is assured through effective maintenance.
Interestingly, were it not for the analysts’ link, De Lima’s map would be loop-less. It is not unusual for actors to explicate their arguments in a linear manner, resulting in tree-shaped maps9. As human beings, we are more comfortable and adept with linear arguments than with arguments constituted by feedback loops. Indeed, the management science methodology called system dynamics was developed as a decision aid for making explicit and analyzing the pervasiveness of such loops (Forrester, 1961; Sterman, 2000) - and SODA maps have successfully been converted to system dynamics models in order to analyze the temporal effects of decision making (Bennett et al, 1997). It is part of the analyst’s task to help actors recognize and analyze feedback dynamics. This leads us to our second methodological rule.
It is part of the analyst’s task to help actors identify, map, and analyze feedback loops.
SODA Rule 2: Feedback loops and the role of the analyst
The feedback loop that emerges in De Lima’s map covers constructs 13, 109, 14, 17, and 16. It is constituted by an even number of negative arrows (two), indicating the presence of reinforcing dynamics. Indeed, the feedback loop points to the manner in which the government and the concessions can work together in order to ensure that:
• the state can continue to offer stimulating mechanisms (in this case, the waiver of financial depreciation);
• concessions can operate with minimal restrictions, one of whose benefits would be their ability to invest in operational maintenance; and,
• the working life of railway equipment is prolonged for as long as possible.
The explicitation of this loop is useful because it promotes partnership. On the other hand, it lacks explicit stabilizing mechanisms. In other words, the parties involved would not know when enough is enough because they lack explicit control criteria. As we shall see later, a significant number of reinforcing loops emerge from the manner in which the actors perceive the railways situation. Unfortunately, these constitute a central problem for all involved.
The one thing that makes De Lima’s map different from those of the other actors is that it is constituted entirely by constructs associated with him – notice that all constructs have been coded with the same color. The remaining actors’ maps were constituted by a mixture of constructs: some were elicited directly from them, whilst others were discussed by them, but were originally assigned to other actors. Consider the case of Neves, also categorized in Table 1 of the Introduction as mainly discussing Concessionarias. His map appears in Figure 11.
9 For a discussion of trees, see Chapter 1.
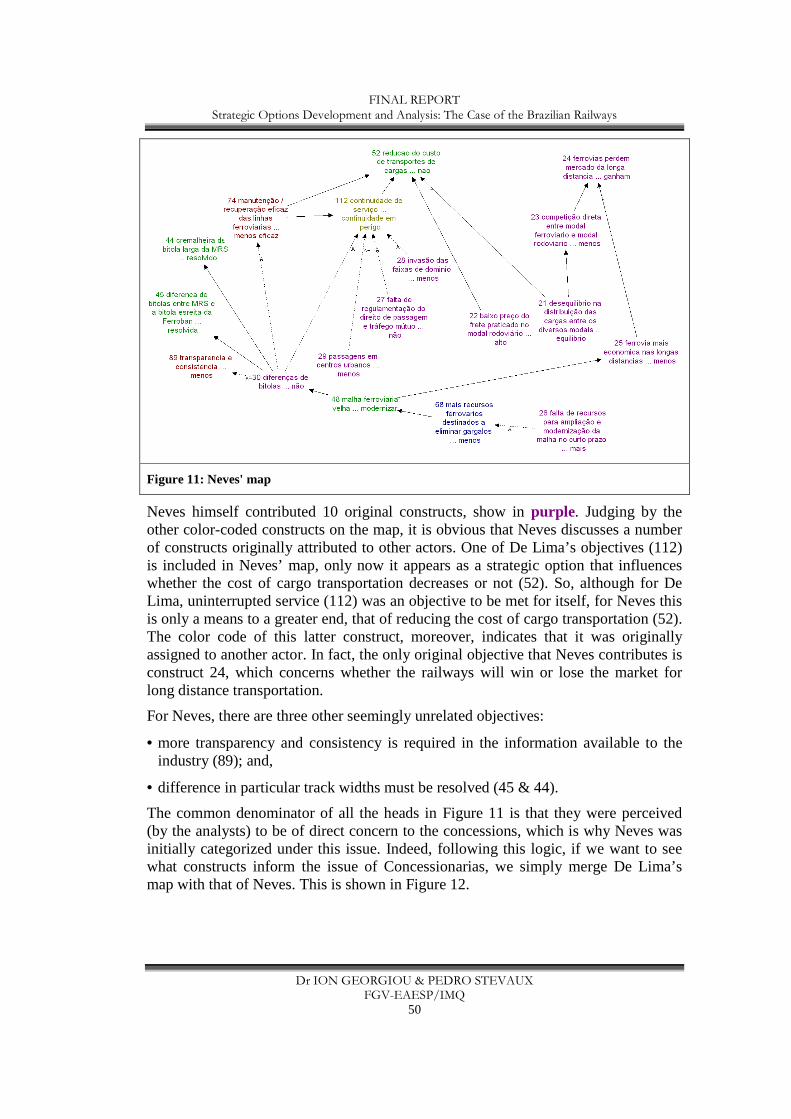
FINAL REPORT Strategic Options Development and Analysis: The Case of the Brazilian Railways
Dr ION GEORGIOU & PEDRO STEVAUX FGV-EAESP/IMQ
50
Figure 11: Neves' map
Neves himself contributed 10 original constructs, show in purple. Judging by the other color-coded constructs on the map, it is obvious that Neves discusses a number of constructs originally attributed to other actors. One of De Lima’s objectives (112) is included in Neves’ map, only now it appears as a strategic option that influences whether the cost of cargo transportation decreases or not (52). So, although for De Lima, uninterrupted service (112) was an objective to be met for itself, for Neves this is only a means to a greater end, that of reducing the cost of cargo transportation (52). The color code of this latter construct, moreover, indicates that it was originally assigned to another actor. In fact, the only original objective that Neves contributes is construct 24, which concerns whether the railways will win or lose the market for long distance transportation.
For Neves, there are three other seemingly unrelated objectives:
• more transparency and consistency is required in the information available to the industry (89); and,
• difference in particular track widths must be resolved (45 & 44).
The common denominator of all the heads in Figure 11 is that they were perceived (by the analysts) to be of direct concern to the concessions, which is why Neves was initially categorized under this issue. Indeed, following this logic, if we want to see what constructs inform the issue of Concessionarias, we simply merge De Lima’s map with that of Neves. This is shown in Figure 12.
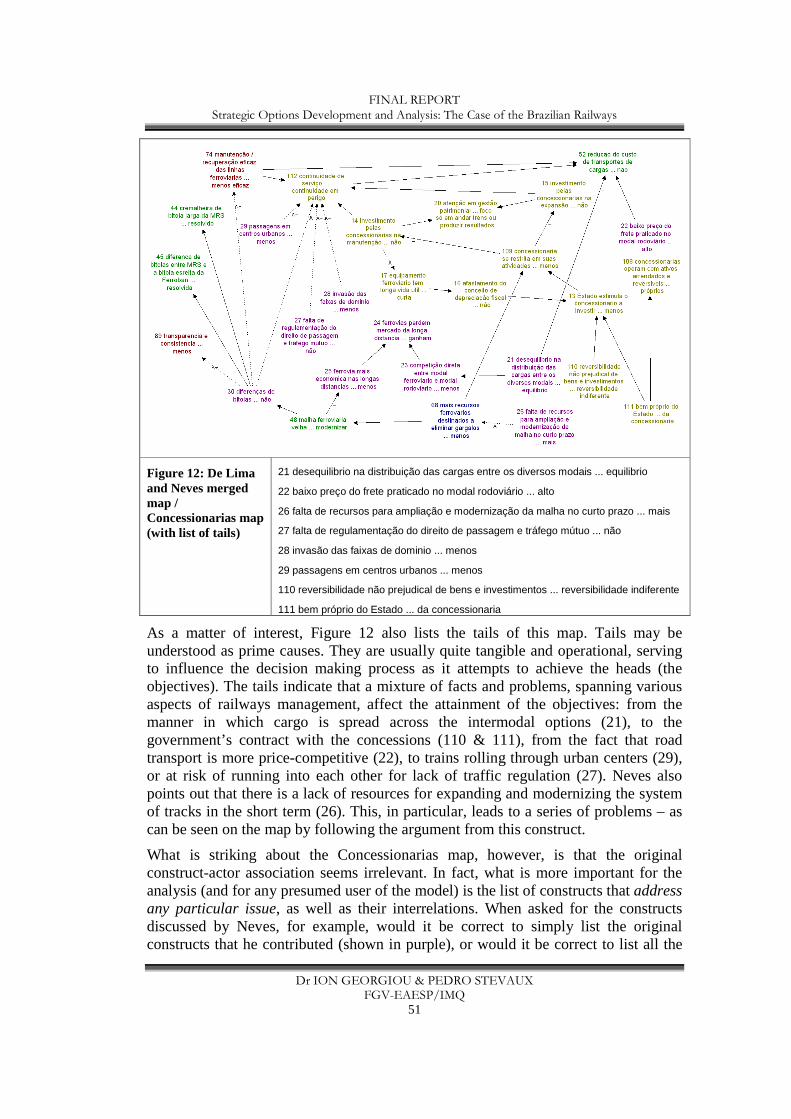
FINAL REPORT Strategic Options Development and Analysis: The Case of the Brazilian Railways
Dr ION GEORGIOU & PEDRO STEVAUX FGV-EAESP/IMQ
51
Figure 12: De Lima and Neves merged map / Concessionarias map (with list of tails)
21 desequilibrio na distribuição das cargas entre os diversos modais ... equilibrio
22 baixo preço do frete praticado no modal rodoviário ... alto
26 falta de recursos para ampliação e modernização da malha no curto prazo ... mais
27 falta de regulamentação do direito de passagem e tráfego mútuo ... não
28 invasão das faixas de dominio ... menos
29 passagens em centros urbanos ... menos
110 reversibilidade não prejudical de bens e investimentos ... reversibilidade indiferente
111 bem próprio do Estado ... da concessionaria
As a matter of interest, Figure 12 also lists the tails of this map. Tails may be understood as prime causes. They are usually quite tangible and operational, serving to influence the decision making process as it attempts to achieve the heads (the objectives). The tails indicate that a mixture of facts and problems, spanning various aspects of railways management, affect the attainment of the objectives: from the manner in which cargo is spread across the intermodal options (21), to the government’s contract with the concessions (110 & 111), from the fact that road transport is more price-competitive (22), to trains rolling through urban centers (29), or at risk of running into each other for lack of traffic regulation (27). Neves also points out that there is a lack of resources for expanding and modernizing the system of tracks in the short term (26). This, in particular, leads to a series of problems – as can be seen on the map by following the argument from this construct.
What is striking about the Concessionarias map, however, is that the original construct-actor association seems irrelevant. In fact, what is more important for the analysis (and for any presumed user of the model) is the list of constructs that address any particular issue, as well as their interrelations. When asked for the constructs discussed by Neves, for example, would it be correct to simply list the original constructs that he contributed (shown in purple), or would it be correct to list all the
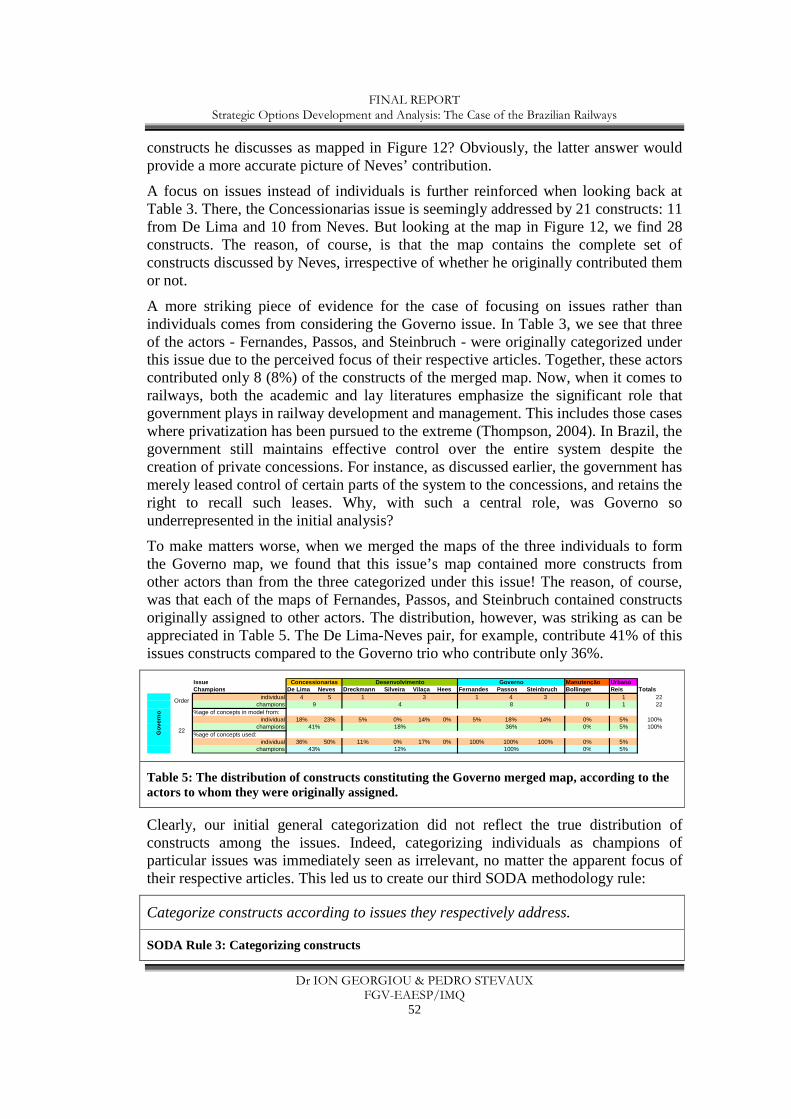
FINAL REPORT Strategic Options Development and Analysis: The Case of the Brazilian Railways
Dr ION GEORGIOU & PEDRO STEVAUX FGV-EAESP/IMQ
52
constructs he discusses as mapped in Figure 12? Obviously, the latter answer would provide a more accurate picture of Neves’ contribution.
A focus on issues instead of individuals is further reinforced when looking back at Table 3. There, the Concessionarias issue is seemingly addressed by 21 constructs: 11 from De Lima and 10 from Neves. But looking at the map in Figure 12, we find 28 constructs. The reason, of course, is that the map contains the complete set of constructs discussed by Neves, irrespective of whether he originally contributed them or not.
A more striking piece of evidence for the case of focusing on issues rather than individuals comes from considering the Governo issue. In Table 3, we see that three of the actors - Fernandes, Passos, and Steinbruch - were originally categorized under this issue due to the perceived focus of their respective articles. Together, these actors contributed only 8 (8%) of the constructs of the merged map. Now, when it comes to railways, both the academic and lay literatures emphasize the significant role that government plays in railway development and management. This includes those cases where privatization has been pursued to the extreme (Thompson, 2004). In Brazil, the government still maintains effective control over the entire system despite the creation of private concessions. For instance, as discussed earlier, the government has merely leased control of certain parts of the system to the concessions, and retains the right to recall such leases. Why, with such a central role, was Governo so underrepresented in the initial analysis?
To make matters worse, when we merged the maps of the three individuals to form the Governo map, we found that this issue’s map contained more constructs from other actors than from the three categorized under this issue! The reason, of course, was that each of the maps of Fernandes, Passos, and Steinbruch contained constructs originally assigned to other actors. The distribution, however, was striking as can be appreciated in Table 5. The De Lima-Neves pair, for example, contribute 41% of this issues constructs compared to the Governo trio who contribute only 36%.
Issue Manutenção UrbanoChampions De Lima Neves Dreckmann Silveira Vilaça Hees Fernandes Passos Steinbruch Bollinger Reis Totals
individual 4 5 1 3 1 4 3 1 22champions 0 1 22
%age of concepts in model from:individual 18% 23% 5% 0% 14% 0% 5% 18% 14% 0% 5% 100%
champions 0% 5% 100%%age of concepts used:
individual 36% 50% 11% 0% 17% 0% 100% 100% 100% 0% 5%champions 0% 5%
Concessionarias Desenvolvimento Governo
Gov
erno
Order9 4 8
2241% 18% 36%
43% 12% 100%
Table 5: The distribution of constructs constituting the Governo merged map, according to the actors to whom they were originally assigned.
Clearly, our initial general categorization did not reflect the true distribution of constructs among the issues. Indeed, categorizing individuals as champions of particular issues was immediately seen as irrelevant, no matter the apparent focus of their respective articles. This led us to create our third SODA methodology rule:
Categorize constructs according to issues they respectively address.
SODA Rule 3: Categorizing constructs
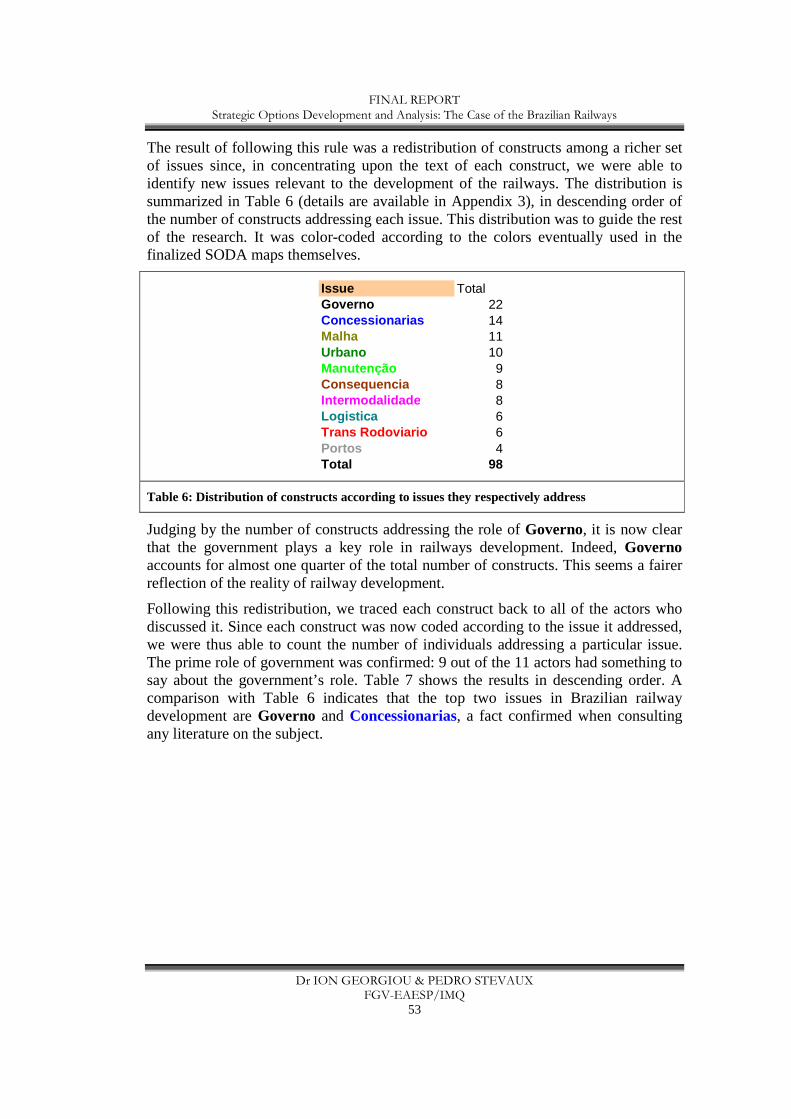
FINAL REPORT Strategic Options Development and Analysis: The Case of the Brazilian Railways
Dr ION GEORGIOU & PEDRO STEVAUX FGV-EAESP/IMQ
53
The result of following this rule was a redistribution of constructs among a richer set of issues since, in concentrating upon the text of each construct, we were able to identify new issues relevant to the development of the railways. The distribution is summarized in Table 6 (details are available in Appendix 3), in descending order of the number of constructs addressing each issue. This distribution was to guide the rest of the research. It was color-coded according to the colors eventually used in the finalized SODA maps themselves.
Issue TotalGoverno 22Concessionarias 14Malha 11Urbano 10Manutenção 9Consequencia 8Intermodalidade 8Logistica 6Trans Rodoviario 6Portos 4Total 98
Table 6: Distribution of constructs according to issues they respectively address
Judging by the number of constructs addressing the role of Governo, it is now clear that the government plays a key role in railways development. Indeed, Governo accounts for almost one quarter of the total number of constructs. This seems a fairer reflection of the reality of railway development.
Following this redistribution, we traced each construct back to all of the actors who discussed it. Since each construct was now coded according to the issue it addressed, we were thus able to count the number of individuals addressing a particular issue. The prime role of government was confirmed: 9 out of the 11 actors had something to say about the government’s role. Table 7 shows the results in descending order. A comparison with Table 6 indicates that the top two issues in Brazilian railway development are Governo and Concessionarias, a fact confirmed when consulting any literature on the subject.
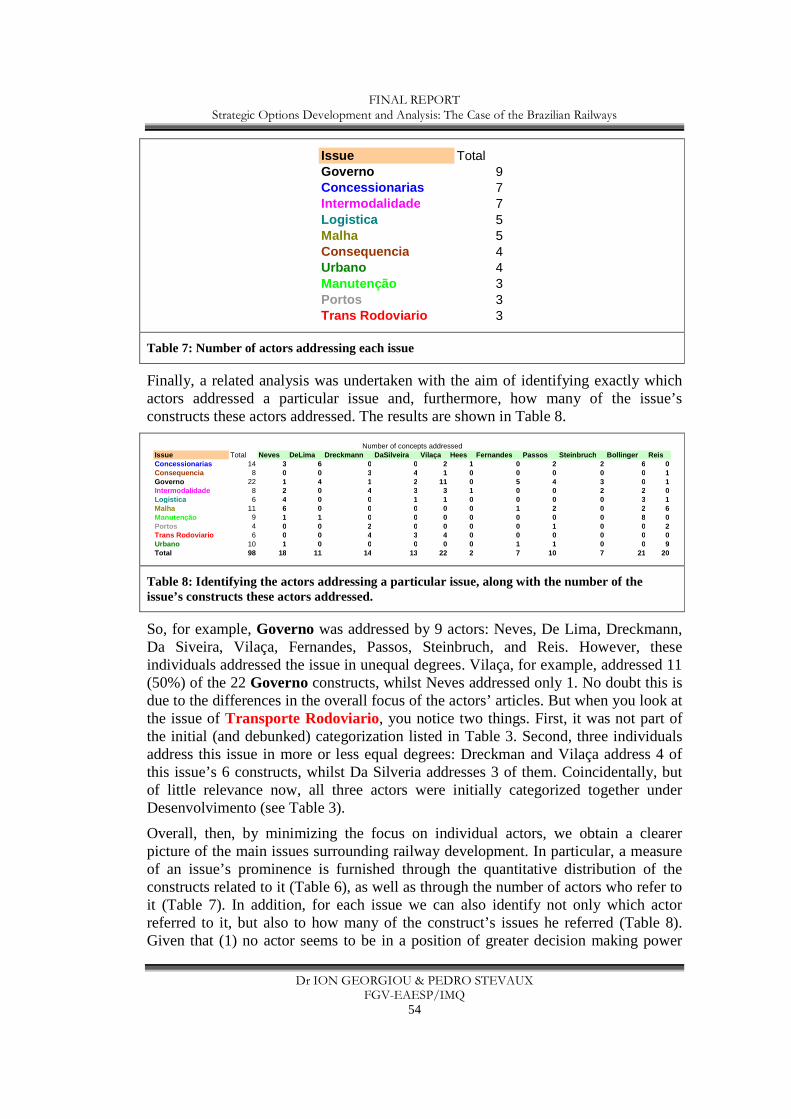
FINAL REPORT Strategic Options Development and Analysis: The Case of the Brazilian Railways
Dr ION GEORGIOU & PEDRO STEVAUX FGV-EAESP/IMQ
54
Issue TotalGoverno 9Concessionarias 7Intermodalidade 7Logistica 5Malha 5Consequencia 4Urbano 4Manutenção 3Portos 3Trans Rodoviario 3
Table 7: Number of actors addressing each issue
Finally, a related analysis was undertaken with the aim of identifying exactly which actors addressed a particular issue and, furthermore, how many of the issue’s constructs these actors addressed. The results are shown in Table 8.
Issue Total Neves DeLima Dreckmann DaSilveira Vilaça Hees Fernandes Passos Steinbruch Bollinger ReisConcessionarias 14 3 6 0 0 2 1 0 2 2 6 0Consequencia 8 0 0 3 4 1 0 0 0 0 0 1Governo 22 1 4 1 2 11 0 5 4 3 0 1Intermodalidade 8 2 0 4 3 3 1 0 0 2 2 0Logistica 6 4 0 0 1 1 0 0 0 0 3 1Malha 11 6 0 0 0 0 0 1 2 0 2 6Manutenção 9 1 1 0 0 0 0 0 0 0 8 0Portos 4 0 0 2 0 0 0 0 1 0 0 2Trans Rodoviario 6 0 0 4 3 4 0 0 0 0 0 0Urbano 10 1 0 0 0 0 0 1 1 0 0 9Total 98 18 11 14 13 22 2 7 10 7 21 20
Number of concepts addressed
Table 8: Identifying the actors addressing a particular issue, along with the number of the issue’s constructs these actors addressed.
So, for example, Governo was addressed by 9 actors: Neves, De Lima, Dreckmann, Da Siveira, Vilaça, Fernandes, Passos, Steinbruch, and Reis. However, these individuals addressed the issue in unequal degrees. Vilaça, for example, addressed 11 (50%) of the 22 Governo constructs, whilst Neves addressed only 1. No doubt this is due to the differences in the overall focus of the actors’ articles. But when you look at the issue of Transporte Rodoviario, you notice two things. First, it was not part of the initial (and debunked) categorization listed in Table 3. Second, three individuals address this issue in more or less equal degrees: Dreckman and Vilaça address 4 of this issue’s 6 constructs, whilst Da Silveria addresses 3 of them. Coincidentally, but of little relevance now, all three actors were initially categorized together under Desenvolvimento (see Table 3).
Overall, then, by minimizing the focus on individual actors, we obtain a clearer picture of the main issues surrounding railway development. In particular, a measure of an issue’s prominence is furnished through the quantitative distribution of the constructs related to it (Table 6), as well as through the number of actors who refer to it (Table 7). In addition, for each issue we can also identify not only which actor referred to it, but also to how many of the construct’s issues he referred (Table 8). Given that (1) no actor seems to be in a position of greater decision making power
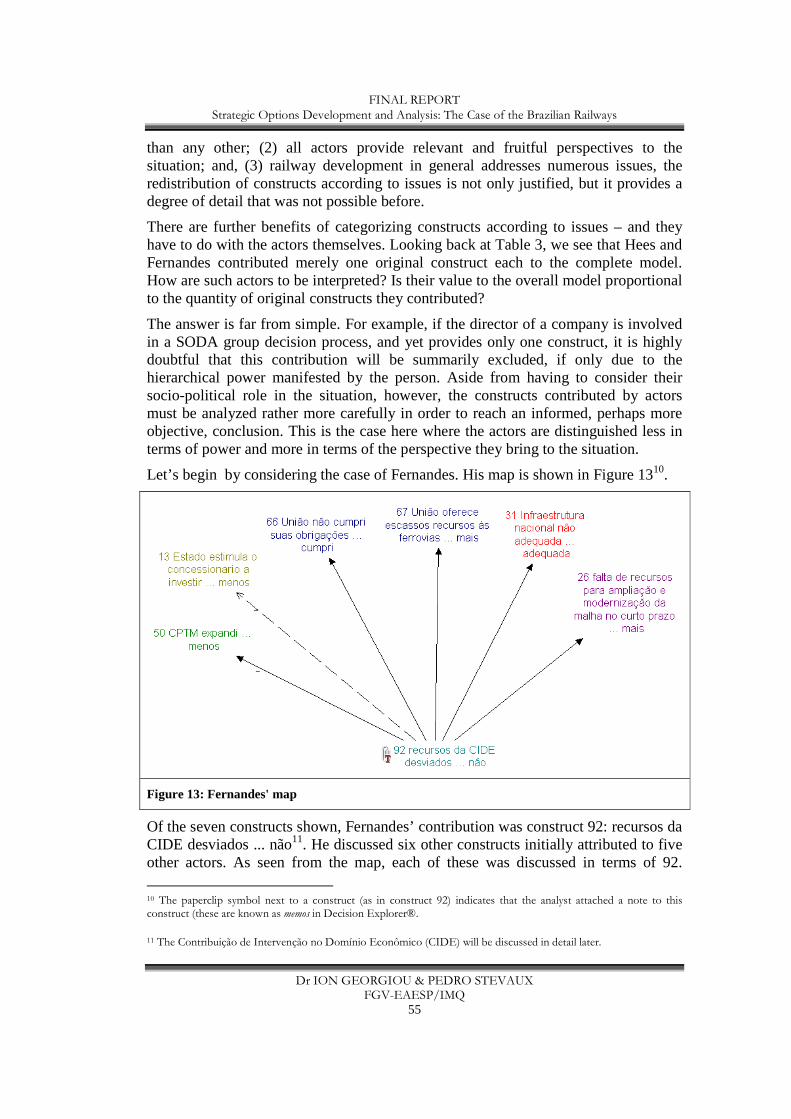
FINAL REPORT Strategic Options Development and Analysis: The Case of the Brazilian Railways
Dr ION GEORGIOU & PEDRO STEVAUX FGV-EAESP/IMQ
55
than any other; (2) all actors provide relevant and fruitful perspectives to the situation; and, (3) railway development in general addresses numerous issues, the redistribution of constructs according to issues is not only justified, but it provides a degree of detail that was not possible before.
There are further benefits of categorizing constructs according to issues – and they have to do with the actors themselves. Looking back at Table 3, we see that Hees and Fernandes contributed merely one original construct each to the complete model. How are such actors to be interpreted? Is their value to the overall model proportional to the quantity of original constructs they contributed?
The answer is far from simple. For example, if the director of a company is involved in a SODA group decision process, and yet provides only one construct, it is highly doubtful that this contribution will be summarily excluded, if only due to the hierarchical power manifested by the person. Aside from having to consider their socio-political role in the situation, however, the constructs contributed by actors must be analyzed rather more carefully in order to reach an informed, perhaps more objective, conclusion. This is the case here where the actors are distinguished less in terms of power and more in terms of the perspective they bring to the situation.
Let’s begin by considering the case of Fernandes. His map is shown in Figure 1310.
Figure 13: Fernandes' map
Of the seven constructs shown, Fernandes’ contribution was construct 92: recursos da CIDE desviados ... não11. He discussed six other constructs initially attributed to five other actors. As seen from the map, each of these was discussed in terms of 92.
10 The paperclip symbol next to a construct (as in construct 92) indicates that the analyst attached a note to this construct (these are known as memos in Decision Explorer®.
11 The Contribuição de Intervenção no Domínio Econômico (CIDE) will be discussed in detail later.
FINAL REPORT Strategic Options Development and Analysis: The Case of the Brazilian Railways
Dr ION GEORGIOU & PEDRO STEVAUX FGV-EAESP/IMQ
56
Indeed, the siphoning of public money is, according to Fernandes, directly responsible for: the inability of the CPTM to expand (50); the failure of the government to sufficiently stimulate the concessions to invest (13); the government failing to meet its obligations (66); the government offering insufficient resources to the railways (67); the inadequate state of the national infrastructure (31); and, the lack of resources for expanding and modernizing the track system in the short term (26).
What is striking here is not so much the polemic tone reflected in the links of Figure 13. It is that construct 92 has six arrows leading out of it. In graph theoretical terms, construct 92 has an outdegree of 6. Furthermore, it has no indegree. In other words, construct 92 is a pure primary cause. Not only that: out of all the constructs elicited from the actors, it is the construct with the largest outdegree by far – only one other construct has an outdegree of 5, and the remaining have an outdegree of 3 or less.
Now, there are two ways of looking at this. First, one could argue that Fernandes is somewhat of an aberration. His contribution of a construct whose basic statistics are so far removed from those of the other constructs indicates an outlier. It should therefore be treated as such. On the other hand, the statistics themselves can be used as an argument in favor of keeping Fernandes’ contribution in the model. After all, a pure primary cause of outdegree 6 merits further investigation. Indeed, this is the correct answer. For, we are in no position to judge the relevance of Fernandes’ contribution until we appreciate it within the overall context of the final merged map that brings together all the constructs elicited from the actors. Furthermore, the content of Fernandes’ construct is not trivial: it concerns the tax collected explicitly for promoting national infrastructural development (of which the railways are an obvious part). This combination of quantitative and qualitative appreciation signals that Fernandes’ contribution cannot be dismissed lightly. Besides, from Table 8, we see that, once the constructs were reassigned according to issues, Fernandes addressed a mix of issues including Governo, Malha, and Urbano. In fact, when the constructs were reassigned according to issues (as per Table 6) construct 92 was categorized, understandably, under Governo – the top issue in Brazilian railway development. This paints a rather more accurate picture of Fernandes’ concerns. Finally, as we shall see later, further investigation of construct 92 renders Fernandes responsible for one of the major results of the research.
Turning to Hees, we find in Table 3 that he also contributed only one original construct, namely 113 - operação logistica ajustada às necessidades e particularidades do cliente ... não. Indeed, that one construct was addressed only by Hees – it is in no other actor’s map. In the redistribution of constructs according to issues of Table 8, Hees fared little better: he is seen to address two issues through one construct each. Does this indicate that Hees, along with any constructs contributed by him, should perhaps be discarded from the analysis and the merged map?
As it turned out, the merged map that brought together all the actors’ maps identified Hees’ contribution as one of the overall objectives of railway development (his construct has no outdegree). Furthermore, his construct was categorized under Concessionarias, one of the top two issues in Brazilian railway development (as discussed earlier – see Tables 6 & 7). Given this, Hees’ contribution might be
FINAL REPORT Strategic Options Development and Analysis: The Case of the Brazilian Railways
Dr ION GEORGIOU & PEDRO STEVAUX FGV-EAESP/IMQ
57
quantitatively minor, but it is qualitatively significant in its role. As such, Hees’ contribution should not be discarded.
From cases such as these, we can deduce a fairly straightforward rule that can guide the treatment of seemingly minor actors or construct contributions.
The value of an actor, and her/his constructs, to the overall model might not be proportional to the quantity of original constructs s/he contributed. Aside from accounting for the actor’s socio-political power, the overall number of issues s/he addresses should be taken into account (probably after all constructs have been assigned according to issues, as per Rule 3). The actor’s contributed constructs should be appreciated in relation to their content, their outdegree and indegree, the issue under which they have been categorized, and their overall impact upon the merged map12.
SODA Rule 4: Analyzing the relevance of an actor and their constructs
Appendix 4 provides the maps of all the individual actors’ articles, along with supplementary data. Needless to say, the variety of analyses to which this information is amenable is limited only by the skills and time of any particular analyst. For example, one could examine each page of Appendix 4 and deduce the most significant constructs or relationships between them, based upon certain criteria. With the aid of Table 8, one could also examine the number of constructs belonging to a particular issue addressed by an actor. One could, furthermore, examine how certain constructs are used or positioned differently between actors who share them. We saw this, for instance, with construct 112 when discussing Neves’ and De Lima’s maps earlier. Positional difference of a construct between maps can be interpreted as a sign of cognitive and structural complexity. In the first instance, the actors tend to cognitively interpret the construct in different ways. In the second case, the construct’s significance in the overall situation or decision making scenario is debatable (is it an objective? a strategic option? and so on).
This report cannot pretend to undertake all analyses possible given the richness of the data collected. It can, however, indicate some analyses which proved to be especially fruitful. We have seen, for instance, that the redistribution of constructs according to issues clearly provides informational and analytical benefits. Having discussed these, it would be useful to at least examine the merged map that brought together the 98 constructs elicited from the actors. When first approaching a merged map, its sheer size, the numerous constructs, and the multiple links may leave one wondering how it is possible to ever begin to understand and analyze the situation with the help of the model. In fact there are two problems. First, how can anything be learnt from the merged map as a whole? Second, how can one ‘enter’ the map, so to speak, and begin to analyze sections of it? These two problems are respectively addressed in the next two chapters.
12 As hinted above, Fernandes was found to have impacted significantly upon the overall model, and this result will be discussed in due course.

FINAL REPORT Strategic Options Development and Analysis: The Case of the Brazilian Railways
Dr ION GEORGIOU & PEDRO STEVAUX FGV-EAESP/IMQ
58
FINAL REPORT Strategic Options Development and Analysis: The Case of the Brazilian Railways
Dr ION GEORGIOU & PEDRO STEVAUX FGV-EAESP/IMQ
59
Chapter 4: Mapping the Railways – Initial Results This chapter considers the merged map as a whole in order to see what conclusions may be drawn from it. This is useful methodologically for, in SODA mapping, analysts will always be faced with making sense of a merged map. It is also useful practically: a number of interesting insights emerge about the Brazilian railways situation just by examining the merged map as a whole. The focus of the discussion will be upon:
• The identification and preliminary exploration of prime causes (the tails of the map);
• The identification and preliminary exploration of objectives (the heads of the map);
o Related to this is (a) the issue termed Consequencia, an issue that emerged during the redistribution of constructs as given in Table 6; and, (b) the merged map’s strategic options;
• The identification and preliminary exploration of the highly affected constructs (these are constructs with high indegree, or implosion grade, based upon a certain criterion);
• The identification and preliminary exploration of the highly affecting constructs (these are constructs with high outdegree, or explosion grade, based upon a certain criterion);
• The identification and preliminary exploration of the most cited constructs; and,
• The identification of constructs with high degree, or domain grade, and a critical examination of how the degree/domain grade of a construct can best be interpreted.
Each point above merits an in-depth discussion in itself. The aim here is to provide a summary overview that offers enough insights into the railways situation, as well as into the SODA methodology itself. In this way, the reader is prepared to study the data further, in conjunction with the appendices.
As discussed earlier, all constructs were eventually categorized by issue (see Table 6) and color-coded accordingly. A merged map of all the constructs was designed, with relations between constructs based upon those first identified in the individual actors’ maps. This merged map is shown in Figure 14. It is, in effect, the model that emerged from the research. As such, this model was to be mined for information and analyzed for insight13. Its sheer size requires the help of Decision Explorer®, a software package designed especially to support SODA. It allows the analyst to create different views of the merged map in terms of sub-maps. It also offers a variety of powerful analytical functions.
13 It is worth noting that the map of Figure 14 is, in essence, a directed graph. Although data mining is a well established area of study, graph mining has emerged only recently. Cook and Holder (2007) have recently published what appears to be the first book-length treatment of graph mining. Although the present research did not draw upon the graph mining literature, this source is highly recommended for future research.

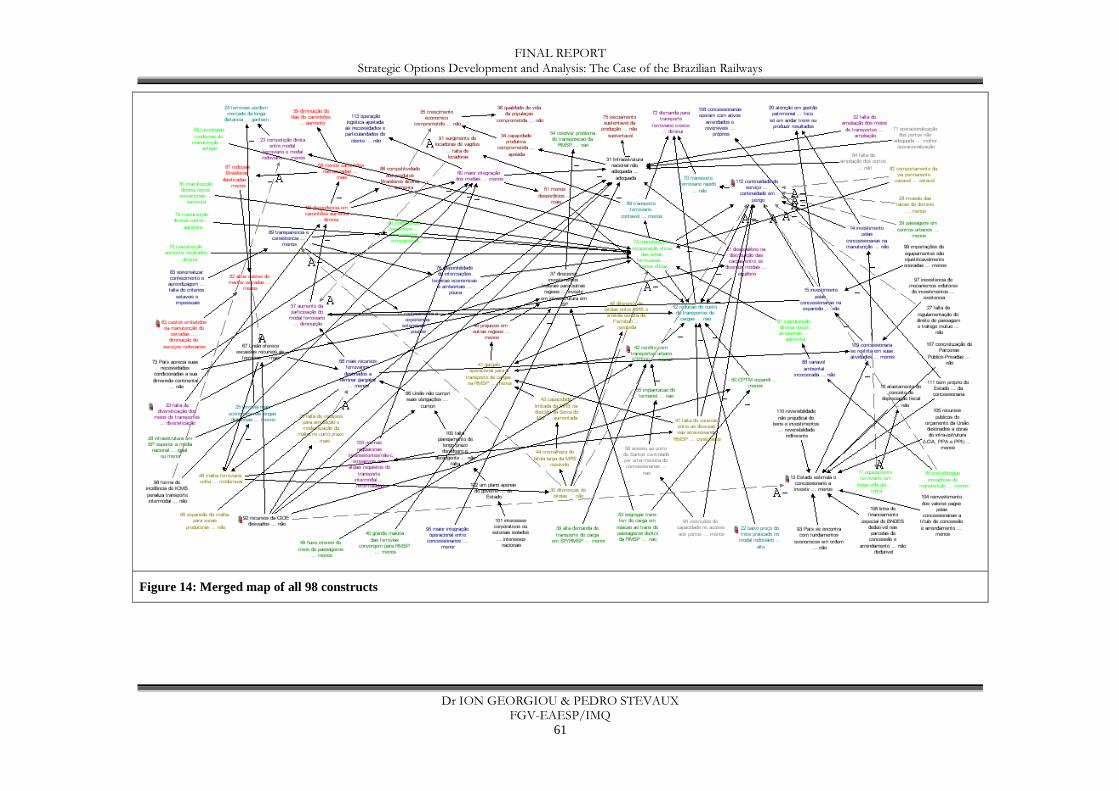
FINAL REPORT Strategic Options Development and Analysis: The Case of the Brazilian Railways
Dr ION GEORGIOU & PEDRO STEVAUX FGV-EAESP/IMQ
61
Figure 14: Merged map of all 98 constructs

FINAL REPORT Strategic Options Development and Analysis: The Case of the Brazilian Railways
Dr ION GEORGIOU & PEDRO STEVAUX FGV-EAESP/IMQ
63
The merged map in Figure 14 has been drawn in a particular way. Along the top are those constructs with no arrows leading out of them: the constructs have no explosion grade, or outdegree. SODA terms these objectives or heads. Along the remaining three sides are to be found those constructs with no arrows leading into them: these constructs have no implosion grade, or indegree. SODA terms these causes, or better, prime causes. They are otherwise known as tails.
In order to facilitate the design and the visualization of a merged map, it is recommended that heads/objectives be placed along the top, and that tails/causes be placed along the remaining three sides.
SODA Rule 5: Layout of a merged map
The identification and preliminary exploration of prime causes There are 37 tails on the map. That is to say, 38% of the map is constituted by prime causes. By definition, prime causes are those constructs that trigger or otherwise influence further constructs. In a decision making situation, they constitute those decisions that must be taken into account if further decisions are to unfold as required.
All objectives can be traced back, through a series of constructs, to prime causes. More often than not, such tracing will uncover a number of prime causes impacting simultaneously upon any one objective. This may give rise to indetermination or indistinction (Montibeller and Belton, 2006). In the first case, the realization of an objective is indeterminable because the paths of constructs terminating on the objective respectively impact upon its primary and secondary poles. One cannot determine, in other words, which of the two poles of the objective might actually occur. The case of indistinction is slightly different. Here, all paths lead to one or the other pole of the objective, thus the objective is determinable. Given that, however, how can one distinguish between their relative influences? Do some paths merit greater weight than others? In other words, can one distinguish what exactly is more liable to cause the impacted pole of the objective?
Prior to such considerations, however, one must not minimize the usefulness of focusing upon the tails themselves. In particular, a basic question is: how are the tails distributed among the issues? Figure 15 shows the results.

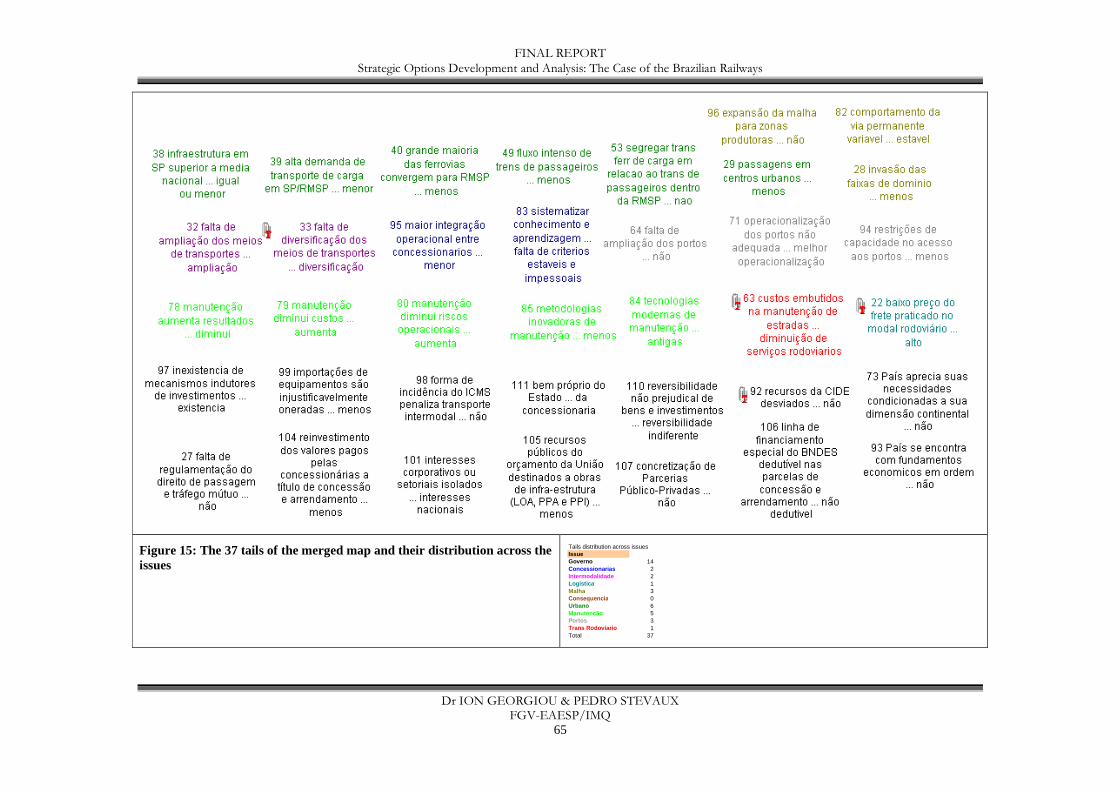
FINAL REPORT Strategic Options Development and Analysis: The Case of the Brazilian Railways
Dr ION GEORGIOU & PEDRO STEVAUX FGV-EAESP/IMQ
65
Figure 15: The 37 tails of the merged map and their distribution across the issues
Tails distribution across issuesIssueGoverno 14Concessionarias 2Intermodalidade 2Logistica 1Malha 3Consequencia 0Urbano 6Manutenção 5Portos 3Trans Rodoviario 1Total 37

FINAL REPORT Strategic Options Development and Analysis: The Case of the Brazilian Railways
Dr ION GEORGIOU & PEDRO STEVAUX FGV-EAESP/IMQ
67
Two things are worth noting. To begin with, there is a distribution of constructs across most issues. In fact, the only issue without a prime-cause construct is Consequencia. This is to be expected since this issue brings together constructs that were deemed to address consequences – as opposed to causes - of national significance. The distribution of constructs across the remaining issues signals that the triggers of railway development involve multi-agency decision making.
Governo plays a significant role, as is to be expected in questions of national infrastructure development. For example, government can promote developmental effectiveness by:
• Developing and promoting investment conduits (97, 106);
• Promoting the correct use of resources from taxes (92, 105), whilst reconsidering taxes or penalties that work against the developmental ideal (99, 98); and,
• Managing corporate or otherwise regional interests in favor of the national or wider betterment (101).
Notwithstanding the government’s key role in triggering railway development, multi-agency decision making will be required to start the process from a number of angles. For example, there is a need to reduce costs embedded in road maintenance (Transporte Rodoviario 63), particularly policing, emergency services, traffic engineering, pollution and accident management14. These increase in proportion to the demands placed upon the road system. As long as such demands go unabated, this prime cause will continue to negatively affect all developmental objectives. It is a clear signal that national and regional planning must incorporate alternative transportation modes simultaneously.
There are five prime causes addressing Manutenção (78, 79, 80, 84, 85). Interestingly, only one of the eleven actors (Bollinger) addresses maintenance, and yet his contribution impacts not only upon the distribution of prime causes shown here, but also upon a significant combination of loops that will be discussed later. Indeed, Bollinger’s influence reaches across to constructs coded within other issues. A case in point is Concessionarias, whose two prime causes indicate that these will impact decisively upon railway development in two ways. The first concerns the degree to which the concessions integrate their operations (95). The second way concerns the degree to which the concessions are able to formalize knowledge and learning on an inter-organizational scale (83) – that is, shared organizational learning among all concessions. This prime cause was originally contributed by Bollinger and was specifically addressed toward maintenance issues and how they should be dealt with by the concessions – hence the blue coding.
The fact that the concessions contribute only two prime causes may be interpreted in a number of ways. First, on a purely quantitative basis, the concessions may be understood as victims of a greater number of external prime forces. Given the multi-agency requirement for railway development, this interpretation is understandable. However, to what degree is the relatively small contribution of prime causes from the concessions due to the actors themselves? A read through the articles suggests that this sample of actors do not see the concessions as powerful enough to trigger railway development. They are only powerful enough to manage the tasks
14 This information is provided by Dreckmann, who contributed this construct.
FINAL REPORT Strategic Options Development and Analysis: The Case of the Brazilian Railways
Dr ION GEORGIOU & PEDRO STEVAUX FGV-EAESP/IMQ
68
they were awarded through the state’s privatization program (notwithstanding their complaints about the state’s failure to follow through with its own commitments). Does the small number of triggers from Concessionarias reflect the reality or simply the opinion of the actors chosen for this research? Furthermore, how does the small number of prime causes from Concessionarias correlate with the importance given to this issue as identified in Tables 6 and 7, earlier? Is one to understand that the concessions have much to contribute to railway development, but only once the government provides the basic impetus? Clearly, more research is required on the degree to which the concessions can (as opposed to should) impact on railway development.
Overall, the high percentage of prime causes (in relation to the total number of constructs), coupled with their distribution across multiple issues, indicates that strategic planning for national railway development will be a complex process, requiring the collaboration of multiple agencies and the accommodation of numerous interests and concerns. Some of these concerns arise from issues that appear peripheral or that are otherwise minimally discussed: Manutenção is a case in point which, as discussed above, reaches beyond its own seemingly specialist confines. Methodologically, we find that a preliminary examination focused upon the tails of the merged map can provide useful information.
The tails of a merged map are key for analyzing indetermination and indistinction. Their distribution across issues provides insights into the type of prime causes acting upon the situation. A summary of the content of tail constructs can inform the prime causes for which each issue is responsible.
SODA Rule 6: The tails of a merged map
The identification and preliminary exploration of o bjectives The research identified 9 heads, or objectives. These may be appreciated as desired outputs of the situation or, equally, as ultimate consequences of sequences, or paths, of lower-level constructs. As consequences, however, the 9 objectives on their own do not tell the whole story. For the research found a number of other constructs whose contents clearly address consequences. These were grouped under the issue Consequencia. Therefore, in order to appreciate the objectives of the railways situation as a whole, one must consider the 9 heads along with the Consequencia constructs. The details are given in Figure 16.
The heads of a SODA map may not be the only objectives or consequences identifiable in the model. A holistic appreciation of the objectives may require the identification of consequences that are not themselves heads.
SODA Rule 7: The heads of a merged map
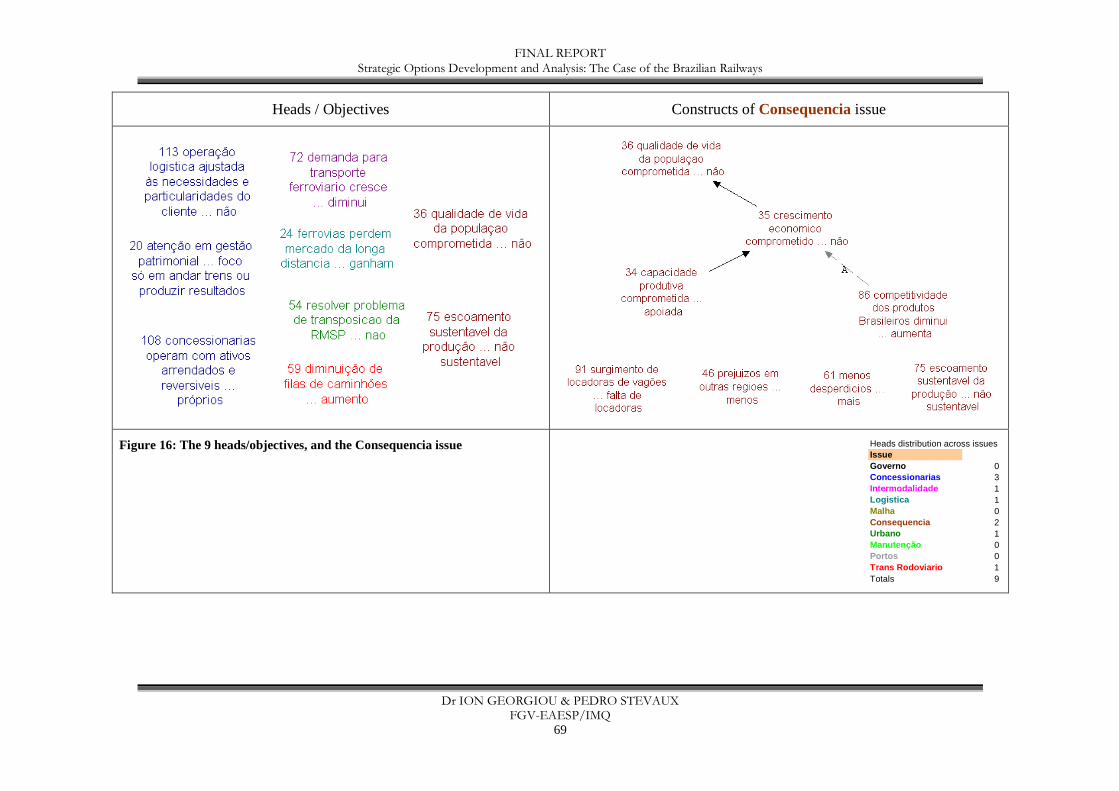
FINAL REPORT Strategic Options Development and Analysis: The Case of the Brazilian Railways
Dr ION GEORGIOU & PEDRO STEVAUX FGV-EAESP/IMQ
69
Heads / Objectives Constructs of Consequencia issue
Figure 16: The 9 heads/objectives, and the Consequencia issue Heads distribution across issuesIssueGoverno 0Concessionarias 3Intermodalidade 1Logistica 1Malha 0Consequencia 2Urbano 1Manutenção 0Portos 0Trans Rodoviario 1Totals 9

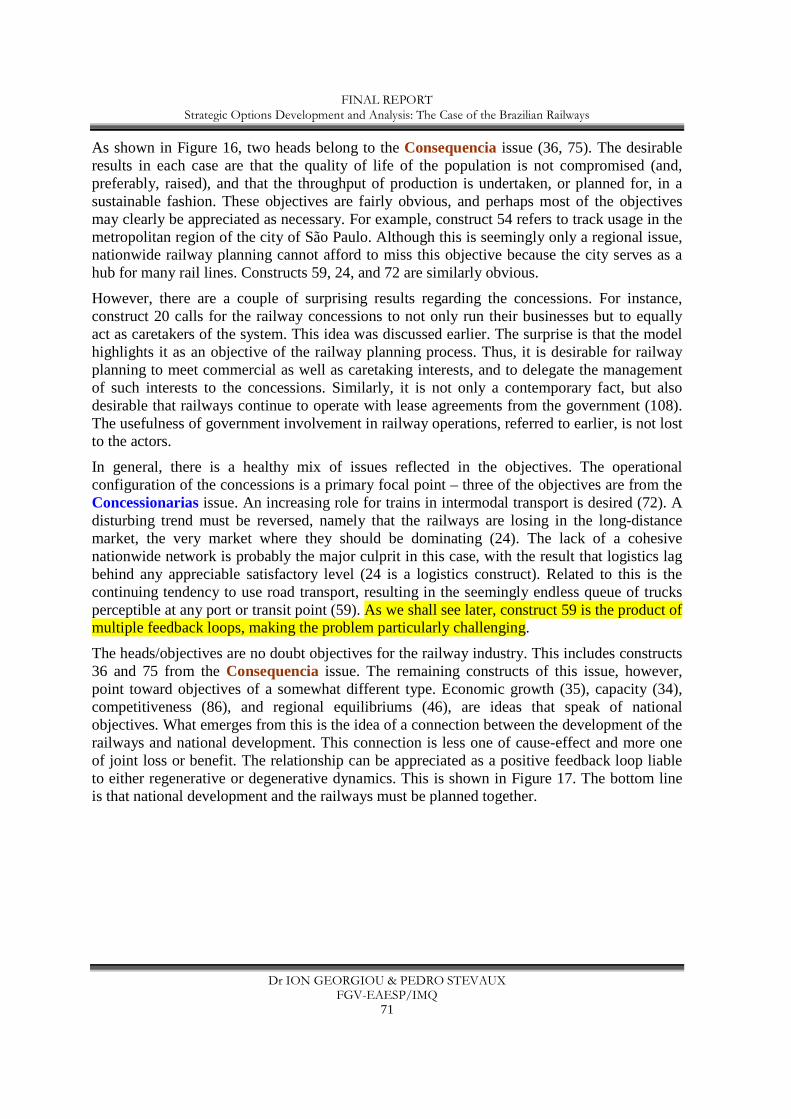
FINAL REPORT Strategic Options Development and Analysis: The Case of the Brazilian Railways
Dr ION GEORGIOU & PEDRO STEVAUX FGV-EAESP/IMQ
71
As shown in Figure 16, two heads belong to the Consequencia issue (36, 75). The desirable results in each case are that the quality of life of the population is not compromised (and, preferably, raised), and that the throughput of production is undertaken, or planned for, in a sustainable fashion. These objectives are fairly obvious, and perhaps most of the objectives may clearly be appreciated as necessary. For example, construct 54 refers to track usage in the metropolitan region of the city of São Paulo. Although this is seemingly only a regional issue, nationwide railway planning cannot afford to miss this objective because the city serves as a hub for many rail lines. Constructs 59, 24, and 72 are similarly obvious.
However, there are a couple of surprising results regarding the concessions. For instance, construct 20 calls for the railway concessions to not only run their businesses but to equally act as caretakers of the system. This idea was discussed earlier. The surprise is that the model highlights it as an objective of the railway planning process. Thus, it is desirable for railway planning to meet commercial as well as caretaking interests, and to delegate the management of such interests to the concessions. Similarly, it is not only a contemporary fact, but also desirable that railways continue to operate with lease agreements from the government (108). The usefulness of government involvement in railway operations, referred to earlier, is not lost to the actors.
In general, there is a healthy mix of issues reflected in the objectives. The operational configuration of the concessions is a primary focal point – three of the objectives are from the Concessionarias issue. An increasing role for trains in intermodal transport is desired (72). A disturbing trend must be reversed, namely that the railways are losing in the long-distance market, the very market where they should be dominating (24). The lack of a cohesive nationwide network is probably the major culprit in this case, with the result that logistics lag behind any appreciable satisfactory level (24 is a logistics construct). Related to this is the continuing tendency to use road transport, resulting in the seemingly endless queue of trucks perceptible at any port or transit point (59). As we shall see later, construct 59 is the product of multiple feedback loops, making the problem particularly challenging.
The heads/objectives are no doubt objectives for the railway industry. This includes constructs 36 and 75 from the Consequencia issue. The remaining constructs of this issue, however, point toward objectives of a somewhat different type. Economic growth (35), capacity (34), competitiveness (86), and regional equilibriums (46), are ideas that speak of national objectives. What emerges from this is the idea of a connection between the development of the railways and national development. This connection is less one of cause-effect and more one of joint loss or benefit. The relationship can be appreciated as a positive feedback loop liable to either regenerative or degenerative dynamics. This is shown in Figure 17. The bottom line is that national development and the railways must be planned together.
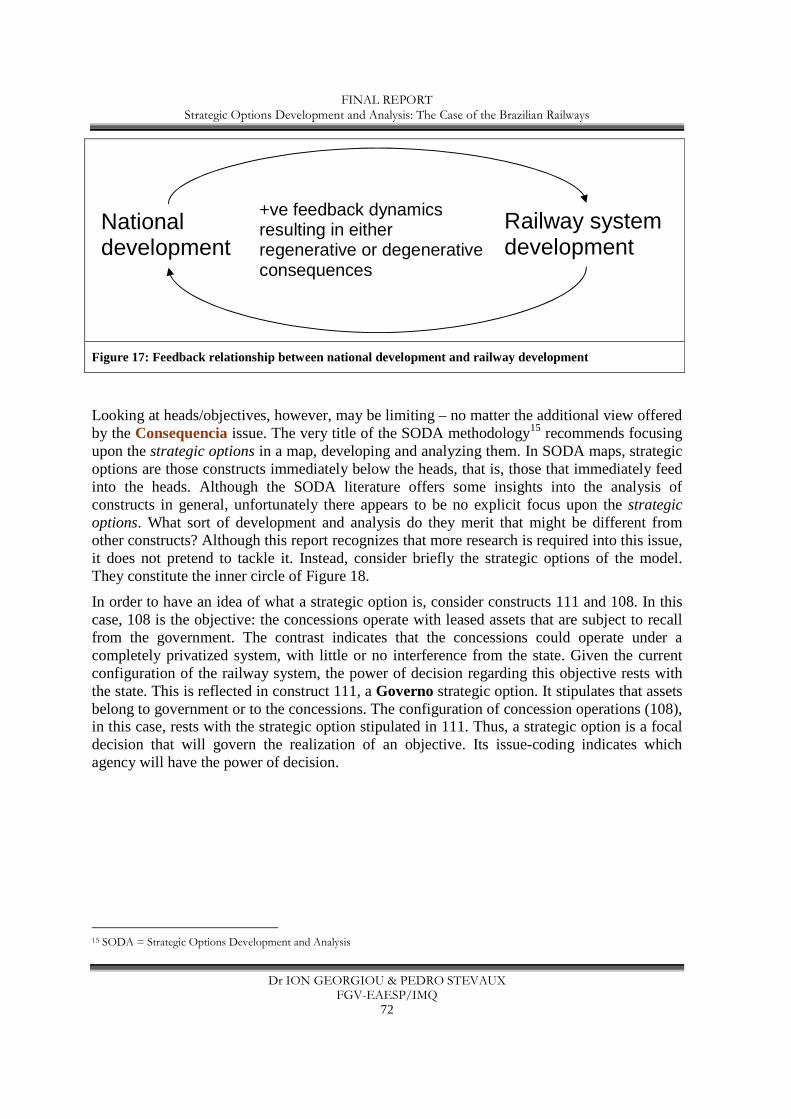
FINAL REPORT Strategic Options Development and Analysis: The Case of the Brazilian Railways
Dr ION GEORGIOU & PEDRO STEVAUX FGV-EAESP/IMQ
72
Figure 17: Feedback relationship between national development and railway development
Looking at heads/objectives, however, may be limiting – no matter the additional view offered by the Consequencia issue. The very title of the SODA methodology15 recommends focusing upon the strategic options in a map, developing and analyzing them. In SODA maps, strategic options are those constructs immediately below the heads, that is, those that immediately feed into the heads. Although the SODA literature offers some insights into the analysis of constructs in general, unfortunately there appears to be no explicit focus upon the strategic options. What sort of development and analysis do they merit that might be different from other constructs? Although this report recognizes that more research is required into this issue, it does not pretend to tackle it. Instead, consider briefly the strategic options of the model. They constitute the inner circle of Figure 18.
In order to have an idea of what a strategic option is, consider constructs 111 and 108. In this case, 108 is the objective: the concessions operate with leased assets that are subject to recall from the government. The contrast indicates that the concessions could operate under a completely privatized system, with little or no interference from the state. Given the current configuration of the railway system, the power of decision regarding this objective rests with the state. This is reflected in construct 111, a Governo strategic option. It stipulates that assets belong to government or to the concessions. The configuration of concession operations (108), in this case, rests with the strategic option stipulated in 111. Thus, a strategic option is a focal decision that will govern the realization of an objective. Its issue-coding indicates which agency will have the power of decision.
15 SODA = Strategic Options Development and Analysis
National development
Railway system development
+ve feedback dynamics resulting in either regenerative or degenerative consequences
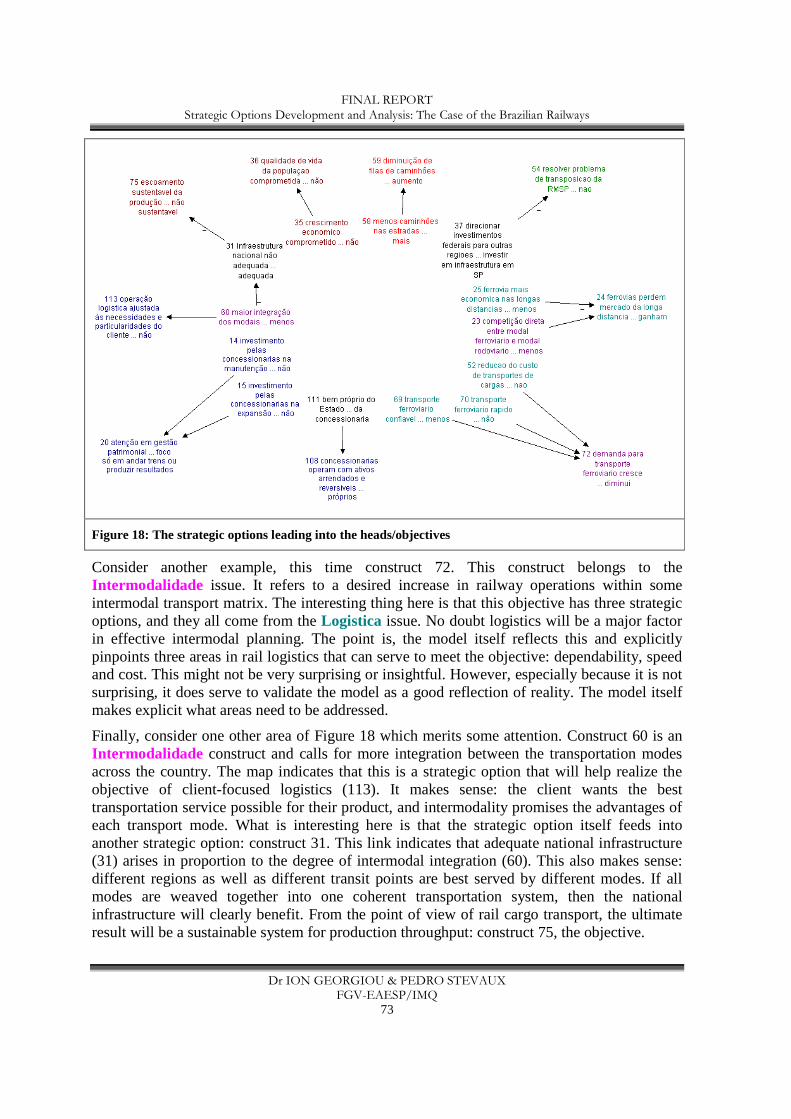
FINAL REPORT Strategic Options Development and Analysis: The Case of the Brazilian Railways
Dr ION GEORGIOU & PEDRO STEVAUX FGV-EAESP/IMQ
73
Figure 18: The strategic options leading into the heads/objectives
Consider another example, this time construct 72. This construct belongs to the Intermodalidade issue. It refers to a desired increase in railway operations within some intermodal transport matrix. The interesting thing here is that this objective has three strategic options, and they all come from the Logistica issue. No doubt logistics will be a major factor in effective intermodal planning. The point is, the model itself reflects this and explicitly pinpoints three areas in rail logistics that can serve to meet the objective: dependability, speed and cost. This might not be very surprising or insightful. However, especially because it is not surprising, it does serve to validate the model as a good reflection of reality. The model itself makes explicit what areas need to be addressed.
Finally, consider one other area of Figure 18 which merits some attention. Construct 60 is an Intermodalidade construct and calls for more integration between the transportation modes across the country. The map indicates that this is a strategic option that will help realize the objective of client-focused logistics (113). It makes sense: the client wants the best transportation service possible for their product, and intermodality promises the advantages of each transport mode. What is interesting here is that the strategic option itself feeds into another strategic option: construct 31. This link indicates that adequate national infrastructure (31) arises in proportion to the degree of intermodal integration (60). This also makes sense: different regions as well as different transit points are best served by different modes. If all modes are weaved together into one coherent transportation system, then the national infrastructure will clearly benefit. From the point of view of rail cargo transport, the ultimate result will be a sustainable system for production throughput: construct 75, the objective.
FINAL REPORT Strategic Options Development and Analysis: The Case of the Brazilian Railways
Dr ION GEORGIOU & PEDRO STEVAUX FGV-EAESP/IMQ
74
A strategic option is a focal decision that governs the realization of an objective. The manner in which it is coded in the model can indicate which entity has the power of decision.
SODA Rule 8: Strategic options
The identification and preliminary exploration of t he highly affected constructs A construct is said to be affected if it has an indegree (or implosion grade) greater than zero. In other words, there is at least one other construct leading into it, and so affecting it in some way. The effect can be one of influence, or one of dependency, but its true nature is context-dependent and requires a qualitative understanding of the constructs involved. In other words, the indegree itself provides no indication as to how the construct is being influenced by those leading into it.
The indegree can be used, however, to differentiate between grades of effect. So, for example, a construct with indegree of 1 can be said to be minimally affected, whereas a construct with high indegree may be said to reflect a complex decision making process. This is because a higher indegree reflects multiple prior decisions that affect the construct simultaneously. For the present purposes, a construct was deemed highly affected if it had indegree greater than or equal to 3. The reason was based on appreciating each construct as a decision. If a decision needs to be taken based on prior decisions, then one with at least 3 prior decisions is, to a perceptibly significant degree, affected by a complex decision-making system. The constructs based upon this criterion are shown in Figure 19.
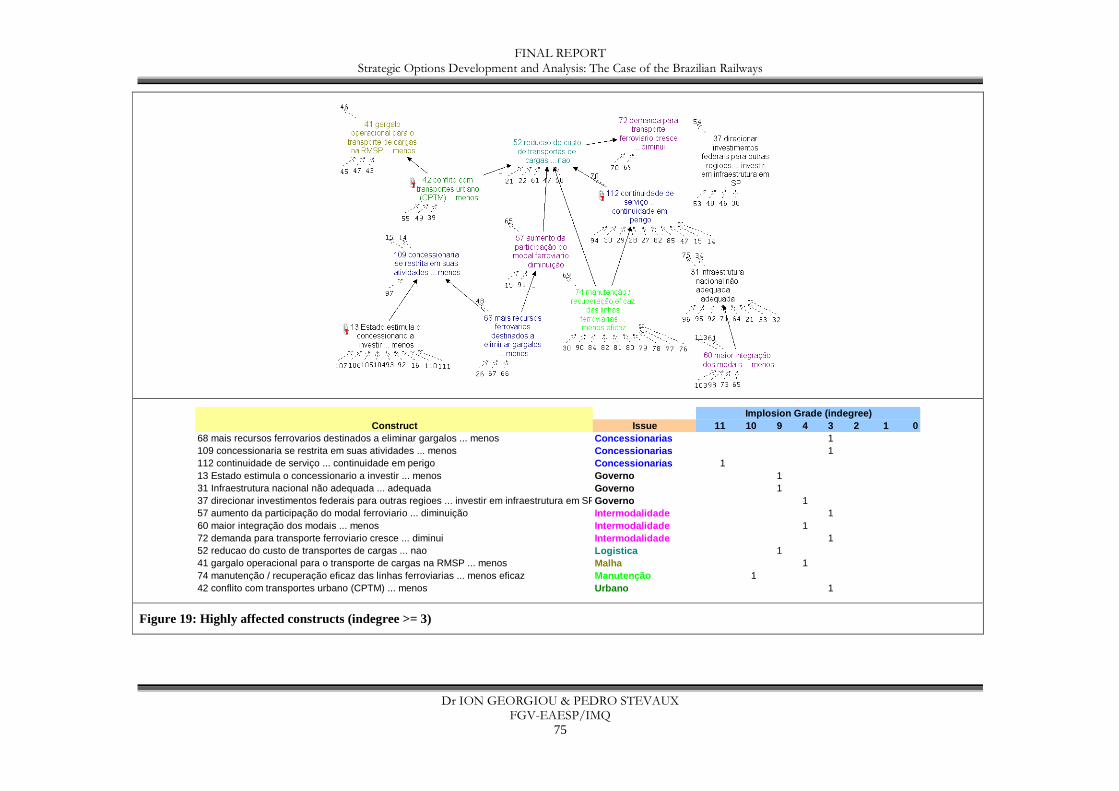
FINAL REPORT Strategic Options Development and Analysis: The Case of the Brazilian Railways
Dr ION GEORGIOU & PEDRO STEVAUX FGV-EAESP/IMQ
75
Construct Issue 11 10 9 4 3 2 1 068 mais recursos ferrovarios destinados a eliminar gargalos ... menos Concessionarias 1109 concessionaria se restrita em suas atividades ... menos Concessionarias 1112 continuidade de serviço ... continuidade em perigo Concessionarias 113 Estado estimula o concessionario a investir ... menos Governo 131 Infraestrutura nacional não adequada ... adequada Governo 137 direcionar investimentos federais para outras regioes ... investir em infraestrutura em SPGoverno 157 aumento da participação do modal ferroviario ... diminuição Intermodalidade 160 maior integração dos modais ... menos Intermodalidade 172 demanda para transporte ferroviario cresce ... diminui Intermodalidade 152 reducao do custo de transportes de cargas ... nao Logistica 141 gargalo operacional para o transporte de cargas na RMSP ... menos Malha 174 manutenção / recuperação eficaz das linhas ferroviarias ... menos eficaz Manutenção 142 conflito com transportes urbano (CPTM) ... menos Urbano 1
Implosion Grade (indegree)
Figure 19: Highly affected constructs (indegree >= 3)
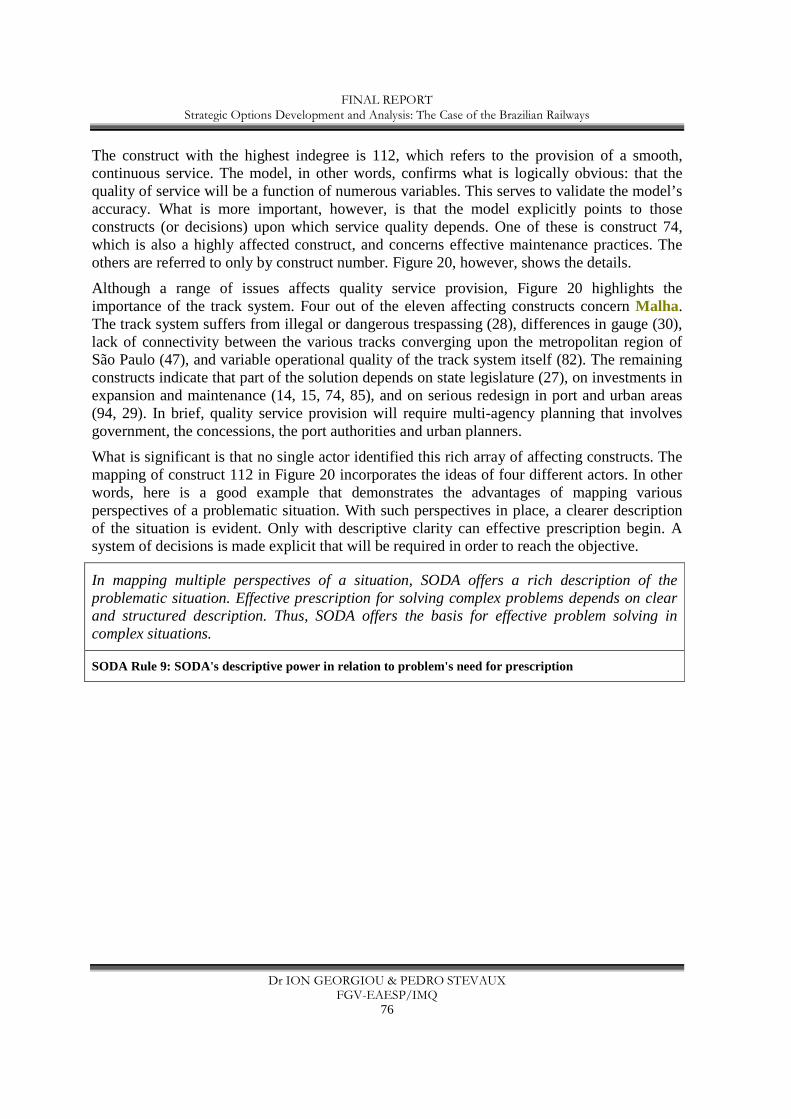
FINAL REPORT Strategic Options Development and Analysis: The Case of the Brazilian Railways
Dr ION GEORGIOU & PEDRO STEVAUX FGV-EAESP/IMQ
76
The construct with the highest indegree is 112, which refers to the provision of a smooth, continuous service. The model, in other words, confirms what is logically obvious: that the quality of service will be a function of numerous variables. This serves to validate the model’s accuracy. What is more important, however, is that the model explicitly points to those constructs (or decisions) upon which service quality depends. One of these is construct 74, which is also a highly affected construct, and concerns effective maintenance practices. The others are referred to only by construct number. Figure 20, however, shows the details.
Although a range of issues affects quality service provision, Figure 20 highlights the importance of the track system. Four out of the eleven affecting constructs concern Malha. The track system suffers from illegal or dangerous trespassing (28), differences in gauge (30), lack of connectivity between the various tracks converging upon the metropolitan region of São Paulo (47), and variable operational quality of the track system itself (82). The remaining constructs indicate that part of the solution depends on state legislature (27), on investments in expansion and maintenance (14, 15, 74, 85), and on serious redesign in port and urban areas (94, 29). In brief, quality service provision will require multi-agency planning that involves government, the concessions, the port authorities and urban planners.
What is significant is that no single actor identified this rich array of affecting constructs. The mapping of construct 112 in Figure 20 incorporates the ideas of four different actors. In other words, here is a good example that demonstrates the advantages of mapping various perspectives of a problematic situation. With such perspectives in place, a clearer description of the situation is evident. Only with descriptive clarity can effective prescription begin. A system of decisions is made explicit that will be required in order to reach the objective.
In mapping multiple perspectives of a situation, SODA offers a rich description of the problematic situation. Effective prescription for solving complex problems depends on clear and structured description. Thus, SODA offers the basis for effective problem solving in complex situations.
SODA Rule 9: SODA's descriptive power in relation to problem's need for prescription
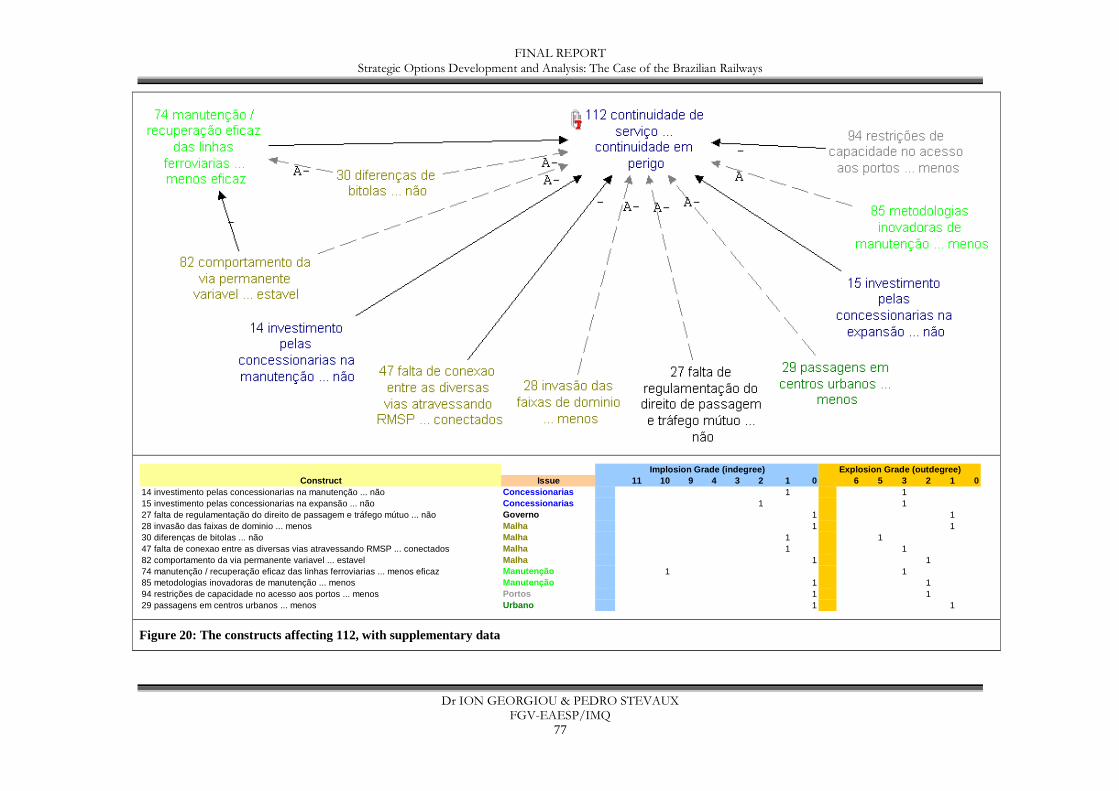
FINAL REPORT Strategic Options Development and Analysis: The Case of the Brazilian Railways
Dr ION GEORGIOU & PEDRO STEVAUX FGV-EAESP/IMQ
77
Construct Issue 11 10 9 4 3 2 1 0 6 5 3 2 1 014 investimento pelas concessionarias na manutenção ... não Concessionarias 1 115 investimento pelas concessionarias na expansão ... não Concessionarias 1 127 falta de regulamentação do direito de passagem e tráfego mútuo ... não Governo 1 128 invasão das faixas de dominio ... menos Malha 1 130 diferenças de bitolas ... não Malha 1 147 falta de conexao entre as diversas vias atravessando RMSP ... conectados Malha 1 182 comportamento da via permanente variavel ... estavel Malha 1 174 manutenção / recuperação eficaz das linhas ferroviarias ... menos eficaz Manutenção 1 185 metodologias inovadoras de manutenção ... menos Manutenção 1 194 restrições de capacidade no acesso aos portos ... menos Portos 1 129 passagens em centros urbanos ... menos Urbano 1 1
Implosion Grade (indegree) Explosion Grade (outdegre e)
Figure 20: The constructs affecting 112, with supplementary data
FINAL REPORT Strategic Options Development and Analysis: The Case of the Brazilian Railways
Dr ION GEORGIOU & PEDRO STEVAUX FGV-EAESP/IMQ
78
The identification and preliminary exploration of t he highly affecting constructs The mapping of construct 112 in Figure 20 affords an enhanced holistic understanding if we focus upon one of its affecting constructs, 30, which concerns the gauge differences that still exist within Brazil. This construct has an explosion grade, or outdegree, of 5. In fact, after construct 92, this is the construct with the highest outdegree in the entire model16. That is to say, it is a highly affecting construct. It is worth mapping it out, and including construct 112 (the previously identified highly affected construct), in order to study the ensuing interrelations. This is shown in Figure 21.
Figure 21: Map of construct 30 showing the direct effects of gauge differences
In Figure 21, we find that, apart from affecting service continuity (112) directly, the rail system’s differences in gauge lead to:
• lack of transparency and consistency within the whole system (especially with regards to maintenance17) (89);
• the detrimental operational effectiveness of a leading concession, MRS (44, 45); and,
• the ineffective maintenance of the track system (74) - this also affects service continuity.
In other words, the effects of construct 30 range from national (89) to corporate (44, 45) dimensions, from maintenance (74) to best practice (89) issues. What is more, the reason for the existence of gauge differences is due to the lack of a modernization program focused on the track system (48). And, last but no least, the client suffers (112). This is a good example of how even a small map can hint at the numerous issues surrounding one construct.
16 See Figure 14 for the entire model (the merged map).
17 Construct 89 was originally discussed by Bollinger in relation to maintenance practices.
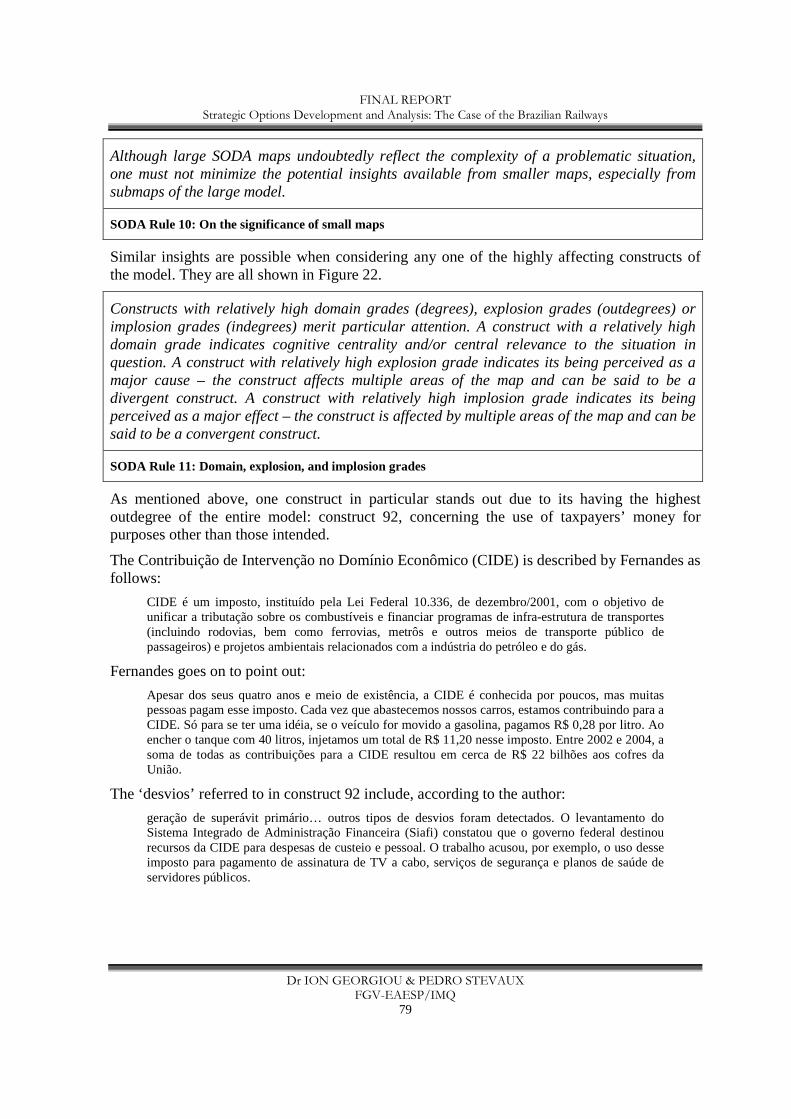
FINAL REPORT Strategic Options Development and Analysis: The Case of the Brazilian Railways
Dr ION GEORGIOU & PEDRO STEVAUX FGV-EAESP/IMQ
79
Although large SODA maps undoubtedly reflect the complexity of a problematic situation, one must not minimize the potential insights available from smaller maps, especially from submaps of the large model.
SODA Rule 10: On the significance of small maps
Similar insights are possible when considering any one of the highly affecting constructs of the model. They are all shown in Figure 22.
Constructs with relatively high domain grades (degrees), explosion grades (outdegrees) or implosion grades (indegrees) merit particular attention. A construct with a relatively high domain grade indicates cognitive centrality and/or central relevance to the situation in question. A construct with relatively high explosion grade indicates its being perceived as a major cause – the construct affects multiple areas of the map and can be said to be a divergent construct. A construct with relatively high implosion grade indicates its being perceived as a major effect – the construct is affected by multiple areas of the map and can be said to be a convergent construct.
SODA Rule 11: Domain, explosion, and implosion grades
As mentioned above, one construct in particular stands out due to its having the highest outdegree of the entire model: construct 92, concerning the use of taxpayers’ money for purposes other than those intended.
The Contribuição de Intervenção no Domínio Econômico (CIDE) is described by Fernandes as follows:
CIDE é um imposto, instituído pela Lei Federal 10.336, de dezembro/2001, com o objetivo de unificar a tributação sobre os combustíveis e financiar programas de infra-estrutura de transportes (incluindo rodovias, bem como ferrovias, metrôs e outros meios de transporte público de passageiros) e projetos ambientais relacionados com a indústria do petróleo e do gás.
Fernandes goes on to point out:
Apesar dos seus quatro anos e meio de existência, a CIDE é conhecida por poucos, mas muitas pessoas pagam esse imposto. Cada vez que abastecemos nossos carros, estamos contribuindo para a CIDE. Só para se ter uma idéia, se o veículo for movido a gasolina, pagamos R$ 0,28 por litro. Ao encher o tanque com 40 litros, injetamos um total de R$ 11,20 nesse imposto. Entre 2002 e 2004, a soma de todas as contribuições para a CIDE resultou em cerca de R$ 22 bilhões aos cofres da União.
The ‘desvios’ referred to in construct 92 include, according to the author:
geração de superávit primário… outros tipos de desvios foram detectados. O levantamento do Sistema Integrado de Administração Financeira (Siafi) constatou que o governo federal destinou recursos da CIDE para despesas de custeio e pessoal. O trabalho acusou, por exemplo, o uso desse imposto para pagamento de assinatura de TV a cabo, serviços de segurança e planos de saúde de servidores públicos.
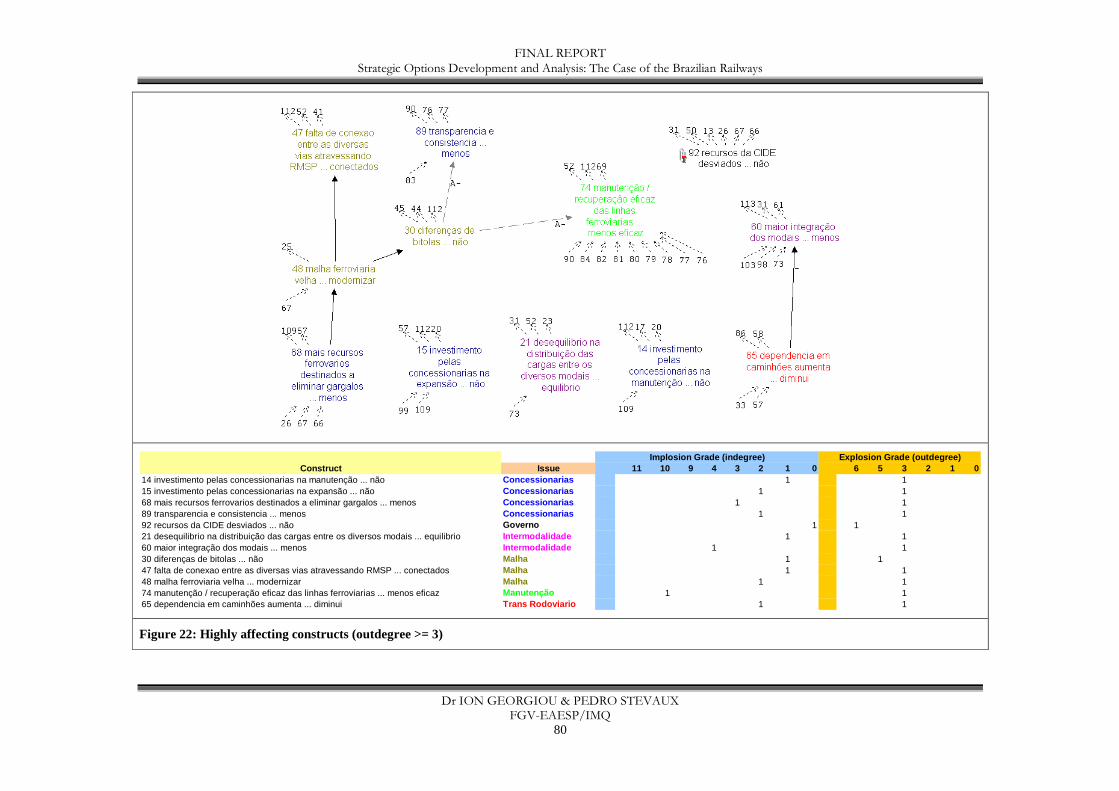
FINAL REPORT Strategic Options Development and Analysis: The Case of the Brazilian Railways
Dr ION GEORGIOU & PEDRO STEVAUX FGV-EAESP/IMQ
80
Construct Issue 11 10 9 4 3 2 1 0 6 5 3 2 1 014 investimento pelas concessionarias na manutenção ... não Concessionarias 1 115 investimento pelas concessionarias na expansão ... não Concessionarias 1 168 mais recursos ferrovarios destinados a eliminar gargalos ... menos Concessionarias 1 189 transparencia e consistencia ... menos Concessionarias 1 192 recursos da CIDE desviados ... não Governo 1 121 desequilibrio na distribuição das cargas entre os diversos modais ... equilibrio Intermodalidade 1 160 maior integração dos modais ... menos Intermodalidade 1 130 diferenças de bitolas ... não Malha 1 147 falta de conexao entre as diversas vias atravessando RMSP ... conectados Malha 1 148 malha ferroviaria velha ... modernizar Malha 1 174 manutenção / recuperação eficaz das linhas ferroviarias ... menos eficaz Manutenção 1 165 dependencia em caminhões aumenta ... diminui Trans Rodoviario 1 1
Implosion Grade (indegree) Explosion Grade (outdegre e)
Figure 22: Highly affecting constructs (outdegree >= 3)
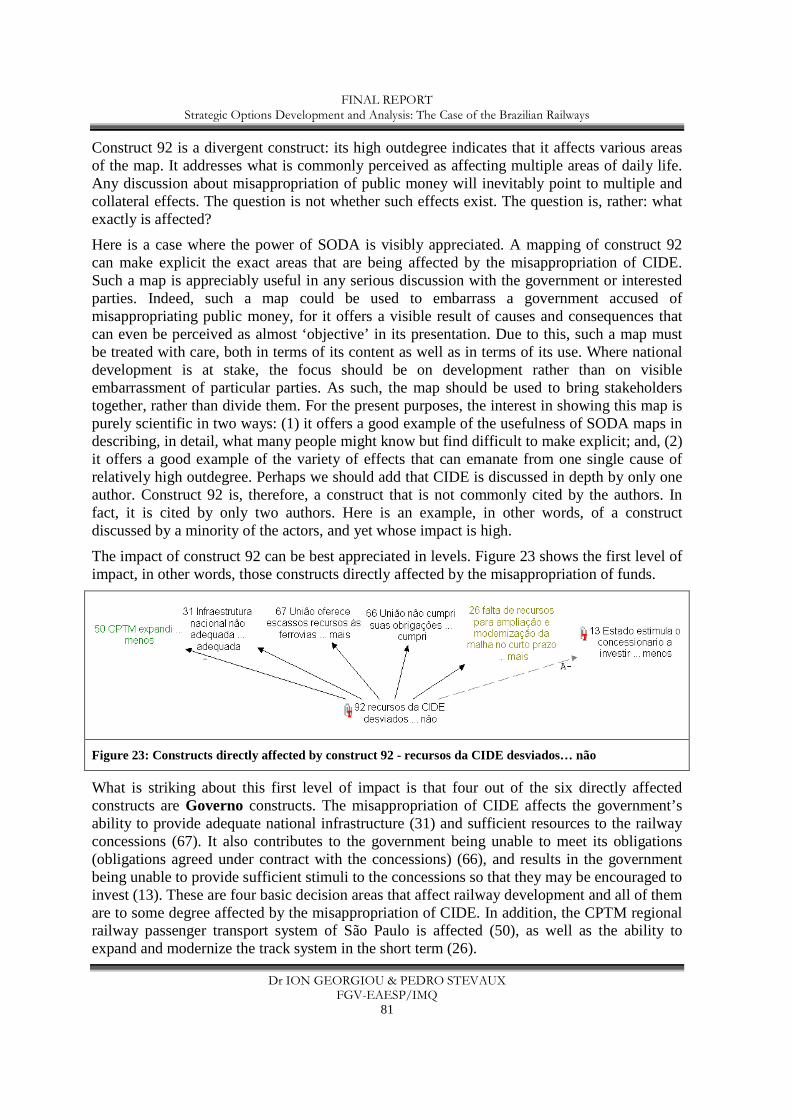
FINAL REPORT Strategic Options Development and Analysis: The Case of the Brazilian Railways
Dr ION GEORGIOU & PEDRO STEVAUX FGV-EAESP/IMQ
81
Construct 92 is a divergent construct: its high outdegree indicates that it affects various areas of the map. It addresses what is commonly perceived as affecting multiple areas of daily life. Any discussion about misappropriation of public money will inevitably point to multiple and collateral effects. The question is not whether such effects exist. The question is, rather: what exactly is affected?
Here is a case where the power of SODA is visibly appreciated. A mapping of construct 92 can make explicit the exact areas that are being affected by the misappropriation of CIDE. Such a map is appreciably useful in any serious discussion with the government or interested parties. Indeed, such a map could be used to embarrass a government accused of misappropriating public money, for it offers a visible result of causes and consequences that can even be perceived as almost ‘objective’ in its presentation. Due to this, such a map must be treated with care, both in terms of its content as well as in terms of its use. Where national development is at stake, the focus should be on development rather than on visible embarrassment of particular parties. As such, the map should be used to bring stakeholders together, rather than divide them. For the present purposes, the interest in showing this map is purely scientific in two ways: (1) it offers a good example of the usefulness of SODA maps in describing, in detail, what many people might know but find difficult to make explicit; and, (2) it offers a good example of the variety of effects that can emanate from one single cause of relatively high outdegree. Perhaps we should add that CIDE is discussed in depth by only one author. Construct 92 is, therefore, a construct that is not commonly cited by the authors. In fact, it is cited by only two authors. Here is an example, in other words, of a construct discussed by a minority of the actors, and yet whose impact is high.
The impact of construct 92 can be best appreciated in levels. Figure 23 shows the first level of impact, in other words, those constructs directly affected by the misappropriation of funds.
Figure 23: Constructs directly affected by construct 92 - recursos da CIDE desviados… não
What is striking about this first level of impact is that four out of the six directly affected constructs are Governo constructs. The misappropriation of CIDE affects the government’s ability to provide adequate national infrastructure (31) and sufficient resources to the railway concessions (67). It also contributes to the government being unable to meet its obligations (obligations agreed under contract with the concessions) (66), and results in the government being unable to provide sufficient stimuli to the concessions so that they may be encouraged to invest (13). These are four basic decision areas that affect railway development and all of them are to some degree affected by the misappropriation of CIDE. In addition, the CPTM regional railway passenger transport system of São Paulo is affected (50), as well as the ability to expand and modernize the track system in the short term (26).
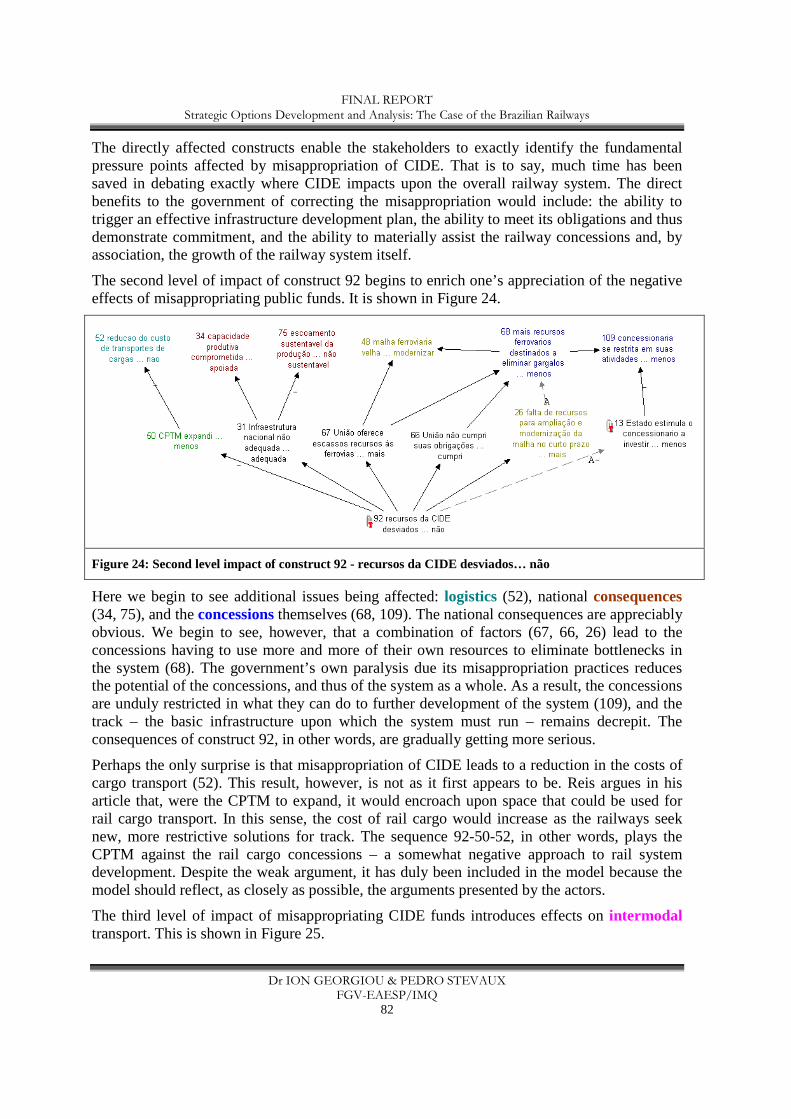
FINAL REPORT Strategic Options Development and Analysis: The Case of the Brazilian Railways
Dr ION GEORGIOU & PEDRO STEVAUX FGV-EAESP/IMQ
82
The directly affected constructs enable the stakeholders to exactly identify the fundamental pressure points affected by misappropriation of CIDE. That is to say, much time has been saved in debating exactly where CIDE impacts upon the overall railway system. The direct benefits to the government of correcting the misappropriation would include: the ability to trigger an effective infrastructure development plan, the ability to meet its obligations and thus demonstrate commitment, and the ability to materially assist the railway concessions and, by association, the growth of the railway system itself.
The second level of impact of construct 92 begins to enrich one’s appreciation of the negative effects of misappropriating public funds. It is shown in Figure 24.
Figure 24: Second level impact of construct 92 - recursos da CIDE desviados… não
Here we begin to see additional issues being affected: logistics (52), national consequences (34, 75), and the concessions themselves (68, 109). The national consequences are appreciably obvious. We begin to see, however, that a combination of factors (67, 66, 26) lead to the concessions having to use more and more of their own resources to eliminate bottlenecks in the system (68). The government’s own paralysis due its misappropriation practices reduces the potential of the concessions, and thus of the system as a whole. As a result, the concessions are unduly restricted in what they can do to further development of the system (109), and the track – the basic infrastructure upon which the system must run – remains decrepit. The consequences of construct 92, in other words, are gradually getting more serious.
Perhaps the only surprise is that misappropriation of CIDE leads to a reduction in the costs of cargo transport (52). This result, however, is not as it first appears to be. Reis argues in his article that, were the CPTM to expand, it would encroach upon space that could be used for rail cargo transport. In this sense, the cost of rail cargo would increase as the railways seek new, more restrictive solutions for track. The sequence 92-50-52, in other words, plays the CPTM against the rail cargo concessions – a somewhat negative approach to rail system development. Despite the weak argument, it has duly been included in the model because the model should reflect, as closely as possible, the arguments presented by the actors.
The third level of impact of misappropriating CIDE funds introduces effects on intermodal transport. This is shown in Figure 25.
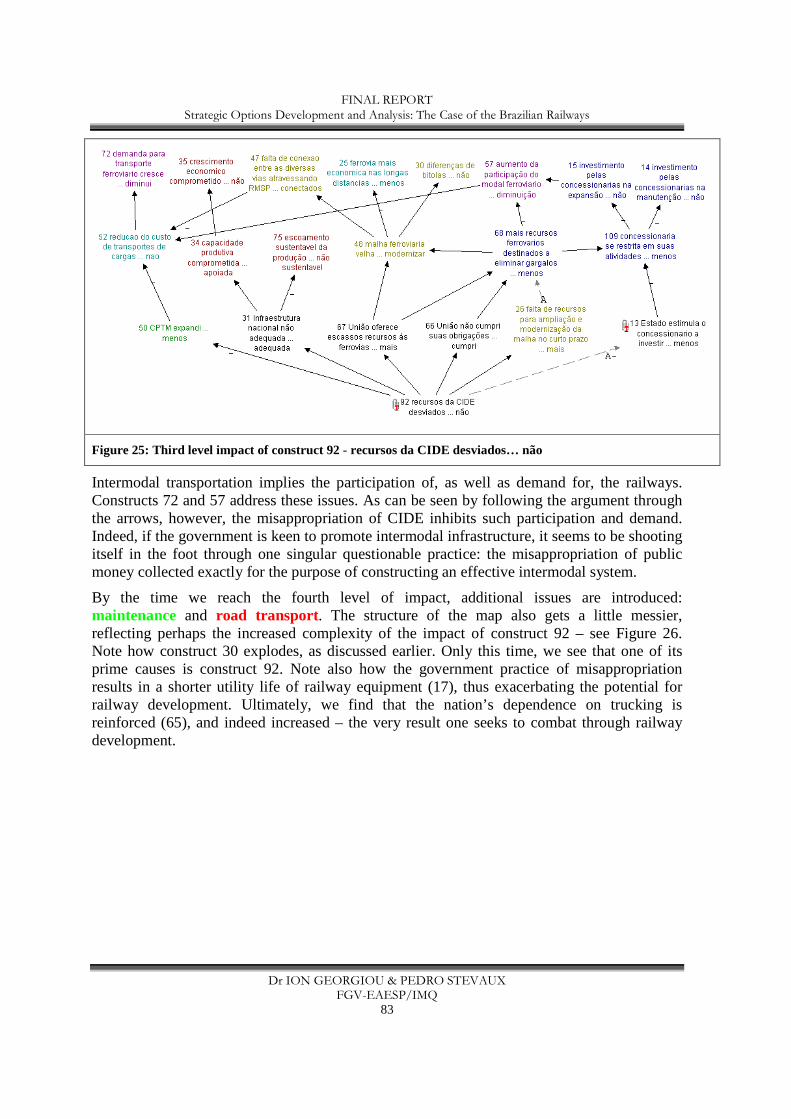
FINAL REPORT Strategic Options Development and Analysis: The Case of the Brazilian Railways
Dr ION GEORGIOU & PEDRO STEVAUX FGV-EAESP/IMQ
83
Figure 25: Third level impact of construct 92 - recursos da CIDE desviados… não
Intermodal transportation implies the participation of, as well as demand for, the railways. Constructs 72 and 57 address these issues. As can be seen by following the argument through the arrows, however, the misappropriation of CIDE inhibits such participation and demand. Indeed, if the government is keen to promote intermodal infrastructure, it seems to be shooting itself in the foot through one singular questionable practice: the misappropriation of public money collected exactly for the purpose of constructing an effective intermodal system.
By the time we reach the fourth level of impact, additional issues are introduced: maintenance and road transport. The structure of the map also gets a little messier, reflecting perhaps the increased complexity of the impact of construct 92 – see Figure 26. Note how construct 30 explodes, as discussed earlier. Only this time, we see that one of its prime causes is construct 92. Note also how the government practice of misappropriation results in a shorter utility life of railway equipment (17), thus exacerbating the potential for railway development. Ultimately, we find that the nation’s dependence on trucking is reinforced (65), and indeed increased – the very result one seeks to combat through railway development.
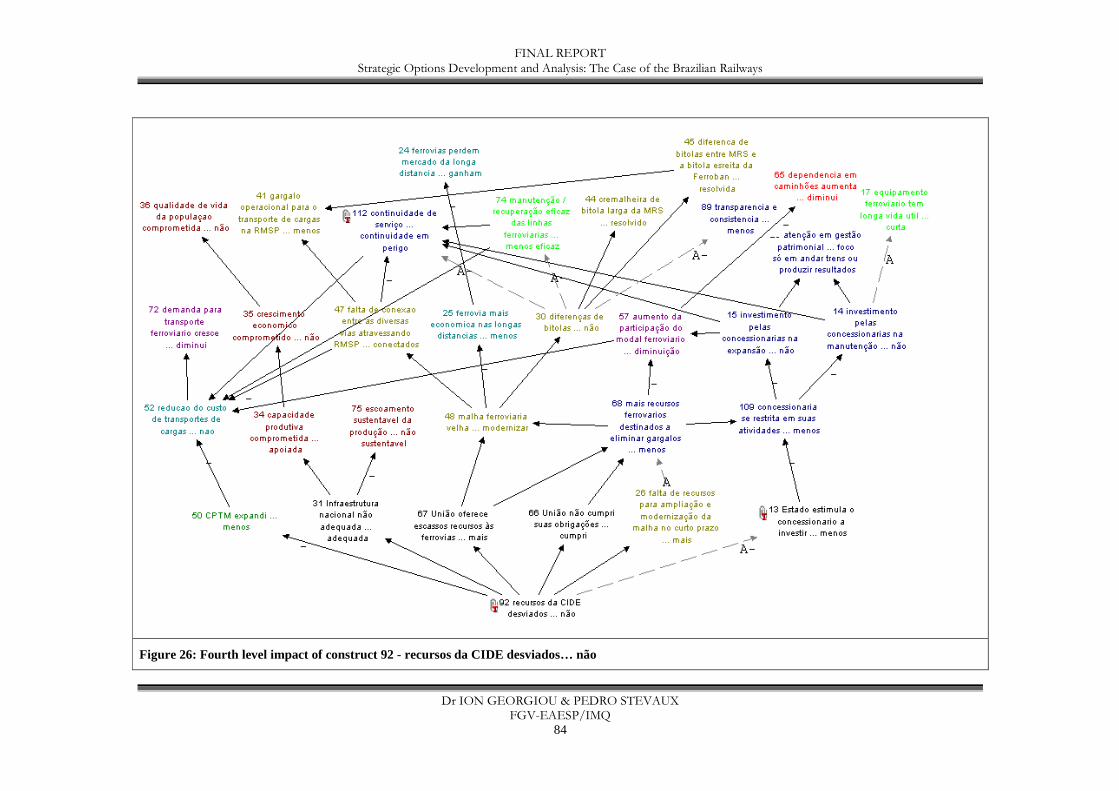
FINAL REPORT Strategic Options Development and Analysis: The Case of the Brazilian Railways
Dr ION GEORGIOU & PEDRO STEVAUX FGV-EAESP/IMQ
84
Figure 26: Fourth level impact of construct 92 - recursos da CIDE desviados… não
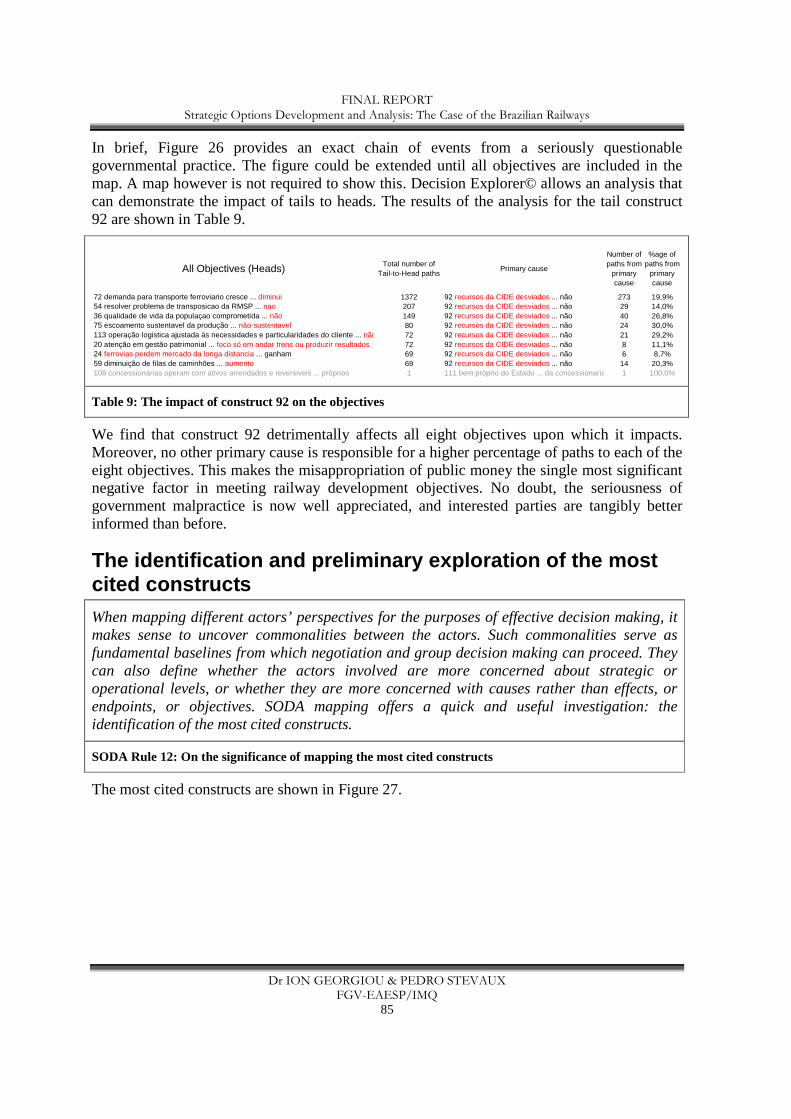
FINAL REPORT Strategic Options Development and Analysis: The Case of the Brazilian Railways
Dr ION GEORGIOU & PEDRO STEVAUX FGV-EAESP/IMQ
85
In brief, Figure 26 provides an exact chain of events from a seriously questionable governmental practice. The figure could be extended until all objectives are included in the map. A map however is not required to show this. Decision Explorer© allows an analysis that can demonstrate the impact of tails to heads. The results of the analysis for the tail construct 92 are shown in Table 9.
All Objectives (Heads) Total number of Tail-to-Head paths
Primary cause
Number of paths from
primary cause
%age of paths from
primary cause
72 demanda para transporte ferroviario cresce ... diminui 1372 92 recursos da CIDE desviados ... não 273 19,9%54 resolver problema de transposicao da RMSP ... nao 207 92 recursos da CIDE desviados ... não 29 14,0%36 qualidade de vida da populaçao comprometida ... não 149 92 recursos da CIDE desviados ... não 40 26,8%75 escoamento sustentavel da produção ... não sustentavel 80 92 recursos da CIDE desviados ... não 24 30,0%113 operação logistica ajustada às necessidades e particularidades do cliente ... não 72 92 recursos da CIDE desviados ... não 21 29,2%20 atenção em gestão patrimonial ... foco só em andar trens ou produzir resultados 72 92 recursos da CIDE desviados ... não 8 11,1%24 ferrovias perdem mercado da longa distancia ... ganham 69 92 recursos da CIDE desviados ... não 6 8,7%59 diminuição de filas de caminhões ... aumento 69 92 recursos da CIDE desviados ... não 14 20,3%108 concessionarias operam com ativos arrendados e reversiveis ... próprios 1 111 bem próprio do Estado ... da concessionaria 1 100,0%
Table 9: The impact of construct 92 on the objectives
We find that construct 92 detrimentally affects all eight objectives upon which it impacts. Moreover, no other primary cause is responsible for a higher percentage of paths to each of the eight objectives. This makes the misappropriation of public money the single most significant negative factor in meeting railway development objectives. No doubt, the seriousness of government malpractice is now well appreciated, and interested parties are tangibly better informed than before.
The identification and preliminary exploration of t he most cited constructs
When mapping different actors’ perspectives for the purposes of effective decision making, it makes sense to uncover commonalities between the actors. Such commonalities serve as fundamental baselines from which negotiation and group decision making can proceed. They can also define whether the actors involved are more concerned about strategic or operational levels, or whether they are more concerned with causes rather than effects, or endpoints, or objectives. SODA mapping offers a quick and useful investigation: the identification of the most cited constructs.
SODA Rule 12: On the significance of mapping the most cited constructs
The most cited constructs are shown in Figure 27.
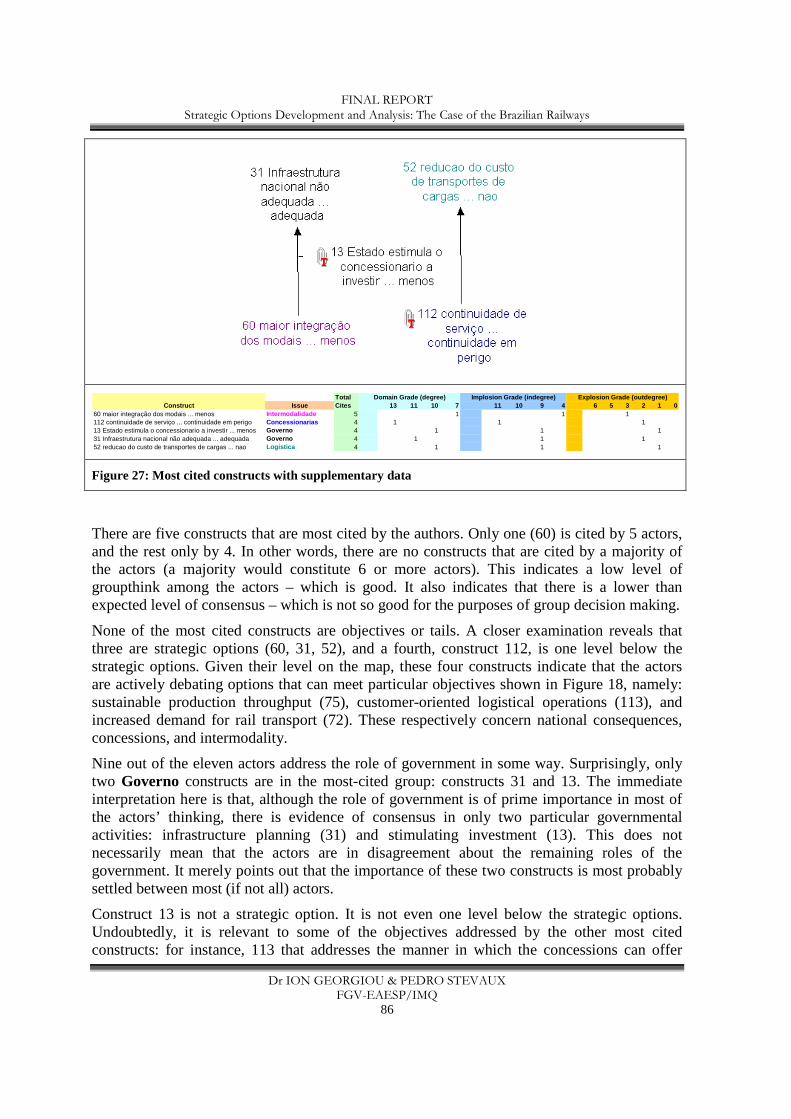
FINAL REPORT Strategic Options Development and Analysis: The Case of the Brazilian Railways
Dr ION GEORGIOU & PEDRO STEVAUX FGV-EAESP/IMQ
86
TotalConstruct Issue Cites 13 11 10 7 11 10 9 4 6 5 3 2 1 0
60 maior integração dos modais ... menos Intermodalidade 5 1 1 1112 continuidade de serviço ... continuidade em perigo Concessionarias 4 1 1 113 Estado estimula o concessionario a investir ... menos Governo 4 1 1 131 Infraestrutura nacional não adequada ... adequada Governo 4 1 1 152 reducao do custo de transportes de cargas ... nao Logistica 4 1 1 1
Domain Grade (degree) Implosion Grade (indegree) Expl osion Grade (outdegree)
Figure 27: Most cited constructs with supplementary data
There are five constructs that are most cited by the authors. Only one (60) is cited by 5 actors, and the rest only by 4. In other words, there are no constructs that are cited by a majority of the actors (a majority would constitute 6 or more actors). This indicates a low level of groupthink among the actors – which is good. It also indicates that there is a lower than expected level of consensus – which is not so good for the purposes of group decision making.
None of the most cited constructs are objectives or tails. A closer examination reveals that three are strategic options (60, 31, 52), and a fourth, construct 112, is one level below the strategic options. Given their level on the map, these four constructs indicate that the actors are actively debating options that can meet particular objectives shown in Figure 18, namely: sustainable production throughput (75), customer-oriented logistical operations (113), and increased demand for rail transport (72). These respectively concern national consequences, concessions, and intermodality.
Nine out of the eleven actors address the role of government in some way. Surprisingly, only two Governo constructs are in the most-cited group: constructs 31 and 13. The immediate interpretation here is that, although the role of government is of prime importance in most of the actors’ thinking, there is evidence of consensus in only two particular governmental activities: infrastructure planning (31) and stimulating investment (13). This does not necessarily mean that the actors are in disagreement about the remaining roles of the government. It merely points out that the importance of these two constructs is most probably settled between most (if not all) actors.
Construct 13 is not a strategic option. It is not even one level below the strategic options. Undoubtedly, it is relevant to some of the objectives addressed by the other most cited constructs: for instance, 113 that addresses the manner in which the concessions can offer
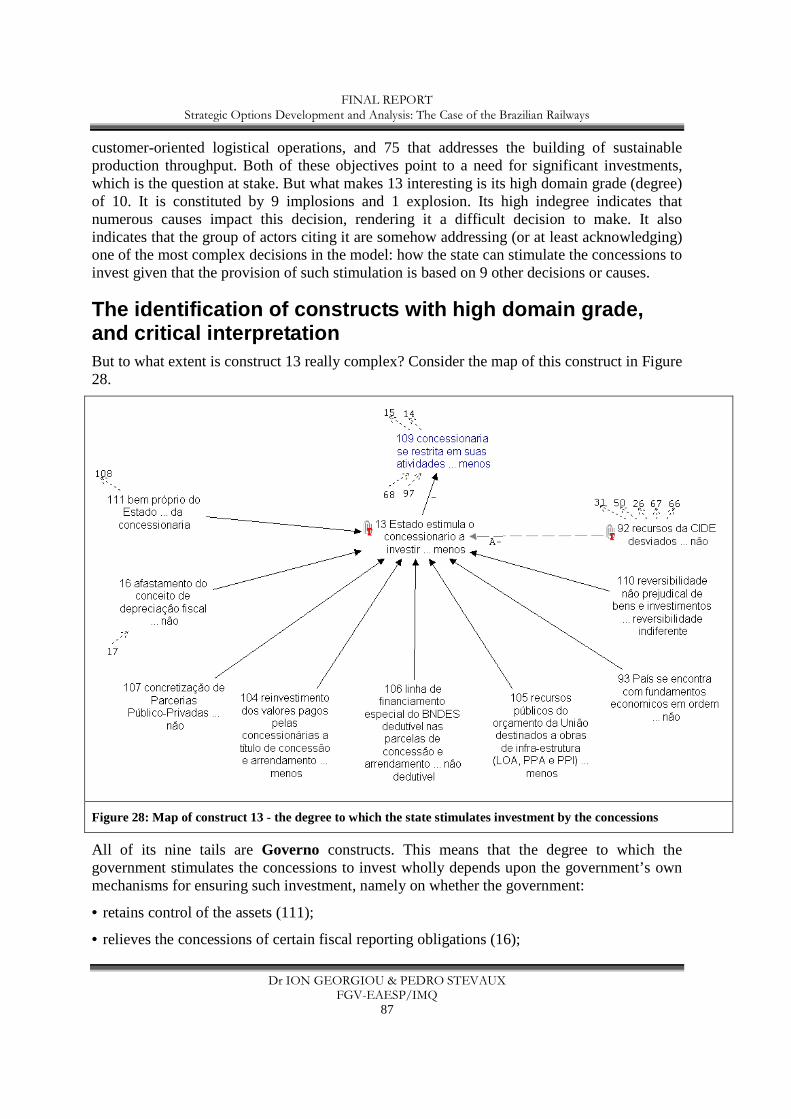
FINAL REPORT Strategic Options Development and Analysis: The Case of the Brazilian Railways
Dr ION GEORGIOU & PEDRO STEVAUX FGV-EAESP/IMQ
87
customer-oriented logistical operations, and 75 that addresses the building of sustainable production throughput. Both of these objectives point to a need for significant investments, which is the question at stake. But what makes 13 interesting is its high domain grade (degree) of 10. It is constituted by 9 implosions and 1 explosion. Its high indegree indicates that numerous causes impact this decision, rendering it a difficult decision to make. It also indicates that the group of actors citing it are somehow addressing (or at least acknowledging) one of the most complex decisions in the model: how the state can stimulate the concessions to invest given that the provision of such stimulation is based on 9 other decisions or causes.
The identification of constructs with high domain g rade, and critical interpretation But to what extent is construct 13 really complex? Consider the map of this construct in Figure 28.
Figure 28: Map of construct 13 - the degree to which the state stimulates investment by the concessions
All of its nine tails are Governo constructs. This means that the degree to which the government stimulates the concessions to invest wholly depends upon the government’s own mechanisms for ensuring such investment, namely on whether the government:
• retains control of the assets (111);
• relieves the concessions of certain fiscal reporting obligations (16);
FINAL REPORT Strategic Options Development and Analysis: The Case of the Brazilian Railways
Dr ION GEORGIOU & PEDRO STEVAUX FGV-EAESP/IMQ
88
• reaffirms public-private partnerships (107);
• uses funds appropriately (104, 105, 92);
• offers fiscal relief on loans (106);
• maintains a non-prejudicial asset recall position (110); and,
• maintains the country’s economy in order (93).
No doubt this covers a range of issues. The high implosion grade of construct 13 reflects this. But its implosion grade is wholly constituted by constructs from within its own issue: Governo. The government’s decision, implicit in construct 13, depends upon nine other decisions that the government itself will make. As such, the complexity in question has nothing to do with multiple agencies required to make joint, interdependent decisions prior to 13. There is only one agency, the government, that will take its own decision, dependent upon only its own prior decisions. If construct 13 is complex at all, it is merely enumeratively complex: the government is the only body with power of decision here, and its decision will be based on the manner in which it balances its own metaphorical plates.
In summary, construct 13 has a high domain grade, but its domain grade is concentrated within its own issue: Governo. The question of how the state will stimulate concessions to invest is very much an internal governmental decision. If the complexity of a construct (or a decision) is to be judged according to different types of issues impacting upon it, or upon which it impacts, 13 is not complex. This leads to the following warning: domain grade does not necessarily indicate complexity. An internal decision might have a high domain grade but, due to its homogeneous nature, it demands little external attention from other issues. Of course, how the state stimulates concessions might require discussions with the concessions themselves (indeed, a concessions construct is the only outdegree of construct 13). But the decision implicit in construct 13 itself is very much a governmental one.
The discussion of construct 13 allows us to understand the relationship between domain grade and perception of complexity with somewhat more exactness. If you take the complete model – the merged map of Figure 14 – and uncover those constructs with high domain grade you will end up with a particular list. Table 10 shows one such list for a domain grade greater than or equal to 6.
All concepts in order of highest domain - in descending order of value Domain grade 13 74 manutenção / recuperação eficaz das linhas ferroviarias ... menos eficaz 112 continuidade de serviço ... continuidade em perigo Domain grade 11 31 Infraestrutura nacional não adequada ... adequada Domain grade 10 52 reducao do custo de transportes de cargas ... nao 13 Estado estimula o concessionario a investir ... menos
FINAL REPORT Strategic Options Development and Analysis: The Case of the Brazilian Railways
Dr ION GEORGIOU & PEDRO STEVAUX FGV-EAESP/IMQ
89
Domain grade 7 60 maior integração dos modais ... menos Domain grade 6 68 mais recursos ferrovarios destinados a eliminar gargalos ... menos 30 diferenças de bitolas ... não 92 recursos da CIDE desviados ... não
Table 10: Constructs with domain grade >=6, based on complete model
What the results of Table 10 fail to make explicit is the degree to which any construct on the list actually connects with constructs that do not belong to its own issue. For example, as we saw, construct 13 has domain grade of 10. But this alone does not tell us whether the connections implied by this domain stretch to issues other than that to which the construct itself belongs. A map analysis was required to uncover the minimal connection this construct has with other issues.
Consider then a different list of constructs with high domains. This time, the list is not based upon the complete model. It is based upon a submap constituted only by those constructs that have connections to issues other than the ones under which they are respectively categorized. The constructs in question, in other words, serve to link one issue to another. For this reason, they may be terms issue linkers. Construct 13 is one such construct: it links the issues of Governo and Concessionarias, as shown in Figure 28. But in the list of issue-linkers with high domain grades, construct 13 is nowhere near the top, as can be seen in Table 11.
Issue linkers in order of highest domain - in descending order of value Domain grade 13 112 continuidade de serviço ... continuidade em perigo Domain grade 11 31 Infraestrutura nacional não adequada ... adequada Domain grade 9 52 reducao do custo de transportes de cargas ... nao 74 manutenção / recuperação eficaz das linhas ferroviarias ... menos eficaz Domain grade 7 60 maior integração dos modais ... menos Domain grade 6 68 mais recursos ferrovarios destinados a eliminar gargalos ... menos 92 recursos da CIDE desviados ... não
Table 11: Issue linkers with domain grade >=6
Table 11 lists those constructs/decisions that are complex, because the high domain grades indicate the involvement of decision makers from various groups representing the different
FINAL REPORT Strategic Options Development and Analysis: The Case of the Brazilian Railways
Dr ION GEORGIOU & PEDRO STEVAUX FGV-EAESP/IMQ
90
underlying issues. Consider construct 112: who decides on how and whether service provision remains continuous, that is, runs smoothly? The domain grade of this construct is 13, and it covers the following issues: logistics (its only outdegree), ports, concessions, maintenance, the track, the government (which has only one indegree, in this case), and urbanism. Arguably, this is a far more complex issue than how the state will stimulate the concessions to invest (construct 13) – and its higher complexity does not arise solely because it has a higher domain grade.
A high domain grade (node degree) of a construct does not necessarily imply high complexity. The construct may be highly homogeneous, that is, its domain grade might lie well within its own issue. If this is the case, the construct communicates minimally with other issues. Such an internally-focused construct/decision is not very complex when compared to a construct that has a high domain grade due to links with other issues. Domain grade on its own, therefore, says very little about complexity. One must always look at the construct’s immediate context in order to come to an informed conclusion about what the domain grade really indicates.
SODA Rule 13: Domain grade (node degree) and complexity
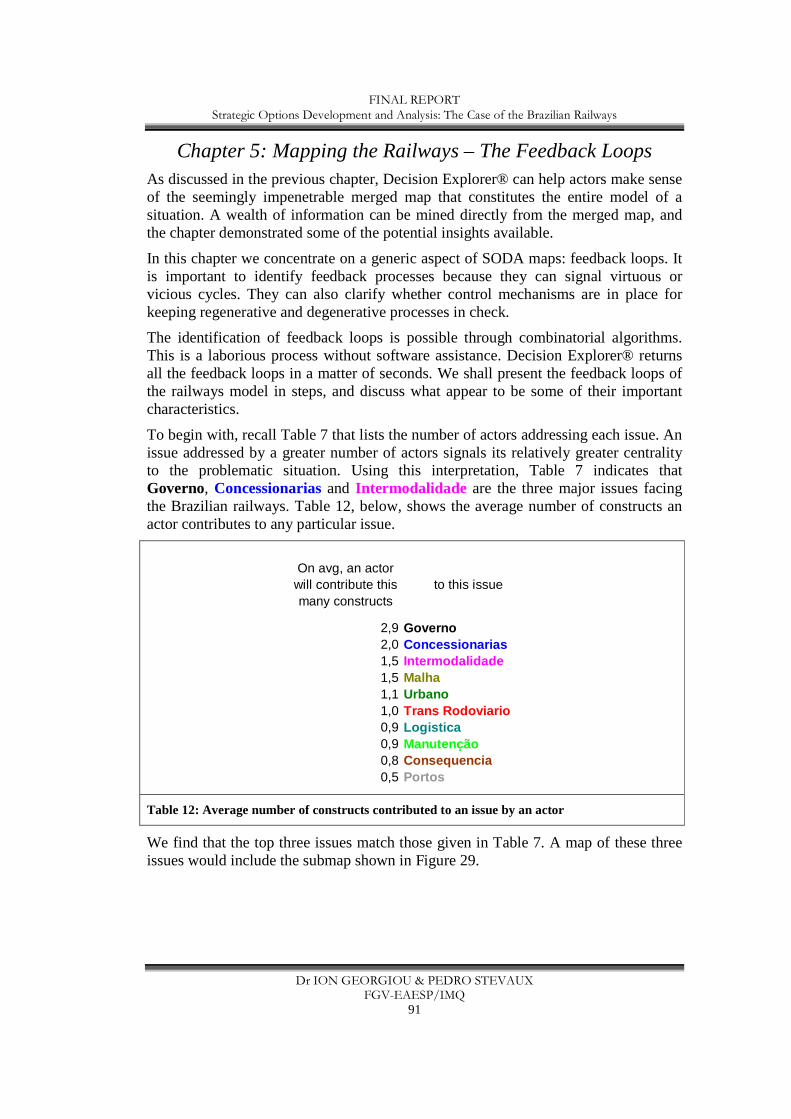
FINAL REPORT Strategic Options Development and Analysis: The Case of the Brazilian Railways
Dr ION GEORGIOU & PEDRO STEVAUX FGV-EAESP/IMQ
91
Chapter 5: Mapping the Railways – The Feedback Loops As discussed in the previous chapter, Decision Explorer® can help actors make sense of the seemingly impenetrable merged map that constitutes the entire model of a situation. A wealth of information can be mined directly from the merged map, and the chapter demonstrated some of the potential insights available.
In this chapter we concentrate on a generic aspect of SODA maps: feedback loops. It is important to identify feedback processes because they can signal virtuous or vicious cycles. They can also clarify whether control mechanisms are in place for keeping regenerative and degenerative processes in check.
The identification of feedback loops is possible through combinatorial algorithms. This is a laborious process without software assistance. Decision Explorer® returns all the feedback loops in a matter of seconds. We shall present the feedback loops of the railways model in steps, and discuss what appear to be some of their important characteristics.
To begin with, recall Table 7 that lists the number of actors addressing each issue. An issue addressed by a greater number of actors signals its relatively greater centrality to the problematic situation. Using this interpretation, Table 7 indicates that Governo, Concessionarias and Intermodalidade are the three major issues facing the Brazilian railways. Table 12, below, shows the average number of constructs an actor contributes to any particular issue.
On avg, an actor will contribute this many constructs
to this issue
2,9 Governo2,0 Concessionarias1,5 Intermodalidade1,5 Malha1,1 Urbano1,0 Trans Rodoviario0,9 Logistica0,9 Manutenção0,8 Consequencia0,5 Portos
Table 12: Average number of constructs contributed to an issue by an actor
We find that the top three issues match those given in Table 7. A map of these three issues would include the submap shown in Figure 29.
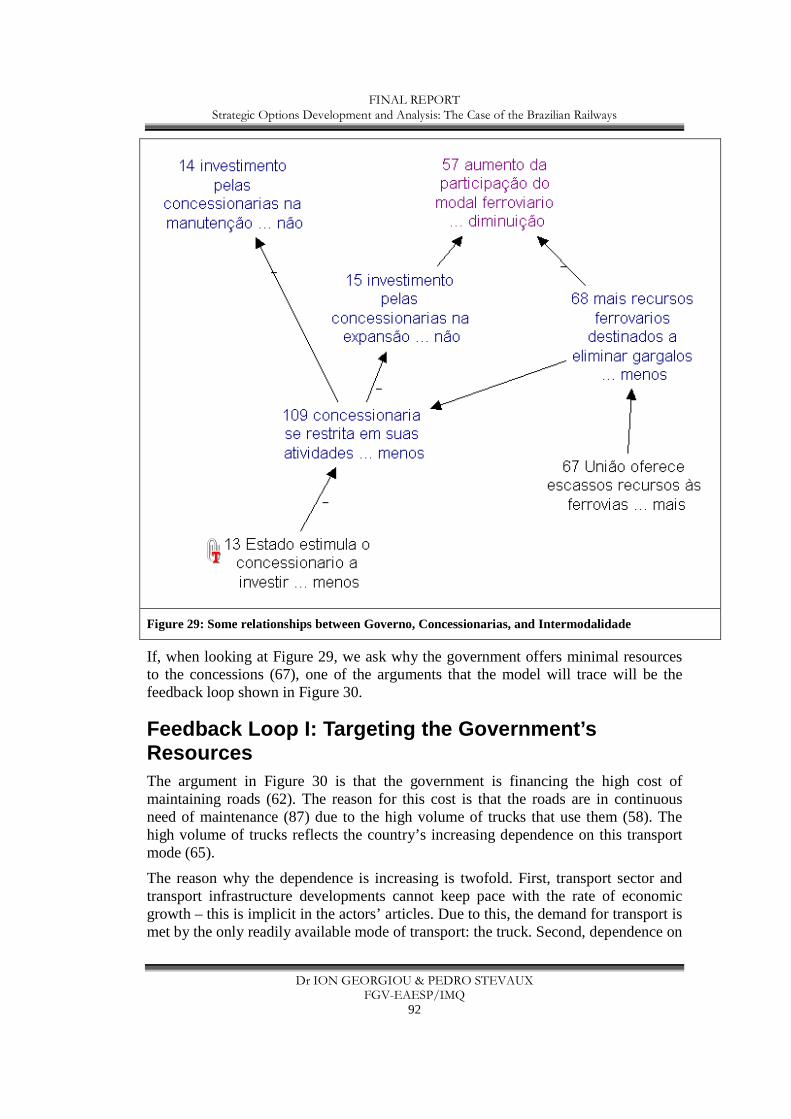
FINAL REPORT Strategic Options Development and Analysis: The Case of the Brazilian Railways
Dr ION GEORGIOU & PEDRO STEVAUX FGV-EAESP/IMQ
92
Figure 29: Some relationships between Governo, Concessionarias, and Intermodalidade
If, when looking at Figure 29, we ask why the government offers minimal resources to the concessions (67), one of the arguments that the model will trace will be the feedback loop shown in Figure 30.
Feedback Loop I: Targeting the Government’s Resources The argument in Figure 30 is that the government is financing the high cost of maintaining roads (62). The reason for this cost is that the roads are in continuous need of maintenance (87) due to the high volume of trucks that use them (58). The high volume of trucks reflects the country’s increasing dependence on this transport mode (65).
The reason why the dependence is increasing is twofold. First, transport sector and transport infrastructure developments cannot keep pace with the rate of economic growth – this is implicit in the actors’ articles. Due to this, the demand for transport is met by the only readily available mode of transport: the truck. Second, dependence on
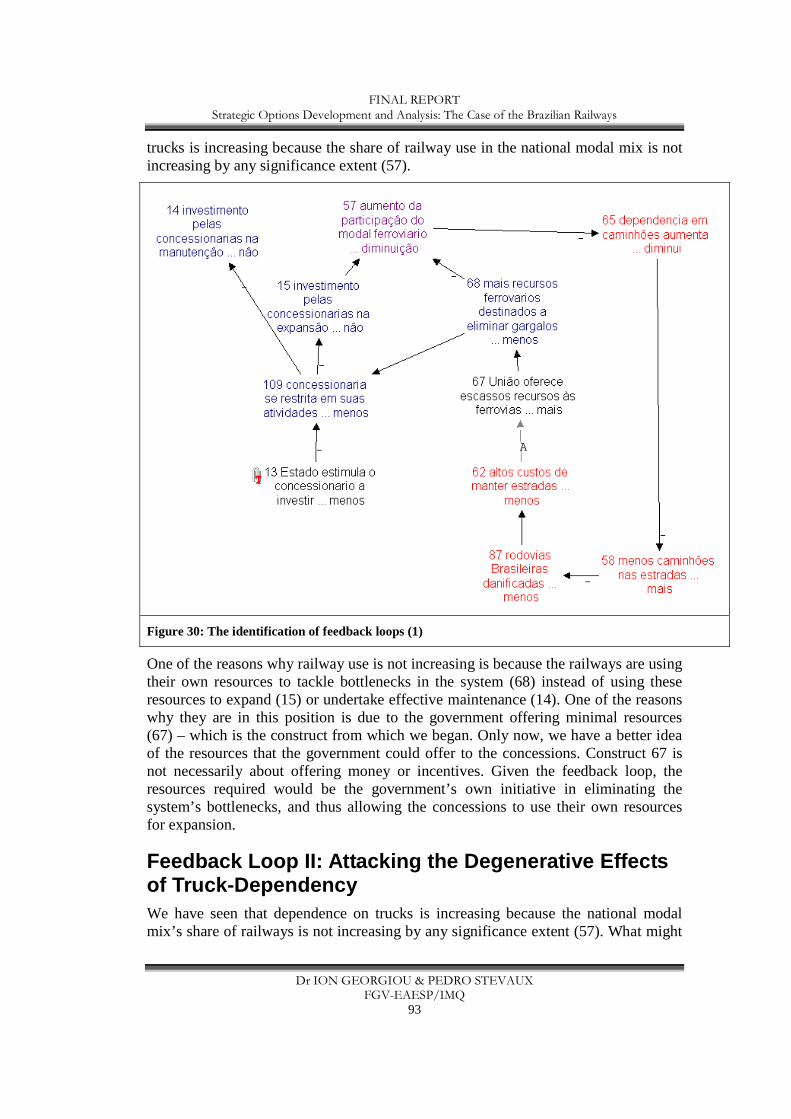
FINAL REPORT Strategic Options Development and Analysis: The Case of the Brazilian Railways
Dr ION GEORGIOU & PEDRO STEVAUX FGV-EAESP/IMQ
93
trucks is increasing because the share of railway use in the national modal mix is not increasing by any significance extent (57).
Figure 30: The identification of feedback loops (1)
One of the reasons why railway use is not increasing is because the railways are using their own resources to tackle bottlenecks in the system (68) instead of using these resources to expand (15) or undertake effective maintenance (14). One of the reasons why they are in this position is due to the government offering minimal resources (67) – which is the construct from which we began. Only now, we have a better idea of the resources that the government could offer to the concessions. Construct 67 is not necessarily about offering money or incentives. Given the feedback loop, the resources required would be the government’s own initiative in eliminating the system’s bottlenecks, and thus allowing the concessions to use their own resources for expansion.
Feedback Loop II: Attacking the Degenerative Effect s of Truck-Dependency We have seen that dependence on trucks is increasing because the national modal mix’s share of railways is not increasing by any significance extent (57). What might
FINAL REPORT Strategic Options Development and Analysis: The Case of the Brazilian Railways
Dr ION GEORGIOU & PEDRO STEVAUX FGV-EAESP/IMQ
94
an increase in railway participation involve? One answer is traced by the feedback loop shown in Figure 31.
Figure 31 shows that one sign of increased railway participation is the emergence of companies that rent wagons (91). This, however, is possible only once the railway system itself is reliable (69): higher reliability brings higher demand which, in turn, brings higher corporate participation in the railways, resulting in wagon rental organizations. A major factor affecting reliability is maintenance (74). Maintenance is currently hindered by a number of factors, one of which is that the system operates with different gauges (30). One of the reasons for this is that the track system is old and in need of upgrades (48). Two reasons why these upgrades are not forthcoming is that the government concentrates too much on roads (67) and the concessions themselves are caught in the bind of tackling bottlenecks (68). By following the outside circle in Figure 31, one easily sees that some of the bottlenecks in question have to do with lack of effective maintenance (74), different gauges (30) and the fact that the track system is in desperate need of modernization (48).
In brief, increasing participation of the railways in the national modal mix requires tackling logistics (69), maintenance (74), and the track system (30, 48). These are not the only areas, to be sure, but they are strategically significant due to their participation in a feedback process. In particular, they may hold the key to reversing the degenerative effects caused by the nation’s dependence on truck transportation (for example, trace the argument from 65 to 68 in Figure 31).
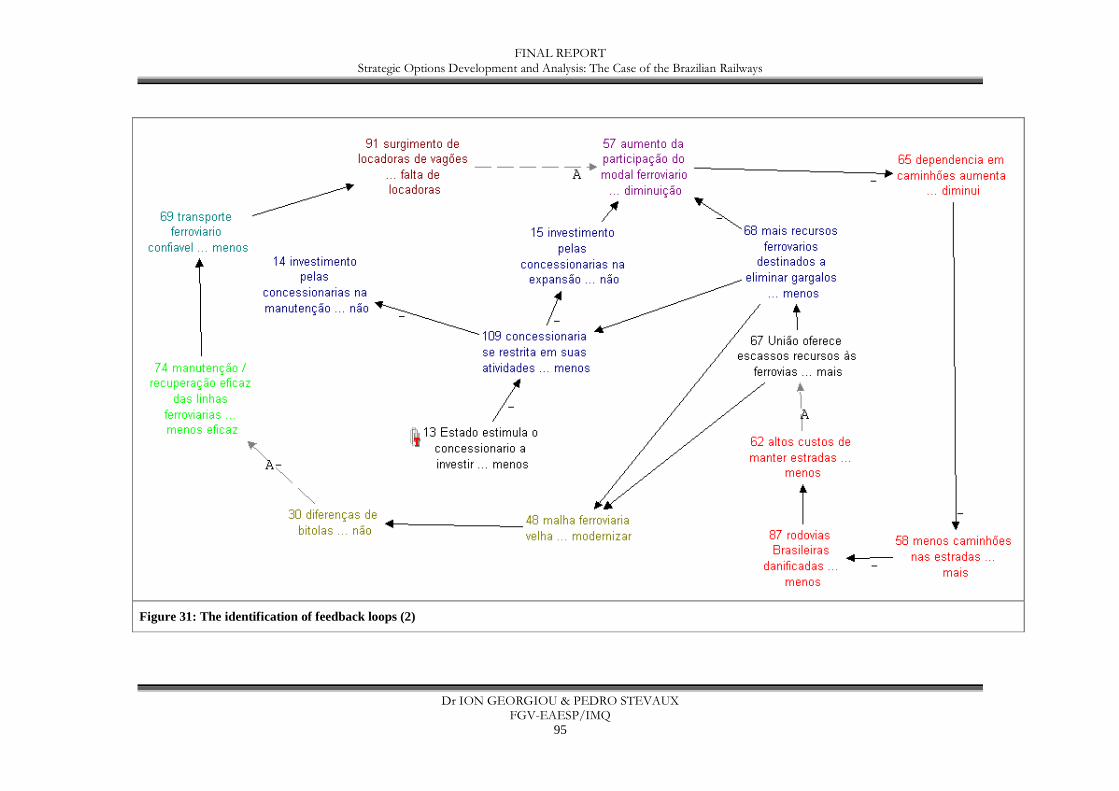
FINAL REPORT Strategic Options Development and Analysis: The Case of the Brazilian Railways
Dr ION GEORGIOU & PEDRO STEVAUX FGV-EAESP/IMQ
95
Figure 31: The identification of feedback loops (2)
FINAL REPORT Strategic Options Development and Analysis: The Case of the Brazilian Railways
Dr ION GEORGIOU & PEDRO STEVAUX FGV-EAESP/IMQ
96
Feedback Loop III: Knowledge Management and Organizational Learning Chapter 4 noted that maintenance is discussed to any significant degree by only one actor: Bollinger. That chapter showed how maintenance commands a fair slice of the prime causes. Here we find that it participates in feedback dynamics. Neither Bollinger, nor any other actor, perceived the dynamics in which maintenance participates as shown in Figure 31. Collectively, however, their individual maps do provide this insight – giving us yet another reason to promote the use of SODA mapping in complex problem solving. But what exactly does effective maintenance entail? One answer is given in Figure 32, a figure that multiplies the number of feedback loops by simply adding a few causes to construct 74.
Although effective maintenance depends on many factors, four are of especial significance to the Brazilian railways due to their participation in uncontrolled degenerative dynamics. To begin with, there is a lack of human resources possessing the experience and knowledge required to plan and implement effective maintenance practices (77). This signals the need to perhaps import such staff in the short term, and to begin training programs that will build national abilities over the longer term. Second, there is a lack of available information in technical, economic, and environmental matters that can assist effective maintenance practice (76). Bollinger emphasizes the need to systematize such information, by which he means, both, make it available in digital format as well as standardize its content or presentation. Third, currently maintenance comes in the form of emergency interventions, instead of planned preventative practice (90). Such a prolonged crisis management approach stifles any attempt at introducing standard, regular and frequent maintenance practices.
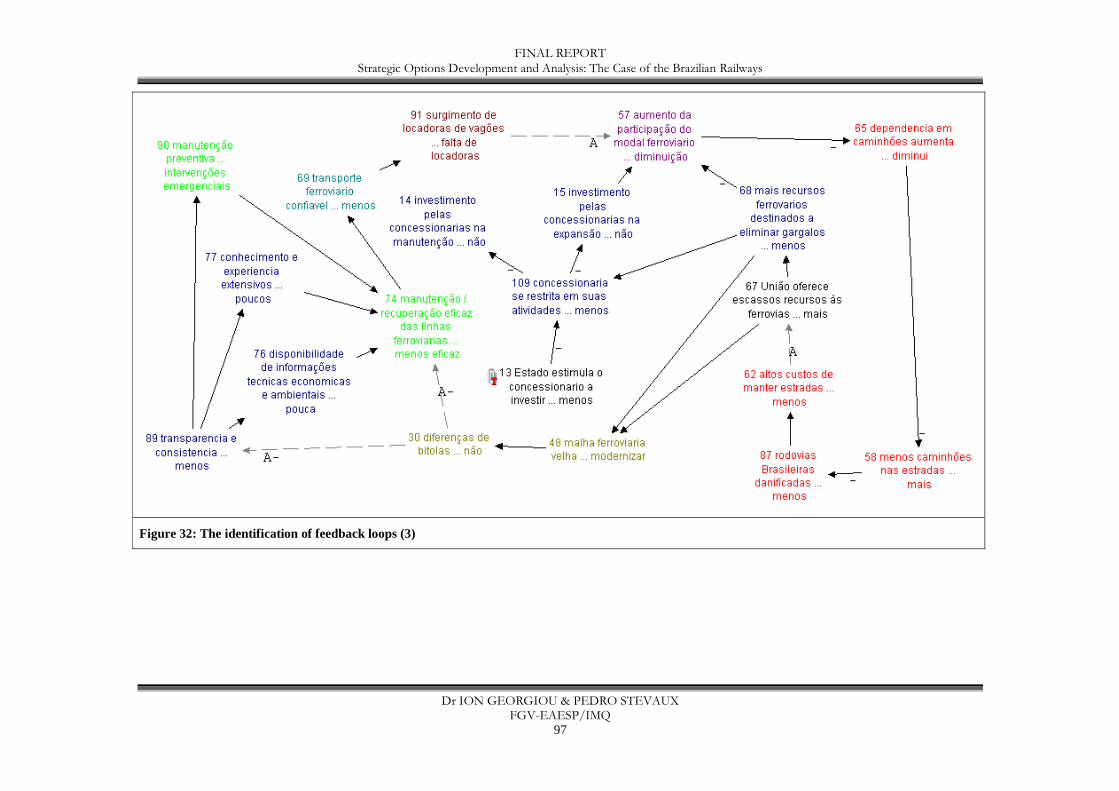
FINAL REPORT Strategic Options Development and Analysis: The Case of the Brazilian Railways
Dr ION GEORGIOU & PEDRO STEVAUX FGV-EAESP/IMQ
97
Figure 32: The identification of feedback loops (3)
FINAL REPORT Strategic Options Development and Analysis: The Case of the Brazilian Railways
Dr ION GEORGIOU & PEDRO STEVAUX FGV-EAESP/IMQ
98
Constructs 77, 76 and 90 are, therefore, three direct causes impacting upon the possibility of effective maintenance (74). Behind them, however, lies a fourth, perhaps more subtle factor: the current system lacks transparency and consistency (89). The feedback loops in Figure 32 identify the gauge differences as one contributory factor (30). Undoubtedly, gauge differences within one system do little to promote transparency, let alone consistency. And, given the participation of construct 30 in a set of degenerative feedback processes, the impact of such differences should not be minimized. Indeed, the model makes explicit the string of numerous decisions required to fix the gauge problem. These are shown in Figure 33.
The figure is a mapping of all the causes of construct 89. It sheds light on the other factor impacting transparency and consistency: knowledge management and organizational learning in the Brazilian railways lacks stable and impersonal criteria (83). The very words used – stable and impersonal – point to a disturbing picture. Lack of stability in learning practices and knowledge management signals lack of effective strategic planning, in other words, implementable strategic planning. A lack of impersonal criteria hints at a divided system, whereby subsystems look after their own interests, usually to the detriment of the whole. Indeed, reading through the articles collected for this research, one gets a feeling that the system does not work as one. Concessions have to compete for track use, indeed buy track use from each other; only certain concessions have port access; different concessions operate different gauges, etc etc. It might well be that the entire railways system itself requires redesign! This, of course, assumes that the designers want it to work as one system.
Feedback Loop IV: False Stimuli or False Model? This research can raise these questions, but cannot pretend to answer them. Instead, we move on to the final set of feedback loops. They are found when asking how it is that the state can stimulate the concessions to invest (13). Figure 34 shows that one way that the state stimulates the concessions to invest is by relieving them of having to report depreciation in their accounts (16). Now, by the relationships governing constructs 13 and 109, we see that the stimulation is related to the concessions being able to undertake commercial activities with minimal restriction. The two primal activities in question are investment in expansion (15) and investment in maintenance (14). By following any loop that goes through construct 68, the model shows that the investment in question is not happening as desired. Moreover, due to this lack of investment, especially in maintenance (14), railway equipment has a relatively shorter shelf life (17). A lack of effective maintenance more than probably leads to the equipment having a shelf life that is shorter than its usual depreciation rate. What is going on here?
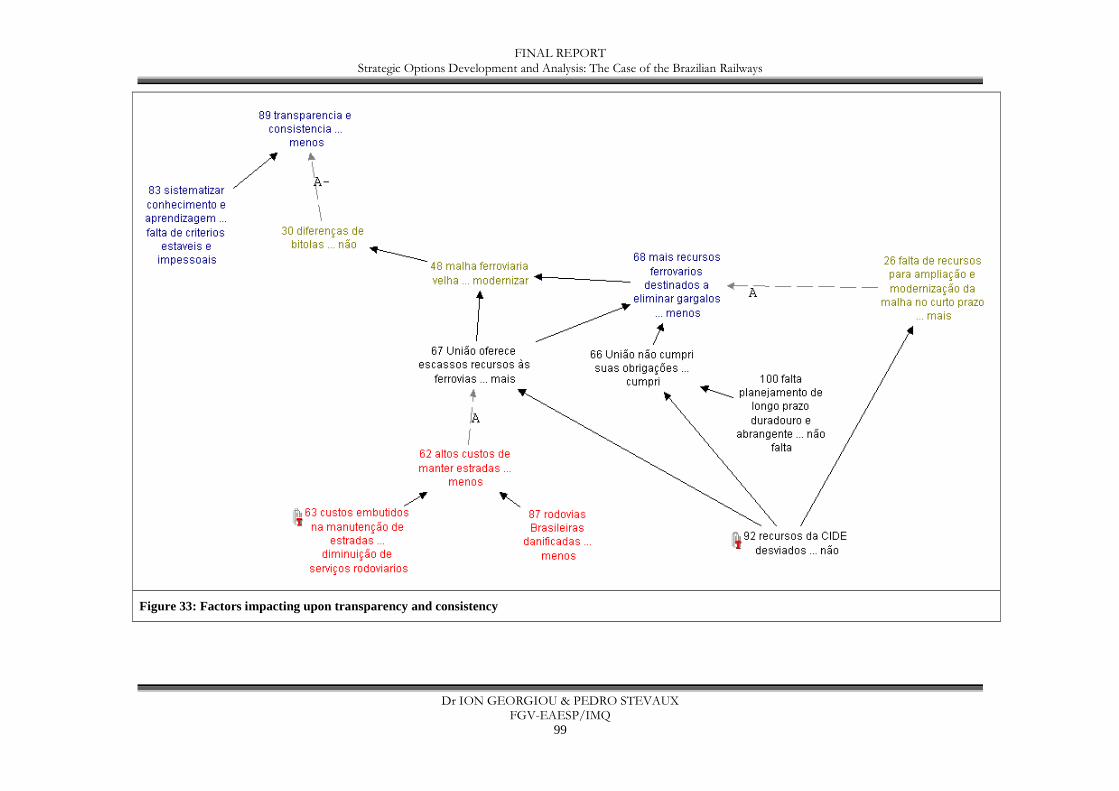
FINAL REPORT Strategic Options Development and Analysis: The Case of the Brazilian Railways
Dr ION GEORGIOU & PEDRO STEVAUX FGV-EAESP/IMQ
99
Figure 33: Factors impacting upon transparency and consistency
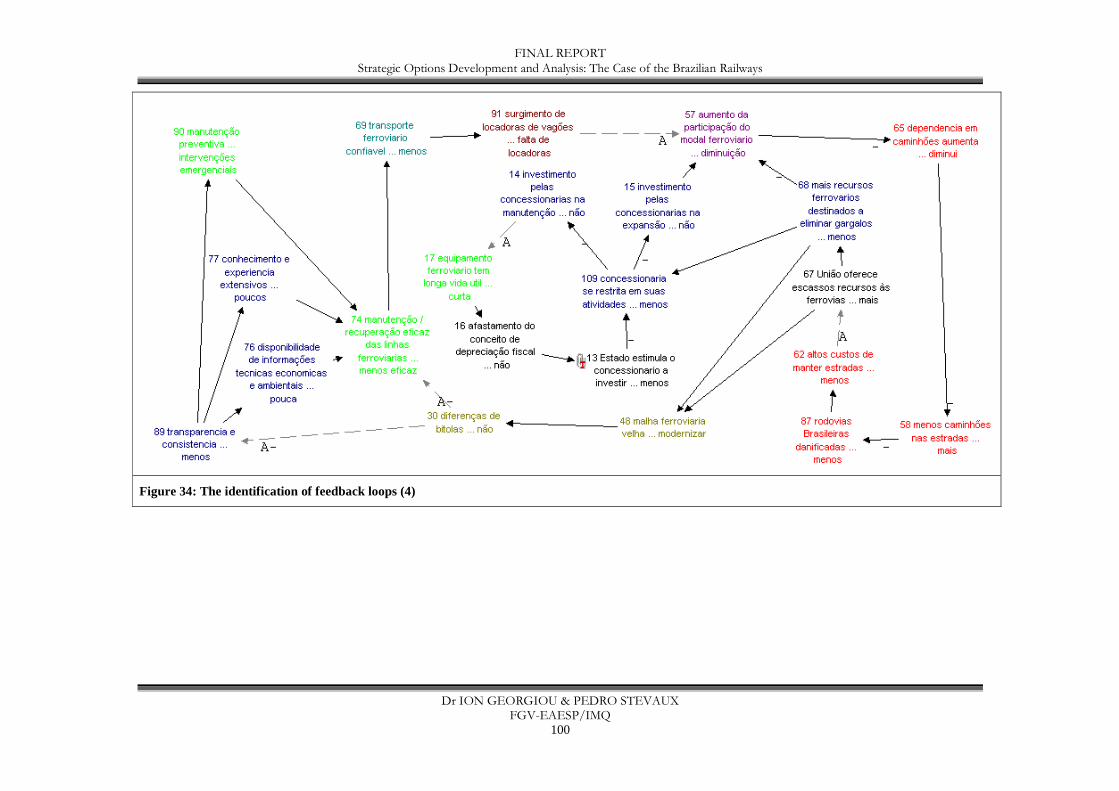
FINAL REPORT Strategic Options Development and Analysis: The Case of the Brazilian Railways
Dr ION GEORGIOU & PEDRO STEVAUX FGV-EAESP/IMQ
100
Figure 34: The identification of feedback loops (4)
FINAL REPORT Strategic Options Development and Analysis: The Case of the Brazilian Railways
Dr ION GEORGIOU & PEDRO STEVAUX FGV-EAESP/IMQ
101
The railways are not required to report depreciation in their books. This means that a piece of obsolete equipment is actually reported as good as new in the books. To what degree does the government’s waiver of reporting depreciation (16) stimulate the concessions to invest (13) when their own books show no depreciation? If the concessions cannot invest in maintenance (14), why do they accept the waiver, knowing that their books provide a highly distorted picture of the reality of the state of their equipment?
In his article, De Lima argues that, due to the longevity of railway equipment, the government has waived the need to report depreciation. This assumes that the equipment will indeed be useful for the time span for which it has been designed. As with all equipment, that time span assumes certain maintenance practices. De Lima, in other words, paints the positive side of the picture. The merged map, on the other hand, constituted by the views of all the actors, paints a different view, and this is highlighted in Figure 34. Indeed, given that the concessions have such a hard time in investing in maintenance, the model’s use of contrasting poles in constructs makes clear that the government should not waive depreciation!
Feedback Loops: Preliminary Opinion on their Influence Whether this is a flaw in the model or whether it sheds light on faulty policy is a matter for future research. What the present model highlights is the following. The merged map has 35 loops constituted by 22 constructs. They are all shown in Figure 34. All loops are degenerative and none exhibit controlling mechanisms. This means that about 25% of the entire model is governed by a degenerative dynamic, spiraling into an abyss. From the context of the situation, we can conclude that, within these loops, four constructs are highly uncertain (13, 74, 69, 14). Another six constructs are highly problematic (89, 76, 77, 90, 15, 58). In other words, the degenerative loops are compounded by the presence of especially uncertain and problematic factors. Moreover, due to their feedback nature, the resolution of the 35 loops into a regenerative dynamic is only possible if all 22 constructs are decided upon simultaneously. Feedback processes do not allow for step-by-step decision making – one must treat them as a whole.
A broad interpretation lends itself. Railway planning in Brazil always seems to begin with positive ideas. One recent example comes from the Lula government that has explicitly affirmed its vision of a nation with a strong railway network. All nationwide railway plans, however, have thus far failed to reach anywhere near what may be called implementation. One reason for this might be that sooner or later the plan hits the combination of degenerative feedback loops uncovered here. Lacking any control mechanisms, the plan gets swept into the ‘black hole’ of degenerative feedback and collapses. Might it be that railway planning for the nation has yet to fully understand and account for feedback dynamics that persistently work against it?
Finally, when we discussed the 9 heads/objectives of the map, earlier, we noted that one objective of railway development is the diminuição de filas de caminhões –

FINAL REPORT Strategic Options Development and Analysis: The Case of the Brazilian Railways
Dr ION GEORGIOU & PEDRO STEVAUX FGV-EAESP/IMQ
102
construct 59 (see Figure 16). We noted then, in passing, that although this objective is desirable, it is more complex than one might think. Indeed, it provides a case in point in how complex a seemingly simple objective actually is. In order to appreciate this, consider that it is the product of all of the 35 feedback loops in the model! This is shown in Figure 35. We leave this figure as a final point upon which the reader may contemplate the challenges facing railways development in Brazil.
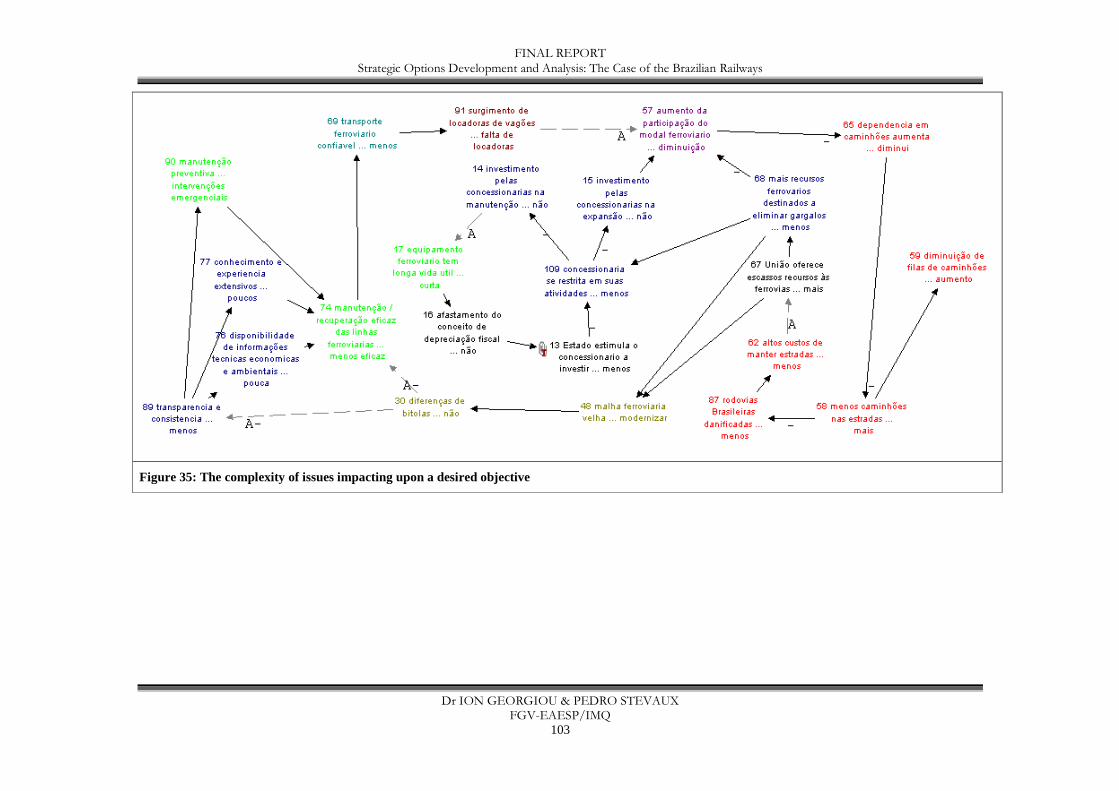
FINAL REPORT Strategic Options Development and Analysis: The Case of the Brazilian Railways
Dr ION GEORGIOU & PEDRO STEVAUX FGV-EAESP/IMQ
103
Figure 35: The complexity of issues impacting upon a desired objective
FINAL REPORT Strategic Options Development and Analysis: The Case of the Brazilian Railways
Dr ION GEORGIOU & PEDRO STEVAUX FGV-EAESP/IMQ
104
Chapter 6: Critical Reflections In this report we have attempted to provide as rich a picture as we can given the project deadline. The previous chapters have provided methodological insights and guidance on the use of SODA. They have discussed what appear to us to be poignant issues facing the railways in Brazil, based on the results of our model and our basic understanding of the railways situation in the country. We insist that we are not railway experts. We merely present an attempt that might help the Brazilian railways develop, and this attempt is based on our expertise in one particular decision support methodology. Any one model, any one set of experts, will always bring their own cards to the table. We have brought ours and given an introductory view to what may be achievable using the SODA approach, namely, the provision of reliable decision support that may help key decision and policy makers make more confident decisions. The risks are always there. The key is to minimize them through better decision support.
With this in mind, we believe that future research will benefit through the following improvements. First, there are two many opposite poles in our constructs. The key is to have contrasting poles, not opposing ones. A mere ‘no’ as a contrasting pole says nothing about what the primary pole means – and this was discussed at length earlier. The reason for having too many opposing poles in our model is due to its use of documentation instead of interviews. With interviews, interviewees can be asked penetrating questions that can generate more effective contrasting poles. We did not have that luxury. On the other hand, there is no question that the present maps serve as a good tool for focusing interviews. They can be shared with interviewees with a view to construct maps whose constructs are more useful in terms of contrasting poles.
Second, with problem structuring methods, one always faces the question of how reliable the analyst’s interpretation and judgment really are. Qualitative research in general is plagued by this question. We have tried to provide an answer by beginning this report with a mathematical, graph-theoretical approach to the problem. The aim was to show that even mathematical interpretation and judgment cannot escape the charges leveled at qualitative models. Indeed, we believe the question is unanswerable. One hires or listens to those one thinks are trustworthy. Trust is built on transparency and solid methodology. We have provided a transparent, solid methodology that has given interesting results, as well as reflected aspects of reality. We therefore trust that what has been offered is worth considering.
Finally, despite the advantages of Decision Explorer software, it lacks an effective interface with Excel and other graph theoretic software packages. This resulted in more manual work than should be required, given the possibilities on offer by technology today. We are strong advocates for a software package that can provide simultaneous mapping, spreadsheet results, and graph theoretic analyses. Our manual work demonstrated in this report is testament to the possibilities. Since technology exerts such a strong influence on the marketing success of methodologies, research in this area is strongly advised.

FINAL REPORT Strategic Options Development and Analysis: The Case of the Brazilian Railways
Dr ION GEORGIOU & PEDRO STEVAUX FGV-EAESP/IMQ
105
Appendix 1 – scanned copies of all articles used
FINAL REPORT Strategic Options Development and Analysis: The Case of the Brazilian Railways
Dr ION GEORGIOU & PEDRO STEVAUX FGV-EAESP/IMQ
106
REVISTA FERROVIÁRIA/NOVEMBRO 2005 p.35
ARTIGO O Futuro das Concessionárias do Modal Ferroviário no Brasil
Marco Antonio Oliveira Neves, Diretor da Tigerlog Consultoria, Hunting e Treinamento em Logística Ltda
Em 2006 completaremos 10 anos de privatização da malha ferroviária brasileira. Em 1992, o Governo Federal anunciou a privatização da rede ferroviária e no final de 1995 foi iniciado o processo de desestatização das ferrovias brasileiras. De lá para cá, apesar das dificuldades enfrentadas, há muito que comemorar. Maiores investimentos no setor e uma melhor gestão têm proporcionado excelentes resultados, refletindo diretamente no aumento da produtividade operacional, na oferta de transporte e na redução dos acidentes. Ainda muito dependente do minério de ferro e da soja, que respondem por 65% do total transportado, o modal ferroviário tem muito a crescer e se desenvolver, principalmente como via de escoamento de produtos de baixo a médio valor agregado destinados à exportação. O comércio internacional representa apenas 25% do nosso PIE, enquanto que países vizinhos como Chile e México apresentam indicadores acima de 50%. Apesar de termos ultrapassado a barreira histórica de US$ 100 bilhões exportados em 12 meses em fevereiro deste ano e estimarmos atingir US$ 117 bilhões em 2005, ainda há muito para crescermos. As vendas externas mundiais deverão chegar a US$ 10 trilhões neste ano, e o Brasil, 12ª maior economia do mundo, representará apenas 1% desse total. Alemanha e Estados Unidos, líderes mundiais no comércio internacional, exportam de seis a sete vezes mais que o Brasil. Embora o modal ferroviário represente cerca de 21% do total transportado no Brasil, ainda estamos muito distantes da realidade de outros países de dimensões continentais. Nos Estados Unidos, o modal representa 43% do total transportado, enquanto na Rússia atinge 81%, no Canadá 46% e na Austrália 43%. Especialistas em transportes apontam que a matriz de transportes deveria privilegiar o modal ferroviário, sendo este responsável por 35% do total transportado, enquanto que o rodoviário e o hidroviário ficariam com cerca de 25% cada e os outros modais com 15%. O desequilíbrio na distribuição das cargas entre os diversos modais no Brasil gera um custo adicional de frete de aproximadamente US$5 bilhões anuais, que só não é ainda maior em função do baixo preço do frete praticado no modal rodoviário. No Brasil, o frete rodoviário é, em geral, de 50% a 80% mais caro que o frete ferroviário; nos países desenvolvidos esse percentual pode chegar a 300%. Estima- se que em alguns casos, o frete rodoviário esteja de duas a três vezes defasado. Nos Estados Unidos, um dos raros exemplos de uma matriz de transportes extremamente equilibrada, o modal ferroviário atua em produtos de baixo a moderado valor, em viagens com distâncias médias entre 900km e 1.300 km, com quatro a sete dias de prazo de entrega e com 60% a 85% de performance de entrega no prazo. No Brasil há uma competição direta entre o modal ferroviário e o modal rodoviário, e a distância média percorrida nas viagens estão ao redor de 500 km a 600 km, e, diferentemente do que se verifica nos Estados Unidos, a ferrovia no Brasil perde espaço nas longas distâncias, onde justamente deveria apresentar condições econômicas mais competitivas. Ainda existem diversos obstáculos a serem vencidos, como a falta de recursos para ampliação e modernização da malha ferroviária no curto prazo, a falta de regulamentação do direito de passagem e tráfego mútuo, passagens em nível, a invasão das faixas de domínio, as passagens em centros urbanos e as diferenças de bitolas. Apesar da morosidade e do descaso governamental, a ANTF e seus associados vêm se mobilizando para superar as dificuldades existentes e, dentro de seus limites, estão realizando as melhorias possíveis. As três principais concessionárias do modal ferroviario, CVRD, MRS e ALL, embora já estejam entre as cinco maiores empresas de logística do Brasil, reunirão todas as condições necessárias para se consolidar entre os maiores prestadores de serviços logísticos do continente e do mundo, inclusive colocando-se em posição de igualdade competitiva para enfrentar os operadores logísticos internacionais. Além dos investimentos necessários em infra-estrutura, essas empresas estão se notabilizando pelas ações na atração, desenvolvimento e retenção de talentos profissionais, condição essencial para este mercado. Grandes clientes, alvos prioritários dessas empresas, estão buscando provedores logísticos one stop shop, ou seja, empresas capacitadas a atendê-los em toda a sua cadeia logística, seja com infra-estrutura própria ou com parceiros logísticos estrategicamente selecionados. Será preciso atuar em todos os modais e com ampla cobertura geográfica, inclusive globalmente, e em diversas configurações operacionais, disponibilizando serviços relacionados à inteligência logística e ao uso de ativos operacionais. Também serão necessários maiores investimentos em tecnologia, para oferecer maior visibilidade das entregas e dos estoques para os seus clientes. As próximas décadas, sem dúvida alguma, serão marcadas pela ascensão e hegemonia da CVRD, MRS e ALL. A legislação que cria a figura do OTM — Operador de Transporte Multimodal, apenas reforçará a atuação dos concessionários das ferrovias como provedores e integradores logísticos e se mecanismos regulatórios de oferta e demanda não forem implantados no modal ferroviário pelo governo (pouco provável em minha opinião), estarão definitivamente seladas as bases para um crescimento sustentado no médio e longo prazo.

FINAL REPORT Strategic Options Development and Analysis: The Case of the Brazilian Railways
Dr ION GEORGIOU & PEDRO STEVAUX FGV-EAESP/IMQ
107
O trem continuará avançando sobre o caminhão, bem como as concessionárias atuarão em toda cadeia logística, disponibilizando serviços de gestão não atrelados aos ativos operacionais. Apenas erros estratégicos internos poderão detê-los, ou seja, seus maiores adversários serão si próprios!
FINAL REPORT Strategic Options Development and Analysis: The Case of the Brazilian Railways
Dr ION GEORGIOU & PEDRO STEVAUX FGV-EAESP/IMQ
108
RF Fev 2006 p. 49 ARTIGO Colocando ordem na casa Bento José de Lima - Diretor da Sysfer Consultoria e Sistemas
Gestão patrimonial nunca foi tema capaz de cativar ferroviários. Ontem, fazer andar trens era um apelo bem mais forte e atraente. Hoje, produzir resultados é o que consome os executivos das concessionárias dos serviços de transporte ferroviário. Os motivos são outros, porém os resultados os mesmos: atenção insuficiente com os ativos.
Ocorre que, agora, gestão patrimonial é um problema mais complexo do que antes. Primeiramente as concessionárias operam com ativos arrendados, com os quais não é possível fazer “qualquer coisa” sem perguntar para o dono se o mesmo concorda e permite. Em seguida, introduziu-se o conceito de reversibilidade do bem, significando que o mesmo, ou seu substituto, necessário para a prestação do serviço concedido, será sempre um próprio do Estado, assegurando a continuidade do serviço em qualquer situação.
Finalmente, os contratos de concessão estendem o conceito da reversão para os investimentos realizados nos bens operacionais. Deste modo, controlar bens arrendados, novos ou incorporados, e investimentos neles realizados são interesses tanto dos seus proprietários, como daqueles que os utilizam.
As incorporações e os investimentos em bens operacionais sujeitam-se a procedimentos que devem estimular o concessionário a repor, modernizar e incorporar novas locomotivas, vagões, etc. Aqualquer tempo, tendo a certeza de que será possível devolver um bem arrendado no qual investiu, quando isto for comercialmente conveniente para si ou necessário sob o ponto de vista do Estado, sem que isto traga prejuízo para seus negócios ou para a continuidade dos serviços, o que certamente interessa também ao Poder Concedente.
Portanto, a gestão do patrimônio operacional é algo que interessa a ambas as partes envolvidas, Poder Concedente e concessionário. No décimo ano de vigência das concessões estima-se que mais de 2 bilhões de reais foram investidos pelas concessionárias das ferrovias brasileiras. A maioria destes investimentos ocorreram na recuperação, modernização e incorporação de bens operacionais ao acervo produtivo das empresas, portanto, em bens classificados nos contratos como reversíveis.
A primeira indagação que fica é: as concessionárias se habilitaram a ter os valores destes investimentos reconhecidos como reversíveis, como indica o inciso I da Cláusula Décima Sexta dos Contratos de Concessão? A resposta é: Não! A justificativa é: o prazo de depreciação é de 10 anos; por tanto, esta preocupação é prematura.
Tal compreensão do problema não se coaduna com o que dispõe o item III da mesma Cláusula Décima Sexta, que introduz, diga-se de passagem sabiamente, o conceito de avaliação técnica e financeira para fins de estabelecimento do valor residual dos bens indenizáveis, determinando, para este fim, o afastamento do conceito de depreciação fiscal, normalmente limitado a 10 anos, no máximo.
Certamente o descolamento destes conceitos levou em consideração a evidência de que o equipamento ferroviário tem uma vida útil produtiva muito maior e o que interessava, e continua interessando, ao Estado é a manutenção do conforto do concessionário para investir na manutenção e na expansão dos ativos operacionais, necessários para a prestação dos serviços concedidos.
Deste modo, o que se afigura é a necessidade, desde já, de desenvolver os procedimentos necessários para ver reconhecidos como reversíveis os investimentos realizados pelas concessionárias, estabelecer a vida útil técnica dos equipamentos e dos investimentos, para só então, através de sistemas de controle de gestão, acompanhar a evolução dos investimentos/incorporações e da vida útil, que fornecerão, a qualquer tempo, os valores indenizáveis em função da reversão, que pode ocorrer, como já tem acontecido, por outros motivos que não apenas o fim da concessão por esgotamento do prazo ou caducidade.
A ANTF, através de suas comissões técnicas, já percebeu a extensão e a complexidade da questão e abriu o diálogo com a ANTT, que por sua vez já discutia internamente o assunto, demonstrando preocupação na manutenção de condições favoráveis para manter o estímulo ao investimento dos concessionários no começo, no meio ou ao final do período da concessão.
Se o processo de concessionamento das ferrovias de carga não foi perfeito, dada a velocidade indispensável quando de sua realização, não é menos verdade que previu conceitos e brechas para que o tempo e a gestão cuidadosa fosse introduzindo as correções necessárias.

FINAL REPORT Strategic Options Development and Analysis: The Case of the Brazilian Railways
Dr ION GEORGIOU & PEDRO STEVAUX FGV-EAESP/IMQ
109
É o que está ocorrendo! No campo do transporte ferroviário de passageiros, problemas análogos existem, como no caso do Rio de Janeiro, onde sua exploração já foi concedida à iniciativa privada. Não seria o caso da ASEP, Central, Supervia e Opportrans examinarem estes procedimentos e virem a adotá-los?
FINAL REPORT Strategic Options Development and Analysis: The Case of the Brazilian Railways
Dr ION GEORGIOU & PEDRO STEVAUX FGV-EAESP/IMQ
110
Revista Ferroviária - Março 2006 p37
ARTIGO Nos trilhos do desenvolvimento
Ralf Dreckmann Diretor-executivo da Voith Turbo
O crescimento econômico é um dos fatores que garantem a um País condições para investir na oferta de educação, saúde, emprego, tecnologia e outros itens que asseguram qualidade de vida a sua população. Para crescer, a existência de uma infra-estrutura de base sólida, ou seja, recursos energéticos e de transporte adequados, é fundamental.
O Brasil tem problemas sérios de infra-estrutura, que podem em breve afetar a capacidade produtiva e comprometer ainda mais o crescimento econômico, que já não foi dos melhores em 2005 — 2,3% de PIB é muito pouco se comparado aos resultados de países como China e Índia, que apresentaram índices de 9% e 7% de crescimento respectivamente. Um dos gargalos mais perceptíveis é a necessidade de ampliação e diversificação dos meios de transportes da população e da produção industrial e agrícola nacional.
De nada adianta ter recordes consecutivos na produção de grãos e minérios, se não há recursos adequados e seguros para fazer os produtos chegarem em tempo hábil aos portos e consumidores finais. Há mais de 50 anos, o País decidiu apostar grande parte de suas fichas no setor rodoviário e hoje sofre com a falta de recursos financeiros para manter as estradas existentes e ampliar as rotas para as regiões mais afastadas. Mesmo com as privatizações, a precariedade do sistema rodoviário é evidente.
Veja-se o investimento de R$ 440 milhões só para restaurar o asfalto em 26,5 mil quilômetros de rodovias, O transporte rodoviário tem suas vantagens, mas seus custos de manutenção e de ampliação são mais elevados, especialmente se considerados custos embutidos como policiamento, serviços de emergência, engenharia de tráfego, recuperação dos feridos, congestionamento e poluição nas grandes cidades.
O modal ferroviário também contempla as necessidades continentais brasileiras e seu custo de implementação é menor. Apesar disto, as ferrovias foram esquecidas por quase meio século. Dos 34 mil quilômetros de estrada de ferro existentes em 1940, hoje só temos 30 mil em funcionamento, mesmo considerando-se os investimentos privados realizados nos últimos 10 anos, e esse trecho é responsável pelo transporte de 23% da produção do País a custos mais acessíveis. Imagine os ganhos em termos de agilidade e de custos se aplicações no setor fossem mais efetivas, tanto para transporte de cargas como de pessoas. No Brasil, a situação começa a melhorar no segmento de cargas, a produtividade ferroviária cresceu 94% na última década, graças aos investimentos realizados principalmente pelo setor privado.
Um dos maiores indicativos do interesse do Governo Federal e das empresas privadas é o aquecimento na produção fabril brasileira de vagões e locomotivas já para atender os poucos quilômetros de ferrovias. Empresas com a ALL e MRS Logística já compraram em 2005 cerca de 7500 vagões. O transporte de cargas no setor, no mesmo período, foi de 400 milhões de toneladas. O BNDES também já sinalizou positivamente com mais de R$ 1 bilhão para as empresas do setor. Falta agora somente retomar o transporte de passageiros, o que certamente amenizaria os problemas de congestionamento das grandes cidades.
Até 2008, o governo brasileiro e o setor privado pretendem investir juntos R$ 11,3 bilhões e acreditam que vão tirar o setor do atraso. Em função das dimensões do nosso País, acredito que precisaremos investir mais, porém o retorno certamente será compensador, desde que sejam realizados simultaneamente os investimentos necessários na ampliação e melhor operacionalização dos portos. Outra questão a ser analisada é que até agora foram privilegiadas rotas comerciais já estabelecidas, não existindo esforços para atender novas fronteiras agrícolas e industriais ou oferecer transporte público de qualidade para os cidadãos. Talvez seja necessário movimentação maior de indústriais, produtores e da sociedade para que os trilhos realmente comecem a ter maior representação dentro da matriz de transportes.
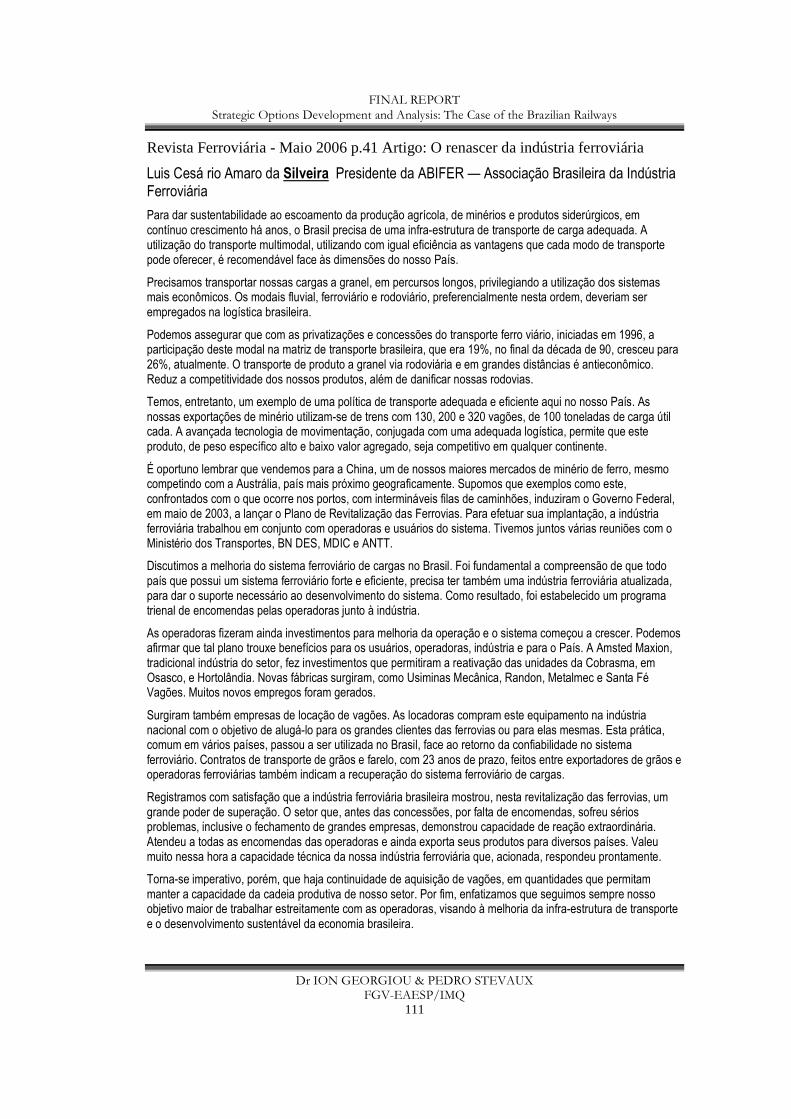
FINAL REPORT Strategic Options Development and Analysis: The Case of the Brazilian Railways
Dr ION GEORGIOU & PEDRO STEVAUX FGV-EAESP/IMQ
111
Revista Ferroviária - Maio 2006 p.41 Artigo: O renascer da indústria ferroviária
Luis Cesá rio Amaro da Silveira Presidente da ABIFER — Associação Brasileira da Indústria Ferroviária
Para dar sustentabilidade ao escoamento da produção agrícola, de minérios e produtos siderúrgicos, em contínuo crescimento há anos, o Brasil precisa de uma infra-estrutura de transporte de carga adequada. A utilização do transporte multimodal, utilizando com igual eficiência as vantagens que cada modo de transporte pode oferecer, é recomendável face às dimensões do nosso País.
Precisamos transportar nossas cargas a granel, em percursos longos, privilegiando a utilização dos sistemas mais econômicos. Os modais fluvial, ferroviário e rodoviário, preferencialmente nesta ordem, deveriam ser empregados na logística brasileira.
Podemos assegurar que com as privatizações e concessões do transporte ferro viário, iniciadas em 1996, a participação deste modal na matriz de transporte brasileira, que era 19%, no final da década de 90, cresceu para 26%, atualmente. O transporte de produto a granel via rodoviária e em grandes distâncias é antieconômico. Reduz a competitividade dos nossos produtos, além de danificar nossas rodovias.
Temos, entretanto, um exemplo de uma política de transporte adequada e eficiente aqui no nosso País. As nossas exportações de minério utilizam-se de trens com 130, 200 e 320 vagões, de 100 toneladas de carga útil cada. A avançada tecnologia de movimentação, conjugada com uma adequada logística, permite que este produto, de peso específico alto e baixo valor agregado, seja competitivo em qualquer continente.
É oportuno lembrar que vendemos para a China, um de nossos maiores mercados de minério de ferro, mesmo competindo com a Austrália, país mais próximo geograficamente. Supomos que exemplos como este, confrontados com o que ocorre nos portos, com intermináveis filas de caminhões, induziram o Governo Federal, em maio de 2003, a lançar o Plano de Revitalização das Ferrovias. Para efetuar sua implantação, a indústria ferroviária trabalhou em conjunto com operadoras e usuários do sistema. Tivemos juntos várias reuniões com o Ministério dos Transportes, BN DES, MDIC e ANTT.
Discutimos a melhoria do sistema ferroviário de cargas no Brasil. Foi fundamental a compreensão de que todo país que possui um sistema ferroviário forte e eficiente, precisa ter também uma indústria ferroviária atualizada, para dar o suporte necessário ao desenvolvimento do sistema. Como resultado, foi estabelecido um programa trienal de encomendas pelas operadoras junto à indústria.
As operadoras fizeram ainda investimentos para melhoria da operação e o sistema começou a crescer. Podemos afirmar que tal plano trouxe benefícios para os usuários, operadoras, indústria e para o País. A Amsted Maxion, tradicional indústria do setor, fez investimentos que permitiram a reativação das unidades da Cobrasma, em Osasco, e Hortolândia. Novas fábricas surgiram, como Usiminas Mecânica, Randon, Metalmec e Santa Fé Vagões. Muitos novos empregos foram gerados.
Surgiram também empresas de locação de vagões. As locadoras compram este equipamento na indústria nacional com o objetivo de alugá-lo para os grandes clientes das ferrovias ou para elas mesmas. Esta prática, comum em vários países, passou a ser utilizada no Brasil, face ao retorno da confiabilidade no sistema ferroviário. Contratos de transporte de grãos e farelo, com 23 anos de prazo, feitos entre exportadores de grãos e operadoras ferroviárias também indicam a recuperação do sistema ferroviário de cargas.
Registramos com satisfação que a indústria ferroviária brasileira mostrou, nesta revitalização das ferrovias, um grande poder de superação. O setor que, antes das concessões, por falta de encomendas, sofreu sérios problemas, inclusive o fechamento de grandes empresas, demonstrou capacidade de reação extraordinária. Atendeu a todas as encomendas das operadoras e ainda exporta seus produtos para diversos países. Valeu muito nessa hora a capacidade técnica da nossa indústria ferroviária que, acionada, respondeu prontamente.
Torna-se imperativo, porém, que haja continuidade de aquisição de vagões, em quantidades que permitam manter a capacidade da cadeia produtiva de nosso setor. Por fim, enfatizamos que seguimos sempre nosso objetivo maior de trabalhar estreitamente com as operadoras, visando à melhoria da infra-estrutura de transporte e o desenvolvimento sustentável da economia brasileira.
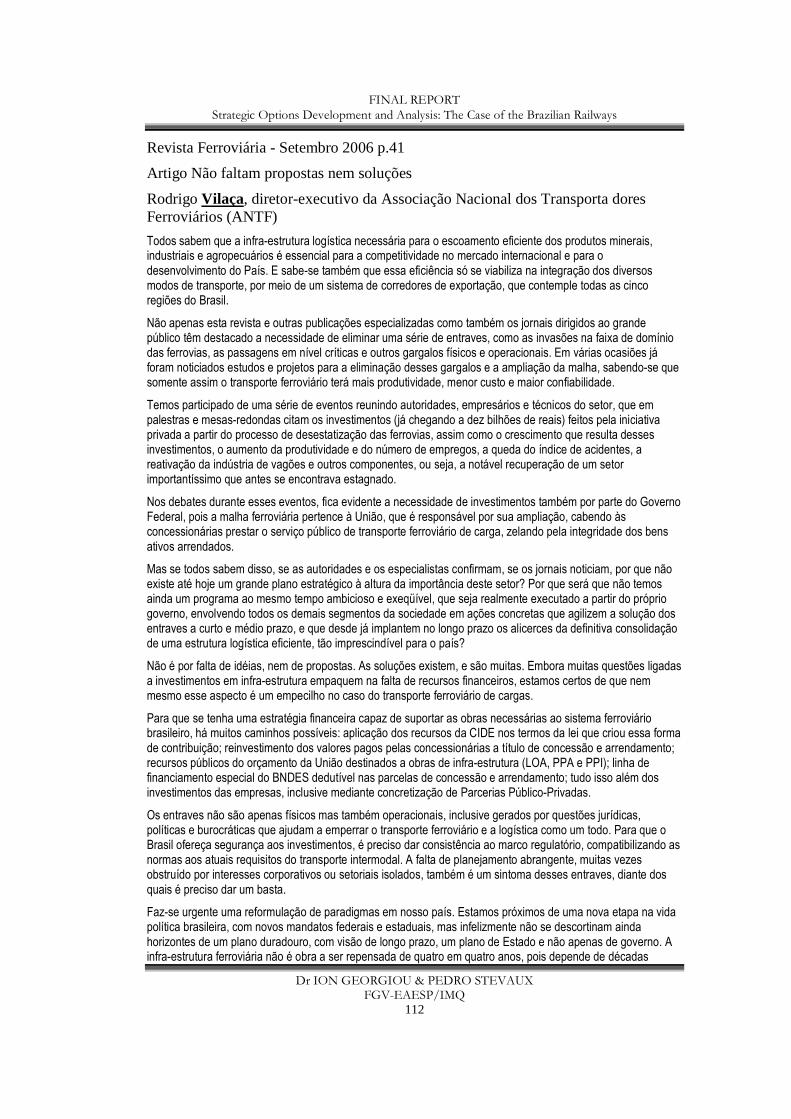
FINAL REPORT Strategic Options Development and Analysis: The Case of the Brazilian Railways
Dr ION GEORGIOU & PEDRO STEVAUX FGV-EAESP/IMQ
112
Revista Ferroviária - Setembro 2006 p.41
Artigo Não faltam propostas nem soluções
Rodrigo Vilaça, diretor-executivo da Associação Nacional dos Transporta dores Ferroviários (ANTF)
Todos sabem que a infra-estrutura logística necessária para o escoamento eficiente dos produtos minerais, industriais e agropecuários é essencial para a competitividade no mercado internacional e para o desenvolvimento do País. E sabe-se também que essa eficiência só se viabiliza na integração dos diversos modos de transporte, por meio de um sistema de corredores de exportação, que contemple todas as cinco regiões do Brasil.
Não apenas esta revista e outras publicações especializadas como também os jornais dirigidos ao grande público têm destacado a necessidade de eliminar uma série de entraves, como as invasões na faixa de domínio das ferrovias, as passagens em nível críticas e outros gargalos físicos e operacionais. Em várias ocasiões já foram noticiados estudos e projetos para a eliminação desses gargalos e a ampliação da malha, sabendo-se que somente assim o transporte ferroviário terá mais produtividade, menor custo e maior confiabilidade.
Temos participado de uma série de eventos reunindo autoridades, empresários e técnicos do setor, que em palestras e mesas-redondas citam os investimentos (já chegando a dez bilhões de reais) feitos pela iniciativa privada a partir do processo de desestatização das ferrovias, assim como o crescimento que resulta desses investimentos, o aumento da produtividade e do número de empregos, a queda do índice de acidentes, a reativação da indústria de vagões e outros componentes, ou seja, a notável recuperação de um setor importantíssimo que antes se encontrava estagnado.
Nos debates durante esses eventos, fica evidente a necessidade de investimentos também por parte do Governo Federal, pois a malha ferroviária pertence à União, que é responsável por sua ampliação, cabendo às concessionárias prestar o serviço público de transporte ferroviário de carga, zelando pela integridade dos bens ativos arrendados.
Mas se todos sabem disso, se as autoridades e os especialistas confirmam, se os jornais noticiam, por que não existe até hoje um grande plano estratégico à altura da importância deste setor? Por que será que não temos ainda um programa ao mesmo tempo ambicioso e exeqüível, que seja realmente executado a partir do próprio governo, envolvendo todos os demais segmentos da sociedade em ações concretas que agilizem a solução dos entraves a curto e médio prazo, e que desde já implantem no longo prazo os alicerces da definitiva consolidação de uma estrutura logística eficiente, tão imprescindível para o país?
Não é por falta de idéias, nem de propostas. As soluções existem, e são muitas. Embora muitas questões ligadas a investimentos em infra-estrutura empaquem na falta de recursos financeiros, estamos certos de que nem mesmo esse aspecto é um empecilho no caso do transporte ferroviário de cargas.
Para que se tenha uma estratégia financeira capaz de suportar as obras necessárias ao sistema ferroviário brasileiro, há muitos caminhos possíveis: aplicação dos recursos da CIDE nos termos da lei que criou essa forma de contribuição; reinvestimento dos valores pagos pelas concessionárias a título de concessão e arrendamento; recursos públicos do orçamento da União destinados a obras de infra-estrutura (LOA, PPA e PPI); linha de financiamento especial do BNDES dedutível nas parcelas de concessão e arrendamento; tudo isso além dos investimentos das empresas, inclusive mediante concretização de Parcerias Público-Privadas.
Os entraves não são apenas físicos mas também operacionais, inclusive gerados por questões jurídicas, políticas e burocráticas que ajudam a emperrar o transporte ferroviário e a logística como um todo. Para que o Brasil ofereça segurança aos investimentos, é preciso dar consistência ao marco regulatório, compatibilizando as normas aos atuais requisitos do transporte intermodal. A falta de planejamento abrangente, muitas vezes obstruído por interesses corporativos ou setoriais isolados, também é um sintoma desses entraves, diante dos quais é preciso dar um basta.
Faz-se urgente uma reformulação de paradigmas em nosso país. Estamos próximos de uma nova etapa na vida política brasileira, com novos mandatos federais e estaduais, mas infelizmente não se descortinam ainda horizontes de um plano duradouro, com visão de longo prazo, um plano de Estado e não apenas de governo. A infra-estrutura ferroviária não é obra a ser repensada de quatro em quatro anos, pois depende de décadas

FINAL REPORT Strategic Options Development and Analysis: The Case of the Brazilian Railways
Dr ION GEORGIOU & PEDRO STEVAUX FGV-EAESP/IMQ
113
sucessivas de muito empenho, investimentos e planejamento integrado, para que os trilhos ajudem a impulsionar o Brasil nos rumos do desenvolvimento.
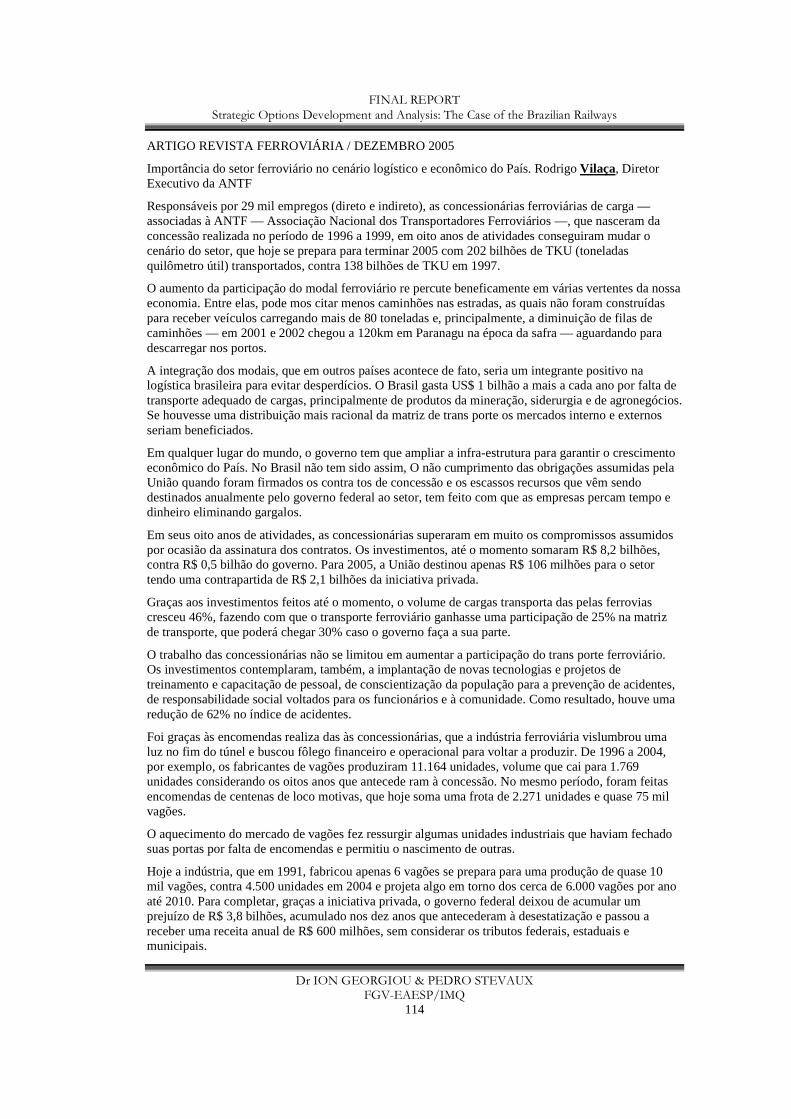
FINAL REPORT Strategic Options Development and Analysis: The Case of the Brazilian Railways
Dr ION GEORGIOU & PEDRO STEVAUX FGV-EAESP/IMQ
114
ARTIGO REVISTA FERROVIÁRIA / DEZEMBRO 2005
Importância do setor ferroviário no cenário logístico e econômico do País. Rodrigo Vilaça, Diretor Executivo da ANTF
Responsáveis por 29 mil empregos (direto e indireto), as concessionárias ferroviárias de carga — associadas à ANTF — Associação Nacional dos Transportadores Ferroviários —, que nasceram da concessão realizada no período de 1996 a 1999, em oito anos de atividades conseguiram mudar o cenário do setor, que hoje se prepara para terminar 2005 com 202 bilhões de TKU (toneladas quilômetro útil) transportados, contra 138 bilhões de TKU em 1997.
O aumento da participação do modal ferroviário re percute beneficamente em várias vertentes da nossa economia. Entre elas, pode mos citar menos caminhões nas estradas, as quais não foram construídas para receber veículos carregando mais de 80 toneladas e, principalmente, a diminuição de filas de caminhões — em 2001 e 2002 chegou a 120km em Paranagu na época da safra — aguardando para descarregar nos portos.
A integração dos modais, que em outros países acontece de fato, seria um integrante positivo na logística brasileira para evitar desperdícios. O Brasil gasta US$ 1 bilhão a mais a cada ano por falta de transporte adequado de cargas, principalmente de produtos da mineração, siderurgia e de agronegócios. Se houvesse uma distribuição mais racional da matriz de trans porte os mercados interno e externos seriam beneficiados.
Em qualquer lugar do mundo, o governo tem que ampliar a infra-estrutura para garantir o crescimento econômico do País. No Brasil não tem sido assim, O não cumprimento das obrigações assumidas pela União quando foram firmados os contra tos de concessão e os escassos recursos que vêm sendo destinados anualmente pelo governo federal ao setor, tem feito com que as empresas percam tempo e dinheiro eliminando gargalos.
Em seus oito anos de atividades, as concessionárias superaram em muito os compromissos assumidos por ocasião da assinatura dos contratos. Os investimentos, até o momento somaram R$ 8,2 bilhões, contra R$ 0,5 bilhão do governo. Para 2005, a União destinou apenas R$ 106 milhões para o setor tendo uma contrapartida de R$ 2,1 bilhões da iniciativa privada.
Graças aos investimentos feitos até o momento, o volume de cargas transporta das pelas ferrovias cresceu 46%, fazendo com que o transporte ferroviário ganhasse uma participação de 25% na matriz de transporte, que poderá chegar 30% caso o governo faça a sua parte.
O trabalho das concessionárias não se limitou em aumentar a participação do trans porte ferroviário. Os investimentos contemplaram, também, a implantação de novas tecnologias e projetos de treinamento e capacitação de pessoal, de conscientização da população para a prevenção de acidentes, de responsabilidade social voltados para os funcionários e à comunidade. Como resultado, houve uma redução de 62% no índice de acidentes.
Foi graças às encomendas realiza das às concessionárias, que a indústria ferroviária vislumbrou uma luz no fim do túnel e buscou fôlego financeiro e operacional para voltar a produzir. De 1996 a 2004, por exemplo, os fabricantes de vagões produziram 11.164 unidades, volume que cai para 1.769 unidades considerando os oitos anos que antecede ram à concessão. No mesmo período, foram feitas encomendas de centenas de loco motivas, que hoje soma uma frota de 2.271 unidades e quase 75 mil vagões.
O aquecimento do mercado de vagões fez ressurgir algumas unidades industriais que haviam fechado suas portas por falta de encomendas e permitiu o nascimento de outras.
Hoje a indústria, que em 1991, fabricou apenas 6 vagões se prepara para uma produção de quase 10 mil vagões, contra 4.500 unidades em 2004 e projeta algo em torno dos cerca de 6.000 vagões por ano até 2010. Para completar, graças a iniciativa privada, o governo federal deixou de acumular um prejuízo de R$ 3,8 bilhões, acumulado nos dez anos que antecederam à desestatização e passou a receber uma receita anual de R$ 600 milhões, sem considerar os tributos federais, estaduais e municipais.

FINAL REPORT Strategic Options Development and Analysis: The Case of the Brazilian Railways
Dr ION GEORGIOU & PEDRO STEVAUX FGV-EAESP/IMQ
115
Os resultados do setor confirmam a determinação das empresas em cumprir o seu papel no crescimento da economia do País. Contas dos especialistas apontam para a necessidade de investimentos de R$ 11,3 bilhões entre 2005 e 2008 (R$ 7,1 bilhões do setor privado e R$ 4,2 bilhões da União). Esse valor, permitirá um aumento de 57% na oferta de transporte ferroviário de carga, um ganho de seis pontos percentuais na matriz de transporte e uma redução de custos para o País na ordem de R$ 11 bilhões.

FINAL REPORT Strategic Options Development and Analysis: The Case of the Brazilian Railways
Dr ION GEORGIOU & PEDRO STEVAUX FGV-EAESP/IMQ
116
REVISTA FERROVIÁRIA/JULHO 2005 p.35
ARTIGO Logística de transporte, armazenagem e movimentação de cargas
Bernardo Hees Presidente da ALL
Com a concorrência nos negócios cada vez mais acirrada, a distribuição e a logística consolidam-se, de maneira crescente, como fundamentais diferenciais competitivos. Por meio dessas atividades busca-se reduzir custos, aumentar a eficiência e garantir a obtenção de um custo-benefício adequado.
Dentro desse contexto, a matriz logística intermodal (envolvendo ferrovias, rodovias, terminais e transporte marítimo), baseada numa maior participação do transporte ferroviário, deve ser compreendida não apenas como uma alternativa viável, mas como uma prioridade que deve ser adotada pelo País.
A experiência acumulada pela ALL desde sua constituição em 1997, fruto da privatização da Malha Sul da Rode Ferroviária Federal, dá fundamento a essa convicção. O modelo de gestão adotado nos possibilita oferecer soluções logísticas alternativas altamente favoráveis aos nossos clientes, tanto em função do custo quanto de eficiência.
A intermodalidade permite ajustar a operação logística às necessidades e às particularidades do cliente e o uso crescente do transporte ferroviário proporciona uma racionalização de custos que certamente terá impacto positivo no preço final dos produtos transportados.
A adequação desse modelo se reflete no expressivo aumento da utilização da ferrovia no transporte de produtos. Segundo estimativas do setor, as concessionárias de ferrovias que administram as malhas existentes no País deverão contabilizar um crescimento acima de 20% ao ano.
A expansão pode ser quantificada por alguns dados correlatos altamente significativos. Segundo dados da Associação Brasileira da Indústria Ferroviária, em 1996 (ano que marca o início do processo de privatização do setor), foram fabricados no País seis vagões (isso mesmo, meia dúzia de vagões). Em 2004, esse número saltou para 3.116, computada a produção entre janeiro e setembro. Também em 96, as concessionárias receberam no total 45 mil vagões, dos quais 28 mil estavam sucateados e sem condições de rodarem. Hoje, há aproximadamente 70 mil vagões em circulação.
Manter esses índices de crescimento pressupõe a realização dos investimentos necessários que, pela própria natureza da atividade, são volumosos. Em nossa companhia, desenvolvemos um mecanismo para aquisição de ativos que permite aplicar os recursos necessários e, ao mesmo tempo, estreitar a relação de parceria com nossos clientes. Por meio desse sistema, os investimentos são compartilhados com os clientes, que participam da compra de vagões e da implantação de terminais que serão utilizados exclusivamente em suas operações.
Como contrapartida dessa aliança, a ALL concede um desconto nos valores cobrados pelo transporte da carga como remuneração pelo capital investido. Com isso, o cliente se beneficia duplamente, pois além de obter essa redução já conta com um custo menor pelo fato de utilizar o meio ferroviário, se comparado com o rodoviário. Cito esse exemplo não com objetivos promocionais, mas por se tratar de um modelo que vem contribuindo, concretamente, para o nosso crescimento e confirma de maneira incontestável a confiança dos nossos parceiros no futuro do transporte ferroviário.
Nessa linha, diversos contratos de longo prazo (acima de 10 anos) foram fechados com os clientes. Este é um exemplo contundente da confiança que as empresas depositam no segmento ferroviário e na sua disposição em investir na otimização dos seus processos logísticos, a ponto de firmarem contratos por períodos pouco usuais para os padrões nacionais, que permitem um planejamento estratégico mais consistente e, certamente, rentável.
Pelas nossas estimativas, o País tem condições reais de ampliar a representatividade da ferrovia dos atuais 22% para 35% nos próximos quinze anos. Para tanto, uma firme parceria entre governo e iniciativa privada deve viabilizar investimentos necessários para ampliação da capacidade dos corredores de transporte, principalmente nos projetos medianos mas com grande impacto na produtividade dos ativos.
A partir dessa plataforma implantada, os diferentes setores produtivos nacionais — sejam agrícolas ou industriais — poderão se beneficiar de uma estrutura de logística e de transportes que lhes garantirá a eficiência e os custos apropriados para disputar os mercados de maneira mais competitiva.

FINAL REPORT Strategic Options Development and Analysis: The Case of the Brazilian Railways
Dr ION GEORGIOU & PEDRO STEVAUX FGV-EAESP/IMQ
117
Transportes e logística não podem mais ser entendidos como um segmento isolado da economia. Eles formam o esteio que dará suporte aos demais setores produtivos e, conseqüentemente, impulsionarão o tão desejado crescimento econômico nacional.
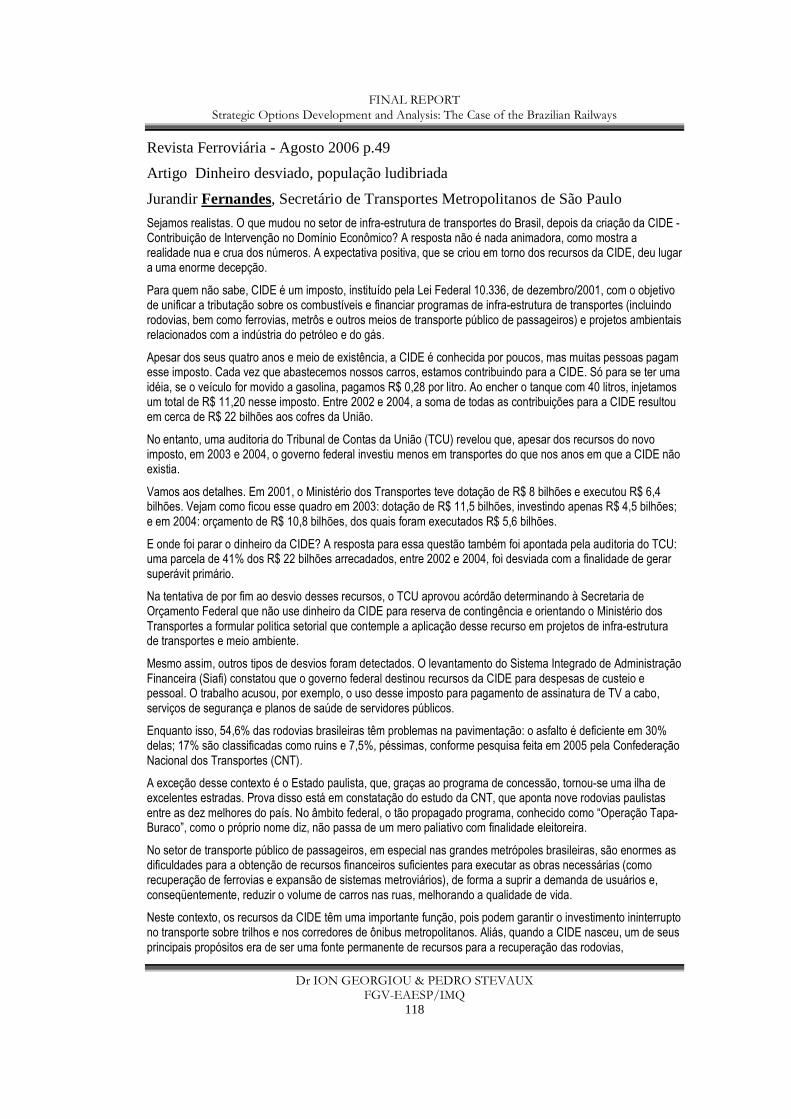
FINAL REPORT Strategic Options Development and Analysis: The Case of the Brazilian Railways
Dr ION GEORGIOU & PEDRO STEVAUX FGV-EAESP/IMQ
118
Revista Ferroviária - Agosto 2006 p.49
Artigo Dinheiro desviado, população ludibriada
Jurandir Fernandes, Secretário de Transportes Metropolitanos de São Paulo
Sejamos realistas. O que mudou no setor de infra-estrutura de transportes do Brasil, depois da criação da CIDE - Contribuição de Intervenção no Domínio Econômico? A resposta não é nada animadora, como mostra a realidade nua e crua dos números. A expectativa positiva, que se criou em torno dos recursos da CIDE, deu lugar a uma enorme decepção.
Para quem não sabe, CIDE é um imposto, instituído pela Lei Federal 10.336, de dezembro/2001, com o objetivo de unificar a tributação sobre os combustíveis e financiar programas de infra-estrutura de transportes (incluindo rodovias, bem como ferrovias, metrôs e outros meios de transporte público de passageiros) e projetos ambientais relacionados com a indústria do petróleo e do gás.
Apesar dos seus quatro anos e meio de existência, a CIDE é conhecida por poucos, mas muitas pessoas pagam esse imposto. Cada vez que abastecemos nossos carros, estamos contribuindo para a CIDE. Só para se ter uma idéia, se o veículo for movido a gasolina, pagamos R$ 0,28 por litro. Ao encher o tanque com 40 litros, injetamos um total de R$ 11,20 nesse imposto. Entre 2002 e 2004, a soma de todas as contribuições para a CIDE resultou em cerca de R$ 22 bilhões aos cofres da União.
No entanto, uma auditoria do Tribunal de Contas da União (TCU) revelou que, apesar dos recursos do novo imposto, em 2003 e 2004, o governo federal investiu menos em transportes do que nos anos em que a CIDE não existia.
Vamos aos detalhes. Em 2001, o Ministério dos Transportes teve dotação de R$ 8 bilhões e executou R$ 6,4 bilhões. Vejam como ficou esse quadro em 2003: dotação de R$ 11,5 bilhões, investindo apenas R$ 4,5 bilhões; e em 2004: orçamento de R$ 10,8 bilhões, dos quais foram executados R$ 5,6 bilhões.
E onde foi parar o dinheiro da CIDE? A resposta para essa questão também foi apontada pela auditoria do TCU: uma parcela de 41% dos R$ 22 bilhões arrecadados, entre 2002 e 2004, foi desviada com a finalidade de gerar superávit primário.
Na tentativa de por fim ao desvio desses recursos, o TCU aprovou acórdão determinando à Secretaria de Orçamento Federal que não use dinheiro da CIDE para reserva de contingência e orientando o Ministério dos Transportes a formular politica setorial que contemple a aplicação desse recurso em projetos de infra-estrutura de transportes e meio ambiente.
Mesmo assim, outros tipos de desvios foram detectados. O levantamento do Sistema Integrado de Administração Financeira (Siafi) constatou que o governo federal destinou recursos da CIDE para despesas de custeio e pessoal. O trabalho acusou, por exemplo, o uso desse imposto para pagamento de assinatura de TV a cabo, serviços de segurança e planos de saúde de servidores públicos.
Enquanto isso, 54,6% das rodovias brasileiras têm problemas na pavimentação: o asfalto é deficiente em 30% delas; 17% são classificadas como ruins e 7,5%, péssimas, conforme pesquisa feita em 2005 pela Confederação Nacional dos Transportes (CNT).
A exceção desse contexto é o Estado paulista, que, graças ao programa de concessão, tornou-se uma ilha de excelentes estradas. Prova disso está em constatação do estudo da CNT, que aponta nove rodovias paulistas entre as dez melhores do país. No âmbito federal, o tão propagado programa, conhecido como “Operação Tapa-Buraco”, como o próprio nome diz, não passa de um mero paliativo com finalidade eleitoreira.
No setor de transporte público de passageiros, em especial nas grandes metrópoles brasileiras, são enormes as dificuldades para a obtenção de recursos financeiros suficientes para executar as obras necessárias (como recuperação de ferrovias e expansão de sistemas metroviários), de forma a suprir a demanda de usuários e, conseqüentemente, reduzir o volume de carros nas ruas, melhorando a qualidade de vida.
Neste contexto, os recursos da CIDE têm uma importante função, pois podem garantir o investimento ininterrupto no transporte sobre trilhos e nos corredores de ônibus metropolitanos. Aliás, quando a CIDE nasceu, um de seus principais propósitos era de ser uma fonte permanente de recursos para a recuperação das rodovias,

FINAL REPORT Strategic Options Development and Analysis: The Case of the Brazilian Railways
Dr ION GEORGIOU & PEDRO STEVAUX FGV-EAESP/IMQ
119
implantação de melhorias no transporte público e de ações relativas ao meio ambiente. Infelizmente, até agora, fomos todos ludibriados.
FINAL REPORT Strategic Options Development and Analysis: The Case of the Brazilian Railways
Dr ION GEORGIOU & PEDRO STEVAUX FGV-EAESP/IMQ
120
Revista Ferroviária - Novembro 2006 pp.40-41
Artigo Ferrovias — Um novo paradigma
Paulo Sérgio Passos Ministro dos Transportes
A situação das ferrovias no Brasil tem componente histórico cujo resgate é necessário para se entender o panorama atual. Construída entre o século XIX e o início do século passado, com investimento de capital privado e público, a estrutura ferroviária, estrategicamente, dedicou-se ao desenvolvi mento e à integração das regiões brasileiras. Assim, o Estado passou a controlar, direta ou indiretamente, o setor. No século XX, ao contrário do que aconteceu no mundo — com revitalização do setor em vários países, destacando-se os EUA, a partir de 1980 —, ocorreram no Brasil o declínio e o colapso dessa estrutura, principalmente por falta de modelo de negócio rentável.
Hoje o Governo Federal faz um esforço para revitalizar as ferrovias e surge uma perspectiva de crescimento deste modal. Isso porque o País se encontra com os fundamentos econômicos em ordem, o que gera confiança no desenvolvimento. Além do disciplinamento adequado, o poder público federal estabelece marcos regulatórios consistentes e em evolução, com responsabilidade e credibilidade, o que se caracteriza como sinais claros da prioridade e importância dadas ao setor ferroviário.
A situação econômica brasileira é imperativa no sentido de proporcionar infra-estrutura de transportes que atenda a esse crescimento. A expansão das áreas de produção agrícola, que aumenta a demanda por transportes, e a necessidade de atender com eficiência à procura decorrente do crescimento interno e do comércio exterior são razões mais do que suficientes para que o País continue firme na busca de um sistema ferroviário articulado. Além disso, a ferrovia é um modo de transporte de alta capacidade, que racionaliza custos logísticos e combate a degradação ambiental— um vagão retira, por exemplo, quatro caminhões das estradas.
Essa busca requer o equacionamento de problemas como: invasões de faixa de domínio em centros urbanos, restrições de capacidade no acesso aos portos, além da excessiva quantidade de passagens de nível — o que retarda a velocidade dos trens. Todos esses estão entre os gargalos atacados pelo Governo Federal. Há também a necessidade de maior integração operacional entre concessionários e expansão da malha para o atendimento da demanda, em especial nas zonas produtoras.
Frente a essa realidade, o Governo Federal estabeleceu uma extensa agenda para o setor entre os anos de 2003 e 2006. Em maio de 2003, foi iniciado o Plano de Revitalização das Ferrovias, com o objetivo de integrar as vias férreas e reconstituir corredores operacionais de transportes, atendendo às exportações e à demanda interna. Houve elevação dos investimentos ferroviários para a eliminação de diversos obstáculos e ampliação da malha. No período 2003- 2005 foram investidos R$ 384,5 milhões para a eliminação de pontos críticos, O Governo aplicou também R$ 309 milhões na Construção da Ferrovia Norte-Sul nos estados de Tocantins e Goiás.
Neste plano está o Programa de Integração e Adequação Operacional de Ferrovias, que consiste na reestruturação das malhas, fortalecimento empresarial das concessões e criação de mecanismos de fiscalização e controle de desempenho das empresas concessionárias. Entre as ações desse programa, destacam-se a reestruturação da Brasil Ferrovias, o aprimoramento regulatório (com resoluções relativas a usuário cativo, usuário investidor, interconexão ferroviária, tráfego mútuo e direito de passagem) e os Termos de Ajuste de Conduta (TAC) com a FERROBAN, a NOVOESTE e a Companhia Ferroviária do Nordeste (CFN), com o objetivo de normalizar as condições operacionais do transporte ferroviário. Na área de regulação — cuja eficiência gera credibilidade ao setor — também foram implantadas penalidades pelo não cumprimento de metas de segurança e produção e se estabeleceram novas metas qüinqüenais. O transporte ferroviário de passageiros, a comunicação de acidentes, questões operacionais, ingresso de acionistas, abertura de capital, reestruturações societárias, além de saneamento econômico-financeiro do setor, são itens também regulados.
O Programa de Ampliação da Capacidade dos Corredores de Transporte, outra ação, compreende a recuperação da infra-estrutura viária, a modernização e ampliação da frota de vagões e locomotivas e o aumento da segurança do transporte, além da definição do contorno de centros urbanos e a eliminação de pontos críticos dos corredores. Algumas ações foram concluídas: o contorno ferroviário de Campo Grande-MS e Barretos-SP; o rebaixamento do leito ferroviário em Maringá-PR; a construção do viaduto sobre a ferrovia em Alagoinhas-BA (2006); adequação do desvio ferroviário em Araguari-MG; construção da ponte ferroviária de Lins-SP e
FINAL REPORT Strategic Options Development and Analysis: The Case of the Brazilian Railways
Dr ION GEORGIOU & PEDRO STEVAUX FGV-EAESP/IMQ
121
conclusão da primeira etapa das obras de adequação de passagem sobre o pátio ferroviário em Vespasiano, também em Minas Gerais. Diversas outras intervenções estão em curso.
A Variante Litorânea Sul da Ferrovia Centro-Atlântica (FCA), entre os municípios Cariacica e Cachoeiro do Itapemirim (ES), totalizando 165 quilômetros de extensão, por exemplo, já teve sua construção autorizada. Essa obra vai atender à crescente demanda por transporte de cargas naquela região. Os investimentos previstos totalizam R$ 700 milhões, com geração de cerca de mil empregos.
Paralelamente, o Programa de Expansão e Modernização da Malha Ferroviária compreende a extensão das ferrovias às zonas de produção agrícola e prevê redução de custos de transportes na regiões Centro-Oeste, Norte e Nordeste, com a recuperação da infra-estrutura viária. As ações prioritárias abrangem a construção de novos trechos, reconstrução e adequação da Nova Trans nordestina, com 1.800 quilômetros entre Eliseu Martins-PI e os portos de Suape-PE e Pecém-CE. O início das obras, também já autorizado, se dá no trecho entre Salgueiro PE e Missão Velha-CE. A nova ferrovia, de alta capacidade, em bitola mista (1,60 m e 1,00 m), será reconstruída no trecho Suape Salgueiro/PE (550 quilômetros de extensão), readequada no segmento Pecém-Missão VelhaJCE (600 quilômetros) e construída nos trechos Missão Velha/CE-Salgueiro/PE (100 quilômetros de extensão) e Salgueiro/PE-Eliseu Martins/PI (546 quilômetros).
Somados os investimentos privados, financiamentos e participações do BNDES, FDNE e FINOR, essas ações receberão recursos da ordem de R$ 4,5 bilhões. Um dos objetivos é atender ao desenvolvimento do cerrado nordestino, criando alternativas para o escoamento da produção de grãos e aproveitamento dos portos de Suape e Pecém, onde já foram investidos mais de R$ 570,6 milhões (R$ 253 milhões e R$ 317,6 milhões, respectivamente). O pleno funcionamento dessa ferrovia potencializará novos pólos e articulações logísticas, com redução de custos.
A Ferrovia Norte-Sul, com 235,5 quilô metros construídos, entre Açailândia-MA e Darcinópolis-TO, também contará com especial atenção. Até o fim do ano, deverão estar prontas as obras até Araguaína-TO, com 108 quilômetros, e a conclusão de mais 146,5 quilômetros. Também estão em curso as obras do Tramo Sul (Campo Lim po — Ouro Verde de Goiás). Por meio de subconcessão, estão em andamento obras em 719 quilômetros entre Açailândia e Palmas-TO. Para o trecho entre Araguaína e Palmas, serão aplicados cerca de R$ 1,4 bilhão, com a construção de 357,5 quilômetros. Na continuidade da ferrovia, está em obra o trecho Campo Limpo — Ouro Verde de Goiás, com 40 quilômetros de extensão, tendo sido executada sua infra-estrutura entre 2003 e 2005.
É meta do Plano de Revitalização o Programa de Resgate do Transporte Ferroviário de Passageiros, que prioriza os trens regionais. Passo decisivo nesse rumo foi a assinatura do Acordo de Cooperação Técnica entre o Ministério dos Transportes e o BNDES para ações de retomada dessa modalidade, em caráter regular, com a implantação de trens regionais, de velocidade em torno de 100 Km/h, por meio de concessão ou permissão. Já foram identificados 28 trechos potencialmente viáveis, com seleção de 15 trechos-piloto. Entre eles estão: Cabedelo—João Pessoa—Campina Grande, na Paraíba; Parnamirim—Natal—Ceará Mirim, no Rio Grande do Norte, e Maceió—Lourenço de Albuquerque.
Também está em estudo a implantação dos trens de alta velocidade nas ligações Rio—São Paulo e Brasília—Goiânia. Para tanto, o Ministério dos Transportes criou um grupo de trabalho, com representantes dos governos do Distrito Federal e de Goiás, com a finalidade de analisar técnica e economicamente a questão. A recomendação do grupo é a implantação do modelo de trem regional com velocidade de até 150 Km/h.
O Plano também prevê a implantação de trens turísticos, que objetivam o resgate do patrimônio histórico e cultural das ferrovias em trechos já autorizados, como São João Del Rei—Tiradentes (MG); Bento Gonçalves—Carlos Barbosa e Rio Pardo-Cachoeira do Sul (RS); Paraíba do Sul—Cavaru (RJ); Campo Grande—Corumbá (MS); Tubarão/Imbituba/Urussanga (SC); e Brás—Mooca(SP).
Em paralelo à agenda de intervenções do Governo Federal, as concessões ferroviárias apresentaram resultados muito positivos. A participação das ferrovias na matriz de transporte de cargas passou de 23%, em 2002, para 25%, em 2005, e a produção de transporte no triênio foi de 611 bilhões de TKU. A revitalização da indústria ferroviária nesse mesmo período produziu 14.030 vagões — fábricas foram ampliadas e quatro novas unidades implantadas, com a criação de 30 mil empregos diretos e indiretos. Os investimentos das concessionárias alcançaram R$ 6,1 bilhões na modernização das malhas e na melhoria da operação ferroviária.

FINAL REPORT Strategic Options Development and Analysis: The Case of the Brazilian Railways
Dr ION GEORGIOU & PEDRO STEVAUX FGV-EAESP/IMQ
122
Este cenário propiciou a dinamização do setor, houve diversificação dos negócios com carga conteinerizada, contratos de longo prazo entre usuários e operadores, que geram confiança e estabilidade, igualmente entre fornecedores de equipamentos e material de transporte, por meio de operações de leasing. Nos últimos anos, todos os indicadores do setor ferroviário — carga transportada, produção de transporte, índice de acidentes, pessoal empregado, investimento das concessionárias, com destaque para vagões e indústria de material de transporte — foram positivos. Diante desse quadro, podemos afirmar que o Governo Federal marcou um novo tempo no transporte ferroviário do país. O Governo trabalha com a diretriz do planejamento integrado de todos os modos de transporte, e as ações governamentais têm como foco a racionalidade da matriz, o aumento da malha e a eficiência de seu pleno funcionamento.
FINAL REPORT Strategic Options Development and Analysis: The Case of the Brazilian Railways
Dr ION GEORGIOU & PEDRO STEVAUX FGV-EAESP/IMQ
123
REVISTA FERROVIÁRIA FEVEREIRO DE 2007
O Pais precisa ser rasgado por ferrovias. Benjamin Steinbruch, Presidente da Companhia Siderúrgica Nacional (CSN).
Experimente levar um estrangeiro qualquer, europeu ou norte-americano, para uma viagem de carro por uma rodovia brasileira importante. Seguramente, ele vai se mostrar assustado com o número de caminhões que trafegam pelas pistas.
Não há esse volume de caminhões em estradas da Europa ou dos Estados Unidos. O transporte rodoviário de mercadorias só é eficiente para distâncias curtas e cargas leves e integrado com ferrovias. Dias atrás, um desses visitantes estrangeiros ficou perplexo ao ver tantos caminhões transportando minério na estrada de Belo Horizonte a Juiz de Fora, em Minas Gerais.
O Brasil precisa ser urgentemente rasgado por novas ferrovias. Qualquer país continental, para ser viável, tem de usar o transporte de cargas por trem em larga escala, Só essas vias podem trazer áreas completamente esquecidas para que sejam inseridas na produção e no consumo.
Existem no território brasileiro verdadeiros países potencialmente produtivos, que só não produzem por falta de integração. A ferrovia tem o poder de realizar a transformação de áreas não-produtivas em produtivas.
O País está, portanto, longe do ideal em matéria de utilização de ferrovias. Mas já evoluiu bastante desde o início das privatizações no setor, há 10 anos. Antes da privatização, a Rede Ferroviária transportava apenas 17% das cargas do País, um dos mais baixos índices entre as nações emergentes. Hoje, essa parcela subiu para 26%, mas ainda é baixa quando comparada com padrões internacionais (42%). As previsões setoriais indicam que a comjunção de investimentos públicos e privados poderá elevá-la para 30% em curto prazo.
Nos 10 anos de privatização houve avanços em matéria de investimento. Em 1995, último ano da rede estatal, os investimentos públicos foram de R$ 10 milhões. Nos 10 anos completos sob a iniciativa privada (1997 a 2006) investiu-se em média R$ 1,2 bilhão por ano, ou seja, um total de R$ 12 bilhões. Esses investimentos, acompanhados da criação de 14 mil novos empregos, fizeram com que a carga transportada aumentasse 56% no período, de 250 milhões de toneladas para 390 milhões de toneladas.
A Rede Ferroviária Federal, nos três anos antes da privatização (1994 a 1996), deu à União prejuízo de R$ 2,2 bilhões. Além de livrar o setor público desse ônus e melhorar a eficiência das ferrovias, o governo já arrecadou R$ 5,6 bilhões com leilões de privatização, impostos, pagamentos trimestrais de concessões e arrendamento de bens da antiga rede.
O transporte ferroviário pode dar também contribuição importantíssima para a produtividade da economia brasileira, porque custa em média 40% menos que o rodoviário. Em 1940, um ano antes da criação da Companhia Siderúrgica Nacional (CSN) por Ge túlio Vargas, o Brasil tinha 35 mil km de estradas de ferro. Passados 66 anos, conta hoje com apenas 30 mil km, dos quais 28 mil km são operados pelo setor privado. Essa redução ocorreu porque, no longo
FINAL REPORT Strategic Options Development and Analysis: The Case of the Brazilian Railways
Dr ION GEORGIOU & PEDRO STEVAUX FGV-EAESP/IMQ
124
período de estatização, a rede ferroviária brasileira ficou praticamente abandonada. Algumas linhas foram sucateadas e suas recuperações, inviabilizadas.
Portanto, todo o crescimento de carga gerado a partir dos anos 40 por obras de infra-estrutura, indústrias de base e depois pelo Plano de Metas de Juscelino foi atendido pelo setor rodoviário. É fácil imaginar os prejuízos causados por essa tendência à competitividade internacional da indústria brasileira, em razão dos custos mais elevados do transporte rodoviário,
Embora minérios e carvão ainda sejam as principais cargas das ferrovias, o boom de produção de soja e outras commodities, que se concentra em regiões distantes dos portos, aumentou muito a demanda de transpor te ferroviário nos últimos anos. A Associação Nacional dos Usuários de Transporte de Carga estima que, só no caso da soja, houve um excesso de demanda de 17 milhões de toneladas em 2005. Isso significa que todo esse volume acabou sendo transportado por caminhões, com aumento de custos para produtores e exportadores e com efeitos desastrosos para a conservação das rodovias.
Em áreas de fronteira agrícola, a ferrovia é indispensável. Tenho a honra de participar do maior projeto hoje em construção no Brasil, a Ferrovia Transnordestina, que vai ligar a nova região agrícola do Piauí aos portos de Suape, em Pernambuco, e Pecém, no Ceará. Serão 2 mil km de trilhos, com investimentos de R$ 4,5 bilhões, em parceria da Companhia Ferroviária do Nordeste com o governo federal.
Além de mais trilhos, a malha ferroviária precisa de obras para aumentar a velocidade dos trens, o que daria mais eficiência ao transporte. Em algumas regiões urbanas, por exempio, as composições reduzem a velocidade para até 5 km por hora para não ameaçar a segurança de populações que vivem às margens das linhas. Na época das concessões, o governo assumiu o compromisso de realizar as obras de contornos de cidades, o que não foi cumprido até hoje. A Associação Nacional de Transporte Ferroviário estima que existam ainda cerca de 12 mil passagens de nível na malha, onde o trem cruza com o automóvel e o caminhão. Quem volta do Guarujá no fim de semana, por exemplo, algumas vezes é surpreendido por cancelas fechadas para a passagem de trens, uma operação que provoca enormes congestionamentos na rodovia Piaçanguera-Guarujá.
Mas essas cancelas são apenas símbolos das deficiências ferroviárias brasileiras. Os verdadeiros entraves ao setor estão na área tributária, pela inexistência de mecanismos indutores de investimentos, muito comuns em outros países. O transporte intermodal, por exemplo, é penalizado pela forma de incidência do ICMS. As contribuições do setor, como recursos de arrendamento e da Cide, não revertem para o próprio setor. Além disso, as importações de equipamentos não produzidos no País são injustificavelmente oneradas.
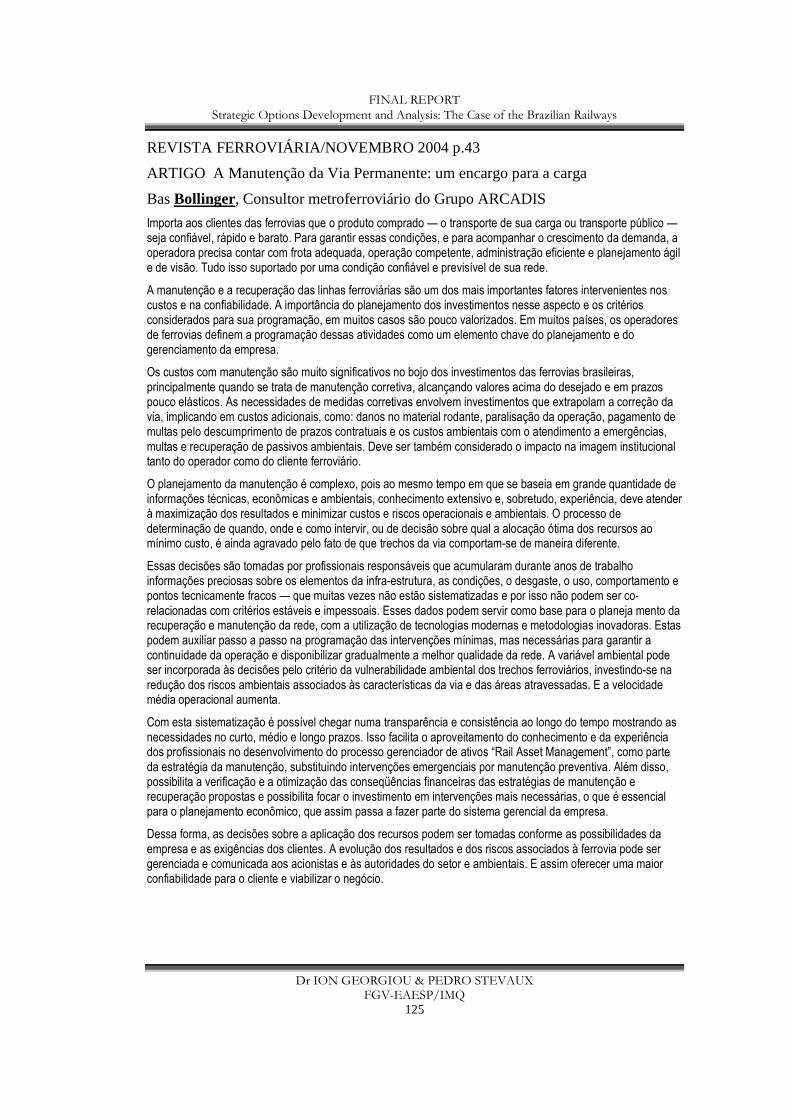
FINAL REPORT Strategic Options Development and Analysis: The Case of the Brazilian Railways
Dr ION GEORGIOU & PEDRO STEVAUX FGV-EAESP/IMQ
125
REVISTA FERROVIÁRIA/NOVEMBRO 2004 p.43
ARTIGO A Manutenção da Via Permanente: um encargo para a carga
Bas Bollinger, Consultor metroferroviário do Grupo ARCADIS
Importa aos clientes das ferrovias que o produto comprado — o transporte de sua carga ou transporte público — seja confiável, rápido e barato. Para garantir essas condições, e para acompanhar o crescimento da demanda, a operadora precisa contar com frota adequada, operação competente, administração eficiente e planejamento ágil e de visão. Tudo isso suportado por uma condição confiável e previsível de sua rede.
A manutenção e a recuperação das linhas ferroviárias são um dos mais importantes fatores intervenientes nos custos e na confiabilidade. A importância do planejamento dos investimentos nesse aspecto e os critérios considerados para sua programação, em muitos casos são pouco valorizados. Em muitos países, os operadores de ferrovias definem a programação dessas atividades como um elemento chave do planejamento e do gerenciamento da empresa.
Os custos com manutenção são muito significativos no bojo dos investimentos das ferrovias brasileiras, principalmente quando se trata de manutenção corretiva, alcançando valores acima do desejado e em prazos pouco elásticos. As necessidades de medidas corretivas envolvem investimentos que extrapolam a correção da via, implicando em custos adicionais, como: danos no material rodante, paralisação da operação, pagamento de multas pelo descumprimento de prazos contratuais e os custos ambientais com o atendimento a emergências, multas e recuperação de passivos ambientais. Deve ser também considerado o impacto na imagem institucional tanto do operador como do cliente ferroviário.
O planejamento da manutenção é complexo, pois ao mesmo tempo em que se baseia em grande quantidade de informações técnicas, econômicas e ambientais, conhecimento extensivo e, sobretudo, experiência, deve atender à maximização dos resultados e minimizar custos e riscos operacionais e ambientais. O processo de determinação de quando, onde e como intervir, ou de decisão sobre qual a alocação ótima dos recursos ao mínimo custo, é ainda agravado pelo fato de que trechos da via comportam-se de maneira diferente.
Essas decisões são tomadas por profissionais responsáveis que acumularam durante anos de trabalho informações preciosas sobre os elementos da infra-estrutura, as condições, o desgaste, o uso, comportamento e pontos tecnicamente fracos — que muitas vezes não estão sistematizadas e por isso não podem ser co-relacionadas com critérios estáveis e impessoais. Esses dados podem servir como base para o planeja mento da recuperação e manutenção da rede, com a utilização de tecnologias modernas e metodologias inovadoras. Estas podem auxiliar passo a passo na programação das intervenções mínimas, mas necessárias para garantir a continuidade da operação e disponibilizar gradualmente a melhor qualidade da rede. A variável ambiental pode ser incorporada às decisões pelo critério da vulnerabilidade ambiental dos trechos ferroviários, investindo-se na redução dos riscos ambientais associados às características da via e das áreas atravessadas. E a velocidade média operacional aumenta.
Com esta sistematização é possível chegar numa transparência e consistência ao longo do tempo mostrando as necessidades no curto, médio e longo prazos. Isso facilita o aproveitamento do conhecimento e da experiência dos profissionais no desenvolvimento do processo gerenciador de ativos “Rail Asset Management”, como parte da estratégia da manutenção, substituindo intervenções emergenciais por manutenção preventiva. Além disso, possibilita a verificação e a otimização das conseqüências financeiras das estratégias de manutenção e recuperação propostas e possibilita focar o investimento em intervenções mais necessárias, o que é essencial para o planejamento econômico, que assim passa a fazer parte do sistema gerencial da empresa.
Dessa forma, as decisões sobre a aplicação dos recursos podem ser tomadas conforme as possibilidades da empresa e as exigências dos clientes. A evolução dos resultados e dos riscos associados à ferrovia pode ser gerenciada e comunicada aos acionistas e às autoridades do setor e ambientais. E assim oferecer uma maior confiabilidade para o cliente e viabilizar o negócio.
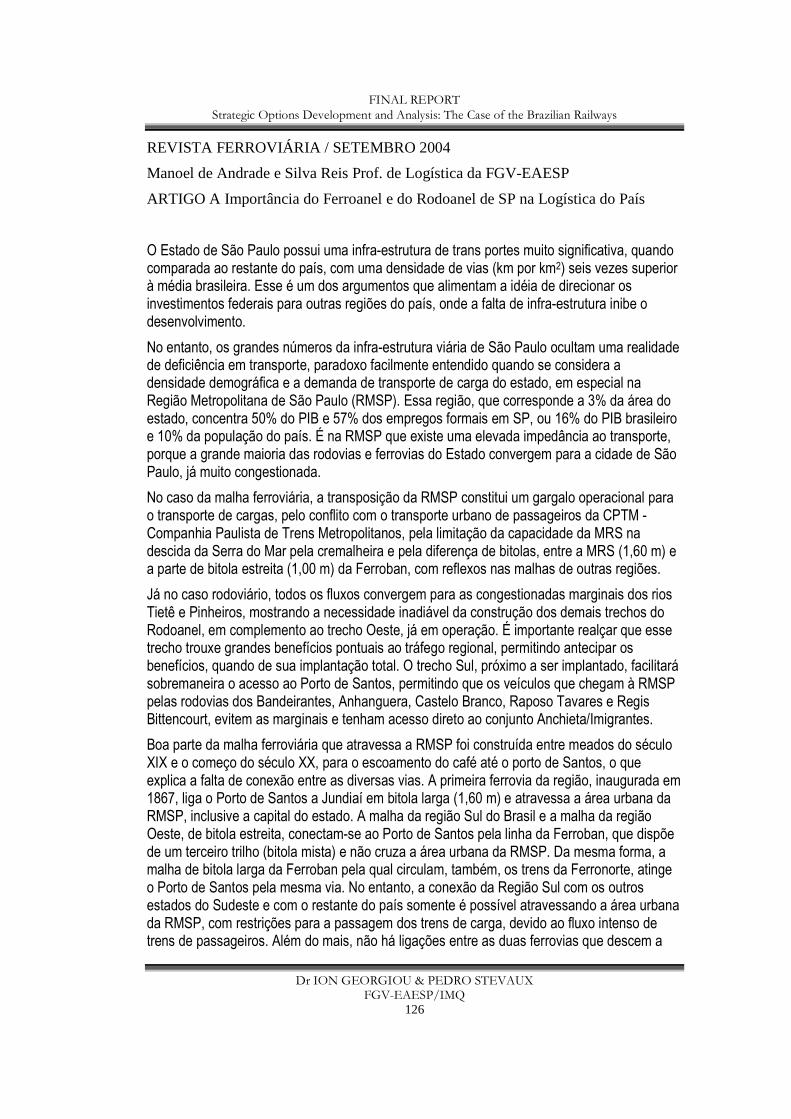
FINAL REPORT Strategic Options Development and Analysis: The Case of the Brazilian Railways
Dr ION GEORGIOU & PEDRO STEVAUX FGV-EAESP/IMQ
126
REVISTA FERROVIÁRIA / SETEMBRO 2004
Manoel de Andrade e Silva Reis Prof. de Logística da FGV-EAESP
ARTIGO A Importância do Ferroanel e do Rodoanel de SP na Logística do País
O Estado de São Paulo possui uma infra-estrutura de trans portes muito significativa, quando comparada ao restante do país, com uma densidade de vias (km por km2) seis vezes superior à média brasileira. Esse é um dos argumentos que alimentam a idéia de direcionar os investimentos federais para outras regiões do país, onde a falta de infra-estrutura inibe o desenvolvimento.
No entanto, os grandes números da infra-estrutura viária de São Paulo ocultam uma realidade de deficiência em transporte, paradoxo facilmente entendido quando se considera a densidade demográfica e a demanda de transporte de carga do estado, em especial na Região Metropolitana de São Paulo (RMSP). Essa região, que corresponde a 3% da área do estado, concentra 50% do PIB e 57% dos empregos formais em SP, ou 16% do PIB brasileiro e 10% da população do país. É na RMSP que existe uma elevada impedância ao transporte, porque a grande maioria das rodovias e ferrovias do Estado convergem para a cidade de São Paulo, já muito congestionada.
No caso da malha ferroviária, a transposição da RMSP constitui um gargalo operacional para o transporte de cargas, pelo conflito com o transporte urbano de passageiros da CPTM - Companhia Paulista de Trens Metropolitanos, pela limitação da capacidade da MRS na descida da Serra do Mar pela cremalheira e pela diferença de bitolas, entre a MRS (1,60 m) e a parte de bitola estreita (1,00 m) da Ferroban, com reflexos nas malhas de outras regiões.
Já no caso rodoviário, todos os fluxos convergem para as congestionadas marginais dos rios Tietê e Pinheiros, mostrando a necessidade inadiável da construção dos demais trechos do Rodoanel, em complemento ao trecho Oeste, já em operação. É importante realçar que esse trecho trouxe grandes benefícios pontuais ao tráfego regional, permitindo antecipar os benefícios, quando de sua implantação total. O trecho Sul, próximo a ser implantado, facilitará sobremaneira o acesso ao Porto de Santos, permitindo que os veículos que chegam à RMSP pelas rodovias dos Bandeirantes, Anhanguera, Castelo Branco, Raposo Tavares e Regis Bittencourt, evitem as marginais e tenham acesso direto ao conjunto Anchieta/Imigrantes.
Boa parte da malha ferroviária que atravessa a RMSP foi construída entre meados do século XIX e o começo do século XX, para o escoamento do café até o porto de Santos, o que explica a falta de conexão entre as diversas vias. A primeira ferrovia da região, inaugurada em 1867, liga o Porto de Santos a Jundiaí em bitola larga (1,60 m) e atravessa a área urbana da RMSP, inclusive a capital do estado. A malha da região Sul do Brasil e a malha da região Oeste, de bitola estreita, conectam-se ao Porto de Santos pela linha da Ferroban, que dispõe de um terceiro trilho (bitola mista) e não cruza a área urbana da RMSP. Da mesma forma, a malha de bitola larga da Ferroban pela qual circulam, também, os trens da Ferronorte, atinge o Porto de Santos pela mesma via. No entanto, a conexão da Região Sul com os outros estados do Sudeste e com o restante do país somente é possível atravessando a área urbana da RMSP, com restrições para a passagem dos trens de carga, devido ao fluxo intenso de trens de passageiros. Além do mais, não há ligações entre as duas ferrovias que descem a
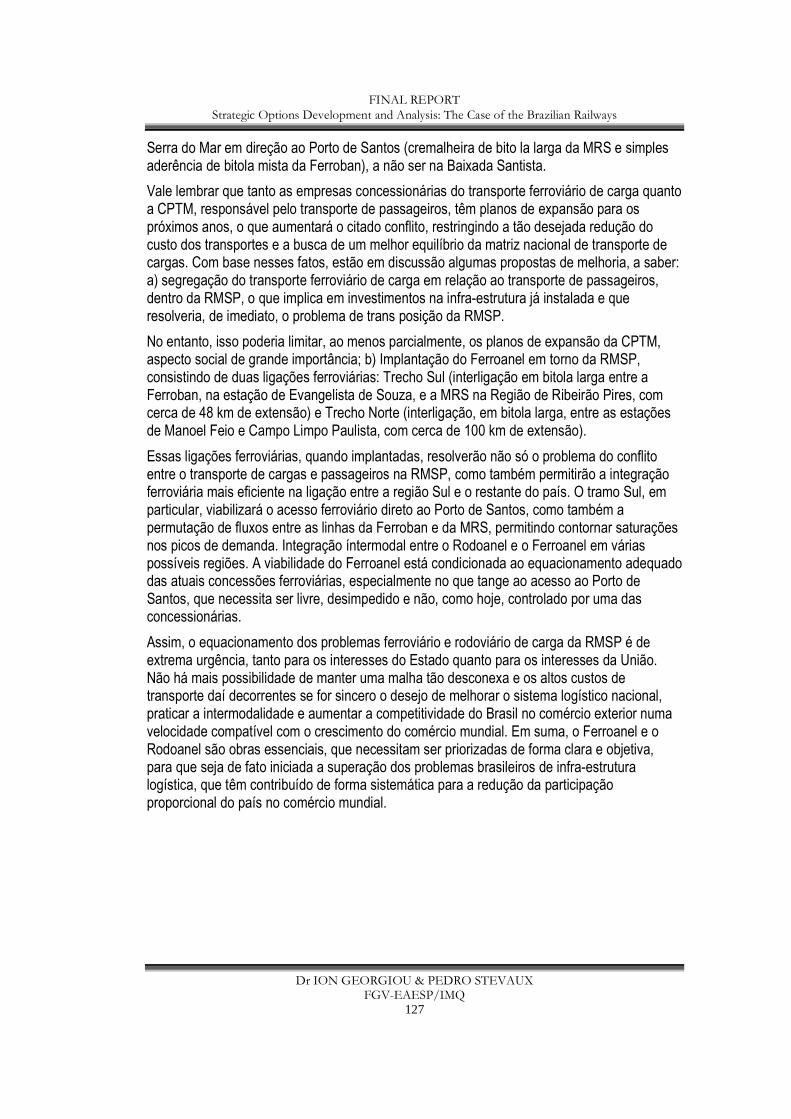
FINAL REPORT Strategic Options Development and Analysis: The Case of the Brazilian Railways
Dr ION GEORGIOU & PEDRO STEVAUX FGV-EAESP/IMQ
127
Serra do Mar em direção ao Porto de Santos (cremalheira de bito la larga da MRS e simples aderência de bitola mista da Ferroban), a não ser na Baixada Santista.
Vale lembrar que tanto as empresas concessionárias do transporte ferroviário de carga quanto a CPTM, responsável pelo transporte de passageiros, têm planos de expansão para os próximos anos, o que aumentará o citado conflito, restringindo a tão desejada redução do custo dos transportes e a busca de um melhor equilíbrio da matriz nacional de transporte de cargas. Com base nesses fatos, estão em discussão algumas propostas de melhoria, a saber: a) segregação do transporte ferroviário de carga em relação ao transporte de passageiros, dentro da RMSP, o que implica em investimentos na infra-estrutura já instalada e que resolveria, de imediato, o problema de trans posição da RMSP.
No entanto, isso poderia limitar, ao menos parcialmente, os planos de expansão da CPTM, aspecto social de grande importância; b) Implantação do Ferroanel em torno da RMSP, consistindo de duas ligações ferroviárias: Trecho Sul (interligação em bitola larga entre a Ferroban, na estação de Evangelista de Souza, e a MRS na Região de Ribeirão Pires, com cerca de 48 km de extensão) e Trecho Norte (interligação, em bitola larga, entre as estações de Manoel Feio e Campo Limpo Paulista, com cerca de 100 km de extensão).
Essas ligações ferroviárias, quando implantadas, resolverão não só o problema do conflito entre o transporte de cargas e passageiros na RMSP, como também permitirão a integração ferroviária mais eficiente na ligação entre a região Sul e o restante do país. O tramo Sul, em particular, viabilizará o acesso ferroviário direto ao Porto de Santos, como também a permutação de fluxos entre as linhas da Ferroban e da MRS, permitindo contornar saturações nos picos de demanda. Integração íntermodal entre o Rodoanel e o Ferroanel em várias possíveis regiões. A viabilidade do Ferroanel está condicionada ao equacionamento adequado das atuais concessões ferroviárias, especialmente no que tange ao acesso ao Porto de Santos, que necessita ser livre, desimpedido e não, como hoje, controlado por uma das concessionárias.
Assim, o equacionamento dos problemas ferroviário e rodoviário de carga da RMSP é de extrema urgência, tanto para os interesses do Estado quanto para os interesses da União. Não há mais possibilidade de manter uma malha tão desconexa e os altos custos de transporte daí decorrentes se for sincero o desejo de melhorar o sistema logístico nacional, praticar a intermodalidade e aumentar a competitividade do Brasil no comércio exterior numa velocidade compatível com o crescimento do comércio mundial. Em suma, o Ferroanel e o Rodoanel são obras essenciais, que necessitam ser priorizadas de forma clara e objetiva, para que seja de fato iniciada a superação dos problemas brasileiros de infra-estrutura logística, que têm contribuído de forma sistemática para a redução da participação proporcional do país no comércio mundial.

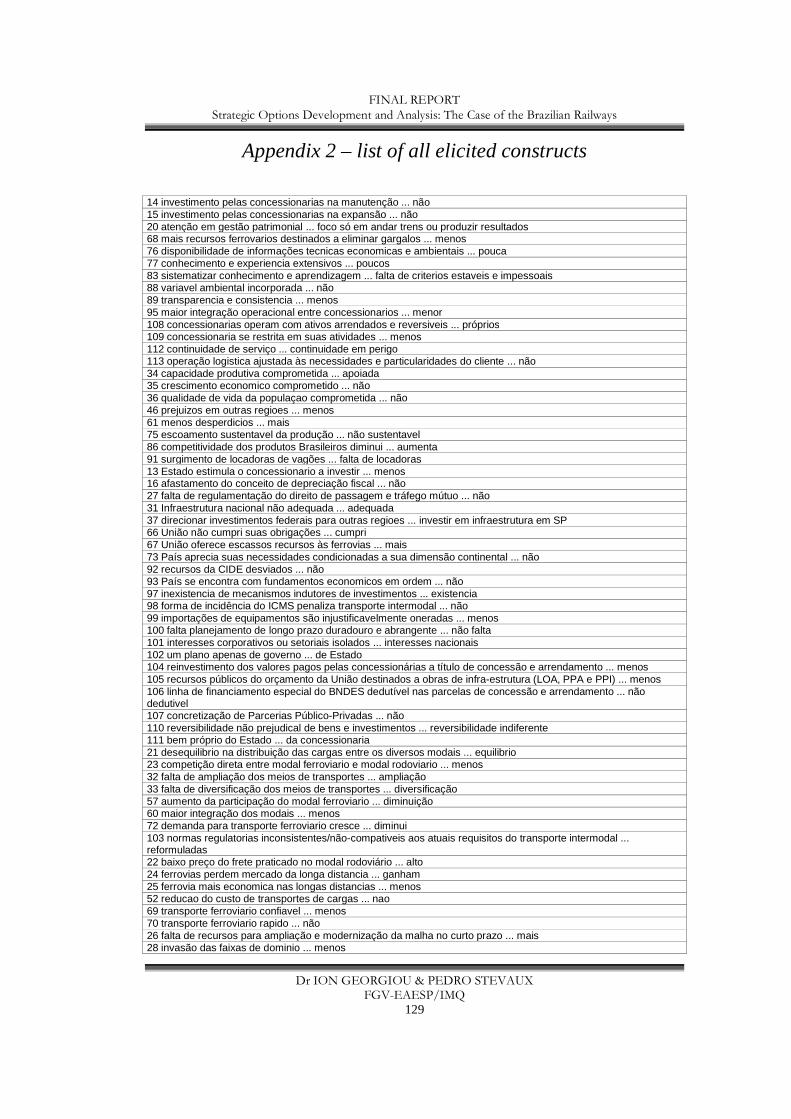
FINAL REPORT Strategic Options Development and Analysis: The Case of the Brazilian Railways
Dr ION GEORGIOU & PEDRO STEVAUX FGV-EAESP/IMQ
129
Appendix 2 – list of all elicited constructs
14 investimento pelas concessionarias na manutenção ... não 15 investimento pelas concessionarias na expansão ... não 20 atenção em gestão patrimonial ... foco só em andar trens ou produzir resultados 68 mais recursos ferrovarios destinados a eliminar gargalos ... menos 76 disponibilidade de informações tecnicas economicas e ambientais ... pouca 77 conhecimento e experiencia extensivos ... poucos 83 sistematizar conhecimento e aprendizagem ... falta de criterios estaveis e impessoais 88 variavel ambiental incorporada ... não 89 transparencia e consistencia ... menos 95 maior integração operacional entre concessionarios ... menor 108 concessionarias operam com ativos arrendados e reversiveis ... próprios 109 concessionaria se restrita em suas atividades ... menos 112 continuidade de serviço ... continuidade em perigo 113 operação logistica ajustada às necessidades e particularidades do cliente ... não 34 capacidade produtiva comprometida ... apoiada 35 crescimento economico comprometido ... não 36 qualidade de vida da populaçao comprometida ... não 46 prejuizos em outras regioes ... menos 61 menos desperdicios ... mais 75 escoamento sustentavel da produção ... não sustentavel 86 competitividade dos produtos Brasileiros diminui ... aumenta 91 surgimento de locadoras de vagões ... falta de locadoras 13 Estado estimula o concessionario a investir ... menos 16 afastamento do conceito de depreciação fiscal ... não 27 falta de regulamentação do direito de passagem e tráfego mútuo ... não 31 Infraestrutura nacional não adequada ... adequada 37 direcionar investimentos federais para outras regioes ... investir em infraestrutura em SP 66 União não cumpri suas obrigações ... cumpri 67 União oferece escassos recursos às ferrovias ... mais 73 País aprecia suas necessidades condicionadas a sua dimensão continental ... não 92 recursos da CIDE desviados ... não 93 País se encontra com fundamentos economicos em ordem ... não 97 inexistencia de mecanismos indutores de investimentos ... existencia 98 forma de incidência do ICMS penaliza transporte intermodal ... não 99 importações de equipamentos são injustificavelmente oneradas ... menos 100 falta planejamento de longo prazo duradouro e abrangente ... não falta 101 interesses corporativos ou setoriais isolados ... interesses nacionais 102 um plano apenas de governo ... de Estado 104 reinvestimento dos valores pagos pelas concessionárias a título de concessão e arrendamento ... menos 105 recursos públicos do orçamento da União destinados a obras de infra-estrutura (LOA, PPA e PPI) ... menos 106 linha de financiamento especial do BNDES dedutível nas parcelas de concessão e arrendamento ... não dedutivel 107 concretização de Parcerias Público-Privadas ... não 110 reversibilidade não prejudical de bens e investimentos ... reversibilidade indiferente 111 bem próprio do Estado ... da concessionaria 21 desequilibrio na distribuição das cargas entre os diversos modais ... equilibrio 23 competição direta entre modal ferroviario e modal rodoviario ... menos 32 falta de ampliação dos meios de transportes ... ampliação 33 falta de diversificação dos meios de transportes ... diversificação 57 aumento da participação do modal ferroviario ... diminuição 60 maior integração dos modais ... menos 72 demanda para transporte ferroviario cresce ... diminui 103 normas regulatorias inconsistentes/não-compativeis aos atuais requisitos do transporte intermodal ... reformuladas 22 baixo preço do frete praticado no modal rodoviário ... alto 24 ferrovias perdem mercado da longa distancia ... ganham 25 ferrovia mais economica nas longas distancias ... menos 52 reducao do custo de transportes de cargas ... nao 69 transporte ferroviario confiavel ... menos 70 transporte ferroviario rapido ... não 26 falta de recursos para ampliação e modernização da malha no curto prazo ... mais 28 invasão das faixas de dominio ... menos
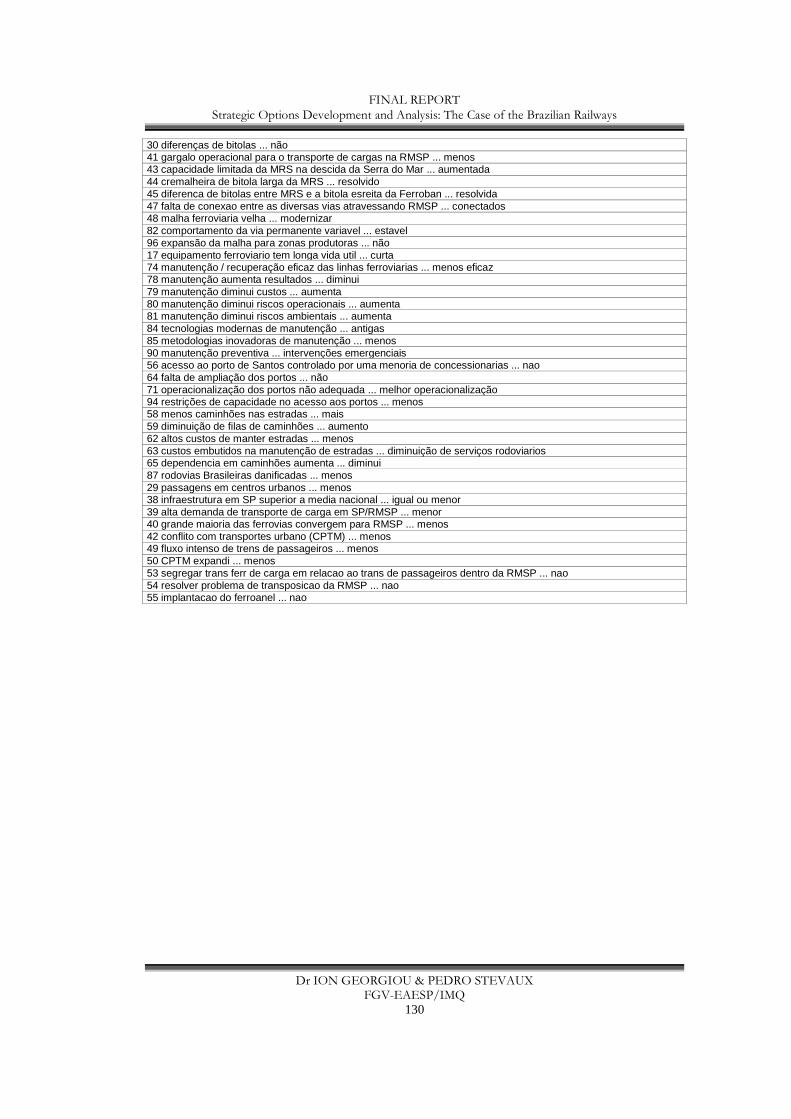
FINAL REPORT Strategic Options Development and Analysis: The Case of the Brazilian Railways
Dr ION GEORGIOU & PEDRO STEVAUX FGV-EAESP/IMQ
130
30 diferenças de bitolas ... não 41 gargalo operacional para o transporte de cargas na RMSP ... menos 43 capacidade limitada da MRS na descida da Serra do Mar ... aumentada 44 cremalheira de bitola larga da MRS ... resolvido 45 diferenca de bitolas entre MRS e a bitola esreita da Ferroban ... resolvida 47 falta de conexao entre as diversas vias atravessando RMSP ... conectados 48 malha ferroviaria velha ... modernizar 82 comportamento da via permanente variavel ... estavel 96 expansão da malha para zonas produtoras ... não 17 equipamento ferroviario tem longa vida util ... curta 74 manutenção / recuperação eficaz das linhas ferroviarias ... menos eficaz 78 manutenção aumenta resultados ... diminui 79 manutenção diminui custos ... aumenta 80 manutenção diminui riscos operacionais ... aumenta 81 manutenção diminui riscos ambientais ... aumenta 84 tecnologias modernas de manutenção ... antigas 85 metodologias inovadoras de manutenção ... menos 90 manutenção preventiva ... intervenções emergenciais 56 acesso ao porto de Santos controlado por uma menoria de concessionarias ... nao 64 falta de ampliação dos portos ... não 71 operacionalização dos portos não adequada ... melhor operacionalização 94 restrições de capacidade no acesso aos portos ... menos 58 menos caminhões nas estradas ... mais 59 diminuição de filas de caminhões ... aumento 62 altos custos de manter estradas ... menos 63 custos embutidos na manutenção de estradas ... diminuição de serviços rodoviarios 65 dependencia em caminhões aumenta ... diminui 87 rodovias Brasileiras danificadas ... menos 29 passagens em centros urbanos ... menos 38 infraestrutura em SP superior a media nacional ... igual ou menor 39 alta demanda de transporte de carga em SP/RMSP ... menor 40 grande maioria das ferrovias convergem para RMSP ... menos 42 conflito com transportes urbano (CPTM) ... menos 49 fluxo intenso de trens de passageiros ... menos 50 CPTM expandi ... menos 53 segregar trans ferr de carga em relacao ao trans de passageiros dentro da RMSP ... nao 54 resolver problema de transposicao da RMSP ... nao 55 implantacao do ferroanel ... nao
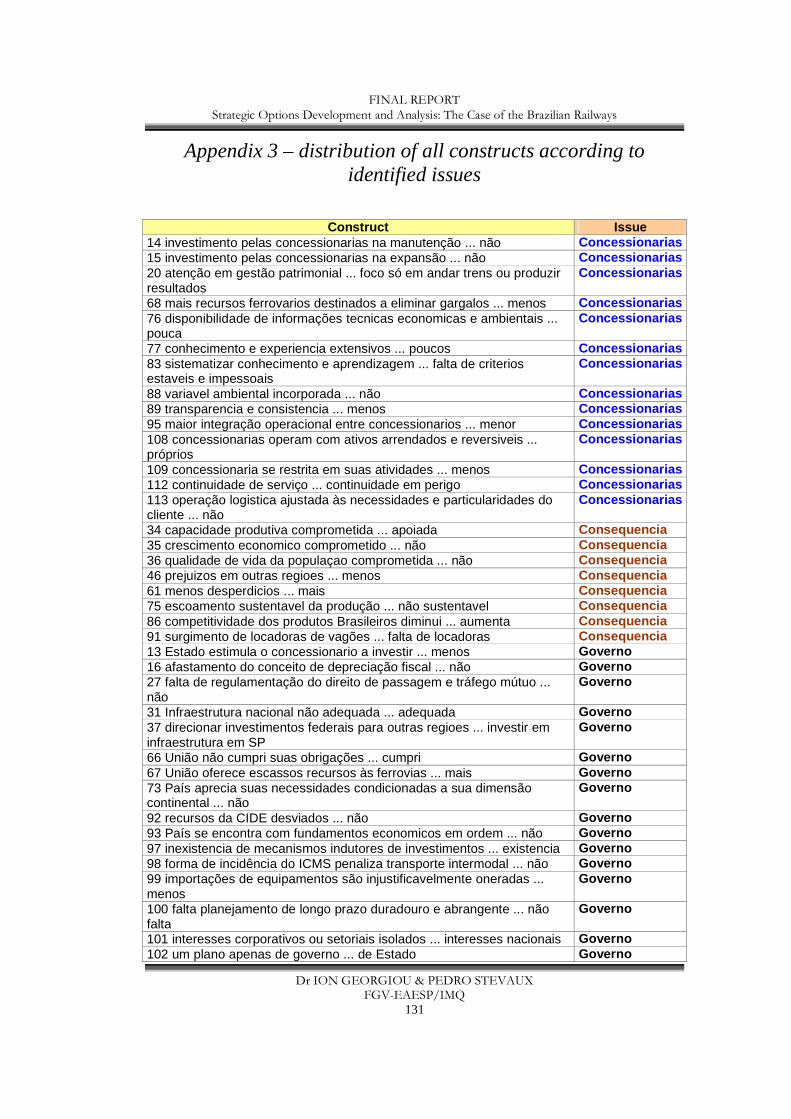
FINAL REPORT Strategic Options Development and Analysis: The Case of the Brazilian Railways
Dr ION GEORGIOU & PEDRO STEVAUX FGV-EAESP/IMQ
131
Appendix 3 – distribution of all constructs according to identified issues
Construct Issue 14 investimento pelas concessionarias na manutenção ... não Concessionarias 15 investimento pelas concessionarias na expansão ... não Concessionarias 20 atenção em gestão patrimonial ... foco só em andar trens ou produzir resultados
Concessionarias
68 mais recursos ferrovarios destinados a eliminar gargalos ... menos Concessionarias 76 disponibilidade de informações tecnicas economicas e ambientais ... pouca
Concessionarias
77 conhecimento e experiencia extensivos ... poucos Concessionarias 83 sistematizar conhecimento e aprendizagem ... falta de criterios estaveis e impessoais
Concessionarias
88 variavel ambiental incorporada ... não Concessionarias 89 transparencia e consistencia ... menos Concess ionarias 95 maior integração operacional entre concessionarios ... menor Concessionarias 108 concessionarias operam com ativos arrendados e reversiveis ... próprios
Concessionarias
109 concessionaria se restrita em suas atividades ... menos Concessionar ias 112 continuidade de serviço ... continuidade em perigo Concessionarias 113 operação logistica ajustada às necessidades e particularidades do cliente ... não
Concessionarias
34 capacidade produtiva comprometida ... apoiada Consequencia 35 crescimento economico comprometido ... não Consequencia 36 qualidade de vida da populaçao comprometida ... não Consequencia 46 prejuizos em outras regioes ... menos Consequencia 61 menos desperdicios ... mais Consequencia 75 escoamento sustentavel da produção ... não sustentavel Consequencia 86 competitividade dos produtos Brasileiros diminui ... aumenta Consequencia 91 surgimento de locadoras de vagões ... falta de locadoras Consequencia 13 Estado estimula o concessionario a investir ... menos Governo 16 afastamento do conceito de depreciação fiscal ... não Governo 27 falta de regulamentação do direito de passagem e tráfego mútuo ... não
Governo
31 Infraestrutura nacional não adequada ... adequada Governo 37 direcionar investimentos federais para outras regioes ... investir em infraestrutura em SP
Governo
66 União não cumpri suas obrigações ... cumpri Governo 67 União oferece escassos recursos às ferrovias ... mais Governo 73 País aprecia suas necessidades condicionadas a sua dimensão continental ... não
Governo
92 recursos da CIDE desviados ... não Governo 93 País se encontra com fundamentos economicos em ordem ... não Governo 97 inexistencia de mecanismos indutores de investimentos ... existencia Governo 98 forma de incidência do ICMS penaliza transporte intermodal ... não Governo 99 importações de equipamentos são injustificavelmente oneradas ... menos
Governo
100 falta planejamento de longo prazo duradouro e abrangente ... não falta
Governo
101 interesses corporativos ou setoriais isolados ... interesses nacionais Governo 102 um plano apenas de governo ... de Estado Governo
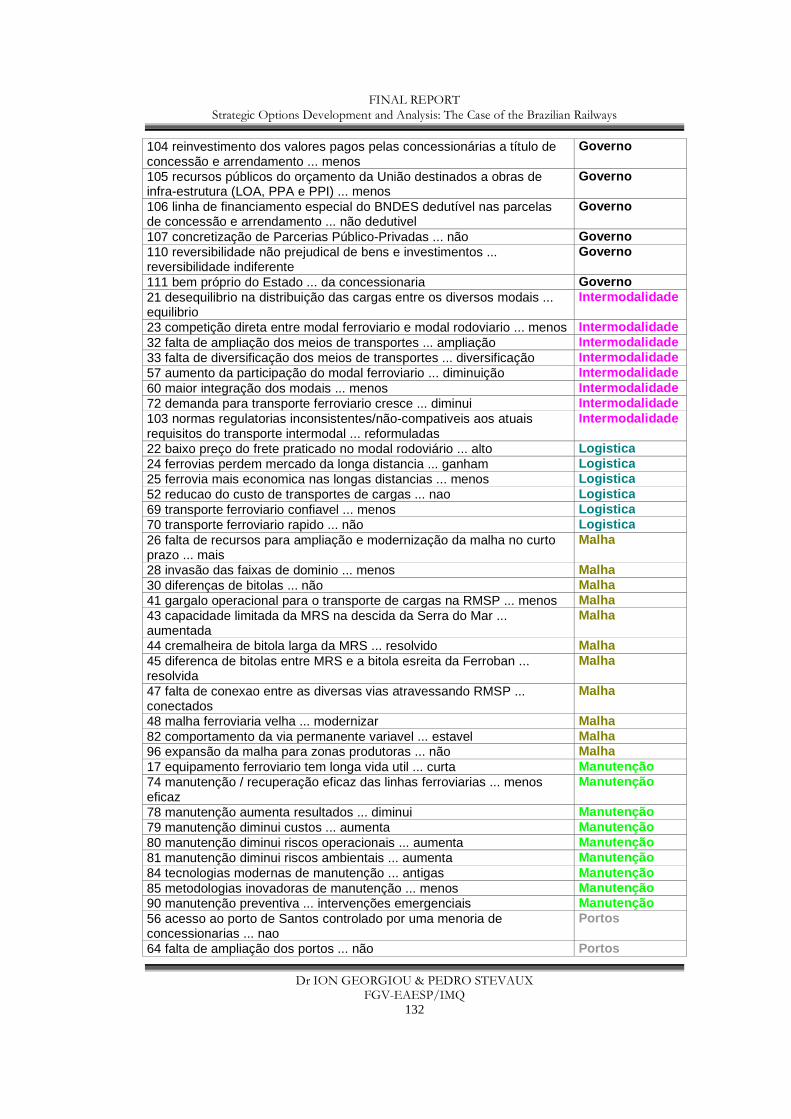
FINAL REPORT Strategic Options Development and Analysis: The Case of the Brazilian Railways
Dr ION GEORGIOU & PEDRO STEVAUX FGV-EAESP/IMQ
132
104 reinvestimento dos valores pagos pelas concessionárias a título de concessão e arrendamento ... menos
Governo
105 recursos públicos do orçamento da União destinados a obras de infra-estrutura (LOA, PPA e PPI) ... menos
Governo
106 linha de financiamento especial do BNDES dedutível nas parcelas de concessão e arrendamento ... não dedutivel
Governo
107 concretização de Parcerias Público-Privadas ... não Governo 110 reversibilidade não prejudical de bens e investimentos ... reversibilidade indiferente
Governo
111 bem próprio do Estado ... da concessionaria Governo 21 desequilibrio na distribuição das cargas entre os diversos modais ... equilibrio
Intermodalidade
23 competição direta entre modal ferroviario e modal rodoviario ... menos Intermodalidade 32 falta de ampliação dos meios de transportes ... ampliação Intermodalidade 33 falta de diversificação dos meios de transportes ... diversificação Intermodalidade 57 aumento da participação do modal ferroviario ... diminuição Intermodalidade 60 maior integração dos modais ... menos Intermodalidade 72 demanda para transporte ferroviario cresce ... diminui Intermodalidade 103 normas regulatorias inconsistentes/não-compativeis aos atuais requisitos do transporte intermodal ... reformuladas
Intermodalidade
22 baixo preço do frete praticado no modal rodoviário ... alto Logistica 24 ferrovias perdem mercado da longa distancia ... ganham Logistica 25 ferrovia mais economica nas longas distancias ... menos Logistica 52 reducao do custo de transportes de cargas ... nao Logistica 69 transporte ferroviario confiavel ... menos Logistica 70 transporte ferroviario rapido ... não Logistica 26 falta de recursos para ampliação e modernização da malha no curto prazo ... mais
Malha
28 invasão das faixas de dominio ... menos Malha 30 diferenças de bitolas ... não Malha 41 gargalo operacional para o transporte de cargas na RMSP ... menos Malha 43 capacidade limitada da MRS na descida da Serra do Mar ... aumentada
Malha
44 cremalheira de bitola larga da MRS ... resolvido Malha 45 diferenca de bitolas entre MRS e a bitola esreita da Ferroban ... resolvida
Malha
47 falta de conexao entre as diversas vias atravessando RMSP ... conectados
Malha
48 malha ferroviaria velha ... modernizar Malha 82 comportamento da via permanente variavel ... estavel Malha 96 expansão da malha para zonas produtoras ... não Malha 17 equipamento ferroviario tem longa vida util ... curta Manutenção 74 manutenção / recuperação eficaz das linhas ferroviarias ... menos eficaz
Manutenção
78 manutenção aumenta resultados ... diminui Manutenção 79 manutenção diminui custos ... aumenta Manutenção 80 manutenção diminui riscos operacionais ... aumenta Manutenç ão 81 manutenção diminui riscos ambientais ... aumenta Manutenção 84 tecnologias modernas de manutenção ... antigas Manutenção 85 metodologias inovadoras de manutenção ... menos Manutenção 90 manutenção preventiva ... intervenções emergenciais Manutenç ão 56 acesso ao porto de Santos controlado por uma menoria de concessionarias ... nao
Portos
64 falta de ampliação dos portos ... não Portos
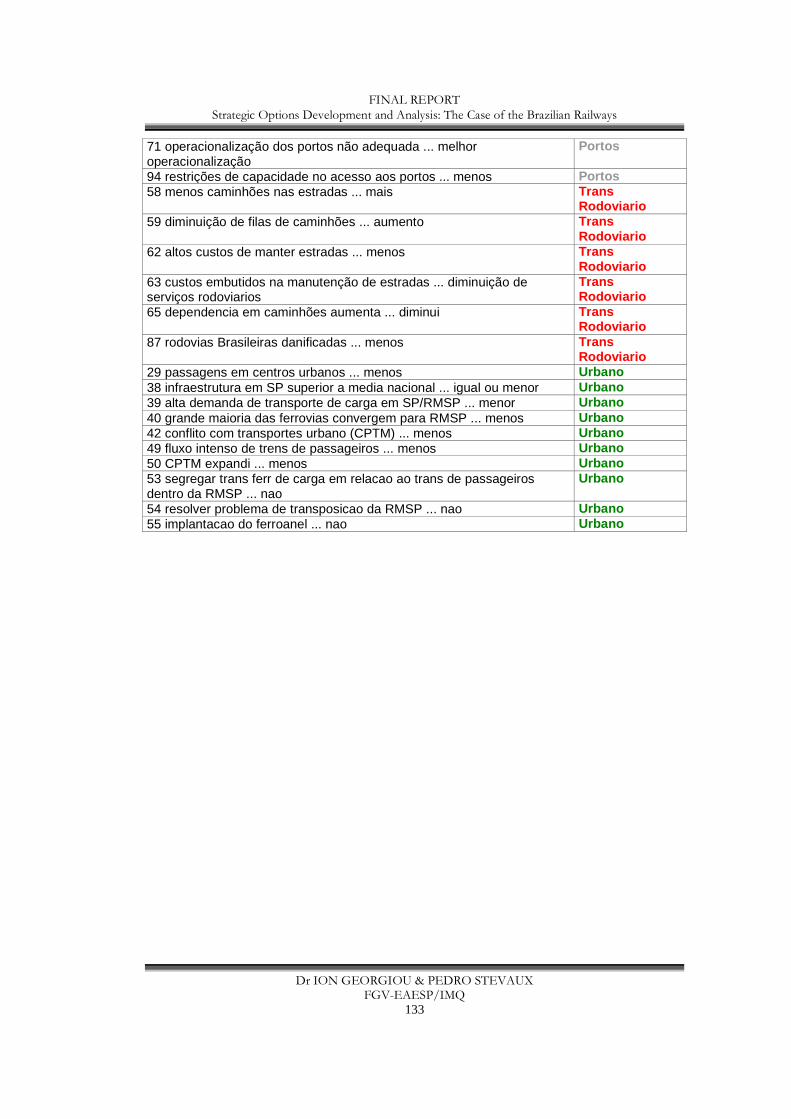
FINAL REPORT Strategic Options Development and Analysis: The Case of the Brazilian Railways
Dr ION GEORGIOU & PEDRO STEVAUX FGV-EAESP/IMQ
133
71 operacionalização dos portos não adequada ... melhor operacionalização
Portos
94 restrições de capacidade no acesso aos portos ... menos Portos 58 menos caminhões nas estradas ... mais Trans
Rodoviario 59 diminuição de filas de caminhões ... aumento Trans
Rodoviario 62 altos custos de manter estradas ... menos Trans
Rodoviario 63 custos embutidos na manutenção de estradas ... diminuição de serviços rodoviarios
Trans Rodoviario
65 dependencia em caminhões aumenta ... diminui Trans Rodoviario
87 rodovias Brasileiras danificadas ... menos Trans Rodoviario
29 passagens em centros urbanos ... menos Urbano 38 infraestrutura em SP superior a media nacional ... igual ou menor Urbano 39 alta demanda de transporte de carga em SP/RMSP ... menor Urbano 40 grande maioria das ferrovias convergem para RMSP ... menos Urbano 42 conflito com transportes urbano (CPTM) ... menos Urbano 49 fluxo intenso de trens de passageiros ... menos Urbano 50 CPTM expandi ... menos Urbano 53 segregar trans ferr de carga em relacao ao trans de passageiros dentro da RMSP ... nao
Urbano
54 resolver problema de transposicao da RMSP ... nao Urbano 55 implantacao do ferroanel ... nao Urbano

FINAL REPORT Strategic Options Development and Analysis: The Case of the Brazilian Railways
Dr ION GEORGIOU & PEDRO STEVAUX FGV-EAESP/IMQ
135
Appendix 4 – maps of all individual actors’ articles with supplementary data
The maps included in this appendix are those that were designed during the initial phase of the research. As discussed in Chapter 3, constructs were elicited from each actor and mutual exclusive allocations of constructs were made between actors. Thus, if two actors mentioned the same, or a similar, construct, the one whom the research had identified as having mentioned it first was assigned that construct. All actors were color-coded. The constructs respectively assigned to them were color-coded accordingly. This color coding is shown in this appendix for the following items: the name of the actor as well as the map on display.
Example:
Neves is color-coded in purple. In the map on display (this actor’s map), those constructs assigned to him are also in purple.
The maps may be read and studied in conjunction with the respective actor’s article given in Appendix 1.
***
As Chapter 3 mentions, constructs were eventually categorized according to issues rather than actors. In that, more advanced, phase of the research, the color-coding of the actors became irrelevant. Rather, the issues themselves were color-coded. Constructs assigned to a specific issue were, in turn, color-coded according to that specific issue. In what follows, there are two tables to the right of each actor’s map. The colors in these tables reflect the colors of the issues. Any resemblance to the initial color-coding of the actors should now be ignored.
The table at the top lists the issues, followed by the total number of constructs belonging to each issue. This is followed by the total number of constructs, categorized within the respective issue, addressed by the actor in question. This table therefore provides information on the issues addressed by an actor. The number of constructs within an issue that an actor addressed gives an idea of the degree of focus placed by the actor on the issue in question.
The table below provides similar information in percentage terms. The first column is the percentage of constructs evident in the overall model that are categorized under the respective issue. This percentage therefore provides an indication of the degree to which the overall map is saturated by a particular issue. The second column is the percentage of constructs categorized under a particular issue that are addressed by an actor. This provides an indication of the degree to which an issue is addressed by an actor.
***
The bottom row of each table shows the total list of constructs addressed by the actor. These constructs are in the map as well. In the bottom row, however, more information about them is provided. For instance:
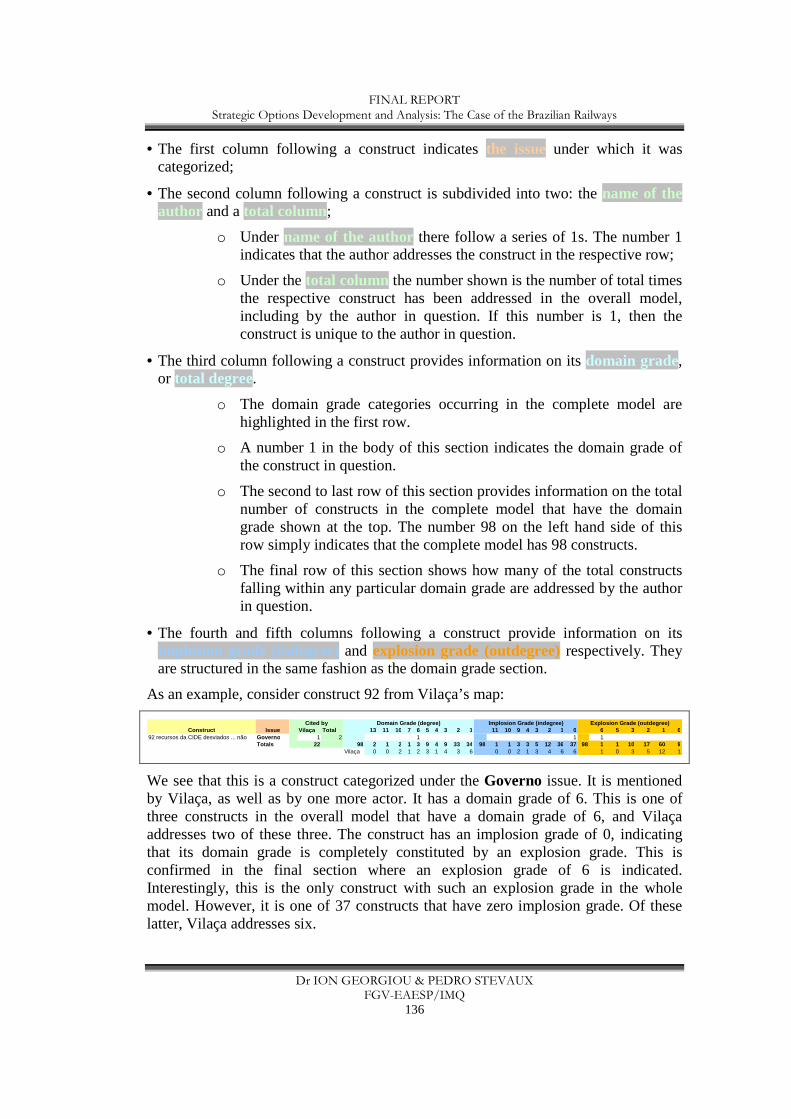
FINAL REPORT Strategic Options Development and Analysis: The Case of the Brazilian Railways
Dr ION GEORGIOU & PEDRO STEVAUX FGV-EAESP/IMQ
136
• The first column following a construct indicates the issue under which it was categorized;
• The second column following a construct is subdivided into two: the name of the author and a total column;
o Under name of the author there follow a series of 1s. The number 1 indicates that the author addresses the construct in the respective row;
o Under the total column the number shown is the number of total times the respective construct has been addressed in the overall model, including by the author in question. If this number is 1, then the construct is unique to the author in question.
• The third column following a construct provides information on its domain grade, or total degree.
o The domain grade categories occurring in the complete model are highlighted in the first row.
o A number 1 in the body of this section indicates the domain grade of the construct in question.
o The second to last row of this section provides information on the total number of constructs in the complete model that have the domain grade shown at the top. The number 98 on the left hand side of this row simply indicates that the complete model has 98 constructs.
o The final row of this section shows how many of the total constructs falling within any particular domain grade are addressed by the author in question.
• The fourth and fifth columns following a construct provide information on its implosion grade (indegree) and explosion grade (outdegree) respectively. They are structured in the same fashion as the domain grade section.
As an example, consider construct 92 from Vilaça’s map:
Construct Vilaça Total 13 11 10 7 6 5 4 3 2 1 11 10 9 4 3 2 1 0 6 5 3 2 1 092 recursos da CIDE desviados ... não Governo 1 2 1 1 1
Totals 22 98 2 1 2 1 3 9 4 9 33 34 98 1 1 3 3 5 12 36 37 98 1 1 10 17 60 9Vilaça 0 0 2 1 2 3 1 4 3 6 0 0 2 1 3 4 6 6 1 0 3 5 12 1
Implosion Grade (indegree) Explosion Grade (outdegree)Issue
Cited by Domain Grade (degree)
We see that this is a construct categorized under the Governo issue. It is mentioned by Vilaça, as well as by one more actor. It has a domain grade of 6. This is one of three constructs in the overall model that have a domain grade of 6, and Vilaça addresses two of these three. The construct has an implosion grade of 0, indicating that its domain grade is completely constituted by an explosion grade. This is confirmed in the final section where an explosion grade of 6 is indicated. Interestingly, this is the only construct with such an explosion grade in the whole model. However, it is one of 37 constructs that have zero implosion grade. Of these latter, Vilaça addresses six.
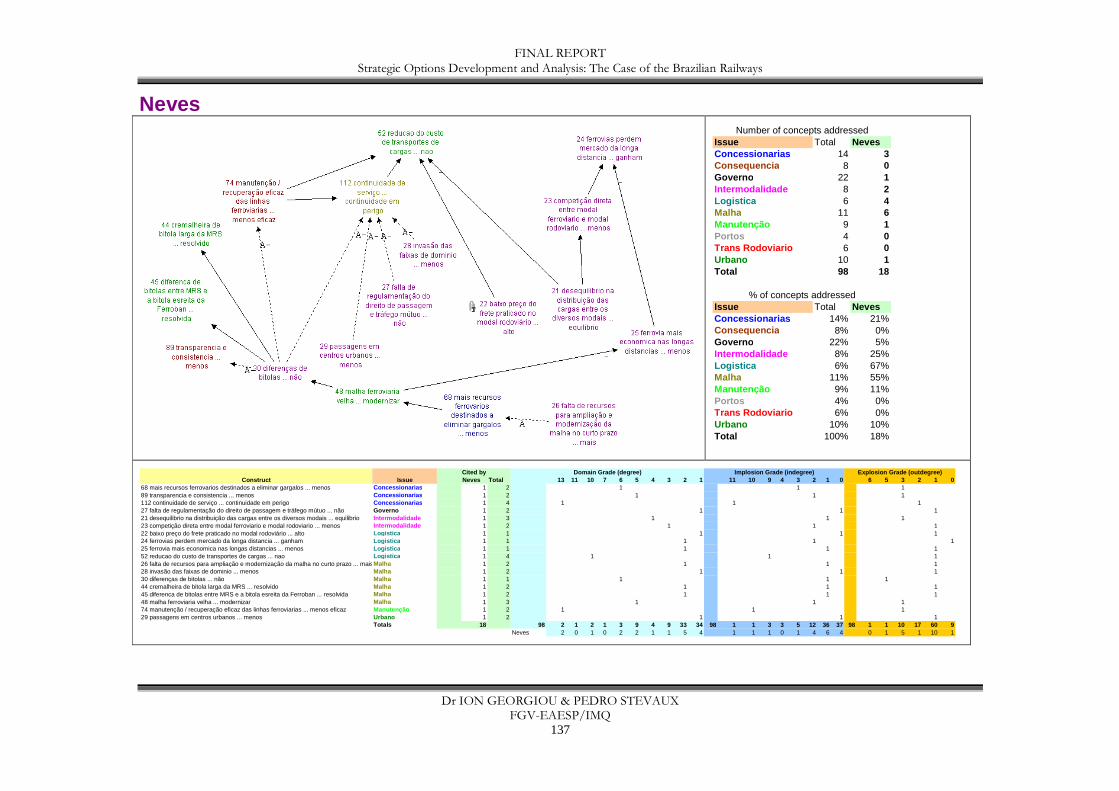
FINAL REPORT Strategic Options Development and Analysis: The Case of the Brazilian Railways
Dr ION GEORGIOU & PEDRO STEVAUX FGV-EAESP/IMQ
137
Neves
Issue Total NevesConcessionarias 14 3Consequencia 8 0Governo 22 1Intermodalidade 8 2Logistica 6 4Malha 11 6Manutenção 9 1Portos 4 0Trans Rodoviario 6 0Urbano 10 1Total 98 18
Issue Total NevesConcessionarias 14% 21%Consequencia 8% 0%Governo 22% 5%Intermodalidade 8% 25%Logistica 6% 67%Malha 11% 55%Manutenção 9% 11%Portos 4% 0%Trans Rodoviario 6% 0%Urbano 10% 10%Total 100% 18%
Number of concepts addressed
% of concepts addressed
Construct Neves Total 13 11 10 7 6 5 4 3 2 1 11 10 9 4 3 2 1 0 6 5 3 2 1 068 mais recursos ferrovarios destinados a eliminar gargalos ... menos Concessionarias 1 2 1 1 189 transparencia e consistencia ... menos Concessionarias 1 2 1 1 1112 continuidade de serviço ... continuidade em perigo Concessionarias 1 4 1 1 127 falta de regulamentação do direito de passagem e tráfego mútuo ... não Governo 1 2 1 1 121 desequilibrio na distribuição das cargas entre os diversos modais ... equilibrio Intermodalidade 1 3 1 1 123 competição direta entre modal ferroviario e modal rodoviario ... menos Intermodalidade 1 2 1 1 122 baixo preço do frete praticado no modal rodoviário ... alto Logistica 1 1 1 1 124 ferrovias perdem mercado da longa distancia ... ganham Logistica 1 1 1 1 125 ferrovia mais economica nas longas distancias ... menos Logistica 1 1 1 1 152 reducao do custo de transportes de cargas ... nao Logistica 1 4 1 1 126 falta de recursos para ampliação e modernização da malha no curto prazo ... maisMalha 1 2 1 1 128 invasão das faixas de dominio ... menos Malha 1 2 1 1 130 diferenças de bitolas ... não Malha 1 1 1 1 144 cremalheira de bitola larga da MRS ... resolvido Malha 1 2 1 1 145 diferenca de bitolas entre MRS e a bitola esreita da Ferroban ... resolvida Malha 1 2 1 1 148 malha ferroviaria velha ... modernizar Malha 1 3 1 1 174 manutenção / recuperação eficaz das linhas ferroviarias ... menos eficaz Manutenção 1 2 1 1 129 passagens em centros urbanos ... menos Urbano 1 2 1 1 1
Totals 18 98 2 1 2 1 3 9 4 9 33 34 98 1 1 3 3 5 12 36 37 98 1 1 10 17 60 9Neves 2 0 1 0 2 2 1 1 5 4 1 1 1 0 1 4 6 4 0 1 5 1 10 1
Explosion Grade (outdegree)Issue
Cited by Domain Grade (degree) Implosion Grade (indeg ree)

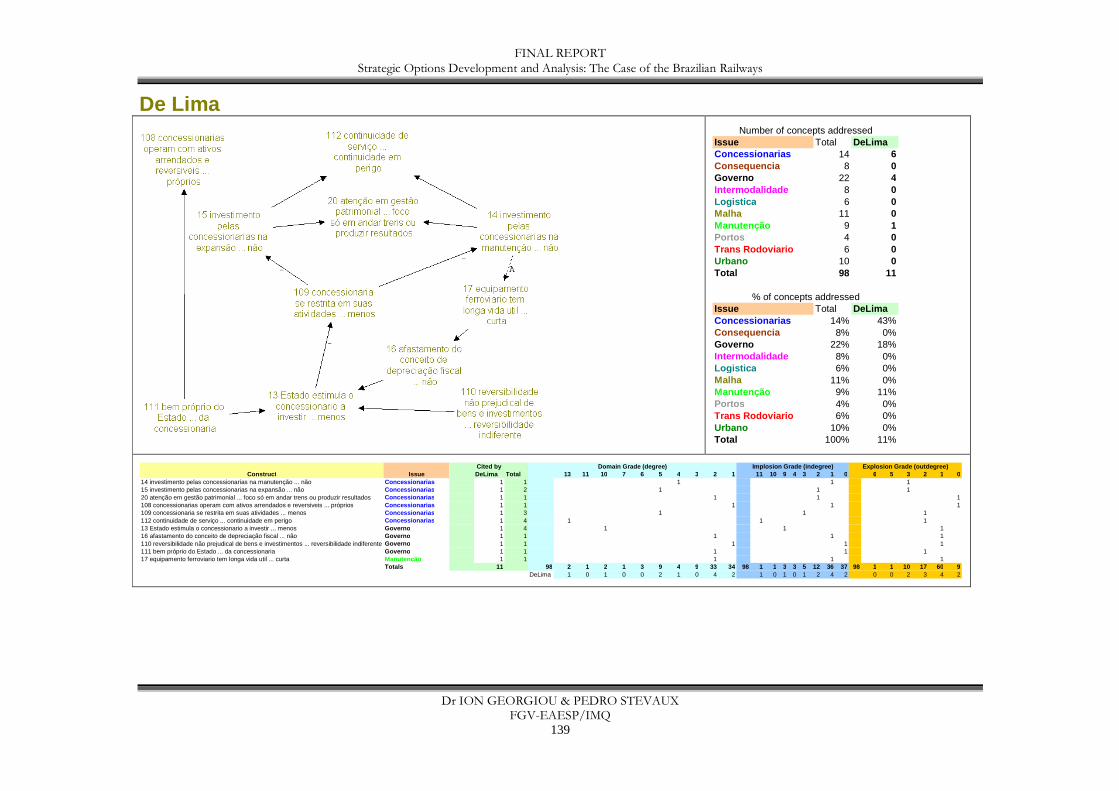
FINAL REPORT Strategic Options Development and Analysis: The Case of the Brazilian Railways
Dr ION GEORGIOU & PEDRO STEVAUX FGV-EAESP/IMQ
139
De Lima
Issue Total DeLimaConcessionarias 14 6Consequencia 8 0Governo 22 4Intermodalidade 8 0Logistica 6 0Malha 11 0Manutenção 9 1Portos 4 0Trans Rodoviario 6 0Urbano 10 0Total 98 11
Issue Total DeLimaConcessionarias 14% 43%Consequencia 8% 0%Governo 22% 18%Intermodalidade 8% 0%Logistica 6% 0%Malha 11% 0%Manutenção 9% 11%Portos 4% 0%Trans Rodoviario 6% 0%Urbano 10% 0%Total 100% 11%
Number of concepts addressed
% of concepts addressed
Construct DeLima Total 13 11 10 7 6 5 4 3 2 1 11 10 9 4 3 2 1 0 6 5 3 2 1 014 investimento pelas concessionarias na manutenção ... não Concessionarias 1 1 1 1 115 investimento pelas concessionarias na expansão ... não Concessionarias 1 2 1 1 120 atenção em gestão patrimonial ... foco só em andar trens ou produzir resultados Concessionarias 1 1 1 1 1108 concessionarias operam com ativos arrendados e reversiveis ... próprios Concessionarias 1 1 1 1 1109 concessionaria se restrita em suas atividades ... menos Concessionarias 1 3 1 1 1112 continuidade de serviço ... continuidade em perigo Concessionarias 1 4 1 1 113 Estado estimula o concessionario a investir ... menos Governo 1 4 1 1 116 afastamento do conceito de depreciação fiscal ... não Governo 1 1 1 1 1110 reversibilidade não prejudical de bens e investimentos ... reversibilidade indiferente Governo 1 1 1 1 1111 bem próprio do Estado ... da concessionaria Governo 1 1 1 1 117 equipamento ferroviario tem longa vida util ... curta Manutenção 1 1 1 1 1
Totals 11 98 2 1 2 1 3 9 4 9 33 34 98 1 1 3 3 5 12 36 37 98 1 1 10 17 60 9DeLima 1 0 1 0 0 2 1 0 4 2 1 0 1 0 1 2 4 2 0 0 2 3 4 2
Implosion Grade (indegree) Explosion Grade (outdegre e)Issue
Cited by Domain Grade (degree)

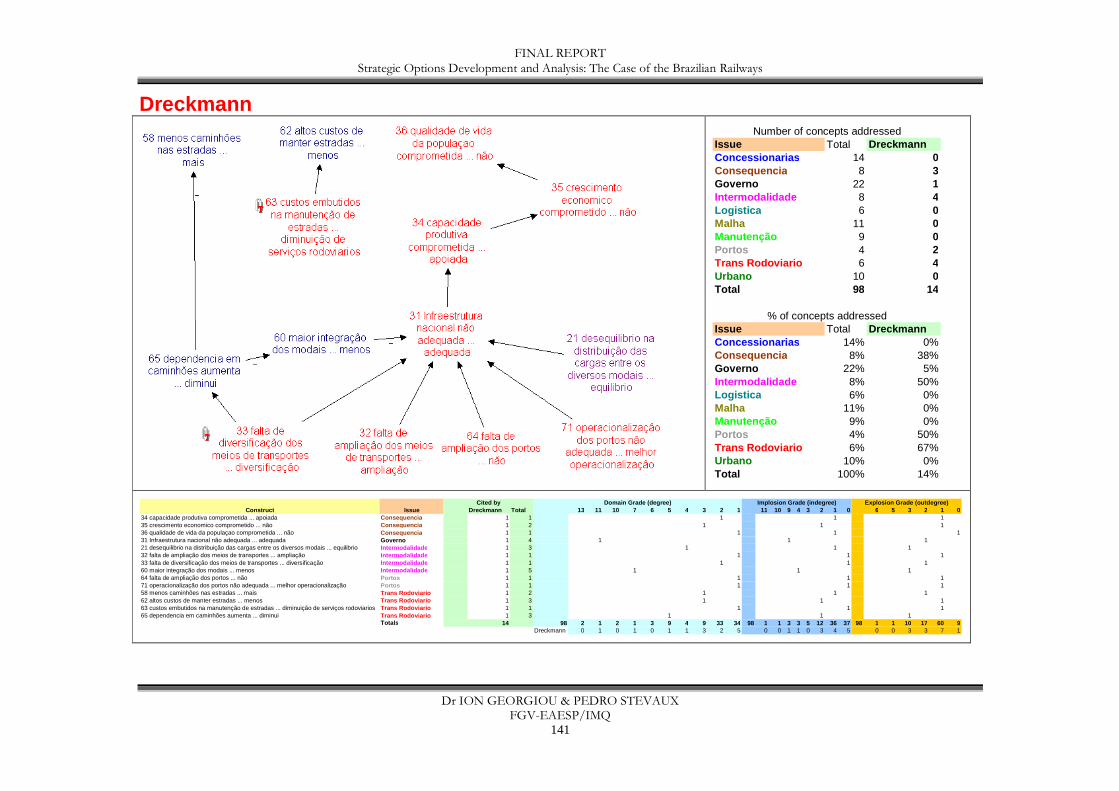
FINAL REPORT Strategic Options Development and Analysis: The Case of the Brazilian Railways
Dr ION GEORGIOU & PEDRO STEVAUX FGV-EAESP/IMQ
141
Dreckmann
Issue Total DreckmannConcessionarias 14 0Consequencia 8 3Governo 22 1Intermodalidade 8 4Logistica 6 0Malha 11 0Manutenção 9 0Portos 4 2Trans Rodoviario 6 4Urbano 10 0Total 98 14
Issue Total DreckmannConcessionarias 14% 0%Consequencia 8% 38%Governo 22% 5%Intermodalidade 8% 50%Logistica 6% 0%Malha 11% 0%Manutenção 9% 0%Portos 4% 50%Trans Rodoviario 6% 67%Urbano 10% 0%Total 100% 14%
Number of concepts addressed
% of concepts addressed
Construct Dreckmann Total 13 11 10 7 6 5 4 3 2 1 11 10 9 4 3 2 1 0 6 5 3 2 1 034 capacidade produtiva comprometida ... apoiada Consequencia 1 1 1 1 135 crescimento economico comprometido ... não Consequencia 1 2 1 1 136 qualidade de vida da populaçao comprometida ... não Consequencia 1 1 1 1 131 Infraestrutura nacional não adequada ... adequada Governo 1 4 1 1 121 desequilibrio na distribuição das cargas entre os diversos modais ... equilibrio Intermodalidade 1 3 1 1 132 falta de ampliação dos meios de transportes ... ampliação Intermodalidade 1 1 1 1 133 falta de diversificação dos meios de transportes ... diversificação Intermodalidade 1 1 1 1 160 maior integração dos modais ... menos Intermodalidade 1 5 1 1 164 falta de ampliação dos portos ... não Portos 1 1 1 1 171 operacionalização dos portos não adequada ... melhor operacionalização Portos 1 1 1 1 158 menos caminhões nas estradas ... mais Trans Rodoviario 1 2 1 1 162 altos custos de manter estradas ... menos Trans Rodoviario 1 3 1 1 163 custos embutidos na manutenção de estradas ... diminuição de serviços rodoviarios Trans Rodoviario 1 1 1 1 165 dependencia em caminhões aumenta ... diminui Trans Rodoviario 1 3 1 1 1
Totals 14 98 2 1 2 1 3 9 4 9 33 34 98 1 1 3 3 5 12 36 37 98 1 1 10 17 60 9Dreckmann 0 1 0 1 0 1 1 3 2 5 0 0 1 1 0 3 4 5 0 0 3 3 7 1
Implosion Grade (indegree) Explosion Grade (outdegre e)Issue
Cited by Domain Grade (degree)

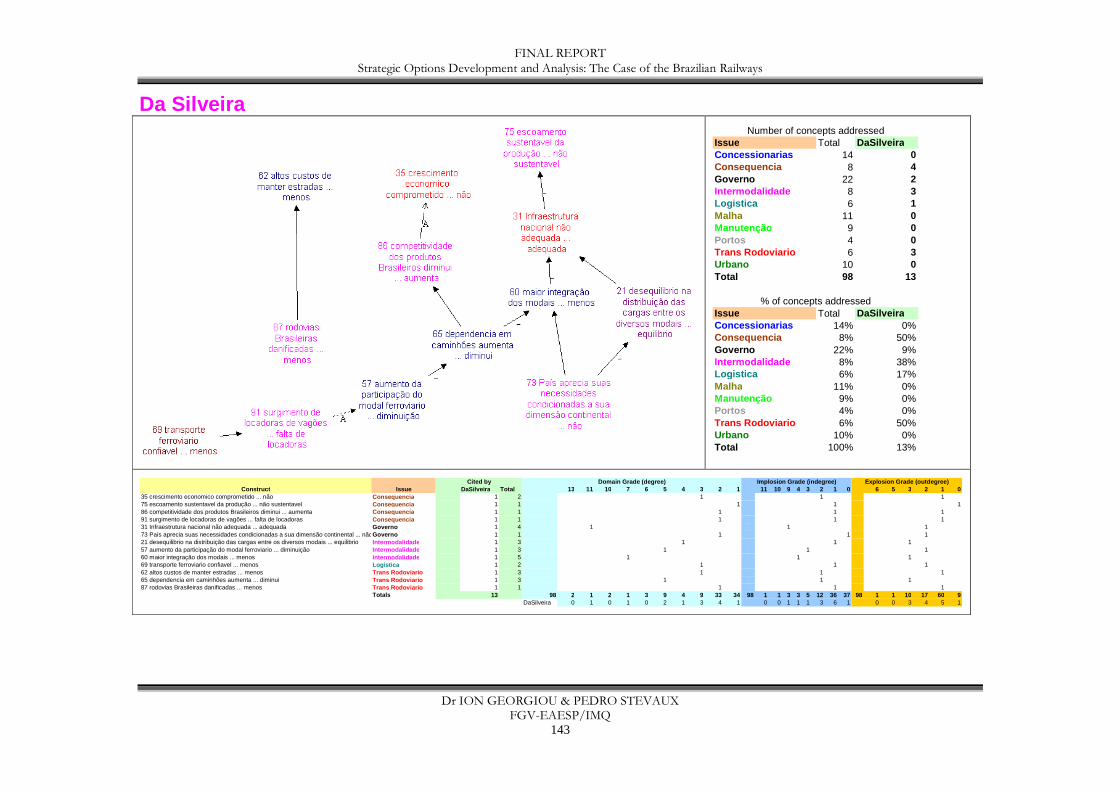
FINAL REPORT Strategic Options Development and Analysis: The Case of the Brazilian Railways
Dr ION GEORGIOU & PEDRO STEVAUX FGV-EAESP/IMQ
143
Da Silveira
Issue Total DaSilveiraConcessionarias 14 0Consequencia 8 4Governo 22 2Intermodalidade 8 3Logistica 6 1Malha 11 0Manutenção 9 0Portos 4 0Trans Rodoviario 6 3Urbano 10 0Total 98 13
Issue Total DaSilveiraConcessionarias 14% 0%Consequencia 8% 50%Governo 22% 9%Intermodalidade 8% 38%Logistica 6% 17%Malha 11% 0%Manutenção 9% 0%Portos 4% 0%Trans Rodoviario 6% 50%Urbano 10% 0%Total 100% 13%
Number of concepts addressed
% of concepts addressed
Construct DaSilveira Total 13 11 10 7 6 5 4 3 2 1 11 10 9 4 3 2 1 0 6 5 3 2 1 035 crescimento economico comprometido ... não Consequencia 1 2 1 1 175 escoamento sustentavel da produção ... não sustentavel Consequencia 1 1 1 1 186 competitividade dos produtos Brasileiros diminui ... aumenta Consequencia 1 1 1 1 191 surgimento de locadoras de vagões ... falta de locadoras Consequencia 1 1 1 1 131 Infraestrutura nacional não adequada ... adequada Governo 1 4 1 1 173 País aprecia suas necessidades condicionadas a sua dimensão continental ... nãoGoverno 1 1 1 1 121 desequilibrio na distribuição das cargas entre os diversos modais ... equilibrio Intermodalidade 1 3 1 1 157 aumento da participação do modal ferroviario ... diminuição Intermodalidade 1 3 1 1 160 maior integração dos modais ... menos Intermodalidade 1 5 1 1 169 transporte ferroviario confiavel ... menos Logistica 1 2 1 1 162 altos custos de manter estradas ... menos Trans Rodoviario 1 3 1 1 165 dependencia em caminhões aumenta ... diminui Trans Rodoviario 1 3 1 1 187 rodovias Brasileiras danificadas ... menos Trans Rodoviario 1 1 1 1 1
Totals 13 98 2 1 2 1 3 9 4 9 33 34 98 1 1 3 3 5 12 36 37 98 1 1 10 17 60 9DaSilveira 0 1 0 1 0 2 1 3 4 1 0 0 1 1 1 3 6 1 0 0 3 4 5 1
Implosion Grade (indegree) Explosion Grade (outdegre e)Issue
Cited by Domain Grade (degree)

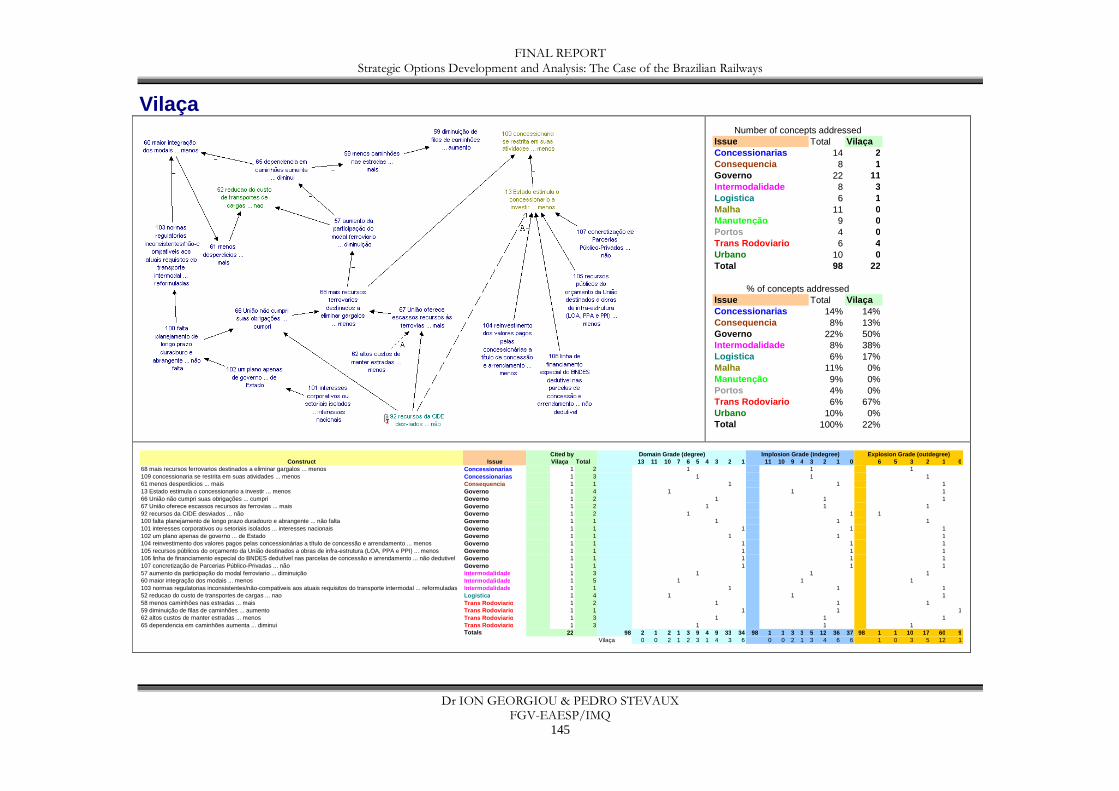
FINAL REPORT Strategic Options Development and Analysis: The Case of the Brazilian Railways
Dr ION GEORGIOU & PEDRO STEVAUX FGV-EAESP/IMQ
145
Vilaça
Issue Total VilaçaConcessionarias 14 2Consequencia 8 1Governo 22 11Intermodalidade 8 3Logistica 6 1Malha 11 0Manutenção 9 0Portos 4 0Trans Rodoviario 6 4Urbano 10 0Total 98 22
Issue Total VilaçaConcessionarias 14% 14%Consequencia 8% 13%Governo 22% 50%Intermodalidade 8% 38%Logistica 6% 17%Malha 11% 0%Manutenção 9% 0%Portos 4% 0%Trans Rodoviario 6% 67%Urbano 10% 0%Total 100% 22%
Number of concepts addressed
% of concepts addressed
Construct Vilaça Total 13 11 10 7 6 5 4 3 2 1 11 10 9 4 3 2 1 0 6 5 3 2 1 068 mais recursos ferrovarios destinados a eliminar gargalos ... menos Concessionarias 1 2 1 1 1109 concessionaria se restrita em suas atividades ... menos Concessionarias 1 3 1 1 161 menos desperdicios ... mais Consequencia 1 1 1 1 113 Estado estimula o concessionario a investir ... menos Governo 1 4 1 1 166 União não cumpri suas obrigações ... cumpri Governo 1 2 1 1 167 União oferece escassos recursos às ferrovias ... mais Governo 1 2 1 1 192 recursos da CIDE desviados ... não Governo 1 2 1 1 1100 falta planejamento de longo prazo duradouro e abrangente ... não falta Governo 1 1 1 1 1101 interesses corporativos ou setoriais isolados ... interesses nacionais Governo 1 1 1 1 1102 um plano apenas de governo ... de Estado Governo 1 1 1 1 1104 reinvestimento dos valores pagos pelas concessionárias a título de concessão e arrendamento ... menos Governo 1 1 1 1 1105 recursos públicos do orçamento da União destinados a obras de infra-estrutura (LOA, PPA e PPI) ... menos Governo 1 1 1 1 1106 linha de financiamento especial do BNDES dedutível nas parcelas de concessão e arrendamento ... não dedutivel Governo 1 1 1 1 1107 concretização de Parcerias Público-Privadas ... não Governo 1 1 1 1 157 aumento da participação do modal ferroviario ... diminuição Intermodalidade 1 3 1 1 160 maior integração dos modais ... menos Intermodalidade 1 5 1 1 1103 normas regulatorias inconsistentes/não-compativeis aos atuais requisitos do transporte intermodal ... reformuladas Intermodalidade 1 1 1 1 152 reducao do custo de transportes de cargas ... nao Logistica 1 4 1 1 158 menos caminhões nas estradas ... mais Trans Rodoviario 1 2 1 1 159 diminuição de filas de caminhões ... aumento Trans Rodoviario 1 1 1 1 162 altos custos de manter estradas ... menos Trans Rodoviario 1 3 1 1 165 dependencia em caminhões aumenta ... diminui Trans Rodoviario 1 3 1 1 1
Totals 22 98 2 1 2 1 3 9 4 9 33 34 98 1 1 3 3 5 12 36 37 98 1 1 10 17 60 9Vilaça 0 0 2 1 2 3 1 4 3 6 0 0 2 1 3 4 6 6 1 0 3 5 12 1
Implosion Grade (indegree) Explosion Grade (outdegre e)Issue
Cited by Domain Grade (degree)

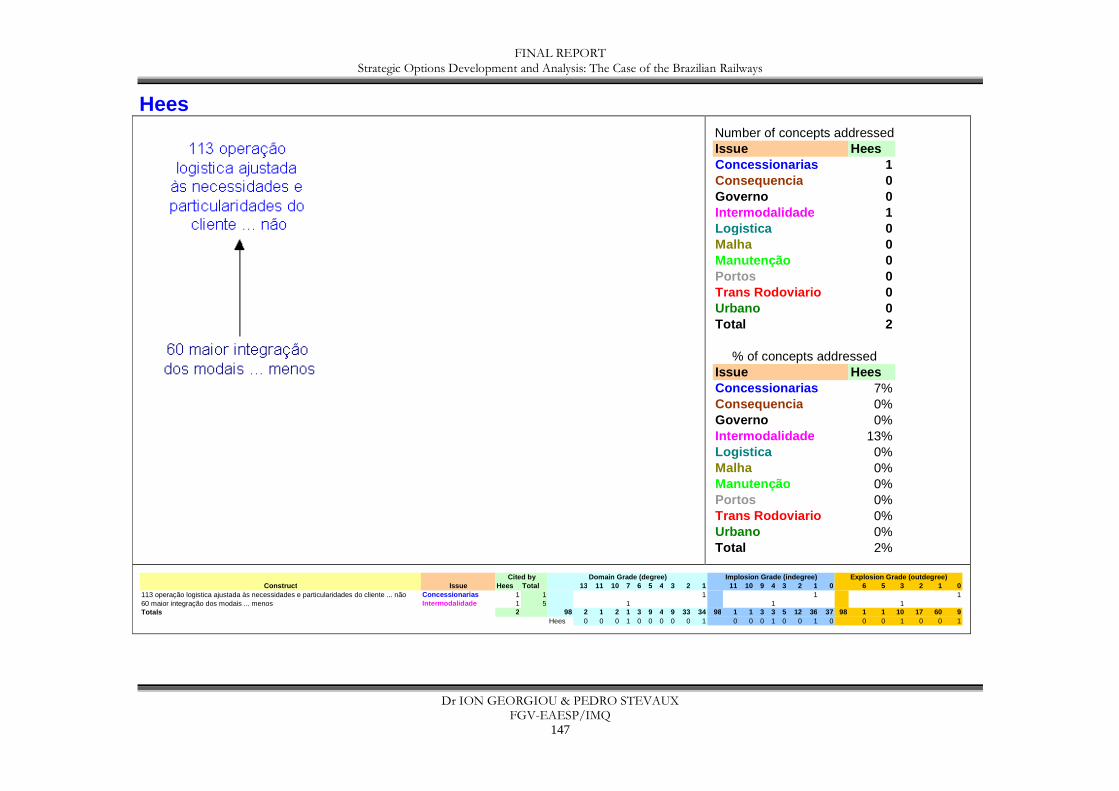
FINAL REPORT Strategic Options Development and Analysis: The Case of the Brazilian Railways
Dr ION GEORGIOU & PEDRO STEVAUX FGV-EAESP/IMQ
147
Hees
Issue HeesConcessionarias 1Consequencia 0Governo 0Intermodalidade 1Logistica 0Malha 0Manutenção 0Portos 0Trans Rodoviario 0Urbano 0Total 2
Issue HeesConcessionarias 7%Consequencia 0%Governo 0%Intermodalidade 13%Logistica 0%Malha 0%Manutenção 0%Portos 0%Trans Rodoviario 0%Urbano 0%Total 2%
Number of concepts addressed
% of concepts addressed
Construct Hees Total 13 11 10 7 6 5 4 3 2 1 11 10 9 4 3 2 1 0 6 5 3 2 1 0113 operação logistica ajustada às necessidades e particularidades do cliente ... não Concessionarias 1 1 1 1 160 maior integração dos modais ... menos Intermodalidade 1 5 1 1 1Totals 2 98 2 1 2 1 3 9 4 9 33 34 98 1 1 3 3 5 12 36 37 98 1 1 10 17 60 9
Hees 0 0 0 1 0 0 0 0 0 1 0 0 0 1 0 0 1 0 0 0 1 0 0 1
Implosion Grade (indegree) Explosion Grade (outdegre e)Issue
Cited by Domain Grade (degree)

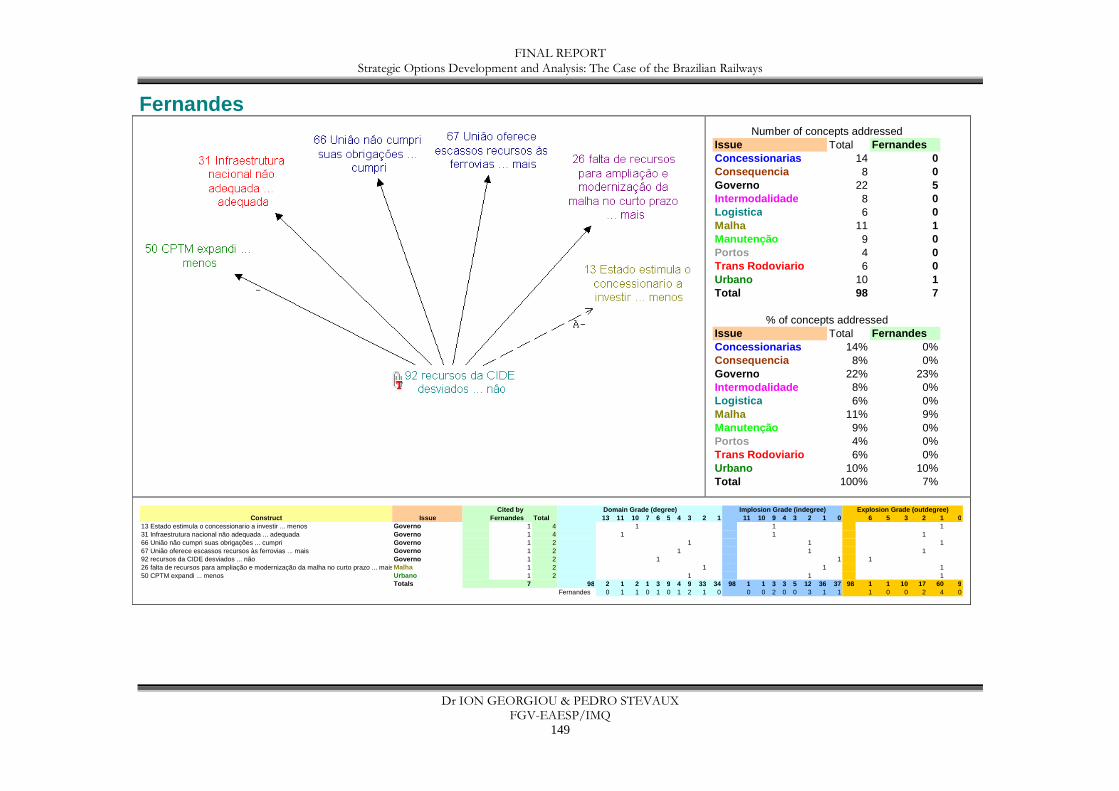
FINAL REPORT Strategic Options Development and Analysis: The Case of the Brazilian Railways
Dr ION GEORGIOU & PEDRO STEVAUX FGV-EAESP/IMQ
149
Fernandes
Issue Total FernandesConcessionarias 14 0Consequencia 8 0Governo 22 5Intermodalidade 8 0Logistica 6 0Malha 11 1Manutenção 9 0Portos 4 0Trans Rodoviario 6 0Urbano 10 1Total 98 7
Issue Total FernandesConcessionarias 14% 0%Consequencia 8% 0%Governo 22% 23%Intermodalidade 8% 0%Logistica 6% 0%Malha 11% 9%Manutenção 9% 0%Portos 4% 0%Trans Rodoviario 6% 0%Urbano 10% 10%Total 100% 7%
Number of concepts addressed
% of concepts addressed
Construct Fernandes Total 13 11 10 7 6 5 4 3 2 1 11 10 9 4 3 2 1 0 6 5 3 2 1 013 Estado estimula o concessionario a investir ... menos Governo 1 4 1 1 131 Infraestrutura nacional não adequada ... adequada Governo 1 4 1 1 166 União não cumpri suas obrigações ... cumpri Governo 1 2 1 1 167 União oferece escassos recursos às ferrovias ... mais Governo 1 2 1 1 192 recursos da CIDE desviados ... não Governo 1 2 1 1 126 falta de recursos para ampliação e modernização da malha no curto prazo ... maisMalha 1 2 1 1 150 CPTM expandi ... menos Urbano 1 2 1 1 1
Totals 7 98 2 1 2 1 3 9 4 9 33 34 98 1 1 3 3 5 12 36 37 98 1 1 10 17 60 9Fernandes 0 1 1 0 1 0 1 2 1 0 0 0 2 0 0 3 1 1 1 0 0 2 4 0
Implosion Grade (indegree) Explosion Grade (outdegre e)Issue
Cited by Domain Grade (degree)
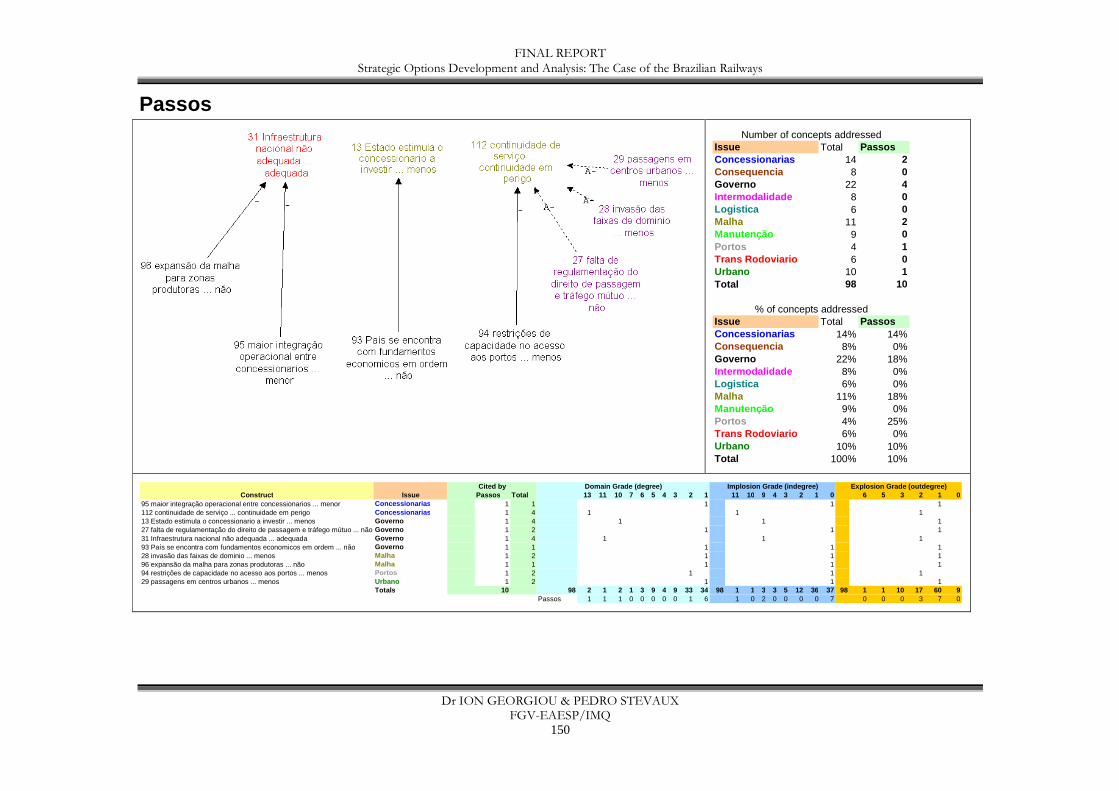
FINAL REPORT Strategic Options Development and Analysis: The Case of the Brazilian Railways
Dr ION GEORGIOU & PEDRO STEVAUX FGV-EAESP/IMQ
150
Passos
Issue Total PassosConcessionarias 14 2Consequencia 8 0Governo 22 4Intermodalidade 8 0Logistica 6 0Malha 11 2Manutenção 9 0Portos 4 1Trans Rodoviario 6 0Urbano 10 1Total 98 10
Issue Total PassosConcessionarias 14% 14%Consequencia 8% 0%Governo 22% 18%Intermodalidade 8% 0%Logistica 6% 0%Malha 11% 18%Manutenção 9% 0%Portos 4% 25%Trans Rodoviario 6% 0%Urbano 10% 10%Total 100% 10%
Number of concepts addressed
% of concepts addressed
Construct Passos Total 13 11 10 7 6 5 4 3 2 1 11 10 9 4 3 2 1 0 6 5 3 2 1 095 maior integração operacional entre concessionarios ... menor Concessionarias 1 1 1 1 1112 continuidade de serviço ... continuidade em perigo Concessionarias 1 4 1 1 113 Estado estimula o concessionario a investir ... menos Governo 1 4 1 1 127 falta de regulamentação do direito de passagem e tráfego mútuo ... não Governo 1 2 1 1 131 Infraestrutura nacional não adequada ... adequada Governo 1 4 1 1 193 País se encontra com fundamentos economicos em ordem ... não Governo 1 1 1 1 128 invasão das faixas de dominio ... menos Malha 1 2 1 1 196 expansão da malha para zonas produtoras ... não Malha 1 1 1 1 194 restrições de capacidade no acesso aos portos ... menos Portos 1 2 1 1 129 passagens em centros urbanos ... menos Urbano 1 2 1 1 1
Totals 10 98 2 1 2 1 3 9 4 9 33 34 98 1 1 3 3 5 12 36 37 98 1 1 10 17 60 9Passos 1 1 1 0 0 0 0 0 1 6 1 0 2 0 0 0 0 7 0 0 0 3 7 0
Implosion Grade (indegree) Explosion Grade (outdegre e)Issue
Cited by Domain Grade (degree)
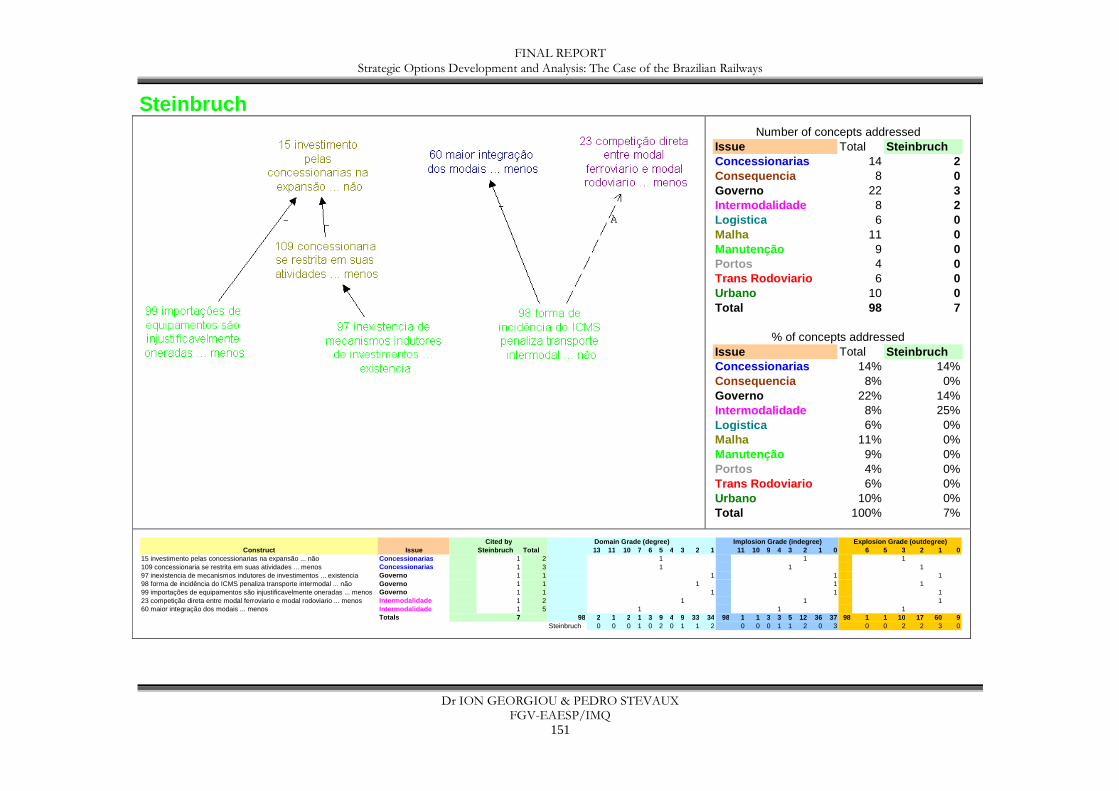
FINAL REPORT Strategic Options Development and Analysis: The Case of the Brazilian Railways
Dr ION GEORGIOU & PEDRO STEVAUX FGV-EAESP/IMQ
151
Steinbruch
Issue Total SteinbruchConcessionarias 14 2Consequencia 8 0Governo 22 3Intermodalidade 8 2Logistica 6 0Malha 11 0Manutenção 9 0Portos 4 0Trans Rodoviario 6 0Urbano 10 0Total 98 7
Issue Total SteinbruchConcessionarias 14% 14%Consequencia 8% 0%Governo 22% 14%Intermodalidade 8% 25%Logistica 6% 0%Malha 11% 0%Manutenção 9% 0%Portos 4% 0%Trans Rodoviario 6% 0%Urbano 10% 0%Total 100% 7%
Number of concepts addressed
% of concepts addressed
Construct Steinbruch Total 13 11 10 7 6 5 4 3 2 1 11 10 9 4 3 2 1 0 6 5 3 2 1 015 investimento pelas concessionarias na expansão ... não Concessionarias 1 2 1 1 1109 concessionaria se restrita em suas atividades ... menos Concessionarias 1 3 1 1 197 inexistencia de mecanismos indutores de investimentos ... existencia Governo 1 1 1 1 198 forma de incidência do ICMS penaliza transporte intermodal ... não Governo 1 1 1 1 199 importações de equipamentos são injustificavelmente oneradas ... menos Governo 1 1 1 1 123 competição direta entre modal ferroviario e modal rodoviario ... menos Intermodalidade 1 2 1 1 160 maior integração dos modais ... menos Intermodalidade 1 5 1 1 1
Totals 7 98 2 1 2 1 3 9 4 9 33 34 98 1 1 3 3 5 12 36 37 98 1 1 10 17 60 9Steinbruch 0 0 0 1 0 2 0 1 1 2 0 0 0 1 1 2 0 3 0 0 2 2 3 0
Implosion Grade (indegree) Explosion Grade (outdegree)Issue
Cited by Domain Grade (degree)

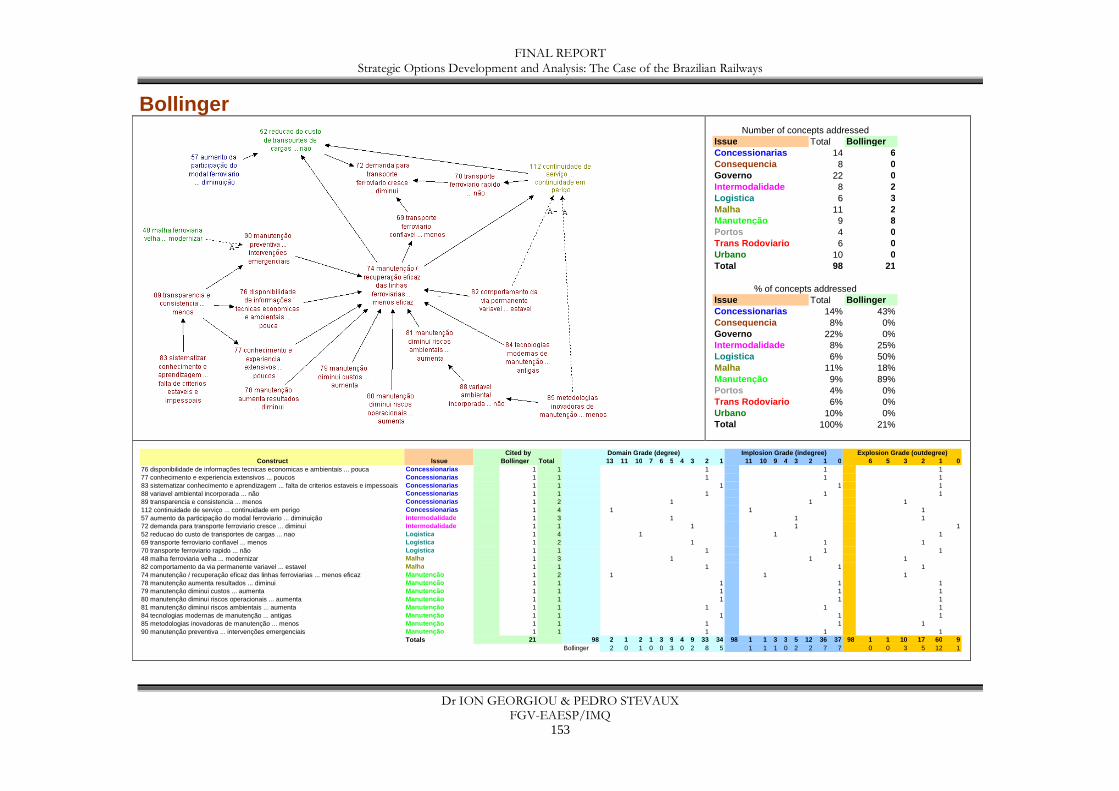
FINAL REPORT Strategic Options Development and Analysis: The Case of the Brazilian Railways
Dr ION GEORGIOU & PEDRO STEVAUX FGV-EAESP/IMQ
153
Bollinger
Issue Total BollingerConcessionarias 14 6Consequencia 8 0Governo 22 0Intermodalidade 8 2Logistica 6 3Malha 11 2Manutenção 9 8Portos 4 0Trans Rodoviario 6 0Urbano 10 0Total 98 21
Issue Total BollingerConcessionarias 14% 43%Consequencia 8% 0%Governo 22% 0%Intermodalidade 8% 25%Logistica 6% 50%Malha 11% 18%Manutenção 9% 89%Portos 4% 0%Trans Rodoviario 6% 0%Urbano 10% 0%Total 100% 21%
Number of concepts addressed
% of concepts addressed
Construct Bollinger Total 13 11 10 7 6 5 4 3 2 1 11 10 9 4 3 2 1 0 6 5 3 2 1 076 disponibilidade de informações tecnicas economicas e ambientais ... pouca Concessionarias 1 1 1 1 177 conhecimento e experiencia extensivos ... poucos Concessionarias 1 1 1 1 183 sistematizar conhecimento e aprendizagem ... falta de criterios estaveis e impessoais Concessionarias 1 1 1 1 188 variavel ambiental incorporada ... não Concessionarias 1 1 1 1 189 transparencia e consistencia ... menos Concessionarias 1 2 1 1 1112 continuidade de serviço ... continuidade em perigo Concessionarias 1 4 1 1 157 aumento da participação do modal ferroviario ... diminuição Intermodalidade 1 3 1 1 172 demanda para transporte ferroviario cresce ... diminui Intermodalidade 1 1 1 1 152 reducao do custo de transportes de cargas ... nao Logistica 1 4 1 1 169 transporte ferroviario confiavel ... menos Logistica 1 2 1 1 170 transporte ferroviario rapido ... não Logistica 1 1 1 1 148 malha ferroviaria velha ... modernizar Malha 1 3 1 1 182 comportamento da via permanente variavel ... estavel Malha 1 1 1 1 174 manutenção / recuperação eficaz das linhas ferroviarias ... menos eficaz Manutenção 1 2 1 1 178 manutenção aumenta resultados ... diminui Manutenção 1 1 1 1 179 manutenção diminui custos ... aumenta Manutenção 1 1 1 1 180 manutenção diminui riscos operacionais ... aumenta Manutenção 1 1 1 1 181 manutenção diminui riscos ambientais ... aumenta Manutenção 1 1 1 1 184 tecnologias modernas de manutenção ... antigas Manutenção 1 1 1 1 185 metodologias inovadoras de manutenção ... menos Manutenção 1 1 1 1 190 manutenção preventiva ... intervenções emergenciais Manutenção 1 1 1 1 1
Totals 21 98 2 1 2 1 3 9 4 9 33 34 98 1 1 3 3 5 12 36 37 98 1 1 10 17 60 9Bollinger 2 0 1 0 0 3 0 2 8 5 1 1 1 0 2 2 7 7 0 0 3 5 12 1
Implosion Grade (indegree) Explosion Grade (outdegre e)Issue
Cited by Domain Grade (degree)

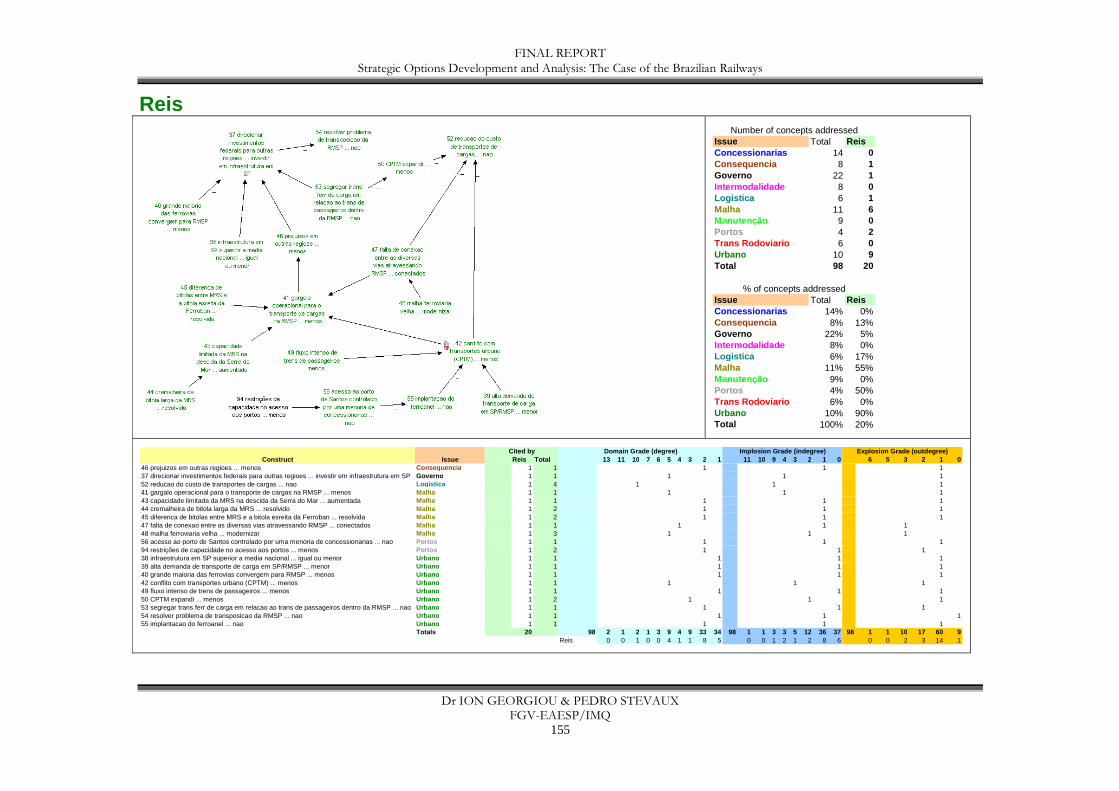
FINAL REPORT Strategic Options Development and Analysis: The Case of the Brazilian Railways
Dr ION GEORGIOU & PEDRO STEVAUX FGV-EAESP/IMQ
155
Reis
Issue Total ReisConcessionarias 14 0Consequencia 8 1Governo 22 1Intermodalidade 8 0Logistica 6 1Malha 11 6Manutenção 9 0Portos 4 2Trans Rodoviario 6 0Urbano 10 9Total 98 20
Issue Total ReisConcessionarias 14% 0%Consequencia 8% 13%Governo 22% 5%Intermodalidade 8% 0%Logistica 6% 17%Malha 11% 55%Manutenção 9% 0%Portos 4% 50%Trans Rodoviario 6% 0%Urbano 10% 90%Total 100% 20%
Number of concepts addressed
% of concepts addressed
Construct Reis Total 13 11 10 7 6 5 4 3 2 1 11 10 9 4 3 2 1 0 6 5 3 2 1 046 prejuizos em outras regioes ... menos Consequencia 1 1 1 1 137 direcionar investimentos federais para outras regioes ... investir em infraestrutura em SP Governo 1 1 1 1 152 reducao do custo de transportes de cargas ... nao Logistica 1 4 1 1 141 gargalo operacional para o transporte de cargas na RMSP ... menos Malha 1 1 1 1 143 capacidade limitada da MRS na descida da Serra do Mar ... aumentada Malha 1 1 1 1 144 cremalheira de bitola larga da MRS ... resolvido Malha 1 2 1 1 145 diferenca de bitolas entre MRS e a bitola esreita da Ferroban ... resolvida Malha 1 2 1 1 147 falta de conexao entre as diversas vias atravessando RMSP ... conectados Malha 1 1 1 1 148 malha ferroviaria velha ... modernizar Malha 1 3 1 1 156 acesso ao porto de Santos controlado por uma menoria de concessionarias ... nao Portos 1 1 1 1 194 restrições de capacidade no acesso aos portos ... menos Portos 1 2 1 1 138 infraestrutura em SP superior a media nacional ... igual ou menor Urbano 1 1 1 1 139 alta demanda de transporte de carga em SP/RMSP ... menor Urbano 1 1 1 1 140 grande maioria das ferrovias convergem para RMSP ... menos Urbano 1 1 1 1 142 conflito com transportes urbano (CPTM) ... menos Urbano 1 1 1 1 149 fluxo intenso de trens de passageiros ... menos Urbano 1 1 1 1 150 CPTM expandi ... menos Urbano 1 2 1 1 153 segregar trans ferr de carga em relacao ao trans de passageiros dentro da RMSP ... nao Urbano 1 1 1 1 154 resolver problema de transposicao da RMSP ... nao Urbano 1 1 1 1 155 implantacao do ferroanel ... nao Urbano 1 1 1 1 1
Totals 20 98 2 1 2 1 3 9 4 9 33 34 98 1 1 3 3 5 12 36 37 98 1 1 10 17 60 9Reis 0 0 1 0 0 4 1 1 8 5 0 0 1 2 1 2 8 6 0 0 2 3 14 1
Implosion Grade (indegree) Explosion Grade (outdegre e)Issue
Cited by Domain Grade (degree)

FINAL REPORT Strategic Options Development and Analysis: The Case of the Brazilian Railways
Dr ION GEORGIOU & PEDRO STEVAUX FGV-EAESP/IMQ
157
Appendix 5 – maps of all identified issues with supplementary data
The maps included in this appendix are those that were designed during the mature phase of the research. Constructs that were initially elicited from the actors were now grouped according to identifiable issues. All issues were color-coded. The constructs respectively assigned to them were color-coded accordingly. This color coding is shown in this appendix for the following items: the name of the issue as well as the map on display. Example: Concessionarias is color-coded in blue. In the map on display (this issue’s map), those constructs assigned to the issue are also in blue. Supplementary data are provided for each issue and its map. For instance, above the map is a table of actors’ names. A ‘1’ indicates that the actor addressed this issue by citing at least one of its constructs. The ‘Total’ is simply the total number of actors addressing the issue in question. Below the map is a list of the issue’s constructs. For each construct, the table shows the total number of citations from all the actors, and information regarding domain grade, implosion and explosion grades. The two rows at the bottom of the table compare the issue’s totals with all the 98 constructs of the merged map.

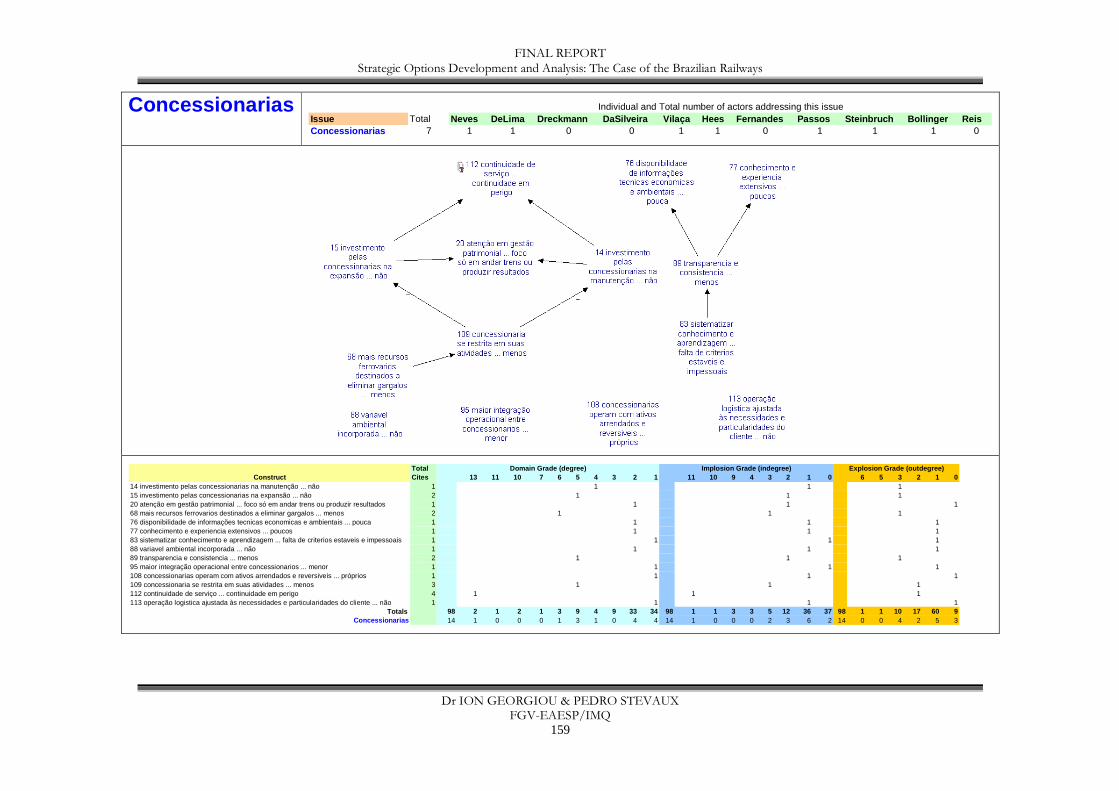
FINAL REPORT Strategic Options Development and Analysis: The Case of the Brazilian Railways
Dr ION GEORGIOU & PEDRO STEVAUX FGV-EAESP/IMQ
159
Concessionarias Issue Total Neves DeLima Dreckmann DaSilveira Vilaça Hees Fernandes Pa ssos Steinbruch Bollinger ReisConcessionarias 7 1 1 0 0 1 1 0 1 1 1 0
Individual and Total number of actors addressing this issue
TotalConstruct Cites 13 11 10 7 6 5 4 3 2 1 11 10 9 4 3 2 1 0 6 5 3 2 1 0
14 investimento pelas concessionarias na manutenção ... não 1 1 1 115 investimento pelas concessionarias na expansão ... não 2 1 1 120 atenção em gestão patrimonial ... foco só em andar trens ou produzir resultados 1 1 1 168 mais recursos ferrovarios destinados a eliminar gargalos ... menos 2 1 1 176 disponibilidade de informações tecnicas economicas e ambientais ... pouca 1 1 1 177 conhecimento e experiencia extensivos ... poucos 1 1 1 183 sistematizar conhecimento e aprendizagem ... falta de criterios estaveis e impessoais 1 1 1 188 variavel ambiental incorporada ... não 1 1 1 189 transparencia e consistencia ... menos 2 1 1 195 maior integração operacional entre concessionarios ... menor 1 1 1 1108 concessionarias operam com ativos arrendados e reversiveis ... próprios 1 1 1 1109 concessionaria se restrita em suas atividades ... menos 3 1 1 1112 continuidade de serviço ... continuidade em perigo 4 1 1 1113 operação logistica ajustada às necessidades e particularidades do cliente ... não 1 1 1 1
Totals 98 2 1 2 1 3 9 4 9 33 34 98 1 1 3 3 5 12 36 37 98 1 1 10 17 60 9Concessionarias 14 1 0 0 0 1 3 1 0 4 4 14 1 0 0 0 2 3 6 2 14 0 0 4 2 5 3
Domain Grade (degree) Implosion Grade (indegree) Explosion Grade (outdegre e)

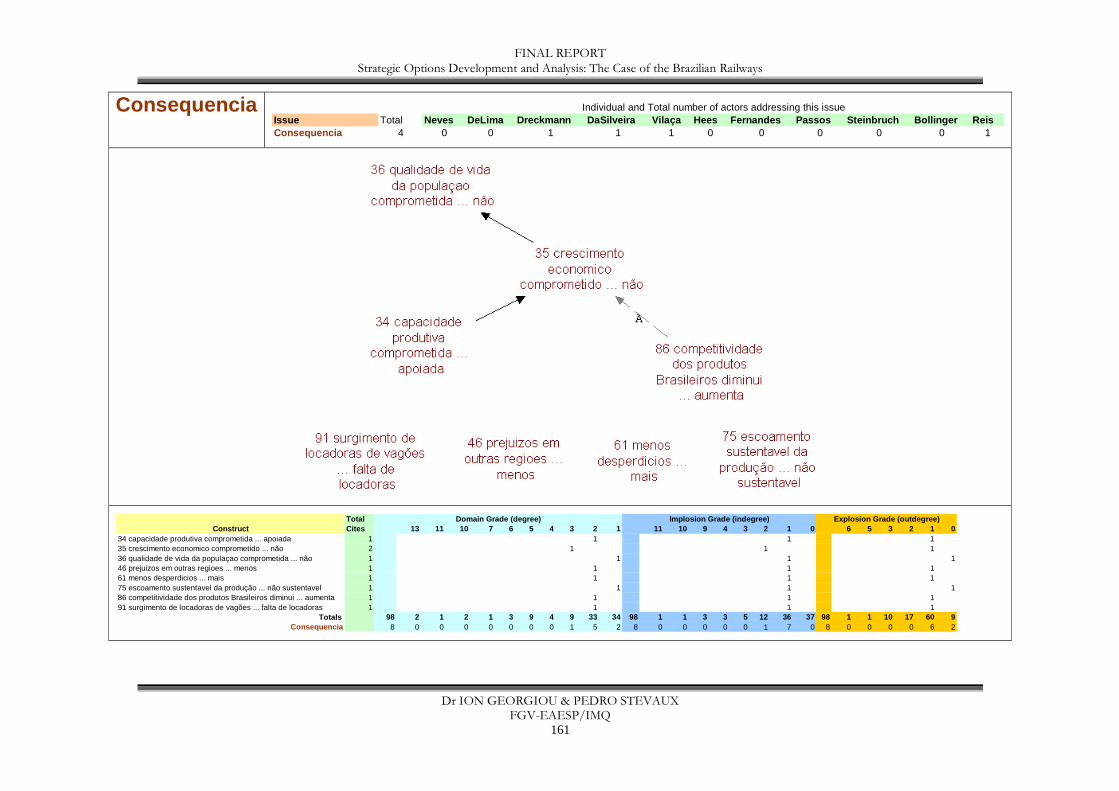
FINAL REPORT Strategic Options Development and Analysis: The Case of the Brazilian Railways
Dr ION GEORGIOU & PEDRO STEVAUX FGV-EAESP/IMQ
161
Consequencia Issue Total Neves DeLima Dreckmann DaSilveira Vilaça Hees Fernandes Pa ssos Steinbruch Bollinger ReisConsequencia 4 0 0 1 1 1 0 0 0 0 0 1
Individual and Total number of actors addressing this issue
TotalConstruct Cites 13 11 10 7 6 5 4 3 2 1 11 10 9 4 3 2 1 0 6 5 3 2 1 0
34 capacidade produtiva comprometida ... apoiada 1 1 1 135 crescimento economico comprometido ... não 2 1 1 136 qualidade de vida da populaçao comprometida ... não 1 1 1 146 prejuizos em outras regioes ... menos 1 1 1 161 menos desperdicios ... mais 1 1 1 175 escoamento sustentavel da produção ... não sustentavel 1 1 1 186 competitividade dos produtos Brasileiros diminui ... aumenta 1 1 1 191 surgimento de locadoras de vagões ... falta de locadoras 1 1 1 1
Totals 98 2 1 2 1 3 9 4 9 33 34 98 1 1 3 3 5 12 36 37 98 1 1 10 17 60 9Consequencia 8 0 0 0 0 0 0 0 1 5 2 8 0 0 0 0 0 1 7 0 8 0 0 0 0 6 2
Domain Grade (degree) Implosion Grade (indegree) Explosion Grade (outdegre e)
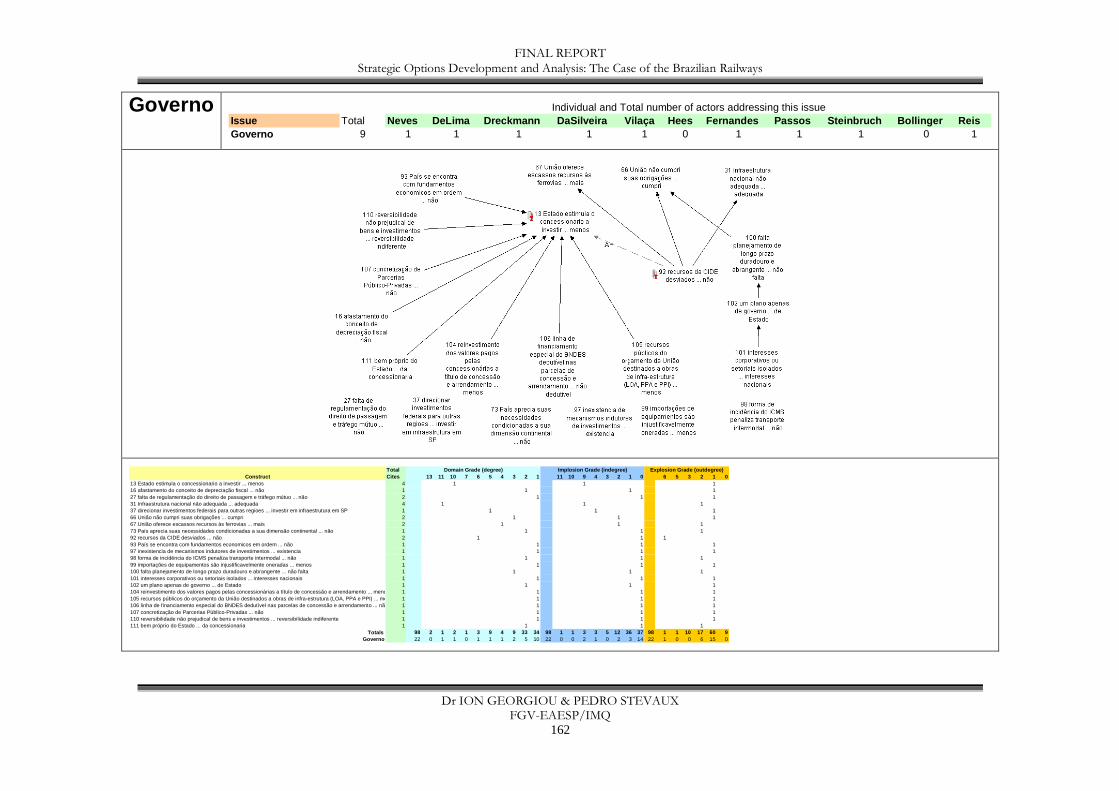
FINAL REPORT Strategic Options Development and Analysis: The Case of the Brazilian Railways
Dr ION GEORGIOU & PEDRO STEVAUX FGV-EAESP/IMQ
162
Governo Issue Total Neves DeLima Dreckmann DaSilveira Vilaça Hees Fernandes Pa ssos Steinbruch Bollinger ReisGoverno 9 1 1 1 1 1 0 1 1 1 0 1
Individual and Total number of actors addressing this issue
TotalConstruct Cites 13 11 10 7 6 5 4 3 2 1 11 10 9 4 3 2 1 0 6 5 3 2 1 0
13 Estado estimula o concessionario a investir ... menos 4 1 1 116 afastamento do conceito de depreciação fiscal ... não 1 1 1 127 falta de regulamentação do direito de passagem e tráfego mútuo ... não 2 1 1 131 Infraestrutura nacional não adequada ... adequada 4 1 1 137 direcionar investimentos federais para outras regioes ... investir em infraestrutura em SP 1 1 1 166 União não cumpri suas obrigações ... cumpri 2 1 1 167 União oferece escassos recursos às ferrovias ... mais 2 1 1 173 País aprecia suas necessidades condicionadas a sua dimensão continental ... não 1 1 1 192 recursos da CIDE desviados ... não 2 1 1 193 País se encontra com fundamentos economicos em ordem ... não 1 1 1 197 inexistencia de mecanismos indutores de investimentos ... existencia 1 1 1 198 forma de incidência do ICMS penaliza transporte intermodal ... não 1 1 1 199 importações de equipamentos são injustificavelmente oneradas ... menos 1 1 1 1100 falta planejamento de longo prazo duradouro e abrangente ... não falta 1 1 1 1101 interesses corporativos ou setoriais isolados ... interesses nacionais 1 1 1 1102 um plano apenas de governo ... de Estado 1 1 1 1104 reinvestimento dos valores pagos pelas concessionárias a título de concessão e arrendamento ... menos 1 1 1 1105 recursos públicos do orçamento da União destinados a obras de infra-estrutura (LOA, PPA e PPI) ... menos 1 1 1 1106 linha de financiamento especial do BNDES dedutível nas parcelas de concessão e arrendamento ... não dedutivel1 1 1 1107 concretização de Parcerias Público-Privadas ... não 1 1 1 1110 reversibilidade não prejudical de bens e investimentos ... reversibilidade indiferente 1 1 1 1111 bem próprio do Estado ... da concessionaria 1 1 1 1
Totals 98 2 1 2 1 3 9 4 9 33 34 98 1 1 3 3 5 12 36 37 98 1 1 10 17 60 9Governo 22 0 1 1 0 1 1 1 2 5 10 22 0 0 2 1 0 2 3 14 22 1 0 0 6 15 0
Domain Grade (degree) Implosion Grade (indegree) Expl osion Grade (outdegree)
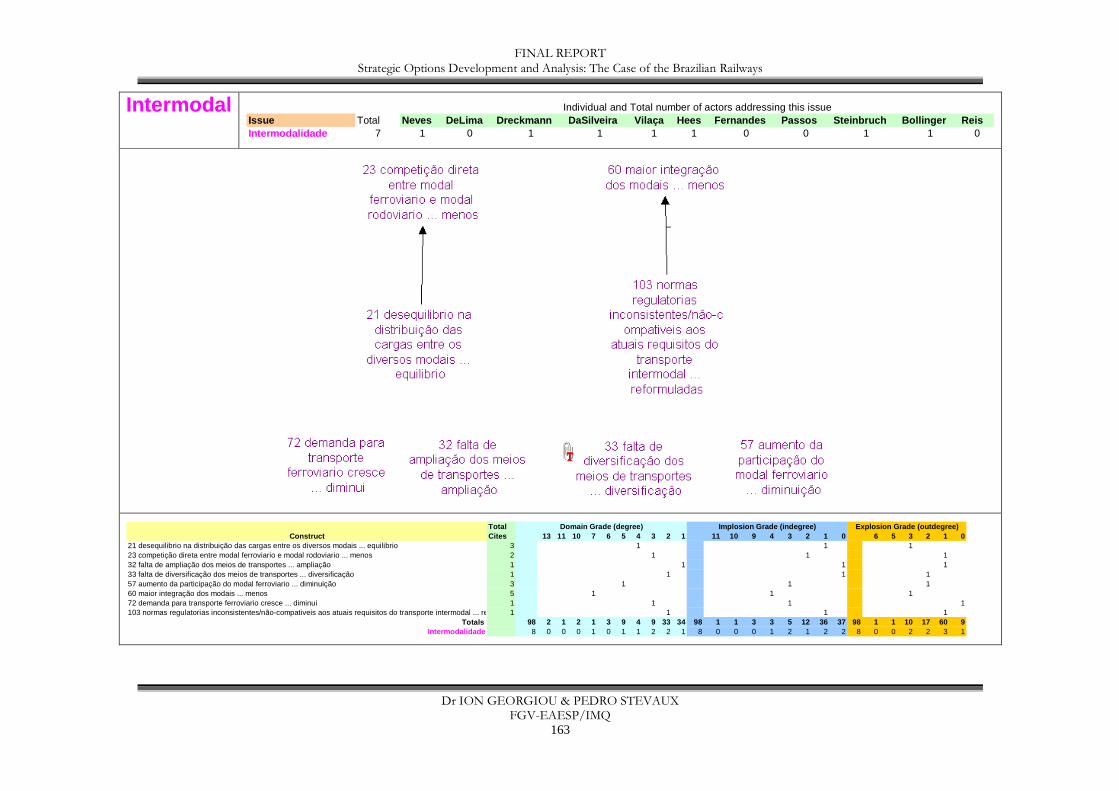
FINAL REPORT Strategic Options Development and Analysis: The Case of the Brazilian Railways
Dr ION GEORGIOU & PEDRO STEVAUX FGV-EAESP/IMQ
163
Intermodal Issue Total Neves DeLima Dreckmann DaSilveira Vilaça Hees Fernandes Pa ssos Steinbruch Bollinger ReisIntermodalidade 7 1 0 1 1 1 1 0 0 1 1 0
Individual and Total number of actors addressing this issue
TotalConstruct Cites 13 11 10 7 6 5 4 3 2 1 11 10 9 4 3 2 1 0 6 5 3 2 1 0
21 desequilibrio na distribuição das cargas entre os diversos modais ... equilibrio 3 1 1 123 competição direta entre modal ferroviario e modal rodoviario ... menos 2 1 1 132 falta de ampliação dos meios de transportes ... ampliação 1 1 1 133 falta de diversificação dos meios de transportes ... diversificação 1 1 1 157 aumento da participação do modal ferroviario ... diminuição 3 1 1 160 maior integração dos modais ... menos 5 1 1 172 demanda para transporte ferroviario cresce ... diminui 1 1 1 1103 normas regulatorias inconsistentes/não-compativeis aos atuais requisitos do transporte intermodal ... reformuladas1 1 1 1
Totals 98 2 1 2 1 3 9 4 9 33 34 98 1 1 3 3 5 12 36 37 98 1 1 10 17 60 9Intermodalidade 8 0 0 0 1 0 1 1 2 2 1 8 0 0 0 1 2 1 2 2 8 0 0 2 2 3 1
Domain Grade (degree) Implosion Grade (indegree) Expl osion Grade (outdegree)
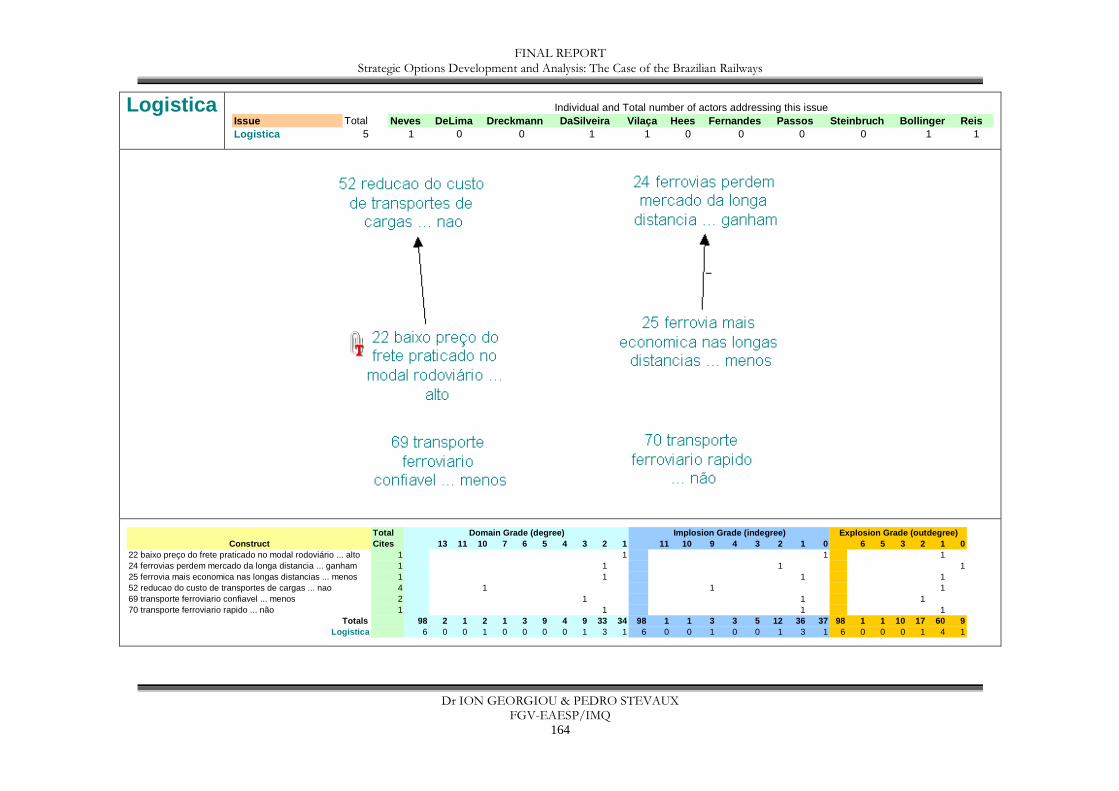
FINAL REPORT Strategic Options Development and Analysis: The Case of the Brazilian Railways
Dr ION GEORGIOU & PEDRO STEVAUX FGV-EAESP/IMQ
164
Logistica Issue Total Neves DeLima Dreckmann DaSilveira Vilaça Hees Fernandes Pa ssos Steinbruch Bollinger ReisLogistica 5 1 0 0 1 1 0 0 0 0 1 1
Individual and Total number of actors addressing this issue
TotalConstruct Cites 13 11 10 7 6 5 4 3 2 1 11 10 9 4 3 2 1 0 6 5 3 2 1 0
22 baixo preço do frete praticado no modal rodoviário ... alto 1 1 1 124 ferrovias perdem mercado da longa distancia ... ganham 1 1 1 125 ferrovia mais economica nas longas distancias ... menos 1 1 1 152 reducao do custo de transportes de cargas ... nao 4 1 1 169 transporte ferroviario confiavel ... menos 2 1 1 170 transporte ferroviario rapido ... não 1 1 1 1
Totals 98 2 1 2 1 3 9 4 9 33 34 98 1 1 3 3 5 12 36 37 98 1 1 10 17 60 9Logistica 6 0 0 1 0 0 0 0 1 3 1 6 0 0 1 0 0 1 3 1 6 0 0 0 1 4 1
Domain Grade (degree) Implosion Grade (indegree) Expl osion Grade (outdegree)
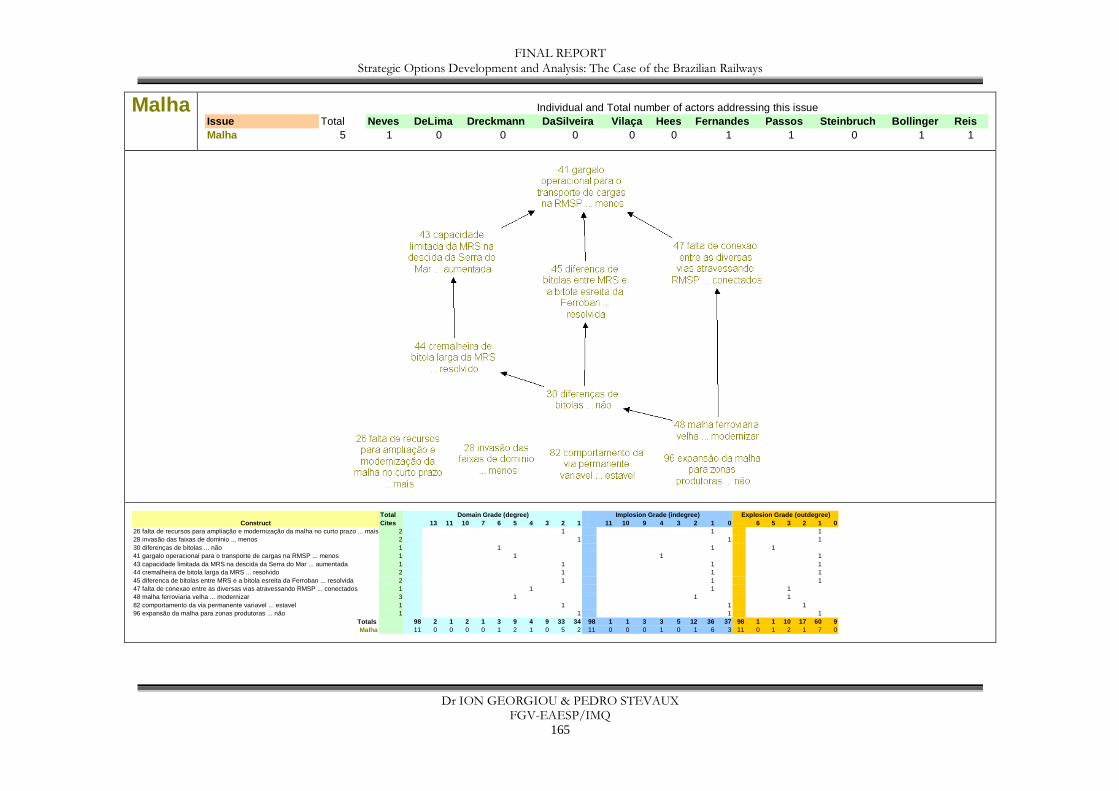
FINAL REPORT Strategic Options Development and Analysis: The Case of the Brazilian Railways
Dr ION GEORGIOU & PEDRO STEVAUX FGV-EAESP/IMQ
165
Malha Issue Total Neves DeLima Dreckmann DaSilveira Vilaça Hees Fernandes Pa ssos Steinbruch Bollinger ReisMalha 5 1 0 0 0 0 0 1 1 0 1 1
Individual and Total number of actors addressing this issue
TotalConstruct Cites 13 11 10 7 6 5 4 3 2 1 11 10 9 4 3 2 1 0 6 5 3 2 1 0
26 falta de recursos para ampliação e modernização da malha no curto prazo ... mais 2 1 1 128 invasão das faixas de dominio ... menos 2 1 1 130 diferenças de bitolas ... não 1 1 1 141 gargalo operacional para o transporte de cargas na RMSP ... menos 1 1 1 143 capacidade limitada da MRS na descida da Serra do Mar ... aumentada 1 1 1 144 cremalheira de bitola larga da MRS ... resolvido 2 1 1 145 diferenca de bitolas entre MRS e a bitola esreita da Ferroban ... resolvida 2 1 1 147 falta de conexao entre as diversas vias atravessando RMSP ... conectados 1 1 1 148 malha ferroviaria velha ... modernizar 3 1 1 182 comportamento da via permanente variavel ... estavel 1 1 1 196 expansão da malha para zonas produtoras ... não 1 1 1 1
Totals 98 2 1 2 1 3 9 4 9 33 34 98 1 1 3 3 5 12 36 37 98 1 1 10 17 60 9Malha 11 0 0 0 0 1 2 1 0 5 2 11 0 0 0 1 0 1 6 3 11 0 1 2 1 7 0
Domain Grade (degree) Implosion Grade (indegree) Expl osion Grade (outdegree)
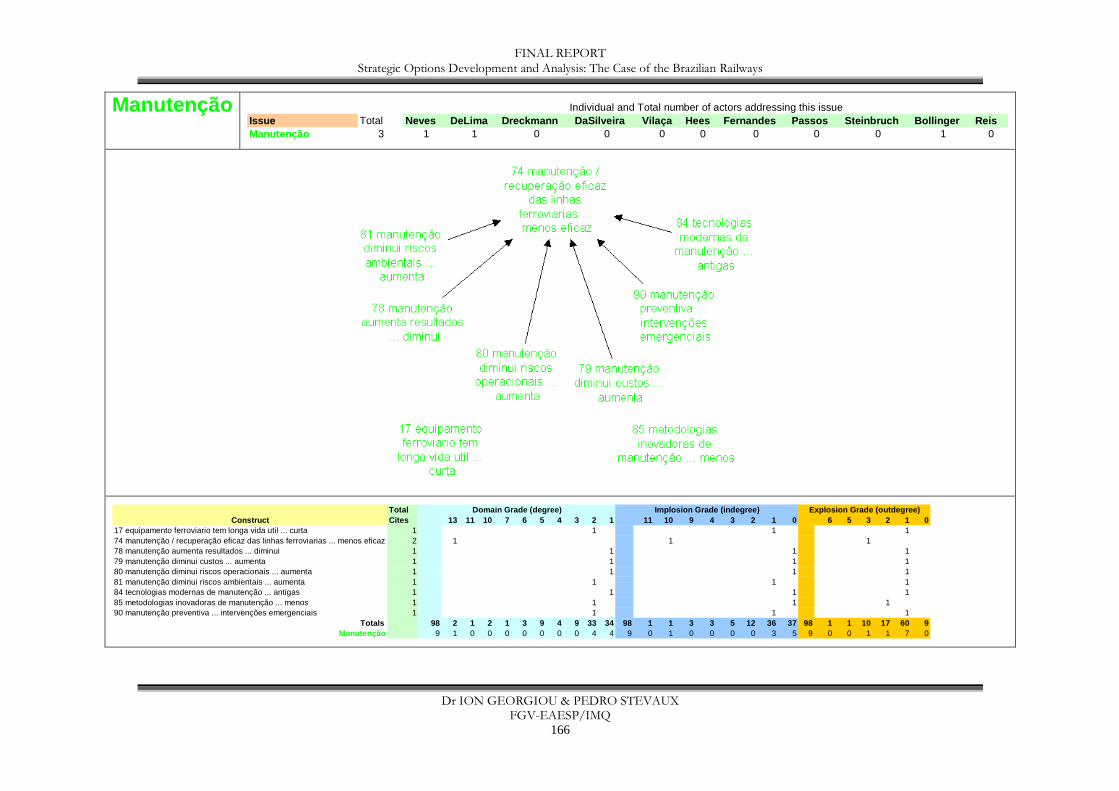
FINAL REPORT Strategic Options Development and Analysis: The Case of the Brazilian Railways
Dr ION GEORGIOU & PEDRO STEVAUX FGV-EAESP/IMQ
166
Manutenção Issue Total Neves DeLima Dreckmann DaSilveira Vilaça Hees Fernandes Pa ssos Steinbruch Bollinger ReisManutenção 3 1 1 0 0 0 0 0 0 0 1 0
Individual and Total number of actors addressing this issue
TotalConstruct Cites 13 11 10 7 6 5 4 3 2 1 11 10 9 4 3 2 1 0 6 5 3 2 1 0
17 equipamento ferroviario tem longa vida util ... curta 1 1 1 174 manutenção / recuperação eficaz das linhas ferroviarias ... menos eficaz 2 1 1 178 manutenção aumenta resultados ... diminui 1 1 1 179 manutenção diminui custos ... aumenta 1 1 1 180 manutenção diminui riscos operacionais ... aumenta 1 1 1 181 manutenção diminui riscos ambientais ... aumenta 1 1 1 184 tecnologias modernas de manutenção ... antigas 1 1 1 185 metodologias inovadoras de manutenção ... menos 1 1 1 190 manutenção preventiva ... intervenções emergenciais 1 1 1 1
Totals 98 2 1 2 1 3 9 4 9 33 34 98 1 1 3 3 5 12 36 37 98 1 1 10 17 60 9Manutenção 9 1 0 0 0 0 0 0 0 4 4 9 0 1 0 0 0 0 3 5 9 0 0 1 1 7 0
Domain Grade (degree) Implosion Grade (indegree) Expl osion Grade (outdegree)
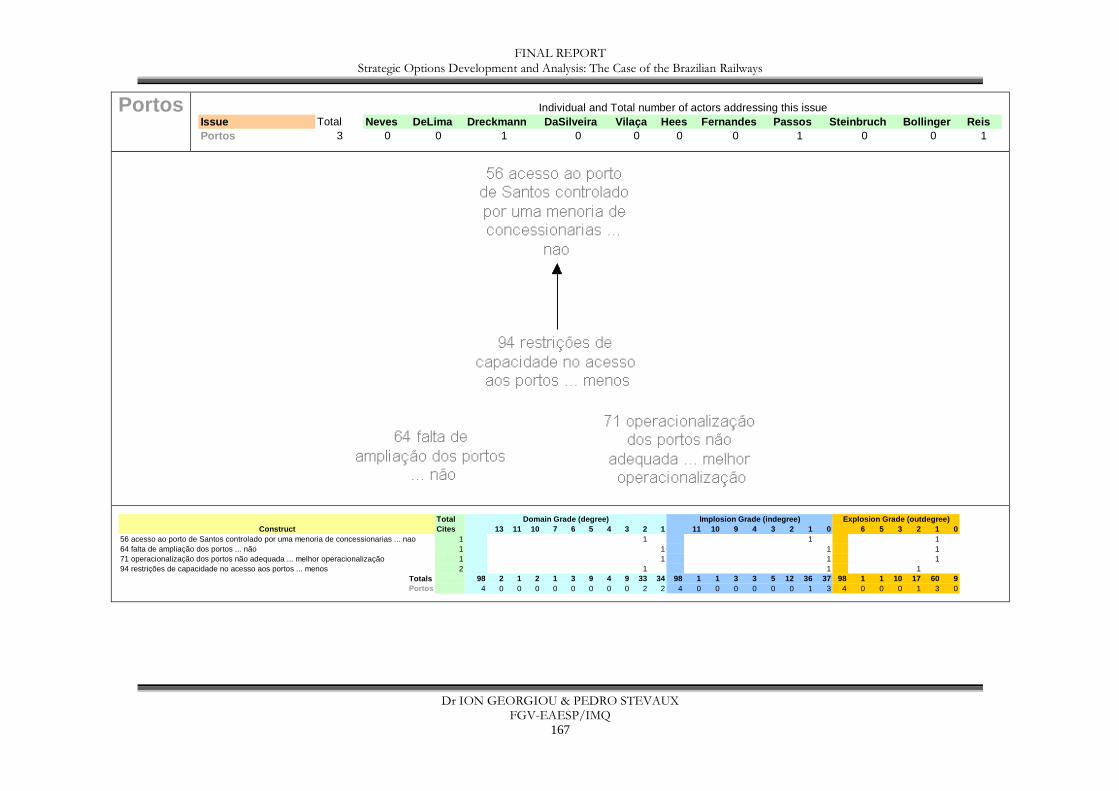
FINAL REPORT Strategic Options Development and Analysis: The Case of the Brazilian Railways
Dr ION GEORGIOU & PEDRO STEVAUX FGV-EAESP/IMQ
167
Portos Issue Total Neves DeLima Dreckmann DaSilveira Vilaça Hees Fernandes Pa ssos Steinbruch Bollinger ReisPortos 3 0 0 1 0 0 0 0 1 0 0 1
Individual and Total number of actors addressing this issue
TotalConstruct Cites 13 11 10 7 6 5 4 3 2 1 11 10 9 4 3 2 1 0 6 5 3 2 1 0
56 acesso ao porto de Santos controlado por uma menoria de concessionarias ... nao 1 1 1 164 falta de ampliação dos portos ... não 1 1 1 171 operacionalização dos portos não adequada ... melhor operacionalização 1 1 1 194 restrições de capacidade no acesso aos portos ... menos 2 1 1 1
Totals 98 2 1 2 1 3 9 4 9 33 34 98 1 1 3 3 5 12 36 37 98 1 1 10 17 60 9Portos 4 0 0 0 0 0 0 0 0 2 2 4 0 0 0 0 0 0 1 3 4 0 0 0 1 3 0
Domain Grade (degree) Implosion Grade (indegree) Expl osion Grade (outdegree)
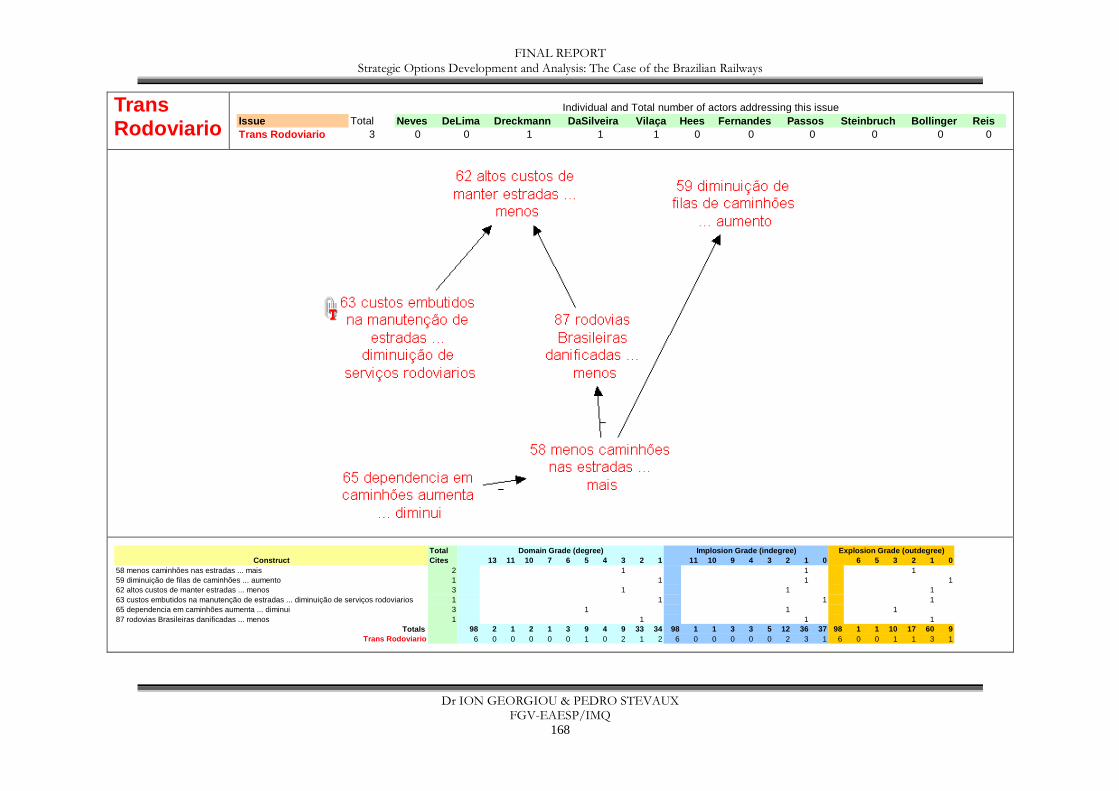
FINAL REPORT Strategic Options Development and Analysis: The Case of the Brazilian Railways
Dr ION GEORGIOU & PEDRO STEVAUX FGV-EAESP/IMQ
168
Trans Rodoviario Issue Total Neves DeLima Dreckmann DaSilveira Vilaça Hees Fernandes Pa ssos Steinbruch Bollinger Reis
Trans Rodoviario 3 0 0 1 1 1 0 0 0 0 0 0
Individual and Total number of actors addressing this issue
TotalConstruct Cites 13 11 10 7 6 5 4 3 2 1 11 10 9 4 3 2 1 0 6 5 3 2 1 0
58 menos caminhões nas estradas ... mais 2 1 1 159 diminuição de filas de caminhões ... aumento 1 1 1 162 altos custos de manter estradas ... menos 3 1 1 163 custos embutidos na manutenção de estradas ... diminuição de serviços rodoviarios 1 1 1 165 dependencia em caminhões aumenta ... diminui 3 1 1 187 rodovias Brasileiras danificadas ... menos 1 1 1 1
Totals 98 2 1 2 1 3 9 4 9 33 34 98 1 1 3 3 5 12 36 37 98 1 1 10 17 60 9Trans Rodoviario 6 0 0 0 0 0 1 0 2 1 2 6 0 0 0 0 0 2 3 1 6 0 0 1 1 3 1
Domain Grade (degree) Implosion Grade (indegree) Expl osion Grade (outdegree)
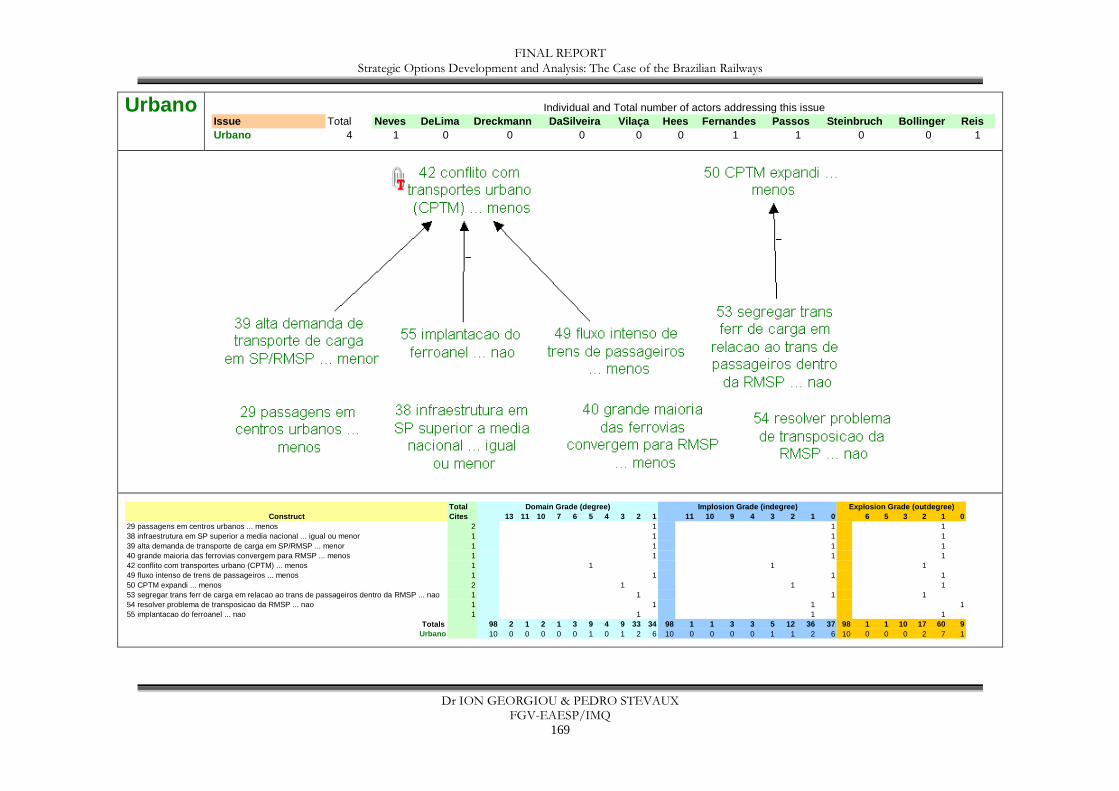
FINAL REPORT Strategic Options Development and Analysis: The Case of the Brazilian Railways
Dr ION GEORGIOU & PEDRO STEVAUX FGV-EAESP/IMQ
169
Urbano Issue Total Neves DeLima Dreckmann DaSilveira Vilaça Hees Fernandes Pa ssos Steinbruch Bollinger ReisUrbano 4 1 0 0 0 0 0 1 1 0 0 1
Individual and Total number of actors addressing this issue
TotalConstruct Cites 13 11 10 7 6 5 4 3 2 1 11 10 9 4 3 2 1 0 6 5 3 2 1 0
29 passagens em centros urbanos ... menos 2 1 1 138 infraestrutura em SP superior a media nacional ... igual ou menor 1 1 1 139 alta demanda de transporte de carga em SP/RMSP ... menor 1 1 1 140 grande maioria das ferrovias convergem para RMSP ... menos 1 1 1 142 conflito com transportes urbano (CPTM) ... menos 1 1 1 149 fluxo intenso de trens de passageiros ... menos 1 1 1 150 CPTM expandi ... menos 2 1 1 153 segregar trans ferr de carga em relacao ao trans de passageiros dentro da RMSP ... nao 1 1 1 154 resolver problema de transposicao da RMSP ... nao 1 1 1 155 implantacao do ferroanel ... nao 1 1 1 1
Totals 98 2 1 2 1 3 9 4 9 33 34 98 1 1 3 3 5 12 36 37 98 1 1 10 17 60 9Urbano 10 0 0 0 0 0 1 0 1 2 6 10 0 0 0 0 1 1 2 6 10 0 0 0 2 7 1
Domain Grade (degree) Implosion Grade (indegree) Expl osion Grade (outdegree)

FINAL REPORT Strategic Options Development and Analysis: The Case of the Brazilian Railways
Dr ION GEORGIOU & PEDRO STEVAUX FGV-EAESP/IMQ
171
References Ackermann F, Eden C (2005) The Practice of Making Strategy: A Step-by-Step Guide. Sage: London.
Ackoff R (1979) The future of operational research is past. Journal of the Operational Research Society 30(2): 93-104
Aldous JM, Wilson RJ (2000) Graphs and Applications: An Introductory Approach. Springer: London.
Bennett PG, Ackermann F, Eden C, Williams T. (1997) Analysing litigation and negotiation: using a combined methodology. In Mingers J and Gill A, Multimethodology: the Theory and Practice of Combining Management Science Methodologies, Wiley: Chichester. pp. 59-88.
Bougon MG (1992) Congregate cognitive maps: a unified dynamic theory of organization and strategy. Journal of Management Studies 29(3), 369-389.
Bryson JM, Ackermann F, Eden C, Finn CB (2004) Visible Thinking: Unlocking Causal Mapping for Practical Business Results. Wiley: Chichester.
Cook DJ, Holder LB (eds.) (2007) Mining Graph Data. Wiley: Chichester.
de Nooy W, Mrvar A, Batagelj V (2005) Exploratory Social Network Analysis with Pajek. Cambridge University Press, Cambridge.
Eden C (1988) Cognitive mapping. European Journal of Operational Research 36(1): 1-13
Eden C (2004) Analyzing cognitive maps to help structure issues or problems. European Journal of Operational Research 159(3), 673-686.
Eden C, Ackermann F (1998) Making Strategy: The Journey of Strategic Management. Sage: London.
Eden C, Ackermann F, Cropper S (1992) The analysis of cause maps. Journal of Management Studies 29(3), 309-324.
Forrester JW (1961) Industrial dynamics. MIT Press: Cambridge
Foulds LR (1992) Graph Theory Applications. Springer: New York.
Fransella F, Bell R, Bannister D (2004) A Manual for Repertory Grid Technique. 2nd edition. Wiley: Chichester.
Friend J, Hickling A (2005) Planning Under Pressure. Third ed. Elsevier Butterworth-Heinemann: Oxford.
Georgiou I (2006) Managerial effectiveness from a system theoretical point of view. Systemic Practice and Action Research 19(5): 441-459
Georgiou I (2008) Making decisions in the absence of clear facts. European Journal of Operational Research 185(1): 299-321
Harris JM, Hirst JL, Mossinghoff MJ (2000) Combinatorics and Graph Theory. Springer: New York.
Kane M, Trochim WMK (2007) Concept Mapping for Planning and Evaluation. Sage: London.
FINAL REPORT Strategic Options Development and Analysis: The Case of the Brazilian Railways
Dr ION GEORGIOU & PEDRO STEVAUX FGV-EAESP/IMQ
172
Kelly GA (1955/1991) The Psychology of Personal Constructs. 2nd edn. Routledge: London
Kelly GA (1963) A Theory of Personality: The Psychology of Personal Constructs. Norton: London.
Kelly GA (1970) A brief introduction to personal construct theory. In Bannister D (ed.), Perspectives in Personal Construct Theory. Academic Press: London pp. 1-30
Langfield-Smith K, Wirth A (1992) Measuring differences between cognitive maps. Journal of the Operational Research Society 43(12): 1135-1150.
Mingers J, Gill A (eds.) (1997) Multimethodology: the Theory and Practice of Combining Management Science Methodologies. Wiley: Chichester.
Mingers J, Rosenhead J (2004) Problem structuring methods in action. European Journal of Operational Research 152: 530-554
Montibeller G, Belton V (2006) Causal maps and the evaluation of decision options – a review. Journal of the Operational Research Society 57(7): 779-791.
Moyer NE, Thompson LS (1992) Options for reshaping the railway. Policy Research Working Papers,WPS926 Infrastructure and Urban Development Department, The World Bank, Washington DC.
Phillips LD (1984) A theory of requisite decision models. ACTA Psychologica 56(1): 29-48.
Roberts FS (1978) Graph Theory and its Applications to Problems of Society. Society for Industrial and Applied Mathematics: Philadelphia.
Rodrigue J-P, Comtois C, Slack B (2006) The Geography of Transport Systems. Routledge: London.
Rosenhead J, Mingers J (eds.) (2001) Rational Analysis for a Problematic World Revisited: Problem Structuring Methods for Uncertainty, Complexity and Conflict. 2nd edition. Wiley: Chichester.
Shaw D, Ackermann F, Eden C (2003) Approaches to sharing knowledge in group problem structuring. Journal of the Operational Research Society 54(9): 936-948.
Sterman JD (2000) Business Dynamics: Systems Thinking and Modeling for a Complex World. Irwin/McGraw-Hill: New York
Thompson LS (2004) Privatizing British Railways: are there lessons for the World Bank and its borrowers? The International Bank for Reconstruction and Development/The World Bank: Washington DC
Wang S (1996) A dynamic perspective of differences between cognitive maps. Journal of the Operational Research Society 47(4): 538-549. Wasserman S, Faust K (1994) Social Network Analysis: Methods and Applications. Cambridge University Press, Cambridge.
Wood D (1992) The Power of Maps. Guilford Press: New York.