Embed Size (px)
Citation preview
Building Science 2 [ARC 3413]
Project 1: Lighting and Acoustic Performance Evaluation and Design
Tutor: Mr. Sanjeh Raman
Anthony Sudianto - 0312260
Aryo Dhaneswara - 0309093
Philip Sutejo - 0312245
Sylvia Kwan - 0311790
Usen Octonio - 0311679
Wong Ai Ling - 0303742
Table of Content
1.0 Introduction
1.1 General
1.2 Aim Objective
1.3 Case Study Site Introduction
1.4 Measured Drawing of Site
1.4.1 Ground Floor Plan
1.4.2 First Floor Plan
1.4.3 Longitudinal Section
2.0 Acoustic Study
2.1 Precedent Study
2.1.1 Acoustic - Music Café, August Wilson Centre
2.1.2 Conclusion
2.2 Methodology of Acoustic Research
2.2.1 Description of Equipment
2.2.2 Data Collection Method
2.2.3 Limitation
2.2.4 Acoustic Analysis Calculation Method
2.2.5 MS 1525 dB Recommendation and Other Standards
2.3 Acoustic Case Study
2.3.1 External Noise Source
2.3.2 Internal Noise Source
2.3.2.1 Speaker Specification
2.3.2.2 Air-Conditioner Specification
2.3.2.3 Electrical Appliances Specification
2.3.3 Materials
2.3.4 Acoustic Data Collection
2.3.4.1 Acoustic reading (non-peak)
2.3.4.2 Acoustic reading (peak)
2.3.5 Acoustic Ray Diagram
2.3.6 Acoustic Calculation
2.3.6.1 Ground Floor Zone A
2.3.6.1.1 Sound Pressure Level
Project 1 Lighting and Acoustic Performance Evaluation and Design
2.3.6.1.2 Reverberation Time
2.3.6.2 Ground Floor Zone B
2.3.6.2.1 Sound Pressure Level
2.3.6.2.2 Reverberation Time
2.3.6.3 Ground Floor Zone C
2.3.6.3.1 Sound Pressure Level
2.3.6.3.2 Reverberation Time
2.3.6.4 Ground Floor Zone D
2.3.6.4.1 Sound Pressure Level
2.3.6.4.2 Reverberation Time
2.3.6.5 Ground Floor Zone E
2.3.6.5.1 Sound Pressure Level
2.3.6.5.2 Reverberation Time
2.3.6.6 First Floor Zone A
2.3.6.6.1 Sound Pressure Level
2.3.6.6.2 Reverberation Time
2.3.6.7 First Floor Zone B
2.3.6.7.1 Sound Pressure Level
2.3.6.7.2 Reverberation Time
2.3.6.8 First Floor Zone C
2.3.6.8.1 Sound Pressure Level
2.3.6.8.2 Reverberation Time
2.3.6.9 Sound Reduction Index
2.3.7 Conclusion
2.3.7.1 Sound Pressure Level
2.3.7.2 Reverberation Time
2.3.7.3 Sound Reduction Index
2.3.8 Improvement and Recommendation
Project 1 Lighting and Acoustic Performance Evaluation and Design
3.0 Lighting Study
3.1 Precedent Study
3.1.1 Lighting - The Art Room, W.D. Richards Elementary School
3.1.2 Conclusion
3.2 Methodology of Lighting Research
3.2.1 Description of Equipment
3.2.2 Data Collection Method
3.2.3 Lighting Analysis Calculation Method
3.2.4 MS 1525 Lux Recommendation
3.3 Lighting Case Study
3.3.1 Lighting Condition of Case Study
3.3.2 Internal Artificial Lighting Fixture
3.3.2.1 Artificial Lighting Fixtures Specification
3.3.3 Artificial Lighting Lux Contour Diagram
3.3.4 Material and Color Reflectance Table
3.3.5 Lighting Data Collection
3.3.5.1 Daytime Lux Reading
3.3.5.2 Nighttime Lux Reading
3.3.5.3 Day and Night Lux Data Comparison
3.3.6 Lighting Calculation
3.3.6.1 Ground Floor Zone A
3.3.6.2 Ground Floor Zone B
3.3.6.3 Ground Floor Zone D
3.3.6.4 Ground Floor Zone E
3.3.6.5 First Floor Zone A
3.3.6.6 First Floor Zone B
3.3.6.7 First Floor Zone C
3.3.7 Conclusion
3.3.8 Improvement and Recommendation
4.0 References
Project 1 Lighting and Acoustic Performance Evaluation and Design
1.0 Introduction
1.1 General The visit to absolute coffee (the site) firstly we had to create a sketch floor plan having the placement of furniture to be include into the floor plan for the case study. With the floor plan created, grid lines of 2 x 1.5m were created, to have accurate collection of data. Through the intersection of grid lines we measured the illumnance of the interior and direct lighting with the aid of lux meter. The sound meter was used at the same time to get the acoustic readings. Our data collecting happens in two different period, morning- non peak hour and night-peak hour. Through the data collected the analyses can be performed with the comparison with the two data, identifying the problem created by the light and sound that contributes to occupancy comfort, these can be achieve through the calculation that will be performed. Calculation such as daylight factor, lumen method, reverberation time and sound transmission coefficient are being applied. Solution and recommendation are provided with the referencing MS1525 to give the space a better comfort.
1.2 Aim and Objective
Through this project it is expected that we achieve the objective and our aim which is:
o To understand principle of acoustic and lighting also the requirement of these aspect in specific space.
o Analyze characteristic of acoustic and lighting within spaces. o Generate solution and detail evaluation of the analyzed spaces with the principle
understanding of acoustic and lighting. o Understand the technicality and the way to design and application to improve the quality of
the designed space. o Produce documentation of acoustic and lighting and the analysis in relation to lighting and
acoustic requirement and the design layout. o To understand the desirable limit of the lighting and noise level acceptance inside a used
space in the planning and installation stage.
Project 1 Lighting and Acoustic Performance Evaluation and Design
1.3 Case Study Introduction
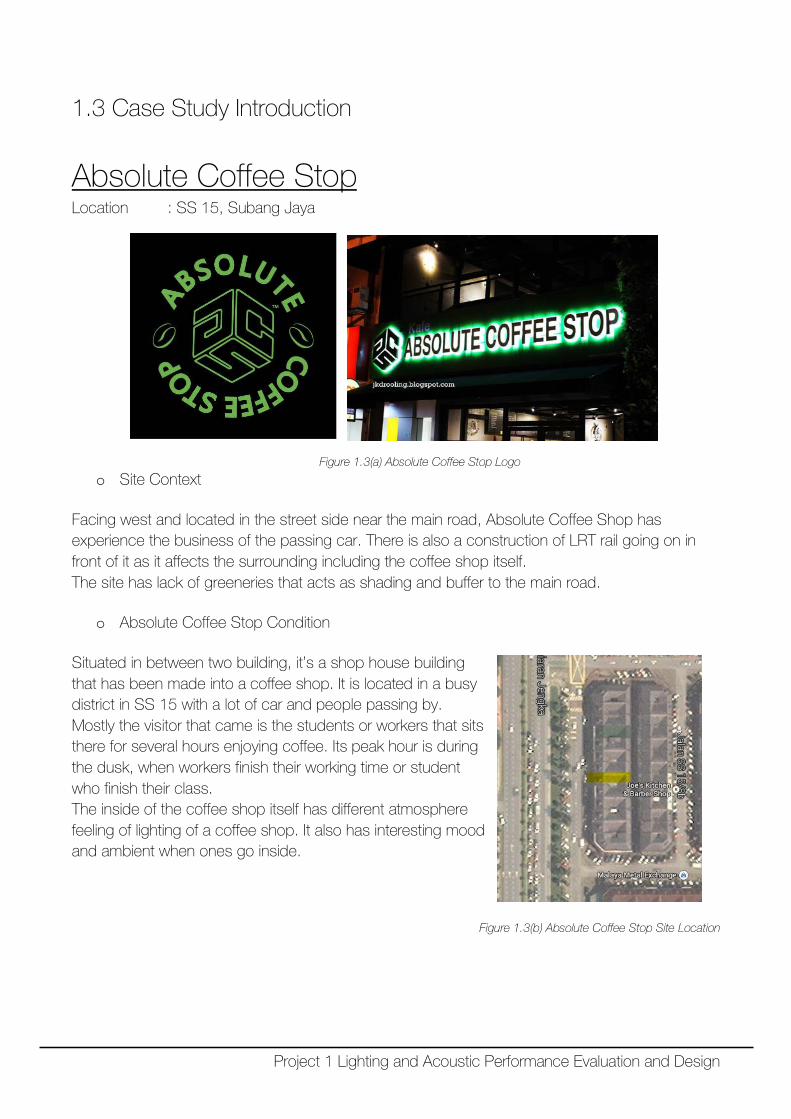
Absolute Coffee Stop
Location : SS 15, Subang Jaya
Figure 1.3(a) Absolute Coffee Stop Logo
o Site Context Facing west and located in the street side near the main road, Absolute Coffee Shop has experience the business of the passing car. There is also a construction of LRT rail going on in front of it as it affects the surrounding including the coffee shop itself. The site has lack of greeneries that acts as shading and buffer to the main road.
o Absolute Coffee Stop Condition Situated in between two building, it’s a shop house building that has been made into a coffee shop. It is located in a busy district in SS 15 with a lot of car and people passing by. Mostly the visitor that came is the students or workers that sits there for several hours enjoying coffee. Its peak hour is during the dusk, when workers finish their working time or student who finish their class. The inside of the coffee shop itself has different atmosphere feeling of lighting of a coffee shop. It also has interesting mood and ambient when ones go inside.
Figure 1.3(b) Absolute Coffee Stop Site Location
Project 1 Lighting and Acoustic Performance Evaluation and Design
1.4 Measured Drawing of Absolute Coffee Shop
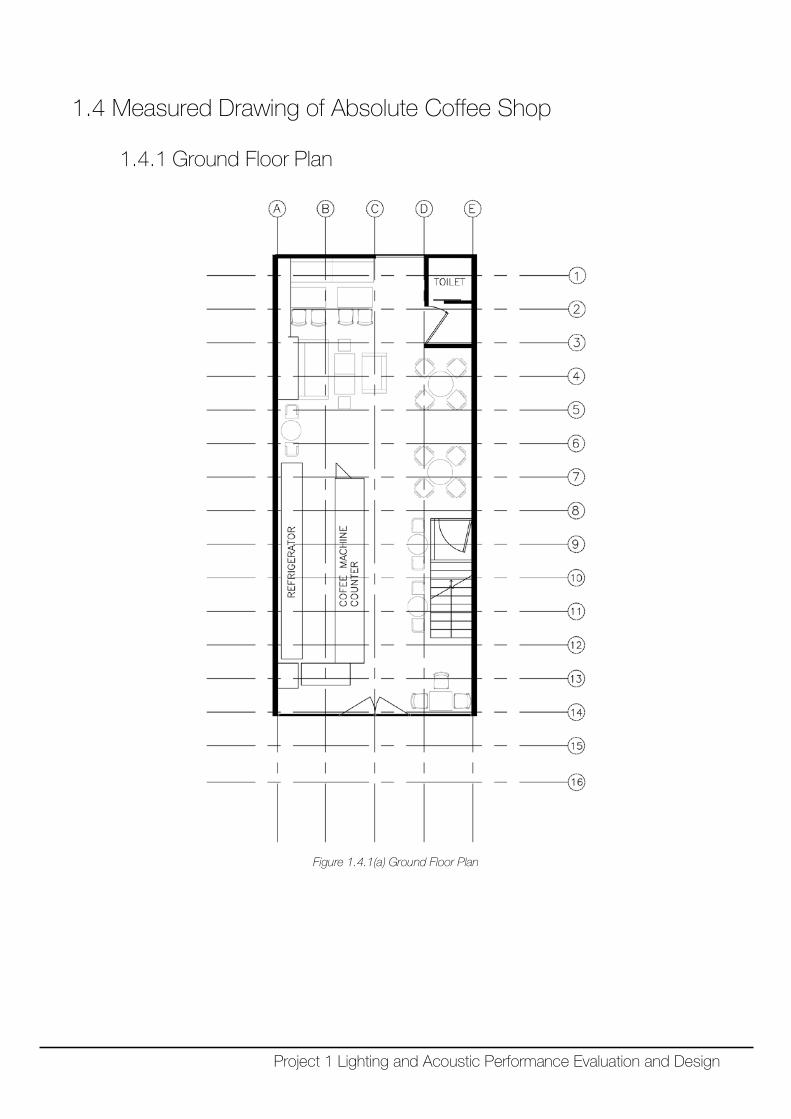
1.4.1 Ground Floor Plan
Figure 1.4.1(a) Ground Floor Plan
Project 1 Lighting and Acoustic Performance Evaluation and Design
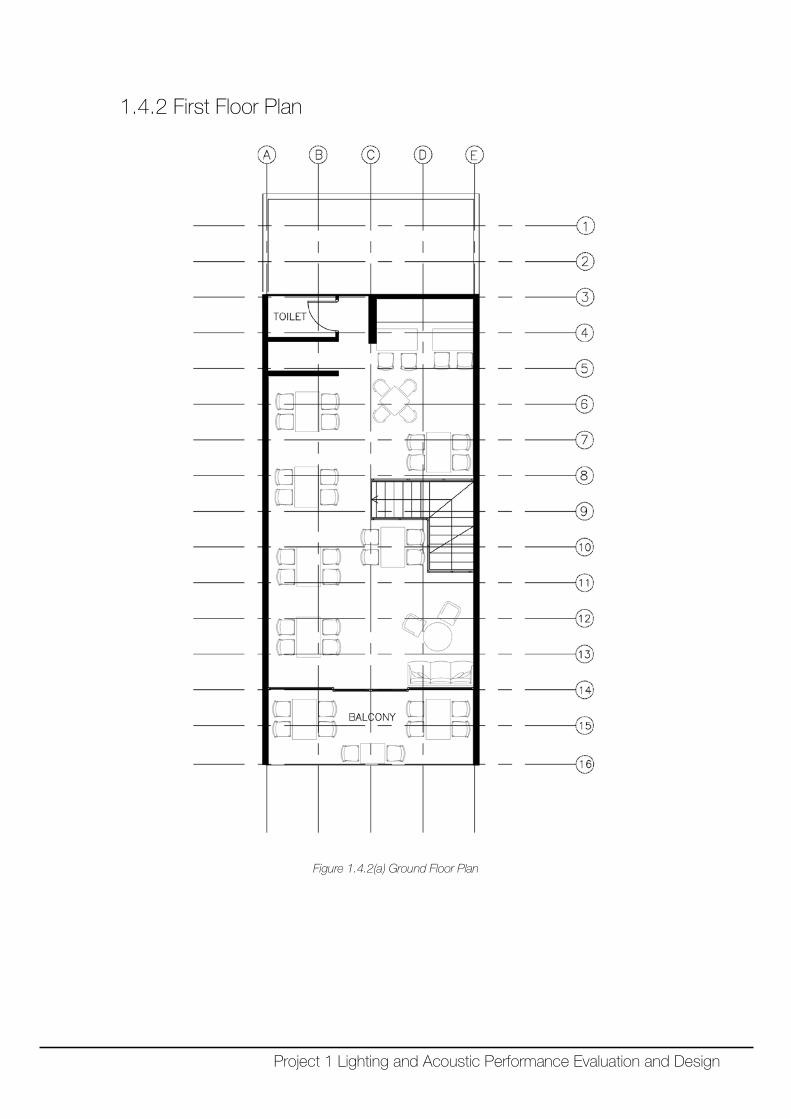
1.4.2 First Floor Plan
Figure 1.4.2(a) Ground Floor Plan
Project 1 Lighting and Acoustic Performance Evaluation and Design

1.4.3 Longitudinal Section
Figure 1.4.3(a) Ground Floor Plan
Project 1 Lighting and Acoustic Performance Evaluation and Design
2.0 Acoustic Study
Project 1 Lighting and Acoustic Performance Evaluation and Design
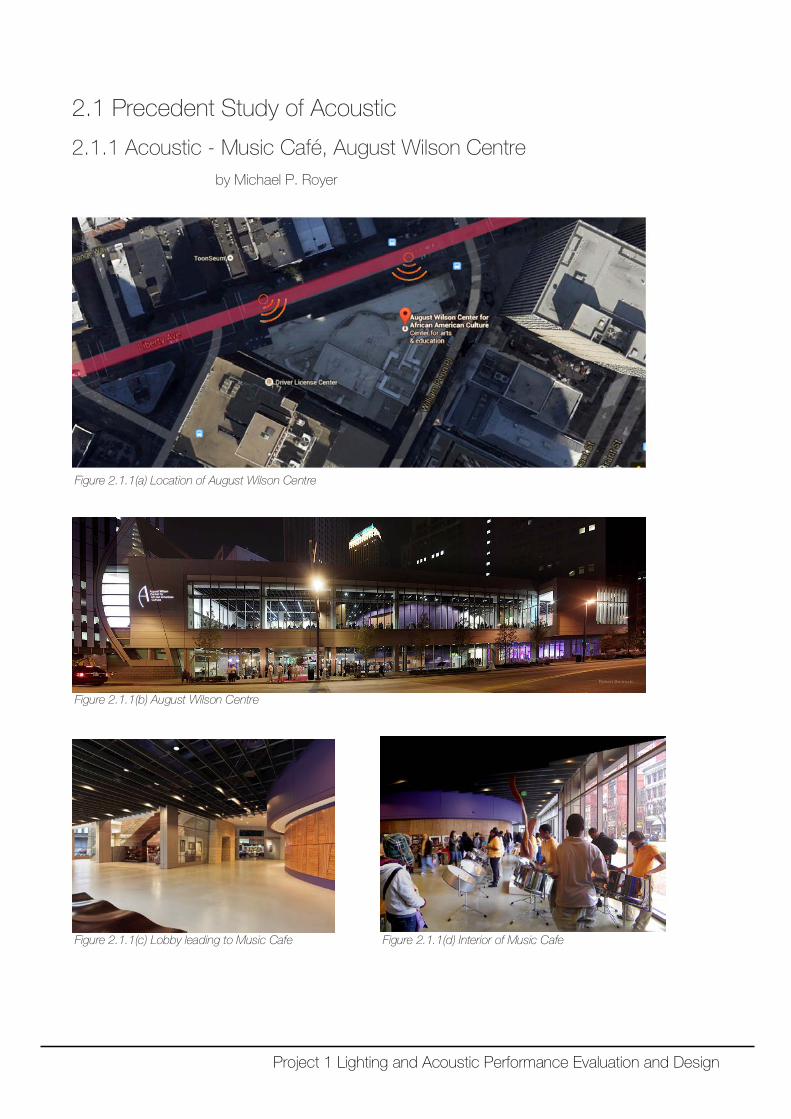
2.1 Precedent Study of Acoustic
2.1.1 Acoustic - Music Café, August Wilson Centre by Michael P. Royer
Figure 2.1.1(a) Location of August Wilson Centre
Figure 2.1.1(b) August Wilson Centre
Figure 2.1.1(c) Lobby leading to Music Cafe Figure 2.1.1(d) Interior of Music Cafe
Project 1 Lighting and Acoustic Performance Evaluation and Design
o Function As a center to arts and culture, August Wilson Centre is home to a variety of acoustical performances. The
Music Café is located at sidewalk level and can be accessed from the street or from the center within via
the lobby (Figure 2.1.1(b)). According to architects Perkins + Will, the music café is modeled after New
York’s BAM café or Joe Pub the Café, it is also to accommodate an on-going menu of programs and to
function as an alternative performance space with limited seating for jazz and poetry which forms a club
setting at night. A portable stage with theatrical lighting will be imported to support such performances as
required.
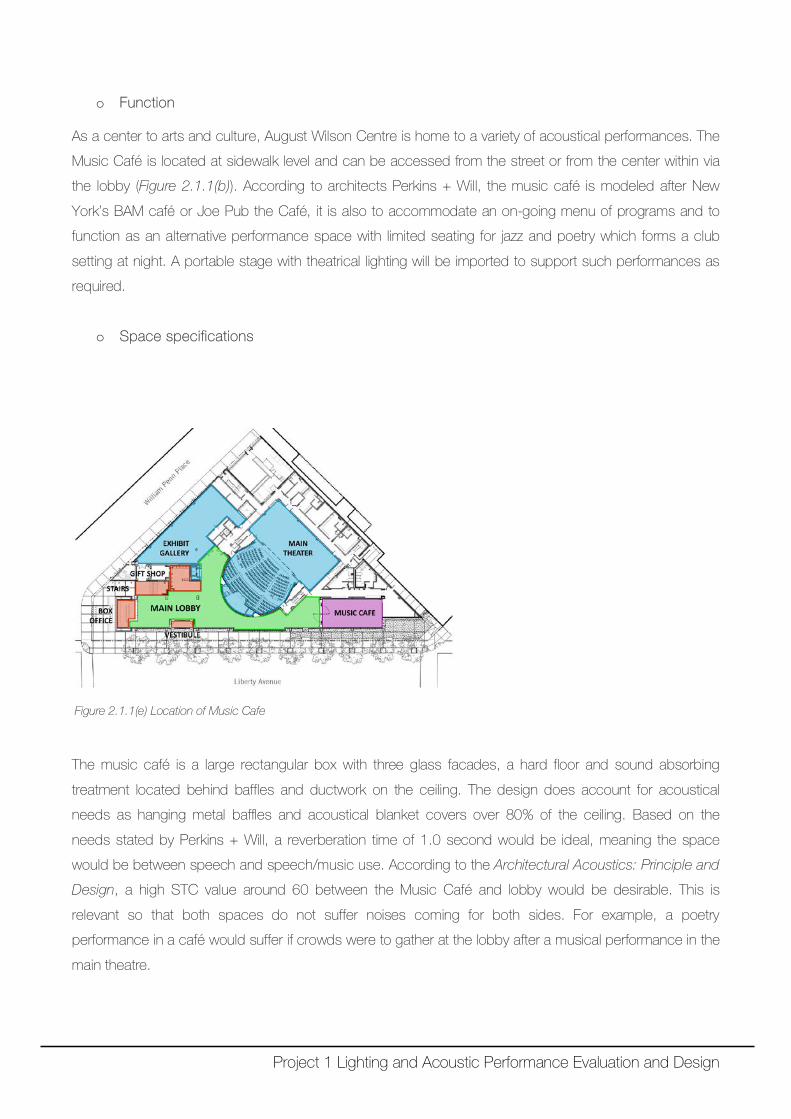
o Space specifications
Figure 2.1.1(e) Location of Music Cafe
The music café is a large rectangular box with three glass facades, a hard floor and sound absorbing
treatment located behind baffles and ductwork on the ceiling. The design does account for acoustical
needs as hanging metal baffles and acoustical blanket covers over 80% of the ceiling. Based on the
needs stated by Perkins + Will, a reverberation time of 1.0 second would be ideal, meaning the space
would be between speech and speech/music use. According to the Architectural Acoustics: Principle and
Design, a high STC value around 60 between the Music Café and lobby would be desirable. This is
relevant so that both spaces do not suffer noises coming for both sides. For example, a poetry
performance in a café would suffer if crowds were to gather at the lobby after a musical performance in the
main theatre.
Project 1 Lighting and Acoustic Performance Evaluation and Design
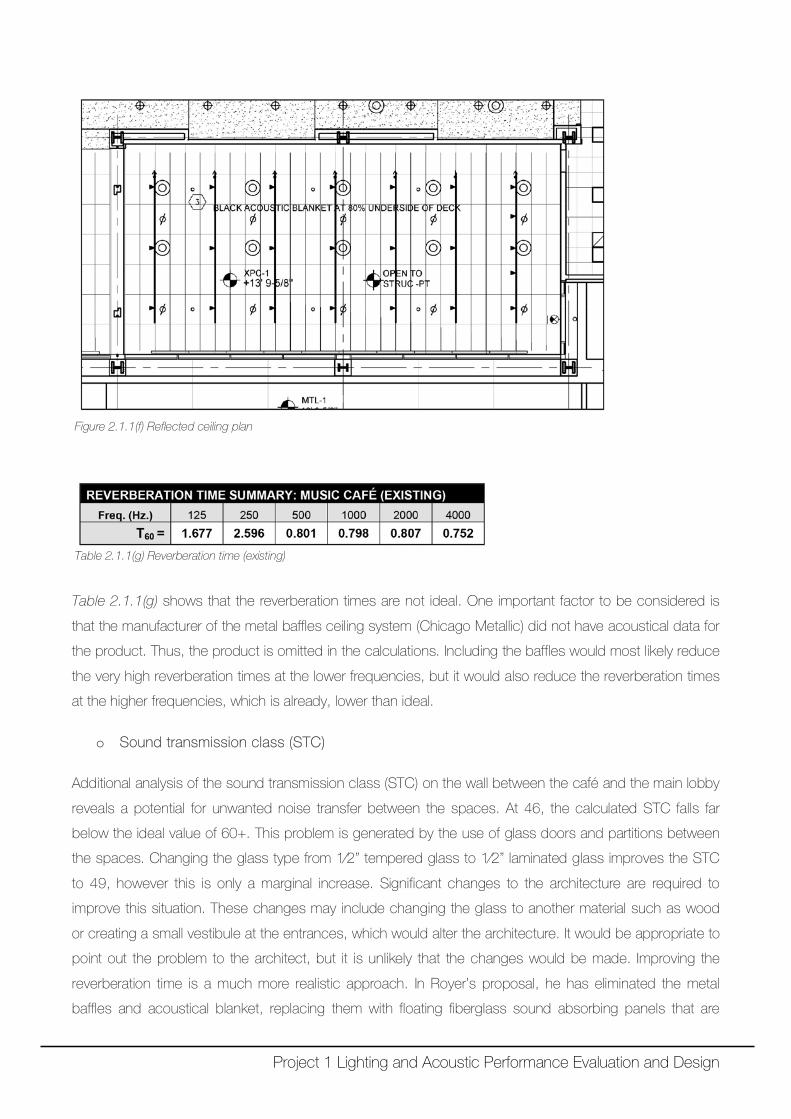
Figure 2.1.1(f) Reflected ceiling plan
Table 2.1.1(g) Reverberation time (existing)
Table 2.1.1(g) shows that the reverberation times are not ideal. One important factor to be considered is
that the manufacturer of the metal baffles ceiling system (Chicago Metallic) did not have acoustical data for
the product. Thus, the product is omitted in the calculations. Including the baffles would most likely reduce
the very high reverberation times at the lower frequencies, but it would also reduce the reverberation times
at the higher frequencies, which is already, lower than ideal.
o Sound transmission class (STC)
Additional analysis of the sound transmission class (STC) on the wall between the café and the main lobby
reveals a potential for unwanted noise transfer between the spaces. At 46, the calculated STC falls far
below the ideal value of 60+. This problem is generated by the use of glass doors and partitions between
the spaces. Changing the glass type from 1⁄2” tempered glass to 1⁄2” laminated glass improves the STC
to 49, however this is only a marginal increase. Significant changes to the architecture are required to
improve this situation. These changes may include changing the glass to another material such as wood
or creating a small vestibule at the entrances, which would alter the architecture. It would be appropriate to
point out the problem to the architect, but it is unlikely that the changes would be made. Improving the
reverberation time is a much more realistic approach. In Royer’s proposal, he has eliminated the metal
baffles and acoustical blanket, replacing them with floating fiberglass sound absorbing panels that are
Project 1 Lighting and Acoustic Performance Evaluation and Design
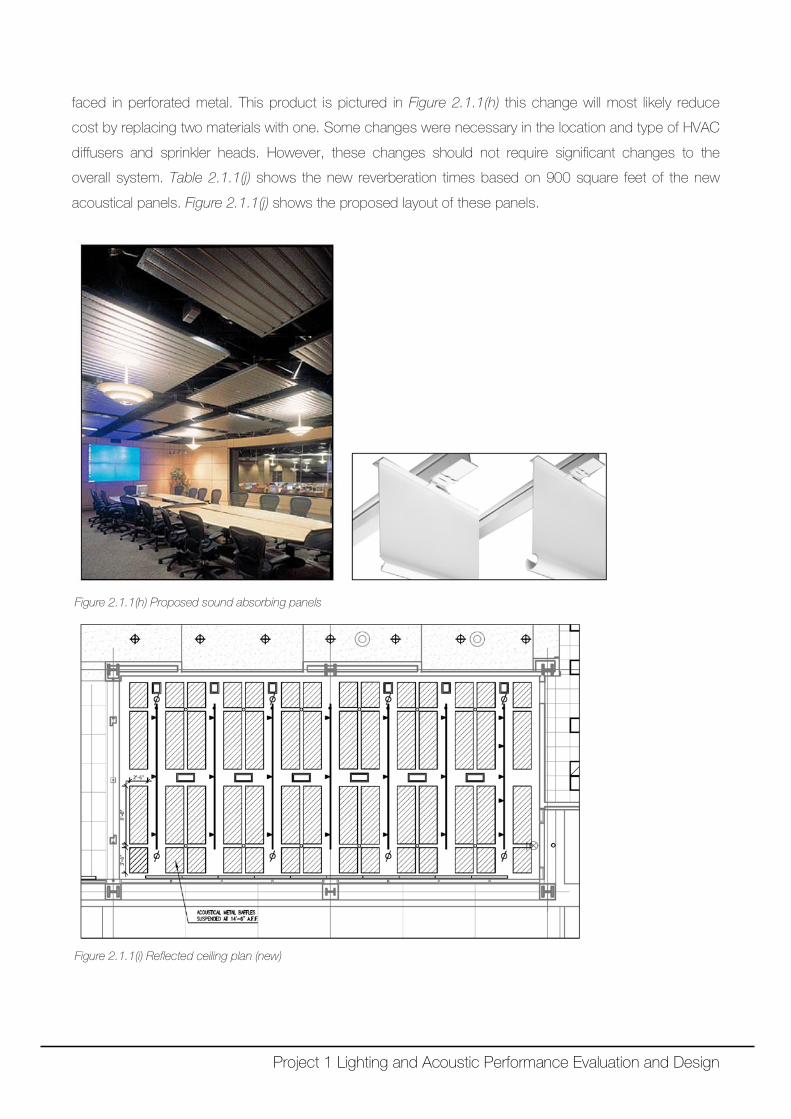
faced in perforated metal. This product is pictured in Figure 2.1.1(h) this change will most likely reduce
cost by replacing two materials with one. Some changes were necessary in the location and type of HVAC
diffusers and sprinkler heads. However, these changes should not require significant changes to the
overall system. Table 2.1.1(j) shows the new reverberation times based on 900 square feet of the new
acoustical panels. Figure 2.1.1(j) shows the proposed layout of these panels.
Figure 2.1.1(h) Proposed sound absorbing panels
Figure 2.1.1(i) Reflected ceiling plan (new)
Project 1 Lighting and Acoustic Performance Evaluation and Design
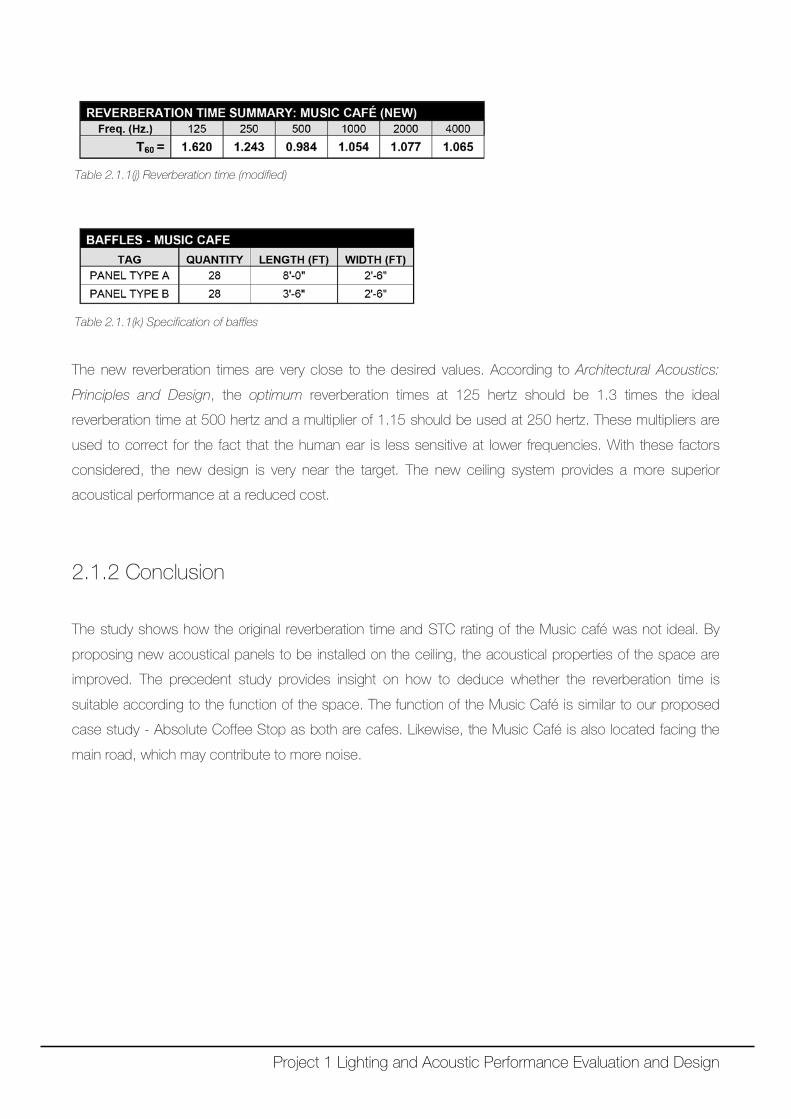
Table 2.1.1(j) Reverberation time (modified)
Table 2.1.1(k) Specification of baffles
The new reverberation times are very close to the desired values. According to Architectural Acoustics:
Principles and Design, the optimum reverberation times at 125 hertz should be 1.3 times the ideal
reverberation time at 500 hertz and a multiplier of 1.15 should be used at 250 hertz. These multipliers are
used to correct for the fact that the human ear is less sensitive at lower frequencies. With these factors
considered, the new design is very near the target. The new ceiling system provides a more superior
acoustical performance at a reduced cost.
2.1.2 Conclusion
The study shows how the original reverberation time and STC rating of the Music café was not ideal. By
proposing new acoustical panels to be installed on the ceiling, the acoustical properties of the space are
improved. The precedent study provides insight on how to deduce whether the reverberation time is
suitable according to the function of the space. The function of the Music Café is similar to our proposed
case study - Absolute Coffee Stop as both are cafes. Likewise, the Music Café is also located facing the
main road, which may contribute to more noise.
Project 1 Lighting and Acoustic Performance Evaluation and Design
2.2 Methodology of Acoustic Research
2.2.1 Description of Equipment
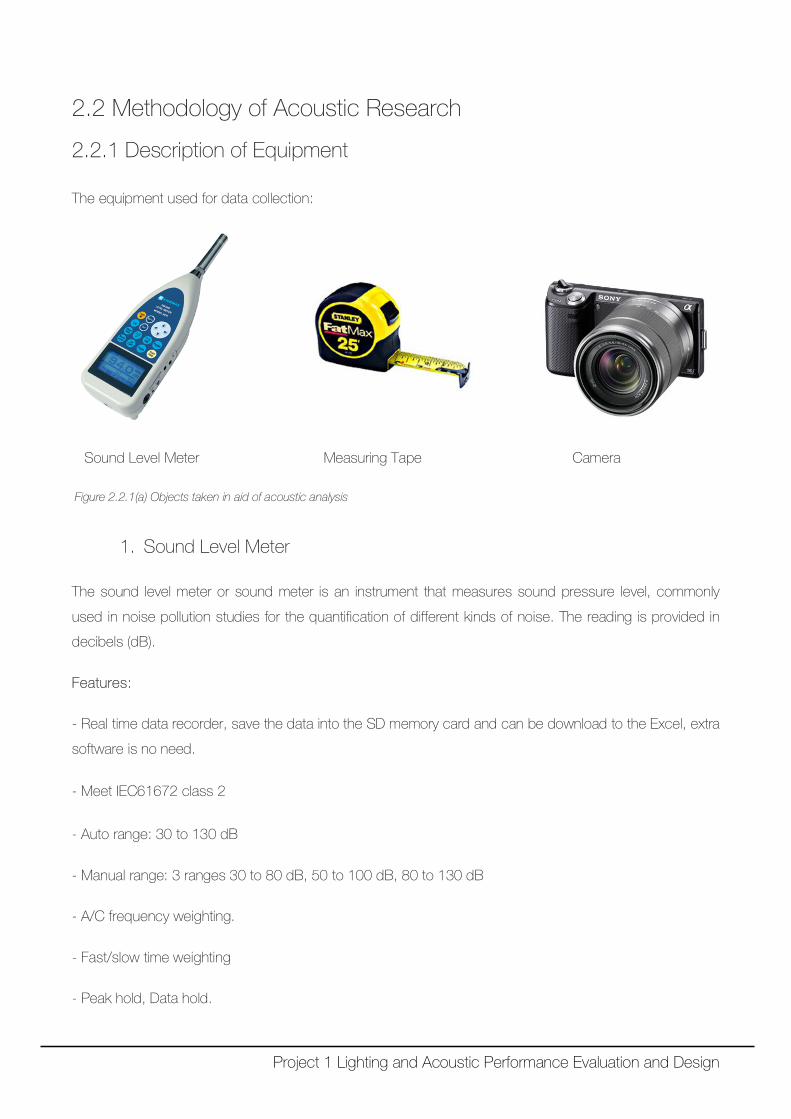
The equipment used for data collection:
Sound Level Meter Measuring Tape Camera
Figure 2.2.1(a) Objects taken in aid of acoustic analysis
1. Sound Level Meter
The sound level meter or sound meter is an instrument that measures sound pressure level, commonly
used in noise pollution studies for the quantification of different kinds of noise. The reading is provided in
decibels (dB).
Features:
- Real time data recorder, save the data into the SD memory card and can be download to the Excel, extra
software is no need.
- Meet IEC61672 class 2
- Auto range: 30 to 130 dB
- Manual range: 3 ranges 30 to 80 dB, 50 to 100 dB, 80 to 130 dB
- A/C frequency weighting.
- Fast/slow time weighting
- Peak hold, Data hold.
Project 1 Lighting and Acoustic Performance Evaluation and Design
- Record (Ma2. & Min.)
- RS232/USB computer interface
- Optional wind shield ball, SB-01
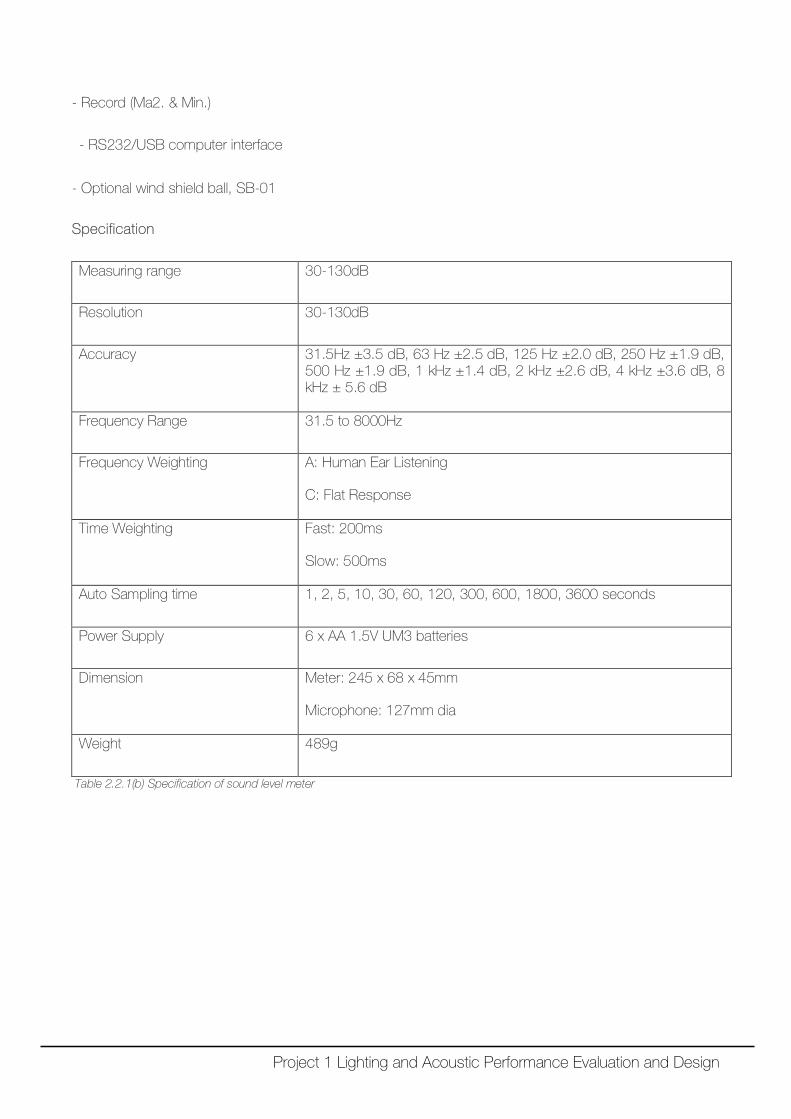
Specification
Measuring range 30-130dB
Resolution 30-130dB
Accuracy 31.5Hz ±3.5 dB, 63 Hz ±2.5 dB, 125 Hz ±2.0 dB, 250 Hz ±1.9 dB, 500 Hz ±1.9 dB, 1 kHz ±1.4 dB, 2 kHz ±2.6 dB, 4 kHz ±3.6 dB, 8 kHz ± 5.6 dB
Frequency Range 31.5 to 8000Hz
Frequency Weighting A: Human Ear Listening
C: Flat Response
Time Weighting Fast: 200ms
Slow: 500ms
Auto Sampling time 1, 2, 5, 10, 30, 60, 120, 300, 600, 1800, 3600 seconds
Power Supply 6 x AA 1.5V UM3 batteries
Dimension Meter: 245 x 68 x 45mm
Microphone: 127mm dia
Weight 489g
Table 2.2.1(b) Specification of sound level meter
Project 1 Lighting and Acoustic Performance Evaluation and Design
2. Measuring Tape
The measuring tape is used to measure the 1.5m height needed to position the meter. The tape was also
used to measure the width and length of site.
3. Camera
A DSLR was used to document the furniture and materials applied on site. Sounds for acoustics were also
recorded for reference.
Project 1 Lighting and Acoustic Performance Evaluation and Design
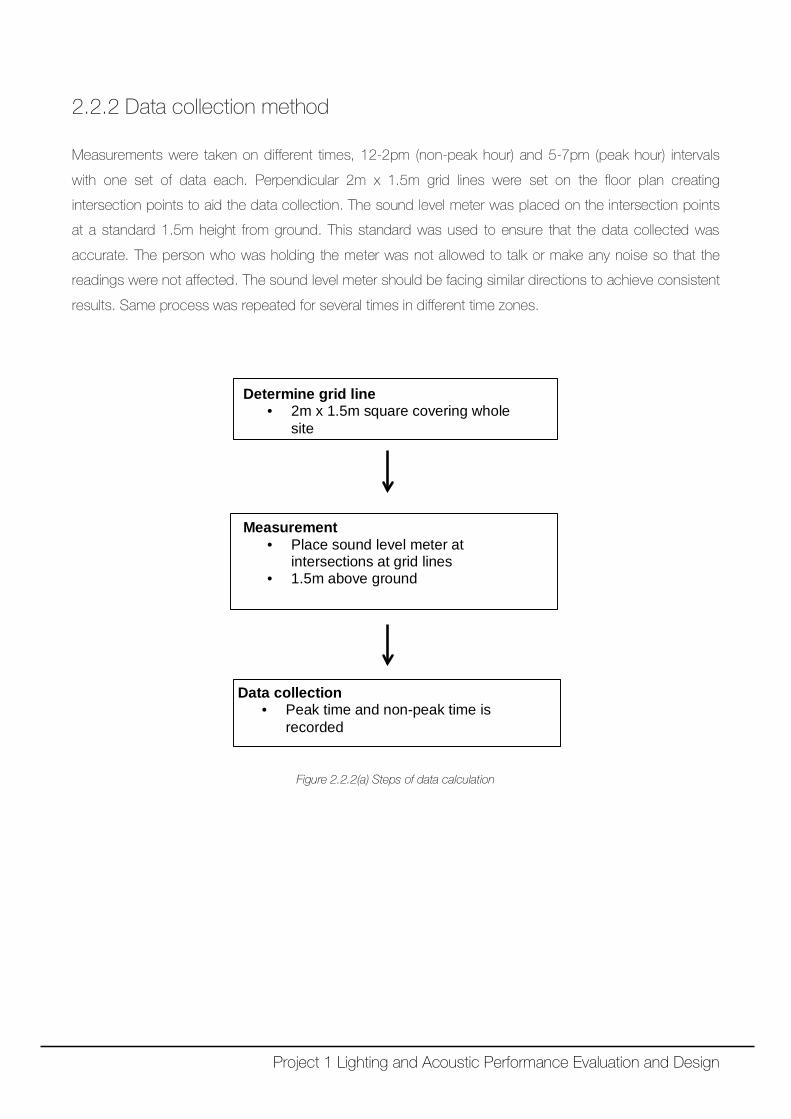
2.2.2 Data collection method
Measurements were taken on different times, 12-2pm (non-peak hour) and 5-7pm (peak hour) intervals
with one set of data each. Perpendicular 2m x 1.5m grid lines were set on the floor plan creating
intersection points to aid the data collection. The sound level meter was placed on the intersection points
at a standard 1.5m height from ground. This standard was used to ensure that the data collected was
accurate. The person who was holding the meter was not allowed to talk or make any noise so that the
readings were not affected. The sound level meter should be facing similar directions to achieve consistent
results. Same process was repeated for several times in different time zones.
Figure 2.2.2(a) Steps of data calculation
Determine grid line
• 2m x 1.5m square covering whole site
Measurement • Place sound level meter at
intersections at grid lines • 1.5m above ground
Data collection
• Peak time and non-peak time is recorded
Project 1 Lighting and Acoustic Performance Evaluation and Design
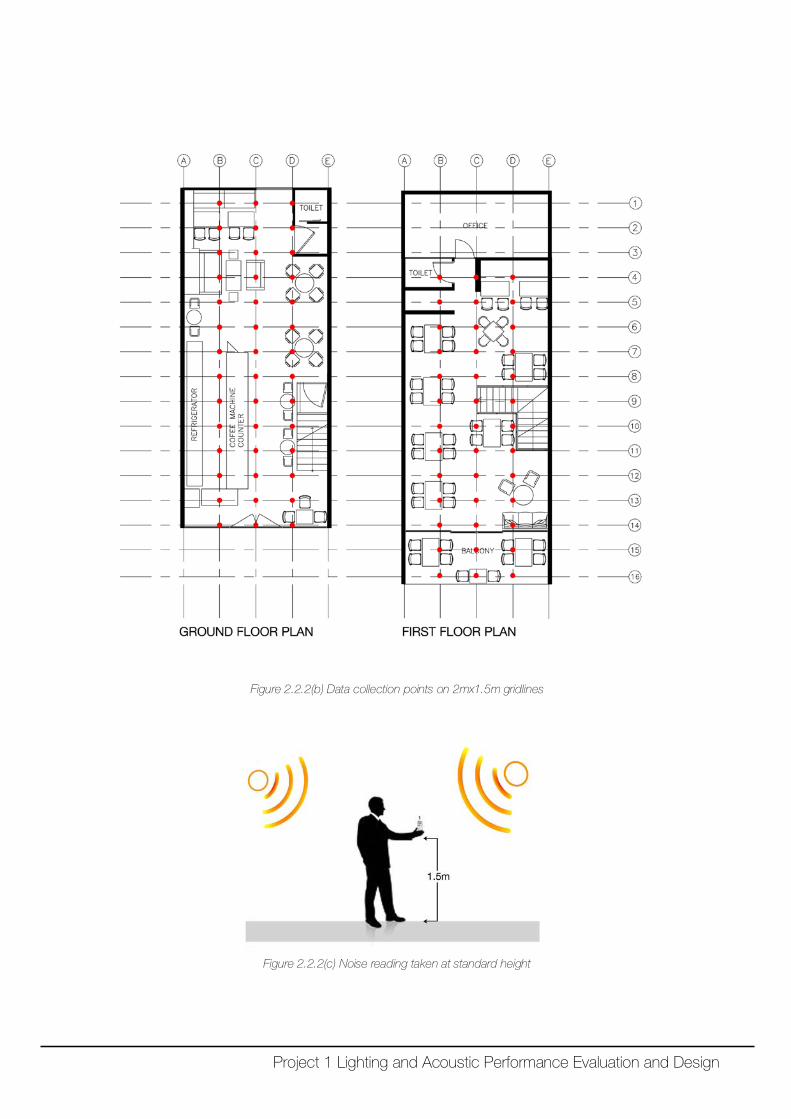
Figure 2.2.2(b) Data collection points on 2mx1.5m gridlines
Figure 2.2.2(c) Noise reading taken at standard height
Project 1 Lighting and Acoustic Performance Evaluation and Design
2.2.3 Limitations
o Incomplete definition
Differences in height levels affect the reading of the sound level meter. The height levels may fluctuate
slightly when taking readings. As different operators have varying heights, this may result in slight
inaccuracy.
o Failure to account of a factor
Non-peak hours and peak hours are not properly utilized. For example, the bar tender might be away for
the bar during the data is recorded during peak hour.
o Environmental factor
The sound level meter is very sensitive to minimal sound. Rainy days may yield higher dB readings.
Project 1 Lighting and Acoustic Performance Evaluation and Design
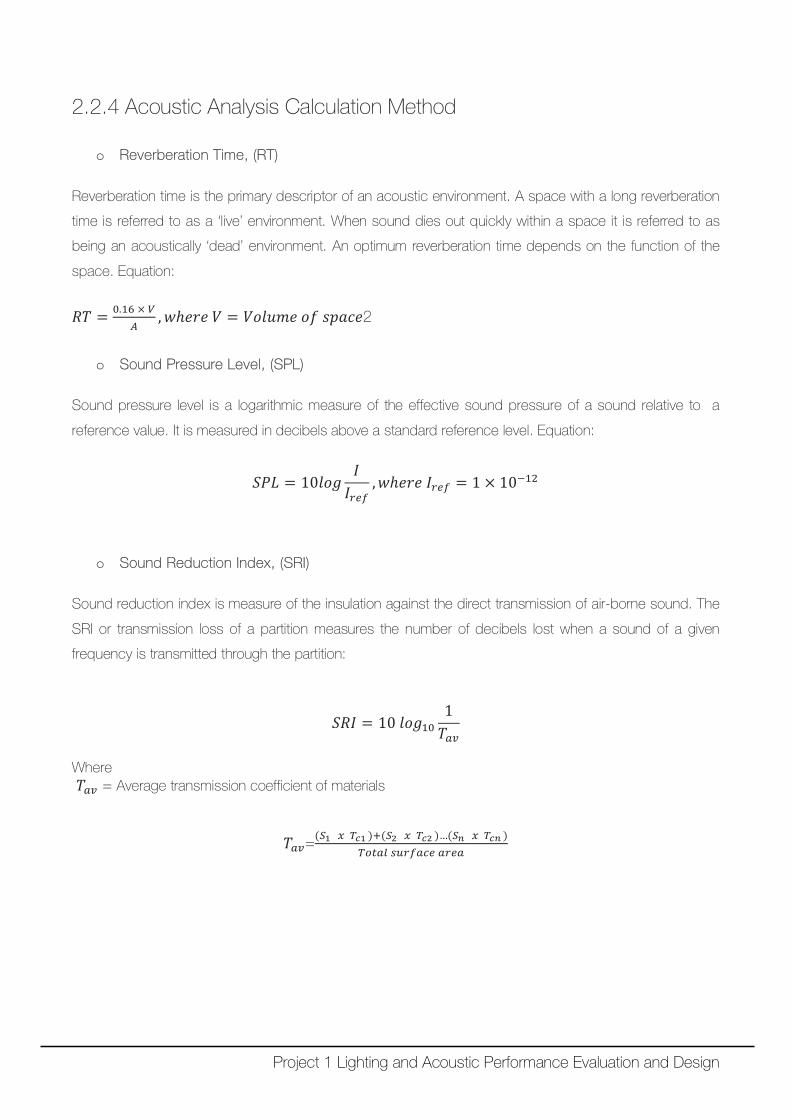
2.2.4 Acoustic Analysis Calculation Method
o Reverberation Time, (RT)
Reverberation time is the primary descriptor of an acoustic environment. A space with a long reverberation
time is referred to as a ‘live’ environment. When sound dies out quickly within a space it is referred to as
being an acoustically ‘dead’ environment. An optimum reverberation time depends on the function of the
space. Equation:
𝑅𝑅𝑅𝑅 = 0.16 × 𝑉𝑉𝐴𝐴
,𝑤𝑤ℎ𝑒𝑒𝑒𝑒𝑒𝑒 𝑉𝑉 = 𝑉𝑉𝑉𝑉𝑉𝑉𝑉𝑉𝑉𝑉𝑒𝑒 𝑉𝑉𝑜𝑜 𝑠𝑠𝑠𝑠𝑠𝑠𝑠𝑠𝑒𝑒2
o Sound Pressure Level, (SPL)
Sound pressure level is a logarithmic measure of the effective sound pressure of a sound relative to a
reference value. It is measured in decibels above a standard reference level. Equation:
𝑆𝑆𝑆𝑆𝑆𝑆 = 10𝑉𝑉𝑉𝑉𝑙𝑙𝐼𝐼𝐼𝐼𝑟𝑟𝑟𝑟𝑟𝑟
,𝑤𝑤ℎ𝑒𝑒𝑒𝑒𝑒𝑒 𝐼𝐼𝑟𝑟𝑟𝑟𝑟𝑟 = 1 × 10⁻¹²
o Sound Reduction Index, (SRI)
Sound reduction index is measure of the insulation against the direct transmission of air-borne sound. The
SRI or transmission loss of a partition measures the number of decibels lost when a sound of a given
frequency is transmitted through the partition:
𝑆𝑆𝑅𝑅𝐼𝐼 = 10 𝑉𝑉𝑉𝑉𝑙𝑙101𝑅𝑅𝑎𝑎𝑎𝑎
Where 𝑅𝑅𝑎𝑎𝑎𝑎 = Average transmission coefficient of materials
𝑅𝑅𝑎𝑎𝑎𝑎=
(𝑆𝑆1 𝑥𝑥 𝑇𝑇𝑐𝑐1 )+(𝑆𝑆2 𝑥𝑥 𝑇𝑇𝑐𝑐2 )…(𝑆𝑆𝑛𝑛 𝑥𝑥 𝑇𝑇𝑐𝑐𝑛𝑛 )𝑇𝑇𝑇𝑇𝑇𝑇𝑎𝑎𝑇𝑇 𝑠𝑠𝑠𝑠𝑟𝑟𝑟𝑟𝑎𝑎𝑠𝑠𝑟𝑟 𝑎𝑎𝑟𝑟𝑟𝑟𝑎𝑎
Project 1 Lighting and Acoustic Performance Evaluation and Design
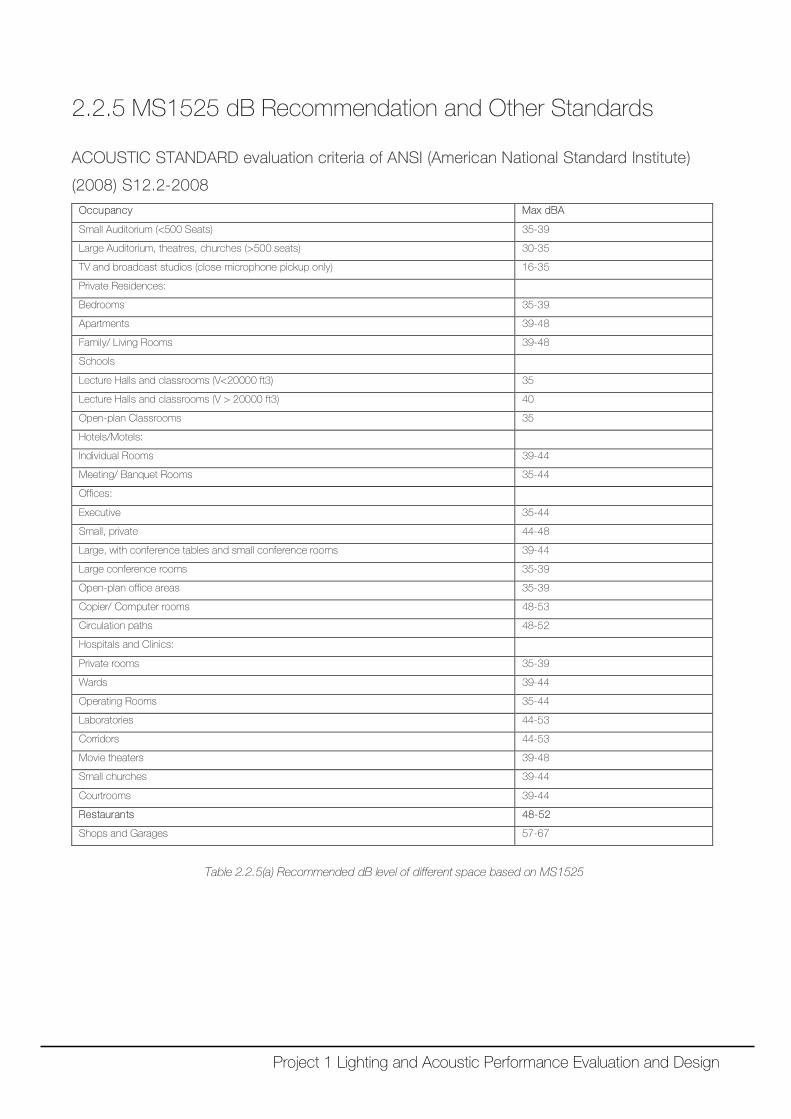
2.2.5 MS1525 dB Recommendation and Other Standards ACOUSTIC STANDARD evaluation criteria of ANSI (American National Standard Institute)
(2008) S12.2-2008
Occupancy Max dBA
Small Auditorium (<500 Seats) 35-39
Large Auditorium, theatres, churches (>500 seats) 30-35
TV and broadcast studios (close microphone pickup only) 16-35
Private Residences:
Bedrooms 35-39
Apartments 39-48
Family/ Living Rooms 39-48
Schools
Lecture Halls and classrooms (V<20000 ft3) 35
Lecture Halls and classrooms (V > 20000 ft3) 40
Open-plan Classrooms 35
Hotels/Motels:
Individual Rooms 39-44
Meeting/ Banquet Rooms 35-44
Offices:
Executive 35-44
Small, private 44-48
Large, with conference tables and small conference rooms 39-44
Large conference rooms 35-39
Open-plan office areas 35-39
Copier/ Computer rooms 48-53
Circulation paths 48-52
Hospitals and Clinics:
Private rooms 35-39
Wards 39-44
Operating Rooms 35-44
Laboratories 44-53
Corridors 44-53
Movie theaters 39-48
Small churches 39-44
Courtrooms 39-44
Restaurants 48-52
Shops and Garages 57-67
Table 2.2.5(a) Recommended dB level of different space based on MS1525
Project 1 Lighting and Acoustic Performance Evaluation and Design
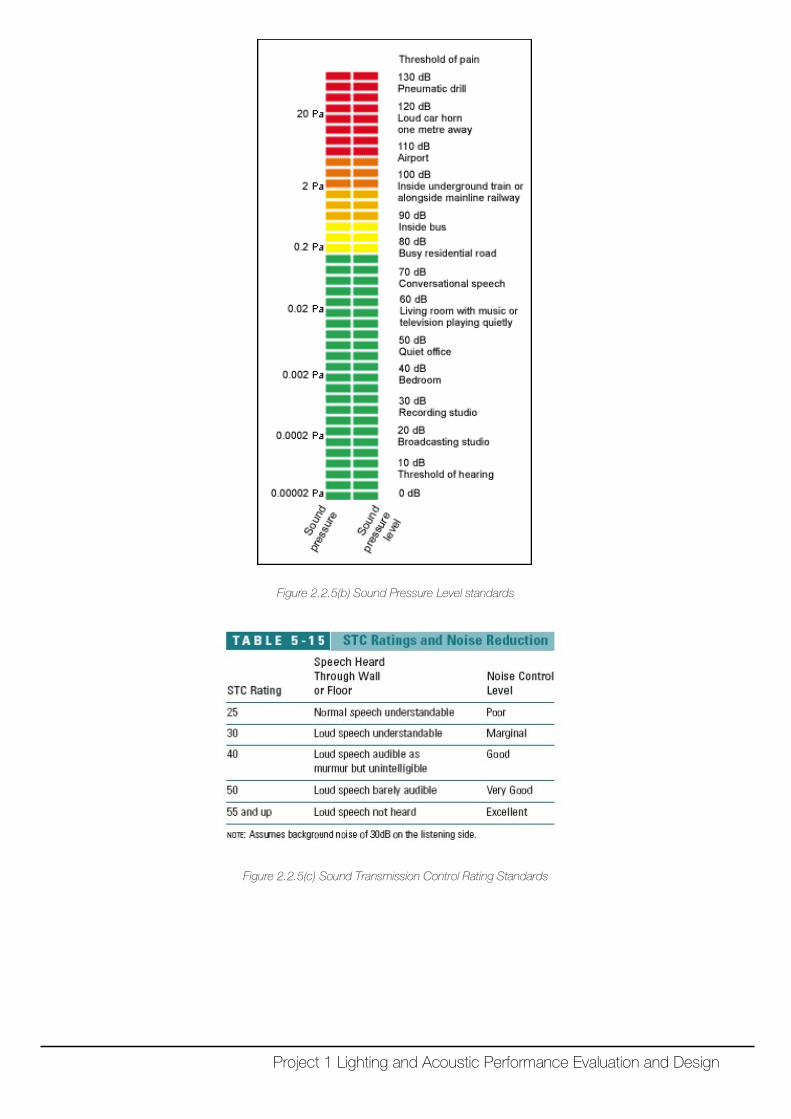
Figure 2.2.5(b) Sound Pressure Level standards
Figure 2.2.5(c) Sound Transmission Control Rating Standards
Project 1 Lighting and Acoustic Performance Evaluation and Design
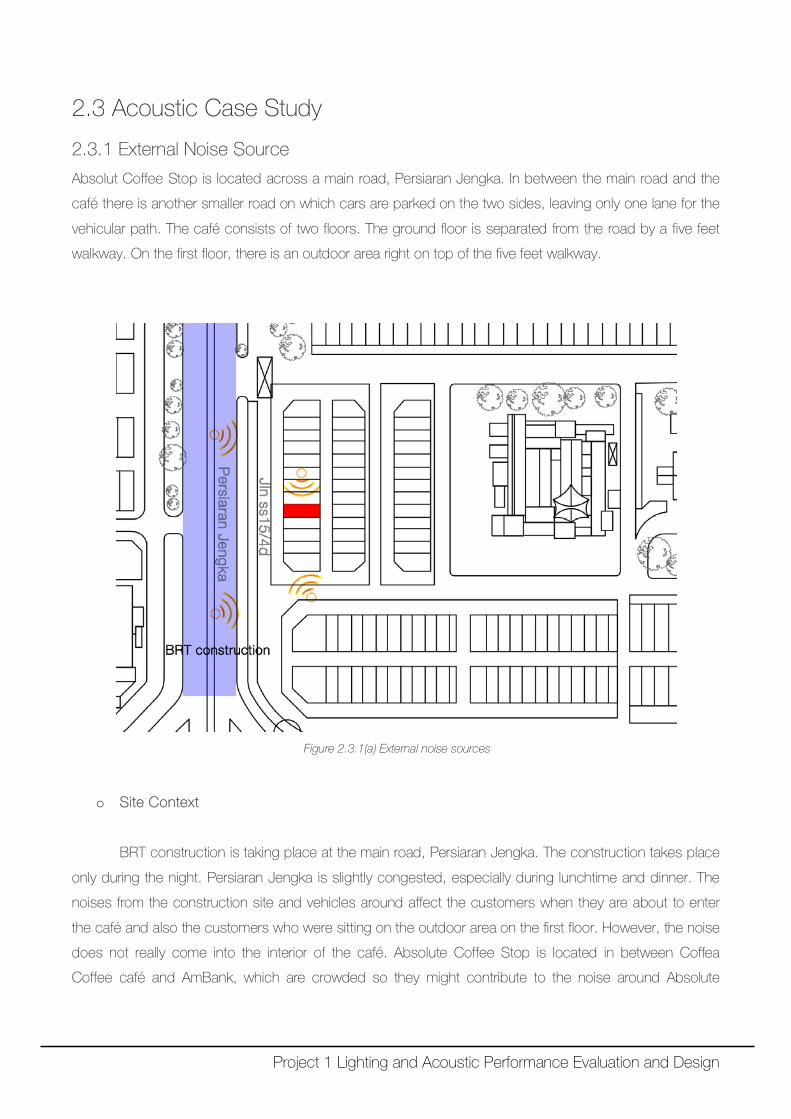
2.3 Acoustic Case Study 2.3.1 External Noise Source
Absolut Coffee Stop is located across a main road, Persiaran Jengka. In between the main road and the
café there is another smaller road on which cars are parked on the two sides, leaving only one lane for the
vehicular path. The café consists of two floors. The ground floor is separated from the road by a five feet
walkway. On the first floor, there is an outdoor area right on top of the five feet walkway.
Figure 2.3.1(a) External noise sources
o Site Context
BRT construction is taking place at the main road, Persiaran Jengka. The construction takes place
only during the night. Persiaran Jengka is slightly congested, especially during lunchtime and dinner. The
noises from the construction site and vehicles around affect the customers when they are about to enter
the café and also the customers who were sitting on the outdoor area on the first floor. However, the noise
does not really come into the interior of the café. Absolute Coffee Stop is located in between Coffea
Coffee café and AmBank, which are crowded so they might contribute to the noise around Absolute
Project 1 Lighting and Acoustic Performance Evaluation and Design
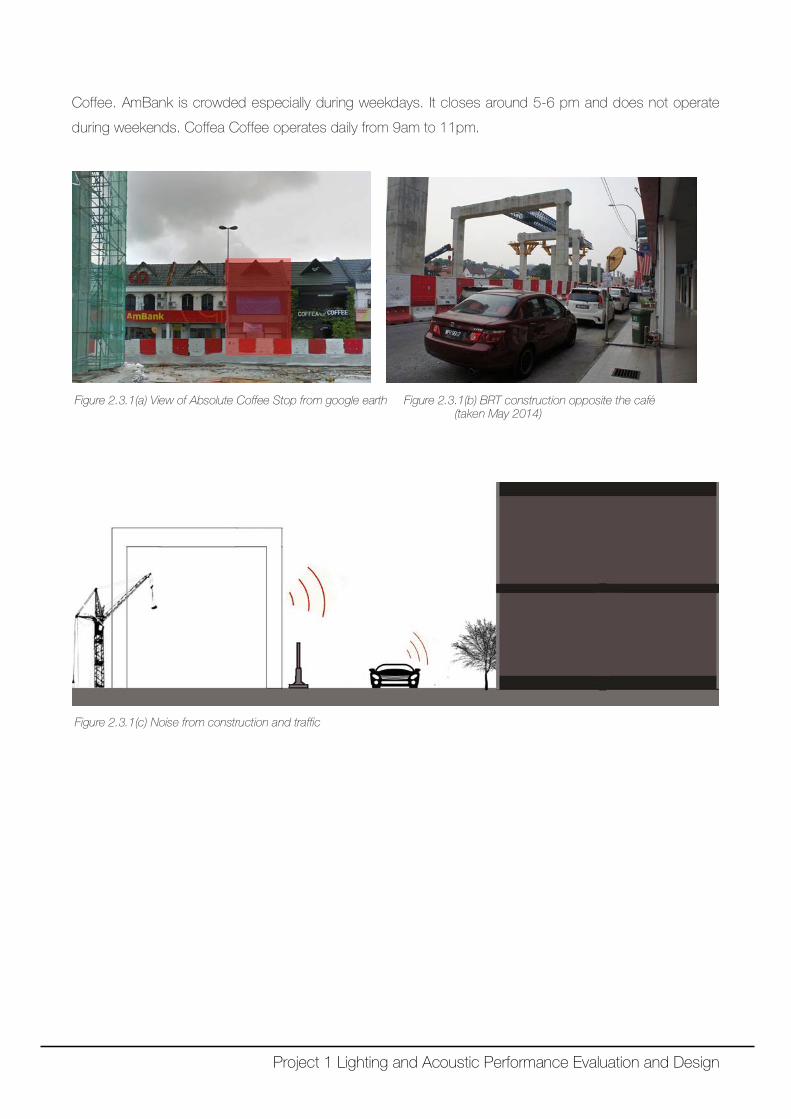
Coffee. AmBank is crowded especially during weekdays. It closes around 5-6 pm and does not operate
during weekends. Coffea Coffee operates daily from 9am to 11pm.
Figure 2.3.1(a) View of Absolute Coffee Stop from google earth Figure 2.3.1(b) BRT construction opposite the café (taken May 2014)
Figure 2.3.1(c) Noise from construction and traffic
Project 1 Lighting and Acoustic Performance Evaluation and Design
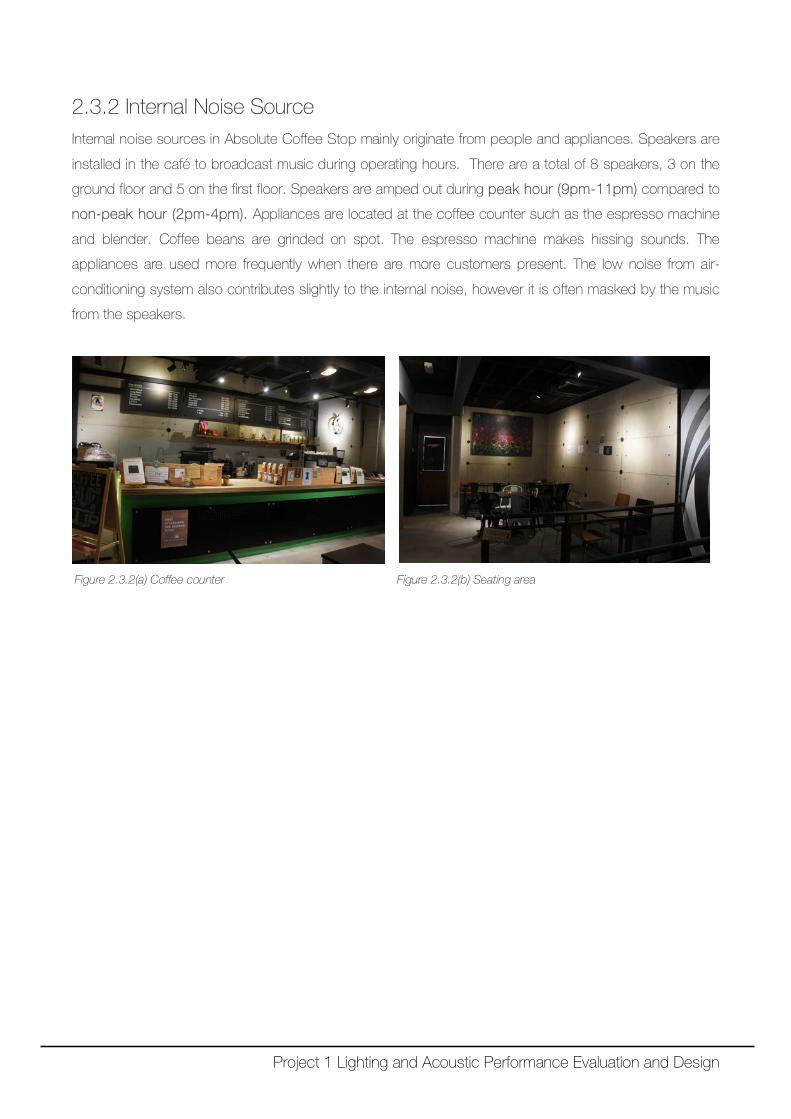
2.3.2 Internal Noise Source Internal noise sources in Absolute Coffee Stop mainly originate from people and appliances. Speakers are
installed in the café to broadcast music during operating hours. There are a total of 8 speakers, 3 on the
ground floor and 5 on the first floor. Speakers are amped out during peak hour (9pm-11pm) compared to
non-peak hour (2pm-4pm). Appliances are located at the coffee counter such as the espresso machine
and blender. Coffee beans are grinded on spot. The espresso machine makes hissing sounds. The
appliances are used more frequently when there are more customers present. The low noise from air-
conditioning system also contributes slightly to the internal noise, however it is often masked by the music
from the speakers.
Figure 2.3.2(a) Coffee counter Figure 2.3.2(b) Seating area
Project 1 Lighting and Acoustic Performance Evaluation and Design
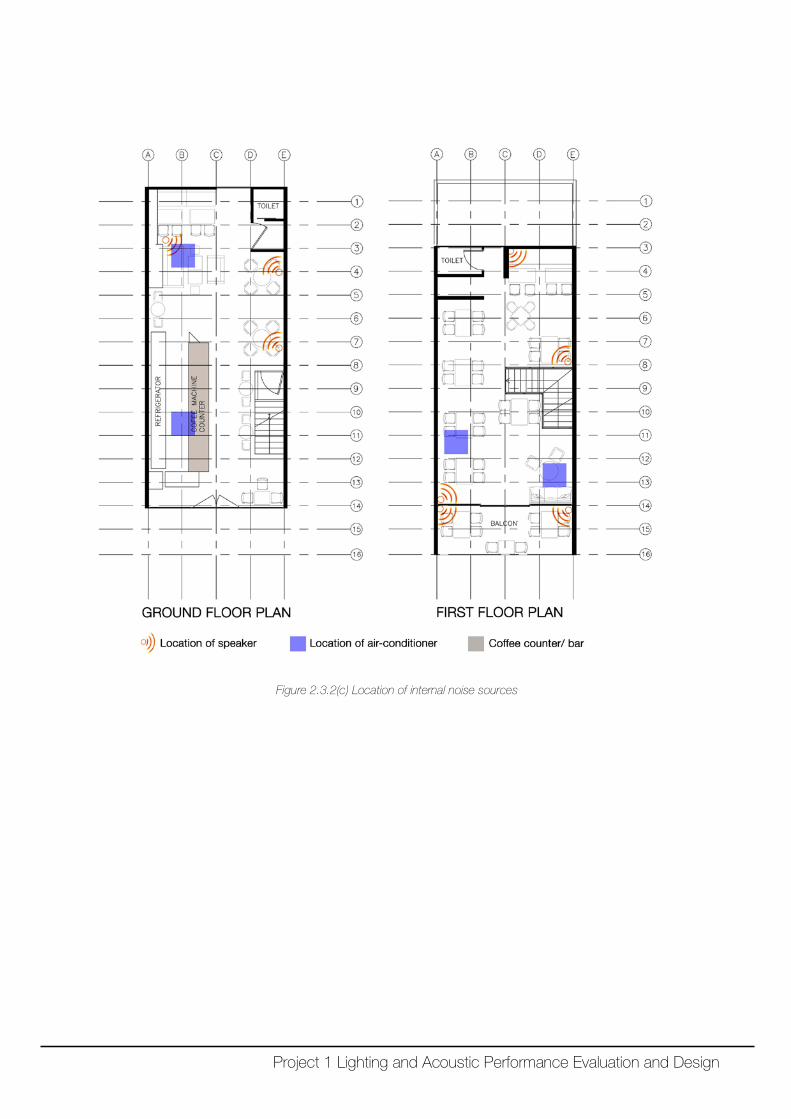
Figure 2.3.2(c) Location of internal noise sources
Project 1 Lighting and Acoustic Performance Evaluation and Design
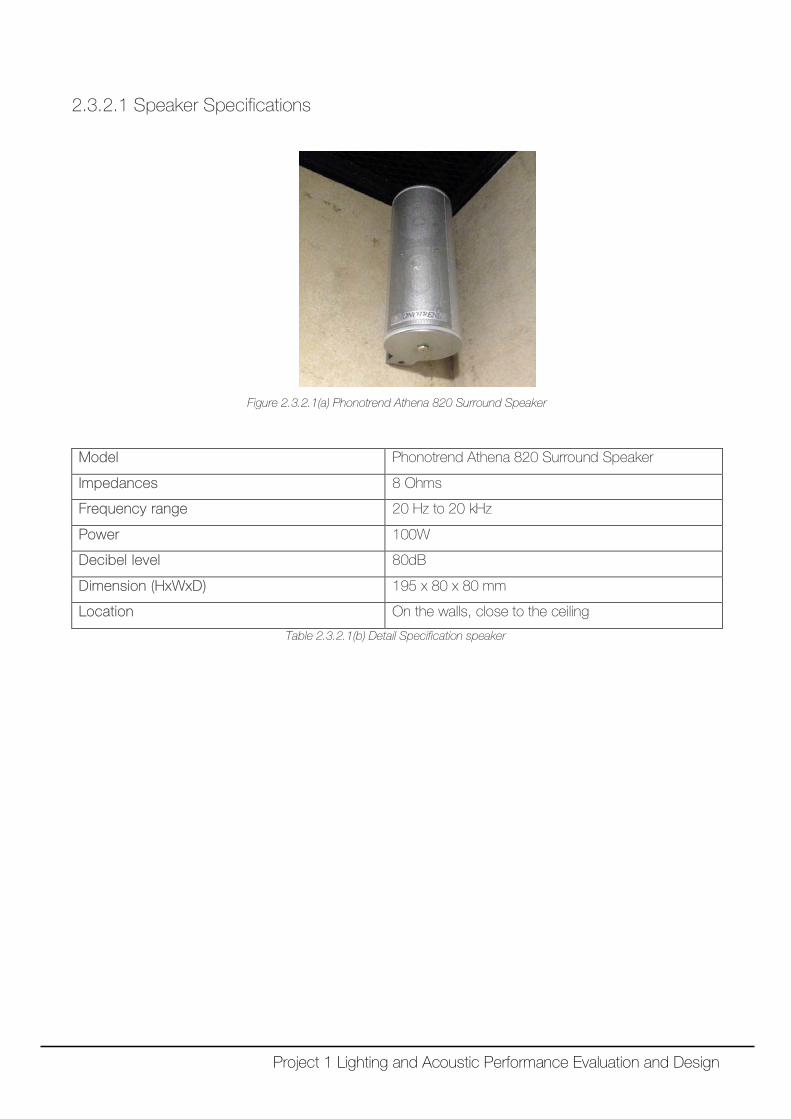
2.3.2.1 Speaker Specifications
Figure 2.3.2.1(a) Phonotrend Athena 820 Surround Speaker
Model Phonotrend Athena 820 Surround Speaker
Impedances 8 Ohms
Frequency range 20 Hz to 20 kHz
Power 100W
Decibel level 80dB
Dimension (HxWxD) 195 x 80 x 80 mm
Location On the walls, close to the ceiling
Table 2.3.2.1(b) Detail Specification speaker
Project 1 Lighting and Acoustic Performance Evaluation and Design
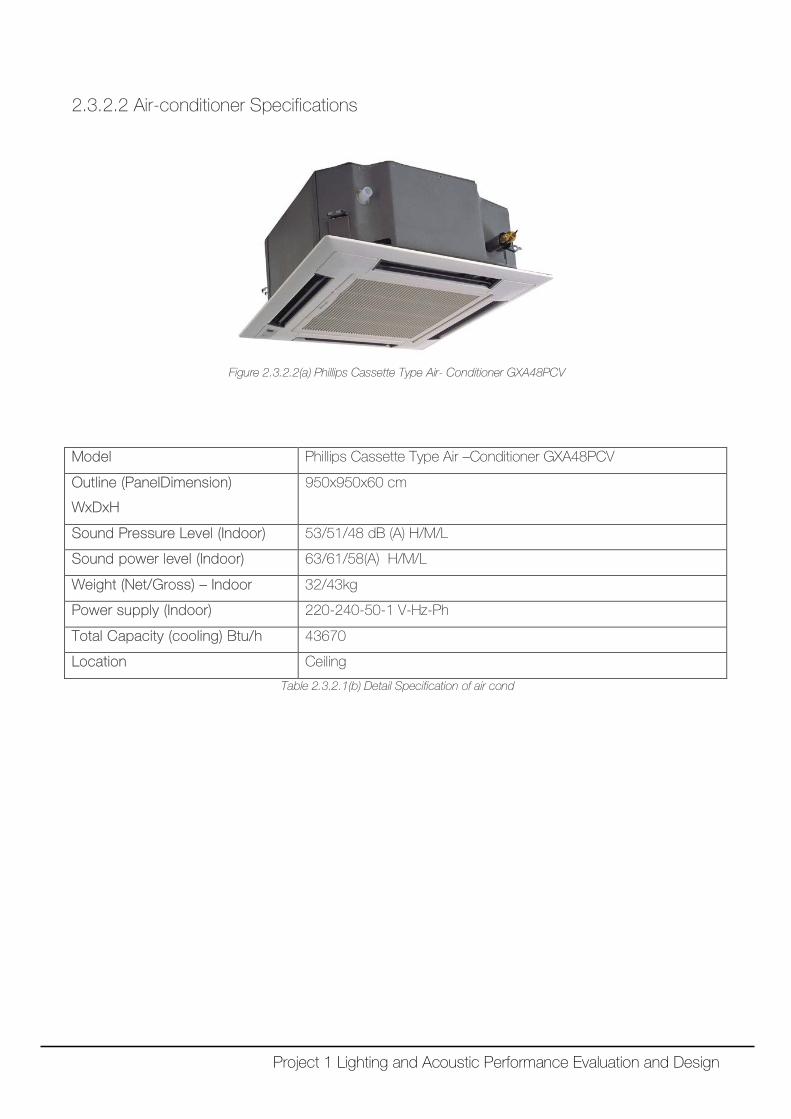
2.3.2.2 Air-conditioner Specifications
Figure 2.3.2.2(a) Phillips Cassette Type Air- Conditioner GXA48PCV
Model Phillips Cassette Type Air –Conditioner GXA48PCV
Outline (PanelDimension)
WxDxH
950x950x60 cm
Sound Pressure Level (Indoor) 53/51/48 dB (A) H/M/L
Sound power level (Indoor) 63/61/58(A) H/M/L
Weight (Net/Gross) – Indoor 32/43kg
Power supply (Indoor) 220-240-50-1 V-Hz-Ph
Total Capacity (cooling) Btu/h 43670
Location Ceiling
Table 2.3.2.1(b) Detail Specification of air cond
Project 1 Lighting and Acoustic Performance Evaluation and Design
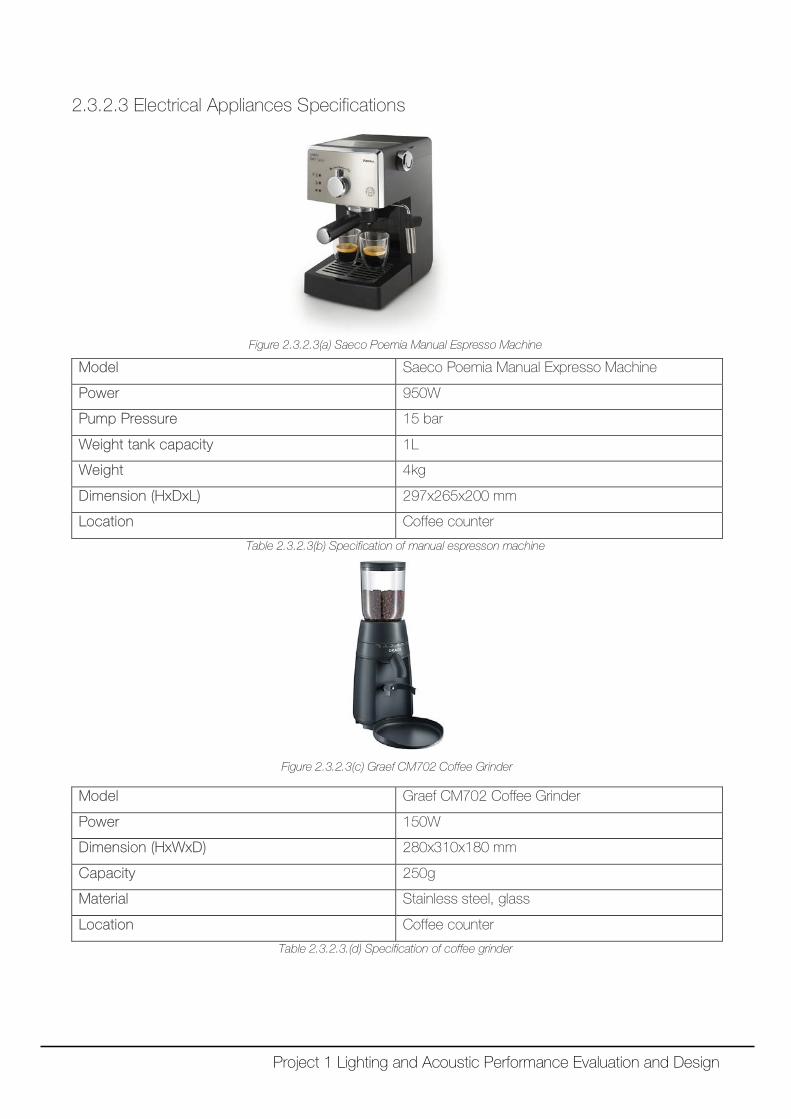
2.3.2.3 Electrical Appliances Specifications
Figure 2.3.2.3(a) Saeco Poemia Manual Espresso Machine
Model Saeco Poemia Manual Expresso Machine
Power 950W
Pump Pressure 15 bar
Weight tank capacity 1L
Weight 4kg
Dimension (HxDxL) 297x265x200 mm
Location Coffee counter
Table 2.3.2.3(b) Specification of manual espresson machine
Figure 2.3.2.3(c) Graef CM702 Coffee Grinder
Model Graef CM702 Coffee Grinder
Power 150W
Dimension (HxWxD) 280x310x180 mm
Capacity 250g
Material Stainless steel, glass
Location Coffee counter
Table 2.3.2.3.(d) Specification of coffee grinder
Project 1 Lighting and Acoustic Performance Evaluation and Design
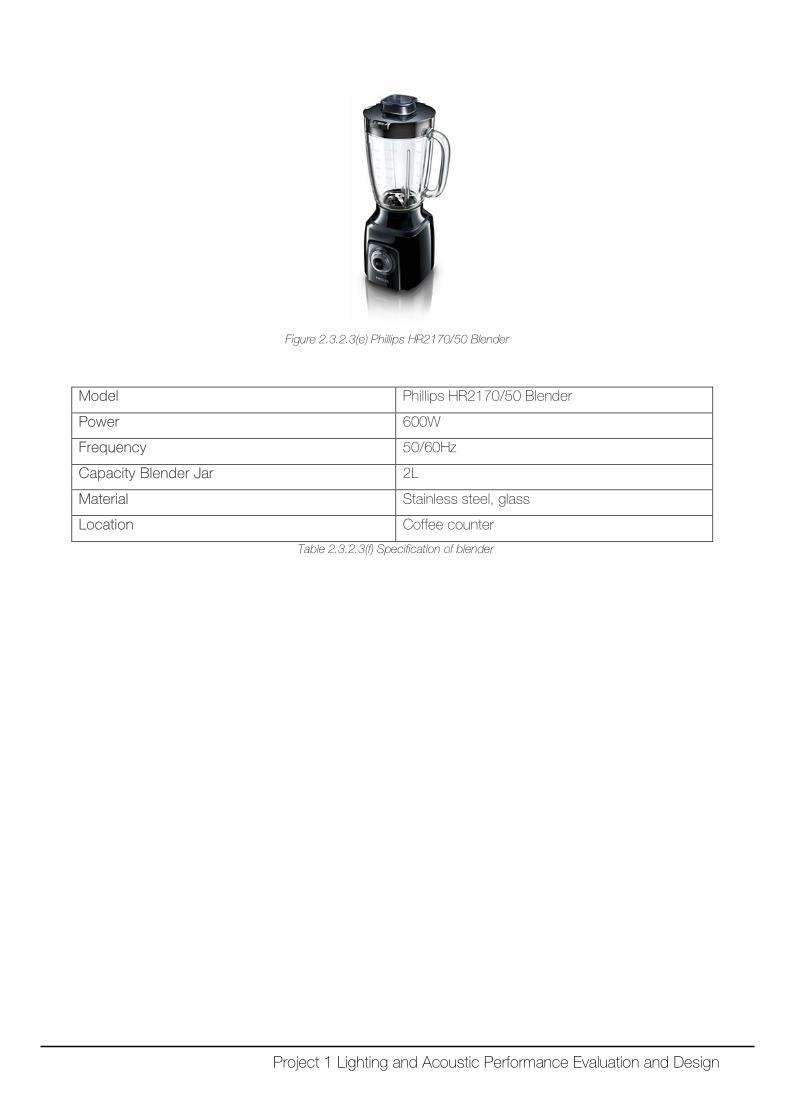
Figure 2.3.2.3(e) Phillips HR2170/50 Blender
Model Phillips HR2170/50 Blender
Power 600W
Frequency 50/60Hz
Capacity Blender Jar 2L
Material Stainless steel, glass
Location Coffee counter
Table 2.3.2.3(f) Specification of blender
Project 1 Lighting and Acoustic Performance Evaluation and Design
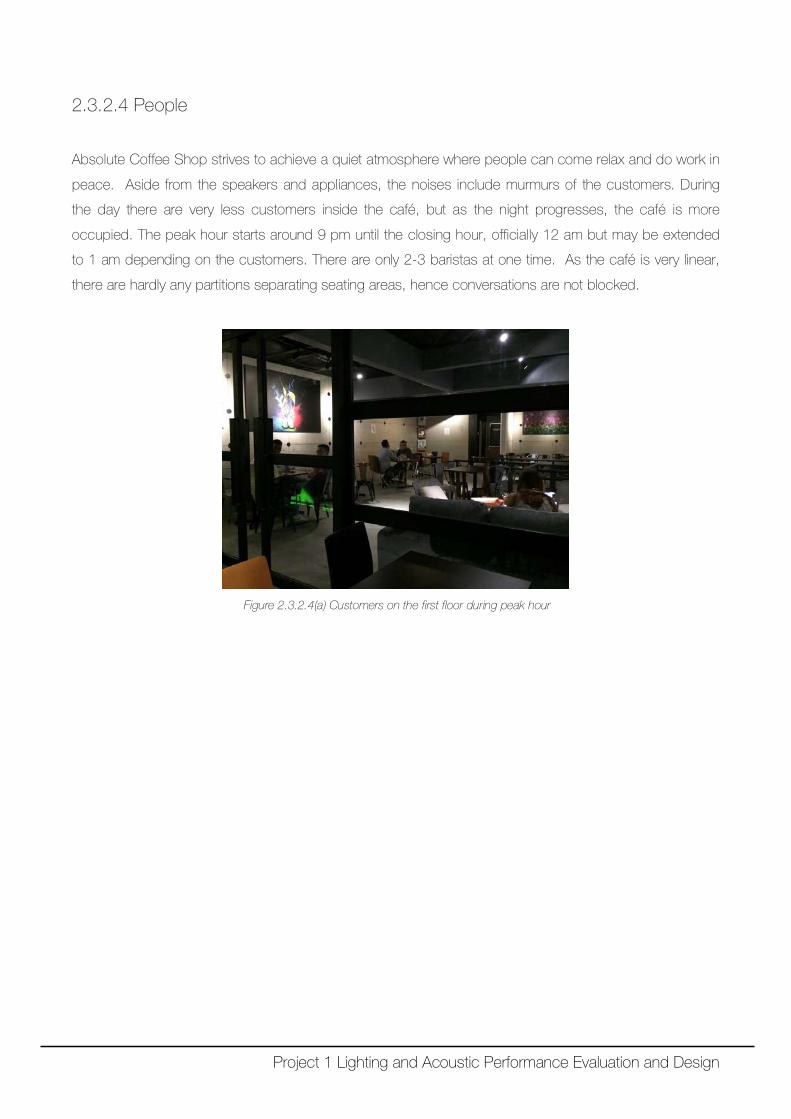
2.3.2.4 People
Absolute Coffee Shop strives to achieve a quiet atmosphere where people can come relax and do work in
peace. Aside from the speakers and appliances, the noises include murmurs of the customers. During
the day there are very less customers inside the café, but as the night progresses, the café is more
occupied. The peak hour starts around 9 pm until the closing hour, officially 12 am but may be extended
to 1 am depending on the customers. There are only 2-3 baristas at one time. As the café is very linear,
there are hardly any partitions separating seating areas, hence conversations are not blocked.
Figure 2.3.2.4(a) Customers on the first floor during peak hour
Project 1 Lighting and Acoustic Performance Evaluation and Design
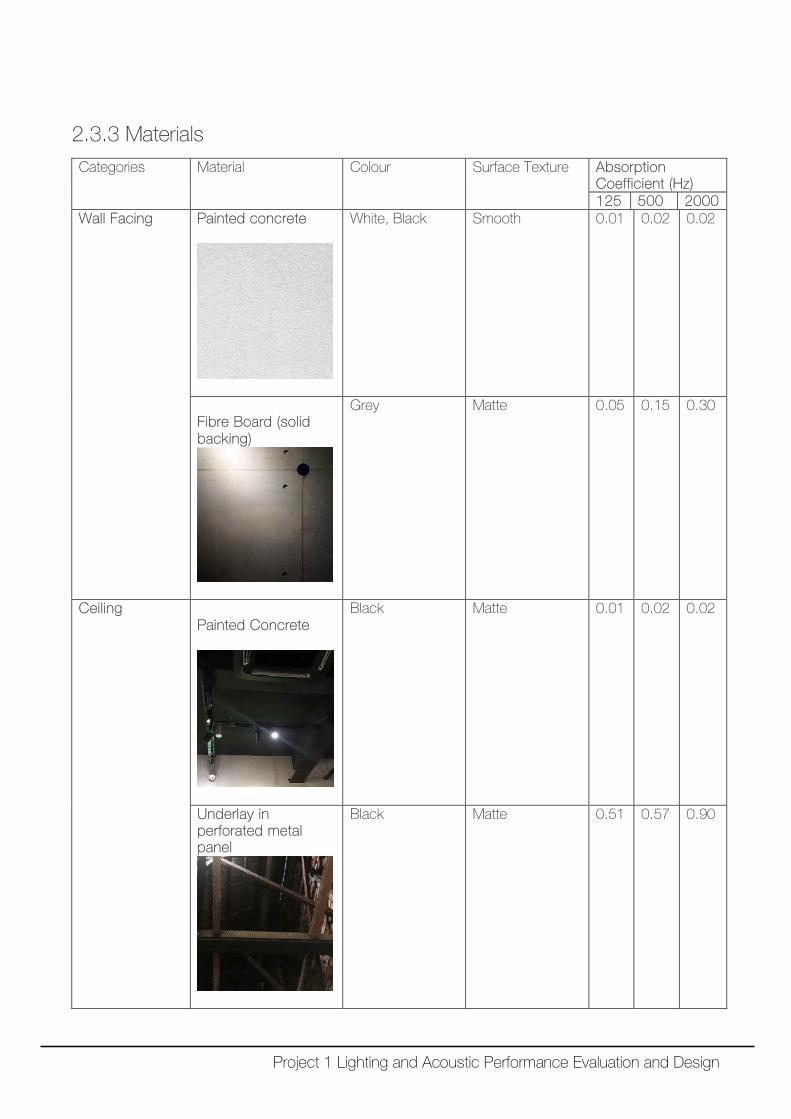
2.3.3 Materials
Categories Material Colour Surface Texture Absorption Coefficient (Hz) 125 500 2000
Wall Facing Painted concrete
White, Black Smooth 0.01 0.02 0.02
Fibre Board (solid backing)
Grey Matte 0.05 0.15 0.30
Ceiling Painted Concrete
Black Matte 0.01 0.02 0.02
Underlay in perforated metal panel
Black Matte 0.51 0.57 0.90
Project 1 Lighting and Acoustic Performance Evaluation and Design
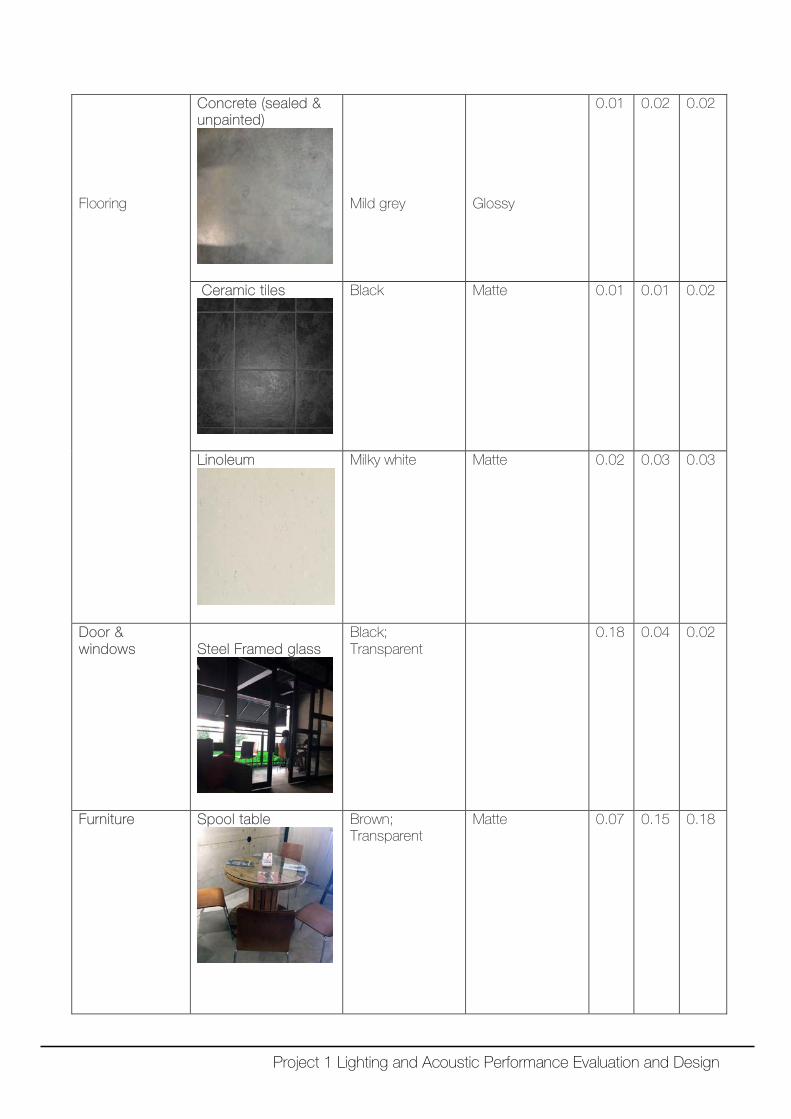
Flooring
Concrete (sealed & unpainted)
Mild grey
Glossy
0.01 0.02 0.02
Ceramic tiles
Black Matte 0.01 0.01 0.02
Linoleum
Milky white Matte 0.02 0.03 0.03
Door & windows
Steel Framed glass
Black; Transparent
0.18 0.04 0.02
Furniture Spool table
Brown; Transparent
Matte 0.07 0.15 0.18
Project 1 Lighting and Acoustic Performance Evaluation and Design
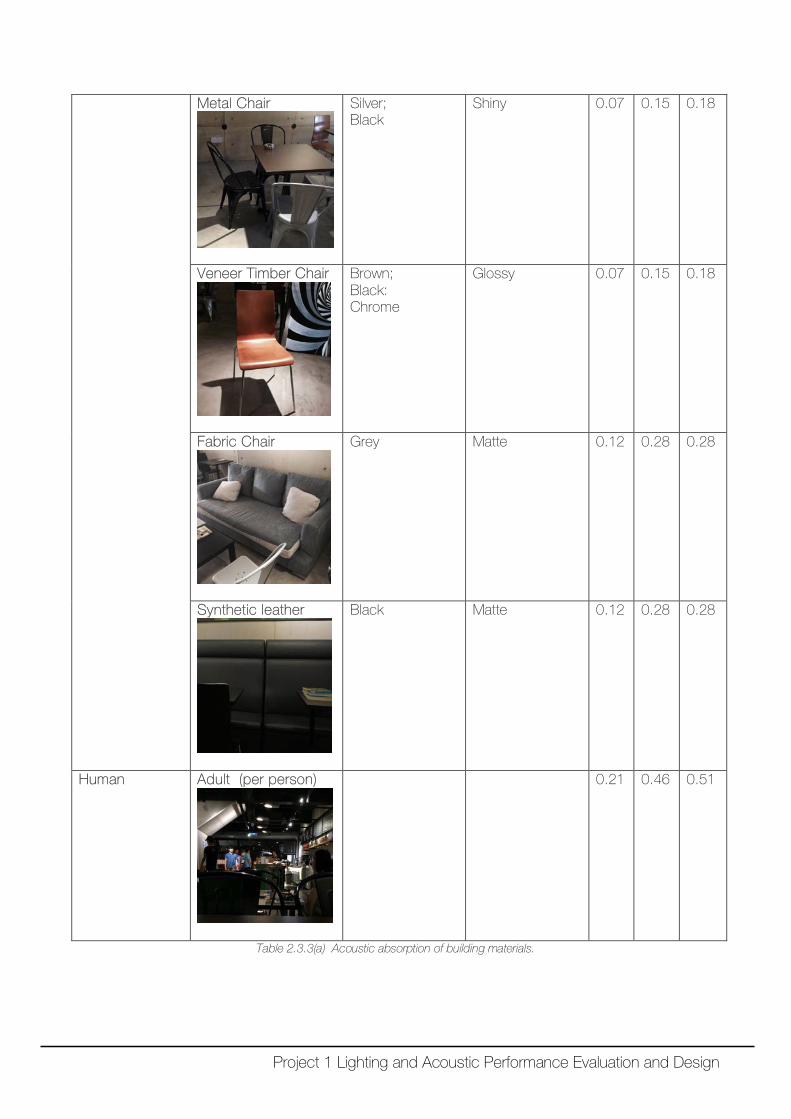
Metal Chair
Silver; Black
Shiny 0.07 0.15 0.18
Veneer Timber Chair
Brown; Black: Chrome
Glossy 0.07 0.15 0.18
Fabric Chair
Grey Matte 0.12 0.28 0.28
Synthetic leather
Black Matte 0.12 0.28 0.28
Human Adult (per person)
0.21 0.46 0.51
Table 2.3.3(a) Acoustic absorption of building materials.
Project 1 Lighting and Acoustic Performance Evaluation and Design
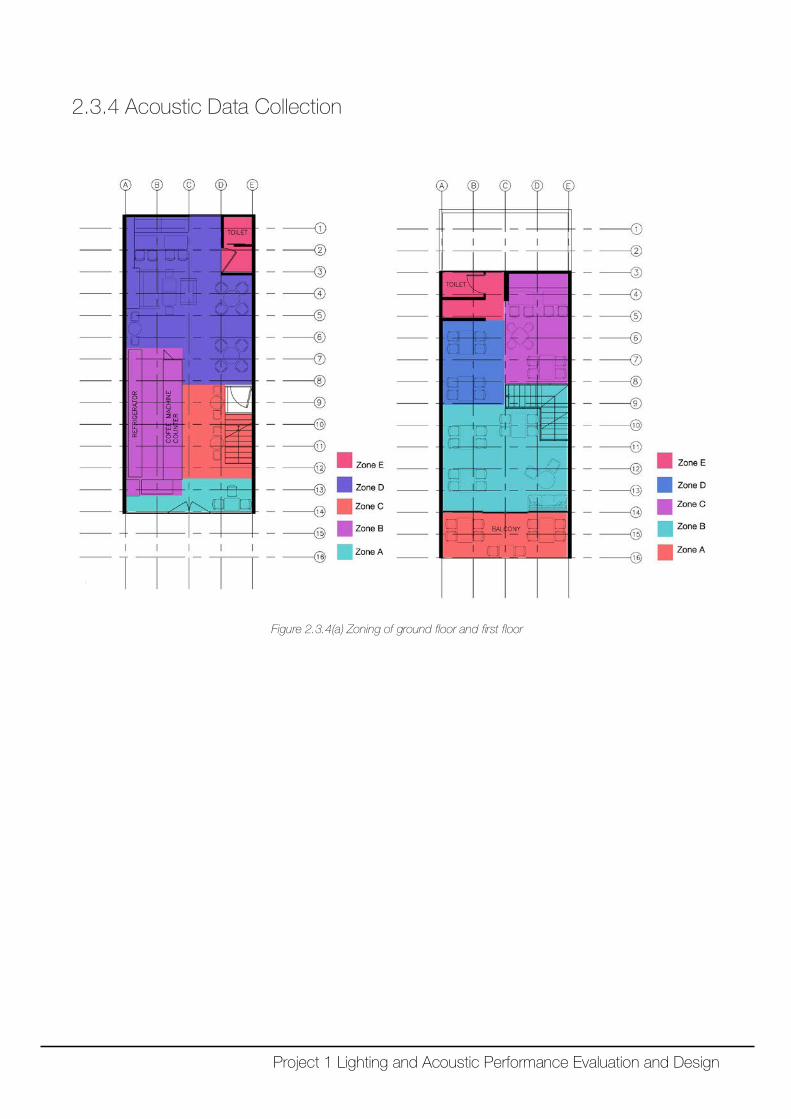
2.3.4 Acoustic Data Collection
Figure 2.3.4(a) Zoning of ground floor and first floor
Project 1 Lighting and Acoustic Performance Evaluation and Design
2.3.4.1 Acoustic readings (Non-peak hour)
o Ground Floor
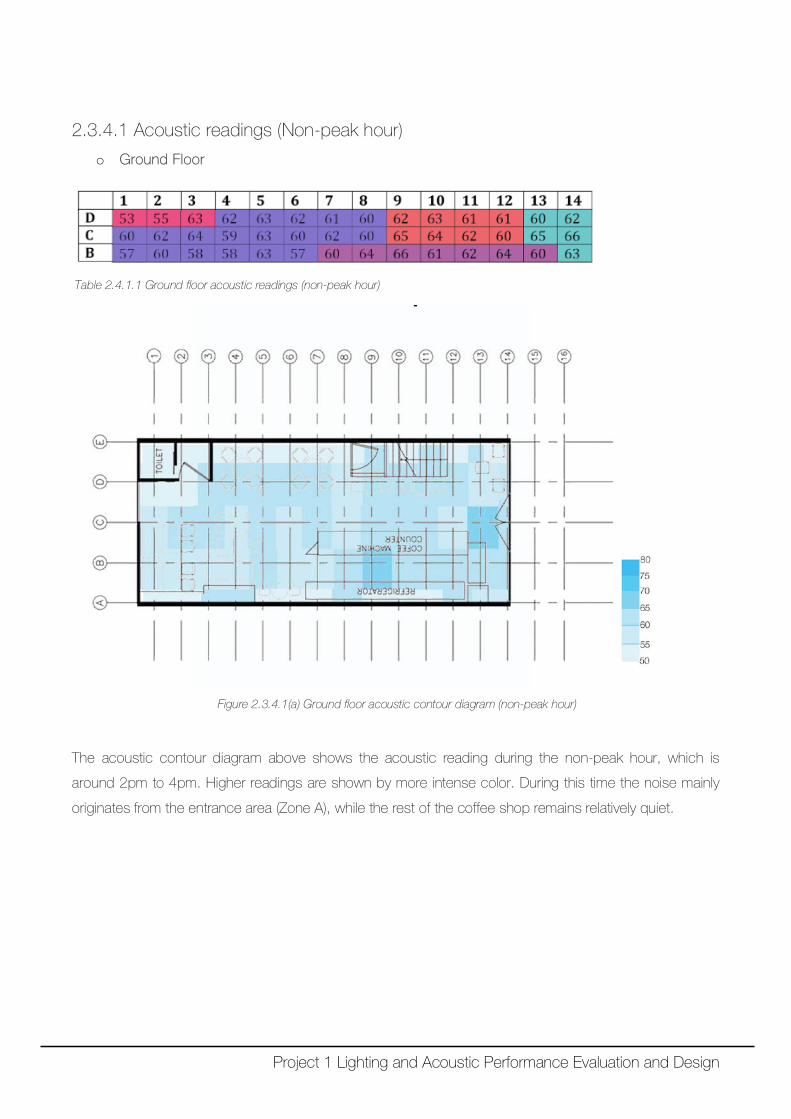
Table 2.4.1.1 Ground floor acoustic readings (non-peak hour)
Figure 2.3.4.1(a) Ground floor acoustic contour diagram (non-peak hour)
The acoustic contour diagram above shows the acoustic reading during the non-peak hour, which is
around 2pm to 4pm. Higher readings are shown by more intense color. During this time the noise mainly
originates from the entrance area (Zone A), while the rest of the coffee shop remains relatively quiet.
Project 1 Lighting and Acoustic Performance Evaluation and Design
o First Floor
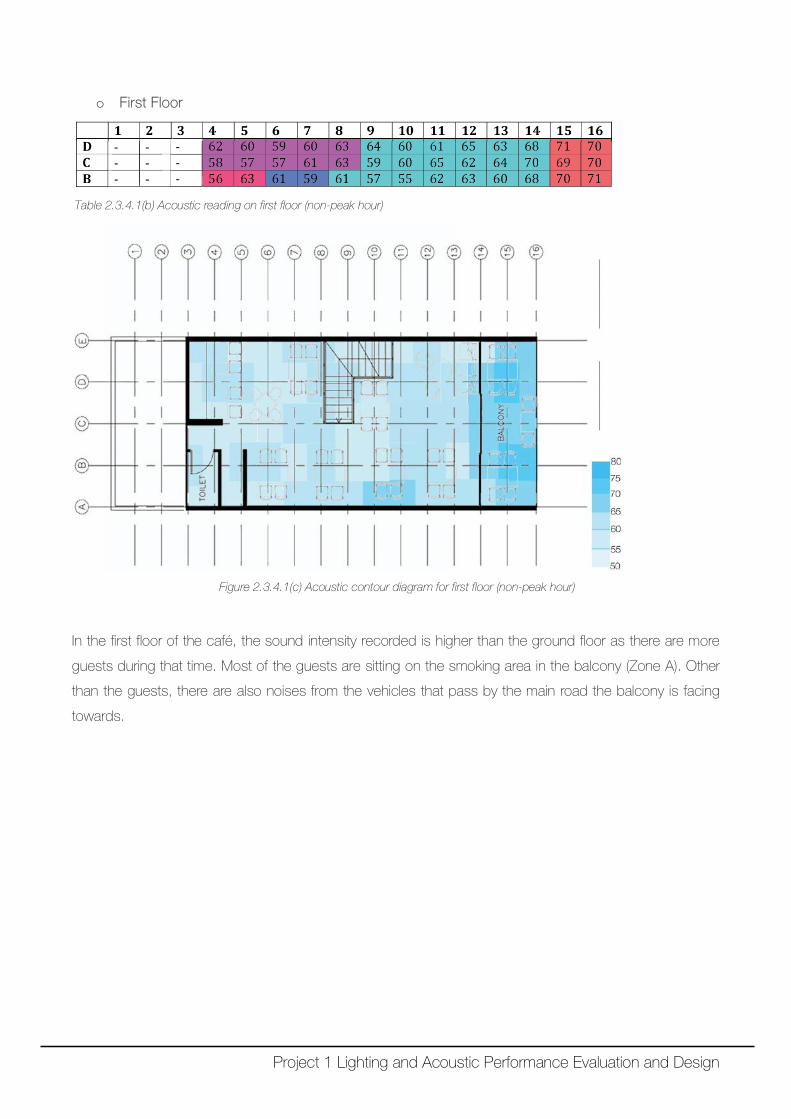
Table 2.3.4.1(b) Acoustic reading on first floor (non-peak hour)
Figure 2.3.4.1(c) Acoustic contour diagram for first floor (non-peak hour)
In the first floor of the café, the sound intensity recorded is higher than the ground floor as there are more
guests during that time. Most of the guests are sitting on the smoking area in the balcony (Zone A). Other
than the guests, there are also noises from the vehicles that pass by the main road the balcony is facing
towards.
Project 1 Lighting and Acoustic Performance Evaluation and Design
2.3.4.2 Acoustic readings (peak hour)
o Ground Floor
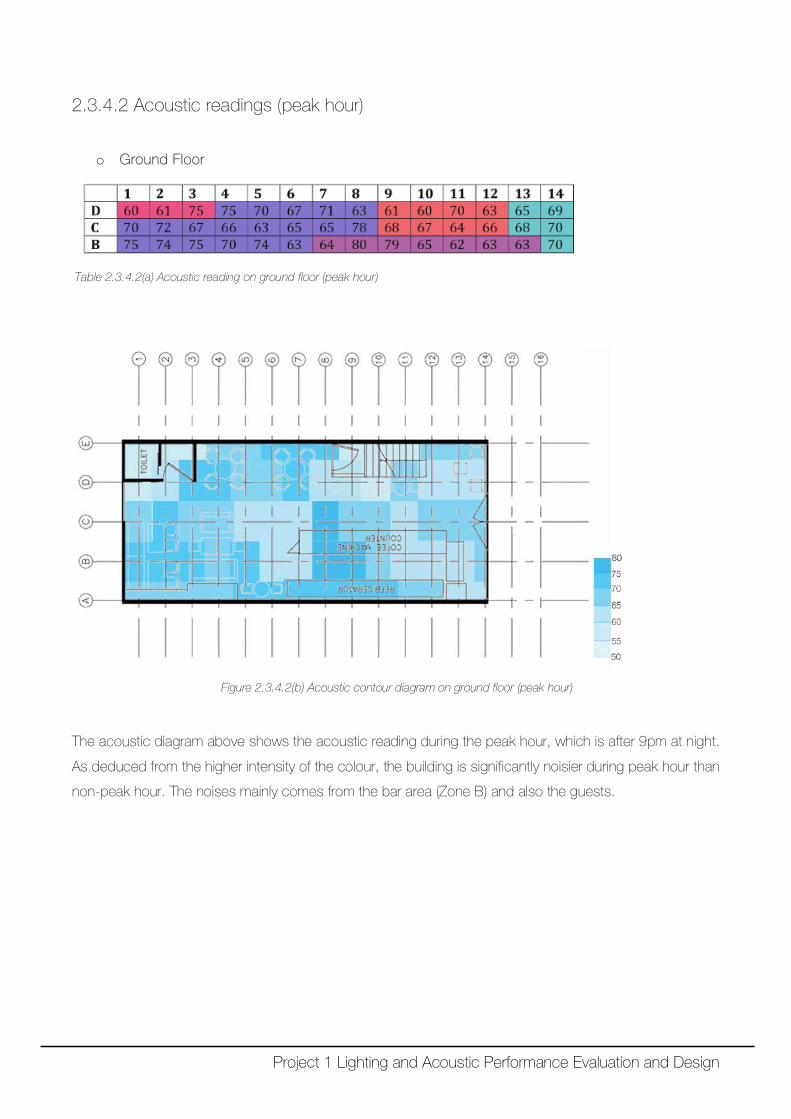
Table 2.3.4.2(a) Acoustic reading on ground floor (peak hour)
Figure 2.3.4.2(b) Acoustic contour diagram on ground floor (peak hour)
The acoustic diagram above shows the acoustic reading during the peak hour, which is after 9pm at night.
As deduced from the higher intensity of the colour, the building is significantly noisier during peak hour than
non-peak hour. The noises mainly comes from the bar area (Zone B) and also the guests.
Project 1 Lighting and Acoustic Performance Evaluation and Design
o First Floor
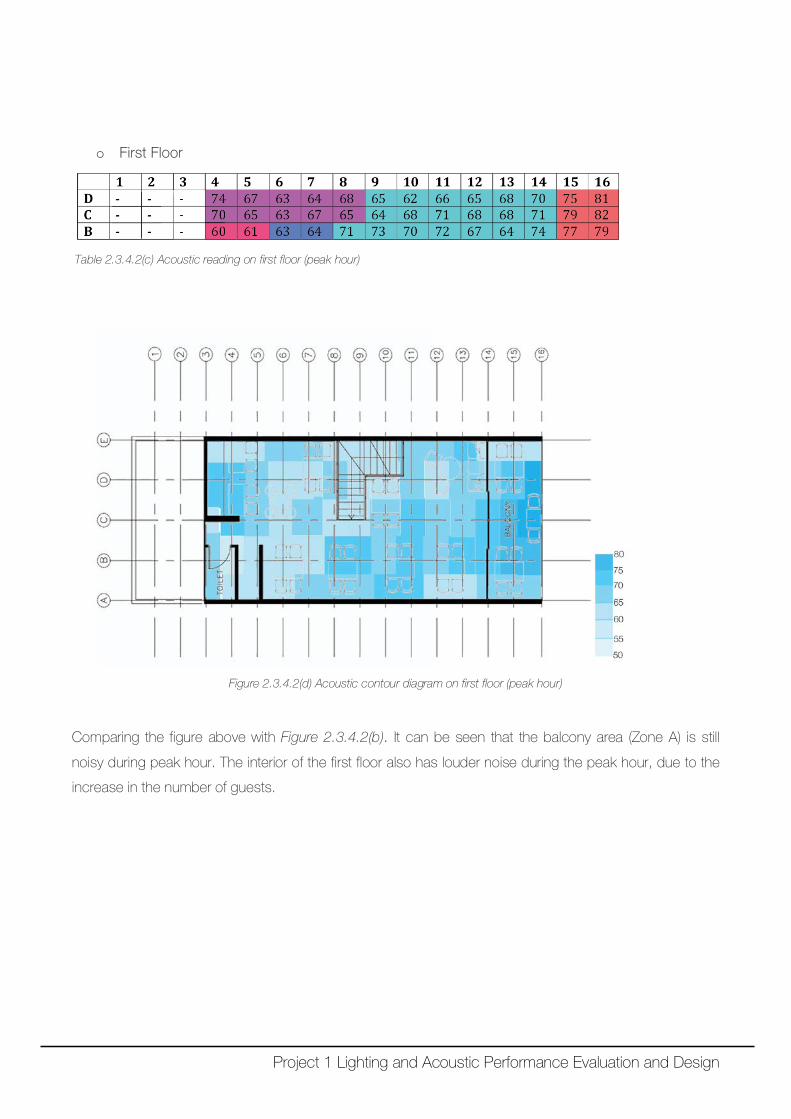
Table 2.3.4.2(c) Acoustic reading on first floor (peak hour)
Figure 2.3.4.2(d) Acoustic contour diagram on first floor (peak hour)
Comparing the figure above with Figure 2.3.4.2(b). It can be seen that the balcony area (Zone A) is still
noisy during peak hour. The interior of the first floor also has louder noise during the peak hour, due to the
increase in the number of guests.
Project 1 Lighting and Acoustic Performance Evaluation and Design
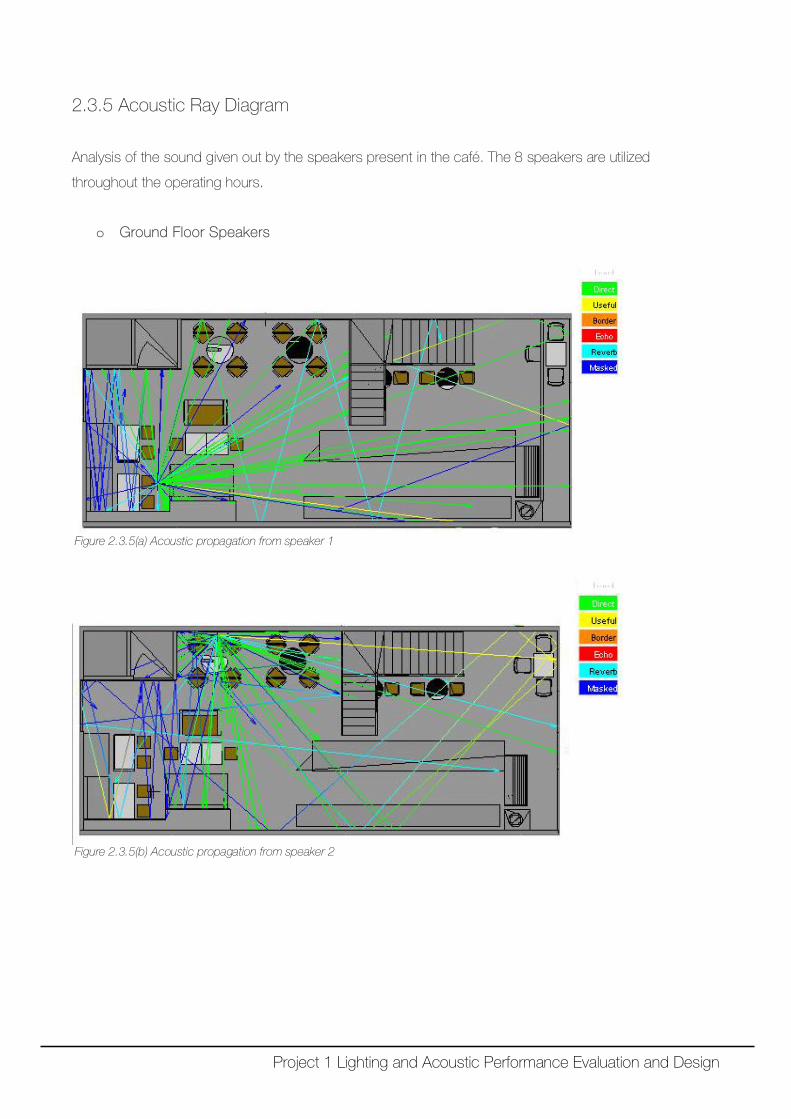
2.3.5 Acoustic Ray Diagram Analysis of the sound given out by the speakers present in the café. The 8 speakers are utilized
throughout the operating hours.
o Ground Floor Speakers
Figure 2.3.5(a) Acoustic propagation from speaker 1
Figure 2.3.5(b) Acoustic propagation from speaker 2
Project 1 Lighting and Acoustic Performance Evaluation and Design
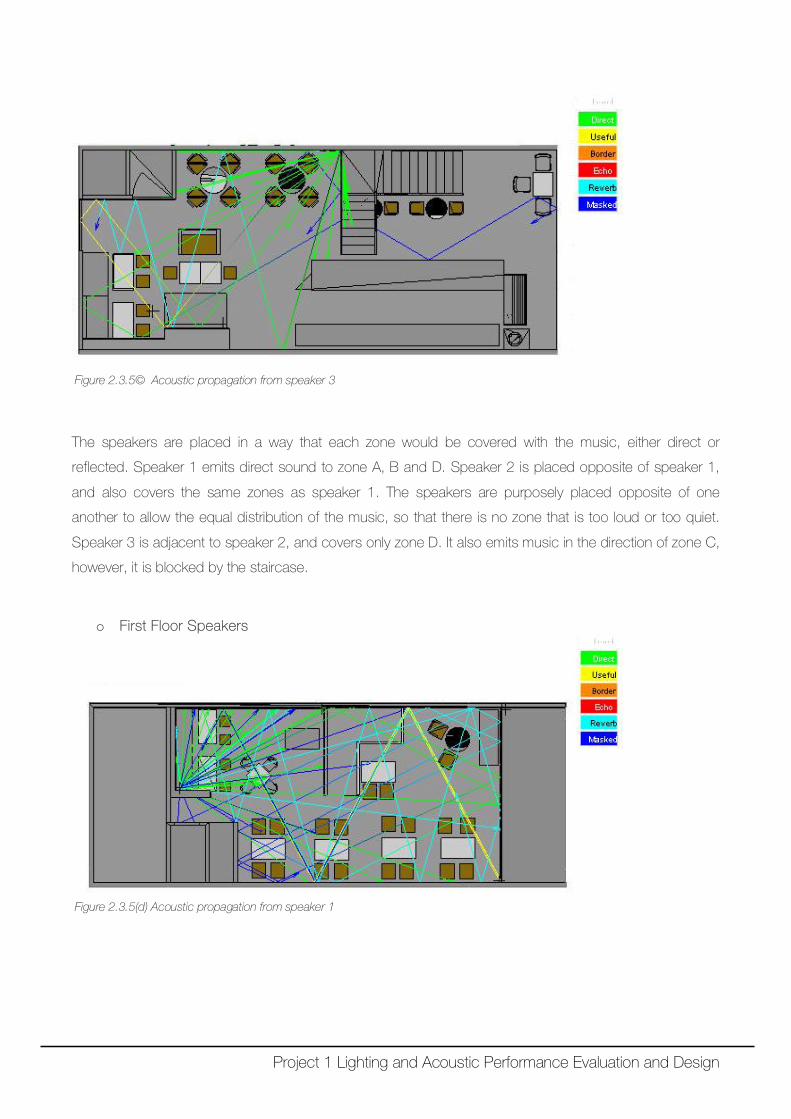
Figure 2.3.5© Acoustic propagation from speaker 3
The speakers are placed in a way that each zone would be covered with the music, either direct or
reflected. Speaker 1 emits direct sound to zone A, B and D. Speaker 2 is placed opposite of speaker 1,
and also covers the same zones as speaker 1. The speakers are purposely placed opposite of one
another to allow the equal distribution of the music, so that there is no zone that is too loud or too quiet.
Speaker 3 is adjacent to speaker 2, and covers only zone D. It also emits music in the direction of zone C,
however, it is blocked by the staircase.
o First Floor Speakers
Figure 2.3.5(d) Acoustic propagation from speaker 1
Project 1 Lighting and Acoustic Performance Evaluation and Design
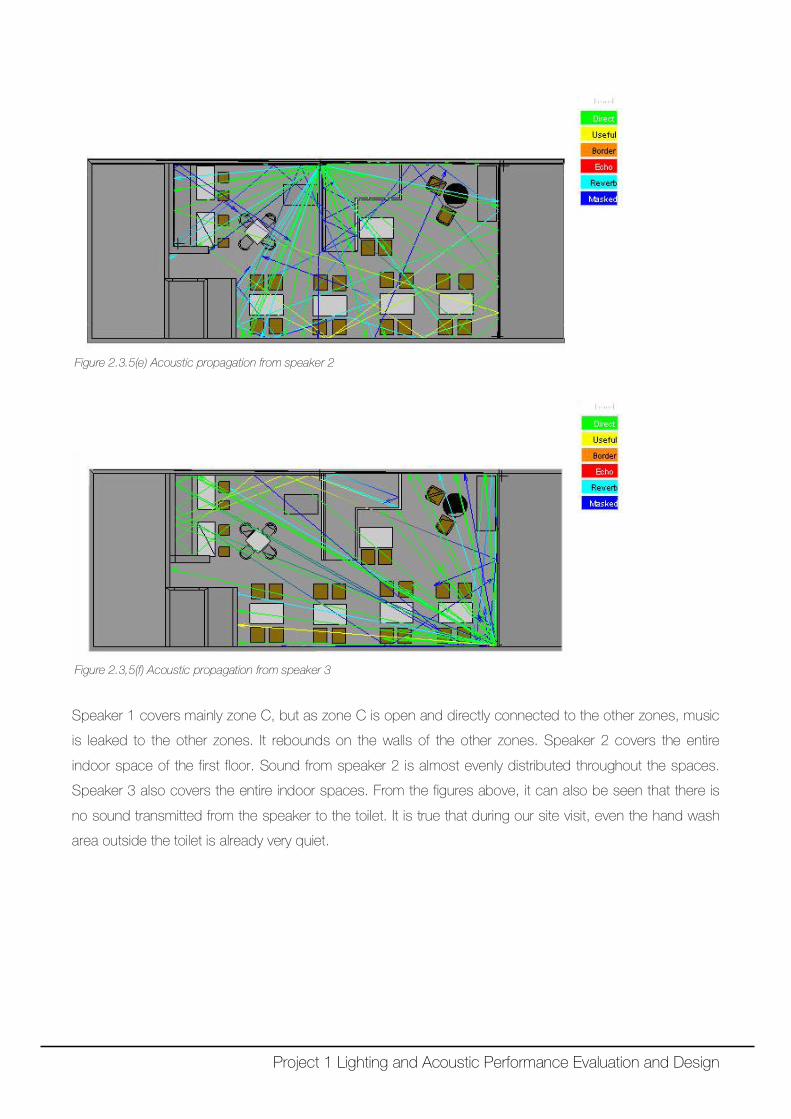
Figure 2.3.5(e) Acoustic propagation from speaker 2
Figure 2.3,5(f) Acoustic propagation from speaker 3
Speaker 1 covers mainly zone C, but as zone C is open and directly connected to the other zones, music
is leaked to the other zones. It rebounds on the walls of the other zones. Speaker 2 covers the entire
indoor space of the first floor. Sound from speaker 2 is almost evenly distributed throughout the spaces.
Speaker 3 also covers the entire indoor spaces. From the figures above, it can also be seen that there is
no sound transmitted from the speaker to the toilet. It is true that during our site visit, even the hand wash
area outside the toilet is already very quiet.
Project 1 Lighting and Acoustic Performance Evaluation and Design
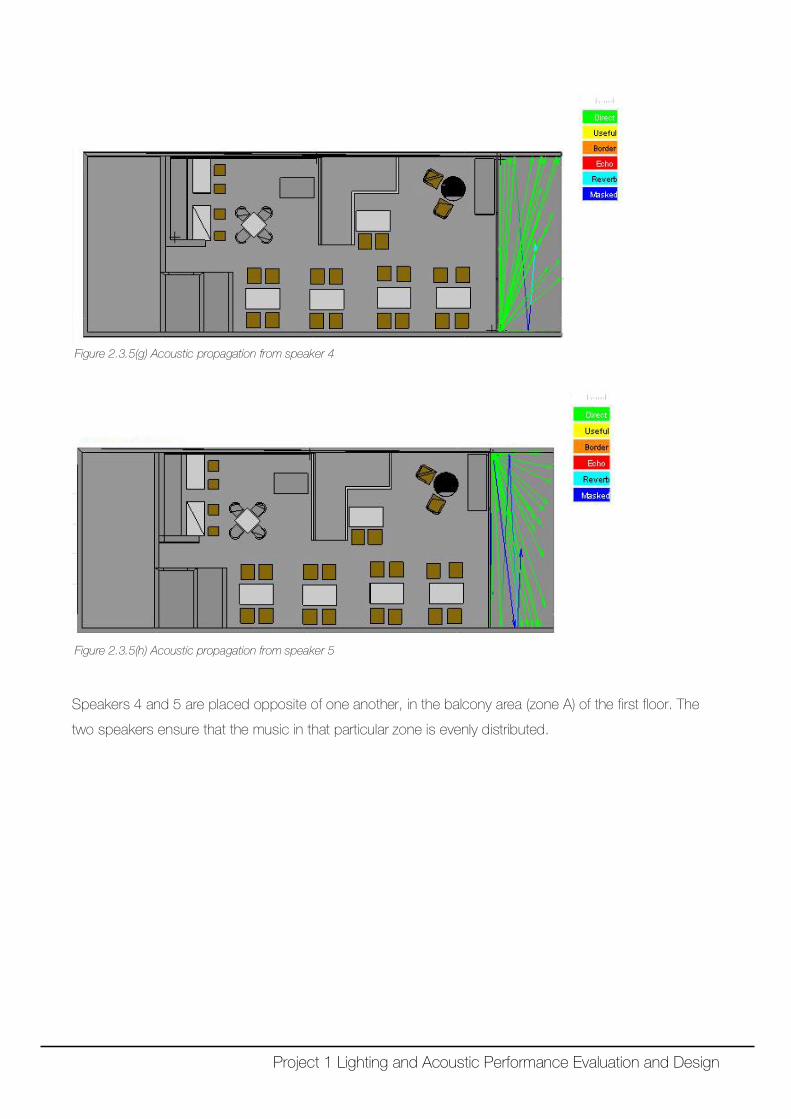
Figure 2.3.5(g) Acoustic propagation from speaker 4
Figure 2.3.5(h) Acoustic propagation from speaker 5
Speakers 4 and 5 are placed opposite of one another, in the balcony area (zone A) of the first floor. The
two speakers ensure that the music in that particular zone is evenly distributed.
Project 1 Lighting and Acoustic Performance Evaluation and Design
2.3.6 Acoustic Calculation
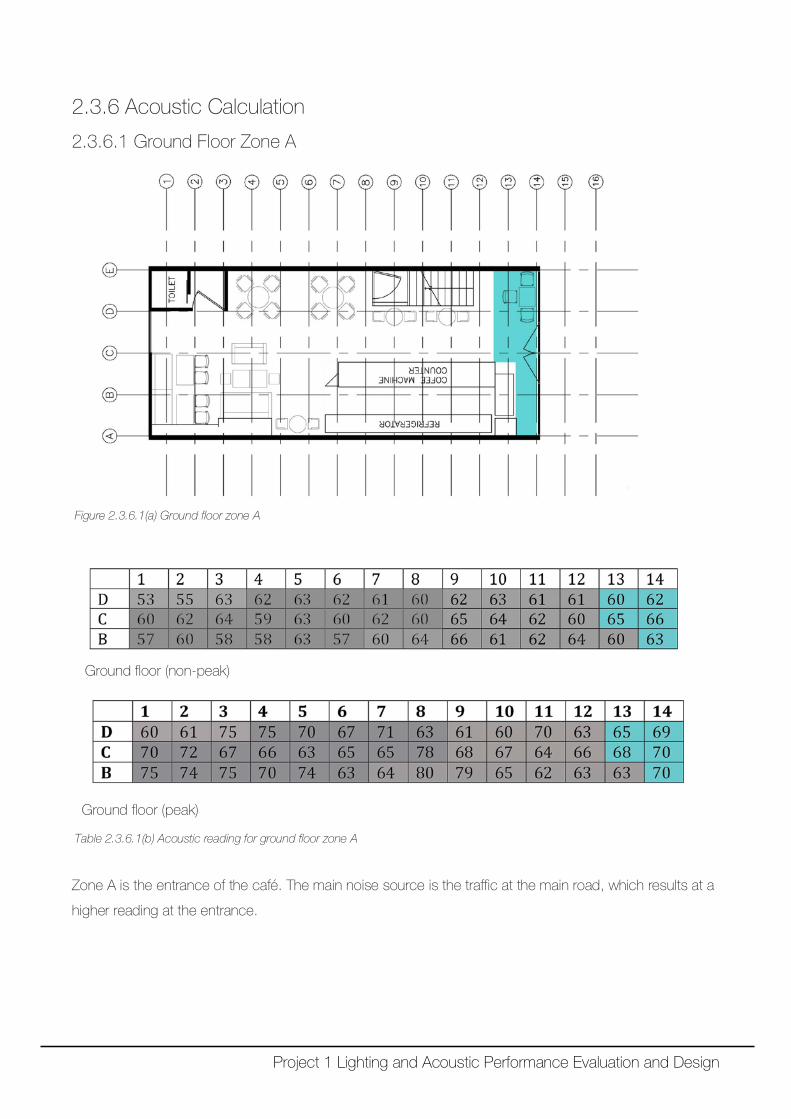
2.3.6.1 Ground Floor Zone A
Figure 2.3.6.1(a) Ground floor zone A
Ground floor (non-peak)
Ground floor (peak)
Table 2.3.6.1(b) Acoustic reading for ground floor zone A
Zone A is the entrance of the café. The main noise source is the traffic at the main road, which results at a
higher reading at the entrance.
Project 1 Lighting and Acoustic Performance Evaluation and Design
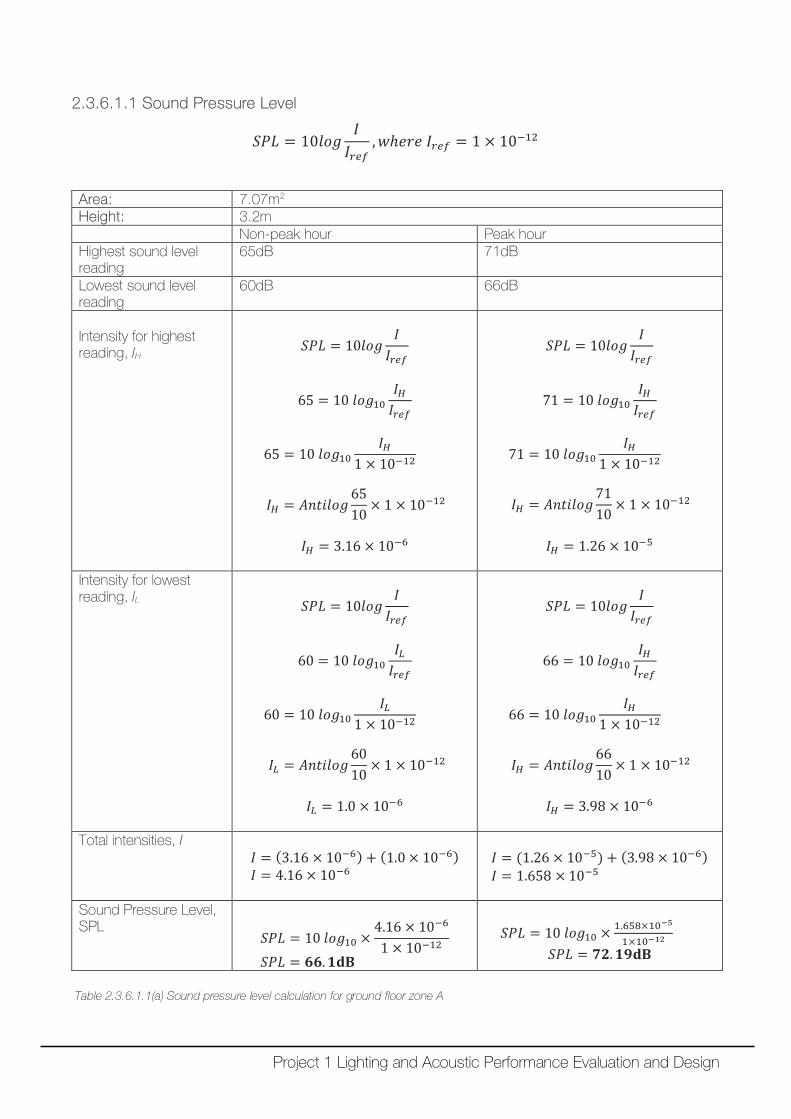
2.3.6.1.1 Sound Pressure Level
𝑆𝑆𝑆𝑆𝑆𝑆 = 10𝑉𝑉𝑉𝑉𝑙𝑙𝐼𝐼𝐼𝐼𝑟𝑟𝑟𝑟𝑟𝑟
,𝑤𝑤ℎ𝑒𝑒𝑒𝑒𝑒𝑒 𝐼𝐼𝑟𝑟𝑟𝑟𝑟𝑟 = 1 × 10⁻¹²
Area: 7.07m2 Height: 3.2m Non-peak hour Peak hour Highest sound level reading
65dB 71dB
Lowest sound level reading
60dB 66dB
Intensity for highest reading, IH
𝑆𝑆𝑆𝑆𝑆𝑆 = 10𝑉𝑉𝑉𝑉𝑙𝑙𝐼𝐼𝐼𝐼𝑟𝑟𝑟𝑟𝑟𝑟
65 = 10 𝑉𝑉𝑉𝑉𝑙𝑙10𝐼𝐼𝐻𝐻𝐼𝐼𝑟𝑟𝑟𝑟𝑟𝑟
65 = 10 𝑉𝑉𝑉𝑉𝑙𝑙10𝐼𝐼𝐻𝐻
1 × 10⁻¹²
𝐼𝐼𝐻𝐻 = 𝐴𝐴𝐴𝐴𝐴𝐴𝐴𝐴𝑉𝑉𝑉𝑉𝑙𝑙6510
× 1 × 10−12
𝐼𝐼𝐻𝐻 = 3.16 × 10⁻⁶
𝑆𝑆𝑆𝑆𝑆𝑆 = 10𝑉𝑉𝑉𝑉𝑙𝑙𝐼𝐼𝐼𝐼𝑟𝑟𝑟𝑟𝑟𝑟
71 = 10 𝑉𝑉𝑉𝑉𝑙𝑙10𝐼𝐼𝐻𝐻𝐼𝐼𝑟𝑟𝑟𝑟𝑟𝑟
71 = 10 𝑉𝑉𝑉𝑉𝑙𝑙10𝐼𝐼𝐻𝐻
1 × 10⁻¹²
𝐼𝐼𝐻𝐻 = 𝐴𝐴𝐴𝐴𝐴𝐴𝐴𝐴𝑉𝑉𝑉𝑉𝑙𝑙7110
× 1 × 10−12
𝐼𝐼𝐻𝐻 = 1.26 × 10⁻⁵
Intensity for lowest reading, IL
𝑆𝑆𝑆𝑆𝑆𝑆 = 10𝑉𝑉𝑉𝑉𝑙𝑙𝐼𝐼𝐼𝐼𝑟𝑟𝑟𝑟𝑟𝑟
60 = 10 𝑉𝑉𝑉𝑉𝑙𝑙10𝐼𝐼𝐿𝐿𝐼𝐼𝑟𝑟𝑟𝑟𝑟𝑟
60 = 10 𝑉𝑉𝑉𝑉𝑙𝑙10𝐼𝐼𝐿𝐿
1 × 10⁻¹²
𝐼𝐼𝐿𝐿 = 𝐴𝐴𝐴𝐴𝐴𝐴𝐴𝐴𝑉𝑉𝑉𝑉𝑙𝑙6010
× 1 × 10−12
𝐼𝐼𝐿𝐿 = 1.0 × 10⁻⁶
𝑆𝑆𝑆𝑆𝑆𝑆 = 10𝑉𝑉𝑉𝑉𝑙𝑙𝐼𝐼𝐼𝐼𝑟𝑟𝑟𝑟𝑟𝑟
66 = 10 𝑉𝑉𝑉𝑉𝑙𝑙10𝐼𝐼𝐻𝐻𝐼𝐼𝑟𝑟𝑟𝑟𝑟𝑟
66 = 10 𝑉𝑉𝑉𝑉𝑙𝑙10𝐼𝐼𝐻𝐻
1 × 10⁻¹²
𝐼𝐼𝐻𝐻 = 𝐴𝐴𝐴𝐴𝐴𝐴𝐴𝐴𝑉𝑉𝑉𝑉𝑙𝑙6610
× 1 × 10−12
𝐼𝐼𝐻𝐻 = 3.98 × 10⁻⁶
Total intensities, I 𝐼𝐼 = (3.16 × 10⁻⁶) + (1.0 × 10⁻⁶) 𝐼𝐼 = 4.16 × 10⁻⁶
𝐼𝐼 = (1.26 × 10⁻⁵) + (3.98 × 10⁻⁶) 𝐼𝐼 = 1.658 × 10⁻⁵
Sound Pressure Level, SPL
𝑆𝑆𝑆𝑆𝑆𝑆 = 10 𝑉𝑉𝑉𝑉𝑙𝑙10 ×4.16 × 10−6
1 × 10⁻¹²
𝑆𝑆𝑆𝑆𝑆𝑆 = 𝟔𝟔𝟔𝟔.𝟏𝟏𝐝𝐝𝐝𝐝
𝑆𝑆𝑆𝑆𝑆𝑆 = 10 𝑉𝑉𝑉𝑉𝑙𝑙10 × 1.658×10−5
1×10⁻¹²
𝑆𝑆𝑆𝑆𝑆𝑆 = 𝟕𝟕𝟕𝟕.𝟏𝟏𝟏𝟏𝐝𝐝𝐝𝐝
Table 2.3.6.1.1(a) Sound pressure level calculation for ground floor zone A
Project 1 Lighting and Acoustic Performance Evaluation and Design
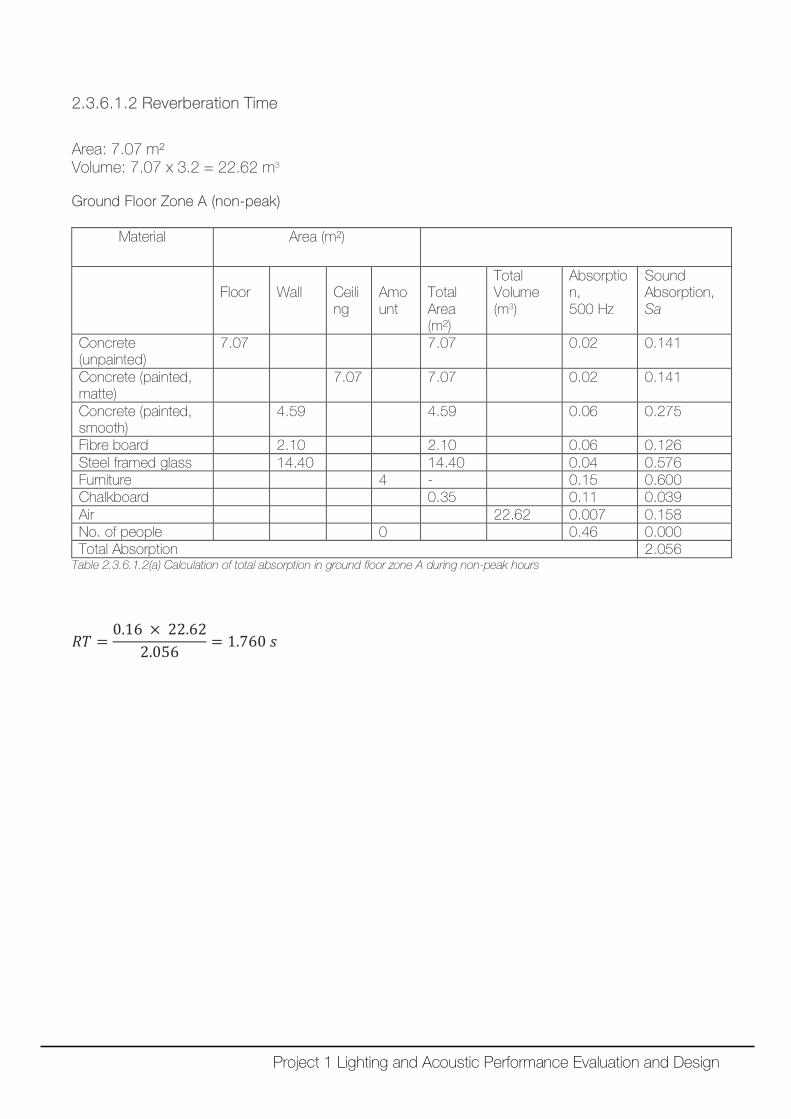
2.3.6.1.2 Reverberation Time
Area: 7.07 m² Volume: 7.07 x 3.2 = 22.62 m3
Ground Floor Zone A (non-peak)
Material Area (m²)
Floor
Wall
Ceiling
Amount
Total Area (m²)
Total Volume (m3)
Absorption, 500 Hz
Sound Absorption, Sa
Concrete (unpainted)
7.07 7.07 0.02 0.141
Concrete (painted, matte)
7.07 7.07 0.02 0.141
Concrete (painted, smooth)
4.59 4.59 0.06 0.275
Fibre board 2.10 2.10 0.06 0.126 Steel framed glass 14.40 14.40 0.04 0.576 Furniture 4 - 0.15 0.600 Chalkboard 0.35 0.11 0.039 Air 22.62 0.007 0.158 No. of people 0 0.46 0.000 Total Absorption 2.056
Table 2.3.6.1.2(a) Calculation of total absorption in ground floor zone A during non-peak hours
𝑅𝑅𝑅𝑅 =0.16 × 22.62
2.056 = 1.760 𝑠𝑠
Project 1 Lighting and Acoustic Performance Evaluation and Design
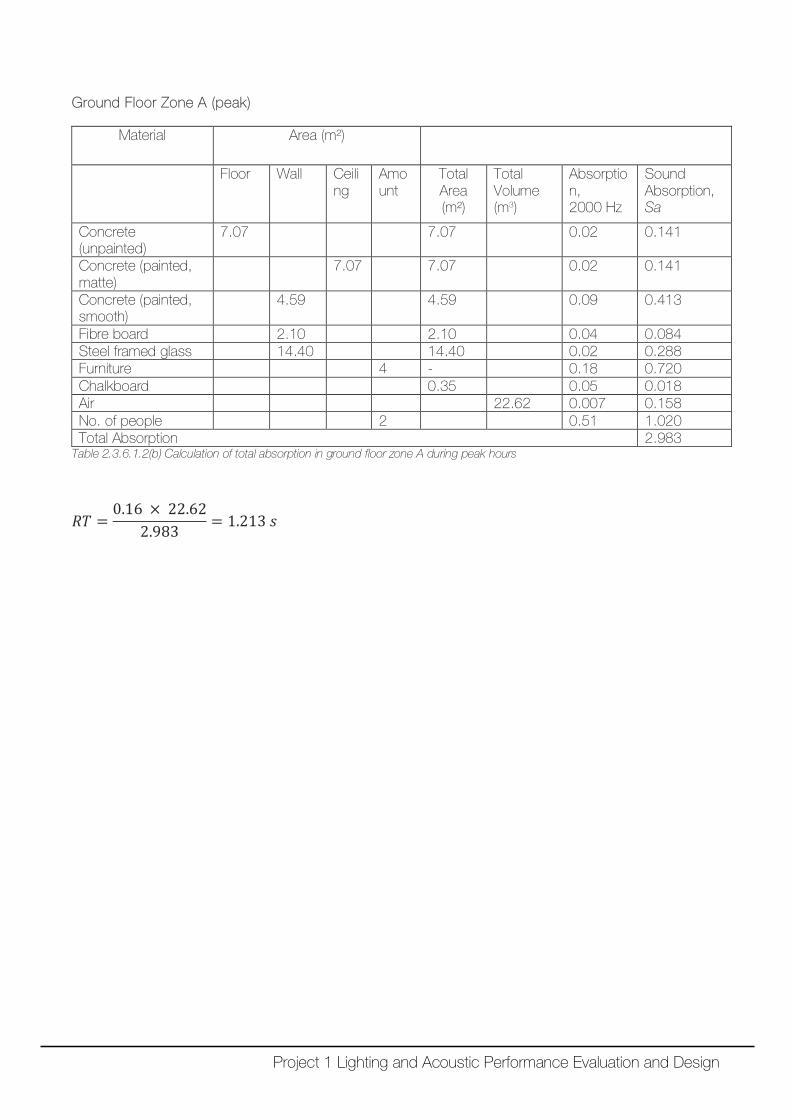
Ground Floor Zone A (peak)
Material Area (m²)
Floor Wall Ceiling
Amount
Total Area (m²)
Total Volume (m3)
Absorption, 2000 Hz
Sound Absorption, Sa
Concrete (unpainted)
7.07 7.07 0.02 0.141
Concrete (painted, matte)
7.07 7.07 0.02 0.141
Concrete (painted, smooth)
4.59 4.59 0.09 0.413
Fibre board 2.10 2.10 0.04 0.084 Steel framed glass 14.40 14.40 0.02 0.288 Furniture 4 - 0.18 0.720 Chalkboard 0.35 0.05 0.018 Air 22.62 0.007 0.158 No. of people 2 0.51 1.020 Total Absorption 2.983
Table 2.3.6.1.2(b) Calculation of total absorption in ground floor zone A during peak hours
𝑅𝑅𝑅𝑅 =0.16 × 22.62
2.983 = 1.213 𝑠𝑠
Project 1 Lighting and Acoustic Performance Evaluation and Design
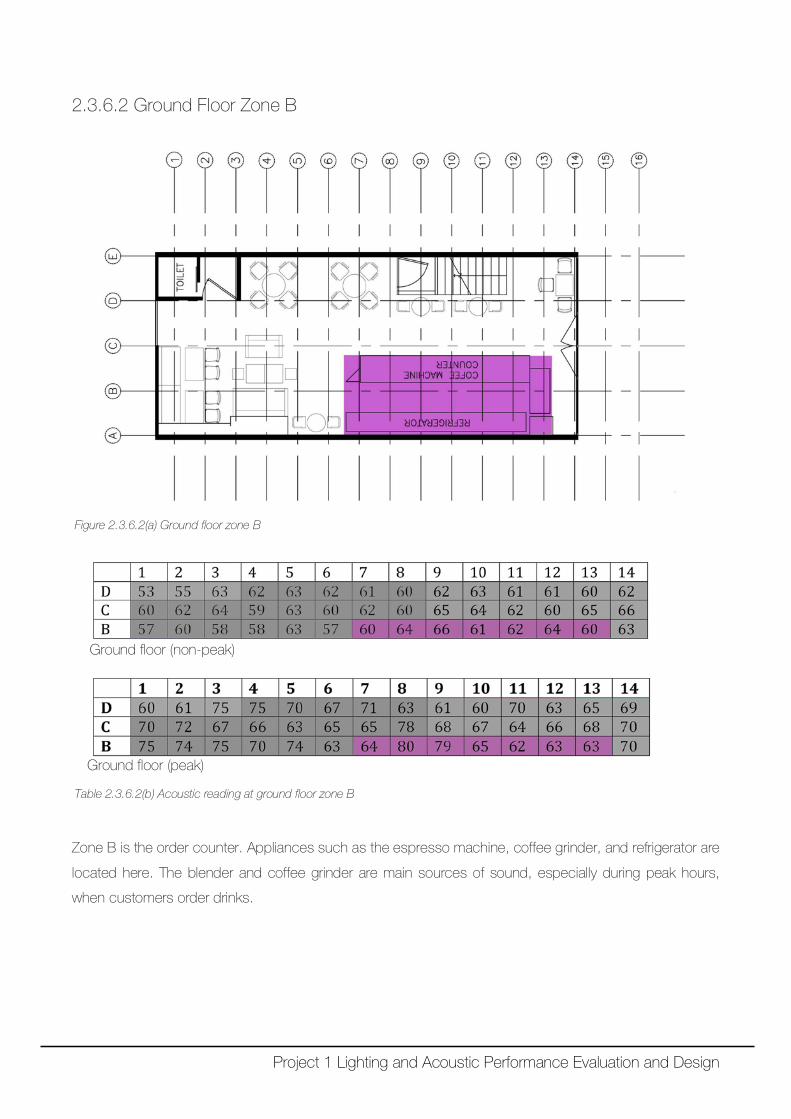
2.3.6.2 Ground Floor Zone B
Figure 2.3.6.2(a) Ground floor zone B
Ground floor (non-peak)
Ground floor (peak)
Table 2.3.6.2(b) Acoustic reading at ground floor zone B
Zone B is the order counter. Appliances such as the espresso machine, coffee grinder, and refrigerator are
located here. The blender and coffee grinder are main sources of sound, especially during peak hours,
when customers order drinks.
Project 1 Lighting and Acoustic Performance Evaluation and Design
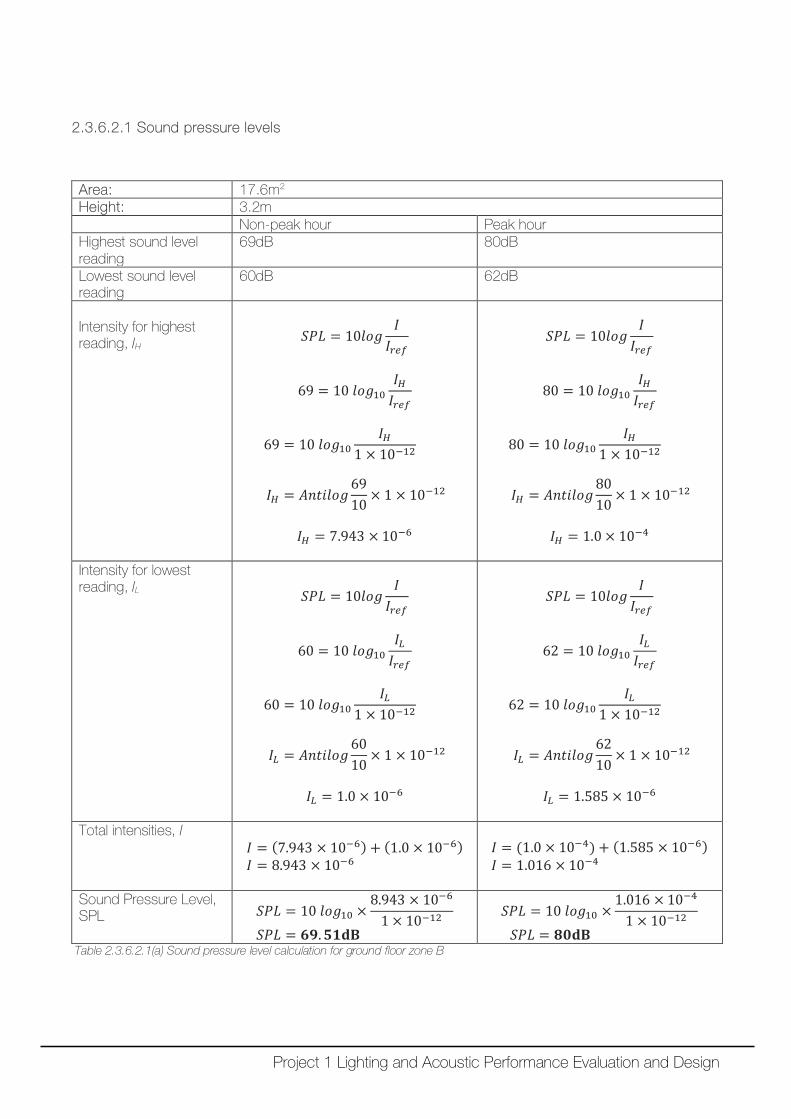
2.3.6.2.1 Sound pressure levels
Area: 17.6m2 Height: 3.2m Non-peak hour Peak hour Highest sound level reading
69dB 80dB
Lowest sound level reading
60dB 62dB
Intensity for highest reading, IH
𝑆𝑆𝑆𝑆𝑆𝑆 = 10𝑉𝑉𝑉𝑉𝑙𝑙𝐼𝐼𝐼𝐼𝑟𝑟𝑟𝑟𝑟𝑟
69 = 10 𝑉𝑉𝑉𝑉𝑙𝑙10𝐼𝐼𝐻𝐻𝐼𝐼𝑟𝑟𝑟𝑟𝑟𝑟
69 = 10 𝑉𝑉𝑉𝑉𝑙𝑙10𝐼𝐼𝐻𝐻
1 × 10⁻¹²
𝐼𝐼𝐻𝐻 = 𝐴𝐴𝐴𝐴𝐴𝐴𝐴𝐴𝑉𝑉𝑉𝑉𝑙𝑙6910
× 1 × 10−12
𝐼𝐼𝐻𝐻 = 7.943 × 10⁻⁶
𝑆𝑆𝑆𝑆𝑆𝑆 = 10𝑉𝑉𝑉𝑉𝑙𝑙𝐼𝐼𝐼𝐼𝑟𝑟𝑟𝑟𝑟𝑟
80 = 10 𝑉𝑉𝑉𝑉𝑙𝑙10𝐼𝐼𝐻𝐻𝐼𝐼𝑟𝑟𝑟𝑟𝑟𝑟
80 = 10 𝑉𝑉𝑉𝑉𝑙𝑙10𝐼𝐼𝐻𝐻
1 × 10⁻¹²
𝐼𝐼𝐻𝐻 = 𝐴𝐴𝐴𝐴𝐴𝐴𝐴𝐴𝑉𝑉𝑉𝑉𝑙𝑙8010
× 1 × 10−12
𝐼𝐼𝐻𝐻 = 1.0 × 10⁻⁴
Intensity for lowest reading, IL
𝑆𝑆𝑆𝑆𝑆𝑆 = 10𝑉𝑉𝑉𝑉𝑙𝑙𝐼𝐼𝐼𝐼𝑟𝑟𝑟𝑟𝑟𝑟
60 = 10 𝑉𝑉𝑉𝑉𝑙𝑙10𝐼𝐼𝐿𝐿𝐼𝐼𝑟𝑟𝑟𝑟𝑟𝑟
60 = 10 𝑉𝑉𝑉𝑉𝑙𝑙10𝐼𝐼𝐿𝐿
1 × 10⁻¹²
𝐼𝐼𝐿𝐿 = 𝐴𝐴𝐴𝐴𝐴𝐴𝐴𝐴𝑉𝑉𝑉𝑉𝑙𝑙6010
× 1 × 10−12
𝐼𝐼𝐿𝐿 = 1.0 × 10⁻⁶
𝑆𝑆𝑆𝑆𝑆𝑆 = 10𝑉𝑉𝑉𝑉𝑙𝑙𝐼𝐼𝐼𝐼𝑟𝑟𝑟𝑟𝑟𝑟
62 = 10 𝑉𝑉𝑉𝑉𝑙𝑙10𝐼𝐼𝐿𝐿𝐼𝐼𝑟𝑟𝑟𝑟𝑟𝑟
62 = 10 𝑉𝑉𝑉𝑉𝑙𝑙10𝐼𝐼𝐿𝐿
1 × 10⁻¹²
𝐼𝐼𝐿𝐿 = 𝐴𝐴𝐴𝐴𝐴𝐴𝐴𝐴𝑉𝑉𝑉𝑉𝑙𝑙6210
× 1 × 10−12
𝐼𝐼𝐿𝐿 = 1.585 × 10⁻⁶
Total intensities, I 𝐼𝐼 = (7.943 × 10⁻⁶) + (1.0 × 10⁻⁶) 𝐼𝐼 = 8.943 × 10⁻⁶
𝐼𝐼 = (1.0 × 10⁻⁴) + (1.585 × 10⁻⁶) 𝐼𝐼 = 1.016 × 10⁻⁴
Sound Pressure Level, SPL 𝑆𝑆𝑆𝑆𝑆𝑆 = 10 𝑉𝑉𝑉𝑉𝑙𝑙10 ×
8.943 × 10−6
1 × 10⁻¹²
𝑆𝑆𝑆𝑆𝑆𝑆 = 𝟔𝟔𝟏𝟏.𝟓𝟓𝟏𝟏𝐝𝐝𝐝𝐝
𝑆𝑆𝑆𝑆𝑆𝑆 = 10 𝑉𝑉𝑉𝑉𝑙𝑙10 ×1.016 × 10−4
1 × 10⁻¹²
𝑆𝑆𝑆𝑆𝑆𝑆 = 𝟖𝟖𝟖𝟖𝐝𝐝𝐝𝐝 Table 2.3.6.2.1(a) Sound pressure level calculation for ground floor zone B
Project 1 Lighting and Acoustic Performance Evaluation and Design
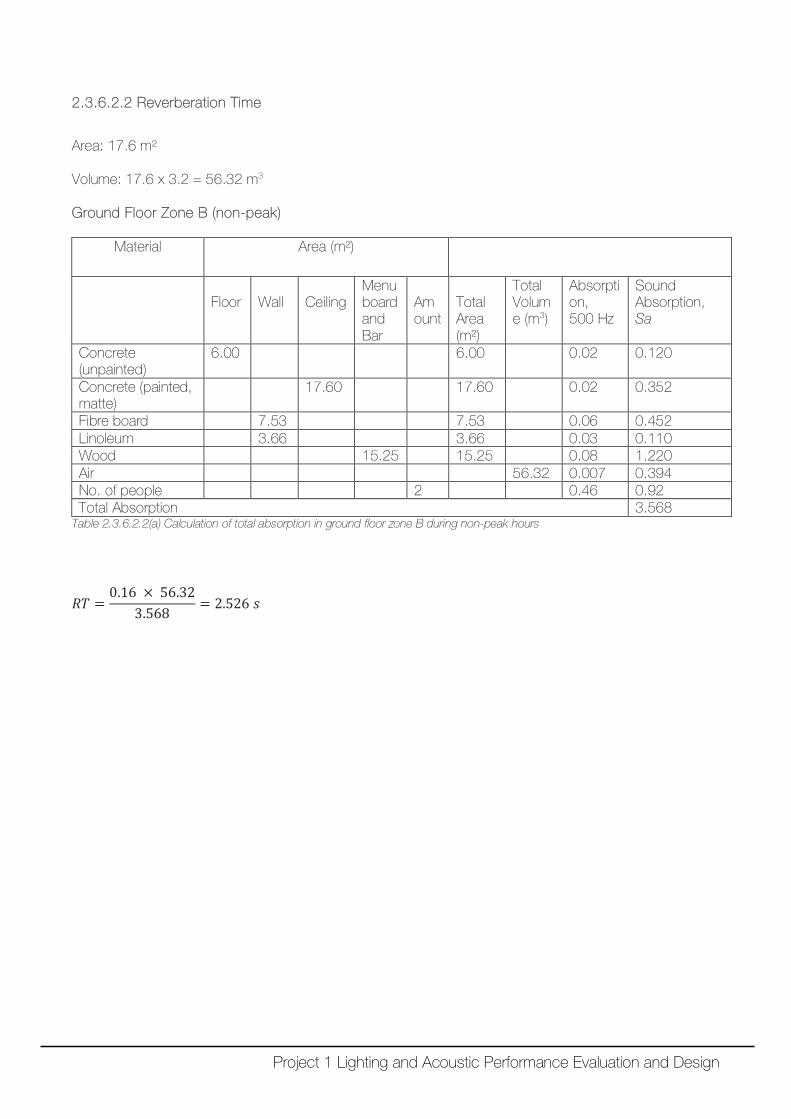
2.3.6.2.2 Reverberation Time
Area: 17.6 m² Volume: 17.6 x 3.2 = 56.32 m3
Ground Floor Zone B (non-peak)
Material Area (m²)
Floor
Wall
Ceiling
Menu board and Bar
Amount
Total Area (m²)
Total Volume (m3)
Absorption, 500 Hz
Sound Absorption, Sa
Concrete (unpainted)
6.00 6.00 0.02 0.120
Concrete (painted, matte)
17.60 17.60 0.02 0.352
Fibre board 7.53 7.53 0.06 0.452 Linoleum 3.66 3.66 0.03 0.110 Wood 15.25 15.25 0.08 1.220 Air 56.32 0.007 0.394 No. of people 2 0.46 0.92 Total Absorption 3.568
Table 2.3.6.2.2(a) Calculation of total absorption in ground floor zone B during non-peak hours
𝑅𝑅𝑅𝑅 =0.16 × 56.32
3.568= 2.526 𝑠𝑠
Project 1 Lighting and Acoustic Performance Evaluation and Design
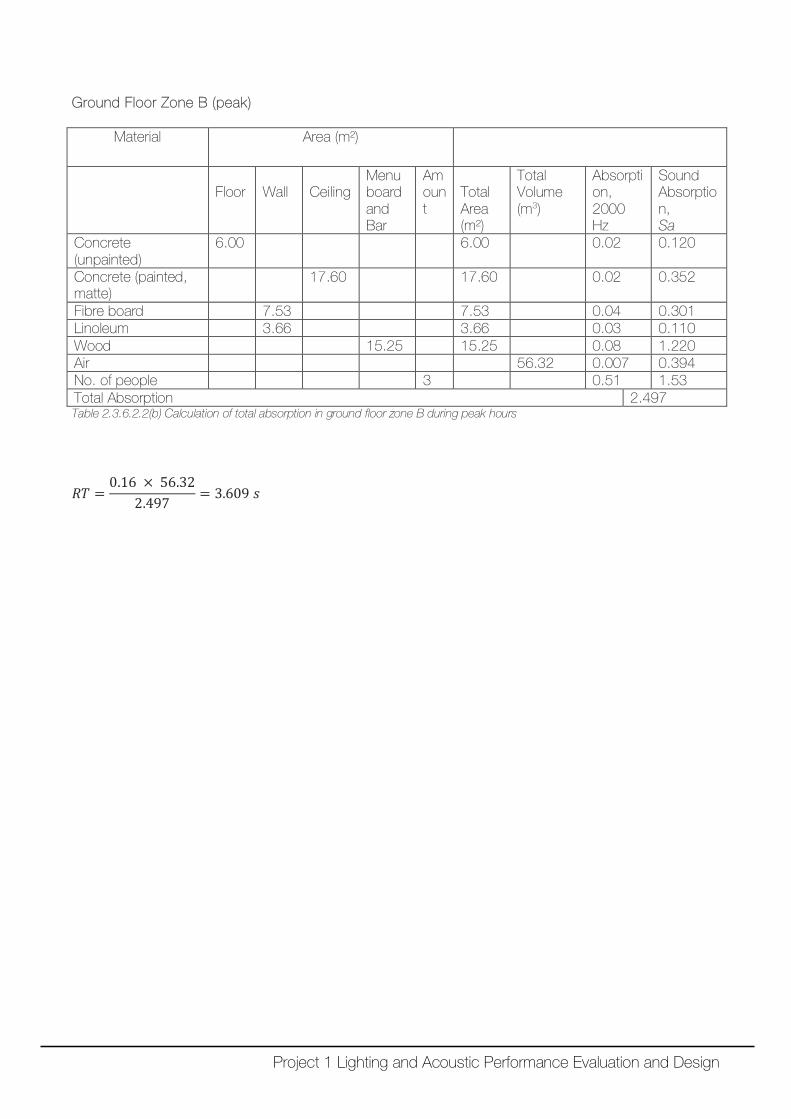
Ground Floor Zone B (peak)
Material Area (m²)
Floor
Wall
Ceiling
Menu board and Bar
Amount
Total Area (m²)
Total Volume (m3)
Absorption, 2000 Hz
Sound Absorption, Sa
Concrete (unpainted)
6.00 6.00 0.02 0.120
Concrete (painted, matte)
17.60 17.60 0.02 0.352
Fibre board 7.53 7.53 0.04 0.301 Linoleum 3.66 3.66 0.03 0.110 Wood 15.25 15.25 0.08 1.220 Air 56.32 0.007 0.394 No. of people 3 0.51 1.53 Total Absorption 2.497 Table 2.3.6.2.2(b) Calculation of total absorption in ground floor zone B during peak hours
𝑅𝑅𝑅𝑅 =0.16 × 56.32
2.497= 3.609 𝑠𝑠
Project 1 Lighting and Acoustic Performance Evaluation and Design
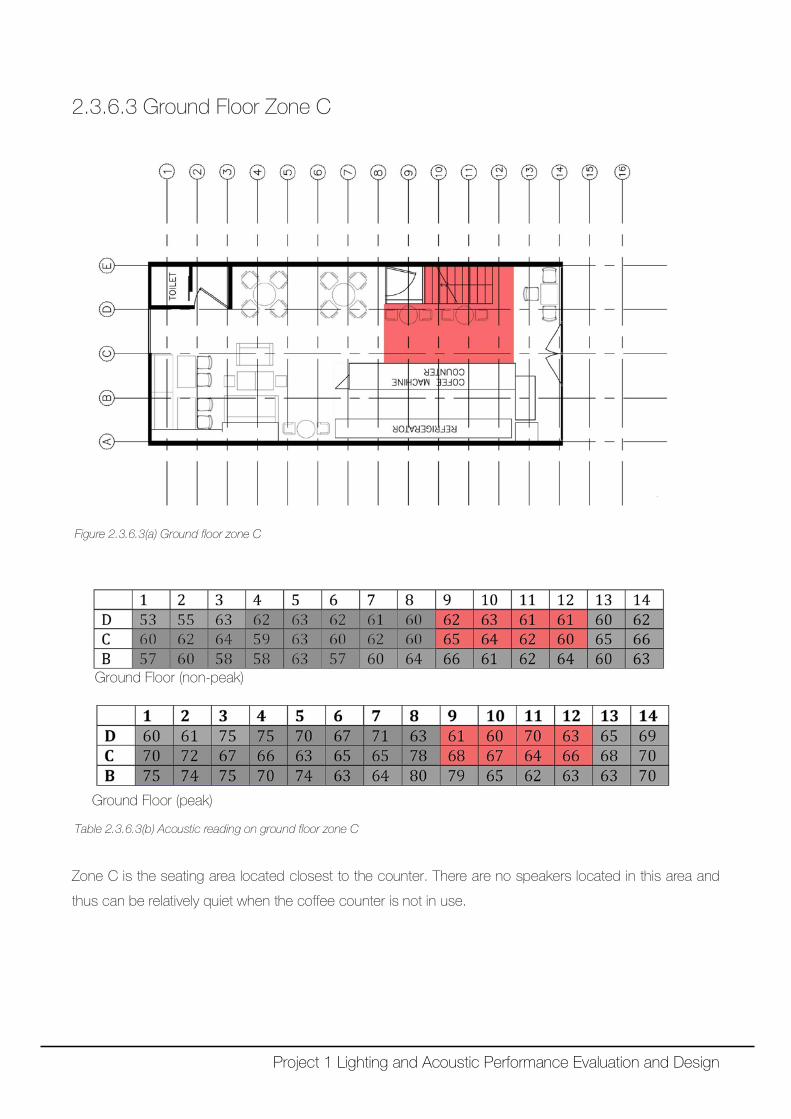
2.3.6.3 Ground Floor Zone C
Figure 2.3.6.3(a) Ground floor zone C
Ground Floor (non-peak)
Ground Floor (peak)
Table 2.3.6.3(b) Acoustic reading on ground floor zone C
Zone C is the seating area located closest to the counter. There are no speakers located in this area and
thus can be relatively quiet when the coffee counter is not in use.
Project 1 Lighting and Acoustic Performance Evaluation and Design
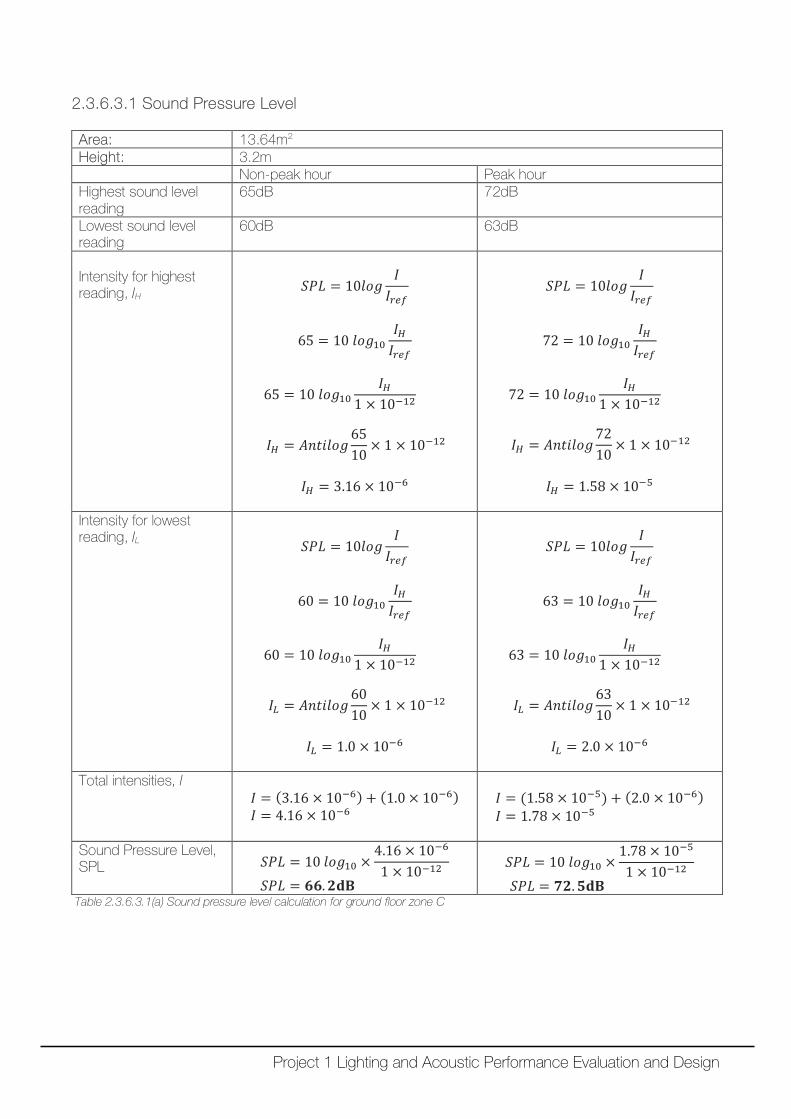
2.3.6.3.1 Sound Pressure Level Area: 13.64m2 Height: 3.2m Non-peak hour Peak hour Highest sound level reading
65dB 72dB
Lowest sound level reading
60dB 63dB
Intensity for highest reading, IH
𝑆𝑆𝑆𝑆𝑆𝑆 = 10𝑉𝑉𝑉𝑉𝑙𝑙𝐼𝐼𝐼𝐼𝑟𝑟𝑟𝑟𝑟𝑟
65 = 10 𝑉𝑉𝑉𝑉𝑙𝑙10𝐼𝐼𝐻𝐻𝐼𝐼𝑟𝑟𝑟𝑟𝑟𝑟
65 = 10 𝑉𝑉𝑉𝑉𝑙𝑙10𝐼𝐼𝐻𝐻
1 × 10⁻¹²
𝐼𝐼𝐻𝐻 = 𝐴𝐴𝐴𝐴𝐴𝐴𝐴𝐴𝑉𝑉𝑉𝑉𝑙𝑙6510
× 1 × 10−12
𝐼𝐼𝐻𝐻 = 3.16 × 10⁻⁶
𝑆𝑆𝑆𝑆𝑆𝑆 = 10𝑉𝑉𝑉𝑉𝑙𝑙𝐼𝐼𝐼𝐼𝑟𝑟𝑟𝑟𝑟𝑟
72 = 10 𝑉𝑉𝑉𝑉𝑙𝑙10𝐼𝐼𝐻𝐻𝐼𝐼𝑟𝑟𝑟𝑟𝑟𝑟
72 = 10 𝑉𝑉𝑉𝑉𝑙𝑙10𝐼𝐼𝐻𝐻
1 × 10⁻¹²
𝐼𝐼𝐻𝐻 = 𝐴𝐴𝐴𝐴𝐴𝐴𝐴𝐴𝑉𝑉𝑉𝑉𝑙𝑙7210
× 1 × 10−12
𝐼𝐼𝐻𝐻 = 1.58 × 10⁻⁵
Intensity for lowest reading, IL
𝑆𝑆𝑆𝑆𝑆𝑆 = 10𝑉𝑉𝑉𝑉𝑙𝑙𝐼𝐼𝐼𝐼𝑟𝑟𝑟𝑟𝑟𝑟
60 = 10 𝑉𝑉𝑉𝑉𝑙𝑙10𝐼𝐼𝐻𝐻𝐼𝐼𝑟𝑟𝑟𝑟𝑟𝑟
60 = 10 𝑉𝑉𝑉𝑉𝑙𝑙10𝐼𝐼𝐻𝐻
1 × 10⁻¹²
𝐼𝐼𝐿𝐿 = 𝐴𝐴𝐴𝐴𝐴𝐴𝐴𝐴𝑉𝑉𝑉𝑉𝑙𝑙6010
× 1 × 10−12
𝐼𝐼𝐿𝐿 = 1.0 × 10⁻⁶
𝑆𝑆𝑆𝑆𝑆𝑆 = 10𝑉𝑉𝑉𝑉𝑙𝑙𝐼𝐼𝐼𝐼𝑟𝑟𝑟𝑟𝑟𝑟
63 = 10 𝑉𝑉𝑉𝑉𝑙𝑙10𝐼𝐼𝐻𝐻𝐼𝐼𝑟𝑟𝑟𝑟𝑟𝑟
63 = 10 𝑉𝑉𝑉𝑉𝑙𝑙10𝐼𝐼𝐻𝐻
1 × 10⁻¹²
𝐼𝐼𝐿𝐿 = 𝐴𝐴𝐴𝐴𝐴𝐴𝐴𝐴𝑉𝑉𝑉𝑉𝑙𝑙6310
× 1 × 10−12
𝐼𝐼𝐿𝐿 = 2.0 × 10⁻⁶
Total intensities, I 𝐼𝐼 = (3.16 × 10⁻⁶) + (1.0 × 10⁻⁶) 𝐼𝐼 = 4.16 × 10⁻⁶
𝐼𝐼 = (1.58 × 10⁻⁵) + (2.0 × 10⁻⁶) 𝐼𝐼 = 1.78 × 10⁻⁵
Sound Pressure Level, SPL 𝑆𝑆𝑆𝑆𝑆𝑆 = 10 𝑉𝑉𝑉𝑉𝑙𝑙10 ×
4.16 × 10−6
1 × 10⁻¹²
𝑆𝑆𝑆𝑆𝑆𝑆 = 𝟔𝟔𝟔𝟔.𝟕𝟕𝐝𝐝𝐝𝐝
𝑆𝑆𝑆𝑆𝑆𝑆 = 10 𝑉𝑉𝑉𝑉𝑙𝑙10 ×1.78 × 10−5
1 × 10⁻¹²
𝑆𝑆𝑆𝑆𝑆𝑆 = 𝟕𝟕𝟕𝟕.𝟓𝟓𝐝𝐝𝐝𝐝 Table 2.3.6.3.1(a) Sound pressure level calculation for ground floor zone C
Project 1 Lighting and Acoustic Performance Evaluation and Design
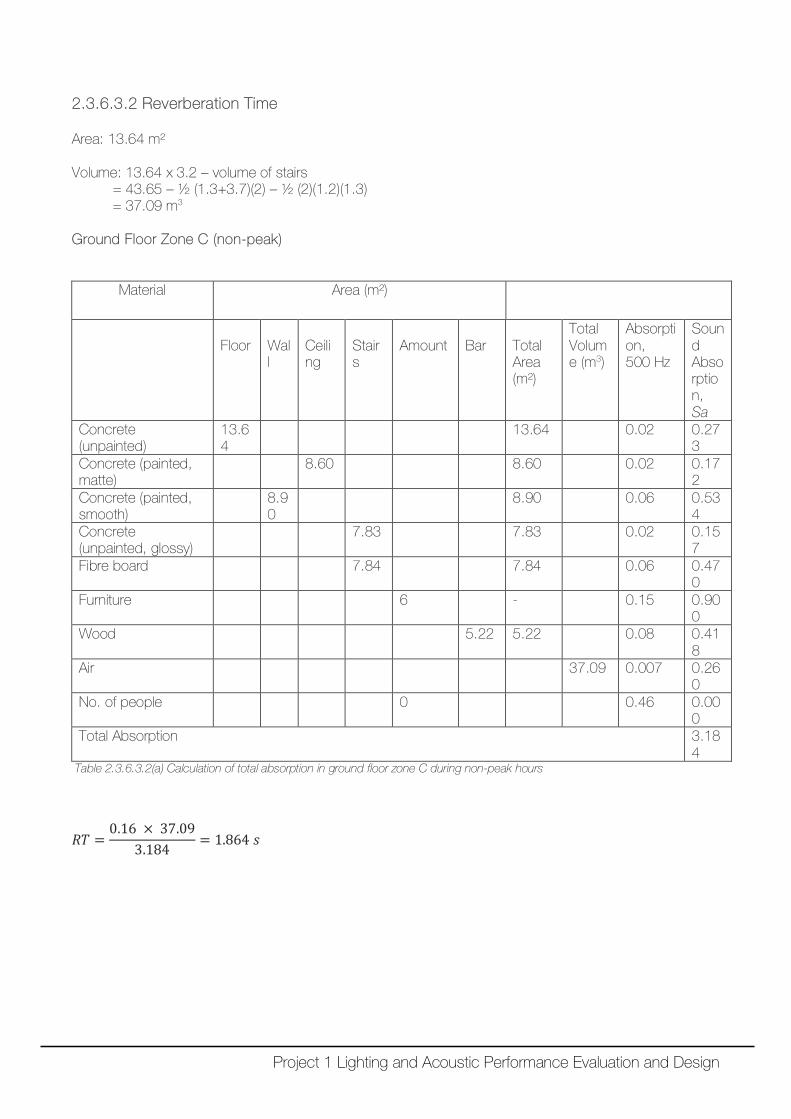
2.3.6.3.2 Reverberation Time Area: 13.64 m² Volume: 13.64 x 3.2 – volume of stairs = 43.65 – ½ (1.3+3.7)(2) – ½ (2)(1.2)(1.3) = 37.09 m3 Ground Floor Zone C (non-peak)
Material Area (m²)
Floor
Wall
Ceiling
Stairs
Amount
Bar
Total Area (m²)
Total Volume (m3)
Absorption, 500 Hz
Sound Absorption, Sa
Concrete (unpainted)
13.64
13.64 0.02 0.273
Concrete (painted, matte)
8.60 8.60 0.02 0.172
Concrete (painted, smooth)
8.90
8.90 0.06 0.534
Concrete (unpainted, glossy)
7.83 7.83 0.02 0.157
Fibre board 7.84 7.84 0.06 0.470
Furniture 6 - 0.15 0.900
Wood 5.22 5.22 0.08 0.418
Air 37.09 0.007 0.260
No. of people 0 0.46 0.000
Total Absorption 3.184
Table 2.3.6.3.2(a) Calculation of total absorption in ground floor zone C during non-peak hours
𝑅𝑅𝑅𝑅 =0.16 × 37.09
3.184= 1.864 𝑠𝑠
Project 1 Lighting and Acoustic Performance Evaluation and Design
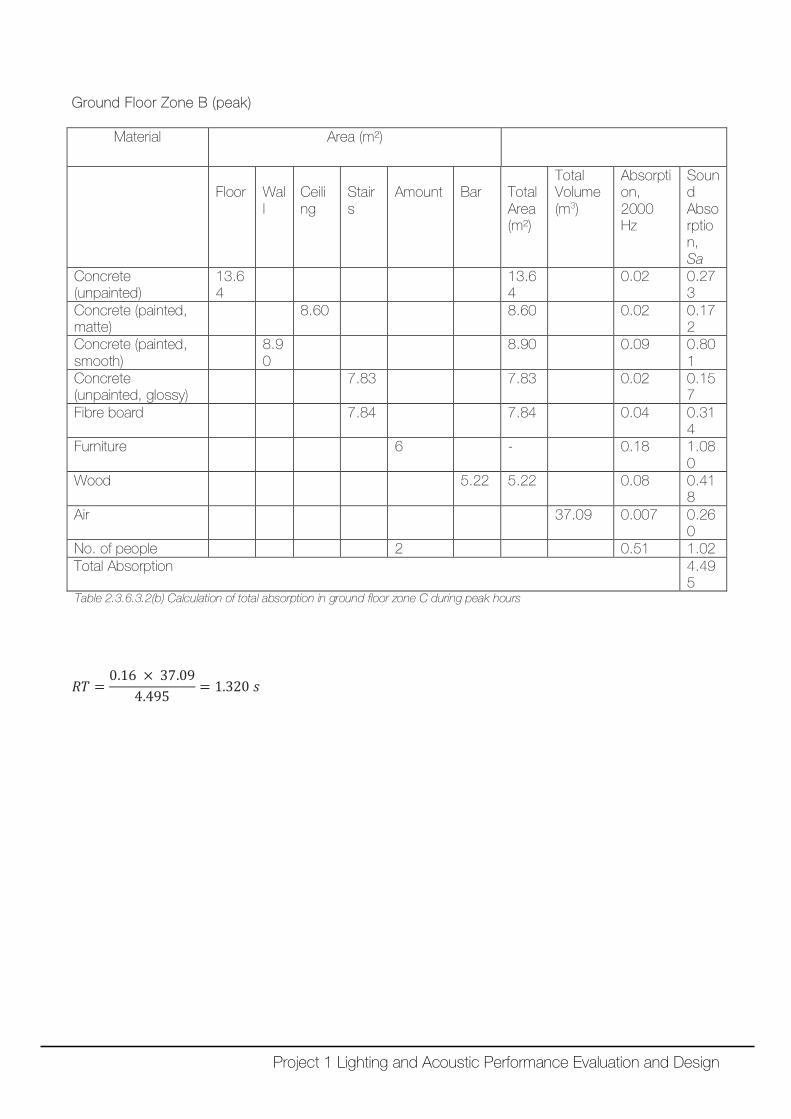
Ground Floor Zone B (peak)
Material Area (m²)
Floor
Wall
Ceiling
Stairs
Amount
Bar
Total Area (m²)
Total Volume (m3)
Absorption, 2000 Hz
Sound Absorption, Sa
Concrete (unpainted)
13.64
13.64
0.02 0.273
Concrete (painted, matte)
8.60 8.60 0.02 0.172
Concrete (painted, smooth)
8.90
8.90 0.09 0.801
Concrete (unpainted, glossy)
7.83 7.83 0.02 0.157
Fibre board 7.84 7.84 0.04 0.314
Furniture 6 - 0.18 1.080
Wood 5.22 5.22 0.08 0.418
Air 37.09 0.007 0.260
No. of people 2 0.51 1.02 Total Absorption 4.49
5 Table 2.3.6.3.2(b) Calculation of total absorption in ground floor zone C during peak hours
𝑅𝑅𝑅𝑅 =0.16 × 37.09
4.495= 1.320 𝑠𝑠
Project 1 Lighting and Acoustic Performance Evaluation and Design
2.3.6.4 Ground Floor Zone D
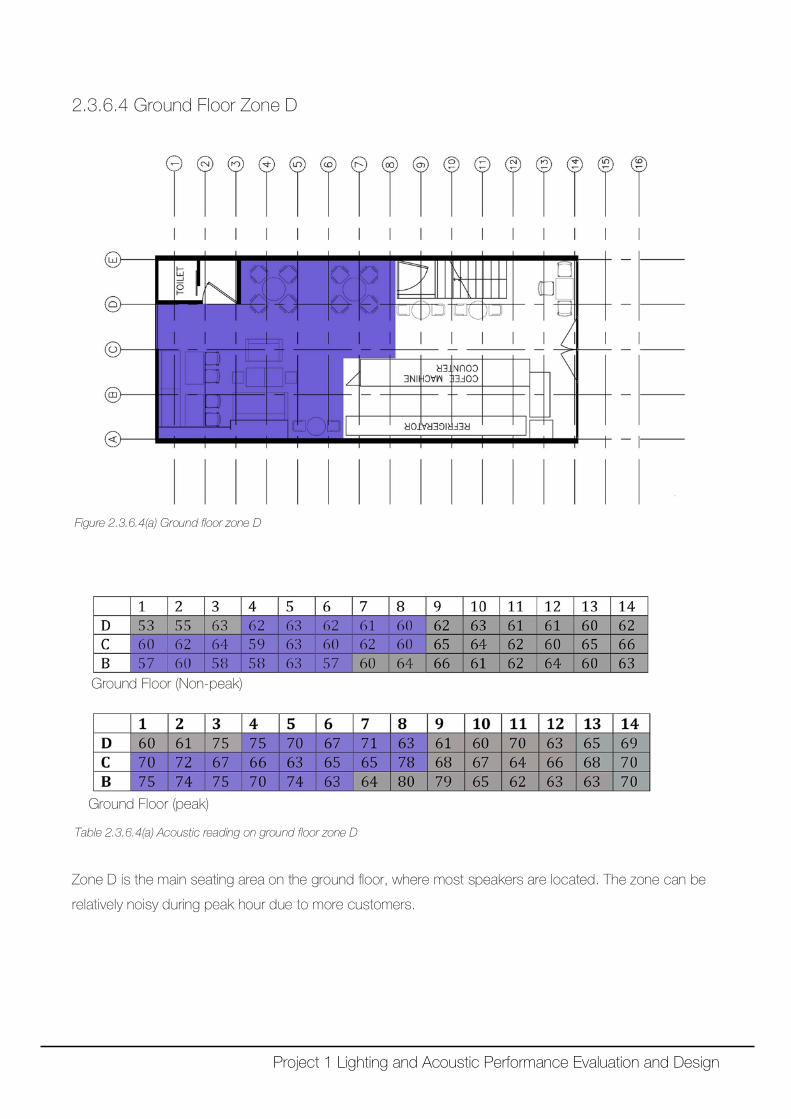
Figure 2.3.6.4(a) Ground floor zone D
Ground Floor (Non-peak)
Ground Floor (peak)
Table 2.3.6.4(a) Acoustic reading on ground floor zone D
Zone D is the main seating area on the ground floor, where most speakers are located. The zone can be
relatively noisy during peak hour due to more customers.
Project 1 Lighting and Acoustic Performance Evaluation and Design
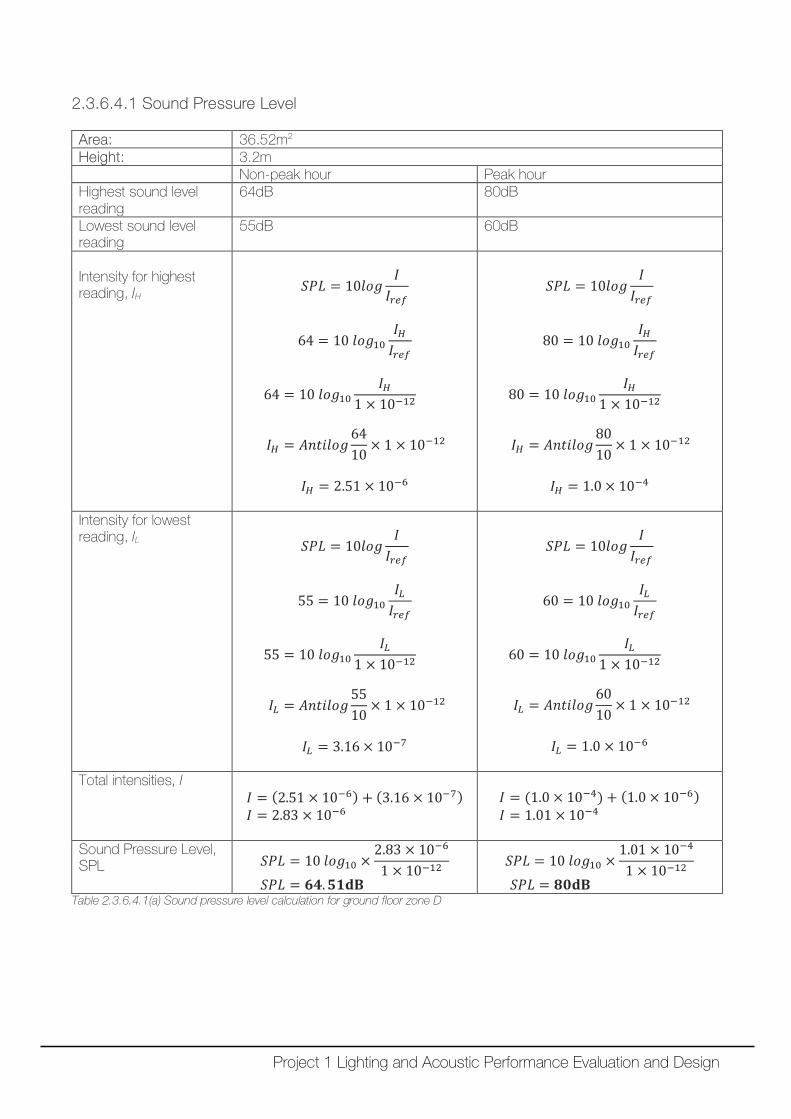
2.3.6.4.1 Sound Pressure Level Area: 36.52m2 Height: 3.2m Non-peak hour Peak hour Highest sound level reading
64dB 80dB
Lowest sound level reading
55dB 60dB
Intensity for highest reading, IH
𝑆𝑆𝑆𝑆𝑆𝑆 = 10𝑉𝑉𝑉𝑉𝑙𝑙𝐼𝐼𝐼𝐼𝑟𝑟𝑟𝑟𝑟𝑟
64 = 10 𝑉𝑉𝑉𝑉𝑙𝑙10𝐼𝐼𝐻𝐻𝐼𝐼𝑟𝑟𝑟𝑟𝑟𝑟
64 = 10 𝑉𝑉𝑉𝑉𝑙𝑙10𝐼𝐼𝐻𝐻
1 × 10⁻¹²
𝐼𝐼𝐻𝐻 = 𝐴𝐴𝐴𝐴𝐴𝐴𝐴𝐴𝑉𝑉𝑉𝑉𝑙𝑙6410
× 1 × 10−12
𝐼𝐼𝐻𝐻 = 2.51 × 10⁻⁶
𝑆𝑆𝑆𝑆𝑆𝑆 = 10𝑉𝑉𝑉𝑉𝑙𝑙𝐼𝐼𝐼𝐼𝑟𝑟𝑟𝑟𝑟𝑟
80 = 10 𝑉𝑉𝑉𝑉𝑙𝑙10𝐼𝐼𝐻𝐻𝐼𝐼𝑟𝑟𝑟𝑟𝑟𝑟
80 = 10 𝑉𝑉𝑉𝑉𝑙𝑙10𝐼𝐼𝐻𝐻
1 × 10⁻¹²
𝐼𝐼𝐻𝐻 = 𝐴𝐴𝐴𝐴𝐴𝐴𝐴𝐴𝑉𝑉𝑉𝑉𝑙𝑙8010
× 1 × 10−12
𝐼𝐼𝐻𝐻 = 1.0 × 10⁻⁴
Intensity for lowest reading, IL
𝑆𝑆𝑆𝑆𝑆𝑆 = 10𝑉𝑉𝑉𝑉𝑙𝑙𝐼𝐼𝐼𝐼𝑟𝑟𝑟𝑟𝑟𝑟
55 = 10 𝑉𝑉𝑉𝑉𝑙𝑙10𝐼𝐼𝐿𝐿𝐼𝐼𝑟𝑟𝑟𝑟𝑟𝑟
55 = 10 𝑉𝑉𝑉𝑉𝑙𝑙10𝐼𝐼𝐿𝐿
1 × 10⁻¹²
𝐼𝐼𝐿𝐿 = 𝐴𝐴𝐴𝐴𝐴𝐴𝐴𝐴𝑉𝑉𝑉𝑉𝑙𝑙5510
× 1 × 10−12
𝐼𝐼𝐿𝐿 = 3.16 × 10⁻⁷
𝑆𝑆𝑆𝑆𝑆𝑆 = 10𝑉𝑉𝑉𝑉𝑙𝑙𝐼𝐼𝐼𝐼𝑟𝑟𝑟𝑟𝑟𝑟
60 = 10 𝑉𝑉𝑉𝑉𝑙𝑙10𝐼𝐼𝐿𝐿𝐼𝐼𝑟𝑟𝑟𝑟𝑟𝑟
60 = 10 𝑉𝑉𝑉𝑉𝑙𝑙10𝐼𝐼𝐿𝐿
1 × 10⁻¹²
𝐼𝐼𝐿𝐿 = 𝐴𝐴𝐴𝐴𝐴𝐴𝐴𝐴𝑉𝑉𝑉𝑉𝑙𝑙6010
× 1 × 10−12
𝐼𝐼𝐿𝐿 = 1.0 × 10⁻⁶
Total intensities, I 𝐼𝐼 = (2.51 × 10⁻⁶) + (3.16 × 10⁻⁷) 𝐼𝐼 = 2.83 × 10⁻⁶
𝐼𝐼 = (1.0 × 10⁻⁴) + (1.0 × 10⁻⁶) 𝐼𝐼 = 1.01 × 10⁻⁴
Sound Pressure Level, SPL 𝑆𝑆𝑆𝑆𝑆𝑆 = 10 𝑉𝑉𝑉𝑉𝑙𝑙10 ×
2.83 × 10−6
1 × 10⁻¹²
𝑆𝑆𝑆𝑆𝑆𝑆 = 𝟔𝟔𝟔𝟔.𝟓𝟓𝟏𝟏𝐝𝐝𝐝𝐝
𝑆𝑆𝑆𝑆𝑆𝑆 = 10 𝑉𝑉𝑉𝑉𝑙𝑙10 ×1.01 × 10−4
1 × 10⁻¹²
𝑆𝑆𝑆𝑆𝑆𝑆 = 𝟖𝟖𝟖𝟖𝐝𝐝𝐝𝐝 Table 2.3.6.4.1(a) Sound pressure level calculation for ground floor zone D
Project 1 Lighting and Acoustic Performance Evaluation and Design
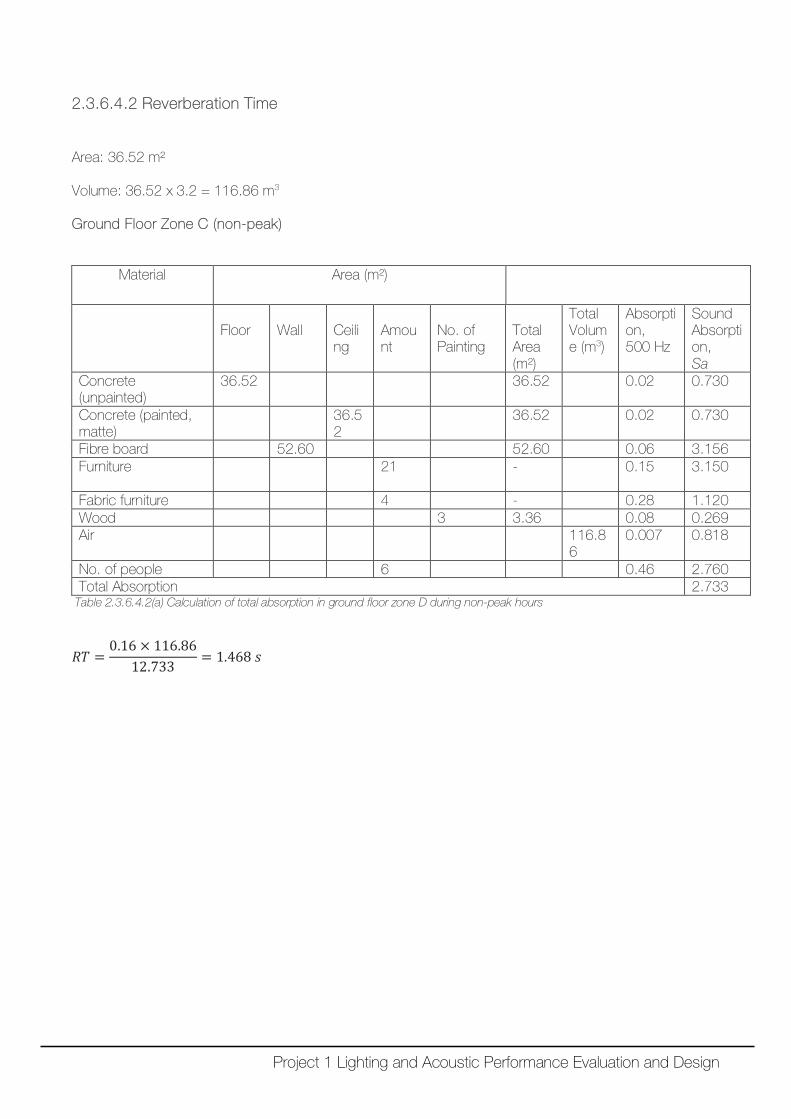
2.3.6.4.2 Reverberation Time Area: 36.52 m² Volume: 36.52 x 3.2 = 116.86 m3
Ground Floor Zone C (non-peak)
Material Area (m²)
Floor
Wall
Ceiling
Amount
No. of Painting
Total Area (m²)
Total Volume (m3)
Absorption, 500 Hz
Sound Absorption, Sa
Concrete (unpainted)
36.52 36.52 0.02 0.730
Concrete (painted, matte)
36.52
36.52 0.02 0.730
Fibre board 52.60 52.60 0.06 3.156 Furniture
21
-
0.15 3.150
Fabric furniture 4 - 0.28 1.120 Wood 3 3.36 0.08 0.269 Air 116.8
6 0.007 0.818
No. of people 6 0.46 2.760 Total Absorption 2.733
Table 2.3.6.4.2(a) Calculation of total absorption in ground floor zone D during non-peak hours
𝑅𝑅𝑅𝑅 =0.16 × 116.86
12.733= 1.468 𝑠𝑠
Project 1 Lighting and Acoustic Performance Evaluation and Design
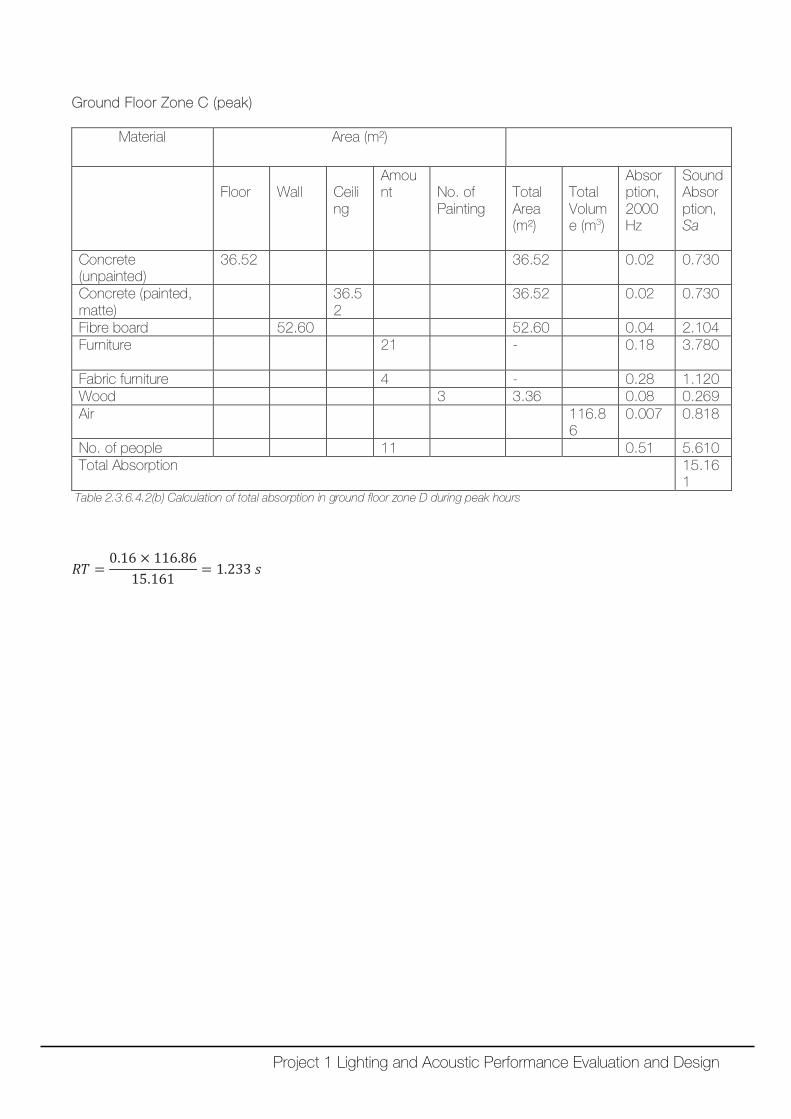
Ground Floor Zone C (peak)
Material Area (m²)
Floor
Wall
Ceiling
Amount
No. of Painting
Total Area (m²)
Total Volume (m3)
Absorption, 2000 Hz
Sound Absorption, Sa
Concrete (unpainted)
36.52 36.52 0.02 0.730
Concrete (painted, matte)
36.52
36.52 0.02 0.730
Fibre board 52.60 52.60 0.04 2.104 Furniture
21
-
0.18 3.780
Fabric furniture 4 - 0.28 1.120 Wood 3 3.36 0.08 0.269 Air 116.8
6 0.007 0.818
No. of people 11 0.51 5.610 Total Absorption 15.16
1 Table 2.3.6.4.2(b) Calculation of total absorption in ground floor zone D during peak hours
𝑅𝑅𝑅𝑅 =0.16 × 116.86
15.161= 1.233 𝑠𝑠
Project 1 Lighting and Acoustic Performance Evaluation and Design
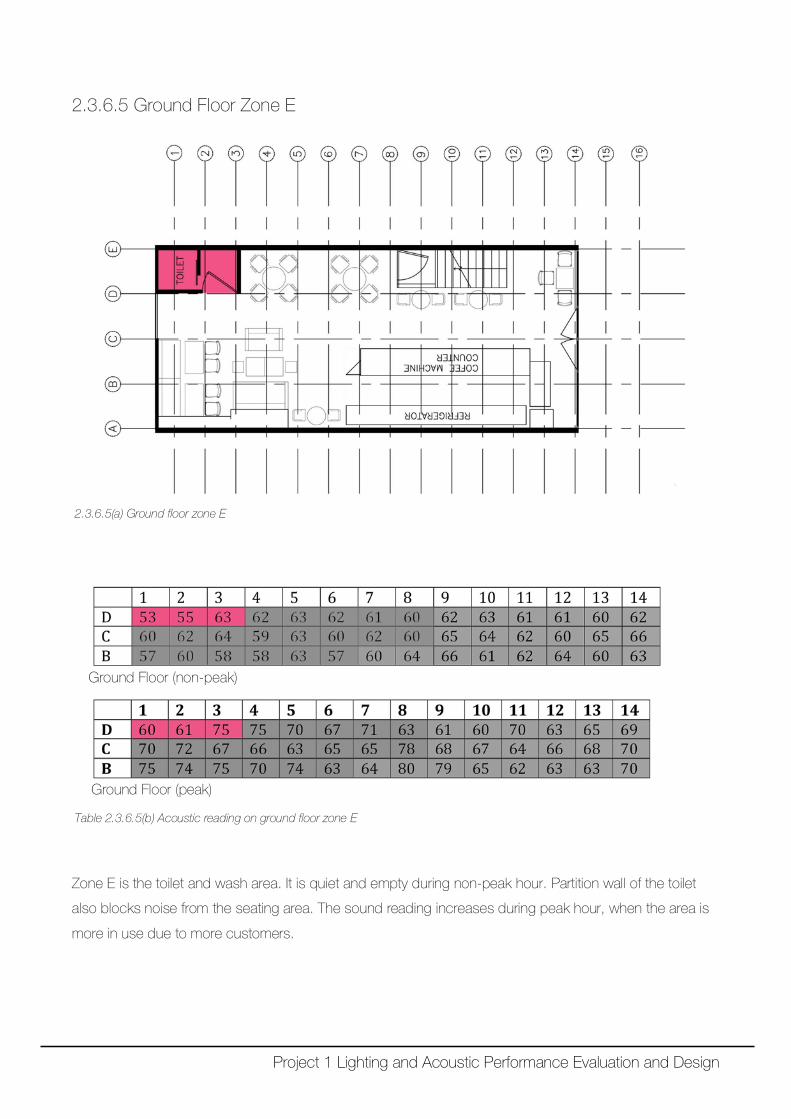
2.3.6.5 Ground Floor Zone E
2.3.6.5(a) Ground floor zone E
Ground Floor (non-peak)
Ground Floor (peak)
Table 2.3.6.5(b) Acoustic reading on ground floor zone E
Zone E is the toilet and wash area. It is quiet and empty during non-peak hour. Partition wall of the toilet
also blocks noise from the seating area. The sound reading increases during peak hour, when the area is
more in use due to more customers.
Project 1 Lighting and Acoustic Performance Evaluation and Design
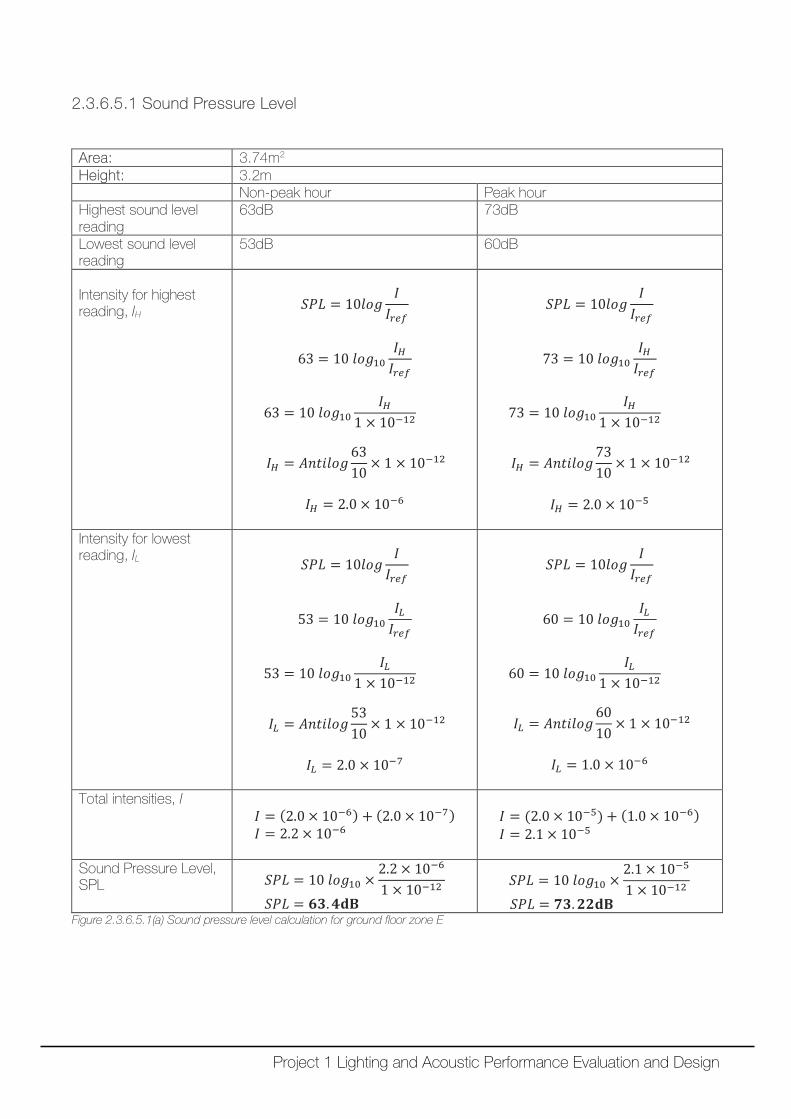
2.3.6.5.1 Sound Pressure Level Area: 3.74m2 Height: 3.2m Non-peak hour Peak hour Highest sound level reading
63dB 73dB
Lowest sound level reading
53dB 60dB
Intensity for highest reading, IH
𝑆𝑆𝑆𝑆𝑆𝑆 = 10𝑉𝑉𝑉𝑉𝑙𝑙𝐼𝐼𝐼𝐼𝑟𝑟𝑟𝑟𝑟𝑟
63 = 10 𝑉𝑉𝑉𝑉𝑙𝑙10𝐼𝐼𝐻𝐻𝐼𝐼𝑟𝑟𝑟𝑟𝑟𝑟
63 = 10 𝑉𝑉𝑉𝑉𝑙𝑙10𝐼𝐼𝐻𝐻
1 × 10⁻¹²
𝐼𝐼𝐻𝐻 = 𝐴𝐴𝐴𝐴𝐴𝐴𝐴𝐴𝑉𝑉𝑉𝑉𝑙𝑙6310
× 1 × 10−12
𝐼𝐼𝐻𝐻 = 2.0 × 10⁻⁶
𝑆𝑆𝑆𝑆𝑆𝑆 = 10𝑉𝑉𝑉𝑉𝑙𝑙𝐼𝐼𝐼𝐼𝑟𝑟𝑟𝑟𝑟𝑟
73 = 10 𝑉𝑉𝑉𝑉𝑙𝑙10𝐼𝐼𝐻𝐻𝐼𝐼𝑟𝑟𝑟𝑟𝑟𝑟
73 = 10 𝑉𝑉𝑉𝑉𝑙𝑙10𝐼𝐼𝐻𝐻
1 × 10⁻¹²
𝐼𝐼𝐻𝐻 = 𝐴𝐴𝐴𝐴𝐴𝐴𝐴𝐴𝑉𝑉𝑉𝑉𝑙𝑙7310
× 1 × 10−12
𝐼𝐼𝐻𝐻 = 2.0 × 10⁻⁵
Intensity for lowest reading, IL
𝑆𝑆𝑆𝑆𝑆𝑆 = 10𝑉𝑉𝑉𝑉𝑙𝑙𝐼𝐼𝐼𝐼𝑟𝑟𝑟𝑟𝑟𝑟
53 = 10 𝑉𝑉𝑉𝑉𝑙𝑙10𝐼𝐼𝐿𝐿𝐼𝐼𝑟𝑟𝑟𝑟𝑟𝑟
53 = 10 𝑉𝑉𝑉𝑉𝑙𝑙10𝐼𝐼𝐿𝐿
1 × 10⁻¹²
𝐼𝐼𝐿𝐿 = 𝐴𝐴𝐴𝐴𝐴𝐴𝐴𝐴𝑉𝑉𝑉𝑉𝑙𝑙5310
× 1 × 10−12
𝐼𝐼𝐿𝐿 = 2.0 × 10⁻⁷
𝑆𝑆𝑆𝑆𝑆𝑆 = 10𝑉𝑉𝑉𝑉𝑙𝑙𝐼𝐼𝐼𝐼𝑟𝑟𝑟𝑟𝑟𝑟
60 = 10 𝑉𝑉𝑉𝑉𝑙𝑙10𝐼𝐼𝐿𝐿𝐼𝐼𝑟𝑟𝑟𝑟𝑟𝑟
60 = 10 𝑉𝑉𝑉𝑉𝑙𝑙10𝐼𝐼𝐿𝐿
1 × 10⁻¹²
𝐼𝐼𝐿𝐿 = 𝐴𝐴𝐴𝐴𝐴𝐴𝐴𝐴𝑉𝑉𝑉𝑉𝑙𝑙6010
× 1 × 10−12
𝐼𝐼𝐿𝐿 = 1.0 × 10⁻⁶
Total intensities, I 𝐼𝐼 = (2.0 × 10⁻⁶) + (2.0 × 10⁻⁷) 𝐼𝐼 = 2.2 × 10⁻⁶
𝐼𝐼 = (2.0 × 10⁻⁵) + (1.0 × 10⁻⁶) 𝐼𝐼 = 2.1 × 10⁻⁵
Sound Pressure Level, SPL 𝑆𝑆𝑆𝑆𝑆𝑆 = 10 𝑉𝑉𝑉𝑉𝑙𝑙10 ×
2.2 × 10−6
1 × 10⁻¹²
𝑆𝑆𝑆𝑆𝑆𝑆 = 𝟔𝟔𝟔𝟔.𝟔𝟔𝐝𝐝𝐝𝐝
𝑆𝑆𝑆𝑆𝑆𝑆 = 10 𝑉𝑉𝑉𝑉𝑙𝑙10 ×2.1 × 10−5
1 × 10⁻¹²
𝑆𝑆𝑆𝑆𝑆𝑆 = 𝟕𝟕𝟔𝟔.𝟕𝟕𝟕𝟕𝐝𝐝𝐝𝐝 Figure 2.3.6.5.1(a) Sound pressure level calculation for ground floor zone E
Project 1 Lighting and Acoustic Performance Evaluation and Design
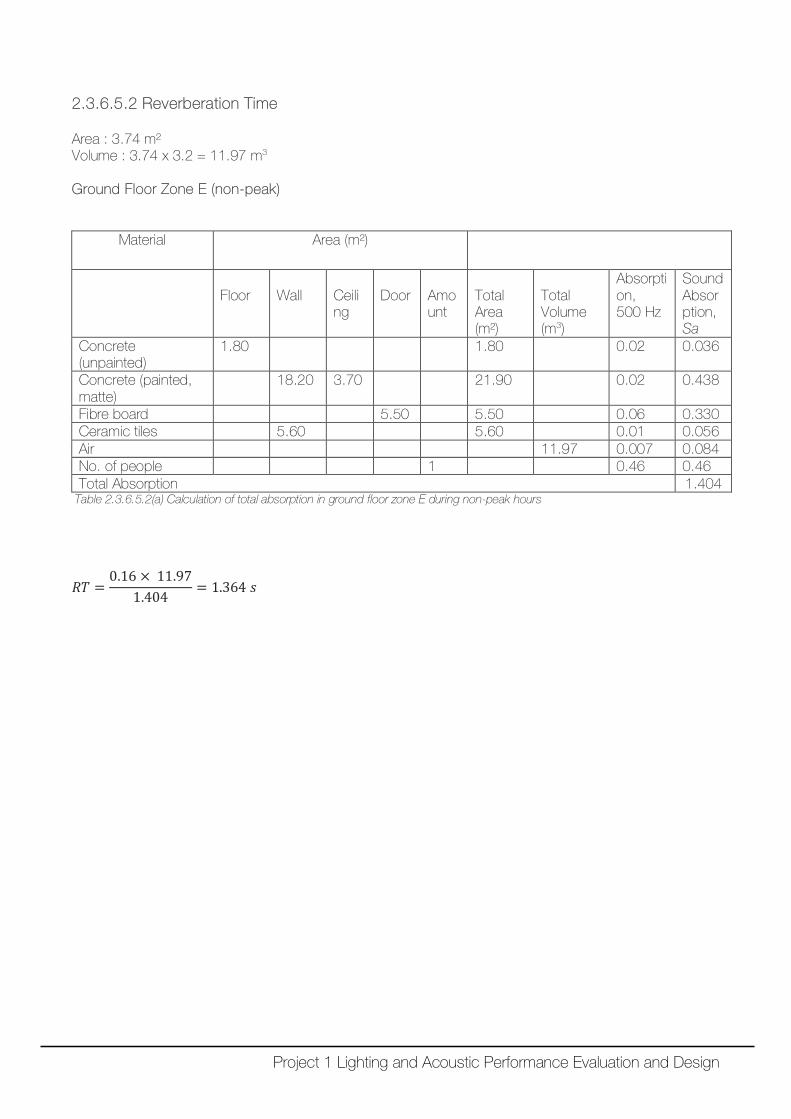
2.3.6.5.2 Reverberation Time Area : 3.74 m² Volume : 3.74 x 3.2 = 11.97 m3 Ground Floor Zone E (non-peak)
Material Area (m²)
Floor
Wall
Ceiling
Door
Amount
Total Area (m²)
Total Volume (m3)
Absorption, 500 Hz
Sound Absorption, Sa
Concrete (unpainted)
1.80 1.80 0.02 0.036
Concrete (painted, matte)
18.20 3.70 21.90 0.02 0.438
Fibre board 5.50 5.50 0.06 0.330 Ceramic tiles 5.60 5.60 0.01 0.056 Air 11.97 0.007 0.084 No. of people 1 0.46 0.46 Total Absorption 1.404
Table 2.3.6.5.2(a) Calculation of total absorption in ground floor zone E during non-peak hours
𝑅𝑅𝑅𝑅 =0.16 × 11.97
1.404= 1.364 𝑠𝑠
Project 1 Lighting and Acoustic Performance Evaluation and Design
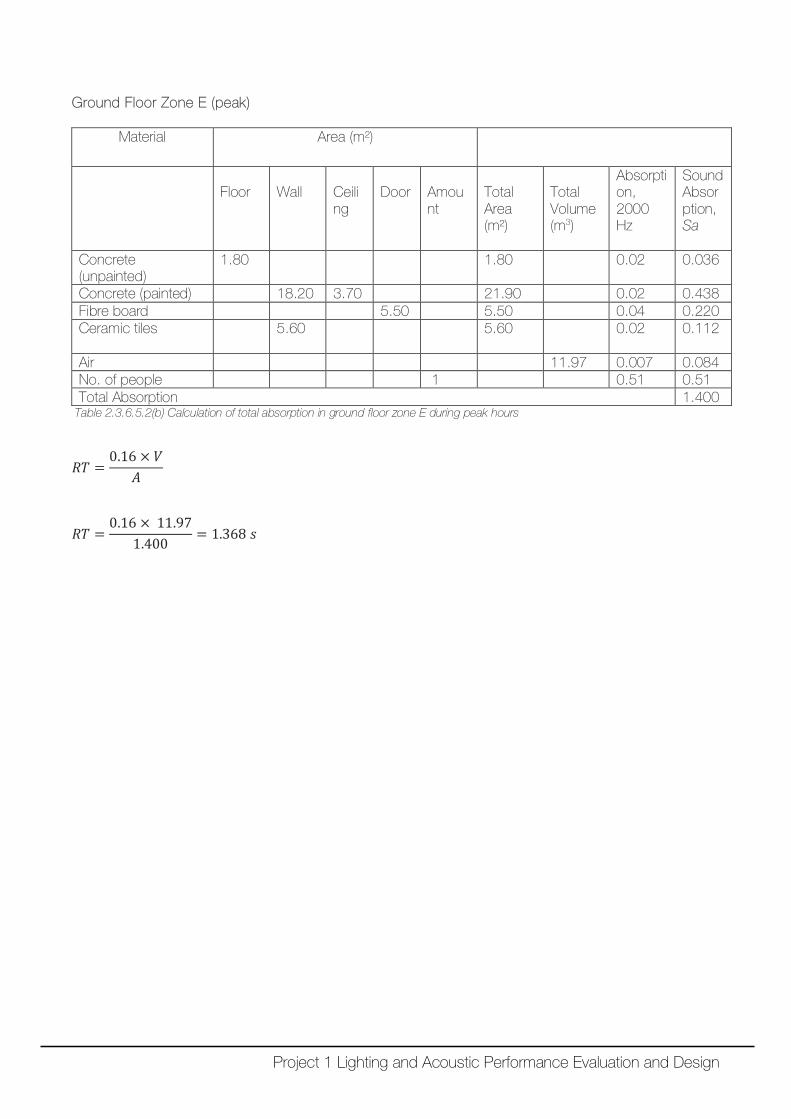
Ground Floor Zone E (peak)
Material Area (m²)
Floor
Wall
Ceiling
Door
Amount
Total Area (m²)
Total Volume (m3)
Absorption, 2000 Hz
Sound Absorption, Sa
Concrete (unpainted)
1.80 1.80 0.02 0.036
Concrete (painted) 18.20 3.70 21.90 0.02 0.438 Fibre board 5.50 5.50 0.04 0.220 Ceramic tiles 5.60 5.60 0.02 0.112
Air 11.97 0.007 0.084 No. of people 1 0.51 0.51 Total Absorption 1.400
Table 2.3.6.5.2(b) Calculation of total absorption in ground floor zone E during peak hours
𝑅𝑅𝑅𝑅 =0.16 × 𝑉𝑉
𝐴𝐴
𝑅𝑅𝑅𝑅 =0.16 × 11.97
1.400= 1.368 𝑠𝑠
Project 1 Lighting and Acoustic Performance Evaluation and Design
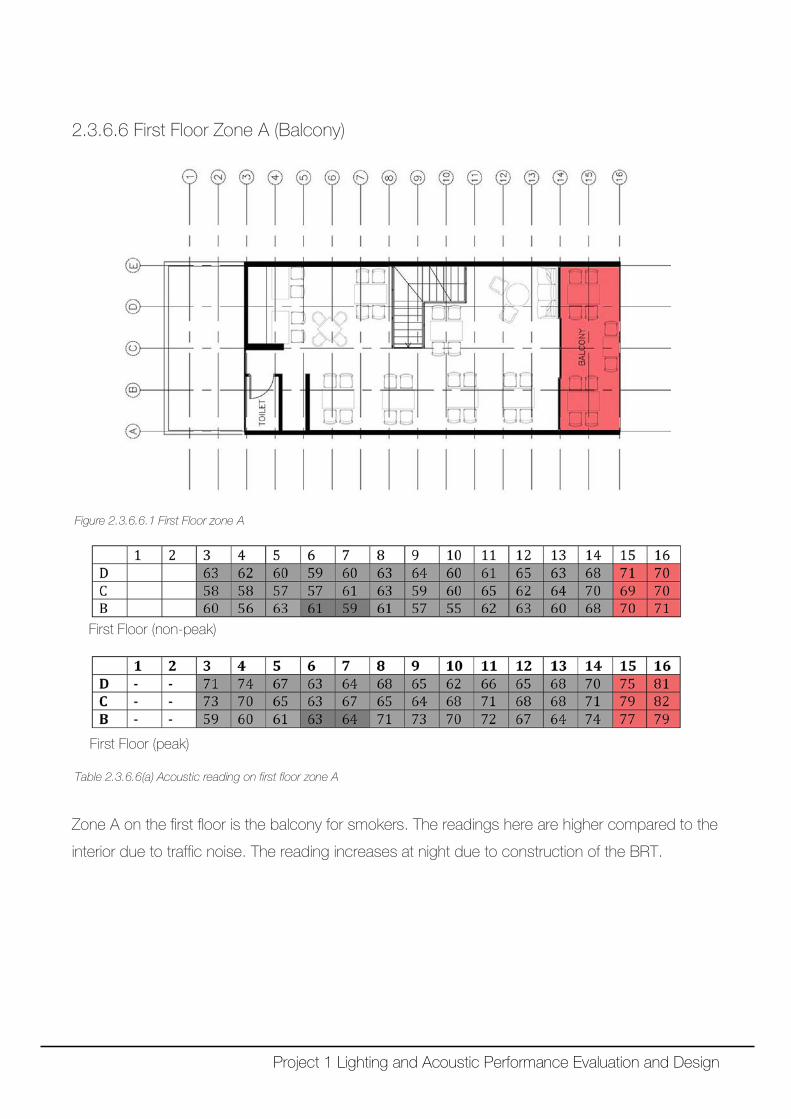
2.3.6.6 First Floor Zone A (Balcony)
Figure 2.3.6.6.1 First Floor zone A
First Floor (non-peak)
First Floor (peak) Table 2.3.6.6(a) Acoustic reading on first floor zone A
Zone A on the first floor is the balcony for smokers. The readings here are higher compared to the
interior due to traffic noise. The reading increases at night due to construction of the BRT.
Project 1 Lighting and Acoustic Performance Evaluation and Design
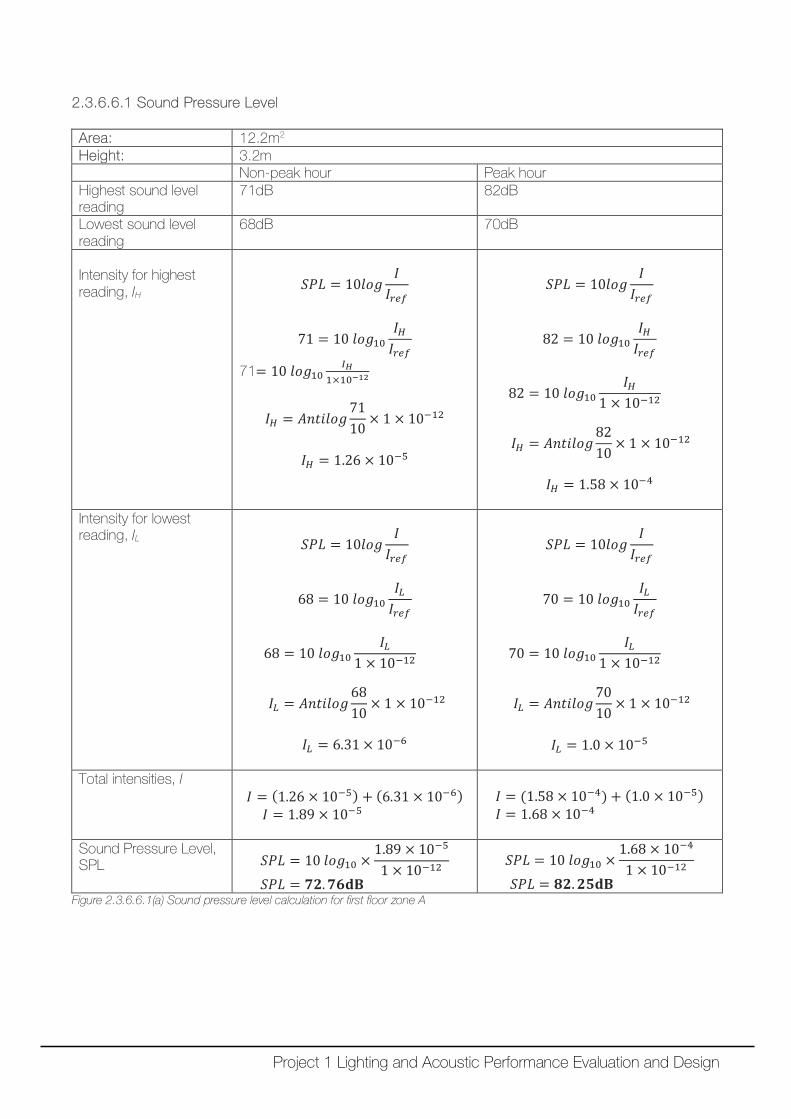
2.3.6.6.1 Sound Pressure Level Area: 12.2m2 Height: 3.2m Non-peak hour Peak hour Highest sound level reading
71dB 82dB
Lowest sound level reading
68dB 70dB
Intensity for highest reading, IH
𝑆𝑆𝑆𝑆𝑆𝑆 = 10𝑉𝑉𝑉𝑉𝑙𝑙𝐼𝐼𝐼𝐼𝑟𝑟𝑟𝑟𝑟𝑟
71 = 10 𝑉𝑉𝑉𝑉𝑙𝑙10𝐼𝐼𝐻𝐻𝐼𝐼𝑟𝑟𝑟𝑟𝑟𝑟
71= 10 𝑉𝑉𝑉𝑉𝑙𝑙10𝐼𝐼𝐻𝐻
1×10⁻¹²
𝐼𝐼𝐻𝐻 = 𝐴𝐴𝐴𝐴𝐴𝐴𝐴𝐴𝑉𝑉𝑉𝑉𝑙𝑙7110
× 1 × 10−12
𝐼𝐼𝐻𝐻 = 1.26 × 10⁻⁵
𝑆𝑆𝑆𝑆𝑆𝑆 = 10𝑉𝑉𝑉𝑉𝑙𝑙𝐼𝐼𝐼𝐼𝑟𝑟𝑟𝑟𝑟𝑟
82 = 10 𝑉𝑉𝑉𝑉𝑙𝑙10𝐼𝐼𝐻𝐻𝐼𝐼𝑟𝑟𝑟𝑟𝑟𝑟
82 = 10 𝑉𝑉𝑉𝑉𝑙𝑙10𝐼𝐼𝐻𝐻
1 × 10⁻¹²
𝐼𝐼𝐻𝐻 = 𝐴𝐴𝐴𝐴𝐴𝐴𝐴𝐴𝑉𝑉𝑉𝑉𝑙𝑙8210
× 1 × 10−12
𝐼𝐼𝐻𝐻 = 1.58 × 10⁻⁴
Intensity for lowest reading, IL
𝑆𝑆𝑆𝑆𝑆𝑆 = 10𝑉𝑉𝑉𝑉𝑙𝑙𝐼𝐼𝐼𝐼𝑟𝑟𝑟𝑟𝑟𝑟
68 = 10 𝑉𝑉𝑉𝑉𝑙𝑙10𝐼𝐼𝐿𝐿𝐼𝐼𝑟𝑟𝑟𝑟𝑟𝑟
68 = 10 𝑉𝑉𝑉𝑉𝑙𝑙10𝐼𝐼𝐿𝐿
1 × 10⁻¹²
𝐼𝐼𝐿𝐿 = 𝐴𝐴𝐴𝐴𝐴𝐴𝐴𝐴𝑉𝑉𝑉𝑉𝑙𝑙6810
× 1 × 10−12
𝐼𝐼𝐿𝐿 = 6.31 × 10⁻⁶
𝑆𝑆𝑆𝑆𝑆𝑆 = 10𝑉𝑉𝑉𝑉𝑙𝑙𝐼𝐼𝐼𝐼𝑟𝑟𝑟𝑟𝑟𝑟
70 = 10 𝑉𝑉𝑉𝑉𝑙𝑙10𝐼𝐼𝐿𝐿𝐼𝐼𝑟𝑟𝑟𝑟𝑟𝑟
70 = 10 𝑉𝑉𝑉𝑉𝑙𝑙10𝐼𝐼𝐿𝐿
1 × 10⁻¹²
𝐼𝐼𝐿𝐿 = 𝐴𝐴𝐴𝐴𝐴𝐴𝐴𝐴𝑉𝑉𝑉𝑉𝑙𝑙7010
× 1 × 10−12
𝐼𝐼𝐿𝐿 = 1.0 × 10⁻⁵
Total intensities, I 𝐼𝐼 = (1.26 × 10⁻⁵) + (6.31 × 10⁻⁶) 𝐼𝐼 = 1.89 × 10⁻⁵
𝐼𝐼 = (1.58 × 10⁻⁴) + (1.0 × 10⁻⁵) 𝐼𝐼 = 1.68 × 10⁻⁴
Sound Pressure Level, SPL 𝑆𝑆𝑆𝑆𝑆𝑆 = 10 𝑉𝑉𝑉𝑉𝑙𝑙10 ×
1.89 × 10−5
1 × 10⁻¹²
𝑆𝑆𝑆𝑆𝑆𝑆 = 𝟕𝟕𝟕𝟕.𝟕𝟕𝟔𝟔𝐝𝐝𝐝𝐝
𝑆𝑆𝑆𝑆𝑆𝑆 = 10 𝑉𝑉𝑉𝑉𝑙𝑙10 ×1.68 × 10−4
1 × 10⁻¹²
𝑆𝑆𝑆𝑆𝑆𝑆 = 𝟖𝟖𝟕𝟕.𝟕𝟕𝟓𝟓𝐝𝐝𝐝𝐝 Figure 2.3.6.6.1(a) Sound pressure level calculation for first floor zone A
Project 1 Lighting and Acoustic Performance Evaluation and Design
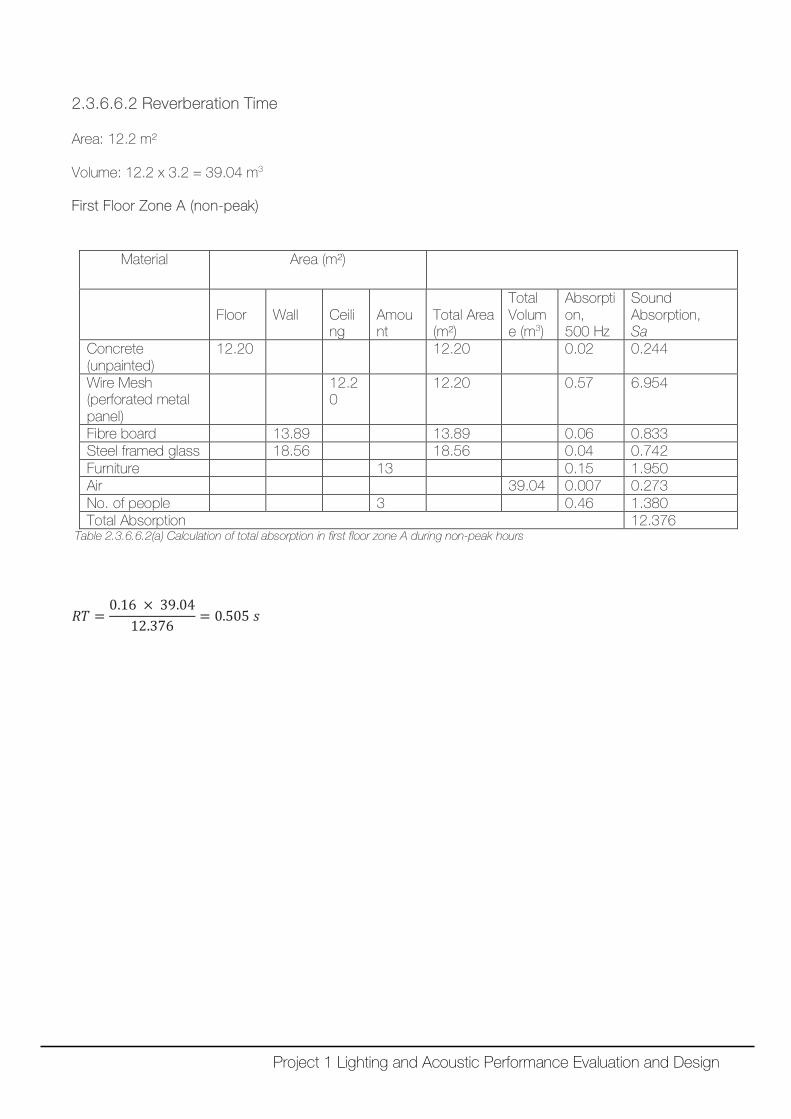
2.3.6.6.2 Reverberation Time Area: 12.2 m² Volume: 12.2 x 3.2 = 39.04 m3
First Floor Zone A (non-peak)
Table 2.3.6.6.2(a) Calculation of total absorption in first floor zone A during non-peak hours
𝑅𝑅𝑅𝑅 =0.16 × 39.04
12.376= 0.505 𝑠𝑠
Material Area (m²)
Floor
Wall
Ceiling
Amount
Total Area (m²)
Total Volume (m3)
Absorption, 500 Hz
Sound Absorption, Sa
Concrete (unpainted)
12.20 12.20 0.02 0.244
Wire Mesh (perforated metal panel)
12.20
12.20 0.57 6.954
Fibre board 13.89 13.89 0.06 0.833 Steel framed glass 18.56 18.56 0.04 0.742 Furniture 13 0.15 1.950 Air 39.04 0.007 0.273 No. of people 3 0.46 1.380 Total Absorption 12.376
Project 1 Lighting and Acoustic Performance Evaluation and Design
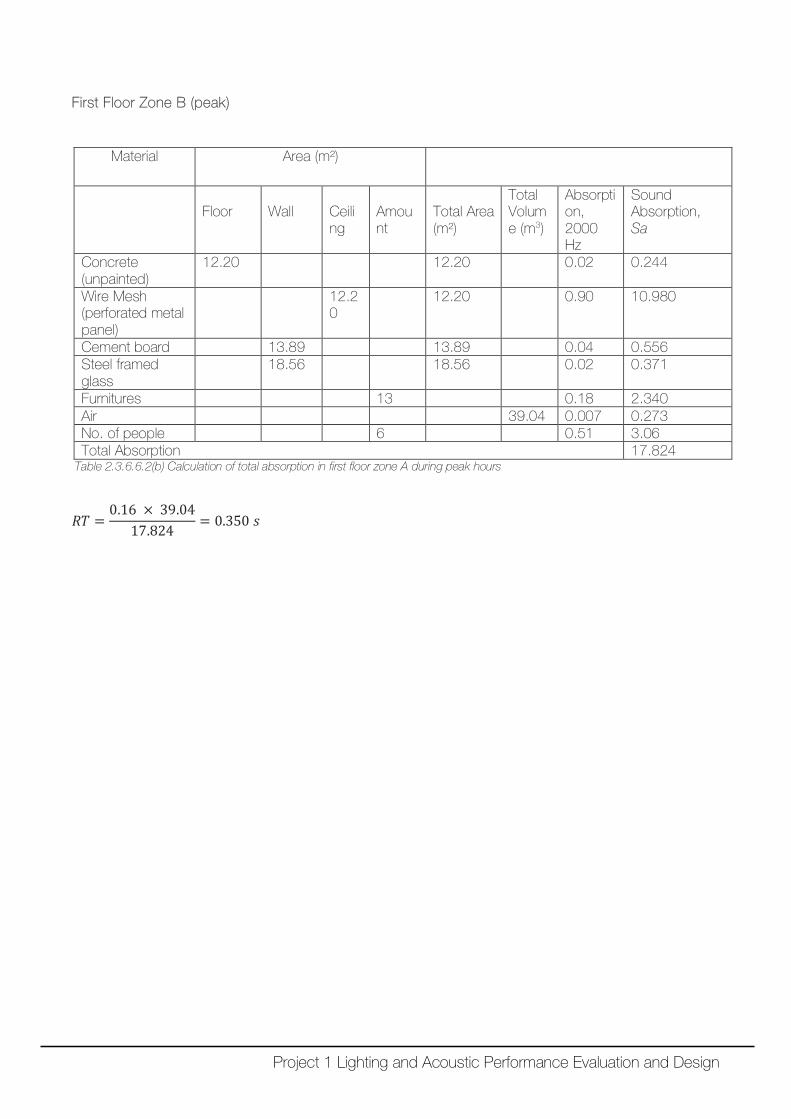
First Floor Zone B (peak)
Table 2.3.6.6.2(b) Calculation of total absorption in first floor zone A during peak hours
𝑅𝑅𝑅𝑅 =0.16 × 39.04
17.824= 0.350 𝑠𝑠
Material Area (m²)
Floor
Wall
Ceiling
Amount
Total Area (m²)
Total Volume (m3)
Absorption, 2000 Hz
Sound Absorption, Sa
Concrete (unpainted)
12.20 12.20 0.02 0.244
Wire Mesh (perforated metal panel)
12.20
12.20 0.90 10.980
Cement board 13.89 13.89 0.04 0.556 Steel framed glass
18.56 18.56 0.02 0.371
Furnitures 13 0.18 2.340 Air 39.04 0.007 0.273 No. of people 6 0.51 3.06 Total Absorption 17.824
Project 1 Lighting and Acoustic Performance Evaluation and Design
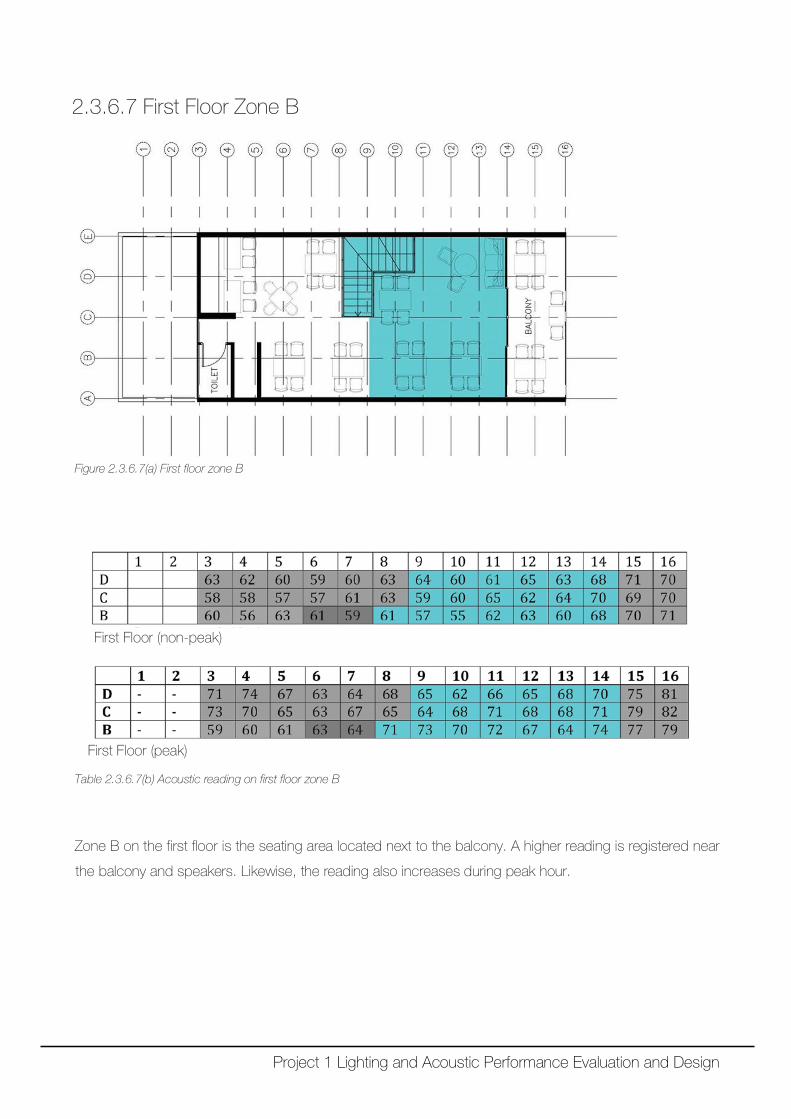
2.3.6.7 First Floor Zone B
Figure 2.3.6.7(a) First floor zone B
First Floor (non-peak)
First Floor (peak)
Table 2.3.6.7(b) Acoustic reading on first floor zone B
Zone B on the first floor is the seating area located next to the balcony. A higher reading is registered near
the balcony and speakers. Likewise, the reading also increases during peak hour.
Project 1 Lighting and Acoustic Performance Evaluation and Design
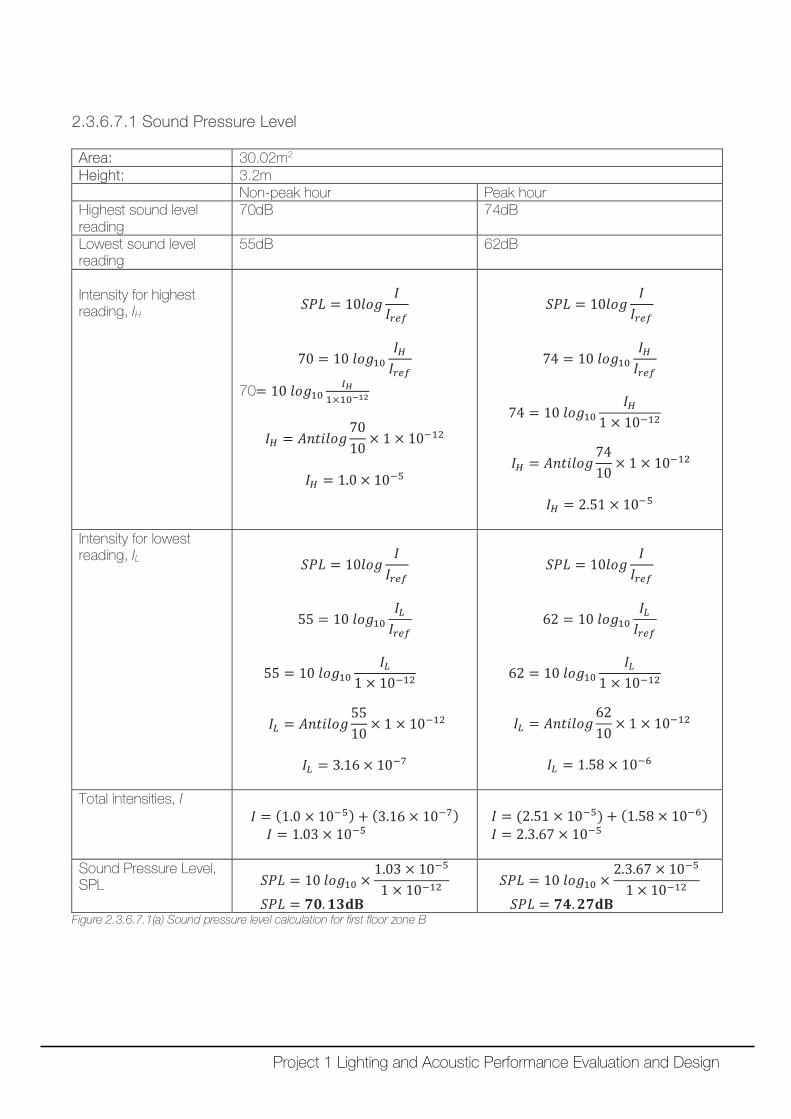
2.3.6.7.1 Sound Pressure Level Area: 30.02m2 Height: 3.2m Non-peak hour Peak hour Highest sound level reading
70dB 74dB
Lowest sound level reading
55dB 62dB
Intensity for highest reading, IH
𝑆𝑆𝑆𝑆𝑆𝑆 = 10𝑉𝑉𝑉𝑉𝑙𝑙𝐼𝐼𝐼𝐼𝑟𝑟𝑟𝑟𝑟𝑟
70 = 10 𝑉𝑉𝑉𝑉𝑙𝑙10𝐼𝐼𝐻𝐻𝐼𝐼𝑟𝑟𝑟𝑟𝑟𝑟
70= 10 𝑉𝑉𝑉𝑉𝑙𝑙10𝐼𝐼𝐻𝐻
1×10⁻¹²
𝐼𝐼𝐻𝐻 = 𝐴𝐴𝐴𝐴𝐴𝐴𝐴𝐴𝑉𝑉𝑉𝑉𝑙𝑙7010
× 1 × 10−12
𝐼𝐼𝐻𝐻 = 1.0 × 10⁻⁵
𝑆𝑆𝑆𝑆𝑆𝑆 = 10𝑉𝑉𝑉𝑉𝑙𝑙𝐼𝐼𝐼𝐼𝑟𝑟𝑟𝑟𝑟𝑟
74 = 10 𝑉𝑉𝑉𝑉𝑙𝑙10𝐼𝐼𝐻𝐻𝐼𝐼𝑟𝑟𝑟𝑟𝑟𝑟
74 = 10 𝑉𝑉𝑉𝑉𝑙𝑙10𝐼𝐼𝐻𝐻
1 × 10⁻¹²
𝐼𝐼𝐻𝐻 = 𝐴𝐴𝐴𝐴𝐴𝐴𝐴𝐴𝑉𝑉𝑉𝑉𝑙𝑙7410
× 1 × 10−12
𝐼𝐼𝐻𝐻 = 2.51 × 10⁻⁵
Intensity for lowest reading, IL
𝑆𝑆𝑆𝑆𝑆𝑆 = 10𝑉𝑉𝑉𝑉𝑙𝑙𝐼𝐼𝐼𝐼𝑟𝑟𝑟𝑟𝑟𝑟
55 = 10 𝑉𝑉𝑉𝑉𝑙𝑙10𝐼𝐼𝐿𝐿𝐼𝐼𝑟𝑟𝑟𝑟𝑟𝑟
55 = 10 𝑉𝑉𝑉𝑉𝑙𝑙10𝐼𝐼𝐿𝐿
1 × 10⁻¹²
𝐼𝐼𝐿𝐿 = 𝐴𝐴𝐴𝐴𝐴𝐴𝐴𝐴𝑉𝑉𝑉𝑉𝑙𝑙5510
× 1 × 10−12
𝐼𝐼𝐿𝐿 = 3.16 × 10⁻⁷
𝑆𝑆𝑆𝑆𝑆𝑆 = 10𝑉𝑉𝑉𝑉𝑙𝑙𝐼𝐼𝐼𝐼𝑟𝑟𝑟𝑟𝑟𝑟
62 = 10 𝑉𝑉𝑉𝑉𝑙𝑙10𝐼𝐼𝐿𝐿𝐼𝐼𝑟𝑟𝑟𝑟𝑟𝑟
62 = 10 𝑉𝑉𝑉𝑉𝑙𝑙10𝐼𝐼𝐿𝐿
1 × 10⁻¹²
𝐼𝐼𝐿𝐿 = 𝐴𝐴𝐴𝐴𝐴𝐴𝐴𝐴𝑉𝑉𝑉𝑉𝑙𝑙6210
× 1 × 10−12
𝐼𝐼𝐿𝐿 = 1.58 × 10⁻⁶
Total intensities, I 𝐼𝐼 = (1.0 × 10⁻⁵) + (3.16 × 10⁻⁷) 𝐼𝐼 = 1.03 × 10⁻⁵
𝐼𝐼 = (2.51 × 10⁻⁵) + (1.58 × 10⁻⁶) 𝐼𝐼 = 2.3.67 × 10−5
Sound Pressure Level, SPL 𝑆𝑆𝑆𝑆𝑆𝑆 = 10 𝑉𝑉𝑉𝑉𝑙𝑙10 ×
1.03 × 10−5
1 × 10⁻¹²
𝑆𝑆𝑆𝑆𝑆𝑆 = 𝟕𝟕𝟖𝟖.𝟏𝟏𝟔𝟔𝐝𝐝𝐝𝐝
𝑆𝑆𝑆𝑆𝑆𝑆 = 10 𝑉𝑉𝑉𝑉𝑙𝑙10 ×2.3.67 × 10−5
1 × 10⁻¹²
𝑆𝑆𝑆𝑆𝑆𝑆 = 𝟕𝟕𝟔𝟔.𝟕𝟕𝟕𝟕𝐝𝐝𝐝𝐝 Figure 2.3.6.7.1(a) Sound pressure level calculation for first floor zone B
Project 1 Lighting and Acoustic Performance Evaluation and Design
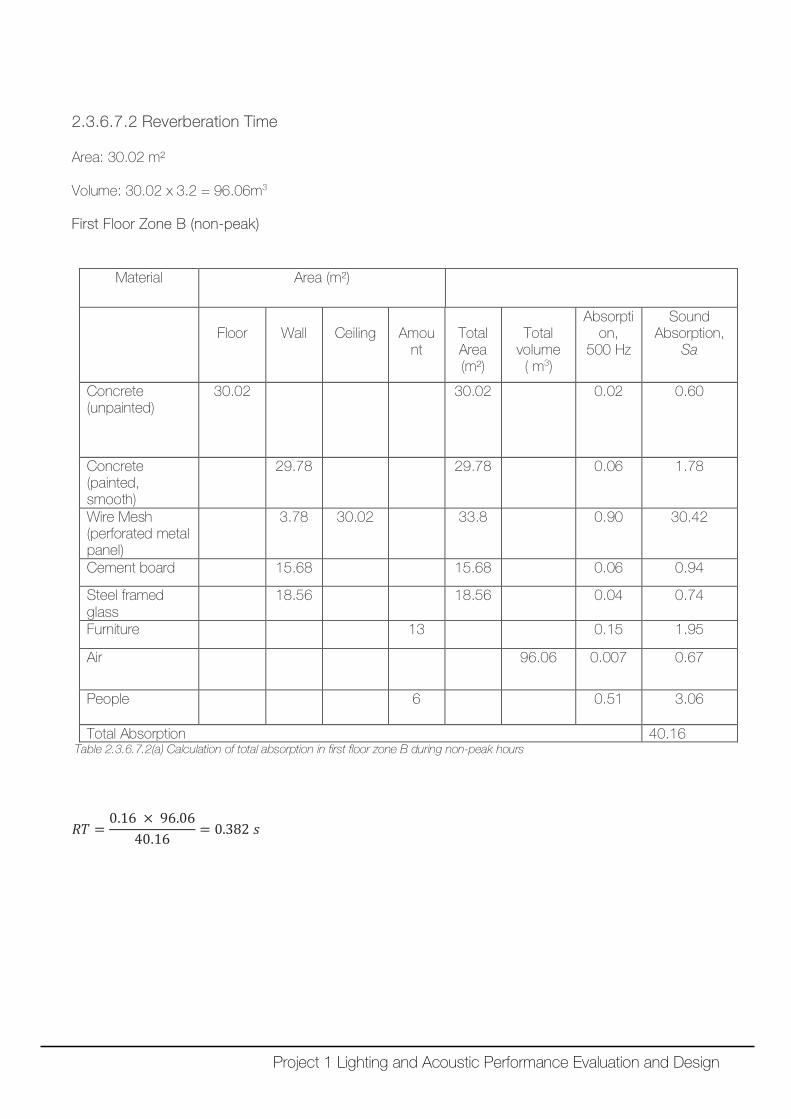
2.3.6.7.2 Reverberation Time Area: 30.02 m² Volume: 30.02 x 3.2 = 96.06m3
First Floor Zone B (non-peak)
Table 2.3.6.7.2(a) Calculation of total absorption in first floor zone B during non-peak hours
𝑅𝑅𝑅𝑅 =0.16 × 96.06
40.16= 0.382 𝑠𝑠
Material Area (m²)
Floor
Wall
Ceiling
Amou
nt
Total Area (m²)
Total
volume ( m3)
Absorption,
500 Hz
Sound Absorption,
Sa
Concrete (unpainted)
30.02 30.02 0.02 0.60
Concrete (painted, smooth)
29.78 29.78 0.06 1.78
Wire Mesh (perforated metal panel)
3.78 30.02 33.8 0.90 30.42
Cement board 15.68 15.68 0.06 0.94
Steel framed glass
18.56 18.56 0.04 0.74
Furniture 13 0.15 1.95
Air 96.06 0.007 0.67
People 6 0.51 3.06
Total Absorption 40.16
Project 1 Lighting and Acoustic Performance Evaluation and Design
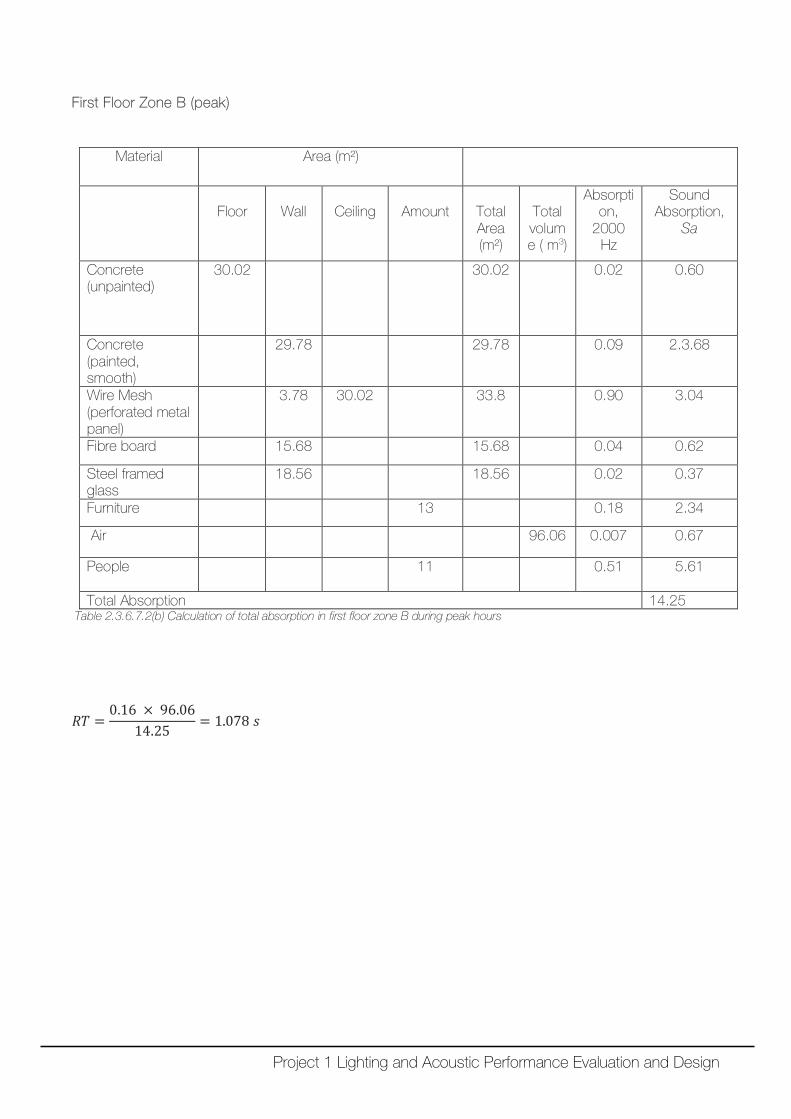
First Floor Zone B (peak)
Table 2.3.6.7.2(b) Calculation of total absorption in first floor zone B during peak hours
𝑅𝑅𝑅𝑅 =0.16 × 96.06
14.25= 1.078 𝑠𝑠
Material Area (m²)
Floor
Wall
Ceiling
Amount
Total Area (m²)
Total volume ( m3)
Absorption,
2000 Hz
Sound Absorption,
Sa
Concrete (unpainted)
30.02 30.02 0.02 0.60
Concrete (painted, smooth)
29.78 29.78 0.09 2.3.68
Wire Mesh (perforated metal panel)
3.78 30.02 33.8 0.90 3.04
Fibre board 15.68 15.68 0.04 0.62
Steel framed glass
18.56 18.56 0.02 0.37
Furniture 13 0.18 2.34
Air 96.06 0.007 0.67
People 11 0.51 5.61
Total Absorption 14.25
Project 1 Lighting and Acoustic Performance Evaluation and Design
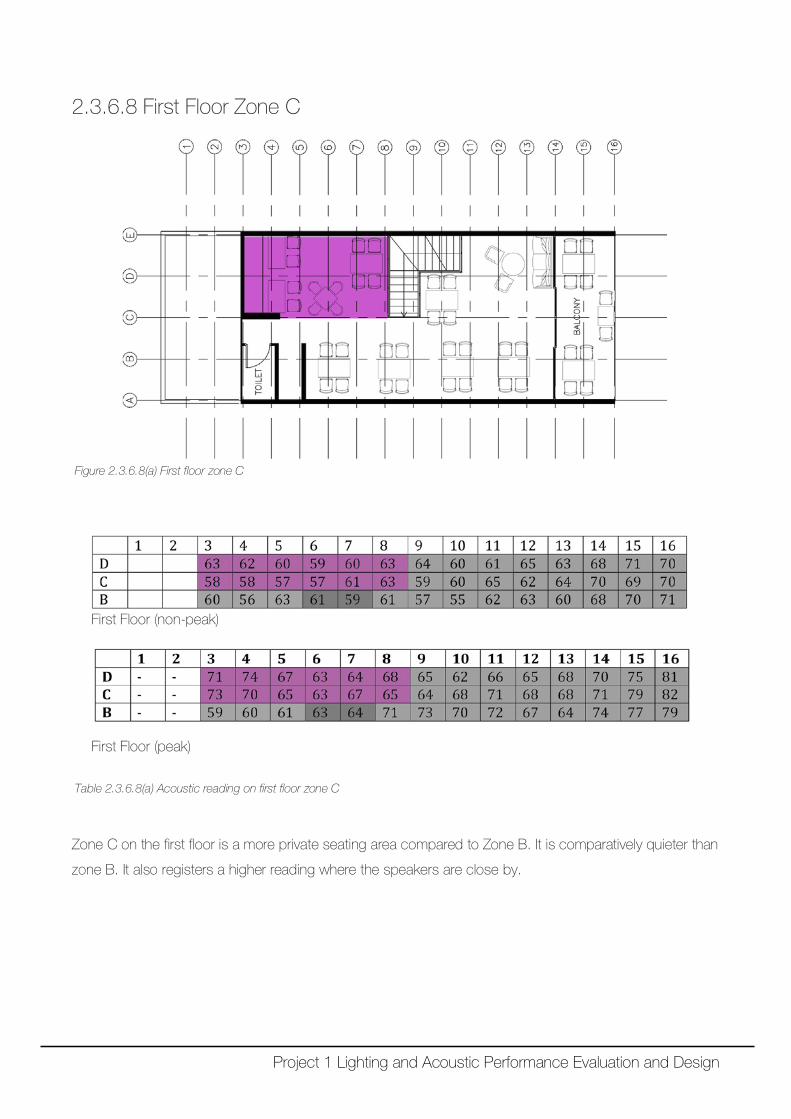
2.3.6.8 First Floor Zone C
Figure 2.3.6.8(a) First floor zone C
First Floor (non-peak)
First Floor (peak)
Table 2.3.6.8(a) Acoustic reading on first floor zone C
Zone C on the first floor is a more private seating area compared to Zone B. It is comparatively quieter than
zone B. It also registers a higher reading where the speakers are close by.
Project 1 Lighting and Acoustic Performance Evaluation and Design
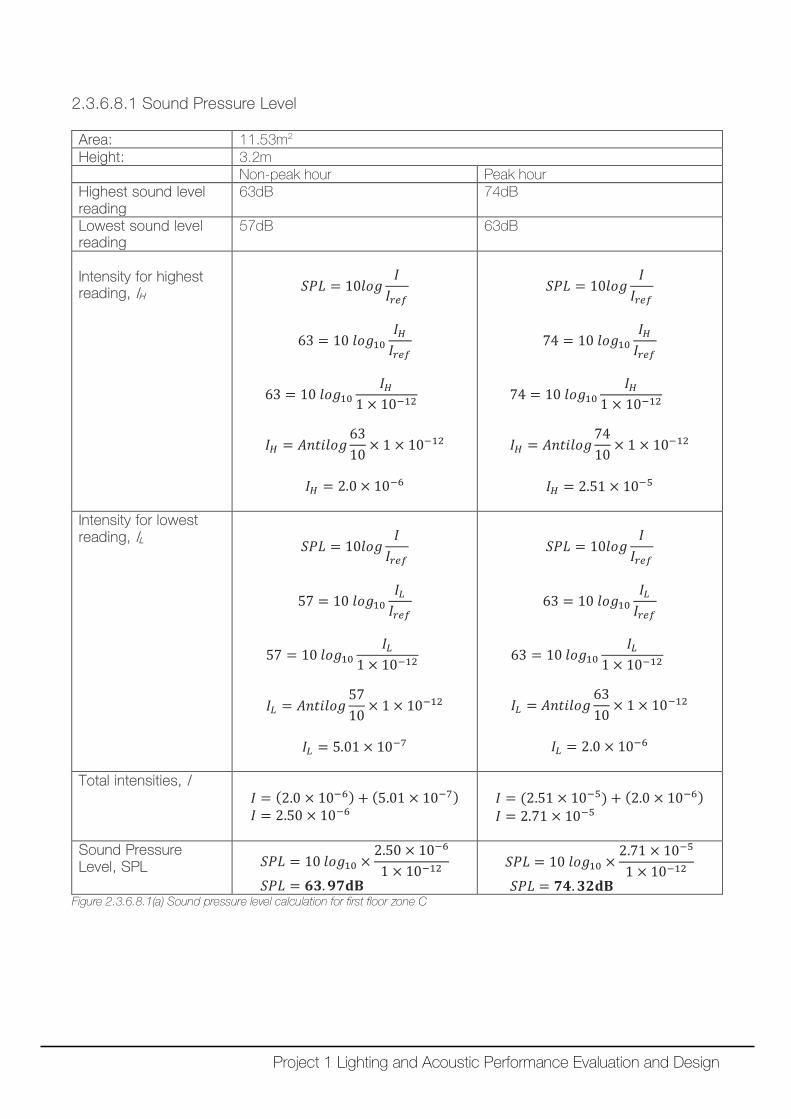
2.3.6.8.1 Sound Pressure Level Area: 11.53m2 Height: 3.2m Non-peak hour Peak hour Highest sound level reading
63dB 74dB
Lowest sound level reading
57dB 63dB
Intensity for highest reading, IH
𝑆𝑆𝑆𝑆𝑆𝑆 = 10𝑉𝑉𝑉𝑉𝑙𝑙𝐼𝐼𝐼𝐼𝑟𝑟𝑟𝑟𝑟𝑟
63 = 10 𝑉𝑉𝑉𝑉𝑙𝑙10𝐼𝐼𝐻𝐻𝐼𝐼𝑟𝑟𝑟𝑟𝑟𝑟
63 = 10 𝑉𝑉𝑉𝑉𝑙𝑙10𝐼𝐼𝐻𝐻
1 × 10⁻¹²
𝐼𝐼𝐻𝐻 = 𝐴𝐴𝐴𝐴𝐴𝐴𝐴𝐴𝑉𝑉𝑉𝑉𝑙𝑙6310
× 1 × 10−12
𝐼𝐼𝐻𝐻 = 2.0 × 10⁻⁶
𝑆𝑆𝑆𝑆𝑆𝑆 = 10𝑉𝑉𝑉𝑉𝑙𝑙𝐼𝐼𝐼𝐼𝑟𝑟𝑟𝑟𝑟𝑟
74 = 10 𝑉𝑉𝑉𝑉𝑙𝑙10𝐼𝐼𝐻𝐻𝐼𝐼𝑟𝑟𝑟𝑟𝑟𝑟
74 = 10 𝑉𝑉𝑉𝑉𝑙𝑙10𝐼𝐼𝐻𝐻
1 × 10⁻¹²
𝐼𝐼𝐻𝐻 = 𝐴𝐴𝐴𝐴𝐴𝐴𝐴𝐴𝑉𝑉𝑉𝑉𝑙𝑙7410
× 1 × 10−12
𝐼𝐼𝐻𝐻 = 2.51 × 10⁻⁵
Intensity for lowest reading, IL
𝑆𝑆𝑆𝑆𝑆𝑆 = 10𝑉𝑉𝑉𝑉𝑙𝑙𝐼𝐼𝐼𝐼𝑟𝑟𝑟𝑟𝑟𝑟
57 = 10 𝑉𝑉𝑉𝑉𝑙𝑙10𝐼𝐼𝐿𝐿𝐼𝐼𝑟𝑟𝑟𝑟𝑟𝑟
57 = 10 𝑉𝑉𝑉𝑉𝑙𝑙10𝐼𝐼𝐿𝐿
1 × 10⁻¹²
𝐼𝐼𝐿𝐿 = 𝐴𝐴𝐴𝐴𝐴𝐴𝐴𝐴𝑉𝑉𝑉𝑉𝑙𝑙5710
× 1 × 10−12
𝐼𝐼𝐿𝐿 = 5.01 × 10⁻⁷
𝑆𝑆𝑆𝑆𝑆𝑆 = 10𝑉𝑉𝑉𝑉𝑙𝑙𝐼𝐼𝐼𝐼𝑟𝑟𝑟𝑟𝑟𝑟
63 = 10 𝑉𝑉𝑉𝑉𝑙𝑙10𝐼𝐼𝐿𝐿𝐼𝐼𝑟𝑟𝑟𝑟𝑟𝑟
63 = 10 𝑉𝑉𝑉𝑉𝑙𝑙10𝐼𝐼𝐿𝐿
1 × 10⁻¹²
𝐼𝐼𝐿𝐿 = 𝐴𝐴𝐴𝐴𝐴𝐴𝐴𝐴𝑉𝑉𝑉𝑉𝑙𝑙6310
× 1 × 10−12
𝐼𝐼𝐿𝐿 = 2.0 × 10⁻⁶
Total intensities, I 𝐼𝐼 = (2.0 × 10⁻⁶) + (5.01 × 10⁻⁷) 𝐼𝐼 = 2.50 × 10⁻⁶
𝐼𝐼 = (2.51 × 10⁻⁵) + (2.0 × 10⁻⁶) 𝐼𝐼 = 2.71 × 10⁻⁵
Sound Pressure Level, SPL 𝑆𝑆𝑆𝑆𝑆𝑆 = 10 𝑉𝑉𝑉𝑉𝑙𝑙10 ×
2.50 × 10−6
1 × 10⁻¹²
𝑆𝑆𝑆𝑆𝑆𝑆 = 𝟔𝟔𝟔𝟔.𝟏𝟏𝟕𝟕𝐝𝐝𝐝𝐝
𝑆𝑆𝑆𝑆𝑆𝑆 = 10 𝑉𝑉𝑉𝑉𝑙𝑙10 ×2.71 × 10−5
1 × 10⁻¹²
𝑆𝑆𝑆𝑆𝑆𝑆 = 𝟕𝟕𝟔𝟔.𝟔𝟔𝟕𝟕𝐝𝐝𝐝𝐝 Figure 2.3.6.8.1(a) Sound pressure level calculation for first floor zone C
Project 1 Lighting and Acoustic Performance Evaluation and Design
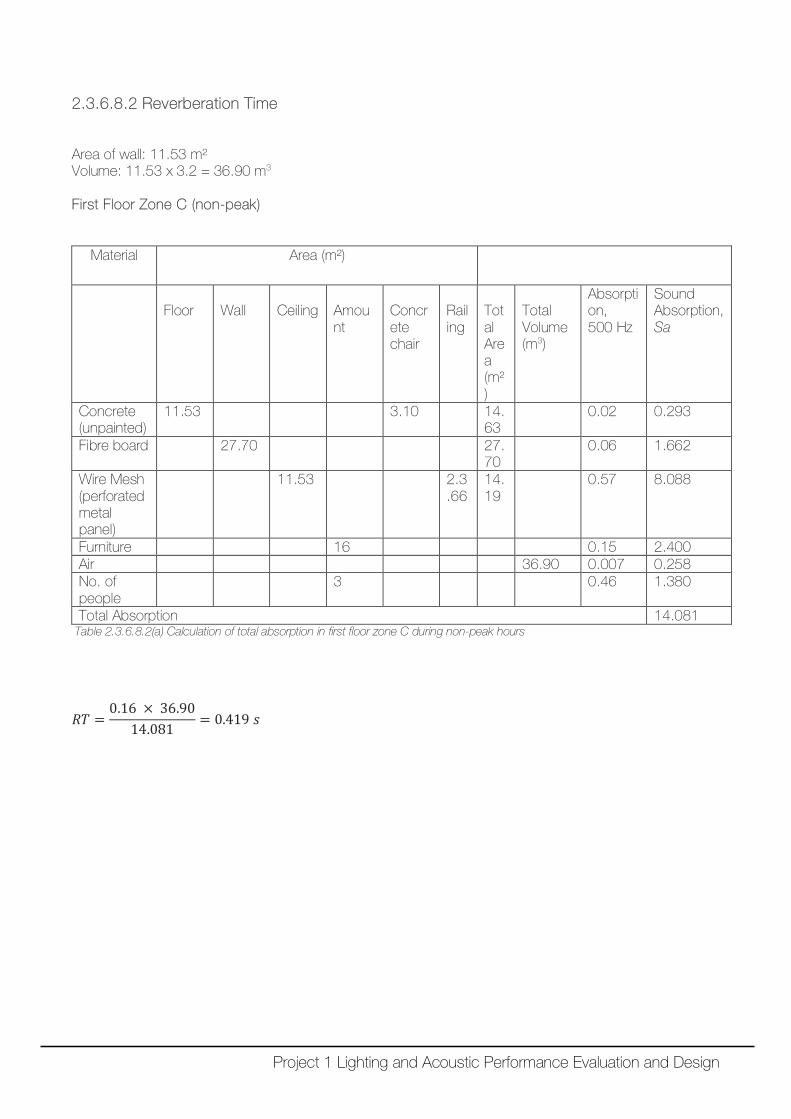
2.3.6.8.2 Reverberation Time Area of wall: 11.53 m² Volume: 11.53 x 3.2 = 36.90 m3
First Floor Zone C (non-peak)
Material Area (m²)
Floor
Wall
Ceiling
Amount
Concrete chair
Railing
Total Area (m²)
Total Volume (m3)
Absorption, 500 Hz
Sound Absorption, Sa
Concrete (unpainted)
11.53 3.10 14.63
0.02 0.293
Fibre board 27.70 27.70
0.06 1.662
Wire Mesh (perforated metal panel)
11.53 2.3.66
14.19
0.57 8.088
Furniture 16 0.15 2.400 Air 36.90 0.007 0.258 No. of people
3 0.46 1.380
Total Absorption 14.081 Table 2.3.6.8.2(a) Calculation of total absorption in first floor zone C during non-peak hours
𝑅𝑅𝑅𝑅 =0.16 × 36.90
14.081= 0.419 𝑠𝑠
Project 1 Lighting and Acoustic Performance Evaluation and Design
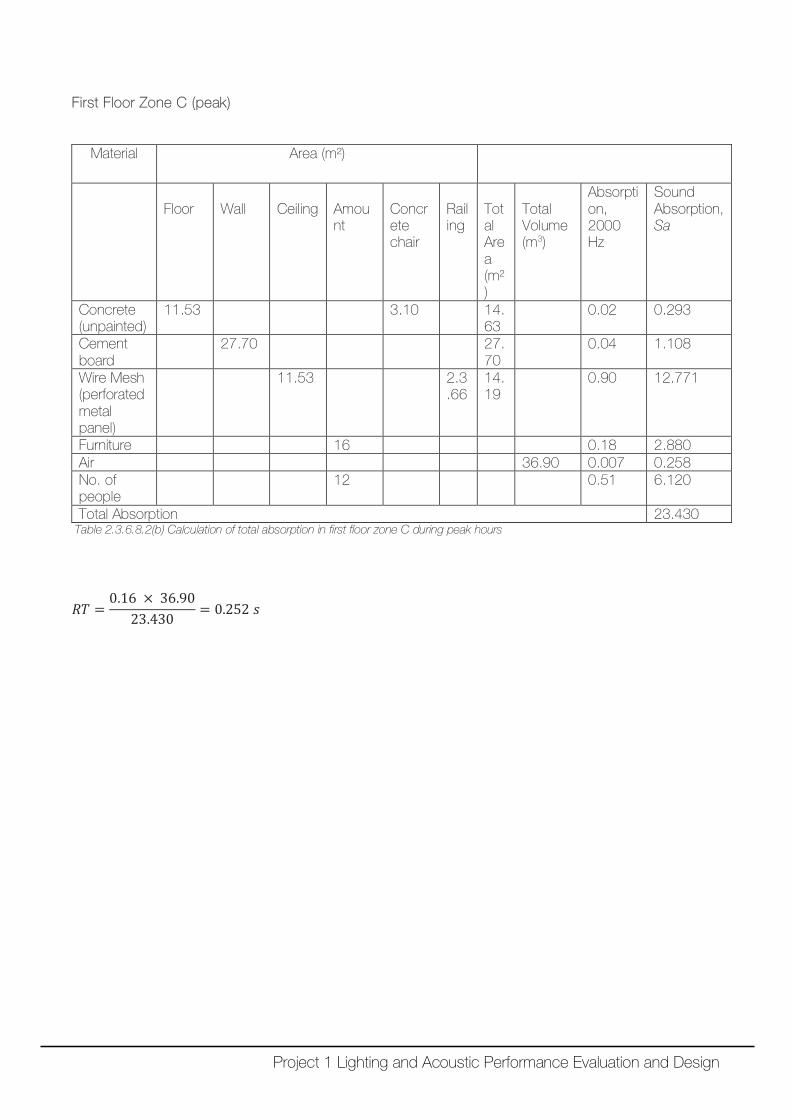
First Floor Zone C (peak)
Material Area (m²)
Floor
Wall
Ceiling
Amount
Concrete chair
Railing
Total Area (m²)
Total Volume (m3)
Absorption, 2000 Hz
Sound Absorption, Sa
Concrete (unpainted)
11.53 3.10 14.63
0.02 0.293
Cement board
27.70 27.70
0.04 1.108
Wire Mesh (perforated metal panel)
11.53 2.3.66
14.19
0.90 12.771
Furniture 16 0.18 2.880 Air 36.90 0.007 0.258 No. of people
12 0.51 6.120
Total Absorption 23.430 Table 2.3.6.8.2(b) Calculation of total absorption in first floor zone C during peak hours
𝑅𝑅𝑅𝑅 =0.16 × 36.90
23.430= 0.252 𝑠𝑠
Project 1 Lighting and Acoustic Performance Evaluation and Design
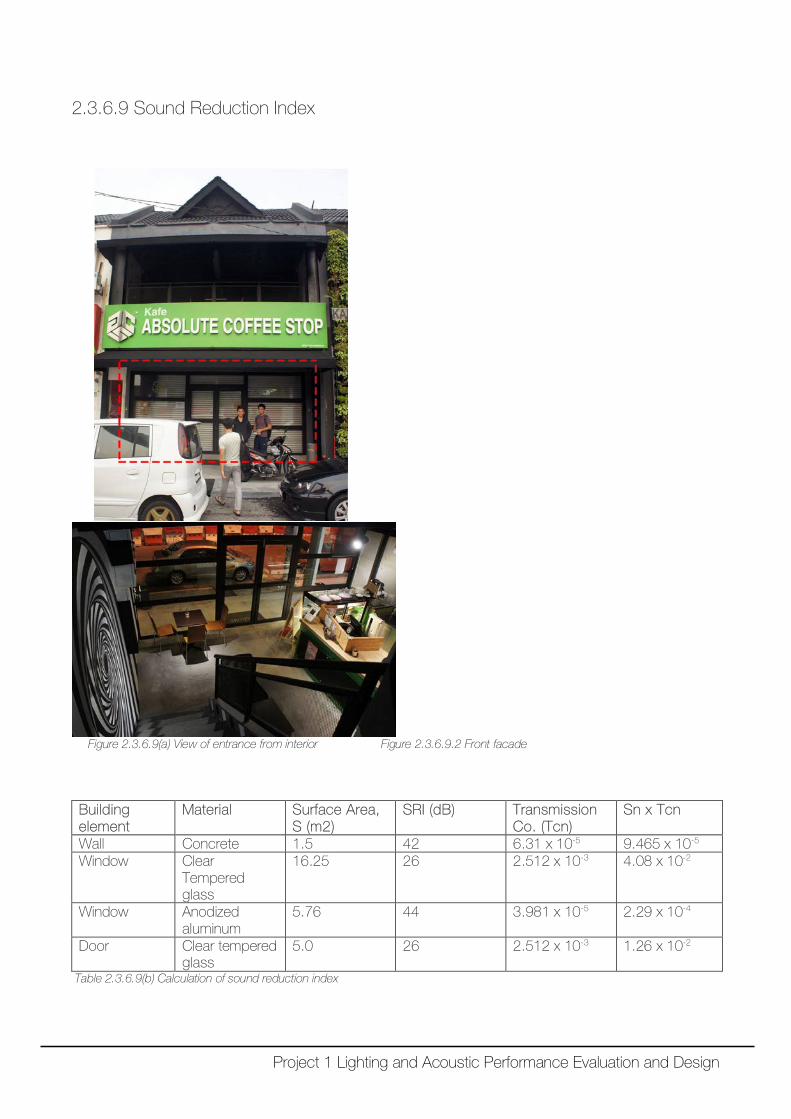
2.3.6.9 Sound Reduction Index
Figure 2.3.6.9(a) View of entrance from interior Figure 2.3.6.9.2 Front facade
Building element
Material Surface Area, S (m2)
SRI (dB) Transmission Co. (Tcn)
Sn x Tcn
Wall Concrete 1.5 42 6.31 x 10⁻⁵ 9.465 x 10⁻⁵ Window Clear
Tempered glass
16.25 26 2.512 x 10⁻³ 4.08 x 10⁻²
Window Anodized aluminum
5.76 44 3.981 x 10⁻⁵ 2.29 x 10⁻⁴
Door Clear tempered glass
5.0 26 2.512 x 10⁻³ 1.26 x 10⁻²
Table 2.3.6.9(b) Calculation of sound reduction index
Project 1 Lighting and Acoustic Performance Evaluation and Design
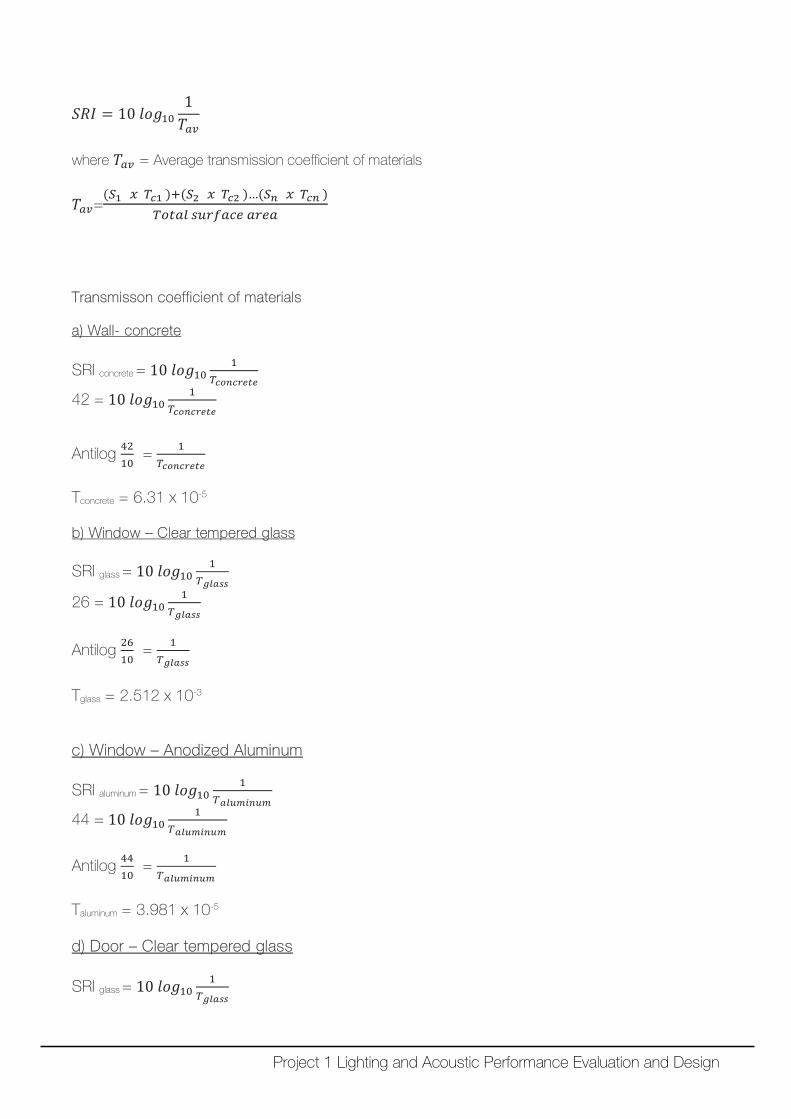
𝑆𝑆𝑅𝑅𝐼𝐼 = 10 𝑉𝑉𝑉𝑉𝑙𝑙101𝑅𝑅𝑎𝑎𝑎𝑎
where 𝑅𝑅𝑎𝑎𝑎𝑎 = Average transmission coefficient of materials
𝑅𝑅𝑎𝑎𝑎𝑎=(𝑆𝑆1 𝑥𝑥 𝑇𝑇𝑐𝑐1 )+(𝑆𝑆2 𝑥𝑥 𝑇𝑇𝑐𝑐2 )…(𝑆𝑆𝑛𝑛 𝑥𝑥 𝑇𝑇𝑐𝑐𝑛𝑛 )
𝑇𝑇𝑇𝑇𝑇𝑇𝑎𝑎𝑇𝑇 𝑠𝑠𝑠𝑠𝑟𝑟𝑟𝑟𝑎𝑎𝑠𝑠𝑟𝑟 𝑎𝑎𝑟𝑟𝑟𝑟𝑎𝑎
Transmisson coefficient of materials a) Wall- concrete SRI concrete = 10 𝑉𝑉𝑉𝑉𝑙𝑙10
1𝑇𝑇𝑐𝑐𝑐𝑐𝑛𝑛𝑐𝑐𝑐𝑐𝑐𝑐𝑐𝑐𝑐𝑐
42 = 10 𝑉𝑉𝑉𝑉𝑙𝑙101
𝑇𝑇𝑐𝑐𝑐𝑐𝑛𝑛𝑐𝑐𝑐𝑐𝑐𝑐𝑐𝑐𝑐𝑐
Antilog 4210
= 1
𝑇𝑇𝑐𝑐𝑐𝑐𝑛𝑛𝑐𝑐𝑐𝑐𝑐𝑐𝑐𝑐𝑐𝑐
Tconcrete = 6.31 x 10⁻⁵
b) Window – Clear tempered glass
SRI glass = 10 𝑉𝑉𝑉𝑉𝑙𝑙101
𝑇𝑇𝑔𝑔𝑔𝑔𝑔𝑔𝑔𝑔𝑔𝑔
26 = 10 𝑉𝑉𝑉𝑉𝑙𝑙101
𝑇𝑇𝑔𝑔𝑔𝑔𝑔𝑔𝑔𝑔𝑔𝑔
Antilog 2610
= 1
𝑇𝑇𝑔𝑔𝑔𝑔𝑔𝑔𝑔𝑔𝑔𝑔
Tglass = 2.512 x 10⁻³
c) Window – Anodized Aluminum
SRI aluminum = 10 𝑉𝑉𝑉𝑉𝑙𝑙101
𝑇𝑇𝑔𝑔𝑔𝑔𝑎𝑎𝑎𝑎𝑎𝑎𝑛𝑛𝑎𝑎𝑎𝑎
44 = 10 𝑉𝑉𝑉𝑉𝑙𝑙101
𝑇𝑇𝑔𝑔𝑔𝑔𝑎𝑎𝑎𝑎𝑎𝑎𝑛𝑛𝑎𝑎𝑎𝑎
Antilog 4410
= 1
𝑇𝑇𝑔𝑔𝑔𝑔𝑎𝑎𝑎𝑎𝑎𝑎𝑛𝑛𝑎𝑎𝑎𝑎
Taluminum = 3.981 x 10⁻⁵
d) Door – Clear tempered glass
SRI glass = 10 𝑉𝑉𝑉𝑉𝑙𝑙101
𝑇𝑇𝑔𝑔𝑔𝑔𝑔𝑔𝑔𝑔𝑔𝑔
Project 1 Lighting and Acoustic Performance Evaluation and Design
44 = 10 𝑉𝑉𝑉𝑉𝑙𝑙101
𝑇𝑇𝑔𝑔𝑔𝑔𝑔𝑔𝑔𝑔𝑔𝑔
Antilog 4410
= 1
𝑇𝑇𝑔𝑔𝑔𝑔𝑔𝑔𝑔𝑔𝑔𝑔
Taluminum = 2.512 x 10⁻³
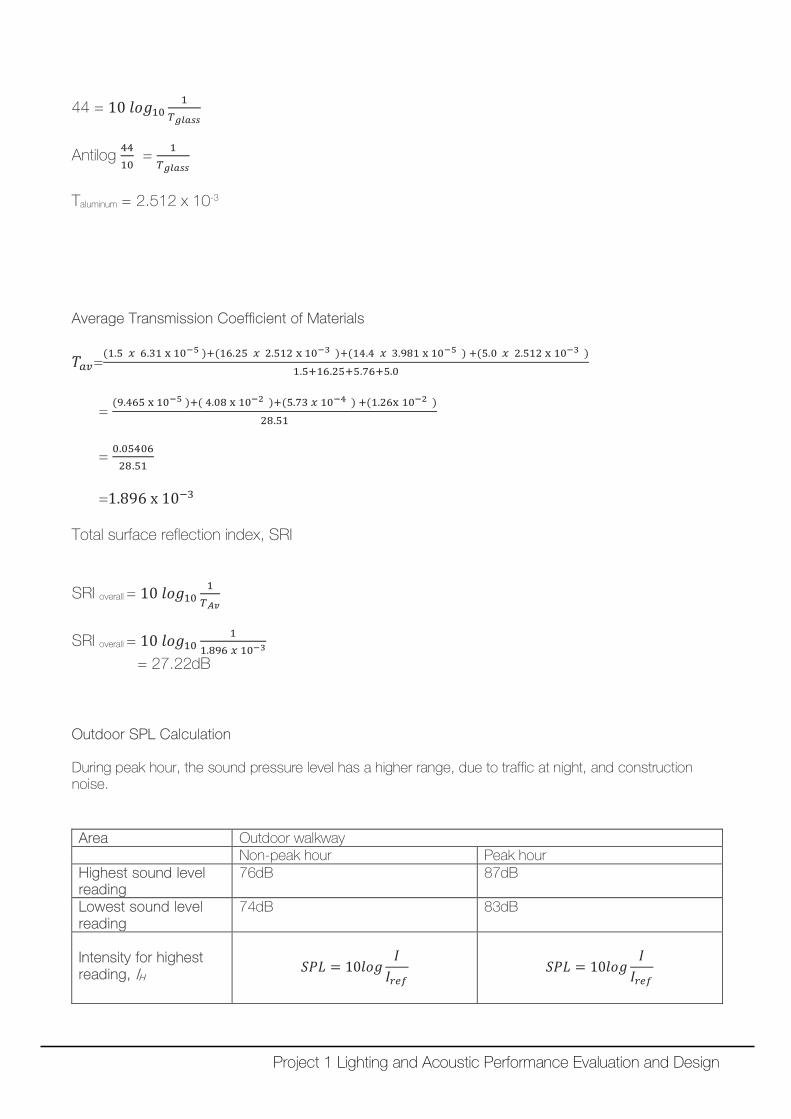
Average Transmission Coefficient of Materials
𝑅𝑅𝑎𝑎𝑎𝑎=(1.5 𝑥𝑥 6.31 x 10⁻⁵ )+(16.25 𝑥𝑥 2.512 x 10⁻³ )+(14.4 𝑥𝑥 3.981 x 10⁻⁵ ) +(5.0 𝑥𝑥 2.512 x 10⁻³ )
1.5+16.25+5.76+5.0
= (9.465 x 10⁻⁵ )+( 4.08 x 10⁻² )+(5.73 𝑥𝑥 10−4 ) +(1.26x 10⁻² )
28.51
=
0.0540628.51
=1.896 x 10⁻³ Total surface reflection index, SRI SRI overall = 10 𝑉𝑉𝑉𝑉𝑙𝑙10
1𝑇𝑇𝐴𝐴𝐴𝐴
SRI overall = 10 𝑉𝑉𝑉𝑉𝑙𝑙10
11.896 𝑥𝑥 10−3
= 27.22dB
Outdoor SPL Calculation During peak hour, the sound pressure level has a higher range, due to traffic at night, and construction noise. Area Outdoor walkway Non-peak hour Peak hour Highest sound level reading
76dB 87dB
Lowest sound level reading
74dB 83dB
Intensity for highest reading, IH
𝑆𝑆𝑆𝑆𝑆𝑆 = 10𝑉𝑉𝑉𝑉𝑙𝑙𝐼𝐼𝐼𝐼𝑟𝑟𝑟𝑟𝑟𝑟
𝑆𝑆𝑆𝑆𝑆𝑆 = 10𝑉𝑉𝑉𝑉𝑙𝑙𝐼𝐼𝐼𝐼𝑟𝑟𝑟𝑟𝑟𝑟
Project 1 Lighting and Acoustic Performance Evaluation and Design
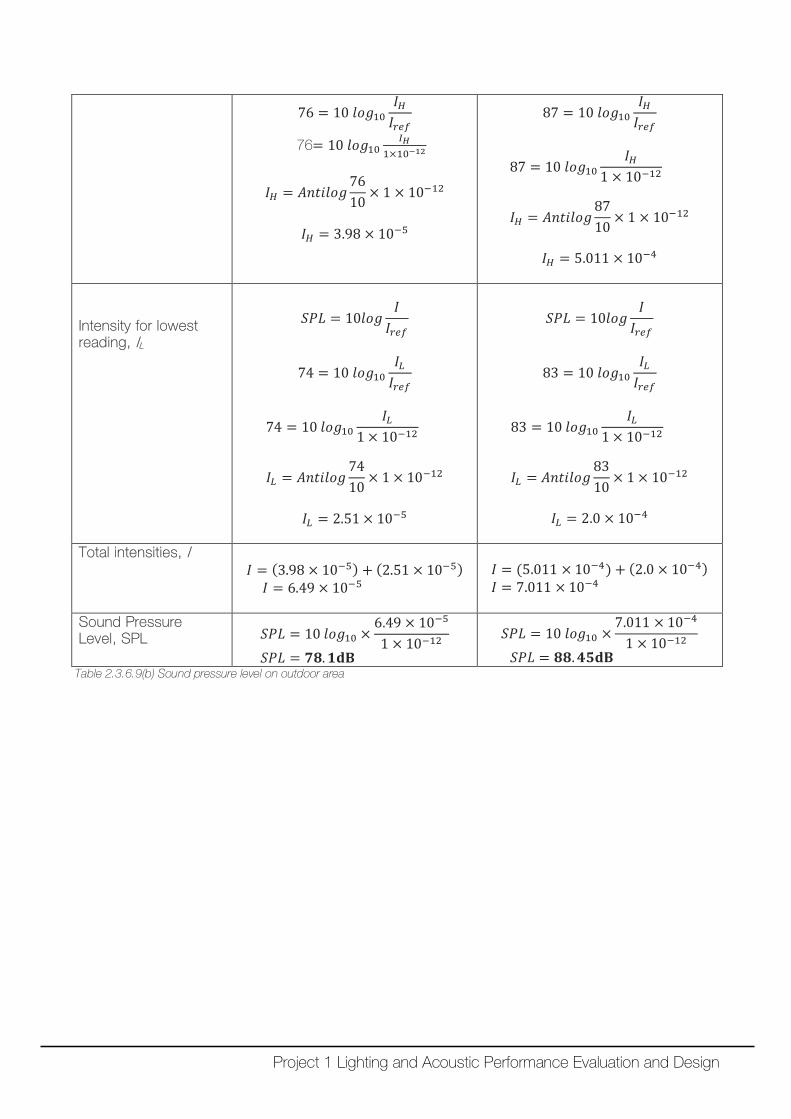
76 = 10 𝑉𝑉𝑉𝑉𝑙𝑙10𝐼𝐼𝐻𝐻𝐼𝐼𝑟𝑟𝑟𝑟𝑟𝑟
76= 10 𝑉𝑉𝑉𝑉𝑙𝑙10𝐼𝐼𝐻𝐻
1×10⁻¹²
𝐼𝐼𝐻𝐻 = 𝐴𝐴𝐴𝐴𝐴𝐴𝐴𝐴𝑉𝑉𝑉𝑉𝑙𝑙7610
× 1 × 10−12
𝐼𝐼𝐻𝐻 = 3.98 × 10⁻⁵
87 = 10 𝑉𝑉𝑉𝑉𝑙𝑙10𝐼𝐼𝐻𝐻𝐼𝐼𝑟𝑟𝑟𝑟𝑟𝑟
87 = 10 𝑉𝑉𝑉𝑉𝑙𝑙10𝐼𝐼𝐻𝐻
1 × 10⁻¹²
𝐼𝐼𝐻𝐻 = 𝐴𝐴𝐴𝐴𝐴𝐴𝐴𝐴𝑉𝑉𝑉𝑉𝑙𝑙8710
× 1 × 10−12
𝐼𝐼𝐻𝐻 = 5.011 × 10⁻⁴
Intensity for lowest reading, IL
𝑆𝑆𝑆𝑆𝑆𝑆 = 10𝑉𝑉𝑉𝑉𝑙𝑙𝐼𝐼𝐼𝐼𝑟𝑟𝑟𝑟𝑟𝑟
74 = 10 𝑉𝑉𝑉𝑉𝑙𝑙10𝐼𝐼𝐿𝐿𝐼𝐼𝑟𝑟𝑟𝑟𝑟𝑟
74 = 10 𝑉𝑉𝑉𝑉𝑙𝑙10𝐼𝐼𝐿𝐿
1 × 10⁻¹²
𝐼𝐼𝐿𝐿 = 𝐴𝐴𝐴𝐴𝐴𝐴𝐴𝐴𝑉𝑉𝑉𝑉𝑙𝑙7410
× 1 × 10−12
𝐼𝐼𝐿𝐿 = 2.51 × 10⁻⁵
𝑆𝑆𝑆𝑆𝑆𝑆 = 10𝑉𝑉𝑉𝑉𝑙𝑙𝐼𝐼𝐼𝐼𝑟𝑟𝑟𝑟𝑟𝑟
83 = 10 𝑉𝑉𝑉𝑉𝑙𝑙10𝐼𝐼𝐿𝐿𝐼𝐼𝑟𝑟𝑟𝑟𝑟𝑟
83 = 10 𝑉𝑉𝑉𝑉𝑙𝑙10𝐼𝐼𝐿𝐿
1 × 10⁻¹²
𝐼𝐼𝐿𝐿 = 𝐴𝐴𝐴𝐴𝐴𝐴𝐴𝐴𝑉𝑉𝑉𝑉𝑙𝑙8310
× 1 × 10−12
𝐼𝐼𝐿𝐿 = 2.0 × 10⁻⁴
Total intensities, I 𝐼𝐼 = (3.98 × 10⁻⁵) + (2.51 × 10⁻⁵) 𝐼𝐼 = 6.49 × 10⁻⁵
𝐼𝐼 = (5.011 × 10⁻⁴) + (2.0 × 10⁻⁴) 𝐼𝐼 = 7.011 × 10⁻⁴
Sound Pressure Level, SPL 𝑆𝑆𝑆𝑆𝑆𝑆 = 10 𝑉𝑉𝑉𝑉𝑙𝑙10 ×
6.49 × 10−5
1 × 10⁻¹²
𝑆𝑆𝑆𝑆𝑆𝑆 = 𝟕𝟕𝟖𝟖.𝟏𝟏𝐝𝐝𝐝𝐝
𝑆𝑆𝑆𝑆𝑆𝑆 = 10 𝑉𝑉𝑉𝑉𝑙𝑙10 ×7.011 × 10−4
1 × 10⁻¹²
𝑆𝑆𝑆𝑆𝑆𝑆 = 𝟖𝟖𝟖𝟖.𝟔𝟔𝟓𝟓𝐝𝐝𝐝𝐝 Table 2.3.6.9(b) Sound pressure level on outdoor area
Project 1 Lighting and Acoustic Performance Evaluation and Design
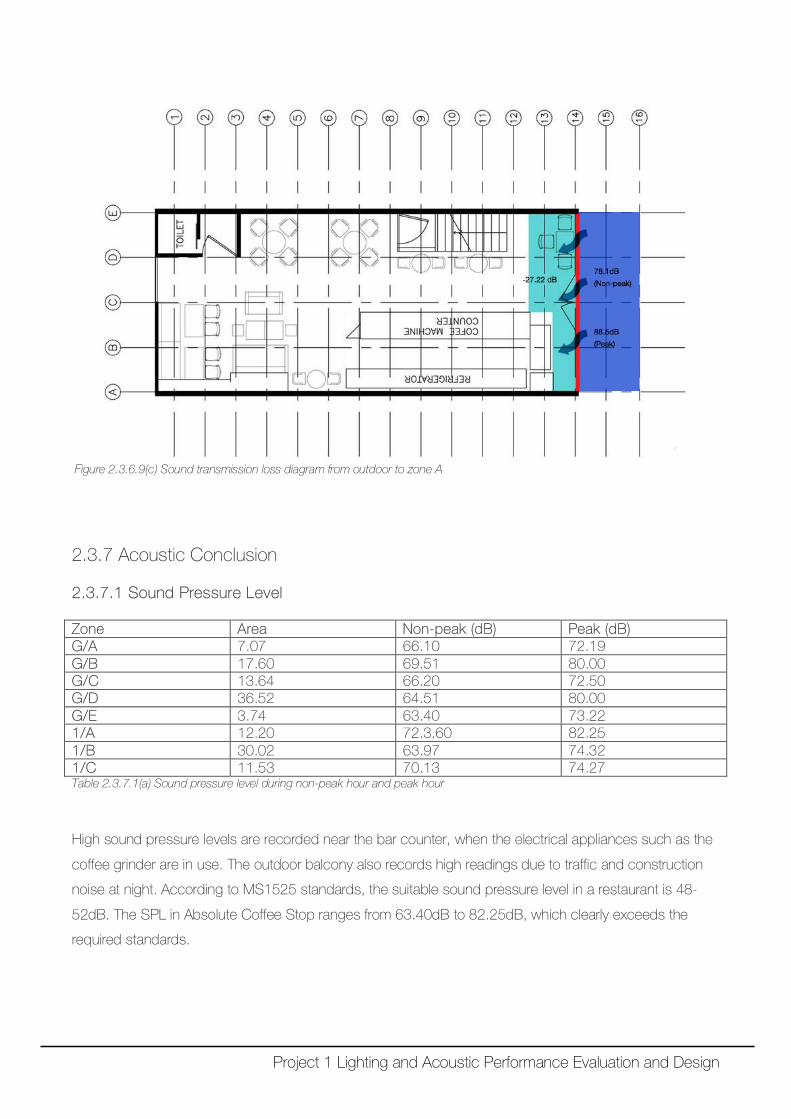
Figure 2.3.6.9(c) Sound transmission loss diagram from outdoor to zone A
2.3.7 Acoustic Conclusion 2.3.7.1 Sound Pressure Level Zone Area Non-peak (dB) Peak (dB) G/A 7.07 66.10 72.19 G/B 17.60 69.51 80.00 G/C 13.64 66.20 72.50 G/D 36.52 64.51 80.00 G/E 3.74 63.40 73.22 1/A 12.20 72.3.60 82.25 1/B 30.02 63.97 74.32 1/C 11.53 70.13 74.27 Table 2.3.7.1(a) Sound pressure level during non-peak hour and peak hour
High sound pressure levels are recorded near the bar counter, when the electrical appliances such as the
coffee grinder are in use. The outdoor balcony also records high readings due to traffic and construction
noise at night. According to MS1525 standards, the suitable sound pressure level in a restaurant is 48-
52dB. The SPL in Absolute Coffee Stop ranges from 63.40dB to 82.25dB, which clearly exceeds the
required standards.
Project 1 Lighting and Acoustic Performance Evaluation and Design
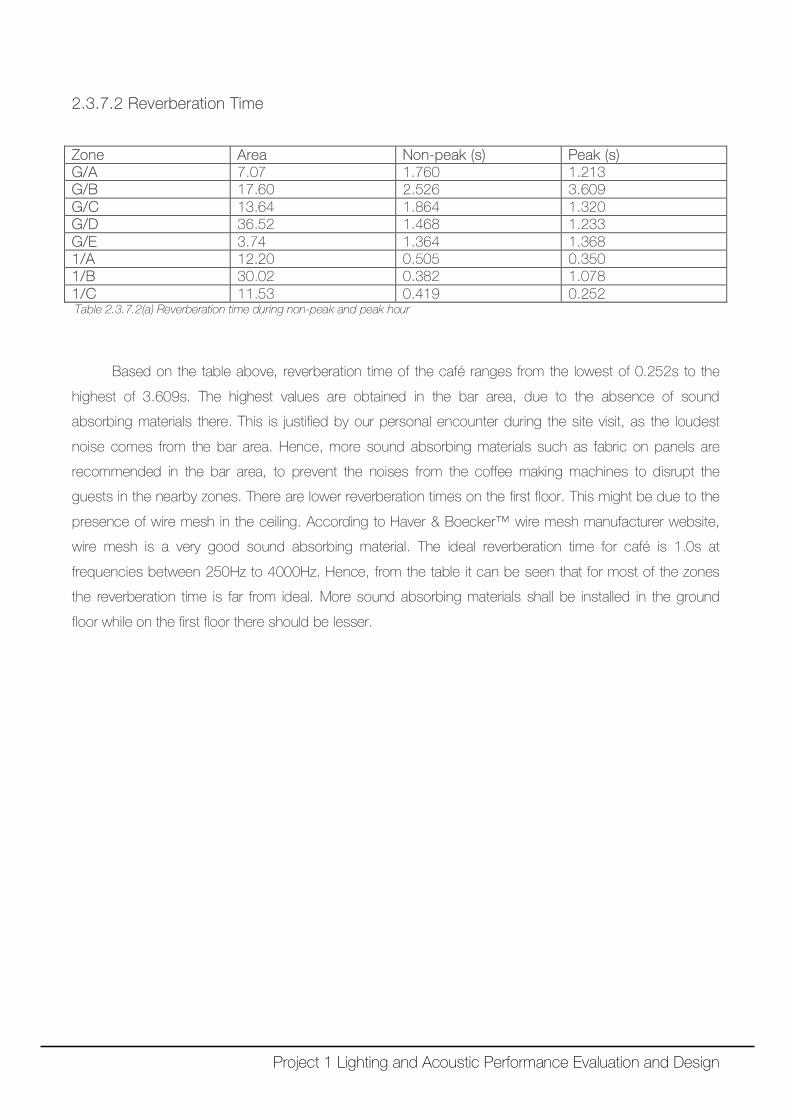
2.3.7.2 Reverberation Time Zone Area Non-peak (s) Peak (s) G/A 7.07 1.760 1.213 G/B 17.60 2.526 3.609 G/C 13.64 1.864 1.320 G/D 36.52 1.468 1.233 G/E 3.74 1.364 1.368 1/A 12.20 0.505 0.350 1/B 30.02 0.382 1.078 1/C 11.53 0.419 0.252 Table 2.3.7.2(a) Reverberation time during non-peak and peak hour
Based on the table above, reverberation time of the café ranges from the lowest of 0.252s to the
highest of 3.609s. The highest values are obtained in the bar area, due to the absence of sound
absorbing materials there. This is justified by our personal encounter during the site visit, as the loudest
noise comes from the bar area. Hence, more sound absorbing materials such as fabric on panels are
recommended in the bar area, to prevent the noises from the coffee making machines to disrupt the
guests in the nearby zones. There are lower reverberation times on the first floor. This might be due to the
presence of wire mesh in the ceiling. According to Haver & Boecker™ wire mesh manufacturer website,
wire mesh is a very good sound absorbing material. The ideal reverberation time for café is 1.0s at
frequencies between 250Hz to 4000Hz. Hence, from the table it can be seen that for most of the zones
the reverberation time is far from ideal. More sound absorbing materials shall be installed in the ground
floor while on the first floor there should be lesser.
Project 1 Lighting and Acoustic Performance Evaluation and Design
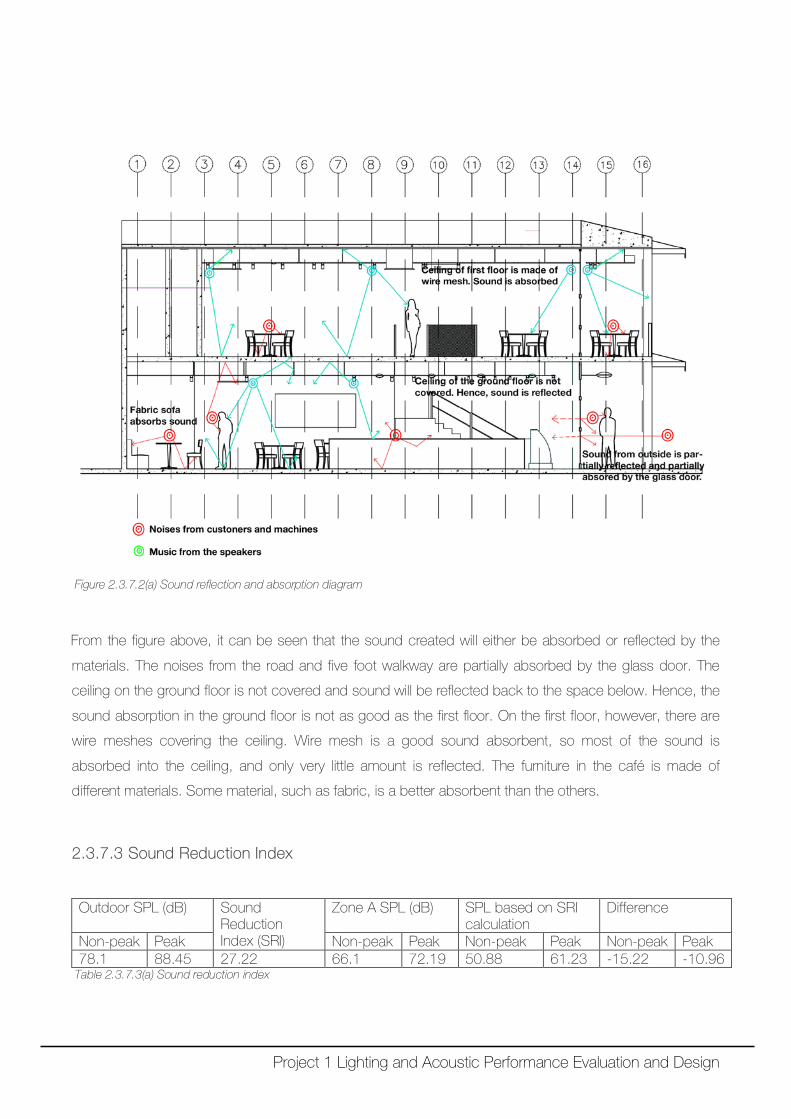
Figure 2.3.7.2(a) Sound reflection and absorption diagram
From the figure above, it can be seen that the sound created will either be absorbed or reflected by the
materials. The noises from the road and five foot walkway are partially absorbed by the glass door. The
ceiling on the ground floor is not covered and sound will be reflected back to the space below. Hence, the
sound absorption in the ground floor is not as good as the first floor. On the first floor, however, there are
wire meshes covering the ceiling. Wire mesh is a good sound absorbent, so most of the sound is
absorbed into the ceiling, and only very little amount is reflected. The furniture in the café is made of
different materials. Some material, such as fabric, is a better absorbent than the others.
2.3.7.3 Sound Reduction Index Outdoor SPL (dB) Sound
Reduction Index (SRI)
Zone A SPL (dB) SPL based on SRI calculation
Difference
Non-peak Peak Non-peak Peak Non-peak Peak Non-peak Peak 78.1 88.45 27.22 66.1 72.19 50.88 61.23 -15.22 -10.96
Table 2.3.7.3(a) Sound reduction index
Project 1 Lighting and Acoustic Performance Evaluation and Design
Based on calculations, the supposed sound pressure level at zone A is supposed to be reduced by
27.22dB. However, the actual SPL taken is higher than expected, 66.1dB and 72.19dB for non-peak and
peak hour respectively. Noise from speakers and bar contribute to a higher interior SPL reading than
expected.
It can be concluded that although the sound levels in Absolute Coffee Stop are still acceptable, it
lacks in proper acoustical treatments as the high sound pressure levels may cause discomfort to the
customers over time. Therefore, proper steps must be taken to improve the acoustic condition of
the café.
2.3.8 Improvement and Recommendation
There are three ways to improve acoustics in general, namely via absorption, blocking, and cover-up.
From our research, the sound pressure levels inside the café exceed the standards required in MS1525.
Therefore, we propose several solutions to reduce the sound level to which that is appropriate.
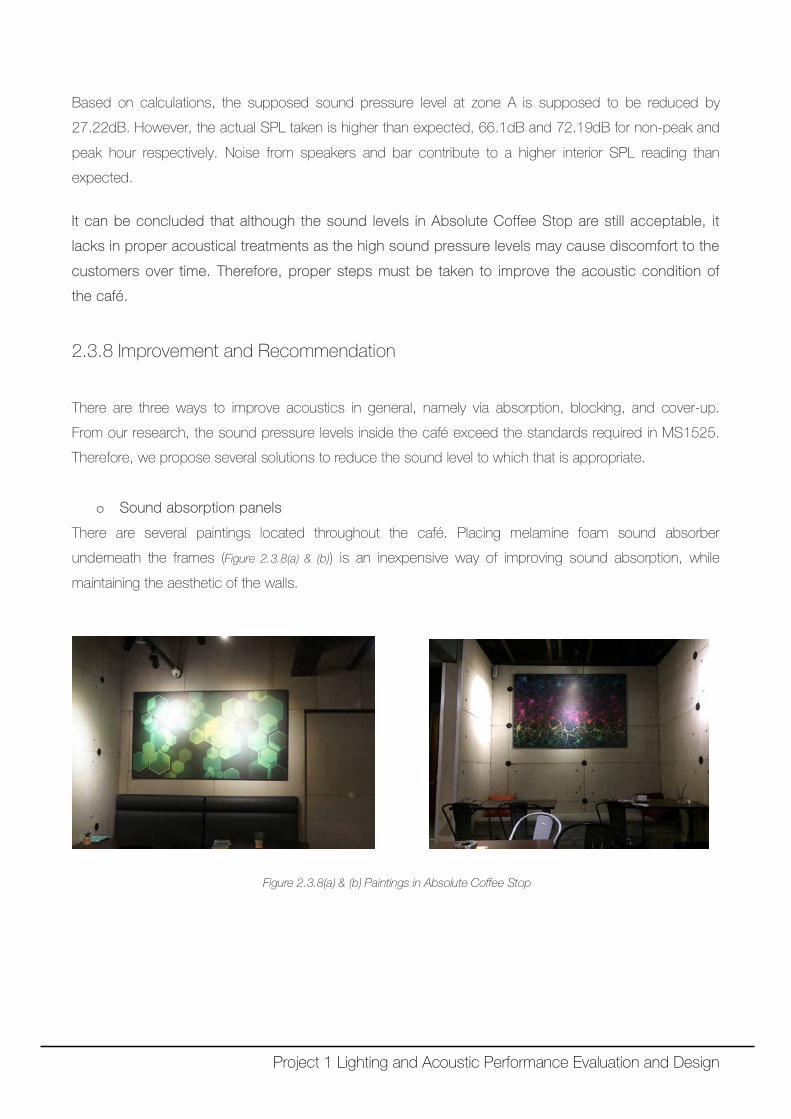
o Sound absorption panels
There are several paintings located throughout the café. Placing melamine foam sound absorber
underneath the frames (Figure 2.3.8(a) & (b)) is an inexpensive way of improving sound absorption, while
maintaining the aesthetic of the walls.
Figure 2.3.8(a) & (b) Paintings in Absolute Coffee Stop
Project 1 Lighting and Acoustic Performance Evaluation and Design
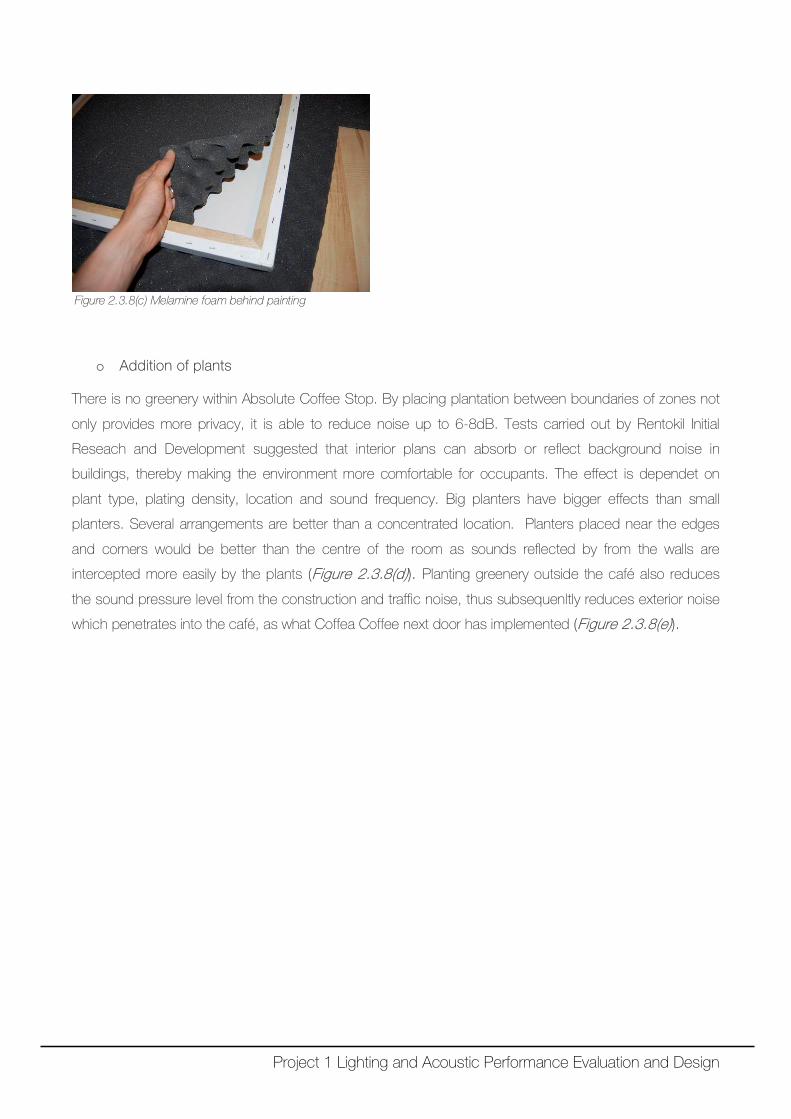
Figure 2.3.8(c) Melamine foam behind painting
o Addition of plants There is no greenery within Absolute Coffee Stop. By placing plantation between boundaries of zones not
only provides more privacy, it is able to reduce noise up to 6-8dB. Tests carried out by Rentokil Initial
Reseach and Development suggested that interior plans can absorb or reflect background noise in
buildings, thereby making the environment more comfortable for occupants. The effect is dependet on
plant type, plating density, location and sound frequency. Big planters have bigger effects than small
planters. Several arrangements are better than a concentrated location. Planters placed near the edges
and corners would be better than the centre of the room as sounds reflected by from the walls are
intercepted more easily by the plants (Figure 2.3.8(d)). Planting greenery outside the café also reduces
the sound pressure level from the construction and traffic noise, thus subsequenltly reduces exterior noise
which penetrates into the café, as what Coffea Coffee next door has implemented (Figure 2.3.8(e)).
Project 1 Lighting and Acoustic Performance Evaluation and Design
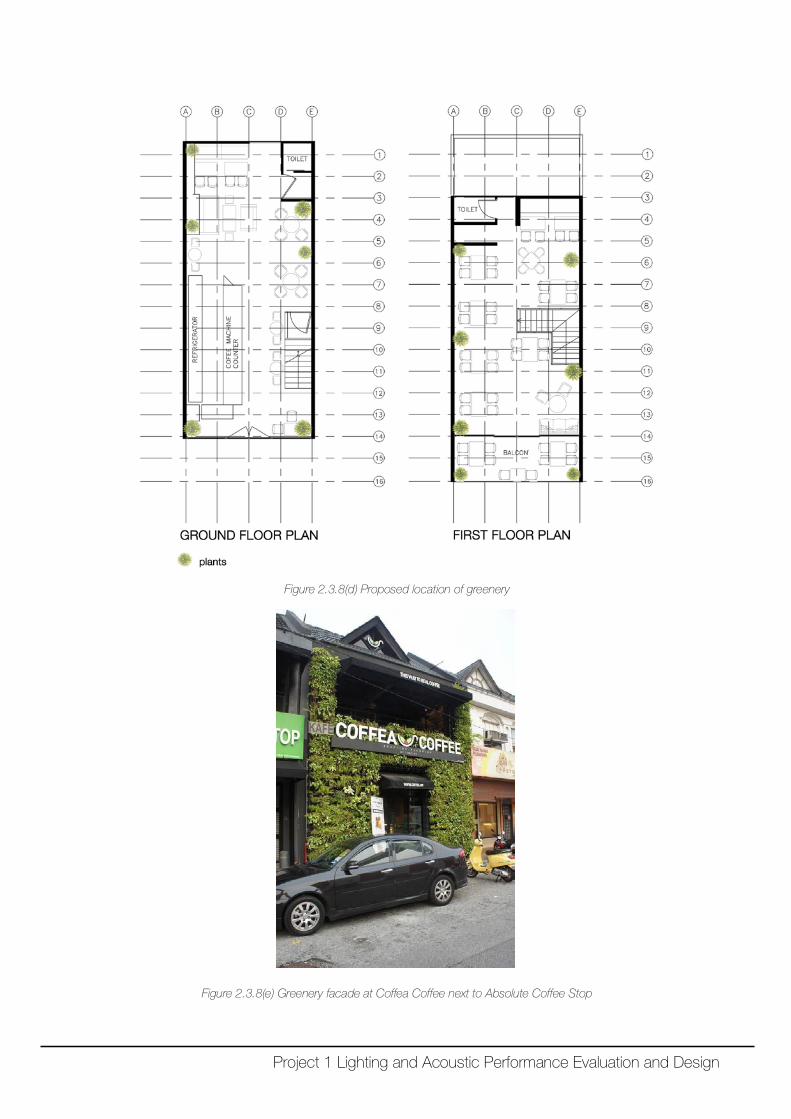
Figure 2.3.8(d) Proposed location of greenery
Figure 2.3.8(e) Greenery facade at Coffea Coffee next to Absolute Coffee Stop
Project 1 Lighting and Acoustic Performance Evaluation and Design
3.0 Lighting Study
Project 1 Lighting and Acoustic Performance Evaluation and Design
3.1 Precedent Study of Lighting
3.1.1 Lighting - The Art Room, W.D. Richards Elementary School by John Bals, Cazembe Day
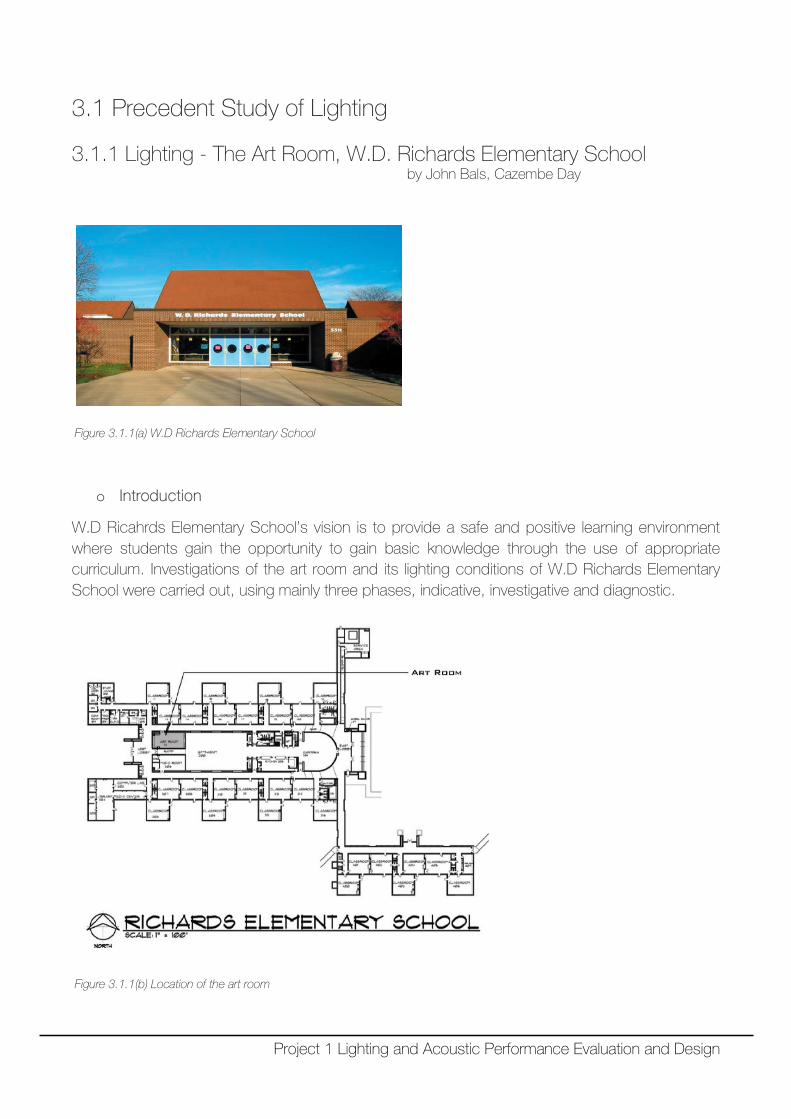
Figure 3.1.1(a) W.D Richards Elementary School
o Introduction
W.D Ricahrds Elementary School’s vision is to provide a safe and positive learning environment where students gain the opportunity to gain basic knowledge through the use of appropriate curriculum. Investigations of the art room and its lighting conditions of W.D Richards Elementary School were carried out, using mainly three phases, indicative, investigative and diagnostic.
Figure 3.1.1(b) Location of the art room
Project 1 Lighting and Acoustic Performance Evaluation and Design
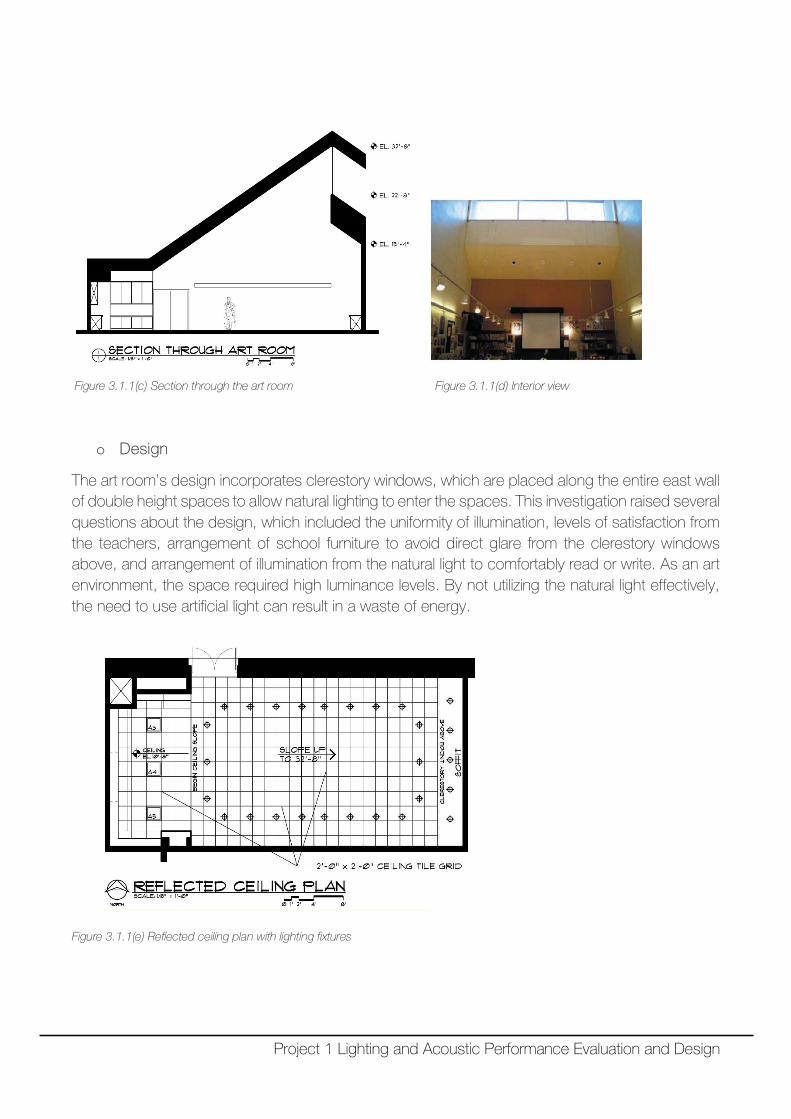
Figure 3.1.1(c) Section through the art room Figure 3.1.1(d) Interior view
o Design
The art room’s design incorporates clerestory windows, which are placed along the entire east wall of double height spaces to allow natural lighting to enter the spaces. This investigation raised several questions about the design, which included the uniformity of illumination, levels of satisfaction from the teachers, arrangement of school furniture to avoid direct glare from the clerestory windows above, and arrangement of illumination from the natural light to comfortably read or write. As an art environment, the space required high luminance levels. By not utilizing the natural light effectively, the need to use artificial light can result in a waste of energy.
Figure 3.1.1(e) Reflected ceiling plan with lighting fixtures
Project 1 Lighting and Acoustic Performance Evaluation and Design
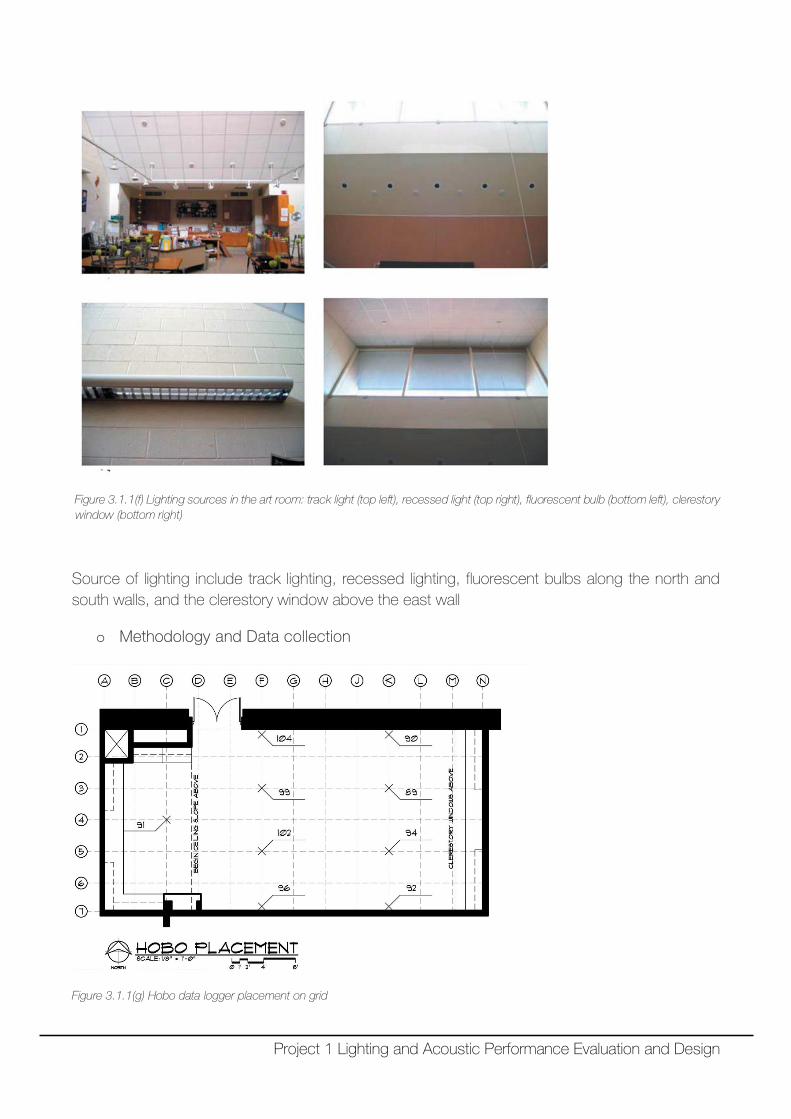
Figure 3.1.1(f) Lighting sources in the art room: track light (top left), recessed light (top right), fluorescent bulb (bottom left), clerestory window (bottom right)
Source of lighting include track lighting, recessed lighting, fluorescent bulbs along the north and south walls, and the clerestory window above the east wall
o Methodology and Data collection
Figure 3.1.1(g) Hobo data logger placement on grid
Project 1 Lighting and Acoustic Performance Evaluation and Design
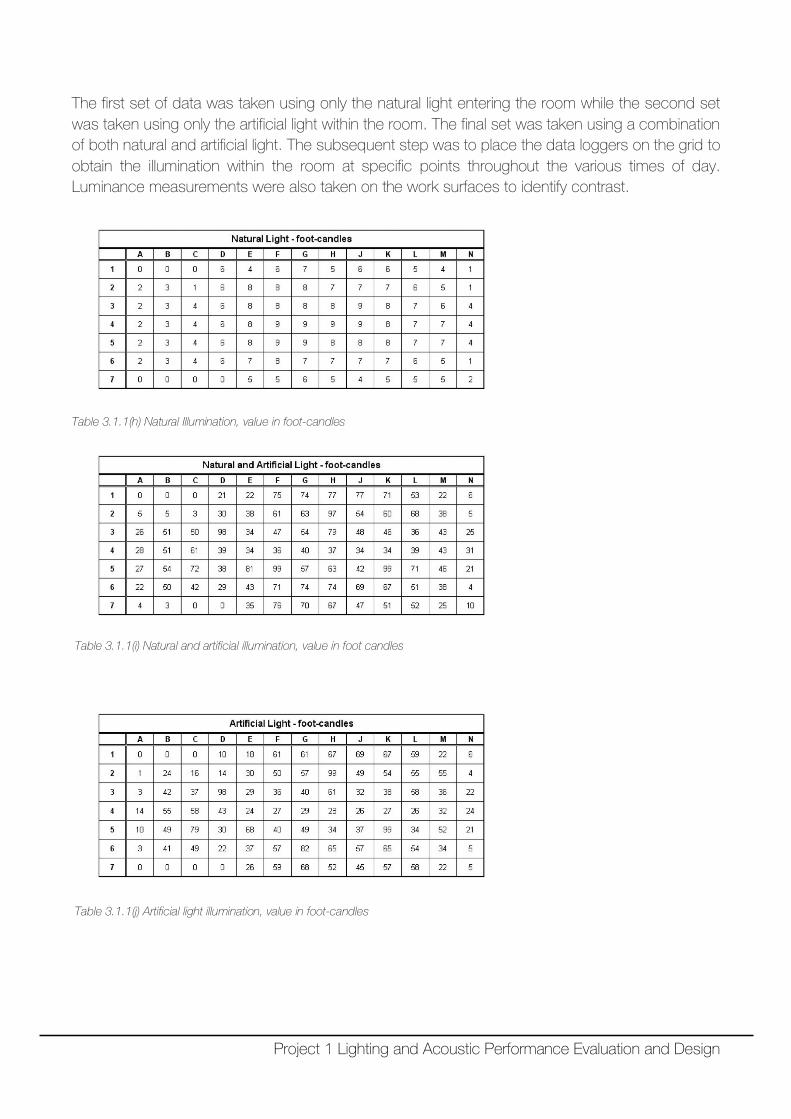
The first set of data was taken using only the natural light entering the room while the second set was taken using only the artificial light within the room. The final set was taken using a combination of both natural and artificial light. The subsequent step was to place the data loggers on the grid to obtain the illumination within the room at specific points throughout the various times of day. Luminance measurements were also taken on the work surfaces to identify contrast.
Table 3.1.1(h) Natural Illumination, value in foot-candles
Table 3.1.1(i) Natural and artificial illumination, value in foot candles
Table 3.1.1(j) Artificial light illumination, value in foot-candles
Project 1 Lighting and Acoustic Performance Evaluation and Design
Diagnostic Research
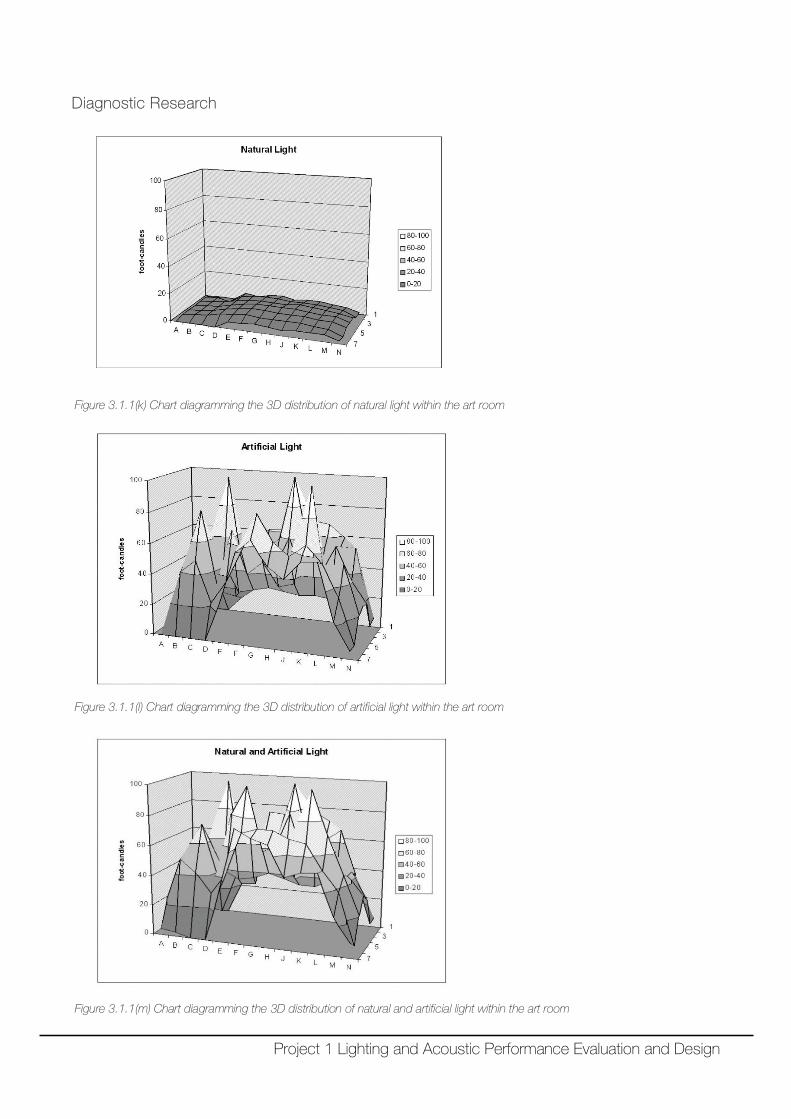
Figure 3.1.1(k) Chart diagramming the 3D distribution of natural light within the art room
Figure 3.1.1(l) Chart diagramming the 3D distribution of artificial light within the art room
Figure 3.1.1(m) Chart diagramming the 3D distribution of natural and artificial light within the art room
Project 1 Lighting and Acoustic Performance Evaluation and Design
The diagnostic phase of the research focused on a detailed examination of the data collected. The first set of data investigated was the illumination measurements gathered using the digital illuminance meter. The three sets of data were placed in a spreadsheet for evaluation. A 3-dimensional graph displaying the distribution of light within the art room was plotted. The data sets showed that the natural light illumination is mostly focused in the center of the room, although fairly evenly distributed over the children’s work area. The graphs that display lighting fixture illumination and lighting fixture illumination with natural lighting show spikes of illumination within the room, which are due to the hotspots of the incandescent can fixtures that provide task lighting in the children’s work area. The illumination measurements were in some places recorded directly below one of the task lighting fixtures. The team also imported the data logger values into spreadsheets, which were used to create line graphs showing the change in the amount of natural light within the space over the weekend. The graphs all depicted that the amount of light in the art room is highest in the morning. The light levels then begin to decrease in late morning and on through the afternoon. This corresponds with the location of the sun in relation to position of the clerestory window: the window faces east and thus the amount of light in the room is greatest when the sun is on the eastern side.
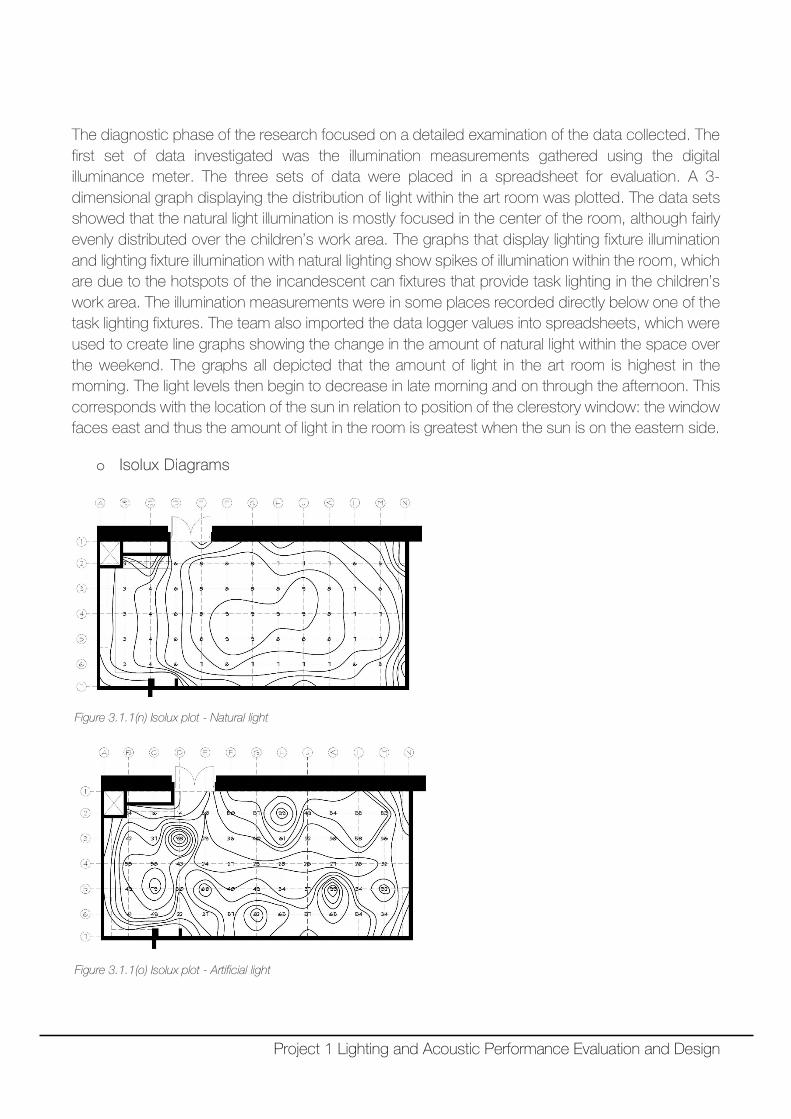
o Isolux Diagrams
Figure 3.1.1(n) Isolux plot - Natural light
Figure 3.1.1(o) Isolux plot - Artificial light
Project 1 Lighting and Acoustic Performance Evaluation and Design
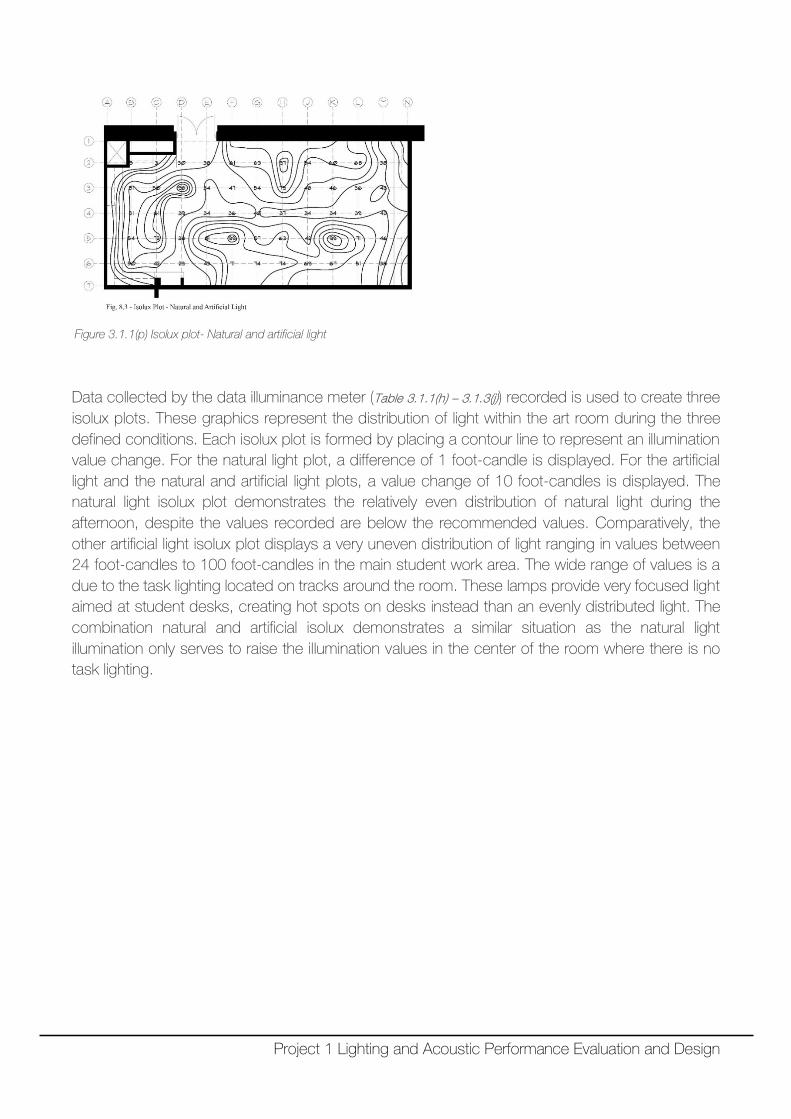
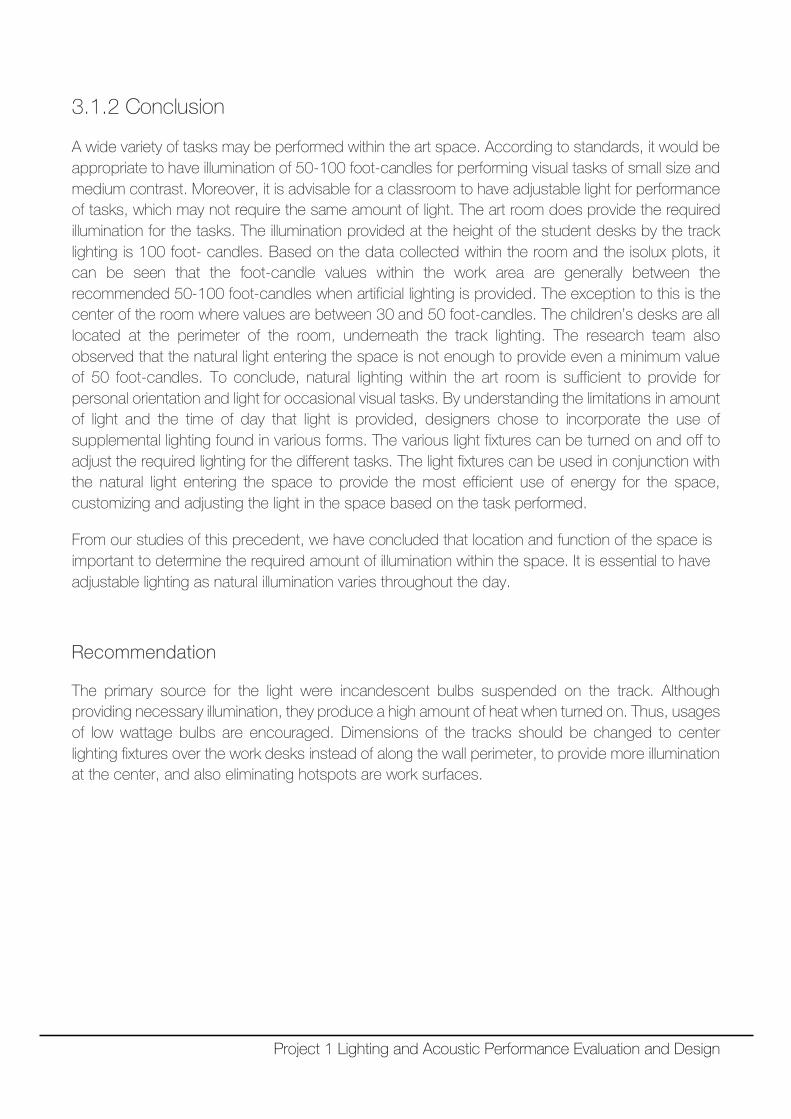
Figure 3.1.1(p) Isolux plot- Natural and artificial light
Data collected by the data illuminance meter (Table 3.1.1(h) – 3.1.3(j)) recorded is used to create three isolux plots. These graphics represent the distribution of light within the art room during the three defined conditions. Each isolux plot is formed by placing a contour line to represent an illumination value change. For the natural light plot, a difference of 1 foot-candle is displayed. For the artificial light and the natural and artificial light plots, a value change of 10 foot-candles is displayed. The natural light isolux plot demonstrates the relatively even distribution of natural light during the afternoon, despite the values recorded are below the recommended values. Comparatively, the other artificial light isolux plot displays a very uneven distribution of light ranging in values between 24 foot-candles to 100 foot-candles in the main student work area. The wide range of values is a due to the task lighting located on tracks around the room. These lamps provide very focused light aimed at student desks, creating hot spots on desks instead than an evenly distributed light. The combination natural and artificial isolux demonstrates a similar situation as the natural light illumination only serves to raise the illumination values in the center of the room where there is no task lighting.
Project 1 Lighting and Acoustic Performance Evaluation and Design
3.1.2 Conclusion
A wide variety of tasks may be performed within the art space. According to standards, it would be appropriate to have illumination of 50-100 foot-candles for performing visual tasks of small size and medium contrast. Moreover, it is advisable for a classroom to have adjustable light for performance of tasks, which may not require the same amount of light. The art room does provide the required illumination for the tasks. The illumination provided at the height of the student desks by the track lighting is 100 foot- candles. Based on the data collected within the room and the isolux plots, it can be seen that the foot-candle values within the work area are generally between the recommended 50-100 foot-candles when artificial lighting is provided. The exception to this is the center of the room where values are between 30 and 50 foot-candles. The children’s desks are all located at the perimeter of the room, underneath the track lighting. The research team also observed that the natural light entering the space is not enough to provide even a minimum value of 50 foot-candles. To conclude, natural lighting within the art room is sufficient to provide for personal orientation and light for occasional visual tasks. By understanding the limitations in amount of light and the time of day that light is provided, designers chose to incorporate the use of supplemental lighting found in various forms. The various light fixtures can be turned on and off to adjust the required lighting for the different tasks. The light fixtures can be used in conjunction with the natural light entering the space to provide the most efficient use of energy for the space, customizing and adjusting the light in the space based on the task performed.
From our studies of this precedent, we have concluded that location and function of the space is important to determine the required amount of illumination within the space. It is essential to have adjustable lighting as natural illumination varies throughout the day.
Recommendation
The primary source for the light were incandescent bulbs suspended on the track. Although providing necessary illumination, they produce a high amount of heat when turned on. Thus, usages of low wattage bulbs are encouraged. Dimensions of the tracks should be changed to center lighting fixtures over the work desks instead of along the wall perimeter, to provide more illumination at the center, and also eliminating hotspots are work surfaces.
Project 1 Lighting and Acoustic Performance Evaluation and Design
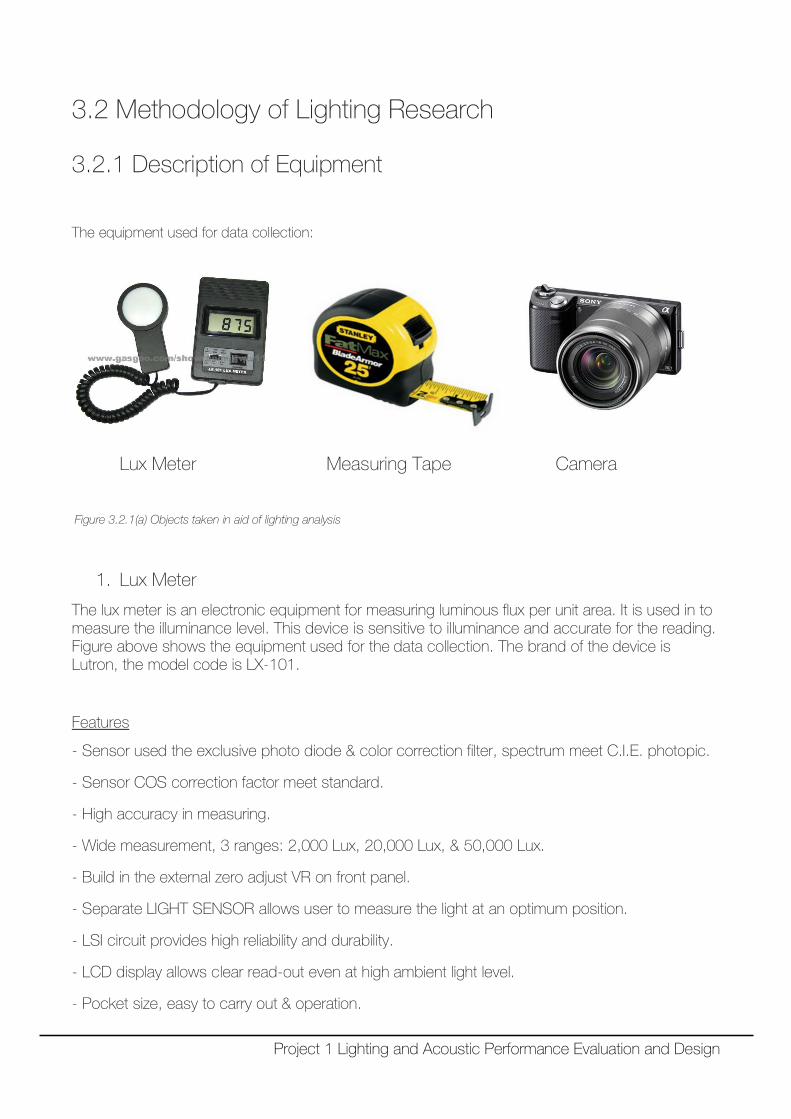
3.2 Methodology of Lighting Research
3.2.1 Description of Equipment
The equipment used for data collection:
Lux Meter Measuring Tape Camera
Figure 3.2.1(a) Objects taken in aid of lighting analysis
1. Lux Meter
The lux meter is an electronic equipment for measuring luminous flux per unit area. It is used in to measure the illuminance level. This device is sensitive to illuminance and accurate for the reading. Figure above shows the equipment used for the data collection. The brand of the device is Lutron, the model code is LX-101.
Features
- Sensor used the exclusive photo diode & color correction filter, spectrum meet C.I.E. photopic.
- Sensor COS correction factor meet standard.
- High accuracy in measuring.
- Wide measurement, 3 ranges: 2,000 Lux, 20,000 Lux, & 50,000 Lux.
- Build in the external zero adjust VR on front panel.
- Separate LIGHT SENSOR allows user to measure the light at an optimum position.
- LSI circuit provides high reliability and durability.
- LCD display allows clear read-out even at high ambient light level.
- Pocket size, easy to carry out & operation.
Project 1 Lighting and Acoustic Performance Evaluation and Design
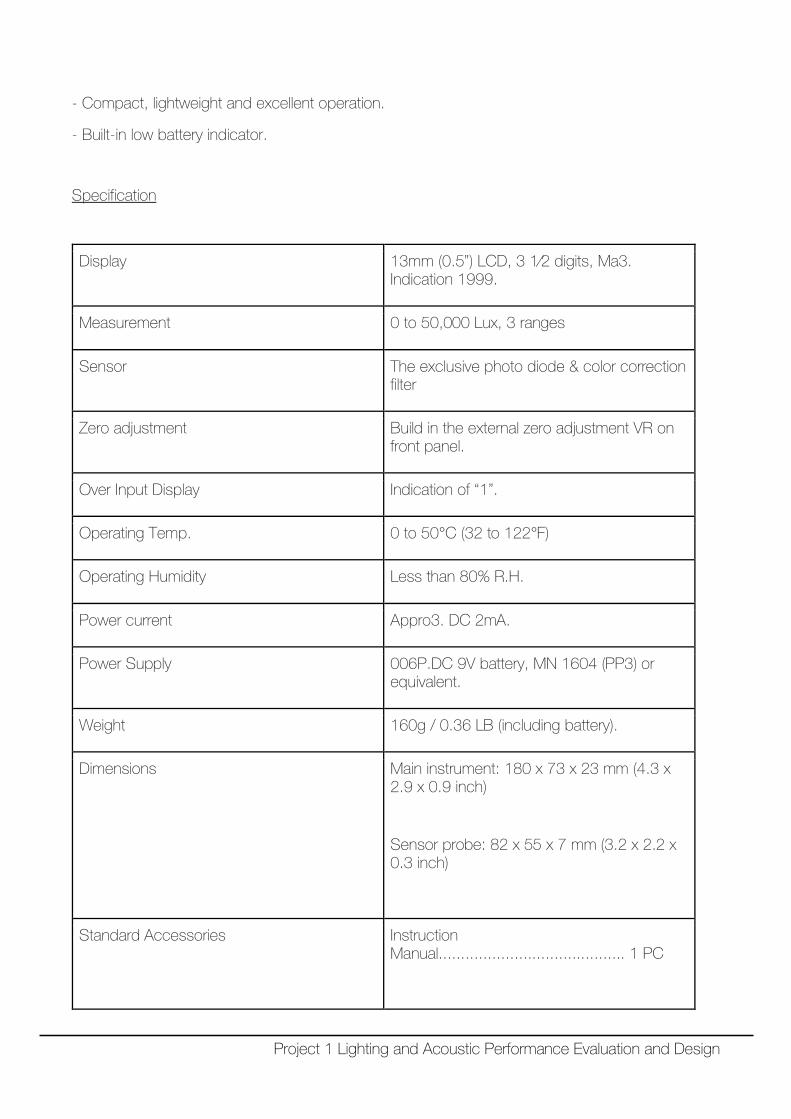
- Compact, lightweight and excellent operation.
- Built-in low battery indicator.
Specification
Display 13mm (0.5”) LCD, 3 1⁄2 digits, Ma3. Indication 1999.
Measurement 0 to 50,000 Lux, 3 ranges
Sensor The exclusive photo diode & color correction filter
Zero adjustment Build in the external zero adjustment VR on front panel.
Over Input Display Indication of “1”.
Operating Temp. 0 to 50°C (32 to 122°F)
Operating Humidity Less than 80% R.H.
Power current Appro3. DC 2mA.
Power Supply 006P.DC 9V battery, MN 1604 (PP3) or equivalent.
Weight 160g / 0.36 LB (including battery).
Dimensions Main instrument: 180 x 73 x 23 mm (4.3 x 2.9 x 0.9 inch)
Sensor probe: 82 x 55 x 7 mm (3.2 x 2.2 x 0.3 inch)
Standard Accessories Instruction Manual.......................................... 1 PC
Project 1 Lighting and Acoustic Performance Evaluation and Design
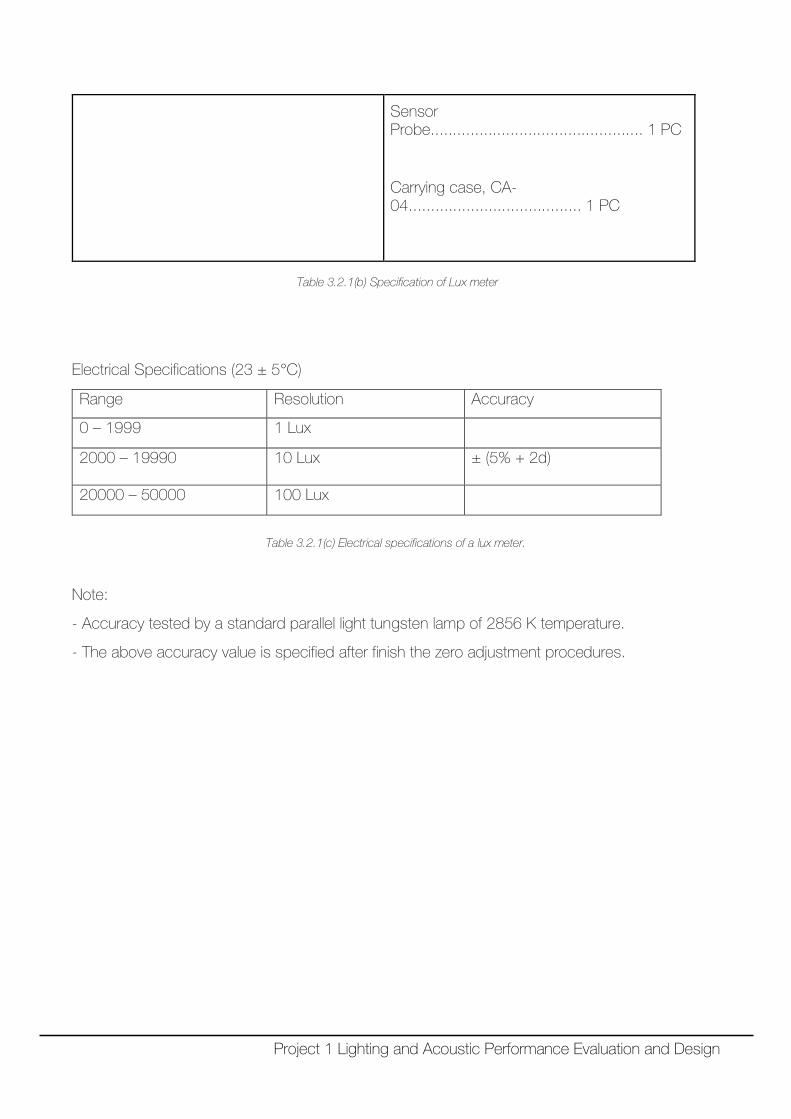
Sensor Probe................................................ 1 PC
Carrying case, CA-04....................................... 1 PC
Table 3.2.1(b) Specification of Lux meter
Electrical Specifications (23 ± 5°C)
Range Resolution Accuracy
0 – 1999 1 Lux
2000 – 19990 10 Lux ± (5% + 2d)
20000 – 50000 100 Lux
Table 3.2.1(c) Electrical specifications of a lux meter.
Note:
- Accuracy tested by a standard parallel light tungsten lamp of 2856 K temperature.
- The above accuracy value is specified after finish the zero adjustment procedures.
Project 1 Lighting and Acoustic Performance Evaluation and Design
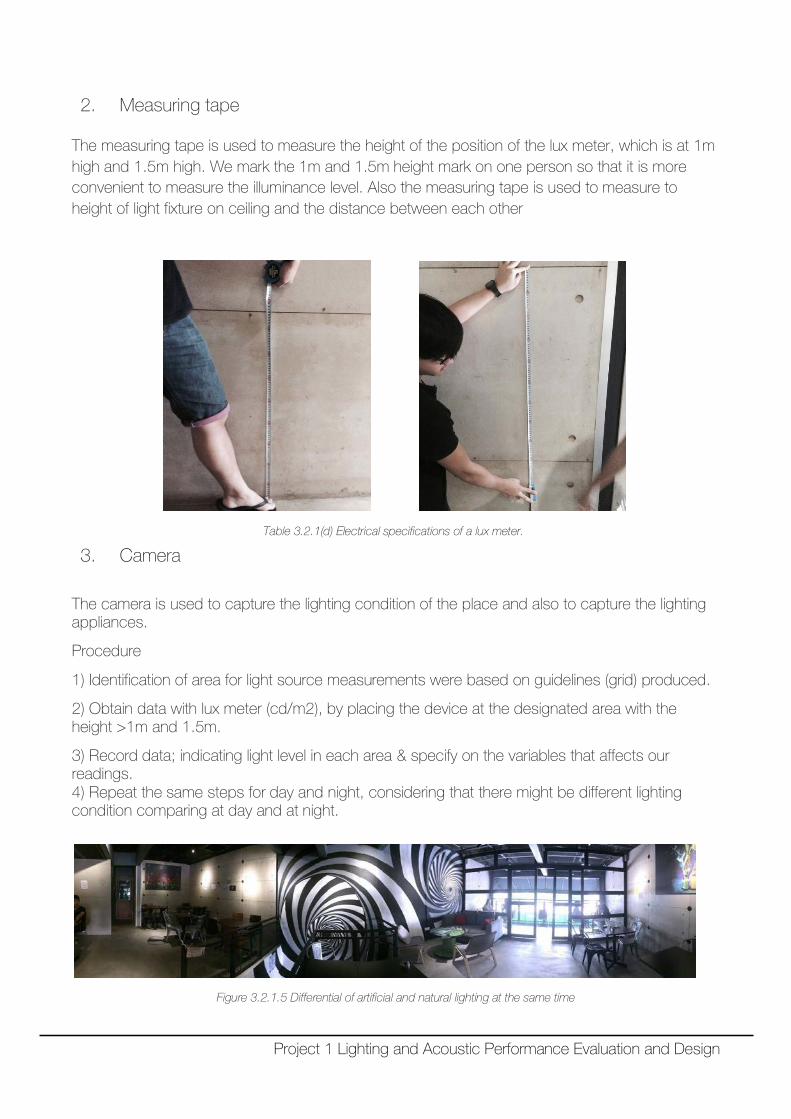
2. Measuring tape The measuring tape is used to measure the height of the position of the lux meter, which is at 1m high and 1.5m high. We mark the 1m and 1.5m height mark on one person so that it is more convenient to measure the illuminance level. Also the measuring tape is used to measure to height of light fixture on ceiling and the distance between each other
Table 3.2.1(d) Electrical specifications of a lux meter.
3. Camera
The camera is used to capture the lighting condition of the place and also to capture the lighting appliances.
Procedure
1) Identification of area for light source measurements were based on guidelines (grid) produced.
2) Obtain data with lux meter (cd/m2), by placing the device at the designated area with the height >1m and 1.5m.
3) Record data; indicating light level in each area & specify on the variables that affects our readings. 4) Repeat the same steps for day and night, considering that there might be different lighting condition comparing at day and at night.
Figure 3.2.1.5 Differential of artificial and natural lighting at the same time
Project 1 Lighting and Acoustic Performance Evaluation and Design
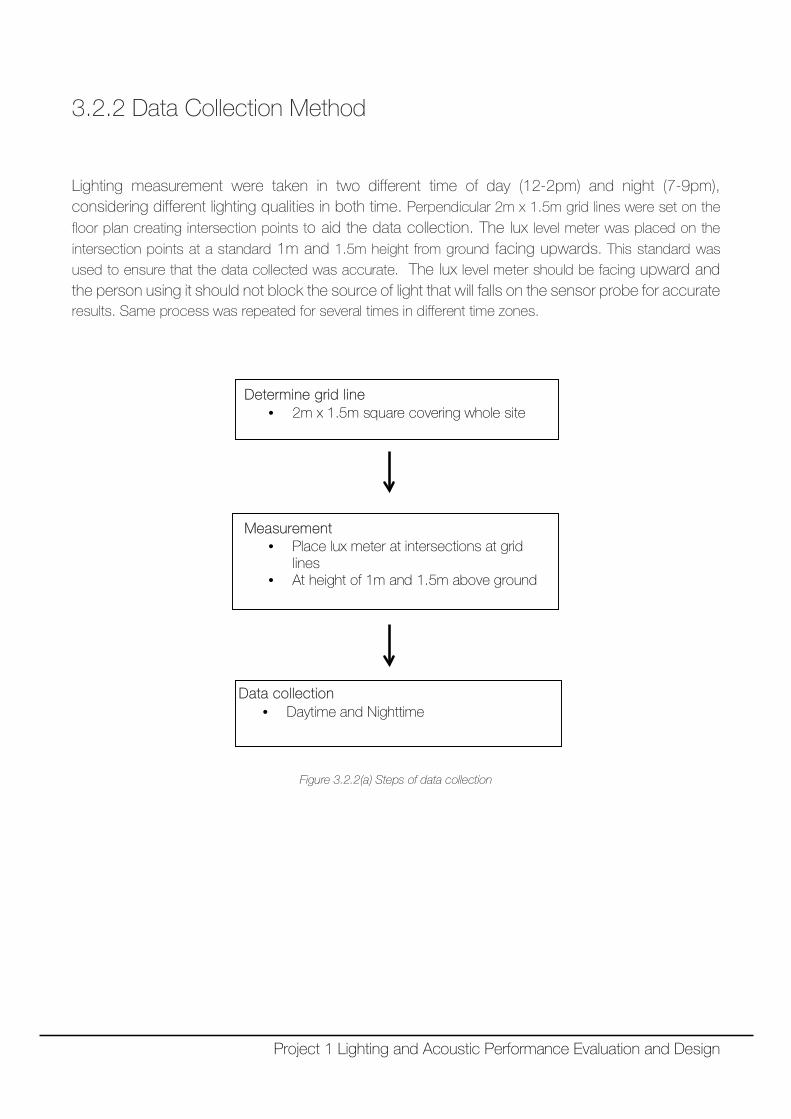
3.2.2 Data Collection Method
Lighting measurement were taken in two different time of day (12-2pm) and night (7-9pm), considering different lighting qualities in both time. Perpendicular 2m x 1.5m grid lines were set on the
floor plan creating intersection points to aid the data collection. The lux level meter was placed on the
intersection points at a standard 1m and 1.5m height from ground facing upwards. This standard was used to ensure that the data collected was accurate. The lux level meter should be facing upward and the person using it should not block the source of light that will falls on the sensor probe for accurate results. Same process was repeated for several times in different time zones.
Figure 3.2.2(a) Steps of data collection
Determine grid line • 2m x 1.5m square covering whole site
Measurement • Place lux meter at intersections at grid
lines • At height of 1m and 1.5m above ground
Data collection
• Daytime and Nighttime
Project 1 Lighting and Acoustic Performance Evaluation and Design
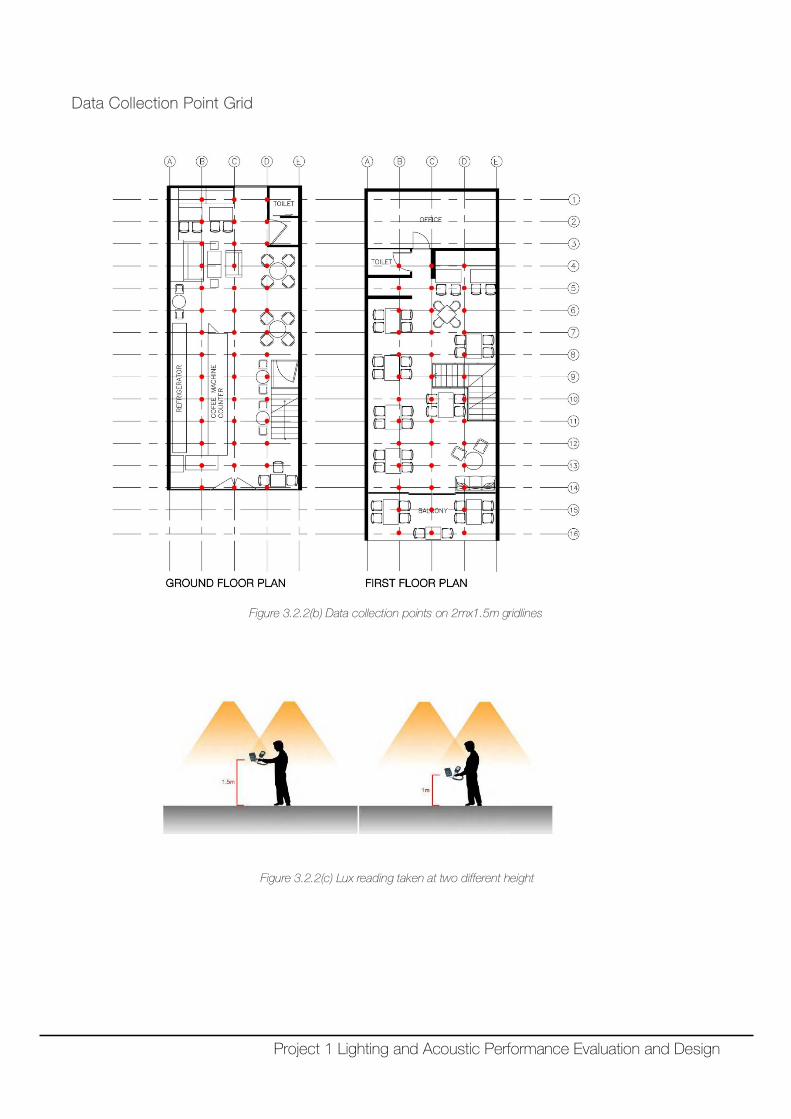
Data Collection Point Grid
Figure 3.2.2(b) Data collection points on 2mx1.5m gridlines
Figure 3.2.2(c) Lux reading taken at two different height
Project 1 Lighting and Acoustic Performance Evaluation and Design
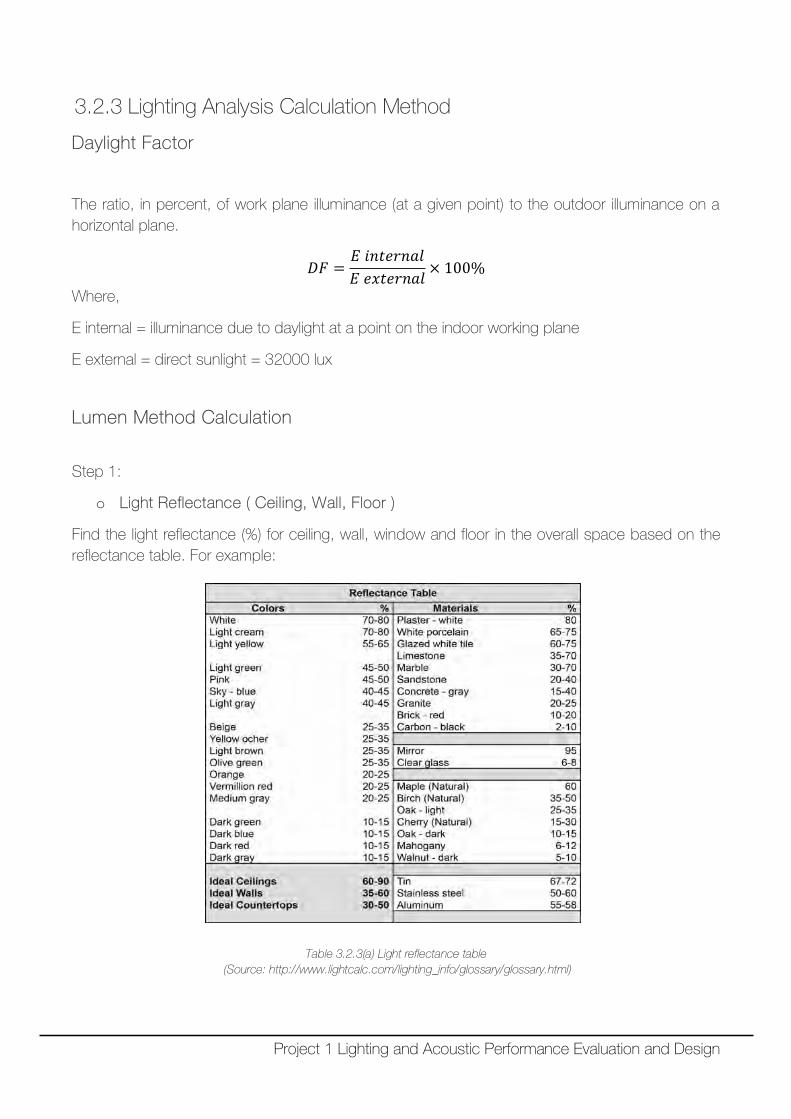
3.2.3 Lighting Analysis Calculation Method
Daylight Factor
The ratio, in percent, of work plane illuminance (at a given point) to the outdoor illuminance on a horizontal plane.
𝐷𝐷𝐷𝐷 =𝐸𝐸 𝑖𝑖𝑖𝑖𝑖𝑖𝑖𝑖𝑖𝑖𝑖𝑖𝑖𝑖𝑖𝑖𝐸𝐸 𝑖𝑖𝑒𝑒𝑖𝑖𝑖𝑖𝑖𝑖𝑖𝑖𝑖𝑖𝑖𝑖 × 100%
Where,
E internal = illuminance due to daylight at a point on the indoor working plane
E external = direct sunlight = 32000 lux
Lumen Method Calculation
Step 1:
o Light Reflectance ( Ceiling, Wall, Floor )
Find the light reflectance (%) for ceiling, wall, window and floor in the overall space based on the reflectance table. For example:
Table 3.2.3(a) Light reflectance table (Source: http://www.lightcalc.com/lighting_info/glossary/glossary.html)
Project 1 Lighting and Acoustic Performance Evaluation and Design
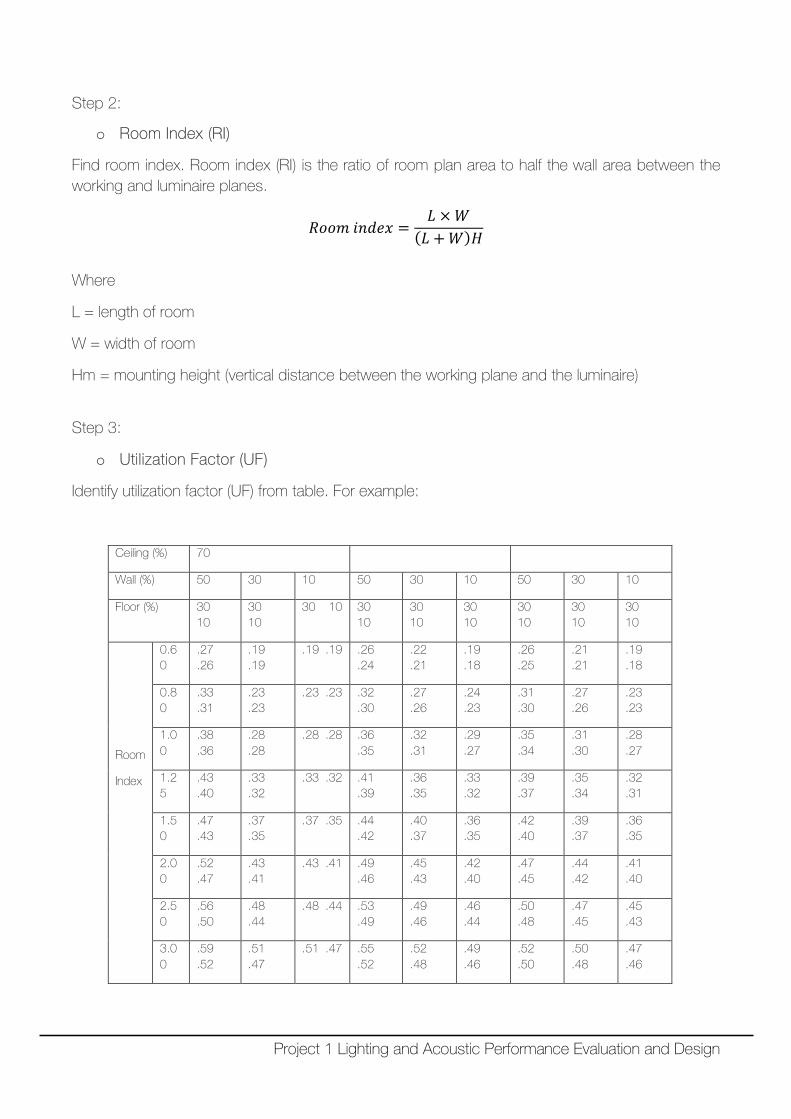
Step 2:
o Room Index (RI)
Find room index. Room index (RI) is the ratio of room plan area to half the wall area between the working and luminaire planes.
𝑅𝑅𝑅𝑅𝑅𝑅𝑅𝑅 𝑖𝑖𝑖𝑖𝑖𝑖𝑖𝑖𝑒𝑒 =𝐿𝐿 × 𝑊𝑊
(𝐿𝐿 + 𝑊𝑊)𝐻𝐻
Where
L = length of room
W = width of room
Hm = mounting height (vertical distance between the working plane and the luminaire)
Step 3:
o Utilization Factor (UF)
Identify utilization factor (UF) from table. For example:
Ceiling (%) 70
Wall (%) 50 30 10 50 30 10 50 30 10
Floor (%) 30 10
30 10
30 10 30 10
30 10
30 10
30 10
30 10
30 10
Room
Index
0.60
.27
.26 .19 .19
.19 .19 .26 .24
.22
.21 .19 .18
.26
.25 .21 .21
.19
.18
0.80
.33
.31 .23 .23
.23 .23 .32 .30
.27
.26 .24 .23
.31
.30 .27 .26
.23
.23
1.00
.38
.36 .28 .28
.28 .28 .36 .35
.32
.31 .29 .27
.35
.34 .31 .30
.28
.27
1.25
.43
.40 .33 .32
.33 .32 .41 .39
.36
.35 .33 .32
.39
.37 .35 .34
.32
.31
1.50
.47
.43 .37 .35
.37 .35 .44 .42
.40
.37 .36 .35
.42
.40 .39 .37
.36
.35
2.00
.52
.47 .43 .41
.43 .41 .49 .46
.45
.43 .42 .40
.47
.45 .44 .42
.41
.40
2.50
.56
.50 .48 .44
.48 .44 .53 .49
.49
.46 .46 .44
.50
.48 .47 .45
.45
.43
3.00
.59
.52 .51 .47
.51 .47 .55 .52
.52
.48 .49 .46
.52
.50 .50 .48
.47
.46
Project 1 Lighting and Acoustic Performance Evaluation and Design
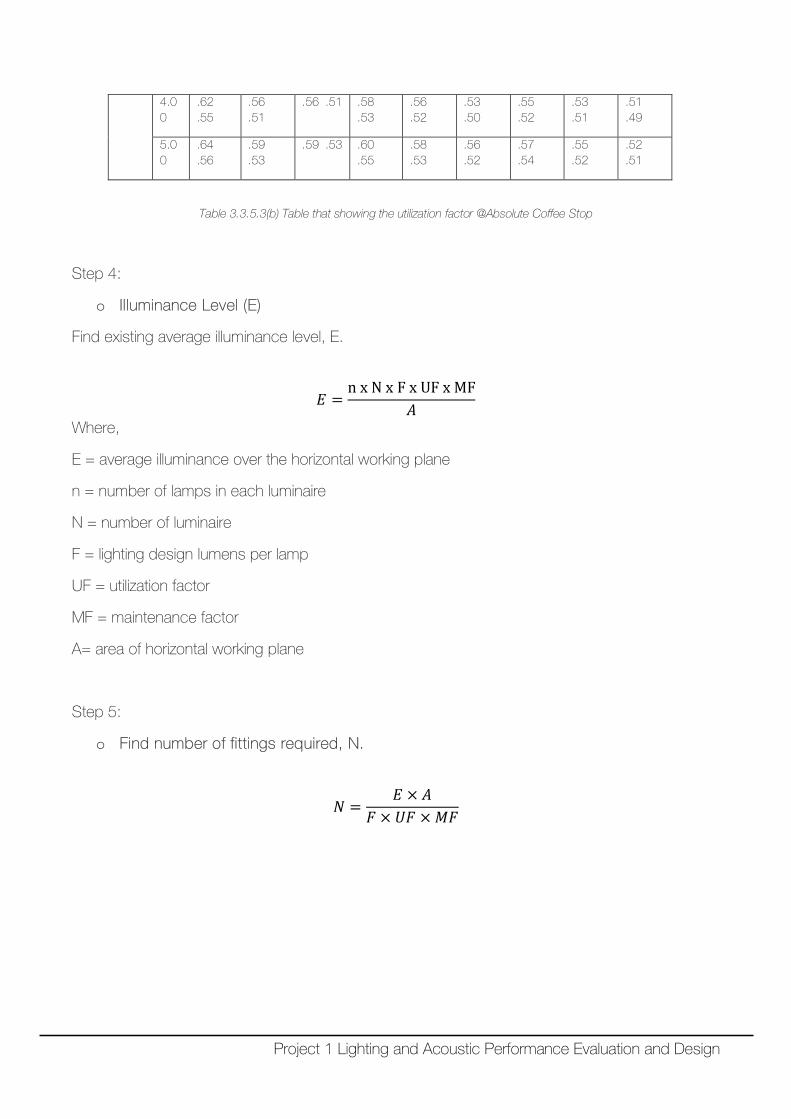
4.00
.62
.55 .56 .51
.56 .51 .58 .53
.56
.52 .53 .50
.55
.52 .53 .51
.51
.49
5.00
.64
.56 .59 .53
.59 .53 .60 .55
.58
.53 .56 .52
.57
.54 .55 .52
.52
.51
Table 3.3.5.3(b) Table that showing the utilization factor @Absolute Coffee Stop
Step 4:
o Illuminance Level (E)
Find existing average illuminance level, E.
𝐸𝐸 =n x N x F x UF x MF
𝐴𝐴
Where,
E = average illuminance over the horizontal working plane
n = number of lamps in each luminaire
N = number of luminaire
F = lighting design lumens per lamp
UF = utilization factor
MF = maintenance factor
A= area of horizontal working plane
Step 5:
o Find number of fittings required, N.
𝑁𝑁 =𝐸𝐸 × 𝐴𝐴
𝐷𝐷 × 𝑈𝑈𝐷𝐷 × 𝑀𝑀𝐷𝐷
Project 1 Lighting and Acoustic Performance Evaluation and Design
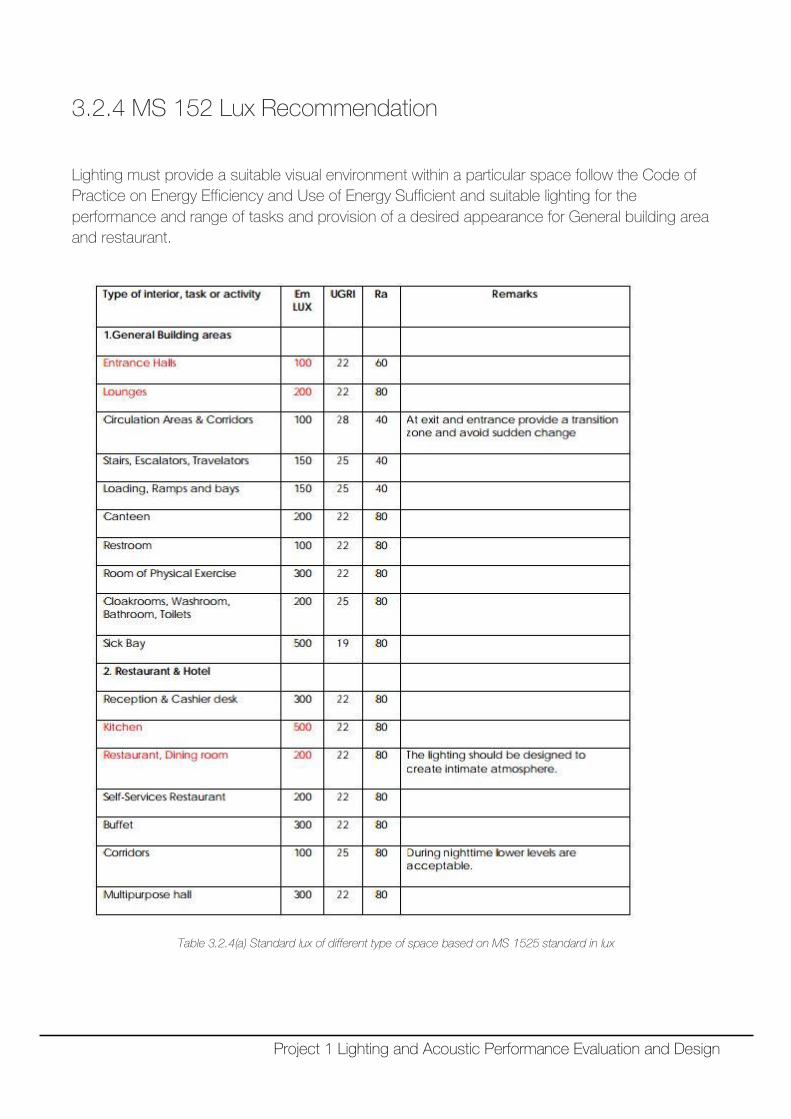
3.2.4 MS 152 Lux Recommendation
Lighting must provide a suitable visual environment within a particular space follow the Code of Practice on Energy Efficiency and Use of Energy Sufficient and suitable lighting for the performance and range of tasks and provision of a desired appearance for General building area and restaurant.
Table 3.2.4(a) Standard lux of different type of space based on MS 1525 standard in lux
Project 1 Lighting and Acoustic Performance Evaluation and Design
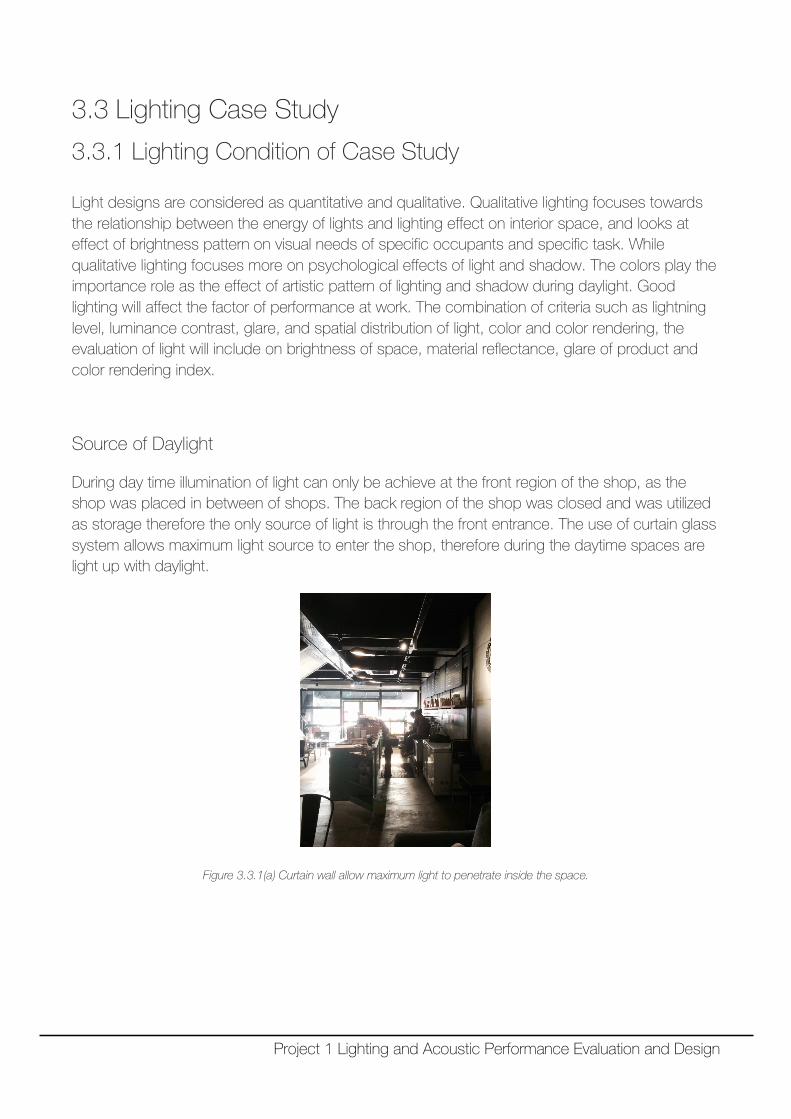
3.3 Lighting Case Study
3.3.1 Lighting Condition of Case Study
Light designs are considered as quantitative and qualitative. Qualitative lighting focuses towards the relationship between the energy of lights and lighting effect on interior space, and looks at effect of brightness pattern on visual needs of specific occupants and specific task. While qualitative lighting focuses more on psychological effects of light and shadow. The colors play the importance role as the effect of artistic pattern of lighting and shadow during daylight. Good lighting will affect the factor of performance at work. The combination of criteria such as lightning level, luminance contrast, glare, and spatial distribution of light, color and color rendering, the evaluation of light will include on brightness of space, material reflectance, glare of product and color rendering index.
Source of Daylight
During day time illumination of light can only be achieve at the front region of the shop, as the shop was placed in between of shops. The back region of the shop was closed and was utilized as storage therefore the only source of light is through the front entrance. The use of curtain glass system allows maximum light source to enter the shop, therefore during the daytime spaces are light up with daylight.
Figure 3.3.1(a) Curtain wall allow maximum light to penetrate inside the space.
Project 1 Lighting and Acoustic Performance Evaluation and Design
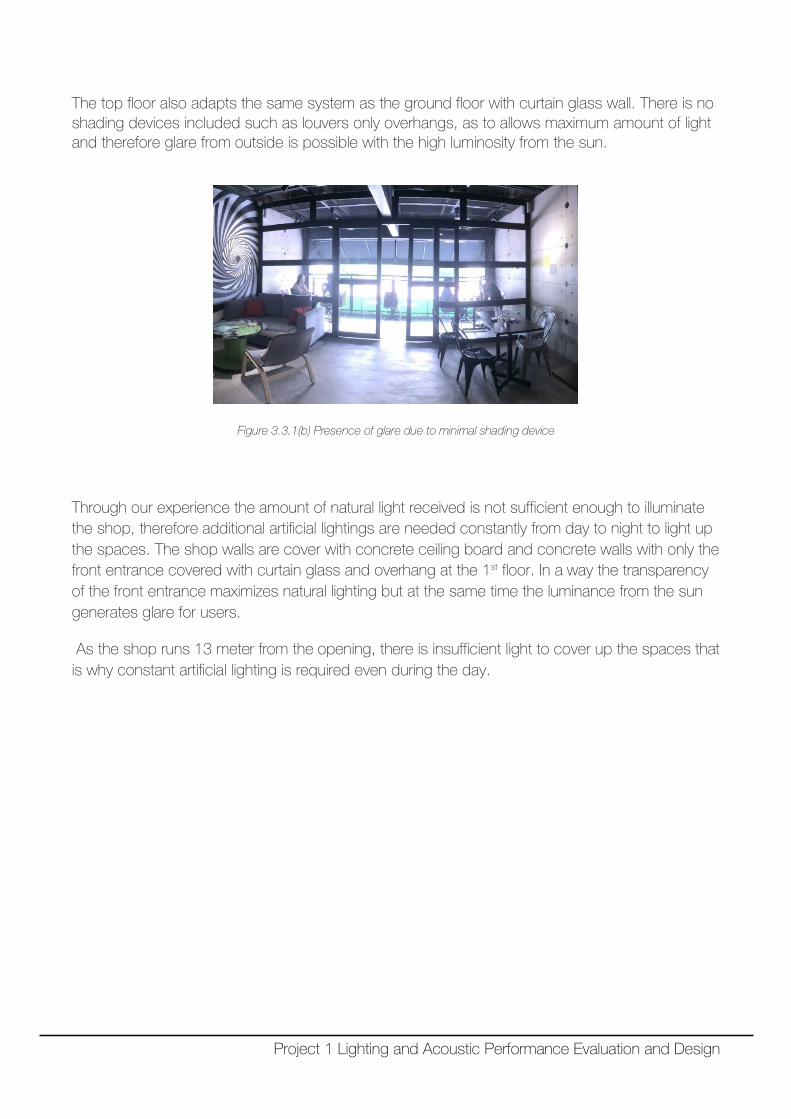
The top floor also adapts the same system as the ground floor with curtain glass wall. There is no shading devices included such as louvers only overhangs, as to allows maximum amount of light and therefore glare from outside is possible with the high luminosity from the sun.
Figure 3.3.1(b) Presence of glare due to minimal shading device
Through our experience the amount of natural light received is not sufficient enough to illuminate the shop, therefore additional artificial lightings are needed constantly from day to night to light up the spaces. The shop walls are cover with concrete ceiling board and concrete walls with only the front entrance covered with curtain glass and overhang at the 1st floor. In a way the transparency of the front entrance maximizes natural lighting but at the same time the luminance from the sun generates glare for users.
As the shop runs 13 meter from the opening, there is insufficient light to cover up the spaces that is why constant artificial lighting is required even during the day.
Project 1 Lighting and Acoustic Performance Evaluation and Design
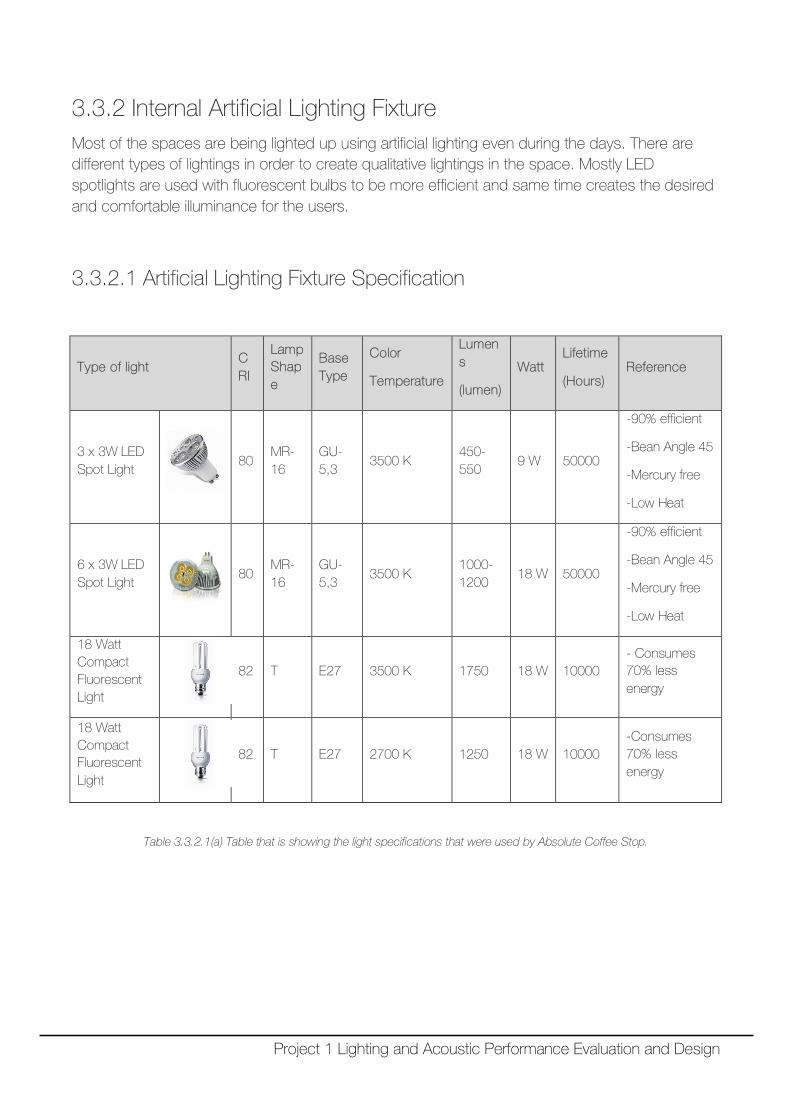
3.3.2 Internal Artificial Lighting Fixture
Most of the spaces are being lighted up using artificial lighting even during the days. There are different types of lightings in order to create qualitative lightings in the space. Mostly LED spotlights are used with fluorescent bulbs to be more efficient and same time creates the desired and comfortable illuminance for the users.
3.3.2.1 Artificial Lighting Fixture Specification
Type of light CRI
Lamp Shape
Base Type
Color
Temperature
Lumens
(lumen)
Watt Lifetime
(Hours) Reference
3 x 3W LED Spot Light
80 MR-16
GU-5,3
3500 K 450-550
9 W 50000
-90% efficient
-Bean Angle 45
-Mercury free
-Low Heat
6 x 3W LED Spot Light
80 MR-16
GU-5,3
3500 K 1000-1200
18 W 50000
-90% efficient
-Bean Angle 45
-Mercury free
-Low Heat
18 Watt Compact Fluorescent Light
82 T E27 3500 K 1750 18 W 10000 - Consumes 70% less energy
18 Watt Compact Fluorescent Light
82 T E27 2700 K 1250 18 W 10000 -Consumes 70% less energy
Table 3.3.2.1(a) Table that is showing the light specifications that were used by Absolute Coffee Stop.
Project 1 Lighting and Acoustic Performance Evaluation and Design
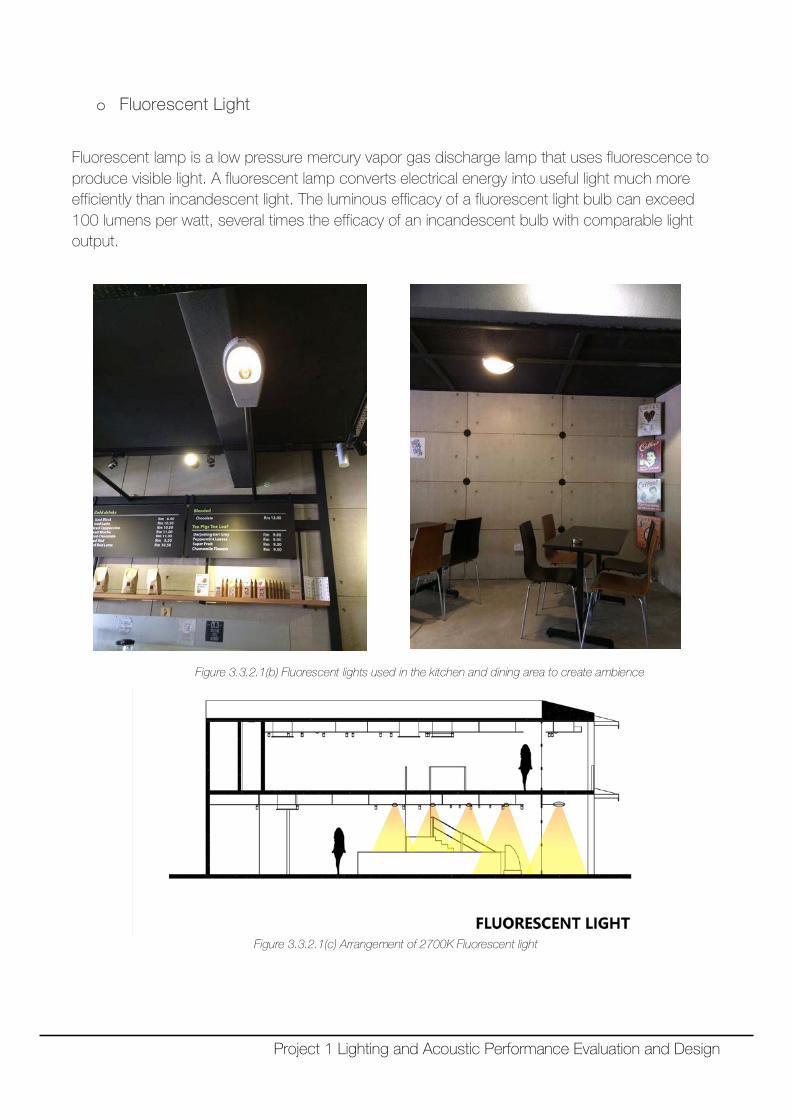
o Fluorescent Light
Fluorescent lamp is a low pressure mercury vapor gas discharge lamp that uses fluorescence to produce visible light. A fluorescent lamp converts electrical energy into useful light much more efficiently than incandescent light. The luminous efficacy of a fluorescent light bulb can exceed 100 lumens per watt, several times the efficacy of an incandescent bulb with comparable light output.
Figure 3.3.2.1(b) Fluorescent lights used in the kitchen and dining area to create ambience
Figure 3.3.2.1(c) Arrangement of 2700K Fluorescent light
Project 1 Lighting and Acoustic Performance Evaluation and Design
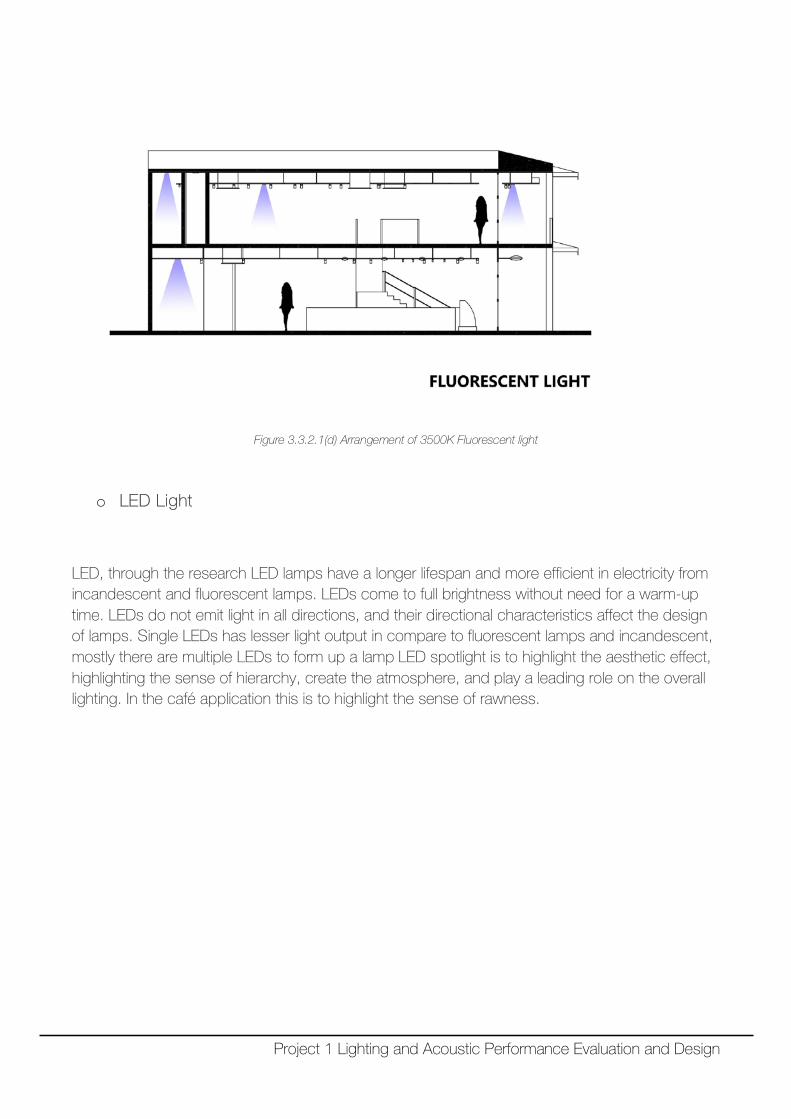
Figure 3.3.2.1(d) Arrangement of 3500K Fluorescent light
o LED Light
LED, through the research LED lamps have a longer lifespan and more efficient in electricity from incandescent and fluorescent lamps. LEDs come to full brightness without need for a warm-up time. LEDs do not emit light in all directions, and their directional characteristics affect the design of lamps. Single LEDs has lesser light output in compare to fluorescent lamps and incandescent, mostly there are multiple LEDs to form up a lamp LED spotlight is to highlight the aesthetic effect, highlighting the sense of hierarchy, create the atmosphere, and play a leading role on the overall lighting. In the café application this is to highlight the sense of rawness.
Project 1 Lighting and Acoustic Performance Evaluation and Design
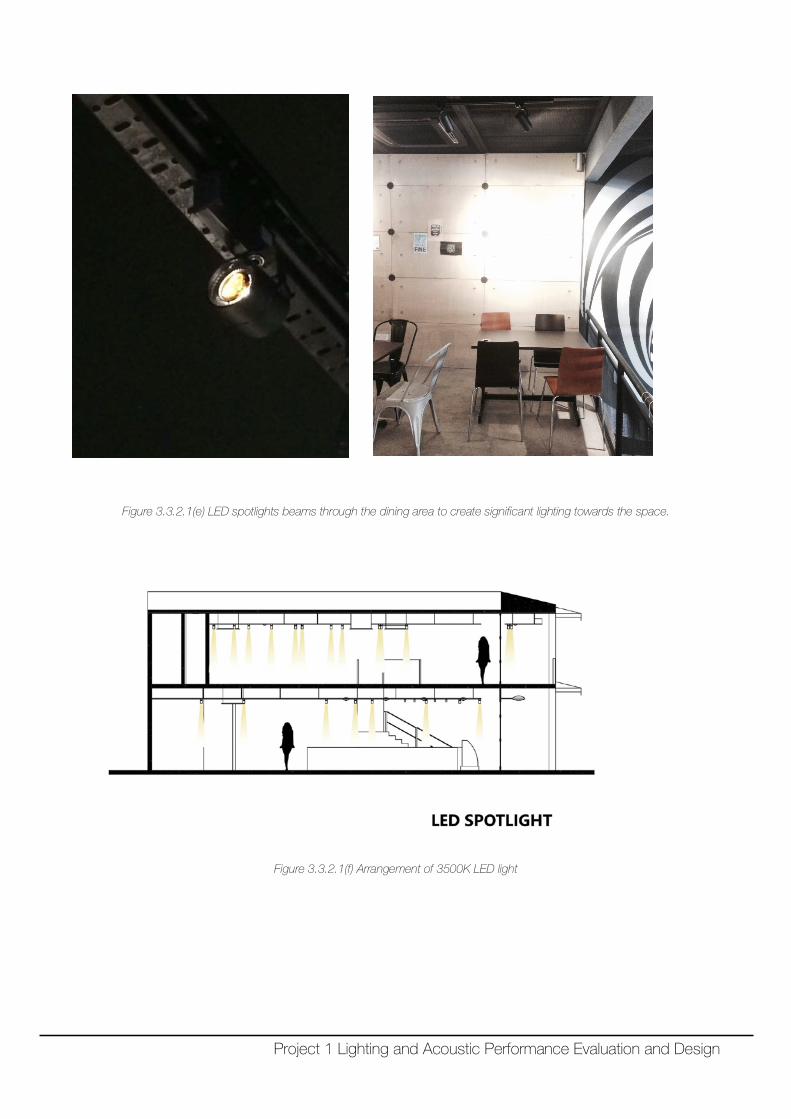
Figure 3.3.2.1(e) LED spotlights beams through the dining area to create significant lighting towards the space.
Figure 3.3.2.1(f) Arrangement of 3500K LED light
Project 1 Lighting and Acoustic Performance Evaluation and Design
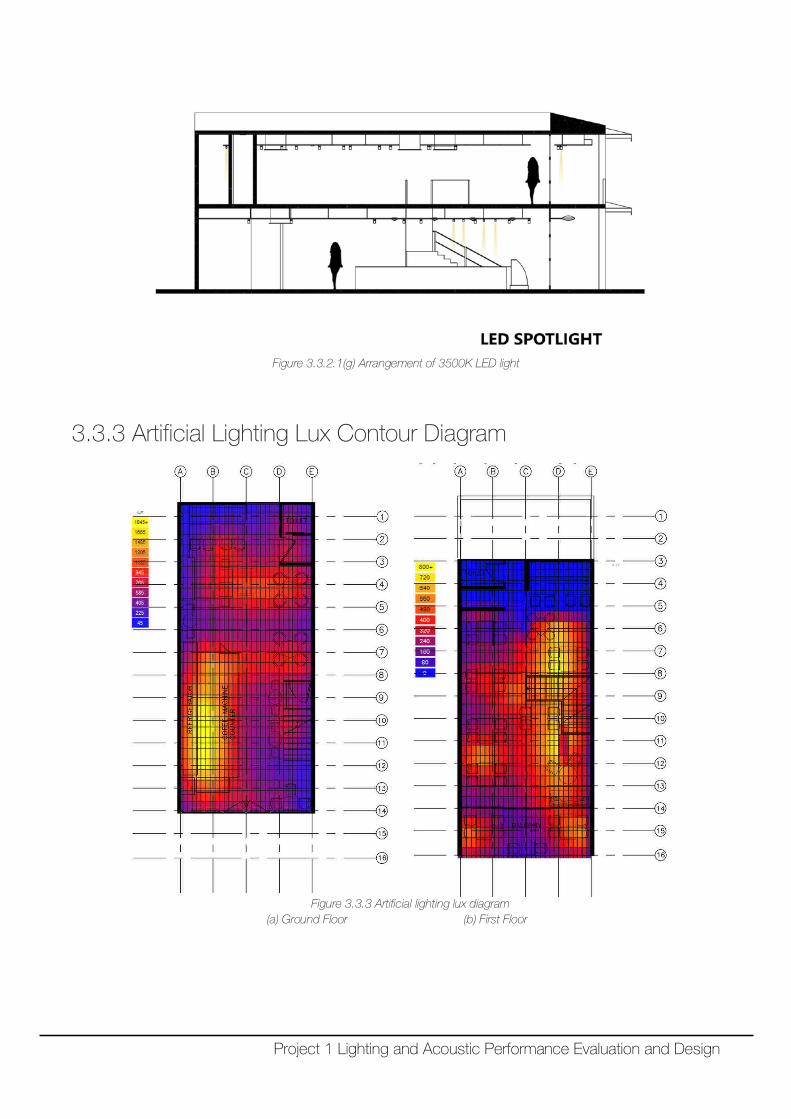
Figure 3.3.2.1(g) Arrangement of 3500K LED light
3.3.3 Artificial Lighting Lux Contour Diagram
Figure 3.3.3 Artificial lighting lux diagram (a) Ground Floor (b) First Floor
Project 1 Lighting and Acoustic Performance Evaluation and Design
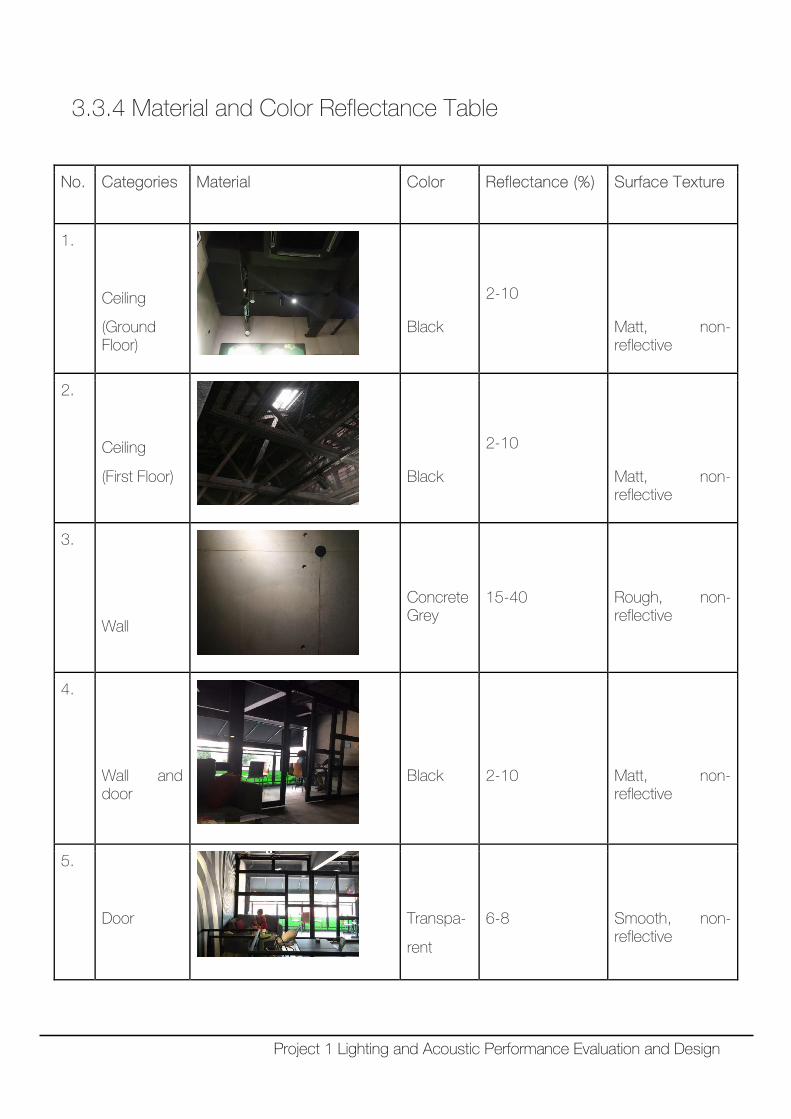
3.3.4 Material and Color Reflectance Table
No. Categories Material Color Reflectance (%) Surface Texture
1.
Ceiling
(Ground Floor)
Black
2-10
Matt, non-reflective
2.
Ceiling
(First Floor)
Black
2-10
Matt, non-reflective
3.
Wall
Concrete Grey
15-40
Rough, non-reflective
4.
Wall and door
Black
2-10
Matt, non-reflective
5.
Door
Transpa-
rent
6-8
Smooth, non-reflective
Project 1 Lighting and Acoustic Performance Evaluation and Design
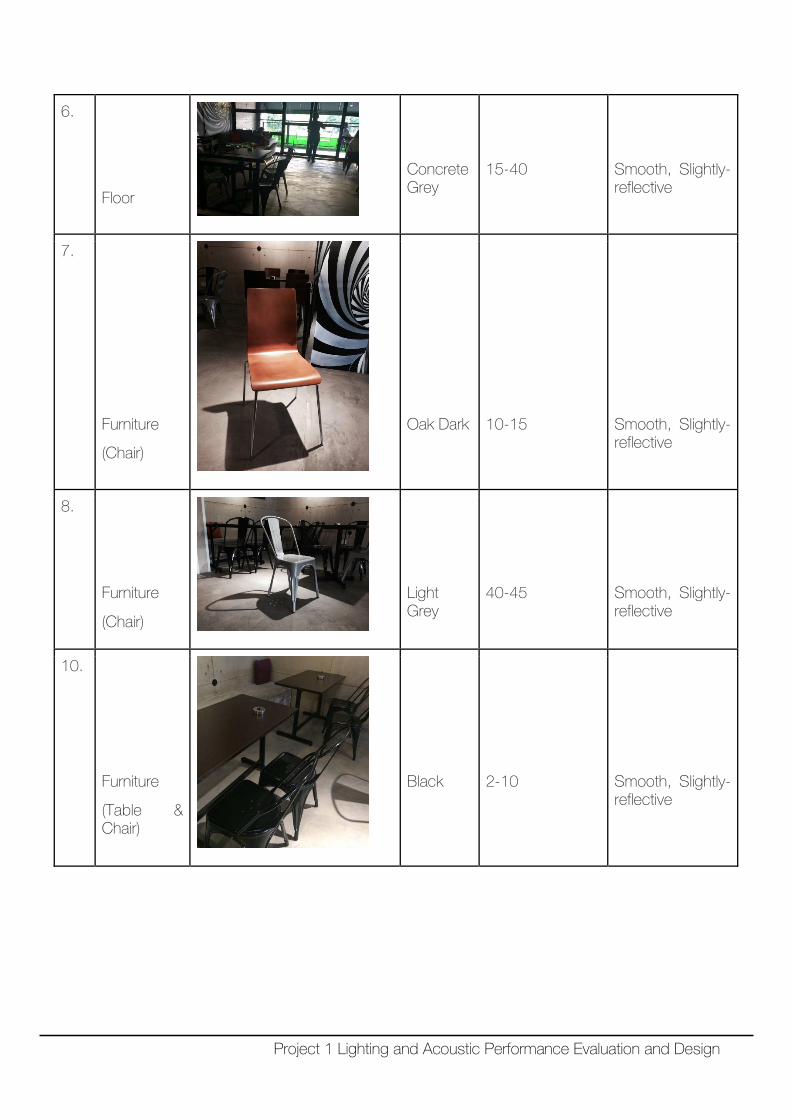
6.
Floor
Concrete Grey
15-40
Smooth, Slightly-reflective
7.
Furniture
(Chair)
Oak Dark
10-15
Smooth, Slightly-reflective
8.
Furniture
(Chair)
Light Grey
40-45
Smooth, Slightly-reflective
10.
Furniture
(Table & Chair)
Black
2-10
Smooth, Slightly-reflective
Project 1 Lighting and Acoustic Performance Evaluation and Design
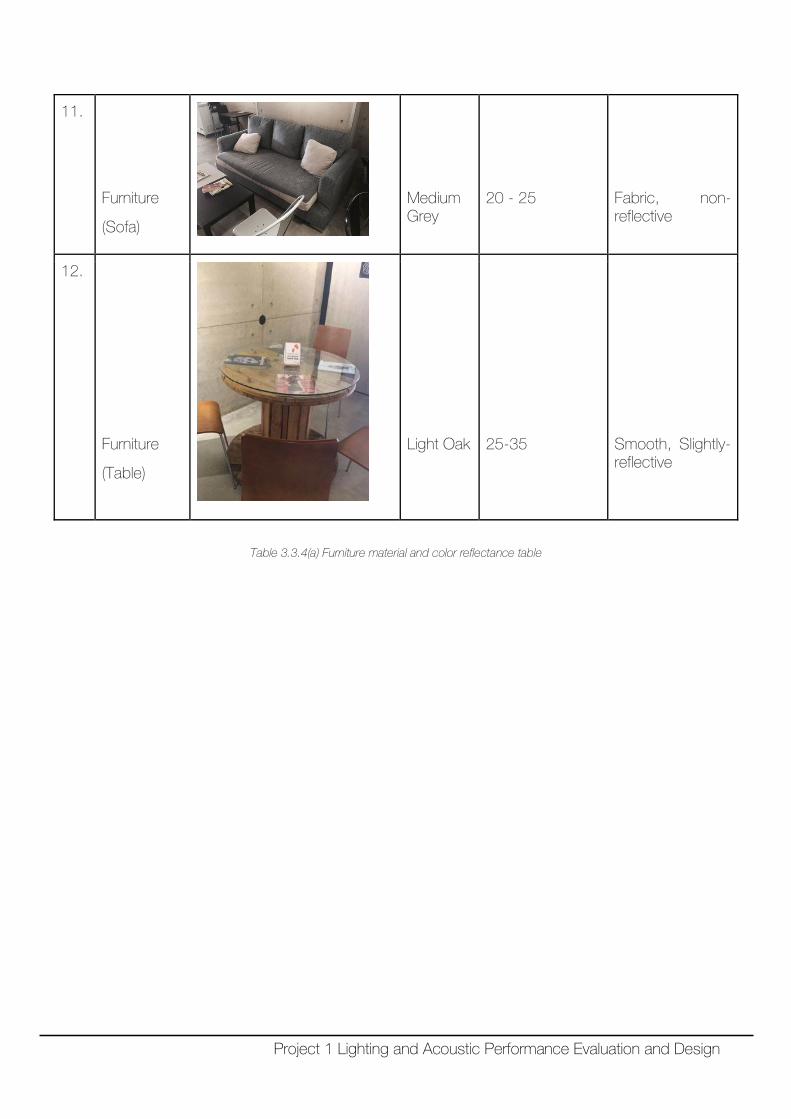
11.
Furniture
(Sofa)
Medium Grey
20 - 25
Fabric, non-reflective
12.
Furniture
(Table)
Light Oak
25-35
Smooth, Slightly-reflective
Table 3.3.4(a) Furniture material and color reflectance table
Project 1 Lighting and Acoustic Performance Evaluation and Design
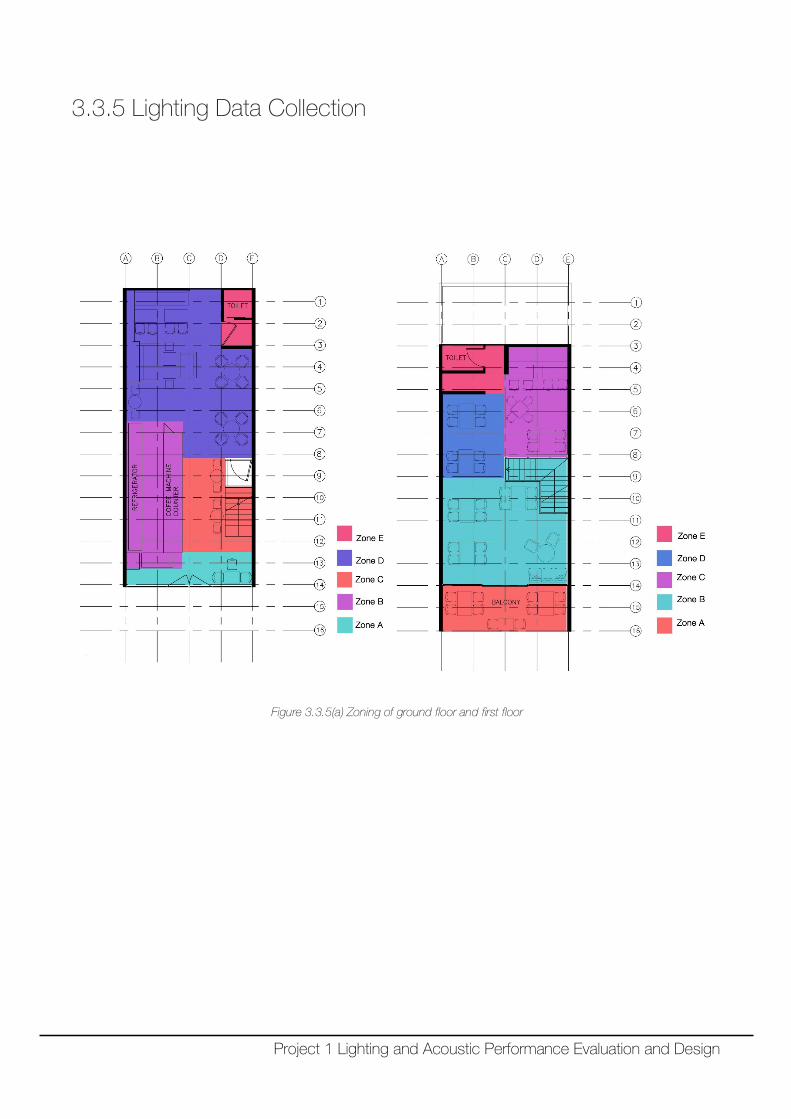
3.3.5 Lighting Data Collection
Figure 3.3.5(a) Zoning of ground floor and first floor
Project 1 Lighting and Acoustic Performance Evaluation and Design
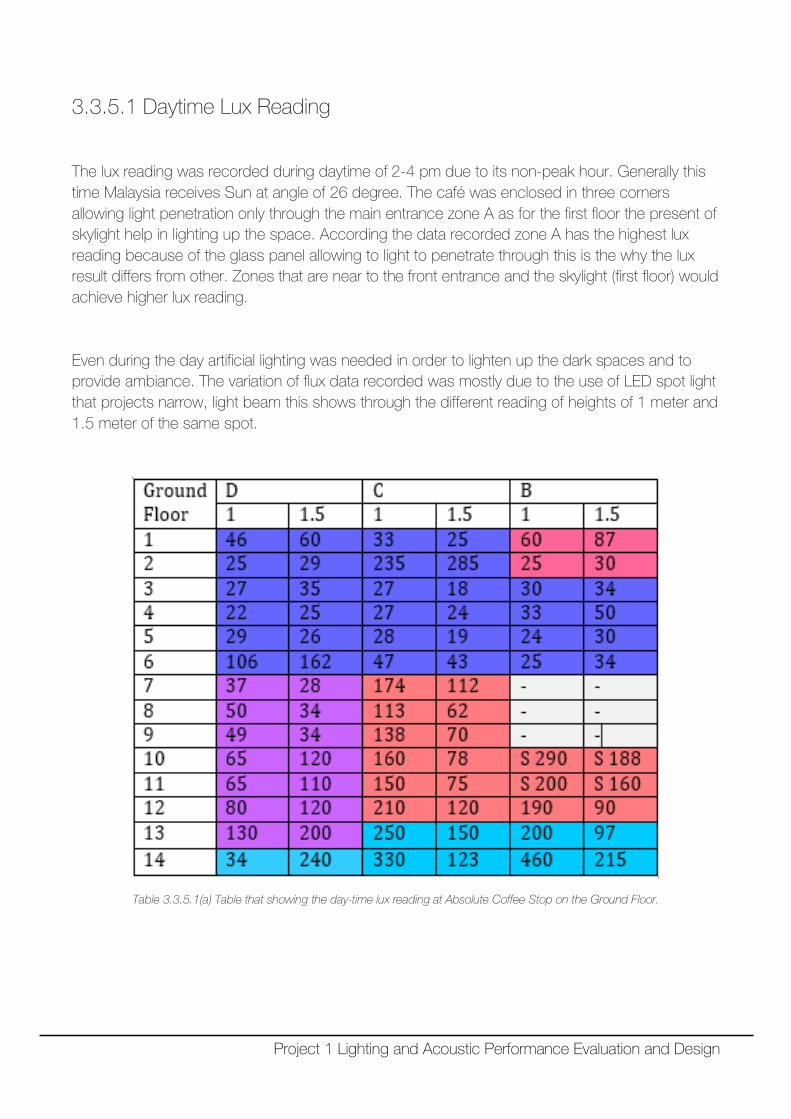
3.3.5.1 Daytime Lux Reading
The lux reading was recorded during daytime of 2-4 pm due to its non-peak hour. Generally this time Malaysia receives Sun at angle of 26 degree. The café was enclosed in three corners allowing light penetration only through the main entrance zone A as for the first floor the present of skylight help in lighting up the space. According the data recorded zone A has the highest lux reading because of the glass panel allowing to light to penetrate through this is the why the lux result differs from other. Zones that are near to the front entrance and the skylight (first floor) would achieve higher lux reading.
Even during the day artificial lighting was needed in order to lighten up the dark spaces and to provide ambiance. The variation of flux data recorded was mostly due to the use of LED spot light that projects narrow, light beam this shows through the different reading of heights of 1 meter and 1.5 meter of the same spot.
Table 3.3.5.1(a) Table that showing the day-time lux reading at Absolute Coffee Stop on the Ground Floor.
Project 1 Lighting and Acoustic Performance Evaluation and Design
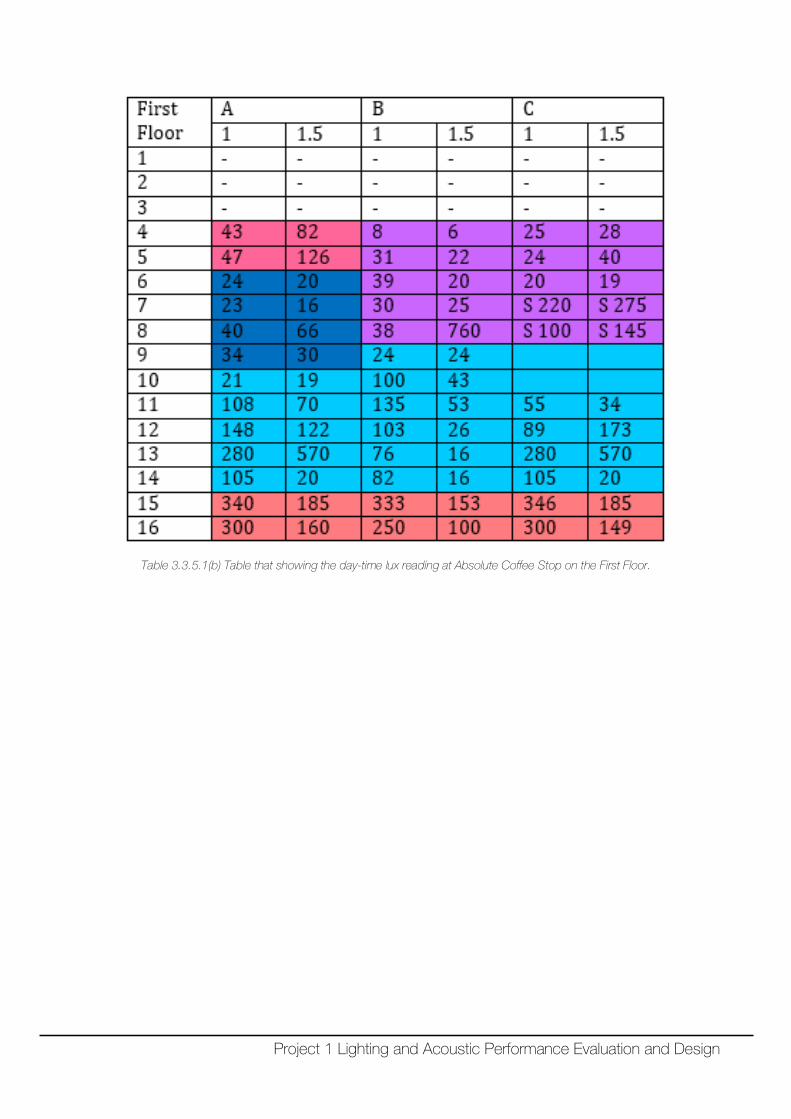
Table 3.3.5.1(b) Table that showing the day-time lux reading at Absolute Coffee Stop on the First Floor.
Project 1 Lighting and Acoustic Performance Evaluation and Design
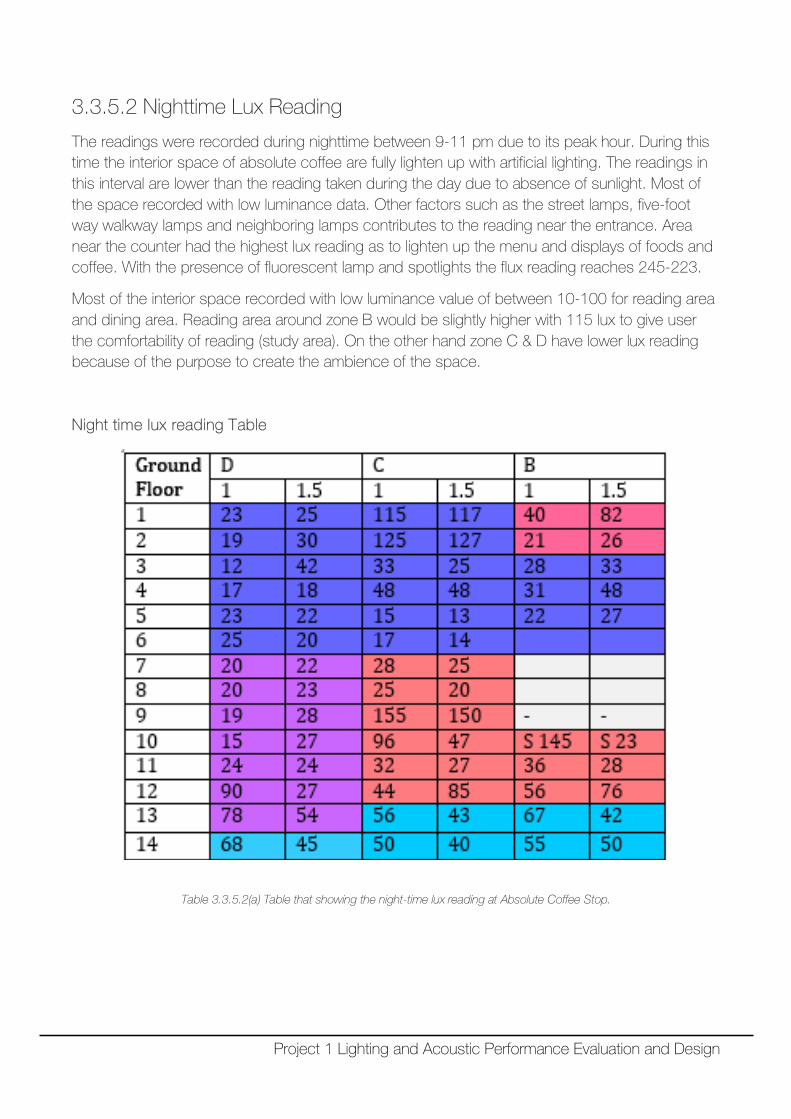
3.3.5.2 Nighttime Lux Reading
The readings were recorded during nighttime between 9-11 pm due to its peak hour. During this time the interior space of absolute coffee are fully lighten up with artificial lighting. The readings in this interval are lower than the reading taken during the day due to absence of sunlight. Most of the space recorded with low luminance data. Other factors such as the street lamps, five-foot way walkway lamps and neighboring lamps contributes to the reading near the entrance. Area near the counter had the highest lux reading as to lighten up the menu and displays of foods and coffee. With the presence of fluorescent lamp and spotlights the flux reading reaches 245-223.
Most of the interior space recorded with low luminance value of between 10-100 for reading area and dining area. Reading area around zone B would be slightly higher with 115 lux to give user the comfortability of reading (study area). On the other hand zone C & D have lower lux reading because of the purpose to create the ambience of the space.
Night time lux reading Table
Table 3.3.5.2(a) Table that showing the night-time lux reading at Absolute Coffee Stop.
Project 1 Lighting and Acoustic Performance Evaluation and Design
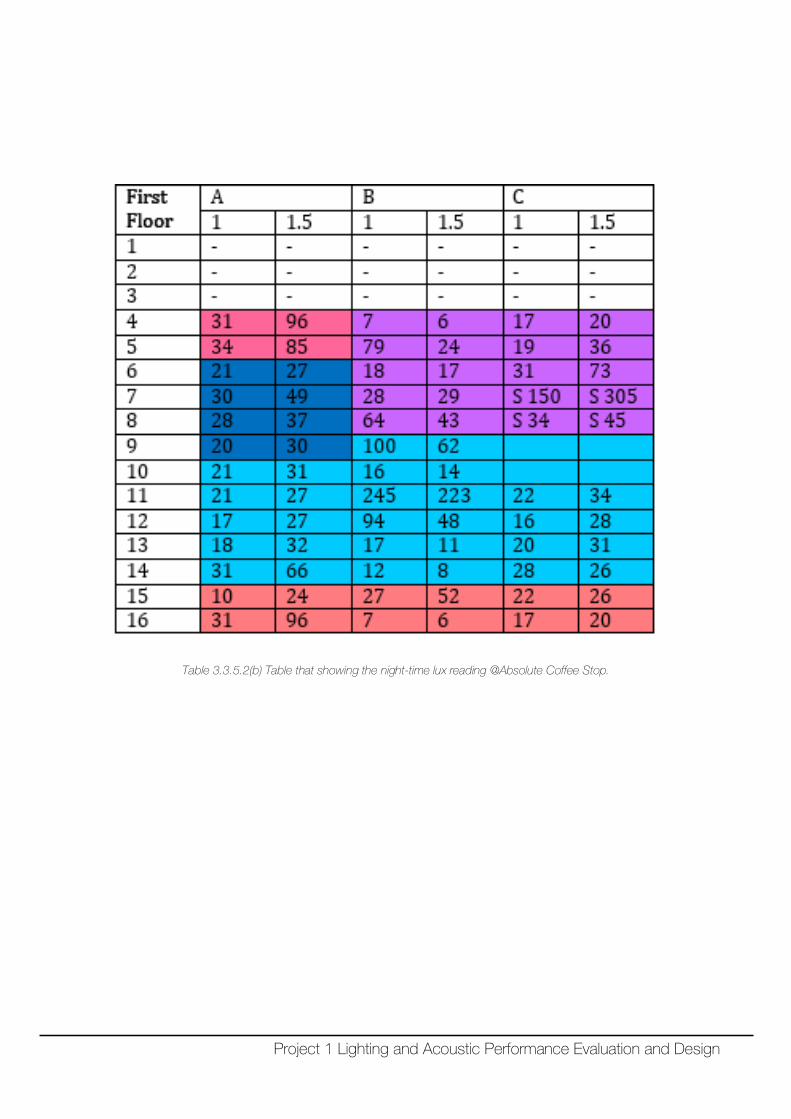
Table 3.3.5.2(b) Table that showing the night-time lux reading @Absolute Coffee Stop.
Project 1 Lighting and Acoustic Performance Evaluation and Design
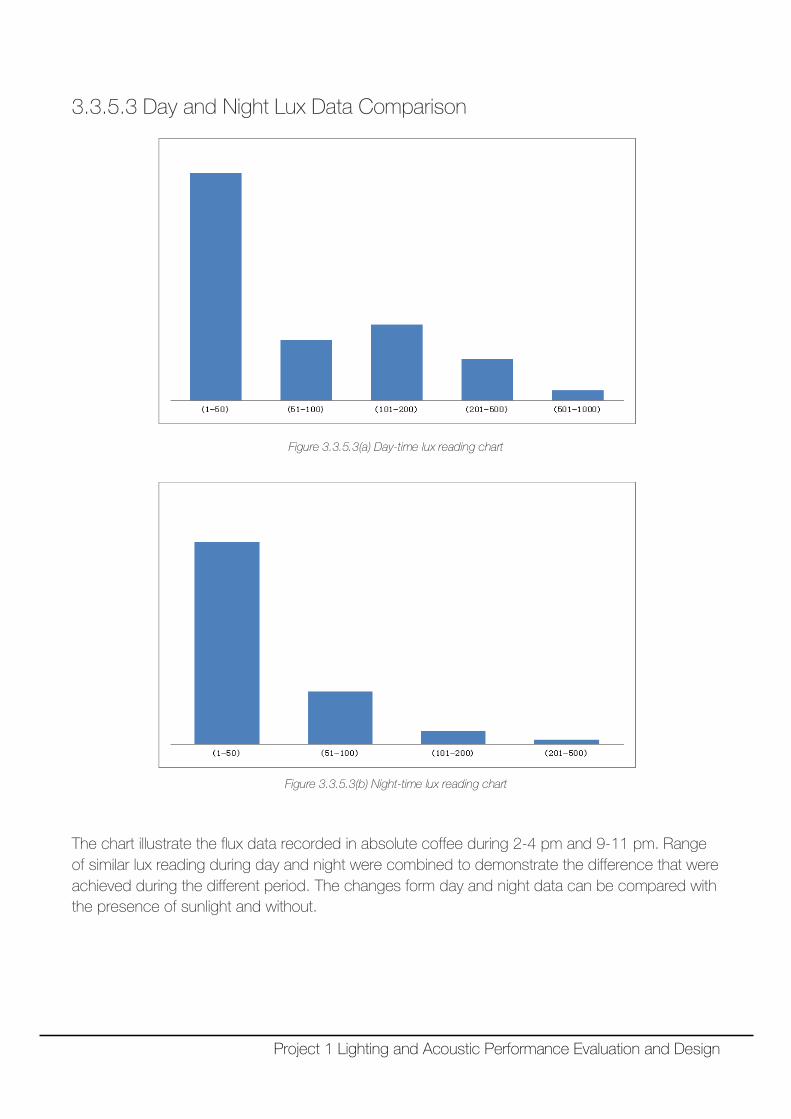
3.3.5.3 Day and Night Lux Data Comparison
Figure 3.3.5.3(a) Day-time lux reading chart
Figure 3.3.5.3(b) Night-time lux reading chart
The chart illustrate the flux data recorded in absolute coffee during 2-4 pm and 9-11 pm. Range of similar lux reading during day and night were combined to demonstrate the difference that were achieved during the different period. The changes form day and night data can be compared with the presence of sunlight and without.
Project 1 Lighting and Acoustic Performance Evaluation and Design
Through the comparison of the night and day data, the chart shows that slight change maintaining the current flux level of 1-50 throughout space mostly. From the interval of 2-4pm (day time) area along the glass wall are brightly lighted while the inner space are lighten with artificial lighting maintain low flux level to achieve the constant ambience level. While for zone X that considers reading/ study area for mostly college uses were lighten up with higher luminance level. Through our evaluation, it’s evident from the data that the intended ambient ranges from 1-50 flux. In conclusion throughout the day absolute coffee tries to achieve the same ambience sense as the consistence lighting through day and night.
Project 1 Lighting and Acoustic Performance Evaluation and Design
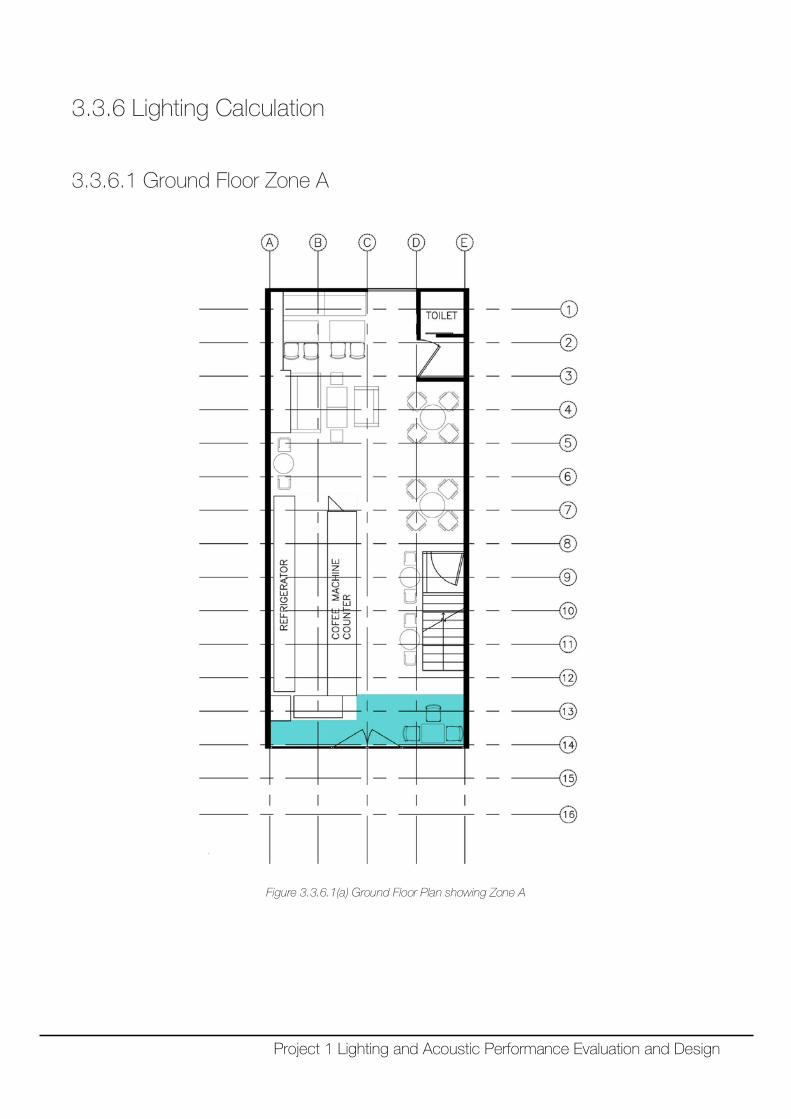
3.3.6 Lighting Calculation
3.3.6.1 Ground Floor Zone A
Figure 3.3.6.1(a) Ground Floor Plan showing Zone A
Project 1 Lighting and Acoustic Performance Evaluation and Design
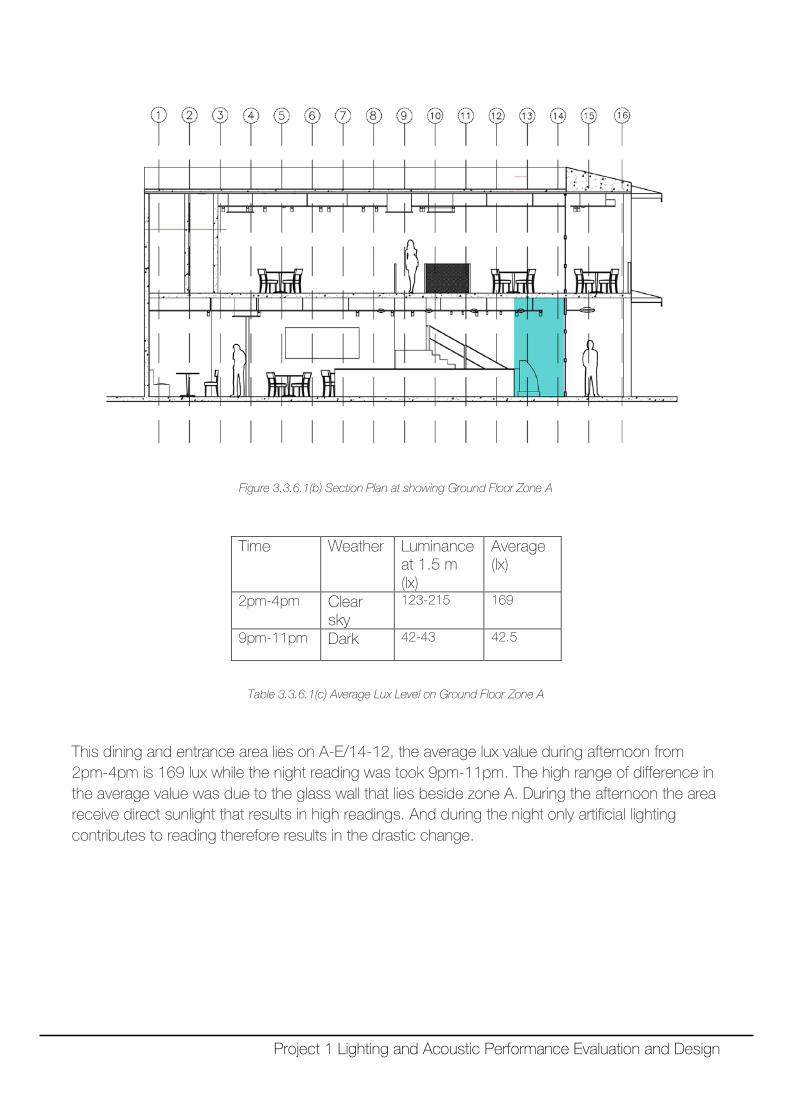
Figure 3.3.6.1(b) Section Plan at showing Ground Floor Zone A
Time Weather Luminance at 1.5 m (lx)
Average (lx)
2pm-4pm Clear sky
123-215 169
9pm-11pm Dark 42-43 42.5
Table 3.3.6.1(c) Average Lux Level on Ground Floor Zone A
This dining and entrance area lies on A-E/14-12, the average lux value during afternoon from 2pm-4pm is 169 lux while the night reading was took 9pm-11pm. The high range of difference in the average value was due to the glass wall that lies beside zone A. During the afternoon the area receive direct sunlight that results in high readings. And during the night only artificial lighting contributes to reading therefore results in the drastic change.
Project 1 Lighting and Acoustic Performance Evaluation and Design
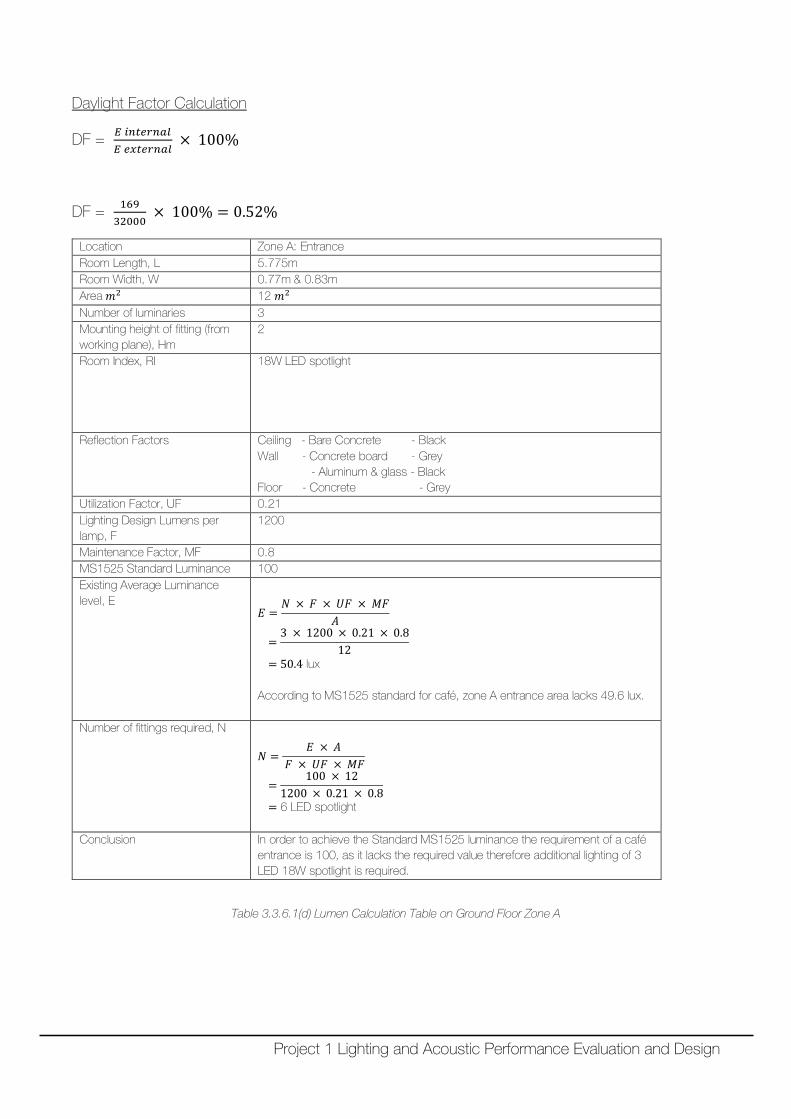
Daylight Factor Calculation
DF = 𝐸𝐸 𝑖𝑖𝑖𝑖𝑖𝑖𝑖𝑖𝑖𝑖𝑖𝑖𝑖𝑖𝑖𝑖𝐸𝐸 𝑖𝑖𝑥𝑥𝑖𝑖𝑖𝑖𝑖𝑖𝑖𝑖𝑖𝑖𝑖𝑖
× 100%
DF = 16932000
× 100% = 0.52%
Location Zone A: Entrance Room Length, L 5.775m Room Width, W 0.77m & 0.83m Area 𝑅𝑅2 12 𝑅𝑅2 Number of luminaries 3 Mounting height of fitting (from working plane), Hm
2
Room Index, RI 18W LED spotlight
Reflection Factors Ceiling - Bare Concrete - Black Wall - Concrete board - Grey - Aluminum & glass - Black Floor - Concrete - Grey
Utilization Factor, UF 0.21 Lighting Design Lumens per lamp, F
1200
Maintenance Factor, MF 0.8 MS1525 Standard Luminance 100 Existing Average Luminance level, E
𝐸𝐸 =𝑁𝑁 × 𝐷𝐷 × 𝑈𝑈𝐷𝐷 × 𝑀𝑀𝐷𝐷
𝐴𝐴
=3 × 1200 × 0.21 × 0.8
12
= 50.4 lux According to MS1525 standard for café, zone A entrance area lacks 49.6 lux.
Number of fittings required, N
𝑁𝑁 =𝐸𝐸 × 𝐴𝐴
𝐷𝐷 × 𝑈𝑈𝐷𝐷 × 𝑀𝑀𝐷𝐷
=100 × 12
1200 × 0.21 × 0.8
= 6 LED spotlight
Conclusion In order to achieve the Standard MS1525 luminance the requirement of a café entrance is 100, as it lacks the required value therefore additional lighting of 3 LED 18W spotlight is required.
Table 3.3.6.1(d) Lumen Calculation Table on Ground Floor Zone A
Project 1 Lighting and Acoustic Performance Evaluation and Design
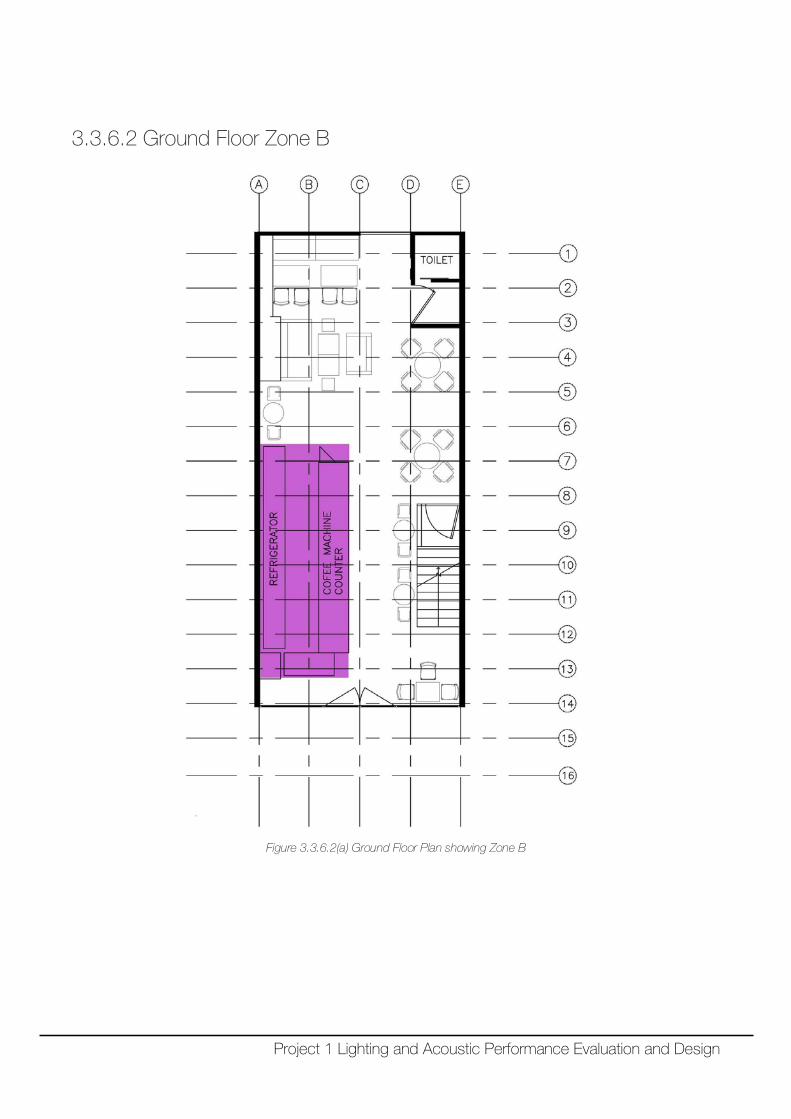
3.3.6.2 Ground Floor Zone B
Figure 3.3.6.2(a) Ground Floor Plan showing Zone B
Project 1 Lighting and Acoustic Performance Evaluation and Design
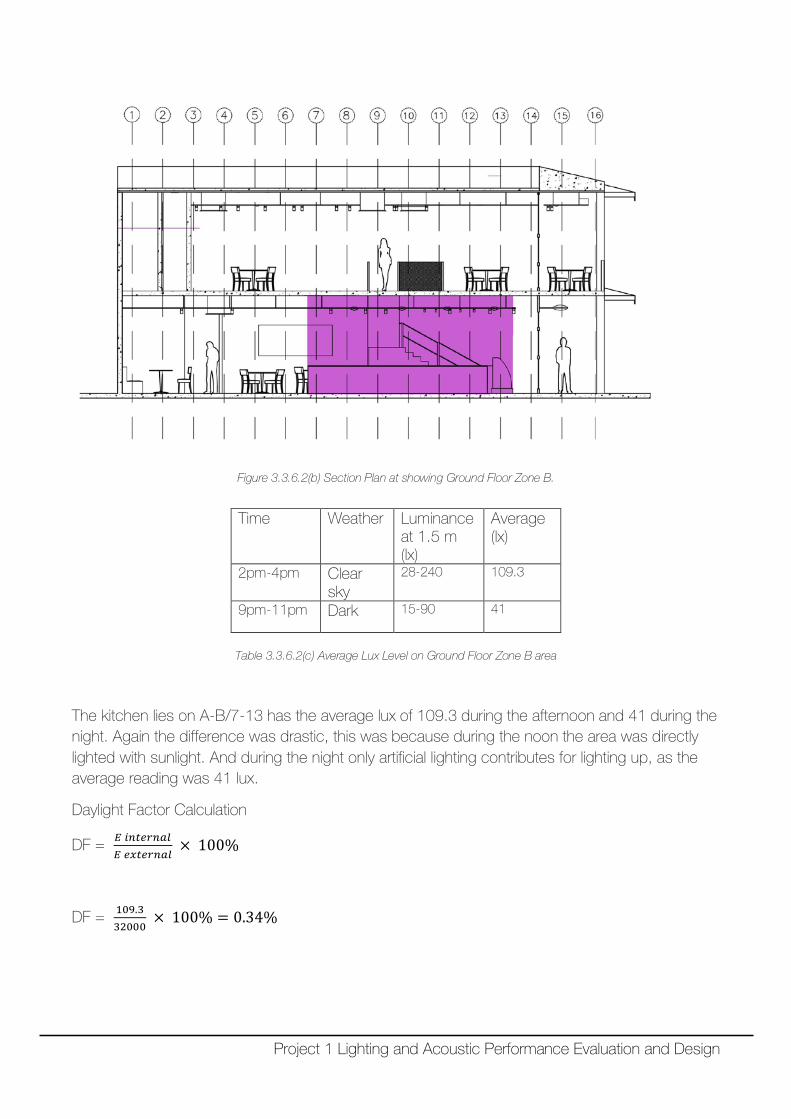
Figure 3.3.6.2(b) Section Plan at showing Ground Floor Zone B.
Table 3.3.6.2(c) Average Lux Level on Ground Floor Zone B area
The kitchen lies on A-B/7-13 has the average lux of 109.3 during the afternoon and 41 during the night. Again the difference was drastic, this was because during the noon the area was directly lighted with sunlight. And during the night only artificial lighting contributes for lighting up, as the average reading was 41 lux.
Daylight Factor Calculation
DF = 𝐸𝐸 𝑖𝑖𝑖𝑖𝑖𝑖𝑖𝑖𝑖𝑖𝑖𝑖𝑖𝑖𝑖𝑖𝐸𝐸 𝑖𝑖𝑥𝑥𝑖𝑖𝑖𝑖𝑖𝑖𝑖𝑖𝑖𝑖𝑖𝑖
× 100%
DF = 109.332000
× 100% = 0.34%
Time Weather Luminance at 1.5 m (lx)
Average (lx)
2pm-4pm Clear sky
28-240 109.3
9pm-11pm Dark 15-90 41
Project 1 Lighting and Acoustic Performance Evaluation and Design
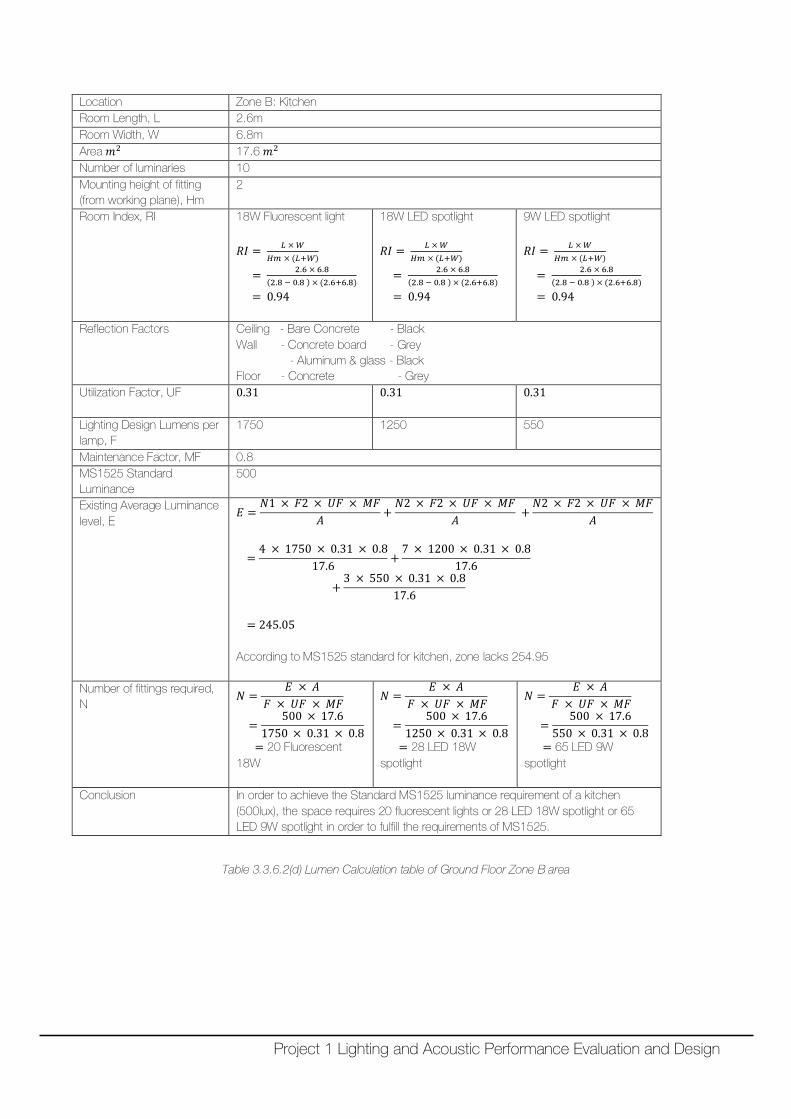
Location Zone B: Kitchen Room Length, L 2.6m Room Width, W 6.8m Area 𝑅𝑅2 17.6 𝑅𝑅2 Number of luminaries 10 Mounting height of fitting (from working plane), Hm
2
Room Index, RI 18W Fluorescent light
𝑅𝑅𝑅𝑅 = 𝐿𝐿 × 𝑊𝑊𝐻𝐻𝐻𝐻 × (𝐿𝐿+𝑊𝑊)
= 2.6 × 6.8(2.8 − 0.8 ) × (2.6+6.8)
= 0.94
18W LED spotlight
𝑅𝑅𝑅𝑅 = 𝐿𝐿 × 𝑊𝑊𝐻𝐻𝐻𝐻 × (𝐿𝐿+𝑊𝑊)
= 2.6 × 6.8(2.8 − 0.8 ) × (2.6+6.8)
= 0.94
9W LED spotlight
𝑅𝑅𝑅𝑅 = 𝐿𝐿 × 𝑊𝑊𝐻𝐻𝐻𝐻 × (𝐿𝐿+𝑊𝑊)
= 2.6 × 6.8(2.8 − 0.8 ) × (2.6+6.8)
= 0.94
Reflection Factors Ceiling - Bare Concrete - Black Wall - Concrete board - Grey - Aluminum & glass - Black Floor - Concrete - Grey
Utilization Factor, UF 0.31
0.31
0.31
Lighting Design Lumens per lamp, F
1750 1250 550
Maintenance Factor, MF 0.8 MS1525 Standard Luminance
500
Existing Average Luminance level, E
𝐸𝐸 =𝑁𝑁1 × 𝐷𝐷2 × 𝑈𝑈𝐷𝐷 × 𝑀𝑀𝐷𝐷
𝐴𝐴 +𝑁𝑁2 × 𝐷𝐷2 × 𝑈𝑈𝐷𝐷 × 𝑀𝑀𝐷𝐷
𝐴𝐴 +𝑁𝑁2 × 𝐷𝐷2 × 𝑈𝑈𝐷𝐷 × 𝑀𝑀𝐷𝐷
𝐴𝐴
=4 × 1750 × 0.31 × 0.8
17.6 +7 × 1200 × 0.31 × 0.8
17.6
+3 × 550 × 0.31 × 0.8
17.6
= 245.05 According to MS1525 standard for kitchen, zone lacks 254.95
Number of fittings required, N
𝑁𝑁 =𝐸𝐸 × 𝐴𝐴
𝐷𝐷 × 𝑈𝑈𝐷𝐷 × 𝑀𝑀𝐷𝐷
=500 × 17.6
1750 × 0.31 × 0.8
= 20 Fluorescent 18W
𝑁𝑁 =𝐸𝐸 × 𝐴𝐴
𝐷𝐷 × 𝑈𝑈𝐷𝐷 × 𝑀𝑀𝐷𝐷
=500 × 17.6
1250 × 0.31 × 0.8
= 28 LED 18W spotlight
𝑁𝑁 =𝐸𝐸 × 𝐴𝐴
𝐷𝐷 × 𝑈𝑈𝐷𝐷 × 𝑀𝑀𝐷𝐷
=500 × 17.6
550 × 0.31 × 0.8
= 65 LED 9W spotlight
Conclusion In order to achieve the Standard MS1525 luminance requirement of a kitchen (500lux), the space requires 20 fluorescent lights or 28 LED 18W spotlight or 65 LED 9W spotlight in order to fulfill the requirements of MS1525.
Table 3.3.6.2(d) Lumen Calculation table of Ground Floor Zone B area
Project 1 Lighting and Acoustic Performance Evaluation and Design
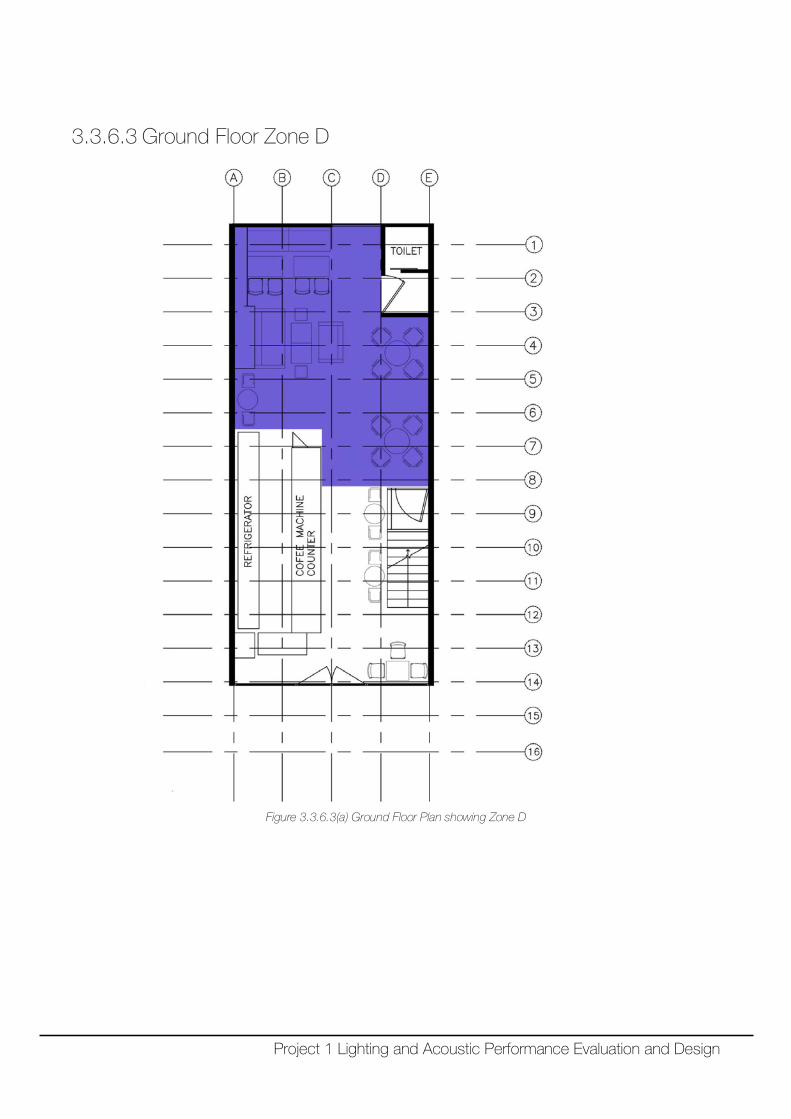
3.3.6.3 Ground Floor Zone D
Figure 3.3.6.3(a) Ground Floor Plan showing Zone D
Project 1 Lighting and Acoustic Performance Evaluation and Design
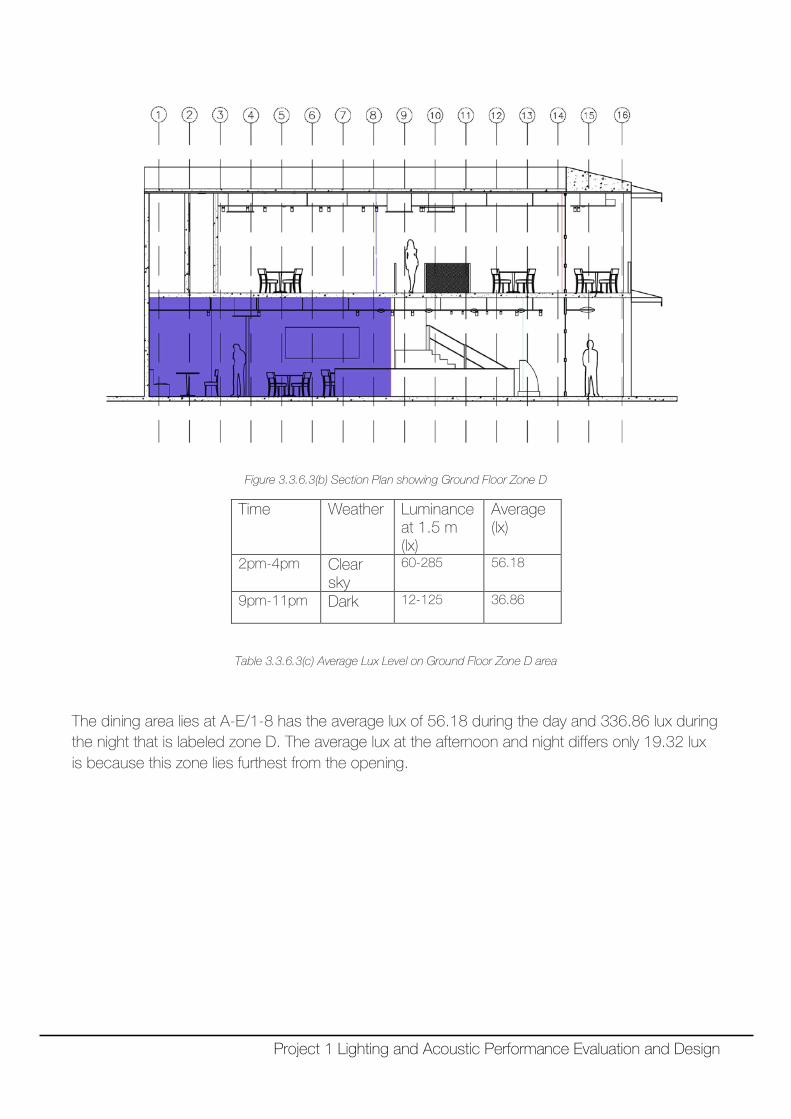
Figure 3.3.6.3(b) Section Plan showing Ground Floor Zone D
Time Weather Luminance at 1.5 m (lx)
Average (lx)
2pm-4pm Clear sky
60-285 56.18
9pm-11pm Dark 12-125 36.86
Table 3.3.6.3(c) Average Lux Level on Ground Floor Zone D area
The dining area lies at A-E/1-8 has the average lux of 56.18 during the day and 336.86 lux during the night that is labeled zone D. The average lux at the afternoon and night differs only 19.32 lux is because this zone lies furthest from the opening.
Project 1 Lighting and Acoustic Performance Evaluation and Design
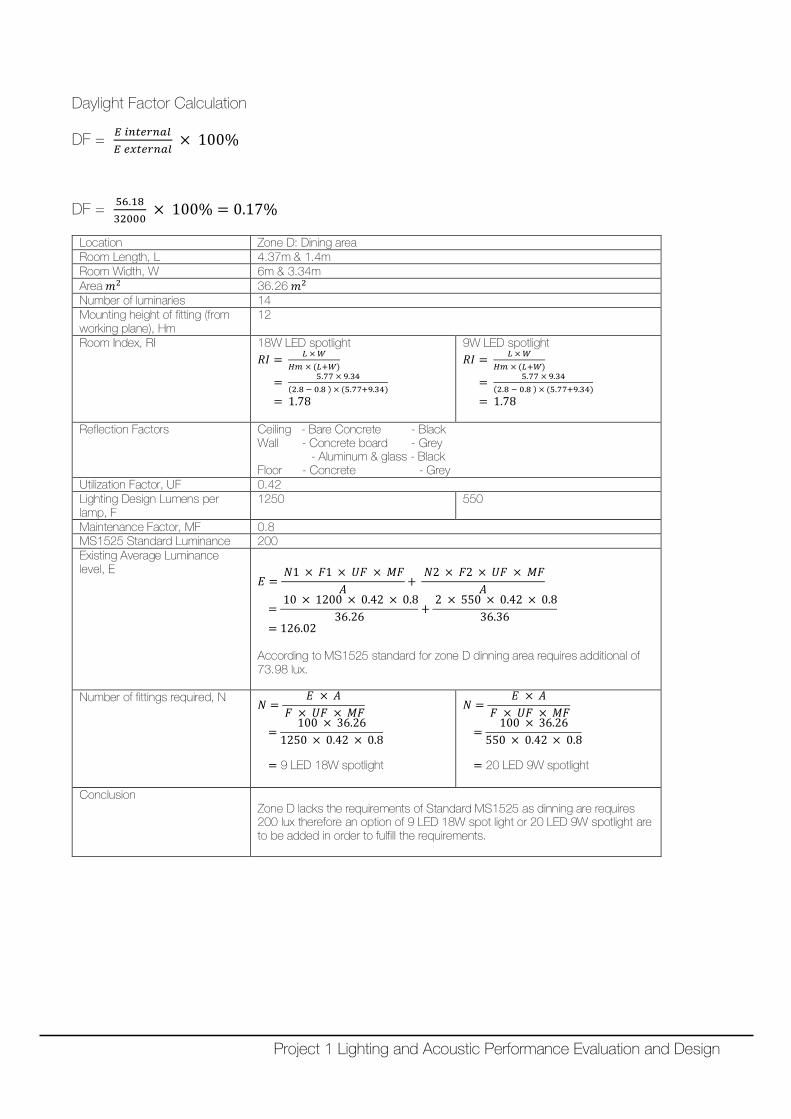
Daylight Factor Calculation
DF = 𝐸𝐸 𝑖𝑖𝑖𝑖𝑖𝑖𝑖𝑖𝑖𝑖𝑖𝑖𝑖𝑖𝑖𝑖𝐸𝐸 𝑖𝑖𝑥𝑥𝑖𝑖𝑖𝑖𝑖𝑖𝑖𝑖𝑖𝑖𝑖𝑖
× 100%
DF = 56.1832000
× 100% = 0.17%
Location Zone D: Dining area Room Length, L 4.37m & 1.4m Room Width, W 6m & 3.34m Area 𝑅𝑅2 36.26 𝑅𝑅2 Number of luminaries 14 Mounting height of fitting (from working plane), Hm
12
Room Index, RI 18W LED spotlight 𝑅𝑅𝑅𝑅 = 𝐿𝐿 × 𝑊𝑊
𝐻𝐻𝐻𝐻 × (𝐿𝐿+𝑊𝑊)
= 5.77 × 9.34(2.8 − 0.8 ) × (5.77+9.34)
= 1.78
9W LED spotlight 𝑅𝑅𝑅𝑅 = 𝐿𝐿 × 𝑊𝑊
𝐻𝐻𝐻𝐻 × (𝐿𝐿+𝑊𝑊)
= 5.77 × 9.34(2.8 − 0.8 ) × (5.77+9.34)
= 1.78
Reflection Factors Ceiling - Bare Concrete - Black Wall - Concrete board - Grey - Aluminum & glass - Black Floor - Concrete - Grey
Utilization Factor, UF 0.42 Lighting Design Lumens per lamp, F
1250 550
Maintenance Factor, MF 0.8 MS1525 Standard Luminance 200 Existing Average Luminance level, E
𝐸𝐸 =
𝑁𝑁1 × 𝐷𝐷1 × 𝑈𝑈𝐷𝐷 × 𝑀𝑀𝐷𝐷𝐴𝐴 +
𝑁𝑁2 × 𝐷𝐷2 × 𝑈𝑈𝐷𝐷 × 𝑀𝑀𝐷𝐷𝐴𝐴
= 10 × 1200 × 0.42 × 0.8
36.26 + 2 × 550 × 0.42 × 0.8
36.36
= 126.02 According to MS1525 standard for zone D dinning area requires additional of 73.98 lux.
Number of fittings required, N 𝑁𝑁 =𝐸𝐸 × 𝐴𝐴
𝐷𝐷 × 𝑈𝑈𝐷𝐷 × 𝑀𝑀𝐷𝐷
=100 × 36.26
1250 × 0.42 × 0.8 = 9 LED 18W spotlight
𝑁𝑁 =𝐸𝐸 × 𝐴𝐴
𝐷𝐷 × 𝑈𝑈𝐷𝐷 × 𝑀𝑀𝐷𝐷
=100 × 36.26
550 × 0.42 × 0.8 = 20 LED 9W spotlight
Conclusion Zone D lacks the requirements of Standard MS1525 as dinning are requires 200 lux therefore an option of 9 LED 18W spot light or 20 LED 9W spotlight are to be added in order to fulfill the requirements.
Project 1 Lighting and Acoustic Performance Evaluation and Design
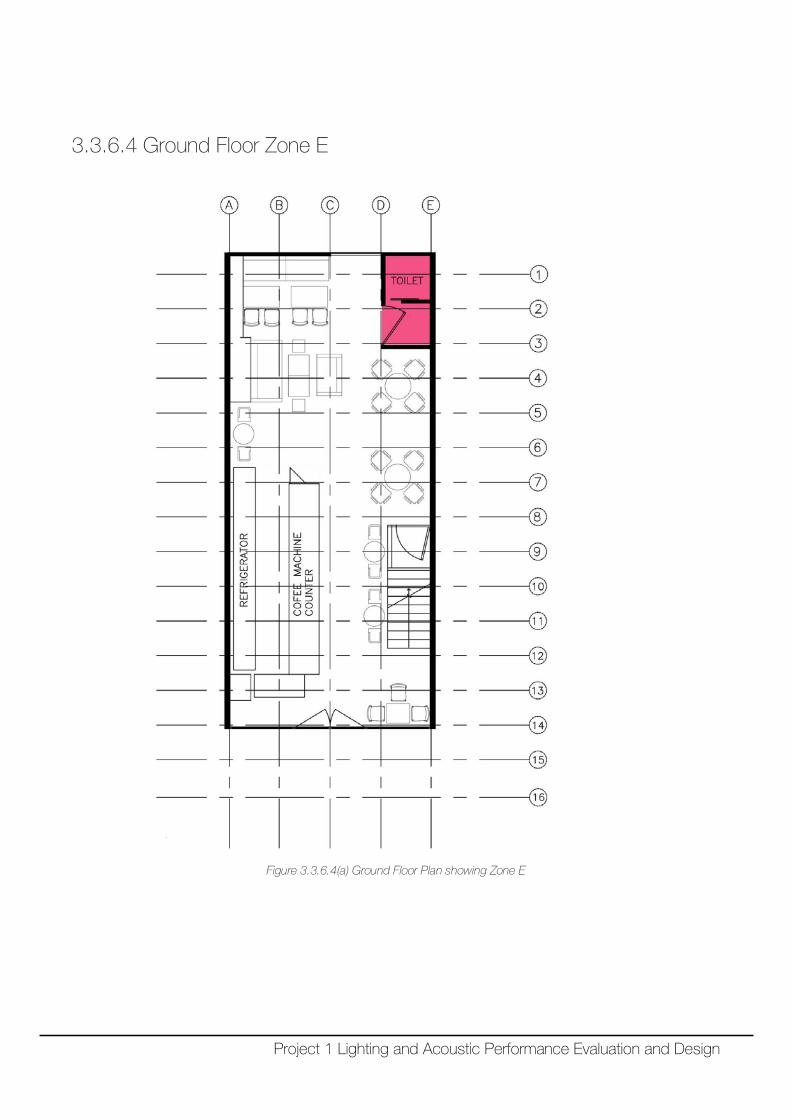
3.3.6.4 Ground Floor Zone E
Figure 3.3.6.4(a) Ground Floor Plan showing Zone E
Project 1 Lighting and Acoustic Performance Evaluation and Design
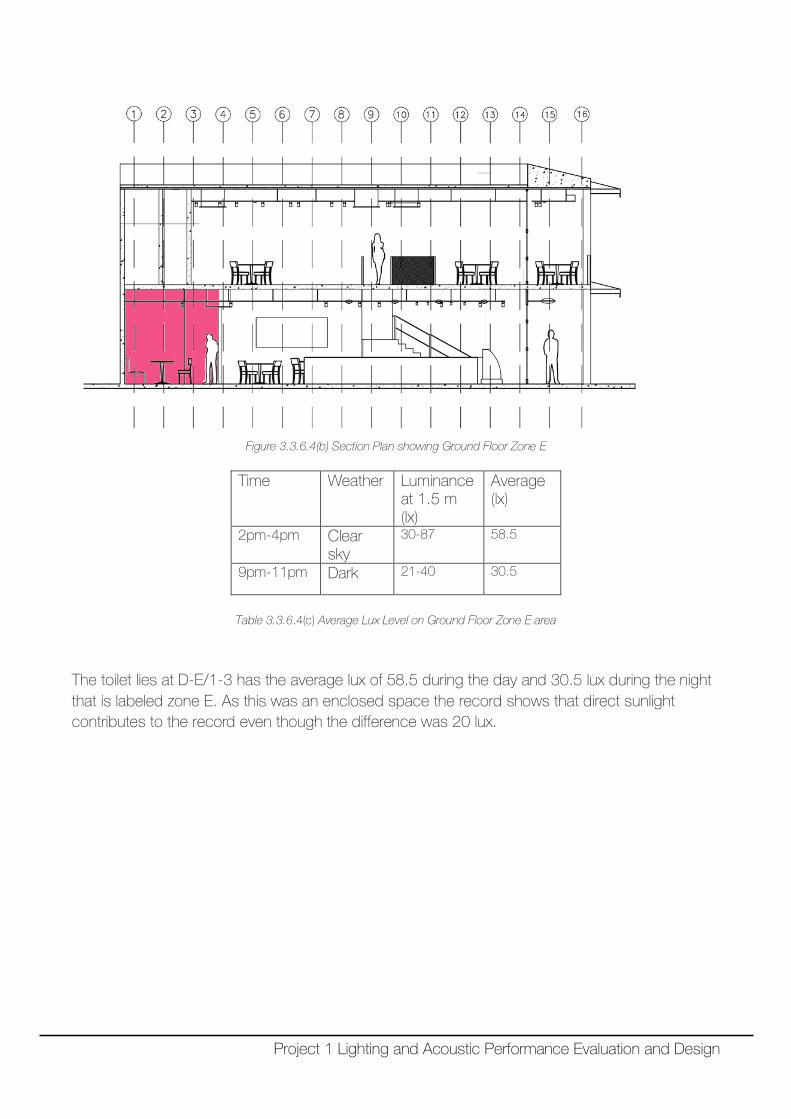
Figure 3.3.6.4(b) Section Plan showing Ground Floor Zone E
Table 3.3.6.4(c) Average Lux Level on Ground Floor Zone E area
The toilet lies at D-E/1-3 has the average lux of 58.5 during the day and 30.5 lux during the night that is labeled zone E. As this was an enclosed space the record shows that direct sunlight contributes to the record even though the difference was 20 lux.
Time Weather Luminance at 1.5 m (lx)
Average (lx)
2pm-4pm Clear sky
30-87 58.5
9pm-11pm Dark 21-40 30.5
Project 1 Lighting and Acoustic Performance Evaluation and Design
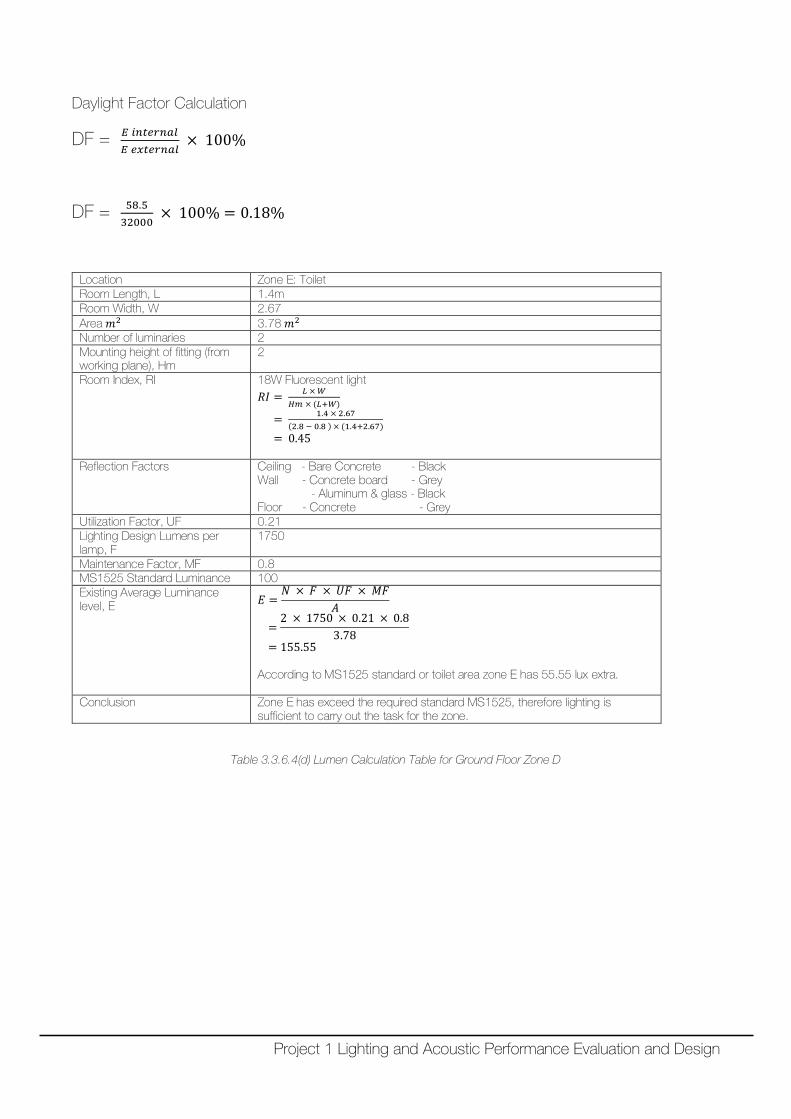
Daylight Factor Calculation
DF = 𝐸𝐸 𝑖𝑖𝑖𝑖𝑖𝑖𝑖𝑖𝑖𝑖𝑖𝑖𝑖𝑖𝑖𝑖𝐸𝐸 𝑖𝑖𝑥𝑥𝑖𝑖𝑖𝑖𝑖𝑖𝑖𝑖𝑖𝑖𝑖𝑖
× 100%
DF = 58.532000
× 100% = 0.18%
Location Zone E: Toilet Room Length, L 1.4m Room Width, W 2.67 Area 𝑅𝑅2 3.78 𝑅𝑅2 Number of luminaries 2 Mounting height of fitting (from working plane), Hm
2
Room Index, RI 18W Fluorescent light 𝑅𝑅𝑅𝑅 = 𝐿𝐿 × 𝑊𝑊
𝐻𝐻𝐻𝐻 × (𝐿𝐿+𝑊𝑊)
= 1.4 × 2.67(2.8 − 0.8 ) × (1.4+2.67)
= 0.45
Reflection Factors Ceiling - Bare Concrete - Black Wall - Concrete board - Grey - Aluminum & glass - Black Floor - Concrete - Grey
Utilization Factor, UF 0.21 Lighting Design Lumens per lamp, F
1750
Maintenance Factor, MF 0.8 MS1525 Standard Luminance 100 Existing Average Luminance level, E 𝐸𝐸 =
𝑁𝑁 × 𝐷𝐷 × 𝑈𝑈𝐷𝐷 × 𝑀𝑀𝐷𝐷𝐴𝐴
=2 × 1750 × 0.21 × 0.8
3.78
= 155.55 According to MS1525 standard or toilet area zone E has 55.55 lux extra.
Conclusion Zone E has exceed the required standard MS1525, therefore lighting is sufficient to carry out the task for the zone.
Table 3.3.6.4(d) Lumen Calculation Table for Ground Floor Zone D
Project 1 Lighting and Acoustic Performance Evaluation and Design
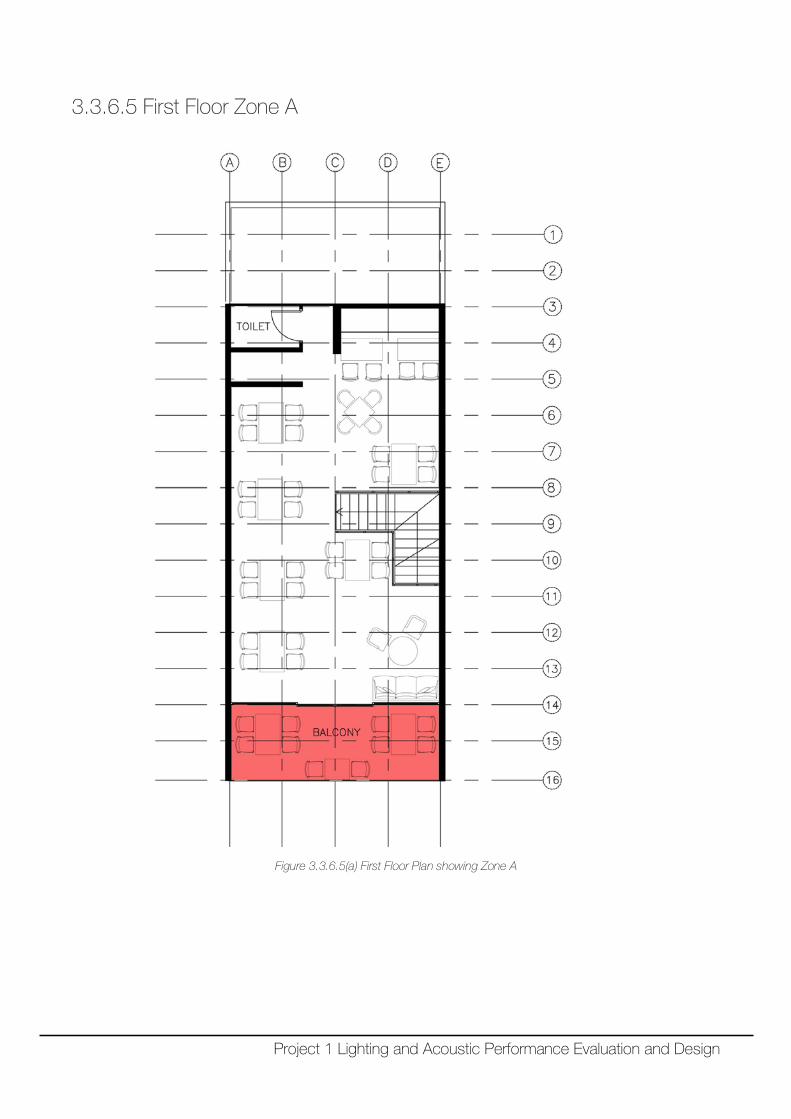
3.3.6.5 First Floor Zone A
Figure 3.3.6.5(a) First Floor Plan showing Zone A
Project 1 Lighting and Acoustic Performance Evaluation and Design
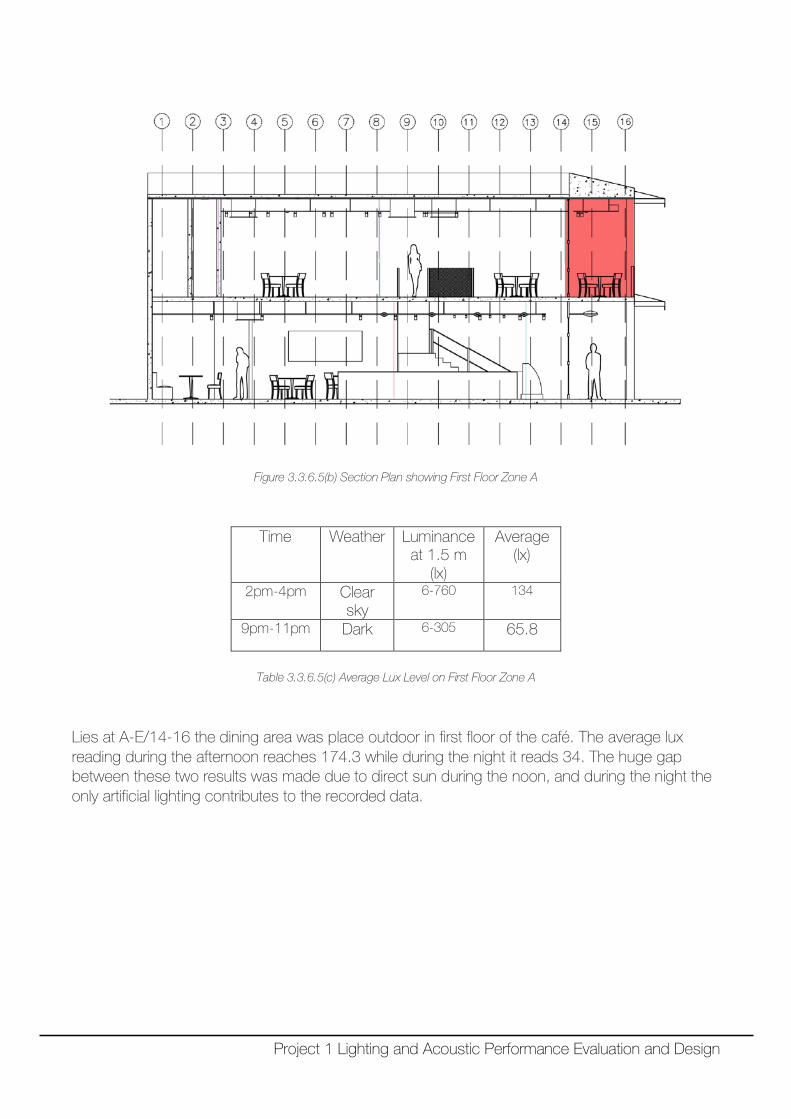
Figure 3.3.6.5(b) Section Plan showing First Floor Zone A
Table 3.3.6.5(c) Average Lux Level on First Floor Zone A
Lies at A-E/14-16 the dining area was place outdoor in first floor of the café. The average lux reading during the afternoon reaches 174.3 while during the night it reads 34. The huge gap between these two results was made due to direct sun during the noon, and during the night the only artificial lighting contributes to the recorded data.
Time Weather Luminance at 1.5 m
(lx)
Average (lx)
2pm-4pm Clear sky
6-760 134
9pm-11pm Dark 6-305 65.8
Project 1 Lighting and Acoustic Performance Evaluation and Design
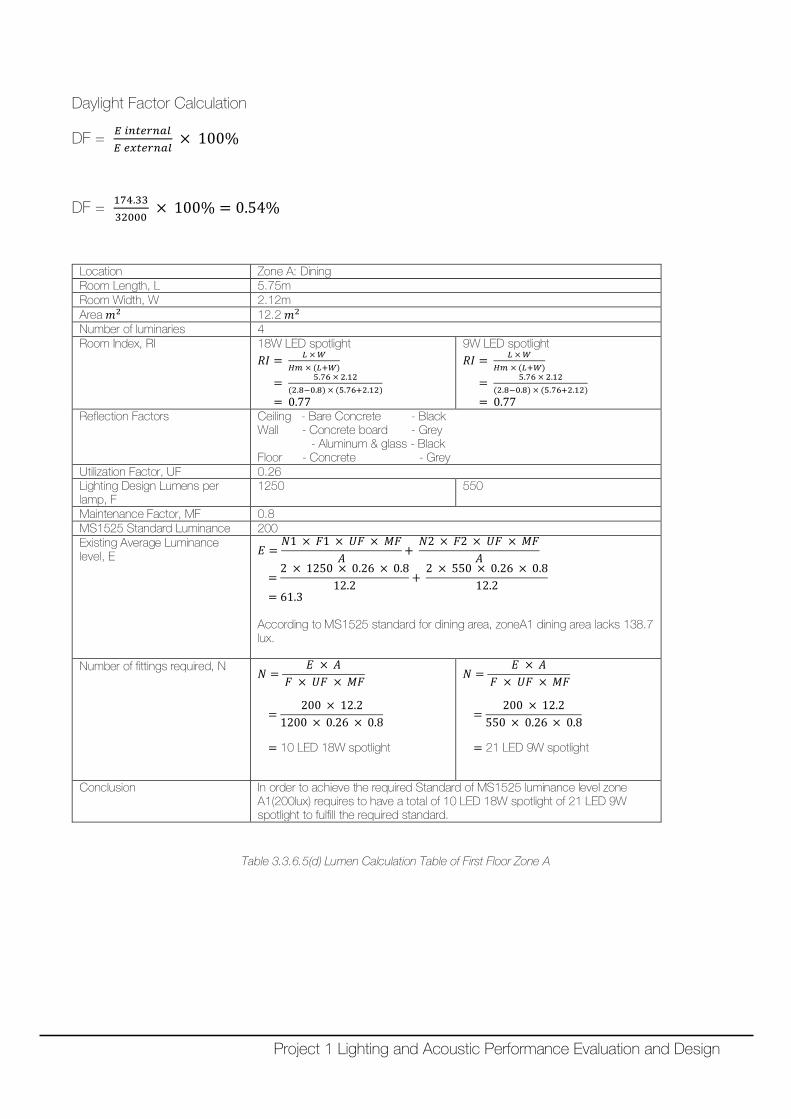
Daylight Factor Calculation
DF = 𝐸𝐸 𝑖𝑖𝑖𝑖𝑖𝑖𝑖𝑖𝑖𝑖𝑖𝑖𝑖𝑖𝑖𝑖𝐸𝐸 𝑖𝑖𝑥𝑥𝑖𝑖𝑖𝑖𝑖𝑖𝑖𝑖𝑖𝑖𝑖𝑖
× 100%
DF = 174.3332000
× 100% = 0.54%
Location Zone A: Dining Room Length, L 5.75m Room Width, W 2.12m Area 𝑅𝑅2 12.2 𝑅𝑅2 Number of luminaries 4 Room Index, RI 18W LED spotlight
𝑅𝑅𝑅𝑅 = 𝐿𝐿 × 𝑊𝑊𝐻𝐻𝐻𝐻 × (𝐿𝐿+𝑊𝑊)
= 5.76 × 2.12(2.8−0.8) × (5.76+2.12)
= 0.77
9W LED spotlight 𝑅𝑅𝑅𝑅 = 𝐿𝐿 × 𝑊𝑊
𝐻𝐻𝐻𝐻 × (𝐿𝐿+𝑊𝑊)
= 5.76 × 2.12(2.8−0.8) × (5.76+2.12)
= 0.77 Reflection Factors Ceiling - Bare Concrete - Black
Wall - Concrete board - Grey - Aluminum & glass - Black Floor - Concrete - Grey
Utilization Factor, UF 0.26 Lighting Design Lumens per lamp, F
1250 550
Maintenance Factor, MF 0.8 MS1525 Standard Luminance 200 Existing Average Luminance level, E 𝐸𝐸 =
𝑁𝑁1 × 𝐷𝐷1 × 𝑈𝑈𝐷𝐷 × 𝑀𝑀𝐷𝐷𝐴𝐴 +
𝑁𝑁2 × 𝐷𝐷2 × 𝑈𝑈𝐷𝐷 × 𝑀𝑀𝐷𝐷𝐴𝐴
=2 × 1250 × 0.26 × 0.8
12.2 + 2 × 550 × 0.26 × 0.8
12.2
= 61.3 According to MS1525 standard for dining area, zoneA1 dining area lacks 138.7 lux.
Number of fittings required, N 𝑁𝑁 =𝐸𝐸 × 𝐴𝐴
𝐷𝐷 × 𝑈𝑈𝐷𝐷 × 𝑀𝑀𝐷𝐷
=200 × 12.2
1200 × 0.26 × 0.8
= 10 LED 18W spotlight
𝑁𝑁 =𝐸𝐸 × 𝐴𝐴
𝐷𝐷 × 𝑈𝑈𝐷𝐷 × 𝑀𝑀𝐷𝐷
=200 × 12.2
550 × 0.26 × 0.8
= 21 LED 9W spotlight
Conclusion In order to achieve the required Standard of MS1525 luminance level zone A1(200lux) requires to have a total of 10 LED 18W spotlight of 21 LED 9W spotlight to fulfill the required standard.
Table 3.3.6.5(d) Lumen Calculation Table of First Floor Zone A
Project 1 Lighting and Acoustic Performance Evaluation and Design
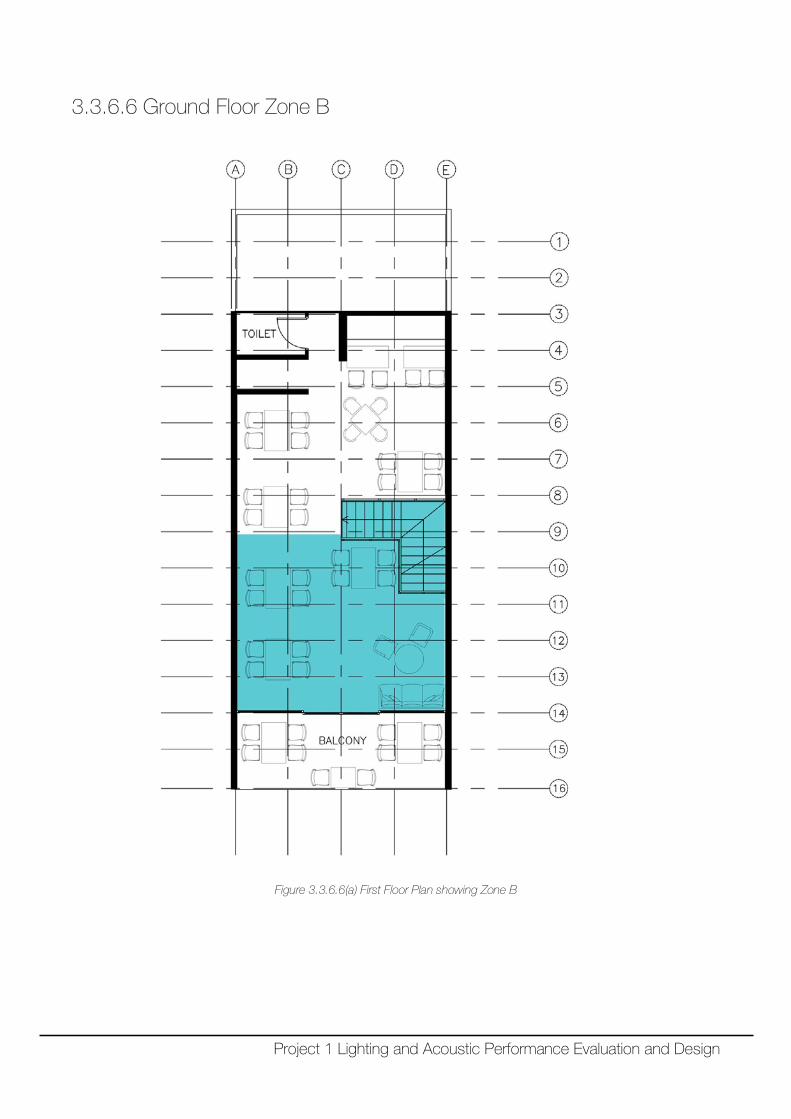
3.3.6.6 Ground Floor Zone B
Figure 3.3.6.6(a) First Floor Plan showing Zone B
Project 1 Lighting and Acoustic Performance Evaluation and Design
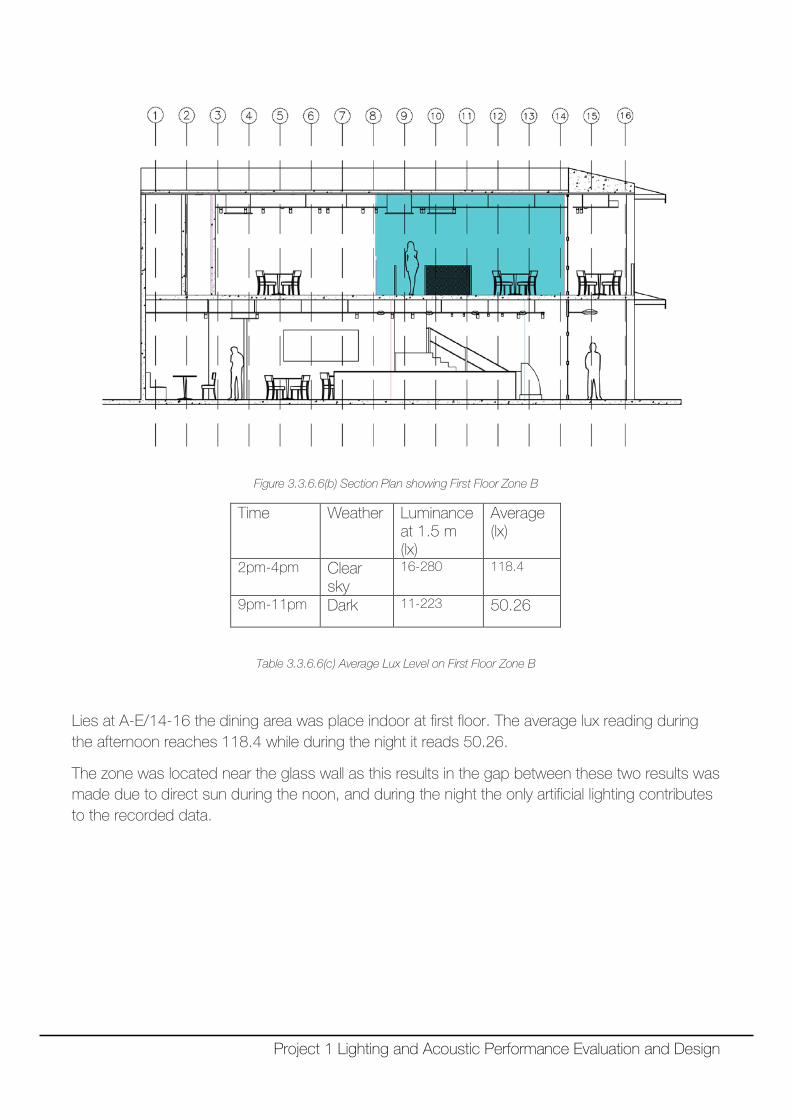
Figure 3.3.6.6(b) Section Plan showing First Floor Zone B
Time Weather Luminance at 1.5 m (lx)
Average (lx)
2pm-4pm Clear sky
16-280 118.4
9pm-11pm Dark 11-223 50.26
Table 3.3.6.6(c) Average Lux Level on First Floor Zone B
Lies at A-E/14-16 the dining area was place indoor at first floor. The average lux reading during the afternoon reaches 118.4 while during the night it reads 50.26.
The zone was located near the glass wall as this results in the gap between these two results was made due to direct sun during the noon, and during the night the only artificial lighting contributes to the recorded data.
Project 1 Lighting and Acoustic Performance Evaluation and Design
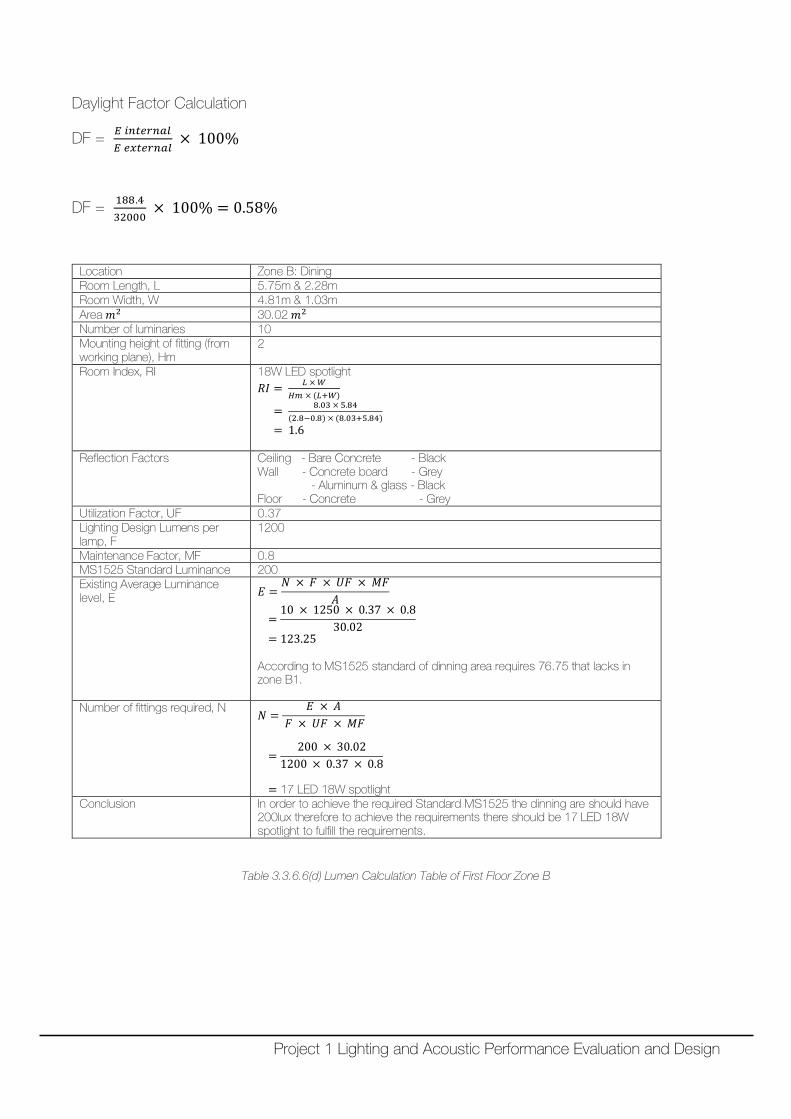
Daylight Factor Calculation
DF = 𝐸𝐸 𝑖𝑖𝑖𝑖𝑖𝑖𝑖𝑖𝑖𝑖𝑖𝑖𝑖𝑖𝑖𝑖𝐸𝐸 𝑖𝑖𝑥𝑥𝑖𝑖𝑖𝑖𝑖𝑖𝑖𝑖𝑖𝑖𝑖𝑖
× 100%
DF = 188.432000
× 100% = 0.58%
Location Zone B: Dining Room Length, L 5.75m & 2.28m Room Width, W 4.81m & 1.03m Area 𝑅𝑅2 30.02 𝑅𝑅2 Number of luminaries 10 Mounting height of fitting (from working plane), Hm
2
Room Index, RI 18W LED spotlight 𝑅𝑅𝑅𝑅 = 𝐿𝐿 × 𝑊𝑊
𝐻𝐻𝐻𝐻 × (𝐿𝐿+𝑊𝑊)
= 8.03 × 5.84(2.8−0.8) × (8.03+5.84)
= 1.6
Reflection Factors Ceiling - Bare Concrete - Black Wall - Concrete board - Grey - Aluminum & glass - Black Floor - Concrete - Grey
Utilization Factor, UF 0.37 Lighting Design Lumens per lamp, F
1200
Maintenance Factor, MF 0.8 MS1525 Standard Luminance 200 Existing Average Luminance level, E 𝐸𝐸 =
𝑁𝑁 × 𝐷𝐷 × 𝑈𝑈𝐷𝐷 × 𝑀𝑀𝐷𝐷𝐴𝐴
=10 × 1250 × 0.37 × 0.8
30.02
= 123.25 According to MS1525 standard of dinning area requires 76.75 that lacks in zone B1.
Number of fittings required, N 𝑁𝑁 =𝐸𝐸 × 𝐴𝐴
𝐷𝐷 × 𝑈𝑈𝐷𝐷 × 𝑀𝑀𝐷𝐷
=200 × 30.02
1200 × 0.37 × 0.8
= 17 LED 18W spotlight
Conclusion In order to achieve the required Standard MS1525 the dinning are should have 200lux therefore to achieve the requirements there should be 17 LED 18W spotlight to fulfill the requirements.
Table 3.3.6.6(d) Lumen Calculation Table of First Floor Zone B
Project 1 Lighting and Acoustic Performance Evaluation and Design
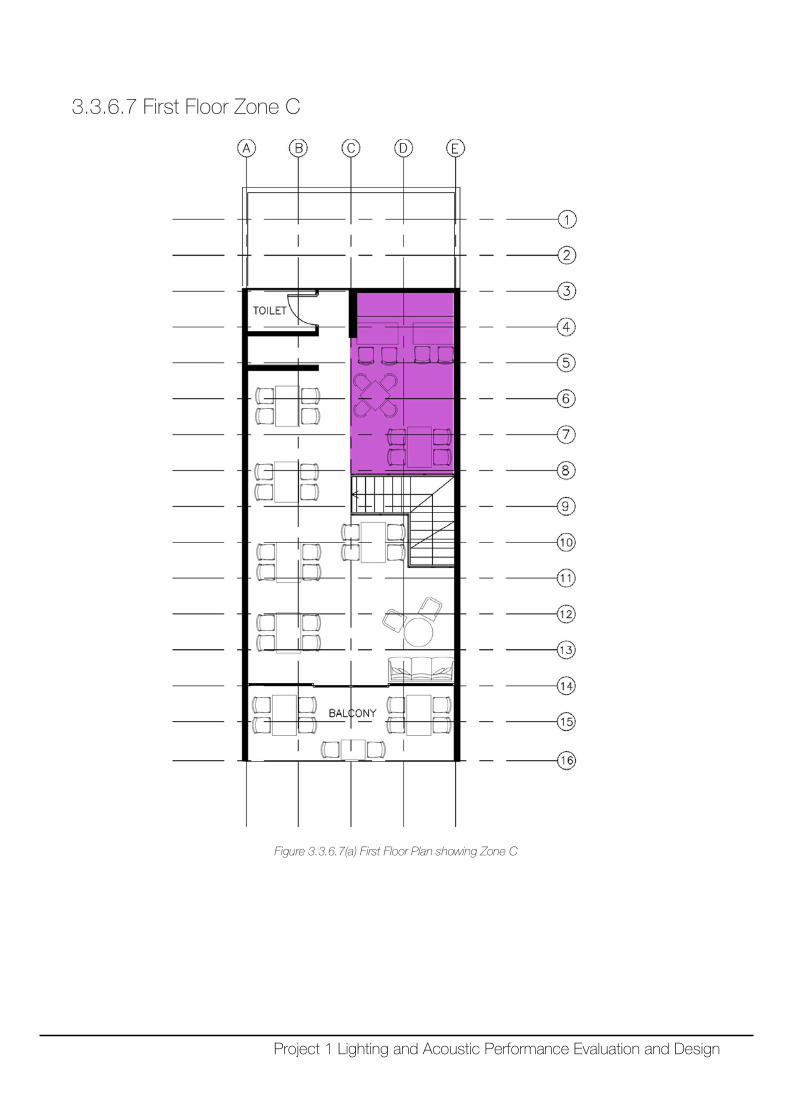
3.3.6.7 First Floor Zone C
Figure 3.3.6.7(a) First Floor Plan showing Zone C
Project 1 Lighting and Acoustic Performance Evaluation and Design
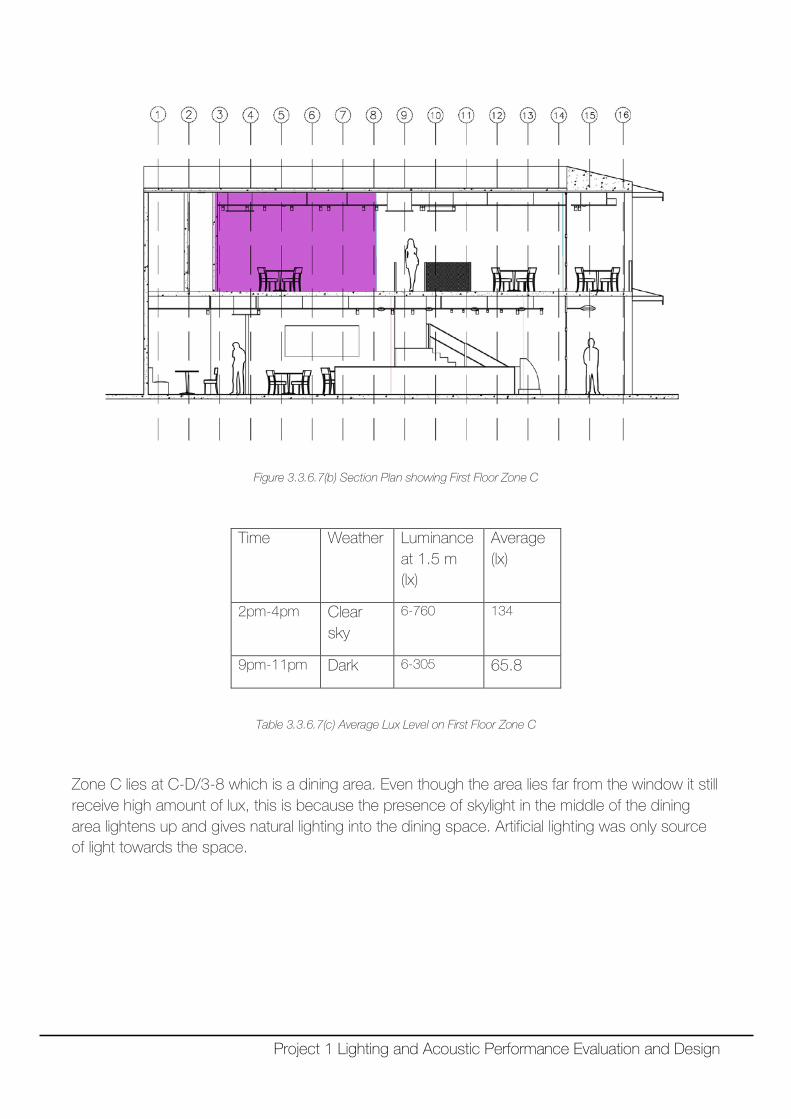
Figure 3.3.6.7(b) Section Plan showing First Floor Zone C
Time Weather Luminance at 1.5 m (lx)
Average (lx)
2pm-4pm Clear sky
6-760 134
9pm-11pm Dark 6-305 65.8
Table 3.3.6.7(c) Average Lux Level on First Floor Zone C
Zone C lies at C-D/3-8 which is a dining area. Even though the area lies far from the window it still receive high amount of lux, this is because the presence of skylight in the middle of the dining area lightens up and gives natural lighting into the dining space. Artificial lighting was only source of light towards the space.
Project 1 Lighting and Acoustic Performance Evaluation and Design
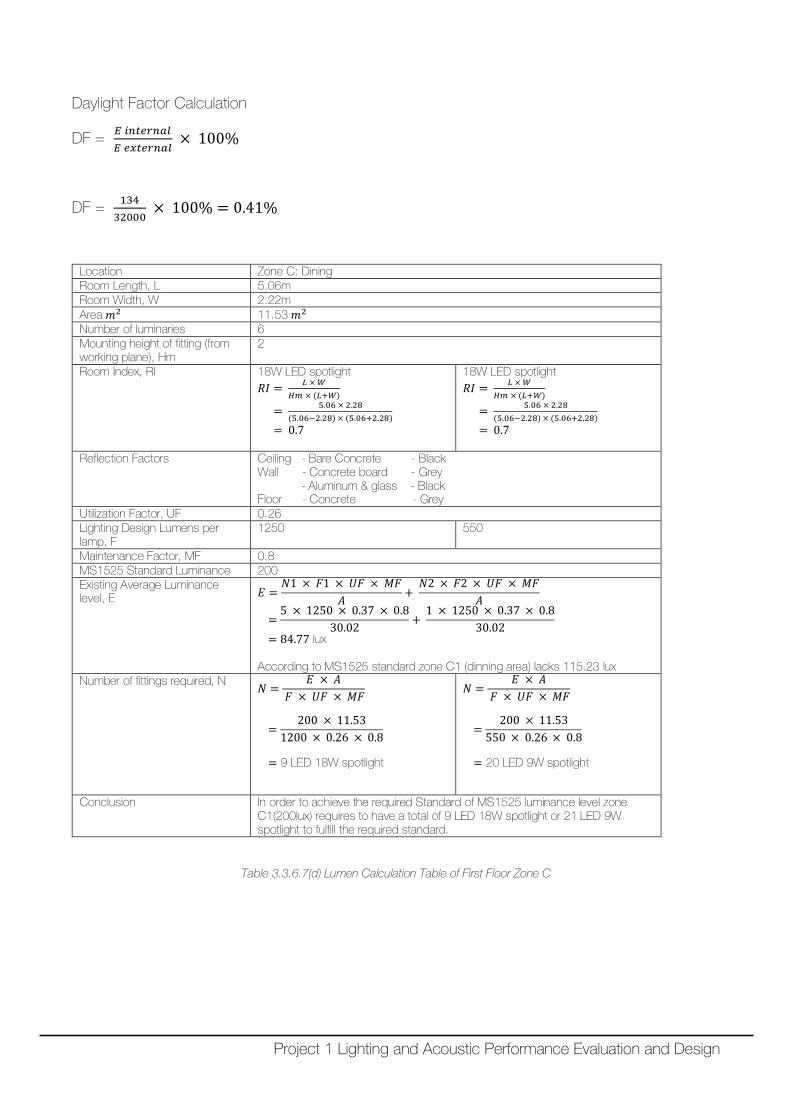
Daylight Factor Calculation
DF = 𝐸𝐸 𝑖𝑖𝑖𝑖𝑖𝑖𝑖𝑖𝑖𝑖𝑖𝑖𝑖𝑖𝑖𝑖𝐸𝐸 𝑖𝑖𝑥𝑥𝑖𝑖𝑖𝑖𝑖𝑖𝑖𝑖𝑖𝑖𝑖𝑖
× 100%
DF = 13432000
× 100% = 0.41%
Location Zone C: Dining Room Length, L 5.06m Room Width, W 2.22m Area 𝑅𝑅2 11.53 𝑅𝑅2 Number of luminaries 6 Mounting height of fitting (from working plane), Hm
2
Room Index, RI 18W LED spotlight 𝑅𝑅𝑅𝑅 = 𝐿𝐿 × 𝑊𝑊
𝐻𝐻𝐻𝐻 × (𝐿𝐿+𝑊𝑊)
= 5.06 × 2.28(5.06−2.28) × (5.06+2.28)
= 0.7
18W LED spotlight 𝑅𝑅𝑅𝑅 = 𝐿𝐿 × 𝑊𝑊
𝐻𝐻𝐻𝐻 × (𝐿𝐿+𝑊𝑊)
= 5.06 × 2.28(5.06−2.28) × (5.06+2.28)
= 0.7
Reflection Factors Ceiling - Bare Concrete - Black Wall - Concrete board - Grey - Aluminum & glass - Black Floor - Concrete - Grey
Utilization Factor, UF 0.26 Lighting Design Lumens per lamp, F
1250 550
Maintenance Factor, MF 0.8 MS1525 Standard Luminance 200 Existing Average Luminance level, E 𝐸𝐸 =
𝑁𝑁1 × 𝐷𝐷1 × 𝑈𝑈𝐷𝐷 × 𝑀𝑀𝐷𝐷𝐴𝐴 +
𝑁𝑁2 × 𝐷𝐷2 × 𝑈𝑈𝐷𝐷 × 𝑀𝑀𝐷𝐷𝐴𝐴
=5 × 1250 × 0.37 × 0.8
30.02 + 1 × 1250 × 0.37 × 0.8
30.02
= 84.77 lux According to MS1525 standard zone C1 (dinning area) lacks 115.23 lux
Number of fittings required, N 𝑁𝑁 =𝐸𝐸 × 𝐴𝐴
𝐷𝐷 × 𝑈𝑈𝐷𝐷 × 𝑀𝑀𝐷𝐷
=200 × 11.53
1200 × 0.26 × 0.8
= 9 LED 18W spotlight
𝑁𝑁 =𝐸𝐸 × 𝐴𝐴
𝐷𝐷 × 𝑈𝑈𝐷𝐷 × 𝑀𝑀𝐷𝐷
=200 × 11.53
550 × 0.26 × 0.8
= 20 LED 9W spotlight
Conclusion In order to achieve the required Standard of MS1525 luminance level zone C1(200lux) requires to have a total of 9 LED 18W spotlight or 21 LED 9W spotlight to fulfill the required standard.
Table 3.3.6.7(d) Lumen Calculation Table of First Floor Zone C
Project 1 Lighting and Acoustic Performance Evaluation and Design
3.3.7 Conclusion
Based on our evaluation and data collection, it can be conclude that absolute coffee has a dim environment that lacks artificial lighting. During day time, the restaurant receives sufficient day lighting focuses only certain area with the aid of glass wall at the entrance and skylight. As the location of the café was between the infill of two shops, hence it can only maximize day lighting through the front glass wall and skylights. As for the night lightings, it is found that absolute coffee are primarily using atmospheric overhead lighting, and the lux reading shows that the café lacks lighting giving a general dim environment. As this might be the design intention of the shop owner. Spot lights at the same time was well arranged as it was directed towards most of the sitting area, as some of the sitting area serves the purpose for reading and studying area for workers and students for gathering. Through our evaluation of the space and sitting area we feel that the spotlights are very effective the light beam was sufficient for reading and perform other activities. To increase the ambience value of the space, 2700K of fluorescent was used to create a warm and comfortable area for users to relax. Since the calculation was based on zoning of areas, spotlight luminance was not effectively calculated as the lights were not effectively spread like the other types of lighting (fluorescent). This working environment can be subjective to different people, as following the standard MS1525, absolute coffee does need to change their lighting method to have efficient lamps or they could add more similar bulbs to the spaces.
3.3.8 Improvement and Recommendation
In order to create a pleasing working environment absolute coffee needs to have additional lightings to put on. For example Zone A, B & D for ground floor and A, B & C for first floor, lacks the requirement of MS1525. Referring to the previous calculation under the number of luminance needed recommendations of additional bulbs have been calculated. Based on that number, different arrangement can be applied with combination of several types of luminaires in the spaces. Through the discussion at the conclusion, major artificial lighting were employed by LED spot lights, as the interior material used inside the café were mostly raw finishes and hanging paintings, spotlights are an excellent choice to highlight those features. Fluorescent on the other hand can be added to create equal luminance throughout the space as the beam angle spreads unlike spotlights.
Project 1 Lighting and Acoustic Performance Evaluation and Design
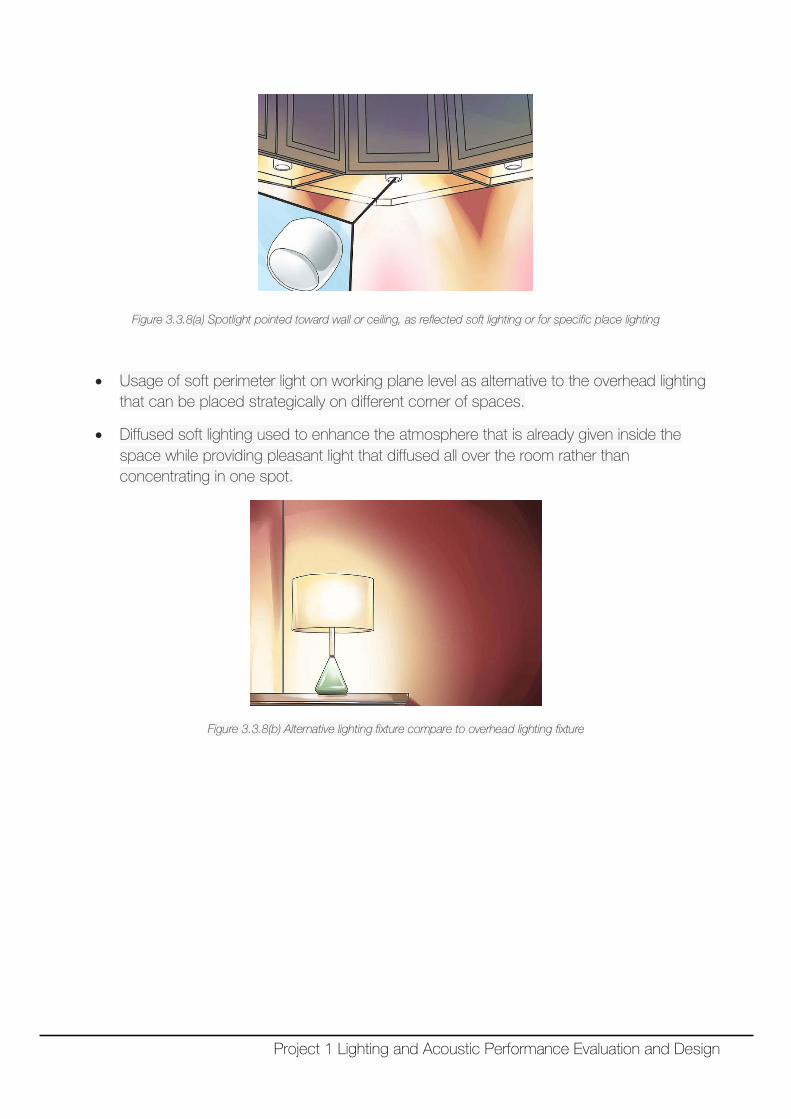
Figure 3.3.8(a) Spotlight pointed toward wall or ceiling, as reflected soft lighting or for specific place lighting
• Usage of soft perimeter light on working plane level as alternative to the overhead lighting that can be placed strategically on different corner of spaces.
• Diffused soft lighting used to enhance the atmosphere that is already given inside the space while providing pleasant light that diffused all over the room rather than concentrating in one spot.
Figure 3.3.8(b) Alternative lighting fixture compare to overhead lighting fixture
Project 1 Lighting and Acoustic Performance Evaluation and Design
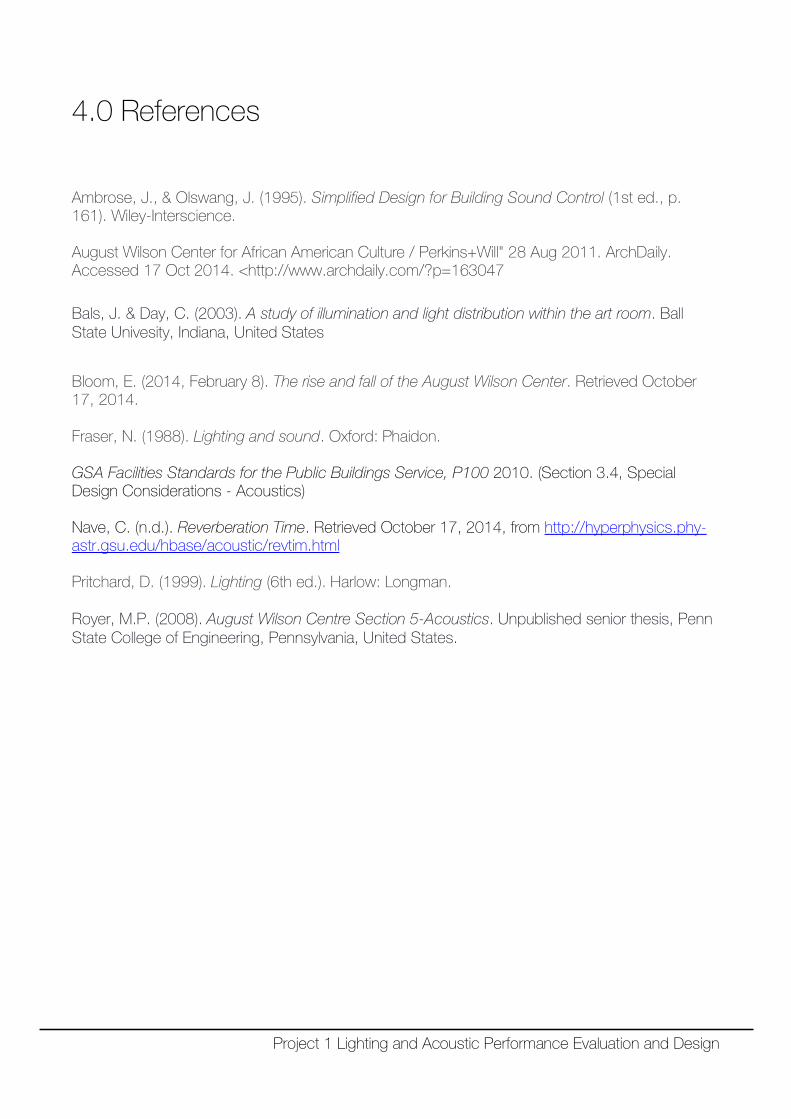
4.0 References
Ambrose, J., & Olswang, J. (1995). Simplified Design for Building Sound Control (1st ed., p. 161). Wiley-Interscience. August Wilson Center for African American Culture / Perkins+Will" 28 Aug 2011. ArchDaily. Accessed 17 Oct 2014. <http://www.archdaily.com/?p=163047
Bals, J. & Day, C. (2003). A study of illumination and light distribution within the art room. Ball State Univesity, Indiana, United States
Bloom, E. (2014, February 8). The rise and fall of the August Wilson Center. Retrieved October 17, 2014. Fraser, N. (1988). Lighting and sound. Oxford: Phaidon. GSA Facilities Standards for the Public Buildings Service, P100 2010. (Section 3.4, Special Design Considerations - Acoustics) Nave, C. (n.d.). Reverberation Time. Retrieved October 17, 2014, from http://hyperphysics.phy-astr.gsu.edu/hbase/acoustic/revtim.html Pritchard, D. (1999). Lighting (6th ed.). Harlow: Longman. Royer, M.P. (2008). August Wilson Centre Section 5-Acoustics. Unpublished senior thesis, Penn State College of Engineering, Pennsylvania, United States.
Project 1 Lighting and Acoustic Performance Evaluation and Design