Embed Size (px)
Citation preview
Financial Accounting Advisory Services Better portfolio evaluations – quantitative analysis to improve accuracy and reliability of your financial instrument valuations May 2013
Page 2 Better portfolio evaluations
Agenda
About EY 3
Better portfolio evaluations 5
Appendix 12
Contacts 13

Page 3 Better portfolio evaluations
About EY
Page 4 Better portfolio evaluations
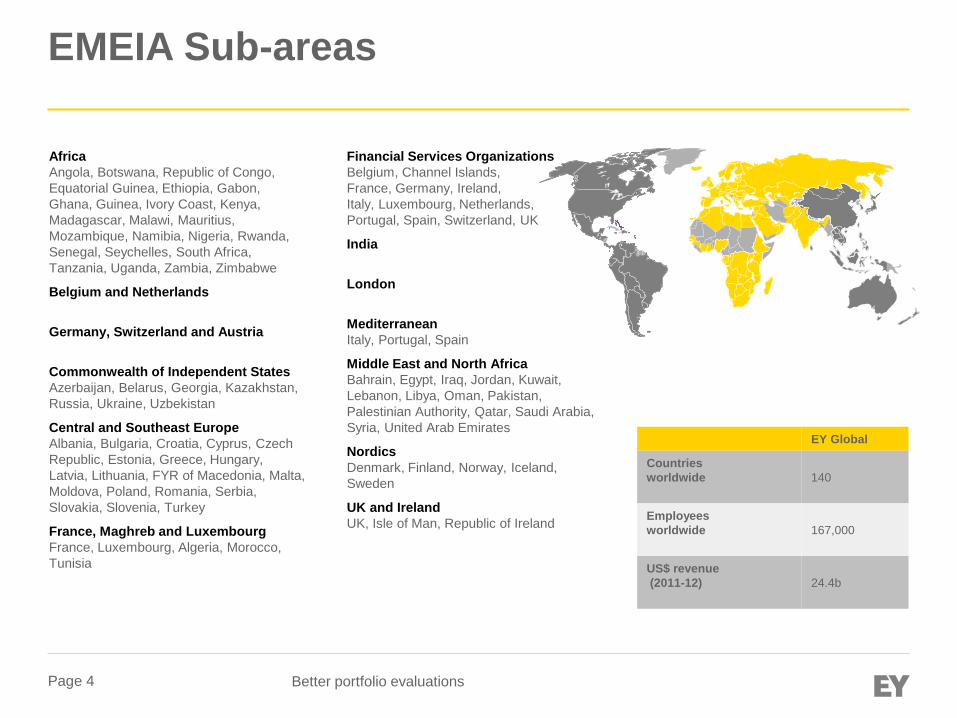
EMEIA Sub-areas
EY Global
Countries worldwide
140
Employees worldwide
167,000
US$ revenue (2011-12)
24.4b
Africa Angola, Botswana, Republic of Congo, Equatorial Guinea, Ethiopia, Gabon, Ghana, Guinea, Ivory Coast, Kenya, Madagascar, Malawi, Mauritius, Mozambique, Namibia, Nigeria, Rwanda, Senegal, Seychelles, South Africa, Tanzania, Uganda, Zambia, Zimbabwe
Belgium and Netherlands
Germany, Switzerland and Austria
Commonwealth of Independent States Azerbaijan, Belarus, Georgia, Kazakhstan, Russia, Ukraine, Uzbekistan
Central and Southeast Europe Albania, Bulgaria, Croatia, Cyprus, Czech Republic, Estonia, Greece, Hungary, Latvia, Lithuania, FYR of Macedonia, Malta, Moldova, Poland, Romania, Serbia, Slovakia, Slovenia, Turkey
France, Maghreb and Luxembourg France, Luxembourg, Algeria, Morocco, Tunisia
Financial Services Organizations Belgium, Channel Islands, France, Germany, Ireland, Italy, Luxembourg, Netherlands, Portugal, Spain, Switzerland, UK
India
London
Mediterranean Italy, Portugal, Spain
Middle East and North Africa Bahrain, Egypt, Iraq, Jordan, Kuwait, Lebanon, Libya, Oman, Pakistan, Palestinian Authority, Qatar, Saudi Arabia, Syria, United Arab Emirates
Nordics Denmark, Finland, Norway, Iceland, Sweden
UK and Ireland UK, Isle of Man, Republic of Ireland

Page 5 Better portfolio evaluations
Better portfolio evaluations
Page 6 Better portfolio evaluations
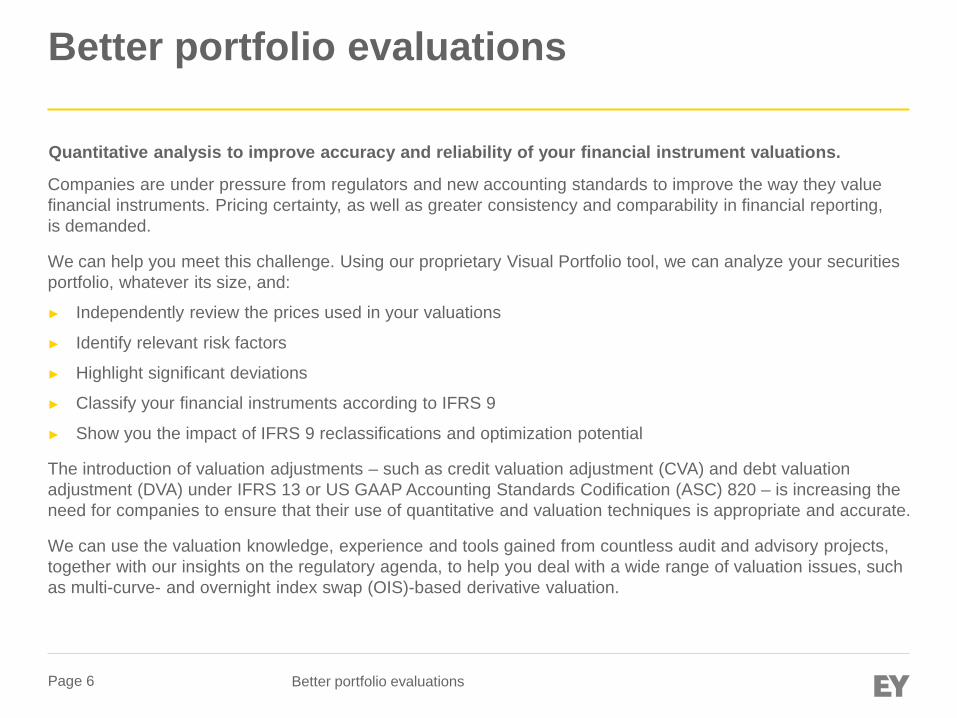
Better portfolio evaluations
Companies are under pressure from regulators and new accounting standards to improve the way they value financial instruments. Pricing certainty, as well as greater consistency and comparability in financial reporting, is demanded.
We can help you meet this challenge. Using our proprietary Visual Portfolio tool, we can analyze your securities portfolio, whatever its size, and:
► Independently review the prices used in your valuations
► Identify relevant risk factors
► Highlight significant deviations
► Classify your financial instruments according to IFRS 9
► Show you the impact of IFRS 9 reclassifications and optimization potential
The introduction of valuation adjustments – such as credit valuation adjustment (CVA) and debt valuation adjustment (DVA) under IFRS 13 or US GAAP Accounting Standards Codification (ASC) 820 – is increasing the need for companies to ensure that their use of quantitative and valuation techniques is appropriate and accurate.
We can use the valuation knowledge, experience and tools gained from countless audit and advisory projects, together with our insights on the regulatory agenda, to help you deal with a wide range of valuation issues, such as multi-curve- and overnight index swap (OIS)-based derivative valuation.
Quantitative analysis to improve accuracy and reliability of your financial instrument valuations.
Page 7 Better portfolio evaluations
Valuation and benchmarking
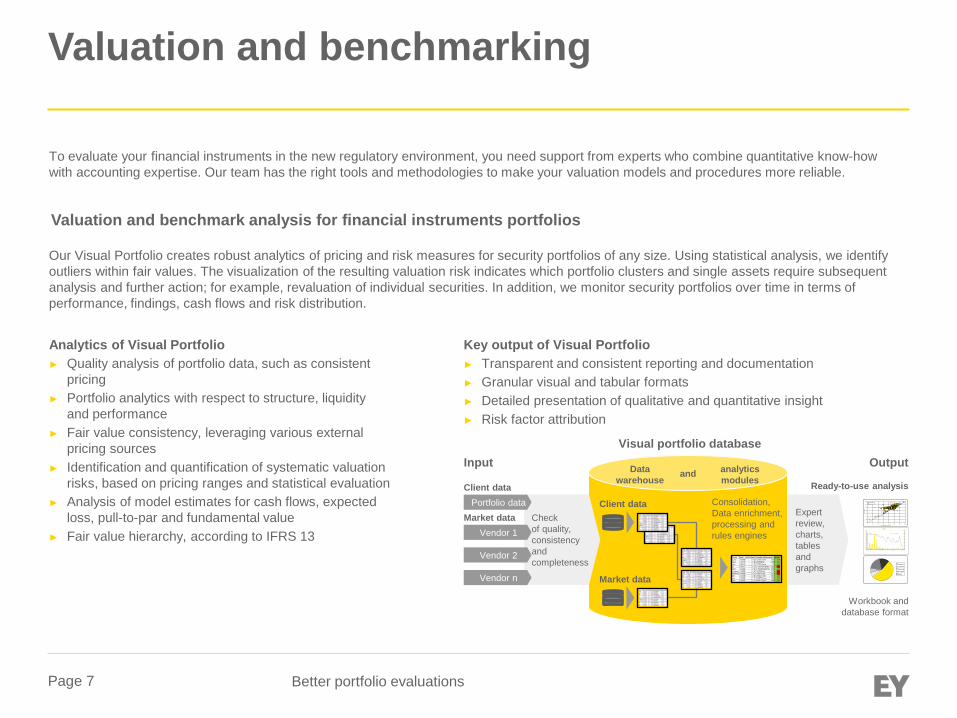
Valuation and benchmark analysis for financial instruments portfolios
Our Visual Portfolio creates robust analytics of pricing and risk measures for security portfolios of any size. Using statistical analysis, we identify outliers within fair values. The visualization of the resulting valuation risk indicates which portfolio clusters and single assets require subsequent analysis and further action; for example, revaluation of individual securities. In addition, we monitor security portfolios over time in terms of performance, findings, cash flows and risk distribution.
To evaluate your financial instruments in the new regulatory environment, you need support from experts who combine quantitative know-how with accounting expertise. Our team has the right tools and methodologies to make your valuation models and procedures more reliable.
Analytics of Visual Portfolio ► Quality analysis of portfolio data, such as consistent
pricing ► Portfolio analytics with respect to structure, liquidity
and performance ► Fair value consistency, leveraging various external
pricing sources ► Identification and quantification of systematic valuation
risks, based on pricing ranges and statistical evaluation ► Analysis of model estimates for cash flows, expected
loss, pull-to-par and fundamental value ► Fair value hierarchy, according to IFRS 13
Key output of Visual Portfolio ► Transparent and consistent reporting and documentation ► Granular visual and tabular formats ► Detailed presentation of qualitative and quantitative insight ► Risk factor attribution
Client data
analytics modules
Data warehouse
Consolidation, Data enrichment, processing and rules engines
Market data
Ready-to-use analysis
Expert review, charts, tables and graphs
Visual portfolio database Output
and
Workbook and database format
Check of quality, consistency and completeness
Portfolio data
Vendor n
Vendor 2
Vendor 1
Client data
Market data
Input
40 Mio
0
20
40
60
80
100
120
140
0 20 40 60 80 100 120 140
Preis Bloomberg in Prozent
Pre
is C
-Ban
k
Preisanbieter IPreisanbieter II
0
20
40
60
80
100
120
0%
2%
4%
6%
8%
10%
12%
14%
16%
18%
20%
Financials
Anzahl Durchschnittspreis
Financial
Corporate
Sovereign
Mortgage
Equity
Page 8 Better portfolio evaluations
Analytics and identification of deviations
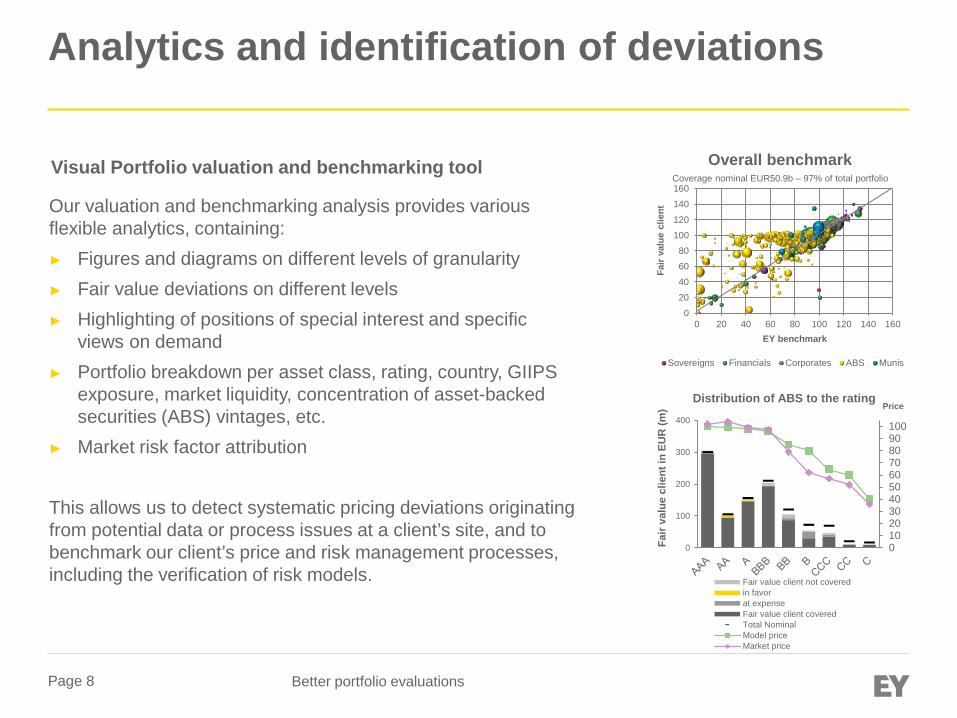
Visual Portfolio valuation and benchmarking tool
Our valuation and benchmarking analysis provides various flexible analytics, containing: ► Figures and diagrams on different levels of granularity ► Fair value deviations on different levels ► Highlighting of positions of special interest and specific
views on demand ► Portfolio breakdown per asset class, rating, country, GIIPS
exposure, market liquidity, concentration of asset-backed securities (ABS) vintages, etc.
► Market risk factor attribution This allows us to detect systematic pricing deviations originating from potential data or process issues at a client’s site, and to benchmark our client’s price and risk management processes, including the verification of risk models.
0
20
40
60
80
100
120
140
160
0 20 40 60 80 100 120 140 160
Fair
valu
e cl
ient
EY benchmark
Overall benchmark
Sovereigns Financials Corporates ABS Munis
Coverage nominal EUR50.9b – 97% of total portfolio
0102030405060708090100
0
100
200
300
400Price
Fair
valu
e cl
ient
in E
UR
(m)
Distribution of ABS to the rating
Fair value client not coveredin favorat expenseFair value client coveredTotal NominalModel priceMarket price
Page 9 Better portfolio evaluations
Classification according to IFRS 9
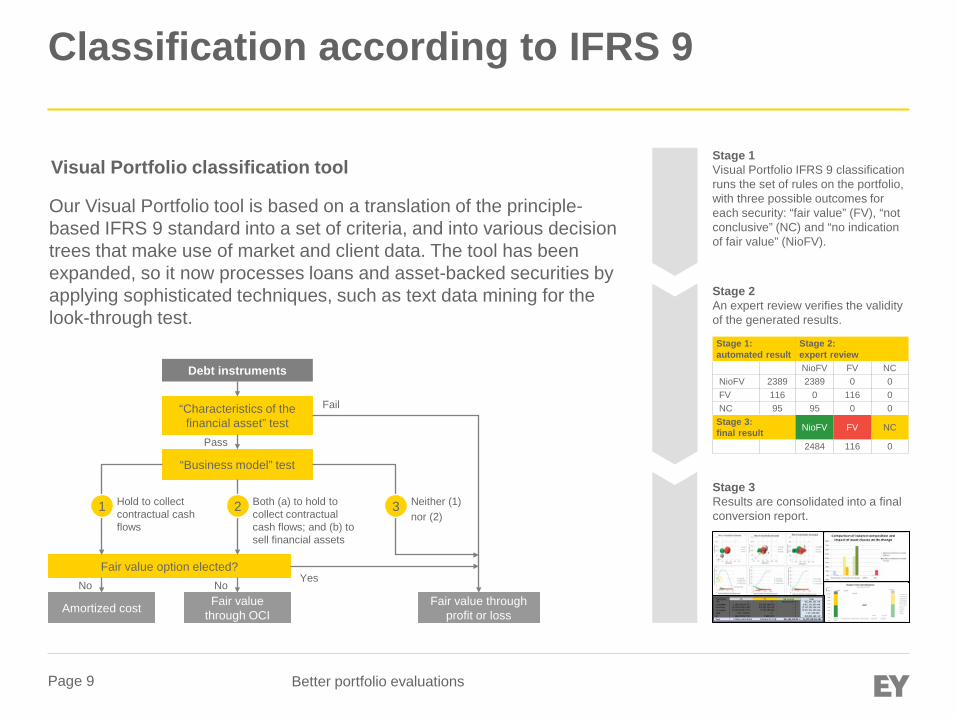
Visual Portfolio classification tool
Our Visual Portfolio tool is based on a translation of the principle-based IFRS 9 standard into a set of criteria, and into various decision trees that make use of market and client data. The tool has been expanded, so it now processes loans and asset-backed securities by applying sophisticated techniques, such as text data mining for the look-through test.
Stage 1 Visual Portfolio IFRS 9 classification runs the set of rules on the portfolio, with three possible outcomes for each security: “fair value” (FV), “not conclusive” (NC) and “no indication of fair value” (NioFV).
Stage 2 An expert review verifies the validity of the generated results.
Stage 3 Results are consolidated into a final conversion report.
Stage 1: automated result
Stage 2: expert review
NioFV FV NC NioFV 2389 2389 0 0 FV 116 0 116 0 NC 95 95 0 0 Stage 3: final result NioFV FV NC
2484 116 0
Debt instruments
“Characteristics of the financial asset” test
“Business model” test
Fair value option elected?
Amortized cost Fair value through OCI
Fair value through profit or loss
Hold to collect contractual cash flows
Both (a) to hold to collect contractual cash flows; and (b) to sell financial assets
Neither (1) nor (2)
1 2 3
Pass
Fail
No No Yes
Page 10 Better portfolio evaluations
Migration analysis Impact on balance sheet
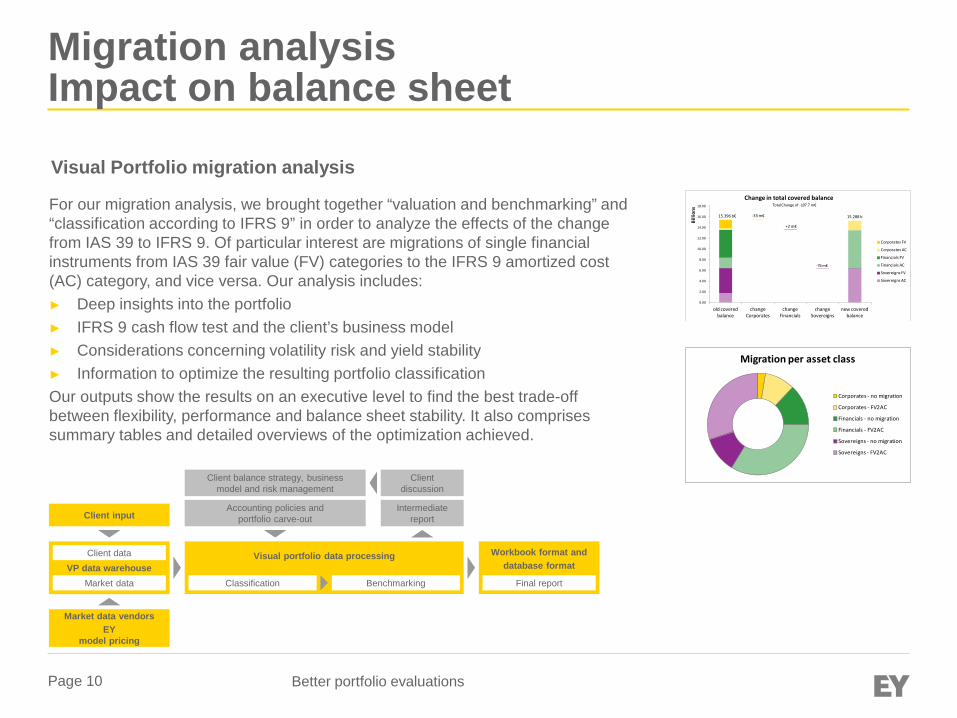
Visual Portfolio migration analysis
For our migration analysis, we brought together “valuation and benchmarking” and “classification according to IFRS 9” in order to analyze the effects of the change from IAS 39 to IFRS 9. Of particular interest are migrations of single financial instruments from IAS 39 fair value (FV) categories to the IFRS 9 amortized cost (AC) category, and vice versa. Our analysis includes: ► Deep insights into the portfolio ► IFRS 9 cash flow test and the client’s business model ► Considerations concerning volatility risk and yield stability ► Information to optimize the resulting portfolio classification Our outputs show the results on an executive level to find the best trade-off between flexibility, performance and balance sheet stability. It also comprises summary tables and detailed overviews of the optimization achieved.
0.00
2.00
4.00
6.00
8.00
10.00
12.00
14.00
16.00
18.00
old covered balance
change Corporates
change Financials
change Sovereigns
new covered balance
Billi
ons
Change in total covered balance
Corporates FV
Corporates AC
Financials FV
Financials AC
Sovereigns FV
Sovereigns AC
-33 m€
+2 m€
-76 m€
15.288 b
TotalChange of -107.7 m€
15.396 b€
Migration per asset class
Corporates - no migration
Corporates - FV2AC
Financials - no migration
Financials - FV2AC
Sovereigns - no migration
Sovereigns - FV2AC
VP data warehouse Client data
Market data
Intermediate report
Client discussion
Client input
Client balance strategy, business model and risk management
Accounting policies and portfolio carve-out
Market data vendors EY
model pricing
Visual portfolio data processing
Benchmarking Classification
Workbook format and database format
Final report
Page 11 Better portfolio evaluations
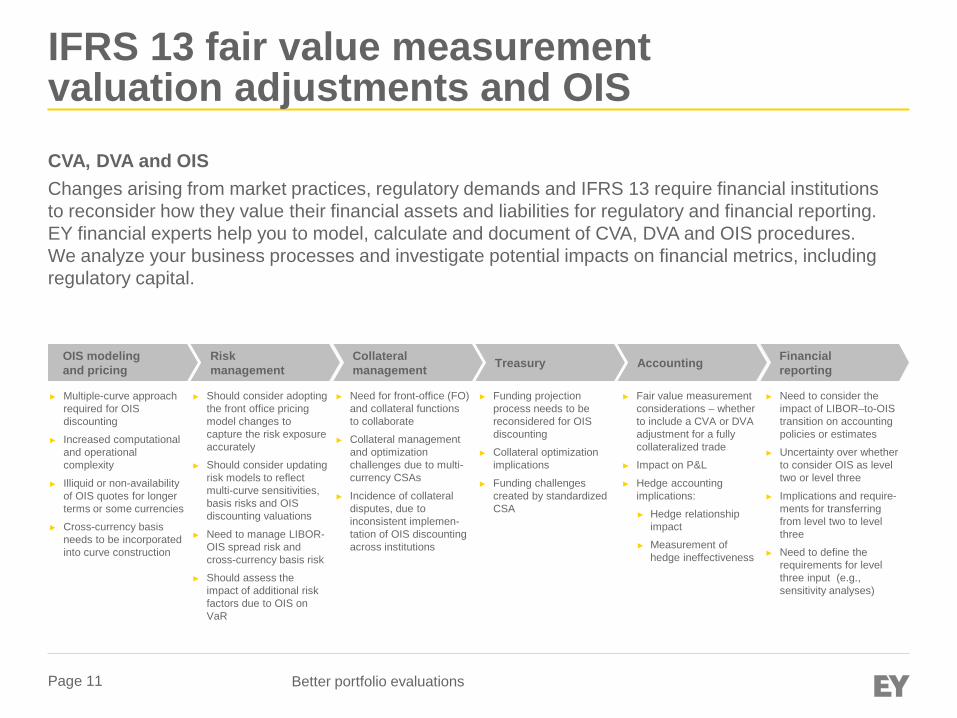
IFRS 13 fair value measurement valuation adjustments and OIS CVA, DVA and OIS Changes arising from market practices, regulatory demands and IFRS 13 require financial institutions to reconsider how they value their financial assets and liabilities for regulatory and financial reporting. EY financial experts help you to model, calculate and document of CVA, DVA and OIS procedures. We analyze your business processes and investigate potential impacts on financial metrics, including regulatory capital.
OIS modeling and pricing
Risk management
► Multiple-curve approach required for OIS discounting
► Increased computational and operational complexity
► Illiquid or non-availability of OIS quotes for longer terms or some currencies
► Cross-currency basis needs to be incorporated into curve construction
Collateral management Treasury Accounting Financial
reporting
► Should consider adopting the front office pricing model changes to capture the risk exposure accurately
► Should consider updating risk models to reflect multi-curve sensitivities, basis risks and OIS discounting valuations
► Need to manage LIBOR-OIS spread risk and cross-currency basis risk
► Should assess the impact of additional risk factors due to OIS on VaR
► Need for front-office (FO) and collateral functions to collaborate
► Collateral management and optimization challenges due to multi-currency CSAs
► Incidence of collateral disputes, due to inconsistent implemen-tation of OIS discounting across institutions
► Funding projection process needs to be reconsidered for OIS discounting
► Collateral optimization implications
► Funding challenges created by standardized CSA
► Fair value measurement considerations – whether to include a CVA or DVA adjustment for a fully collateralized trade
► Impact on P&L
► Hedge accounting implications:
► Hedge relationship impact
► Measurement of hedge ineffectiveness
► Need to consider the impact of LIBOR–to-OIS transition on accounting policies or estimates
► Uncertainty over whether to consider OIS as level two or level three
► Implications and require-ments for transferring from level two to level three
► Need to define the requirements for level three input (e.g., sensitivity analyses)

Page 12 Better portfolio evaluations
Appendix
Page 13 Better portfolio evaluations
Financial Accounting Advisory Services contacts – EMEIA
Karsten Füser Global and EMEIA Markets Financial Accounting Advisory Services [email protected] + 49 711 9881 14497
Bernd Georgi EMEIA Financial Services [email protected] + 49 6196 996 15957

EY | Assurance | Tax | Transactions | Advisory About EY
EY is a global leader in assurance, tax, transaction and advisory services. The insights and quality services we deliver help build trust and confidence in the capital markets and in economies the world over. We develop outstanding leaders who team to deliver on our promises to all of our stakeholders. In so doing, we play a critical role in building a better working world for our people, for our clients and for our communities. EY refers to the global organization, and may refer to one or more, of the member firms of Ernst & Young Global Limited, each of which is a separate legal entity. Ernst & Young Global Limited, a UK company limited by guarantee, does not provide services to clients. For more information about our organization, please visit ey.com. © 2013 EYGM Limited. All Rights Reserved. EYG no. AU1786
EMEIA Marketing Agency 1000307 ED None This material has been prepared for general informational purposes only and is not intended to be relied upon as accounting, tax, or other professional advice. Please refer to your advisors for specific advice. ey.com