Embed Size (px)
Citation preview
FAS 1
Financial Analysis Summary27 March 2017
Issuer SD Finance p.l.c.
Guarantor SD Holdings Limited
FAS 2
The DirectorsSD Finance p.l.c.Seabank HotelMarfa Road, GhadiraMellieha MLH 9064Malta
27 March 2017
Dear Sirs
Financial Analysis Summary
In accordance with your instructions, and in line with the requirements of the Listing Authority Policies, we have compiled the Financial Analysis Summary (the “Analysis”) set out on the following pages and which is being forwarded to you together with this letter.
The purpose of the financial analysis is that of summarising key financial data appertaining to SD Finance p.l.c. (the “Issuer”) and SD Holdings Limited (the “Guarantor”). The data is derived from various sources or is based on our own computations as follows:
(a) Historical financial data for the three years ended 31 March 2014 to 31 March 2016 has been extracted from the audited consolidated financial statements of the Guarantor for the three years in question.
(b) The forecast data for the years ending 31 March 2017 and 31 March 2018 has been provided by management. (c) Our commentary on the results of the db Group and on its financial position is based on the explanations provided by
management. (d) The ratios quoted in the Analysis have been computed by us applying the definitions set out in Part 5 of the Analysis. (e) Relevant financial data in respect of the companies included in Part 4 has been extracted from public sources such
as websites of the companies concerned, financial statements filed with the Registrar of Companies or websites providing financial data.
The Analysis is meant to assist investors in the Issuer’s securities and potential investors by summarising the more important financial data of the db Group. The Analysis does not contain all data that is relevant to investors or potential investors. The Analysis does not constitute an endorsement by our firm of any securities of the Issuer and should not be interpreted as a recommendation to invest in any of the Issuer’s securities. We shall not accept any liability for any loss or damage arising out of the use of the Analysis. As with all investments, potential investors are encouraged to seek independent professional financial advice before investing in the Issuer’s securities.
Yours faithfully,
Wilfred MalliaDirector
FAS 3
TABLE OF CONTENTS PART 1 – INFORMATION ABOUT THE DB GROUP .............................................................................................................4
1. Key Activities of the Issuer ..............................................................................................................................................4
2. Directors of the Issuer ....................................................................................................................................................4
3. Key Activities of the Guarantor .......................................................................................................................................4
4. Directors of the Guarantor and Senior Management ......................................................................................................5
5. db Group Organisational Structure .................................................................................................................................6
PART 2 – OPERATIONAL DEVELOPMENT ..........................................................................................................................7
6. db Seabank Resort & Spa ..............................................................................................................................................7
7. db San Antonio Hotel & Spa ...........................................................................................................................................8
8. Hard Rock Café Malta ..................................................................................................................................................10
9. Tunny Net Complex ......................................................................................................................................................12
10. Hospitality & Leisure Sector Analysis ...........................................................................................................................13 10.1 Economic Update ...............................................................................................................................................13 10.2 Tourism Market ...................................................................................................................................................13 10.3 Food & Beverage Service Sector .......................................................................................................................14
11. Investments in Associated Companies .........................................................................................................................15 11.1 Healthcare and Catering Services .......................................................................................................................15 11.2 Airline Catering Services ......................................................................................................................................16 11.3 Long-Term Care Trend Analysis ..........................................................................................................................17 11.4 Contract Catering Trend Analysis ........................................................................................................................18 11.5 Other Investments in Associated Companies ......................................................................................................19
12. Principal Future Investments ........................................................................................................................................19
PART 3 – PERFORMANCE REVIEW ...................................................................................................................................20
13. Financial Information relating to SD Finance plc ..........................................................................................................20
14. Financial Information relating to SD Holdings Limited ..................................................................................................22
PART 4 - COMPARABLES ...................................................................................................................................................27
PART 5 - EXPLANATORY DEFINITIONS AND REFERENCES ..........................................................................................28
FAS 4
PART 1 – INFORMATION ABOUT THE DB GROUP
1. KEY ACTIVITIES OF THE ISSUER
SD Finance p.l.c. (the “Issuer” or “Company”) was incorporated in January 2017 as a public limited liability company under the Companies Act with an authorised and fully paid up issued share capital of €250,000. The principal activity of the Company is to carry on the business of a holding and finance company within the Group.
The Issuer is not engaged in any trading activities but is involved in raising debt and advancing same to members of the Group as and when the demands of this business or the demands of a particular project so require. Accordingly, the Issuer is economically dependent on the operations, performance and prospects of the Group.
2. DIRECTORS OF THE ISSUER
The Issuer is managed by a Board comprising six directors who are entrusted with its overall direction and management. The Board members of the Issuer as at the date of this report are included hereunder:
Board of DirectorsSilvio Debono ChairmanArthur Gauci Chief Executive OfficerRobert Debono Non-Executive DirectorStephen Muscat Independent Non-Executive DirectorVincent Micallef Independent Non-Executive DirectorPhilip Micallef Independent Non-Executive Director
3. KEY ACTIVITIES OF THE GUARANTOR
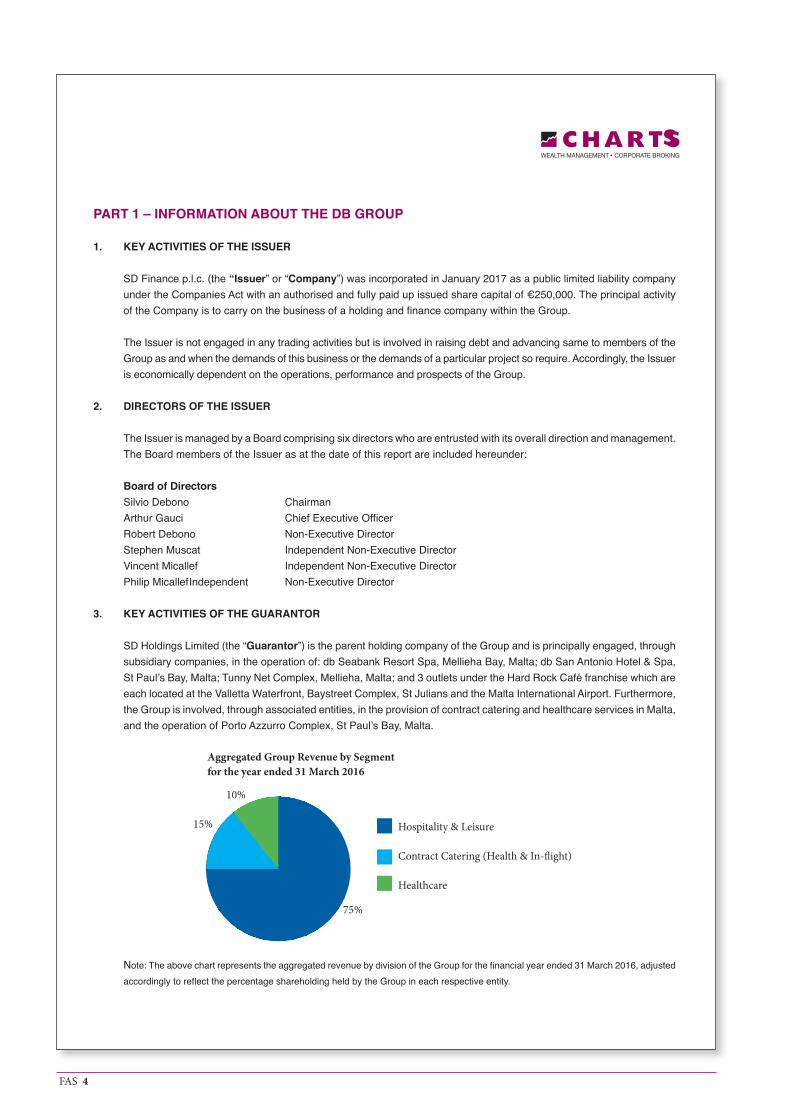
SD Holdings Limited (the “Guarantor”) is the parent holding company of the Group and is principally engaged, through subsidiary companies, in the operation of: db Seabank Resort Spa, Mellieha Bay, Malta; db San Antonio Hotel & Spa, St Paul’s Bay, Malta; Tunny Net Complex, Mellieha, Malta; and 3 outlets under the Hard Rock Café franchise which are each located at the Valletta Waterfront, Baystreet Complex, St Julians and the Malta International Airport. Furthermore, the Group is involved, through associated entities, in the provision of contract catering and healthcare services in Malta, and the operation of Porto Azzurro Complex, St Paul’s Bay, Malta.
Note: The above chart represents the aggregated revenue by division of the Group for the financial year ended 31 March 2016, adjusted accordingly to reflect the percentage shareholding held by the Group in each respective entity.
Hospitality & Leisure
Contract Catering (Health & In-flight)
Healthcare
Aggregated Group Revenue by Segmentfor the year ended 31 March 2016
10%
15%
75%
FAS 5
The authorised share capital of the Guarantor is €5,000,000 divided into 5,000,000 ordinary shares of €1 each. As at 31 March 2016, the Guarantor had an issued share capital of €520,000. By virtue of the capitalisation of amounts payable to the ultimate shareholder, during October 2016, the Guarantor issued and allotted an additional 3,480,000 ordinary shares of €1 each. As a result, the issued share capital is €4,000,000, which is subscribed for, allotted and taken up as fully paid up shares by Silvio Debono.
4. DIRECTORS OF THE GUARANTOR AND SENIOR MANAGEMENT
The Guarantor is managed by a Board comprising six directors who are entrusted with its overall direction and management, including the establishment of strategies for future development. The Board members of the Guarantor as at the date of this report are included hereunder:
Board of DirectorsSilvio Debono ChairmanArthur Gauci Chief Executive OfficerRobert Debono DirectorVictoria Debono DirectorVincent DeGiorgio DirectorJesmond Vella Director
In the execution of the strategic direction, investment and management oversight of the db Group, the Board is assisted by the following members of senior management:
Senior Management of the db GroupSilvio Debono Executive ChairmanArthur Gauci Chief Executive Officer and Director of Franchise OperationsVincent DeGiorgio Director of Hotel OperationsJesmond Vella Head of Purchasing and LogisticsMassimo Azzopardi General Manager of db Seabank Resort & SpaBradley Dingli General Manager of db San Antonio Hotel & SpaRobert Debono Director of Healthcare OperationsTrevor Vella Chief Financial Officer
The weekly average number of employees engaged by the Group during FY2016 amounted to 518 persons (FY2015: 481).
FAS 6
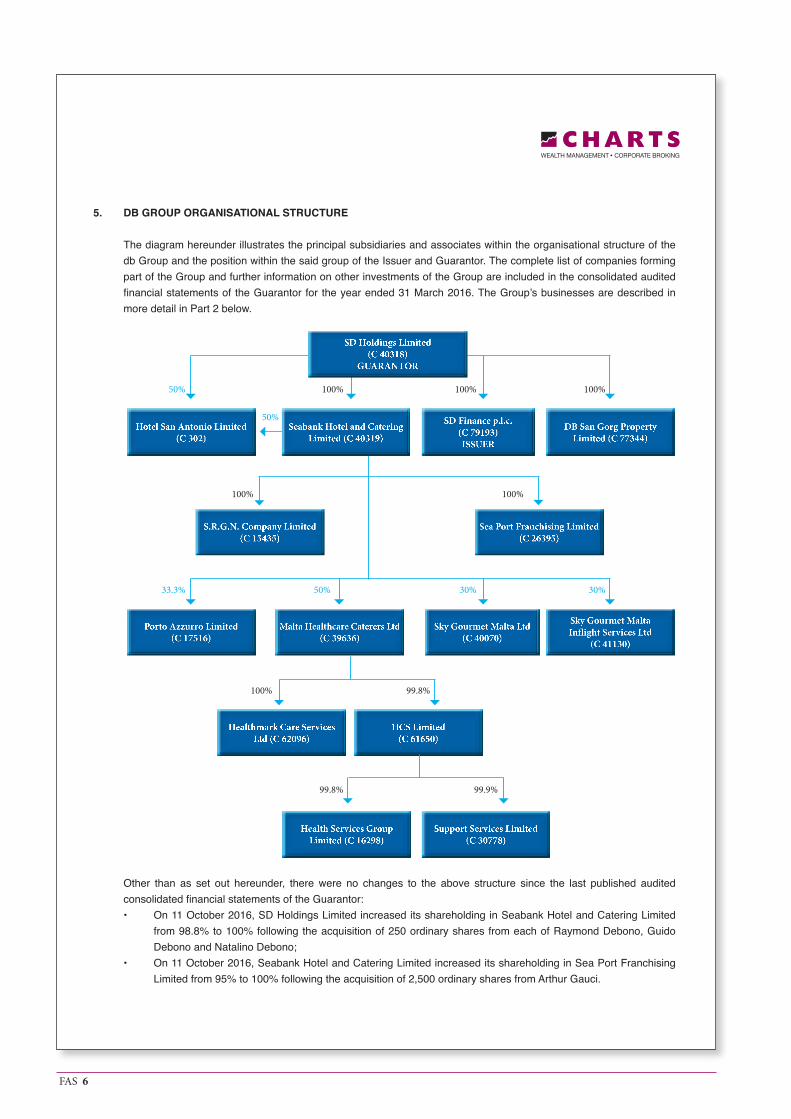
5. DB GROUP ORGANISATIONAL STRUCTURE
The diagram hereunder illustrates the principal subsidiaries and associates within the organisational structure of the db Group and the position within the said group of the Issuer and Guarantor. The complete list of companies forming part of the Group and further information on other investments of the Group are included in the consolidated audited financial statements of the Guarantor for the year ended 31 March 2016. The Group’s businesses are described in more detail in Part 2 below.
Other than as set out hereunder, there were no changes to the above structure since the last published audited consolidated financial statements of the Guarantor:• On 11 October 2016, SD Holdings Limited increased its shareholding in Seabank Hotel and Catering Limited
from 98.8% to 100% following the acquisition of 250 ordinary shares from each of Raymond Debono, Guido Debono and Natalino Debono;
• On 11 October 2016, Seabank Hotel and Catering Limited increased its shareholding in Sea Port Franchising Limited from 95% to 100% following the acquisition of 2,500 ordinary shares from Arthur Gauci.
Porto Azzurro Limited(C 17516)
S.R.G.N. Company Limited(C 15435)
Hotel San Antonio Limited(C 302)
Malta Healthcare Caterers Ltd (C 39636)
Healthmark Care Services Ltd (C 62096)
HCS Limited(C 61650)
Health Services GroupLimited (C 16298)
Support Services Limited(C 30778)
Sky Gourmet Malta Ltd (C 40070)
Sky Gourmet Malta Inflight Services Ltd
(C 41130)
Sea Port Franchising Limited(C 26395)
SD Holdings Limited (C 40318)
GUARANTOR
Seabank Hotel and Catering Limited (C 40319)
SD Finance p.l.c.(C 79193)ISSUER
DB San Gorg Property Limited (C 77344)
100%100%
100%
100%
100% 99.8%
99.9%99.8%
100%
50%
33.3% 50% 30% 30%
50%
FAS 7
PART 2 – OPERATIONAL DEVELOPMENT
6. DB SEABANK RESORT & SPA
IntroductionSeabank Hotel and Catering Limited, a subsidiary of the Guarantor, owns the 539-room four-star db Seabank Resort & Spa, which occupies a land area of over 30,000m2 and is located in Mellieha Bay, Malta (the “Seabank Hotel”). Over a span of 8 months commencing in 2012, the Seabank Hotel was redeveloped at a cost of circa €38 million which was financed from bank funding. It was officially re-opened during the financial year ended 31 March 2013 as an all-inclusive resort with 7 themed restaurants, 4 bars, an external pool, a fitness centre and health spa. In 2015, a new entertainment complex was opened at a cost of circa €1 million, which includes 3 restaurants, a bowling alley, a sports bar and a children club. The carrying value of the Seabank Hotel as at 31 March 2016 is €62.7 million (FY2015: €54.8 million).
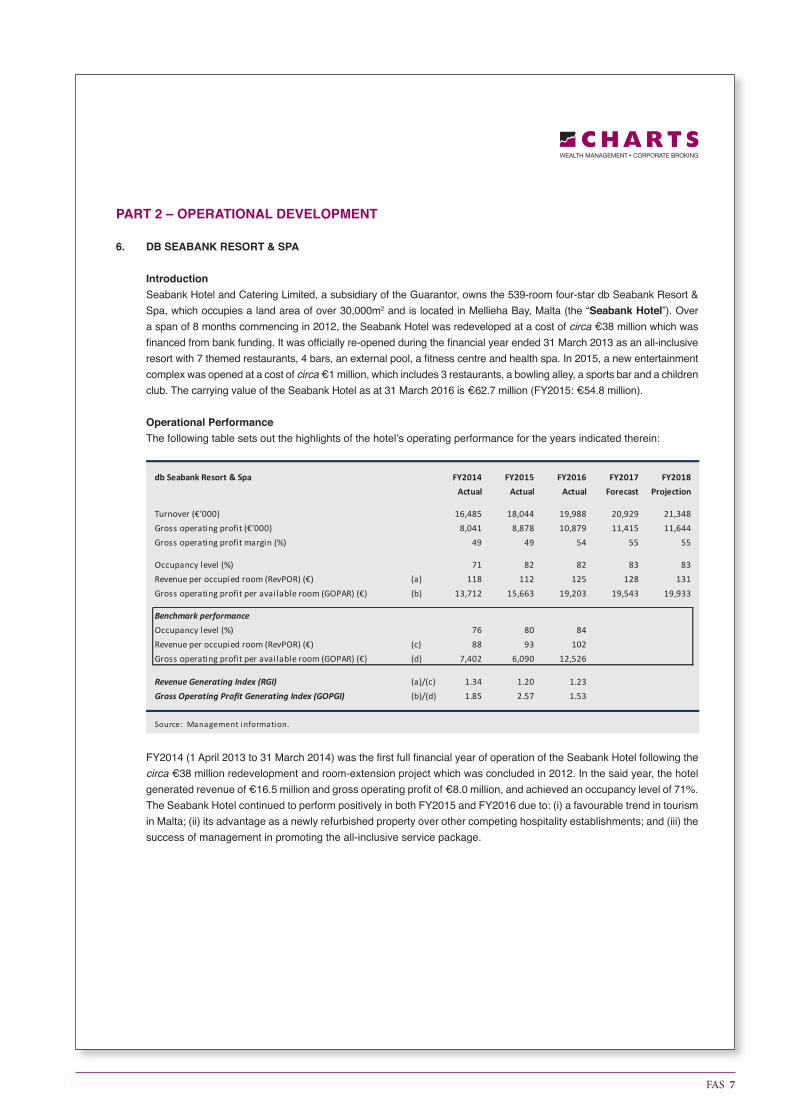
Operational PerformanceThe following table sets out the highlights of the hotel’s operating performance for the years indicated therein:
FY2014 (1 April 2013 to 31 March 2014) was the first full financial year of operation of the Seabank Hotel following the circa €38 million redevelopment and room-extension project which was concluded in 2012. In the said year, the hotel generated revenue of €16.5 million and gross operating profit of €8.0 million, and achieved an occupancy level of 71%. The Seabank Hotel continued to perform positively in both FY2015 and FY2016 due to: (i) a favourable trend in tourism in Malta; (ii) its advantage as a newly refurbished property over other competing hospitality establishments; and (iii) the success of management in promoting the all-inclusive service package.
db Seabank Resort & Spa FY2014 FY2015 FY2016 FY2017 FY2018Actual Actual Actual Forecast Projection
Turnover (€’000) 16,485 18,044 19,988 20,929 21,348Gross operating profit (€’000) 8,041 8,878 10,879 11,415 11,644Gross operating profit margin (%) 49 49 54 55 55
Occupancy level (%) 71 82 82 83 83Revenue per occupied room (RevPOR) (€) (a) 118 112 125 128 131Gross operating profit per available room (GOPAR) (€) (b) 13,712 15,663 19,203 19,543 19,933
Benchmark performanceOccupancy level (%) 76 80 84Revenue per occupied room (RevPOR) (€) (c) 88 93 102Gross operating profit per available room (GOPAR) (€) (d) 7,402 6,090 12,526
Revenue Generating Index (RGI) (a)/(c) 1.34 1.20 1.23Gross Operating Profit Generating Index (GOPGI) (b)/(d) 1.85 2.57 1.53
Source: Management information.
FAS 8
The hotel registered a 9.5% increase in revenue from €16.5 million in FY2014 to €18.0 million in FY2015 (+€1.6 million), and thereafter reported an increase of €1.9 million (+10.8%) in revenue to €20.0 million in FY2016. Gross operating profit also increased yearly from €8.0 million in FY2014 to €8.9 million in FY2015 (+10%) and €10.9 million in FY2016 (+23%). Furthermore, gross operating profit margin improved from 49% in FY2014 to 55% in FY2016.
As to competitive set analysis, no hotel within the four-star sector in Malta fully operates on an all-inclusive basis (other than the San Antonio Hotel described hereunder) and therefore, no peer is deemed to be directly comparable to the Seabank Hotel. As such, the Seabank Hotel has been compared to the average four-star sector results published in the Malta Hotels and Restaurants Association (MHRA) Survey.
In terms of occupancy level, the Seabank Hotel underperformed the benchmark in FY2014 (71% as compared to the industry’s 76%) and in FY2016 (82% as compared to 84%), whilst in FY2015 the hotel surpassed its peer group by 2 percentage points and achieved an occupancy level of 82%. Given that the hotel is one of the largest hotels in Malta with 539 rooms, management believes that it is more challenging to outperform the industry average. As for RevPOR (which incorporates room revenue, food & beverage and other income), the Seabank Hotel performed better than the four-star industry average in each of the historical years under review (as evidenced by the RGI above 1 in FY2014 to FY2016). Furthermore, the Seabank Hotel generated GOPAR in FY2014, FY2015 and FY2016 well in excess of the four-star average (GOPGI of 1.85, 2.57 and 1.53 respectively), primarily as a result of the hotel benefiting from economies of scale, allowing for greater flexibility in operations and having a leaner structure.
With respect to FY2017 and FY2018, the Seabank Hotel is projected to increase occupancy level from 82% in FY2016 to 83%, and RevPOR is expected to increase from €125 in FY2016 to €128 and €131 in FY2017 and FY2018 respectively. As such, revenue is forecasted at €20.9 million in FY2017 (+4.7% over FY2016) and €21.3 million in the subsequent year. Gross operating profit margin is expected to increase from the current 54% to 55% in each of the projected financial years.
7. DB SAN ANTONIO HOTEL & SPA
IntroductionHotel San Antonio Limited, a db Group subsidiary company, owns the 513-room 10-floor four-star db San Antonio Hotel & Spa, located in St Paul’s Bay, Malta (the “San Antonio Hotel”). The Group acquired 50% of the San Antonio Hotel in 2000 and purchased the remaining 50% shareholding in December 2013. During the first two quarters of 2014 (Jan-Jun‘14), the hotel was closed for refurbishment and development works which comprised the extension of the room count from 300 to over 500 rooms. In addition, a number of apartments were developed, which are offered to customers on a long-let basis. The total capital expenditure amounted to circa €32 million and was financed from bank funding. The San Antonio Hotel is an all-inclusive hotel with 5 themed restaurants, indoor, outdoor and rooftop pools, a fitness centre, a Hammam spa and conference facilities. The carrying value of the San Antonio Hotel as at 31 March 2016 is €70.0 million (FY2015: €51.4 million).
FAS 9
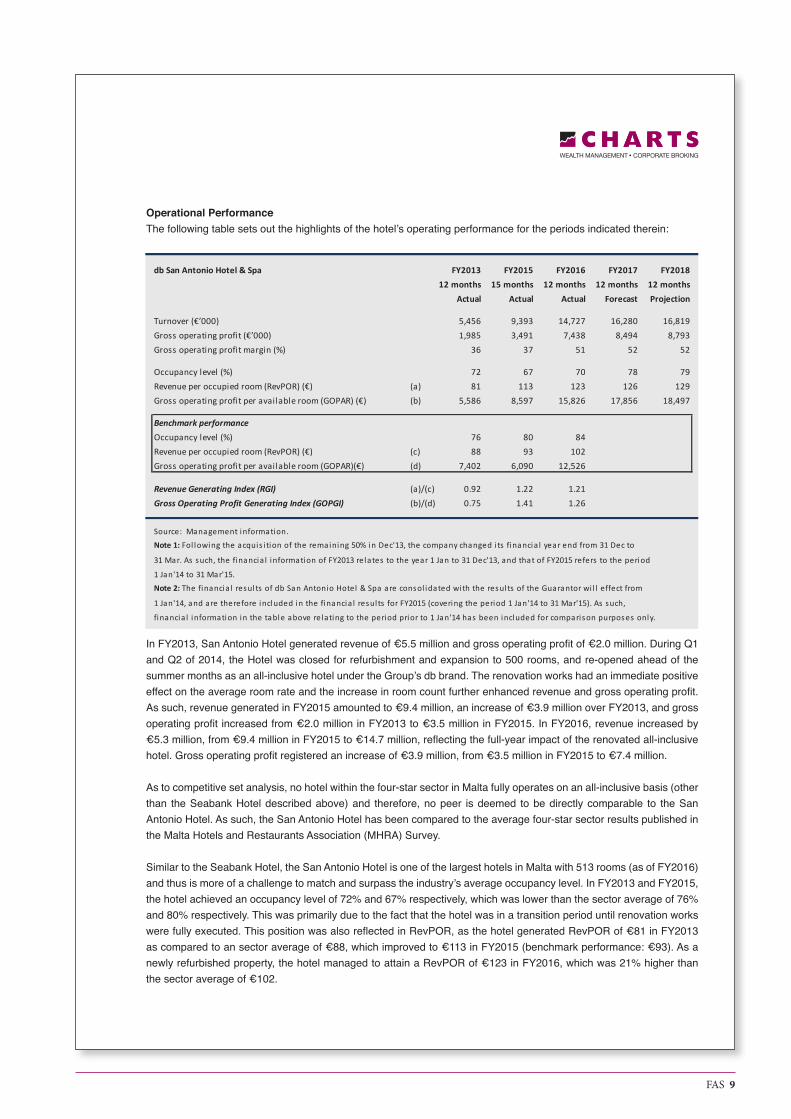
Operational PerformanceThe following table sets out the highlights of the hotel’s operating performance for the periods indicated therein:
In FY2013, San Antonio Hotel generated revenue of €5.5 million and gross operating profit of €2.0 million. During Q1 and Q2 of 2014, the Hotel was closed for refurbishment and expansion to 500 rooms, and re-opened ahead of the summer months as an all-inclusive hotel under the Group’s db brand. The renovation works had an immediate positive effect on the average room rate and the increase in room count further enhanced revenue and gross operating profit. As such, revenue generated in FY2015 amounted to €9.4 million, an increase of €3.9 million over FY2013, and gross operating profit increased from €2.0 million in FY2013 to €3.5 million in FY2015. In FY2016, revenue increased by €5.3 million, from €9.4 million in FY2015 to €14.7 million, reflecting the full-year impact of the renovated all-inclusive hotel. Gross operating profit registered an increase of €3.9 million, from €3.5 million in FY2015 to €7.4 million. As to competitive set analysis, no hotel within the four-star sector in Malta fully operates on an all-inclusive basis (other than the Seabank Hotel described above) and therefore, no peer is deemed to be directly comparable to the San Antonio Hotel. As such, the San Antonio Hotel has been compared to the average four-star sector results published in the Malta Hotels and Restaurants Association (MHRA) Survey. Similar to the Seabank Hotel, the San Antonio Hotel is one of the largest hotels in Malta with 513 rooms (as of FY2016) and thus is more of a challenge to match and surpass the industry’s average occupancy level. In FY2013 and FY2015, the hotel achieved an occupancy level of 72% and 67% respectively, which was lower than the sector average of 76% and 80% respectively. This was primarily due to the fact that the hotel was in a transition period until renovation works were fully executed. This position was also reflected in RevPOR, as the hotel generated RevPOR of €81 in FY2013 as compared to an sector average of €88, which improved to €113 in FY2015 (benchmark performance: €93). As a newly refurbished property, the hotel managed to attain a RevPOR of €123 in FY2016, which was 21% higher than the sector average of €102.
db San Antonio Hotel & Spa FY2013 FY2015 FY2016 FY2017 FY201812 months 15 months 12 months 12 months 12 months
Actual Actual Actual Forecast Projection
Turnover (€’000) 5,456 9,393 14,727 16,280 16,819Gross operating profit (€’000) 1,985 3,491 7,438 8,494 8,793Gross operating profit margin (%) 36 37 51 52 52
Occupancy level (%) 72 67 70 78 79Revenue per occupied room (RevPOR) (€) (a) 81 113 123 126 129Gross operating profit per available room (GOPAR) (€) (b) 5,586 8,597 15,826 17,856 18,497
Benchmark performanceOccupancy level (%) 76 80 84Revenue per occupied room (RevPOR) (€) (c) 88 93 102Gross operating profit per available room (GOPAR)(€) (d) 7,402 6,090 12,526
Revenue Generating Index (RGI) (a)/(c) 0.92 1.22 1.21Gross Operating Profit Generating Index (GOPGI) (b)/(d) 0.75 1.41 1.26
Source: Management information.
Note 1: Fol lowing the acquis i tion of the remaining 50% in Dec'13, the company changed i ts financia l year end from 31 Dec to
31 Mar. As such, the financia l information of FY2013 relates to the year 1 Jan to 31 Dec'13, and that of FY2015 refers to the period
1 Jan'14 to 31 Mar'15.
Note 2: The financia l resul ts of db San Antonio Hotel & Spa are consol idated with the resul ts of the Guarantor wi l l effect from
1 Jan'14, and are therefore included in the financia l resul ts for FY2015 (covering the period 1 Jan'14 to 31 Mar'15). As such,
financia l information in the table above relating to the period prior to 1 Jan'14 has been included for comparison purposes only.
FAS 10
With respect to GOPAR, the San Antonio Hotel exceeded the market average in each of the reviewed historical financial years (other than FY2013), as management took advantage of economies of scale afforded by the property (in view of the higher room inventory than the sector average). As such, in FY2016, the San Antonio Hotel generated GOPAR of €15,826 (FY2015: €8,597), which was 26% higher than the market average of €12,526 (FY2015: €6,090).
During FY2017, the San Antonio Hotel is forecasted to further expand its all-inclusive offering and as a result, occupancy level for the said year is set to reach 78%, an increase of eight percentage points when compared to the prior year. Thereafter, occupancy level is projected to increase to 79% (in FY2018). In terms of RevPOR, management has projected an increase from €123 in FY2016 to €126 and €129 in FY2017 and FY2018 respectively. Due to the afore-mentioned growth, revenue in FY2017 is forecasted to increase by €1.6 million (+11%) from €14.7 million in FY2016 to €16.3 million, and gross operating profit is expected to increase by €1.1 million (+14%) from €7.4 million in FY2016 to €8.5 million. The aforesaid increase in business activity should further enhance operating efficiency at the hotel and therefore, management is forecasting a marginal improvement in gross operating profit margin from 51% in FY2016 to 52%.
As for FY2018, management is projecting revenue to increase by 3.3% from €16.3 million in FY2017 to €16.8 million, and gross operating profit for the reviewed year is estimated at €8.8 million, an increase of 3.5% from a year earlier.
8. HARD ROCK CAFÉ MALTA
IntroductionSea Port Franchising Limited, a db Group subsidiary company, was awarded the Hard Rock Café franchise for Malta in 2000, pursuant to the terms of a franchise agreement entered into with Hard Rock International. This franchise agreement is due to expire on 16 June 2020, subject to renewal.
The db Group presently operates 3 Hard Rock Café outlets in the following localities:
• Bay Street Complex, St Julian’s – The premises is subject to a concession agreement and an operator agreement with Bronville Limited and Baystreet Limited respectively. The term of both agreements commenced on 25 November 2000, and is due to expire on 25 November 2020. The restaurant covers an area of 600m2, has a seating capacity of circa 180 covers, and includes a bar area, merchandise shop and internationally renowned rock ‘n’ roll memorabilia.
• Malta International Airport – Sea Port Franchising Limited operates a Hard Rock Bar at the Malta International Airport pursuant to a lease agreement, entered into with Malta International Airport p.l.c., the term of which commenced on 1 January 2016 and is due to expire on 31 December 2022, subject to renewal. The Hard Rock Bar is situated in the departures lounge of the airport. In 2015, the Hard Rock Bar was fully refurbished and restyled.
• Valletta Waterfront – In 2005, Sea Port Franchising Limited entered into a lease agreement with Valletta Cruise Port p.l.c. (formerly VISET Malta p.l.c.), following which it commenced operating a Hard Rock Bar with a seating capacity of circa 140 covers. The term of this lease agreement commenced on 1 March 2006 and is due to expire on 28 February 2018, subject to renewal.
FAS 11
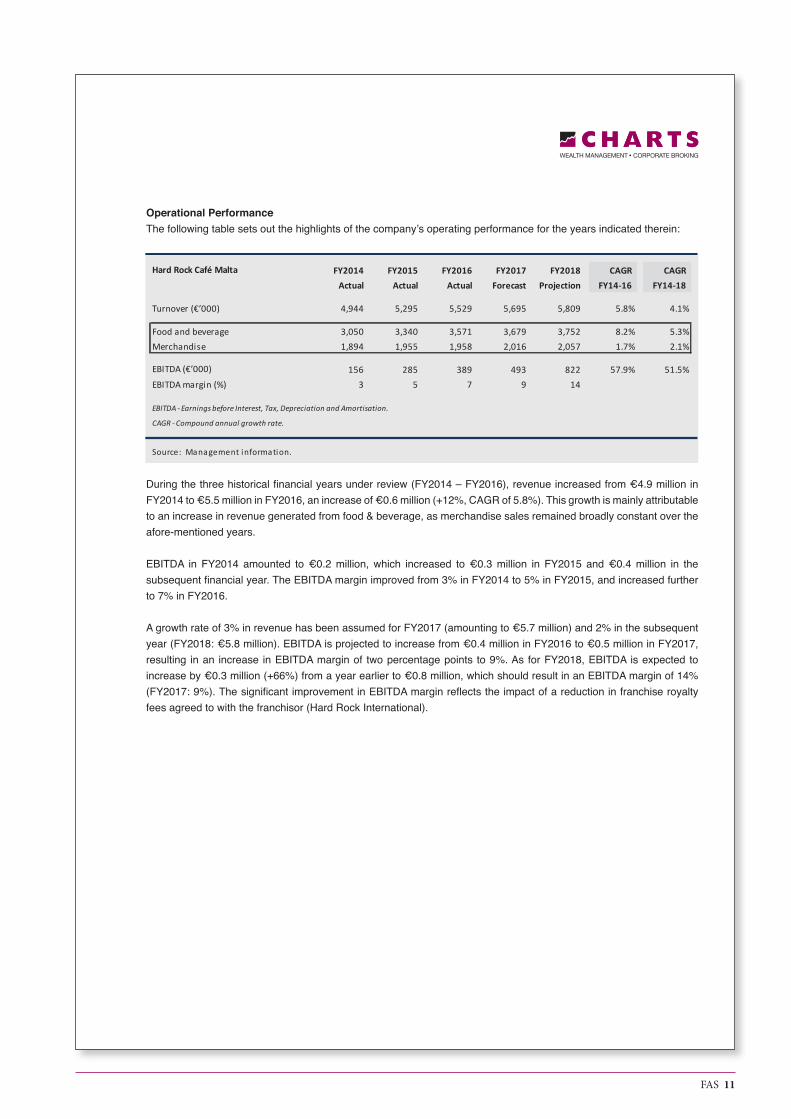
Operational PerformanceThe following table sets out the highlights of the company’s operating performance for the years indicated therein:
During the three historical financial years under review (FY2014 – FY2016), revenue increased from €4.9 million in FY2014 to €5.5 million in FY2016, an increase of €0.6 million (+12%, CAGR of 5.8%). This growth is mainly attributable to an increase in revenue generated from food & beverage, as merchandise sales remained broadly constant over the afore-mentioned years.
EBITDA in FY2014 amounted to €0.2 million, which increased to €0.3 million in FY2015 and €0.4 million in the subsequent financial year. The EBITDA margin improved from 3% in FY2014 to 5% in FY2015, and increased further to 7% in FY2016.
A growth rate of 3% in revenue has been assumed for FY2017 (amounting to €5.7 million) and 2% in the subsequent year (FY2018: €5.8 million). EBITDA is projected to increase from €0.4 million in FY2016 to €0.5 million in FY2017, resulting in an increase in EBITDA margin of two percentage points to 9%. As for FY2018, EBITDA is expected to increase by €0.3 million (+66%) from a year earlier to €0.8 million, which should result in an EBITDA margin of 14% (FY2017: 9%). The significant improvement in EBITDA margin reflects the impact of a reduction in franchise royalty fees agreed to with the franchisor (Hard Rock International).
Hard Rock Café Malta FY2014 FY2015 FY2016 FY2017 FY2018 CAGR CAGRActual Actual Actual Forecast Projection FY14-16 FY14-18
Turnover (€’000) 4,944 5,295 5,529 5,695 5,809 5.8% 4.1%
Food and beverage 3,050 3,340 3,571 3,679 3,752 8.2% 5.3%Merchandise 1,894 1,955 1,958 2,016 2,057 1.7% 2.1%
EBITDA (€’000) 156 285 389 493 822 57.9% 51.5%EBITDA margin (%) 3 5 7 9 14
Source: Management information.
CAGR - Compound annual growth rate.
EBITDA - Earnings before Interest, Tax, Depreciation and Amortisation.
FAS 12
9. TUNNY NET COMPLEX
Introduction Tunny Net Complex is operated by S.R.G.N. Company Limited, a subsidiary company of the db Group. The complex
is located at Mellieha Bay, Malta (in close proximity to db Seabank Resort & Spa) and offers entertainment and leisure facilities to customers, including a beach lido, water sports facilities and a number of restaurants and retail outlets. It was completely refurbished in 2014. The property is leased from a subsidiary company – J.D. Catering Limited (C 15193) – which holds title of temporary emphyteusis granted to it by the Government of Malta and is due to expire on 31 July 2026.
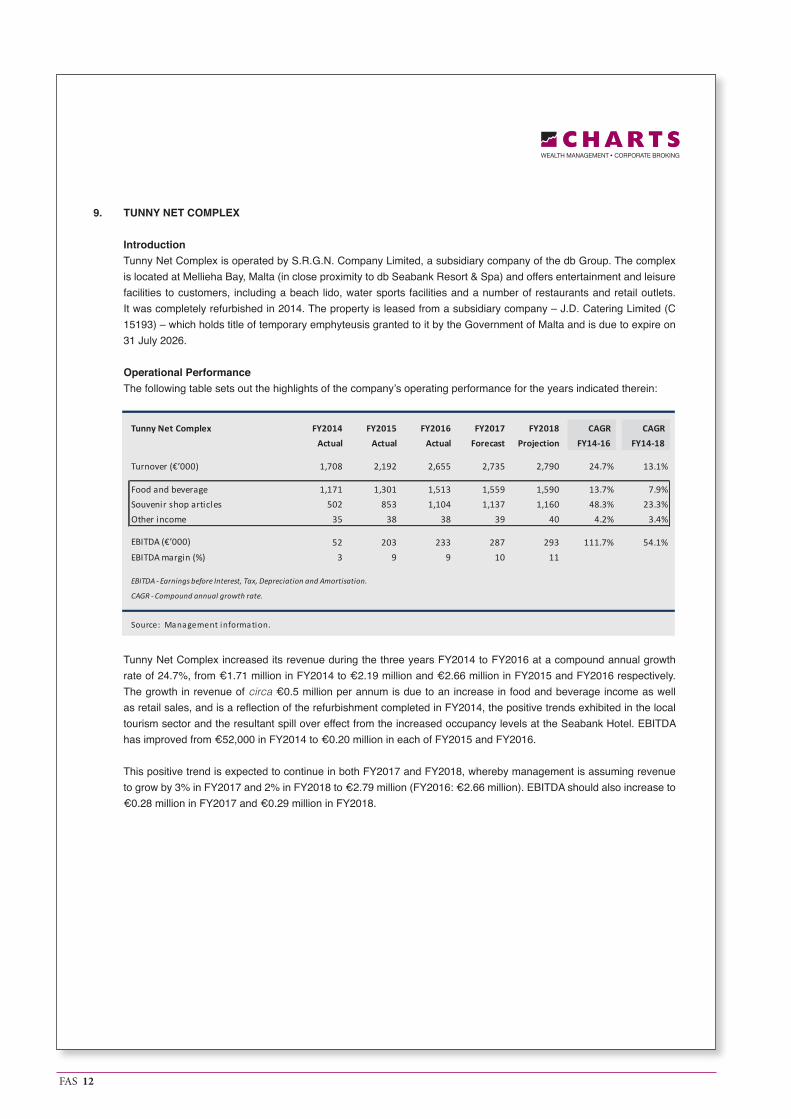
Operational Performance The following table sets out the highlights of the company’s operating performance for the years indicated therein:
Tunny Net Complex increased its revenue during the three years FY2014 to FY2016 at a compound annual growth rate of 24.7%, from €1.71 million in FY2014 to €2.19 million and €2.66 million in FY2015 and FY2016 respectively. The growth in revenue of circa €0.5 million per annum is due to an increase in food and beverage income as well as retail sales, and is a reflection of the refurbishment completed in FY2014, the positive trends exhibited in the local tourism sector and the resultant spill over effect from the increased occupancy levels at the Seabank Hotel. EBITDA has improved from €52,000 in FY2014 to €0.20 million in each of FY2015 and FY2016.
This positive trend is expected to continue in both FY2017 and FY2018, whereby management is assuming revenue to grow by 3% in FY2017 and 2% in FY2018 to €2.79 million (FY2016: €2.66 million). EBITDA should also increase to €0.28 million in FY2017 and €0.29 million in FY2018.
Tunny Net Complex FY2014 FY2015 FY2016 FY2017 FY2018 CAGR CAGRActual Actual Actual Forecast Projection FY14-16 FY14-18
Turnover (€’000) 1,708 2,192 2,655 2,735 2,790 24.7% 13.1%
Food and beverage 1,171 1,301 1,513 1,559 1,590 13.7% 7.9%Souvenir shop articles 502 853 1,104 1,137 1,160 48.3% 23.3%Other income 35 38 38 39 40 4.2% 3.4%
EBITDA (€’000) 52 203 233 287 293 111.7% 54.1%EBITDA margin (%) 3 9 9 10 11
Source: Management information.
CAGR - Compound annual growth rate.
EBITDA - Earnings before Interest, Tax, Depreciation and Amortisation.
FAS 13
10. HOSPITALITY & LEISURE SECTOR ANALYSIS
10.1 ECONOMIC UPDATE
Economic activity in Malta is expected to remain robust in the near term, supported by both demand and supply factors. In particular, the energy reforms that have taken place in recent years, new investment projects, increased labour market participation and robust services exports are the primary drivers supporting the economic expansion. Real GDP growth is expected at 4.3% for 2016 and thereafter, is projected to decelerate to 4.1% in 2017, 3.7% in 2018 and 3.3% in 2019.
As a result, the labour market is projected to remain tight, with the unemployment rate falling further to 4.9% in 2016, before increasing slightly to 5.3% by 2019. Downward international price pressures are expected to contribute towards a further easing of consumer price inflation in 2016 (annual inflation should ease from 1.2% in 2015 to 0.9% in 2016). It is then projected to trend up to 1.9% by 2019, reflecting a pick-up in international commodity prices and domestic cost pressures.
In terms of public finances, restraint in key expenditure variables is expected to contribute towards a decline in the general government deficit, with the government budget set to become broadly in balance by 2019.
10.2 TOURISM MARKET
Tourism in Malta has in recent years been performing at a strong level and this trend continued in 2015 as well as in 2016. Inbound tourism from January to December 2015 amounted to 1.8 million guests, an increase of 6.0% over the same period in 2014. Although tourists residing in collective accommodation (hotels, guesthouses, hostels, B&Bs, etc) made up 71.7% of the market in 2015, preference for private accommodation has been growing in the last years at a faster pace, and actually increased by 18.2% from 2014. Tourism expenditure was estimated at €1.6 billion, 7.5% higher than that recorded for the comparable period in 2014.
Inbound tourist trips from January to December 2016 amounted to 1.99 million, an increase of 10.2% when compared a year earlier. Total nights spent by inbound tourists went up by 5.7%, reaching almost 15.0 million nights. During 2016, total guests in collective accommodation establishments surpassed 1.6 million, an increase of 2.1% over the same period in 2015. Within the collective accommodation establishments, the 5 star and 4 star hotels gained 10,878 guests (+2.8%) and 30,779 guests (+4.5%) respectively in 2016 when compared to a year earlier, while there was a decrease of 24,042 guests (-5.7%) in the 3 star category. Tourism expenditure was estimated at €1.71 billion in 2016, an increase of 4.3% over 2015.
Focus will be maintained on increasing arrivals during the winter months and attracting more visitors from new markets to Malta. This bodes well for the Maltese hospitality industry as the expectation is to continue to grow revenues and increase profitability.
Looking forward, Malta’s EU Presidency in the current year (2017) together with Valletta serving as the European City of Culture in 2018 are widely expected to generate increased demand for hotels and enhance Malta’s image as a tourist destination, which would in turn generate further growth in the hospitality sector. Meanwhile, the somewhat uncertain future of the national carrier Air Malta poses a concern to further growth whilst competition from other Mediterranean countries will likely remain strong.
FAS 14
10.3 FOOD & BEVERAGE SERVICE SECTOR
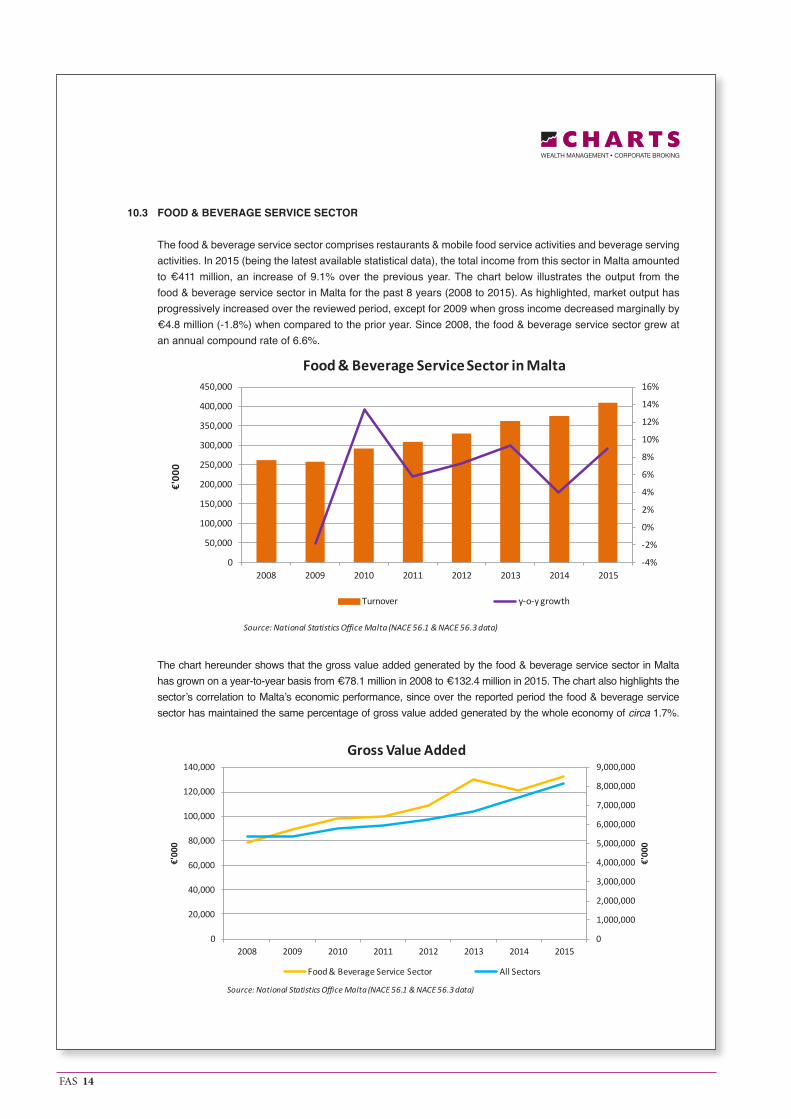
The food & beverage service sector comprises restaurants & mobile food service activities and beverage serving activities. In 2015 (being the latest available statistical data), the total income from this sector in Malta amounted to €411 million, an increase of 9.1% over the previous year. The chart below illustrates the output from the food & beverage service sector in Malta for the past 8 years (2008 to 2015). As highlighted, market output has progressively increased over the reviewed period, except for 2009 when gross income decreased marginally by €4.8 million (-1.8%) when compared to the prior year. Since 2008, the food & beverage service sector grew at an annual compound rate of 6.6%.
The chart hereunder shows that the gross value added generated by the food & beverage service sector in Malta has grown on a year-to-year basis from €78.1 million in 2008 to €132.4 million in 2015. The chart also highlights the sector’s correlation to Malta’s economic performance, since over the reported period the food & beverage service sector has maintained the same percentage of gross value added generated by the whole economy of circa 1.7%.
-4%
-2%
0%
2%
4%
6%
8%
10%
12%
14%
16%
0
50,000
100,000
150,000
200,000
250,000
300,000
350,000
400,000
450,000
2008 2009 2010 2011 2012 2013 2014 2015
€'00
0
Food & Beverage Service Sector in Malta
Turnover y-o-y growth
Source: National Statistics Office Malta (NACE 56.1 & NACE 56.3 data)
0
1,000,000
2,000,000
3,000,000
4,000,000
5,000,000
6,000,000
7,000,000
8,000,000
9,000,000
0
20,000
40,000
60,000
80,000
100,000
120,000
140,000
2008 2009 2010 2011 2012 2013 2014 2015
€'00
0
€'00
0
Gross Value Added
Food & Beverage Service Sector All Sectors
Source: National Statistics Office Malta (NACE 56.1 & NACE 56.3 data)
FAS 15
11. INVESTMENTS IN ASSOCIATED COMPANIES
11.1 HEALTHCARE AND CATERING SERVICES
IntroductionMalta Healthcare Caterers Limited (the “MHC Group”) is a joint venture between the db Group and James Caterers Limited (C 30139), and is principally engaged in the provision of healthcare and catering services to hospitals and retirement homes, together with other related services, in Malta and Gozo. In 2013, the MHC Group acquired a site in Santa Lucija measuring circa 4,455m2 with the intention of eventually developing it into a 300-bed home for the elderly.
Healthcare Division The healthcare division of the MHC Group comprises the following subsidiary companies:
• Healthmark Care Services Ltd – the company is engaged in the provision of health and social care services and training to the general public, hospitals and elderly retirement and nursing homes;
• Health Services Group Limited – the company is engaged in the provision of nursing services;• Support Services Limited – the company is engaged in the provision of nursing, medical and clinical services.
The operations of the healthcare division commenced in 2014 with the acquisition by the MHC Group of two existing healthcare sector companies. Subsequently, in November 2015, the MHC Group substantially increased its headcount to offer services previously provided by Malta Memorial District Nursing Association (which ceased providing community care services in October 2015). At the start of 2016, the MHC Group included domiciliary care for the elderly to its offerings.
At present, the healthcare division has a staff complement of circa 1,500 employees, including 150 professional nurses, 150 staff members providing domiciliary care for the elderly and 1,200 trained care assistants (2015: 1,092 employees). The key agreements include: (i) the provision of nursing and care services under the Active Ageing and Community Care Directorate; (ii) the provision of care worker services at Mater Dei Hospital and other entities within the Health Department; (iii) the provision of care worker services at St Vincent de Paul Residence and Homes for the Elderly Community Care; and (iv) the provision of home help services.
Catering DivisionThe MHC Group initiated operations in contract catering in 2007, after being awarded the contract to supply meals to in-patients at Mater Dei Hospital, St Luke’s Hospital and Sir Paul Boffa Hospital. In 2015, the MHC Group ceased to supply meals to Sir Paul Boffa Hospital, but instead commenced servicing Sir Anthony Mamo Oncology Centre. This agreement shall expire on 16 November 2022.
The MHC Group also provides catering and ancillary services to in-patients and staff of Gozo General Hospital (since 2013) and St Vincent de Paul Residence (since 2014). The contract relating to the former is due to expire on 27 June 2018, subject to the option of extending by a further year. The term of the contract relating to the latter has been extended up to 7 July 2017. In aggregate, the MHC Group serves in the region of 5,700 meals per day.
FAS 16
Operational Performance The following table sets out the highlights of the company’s operating performance for the years indicated
therein:
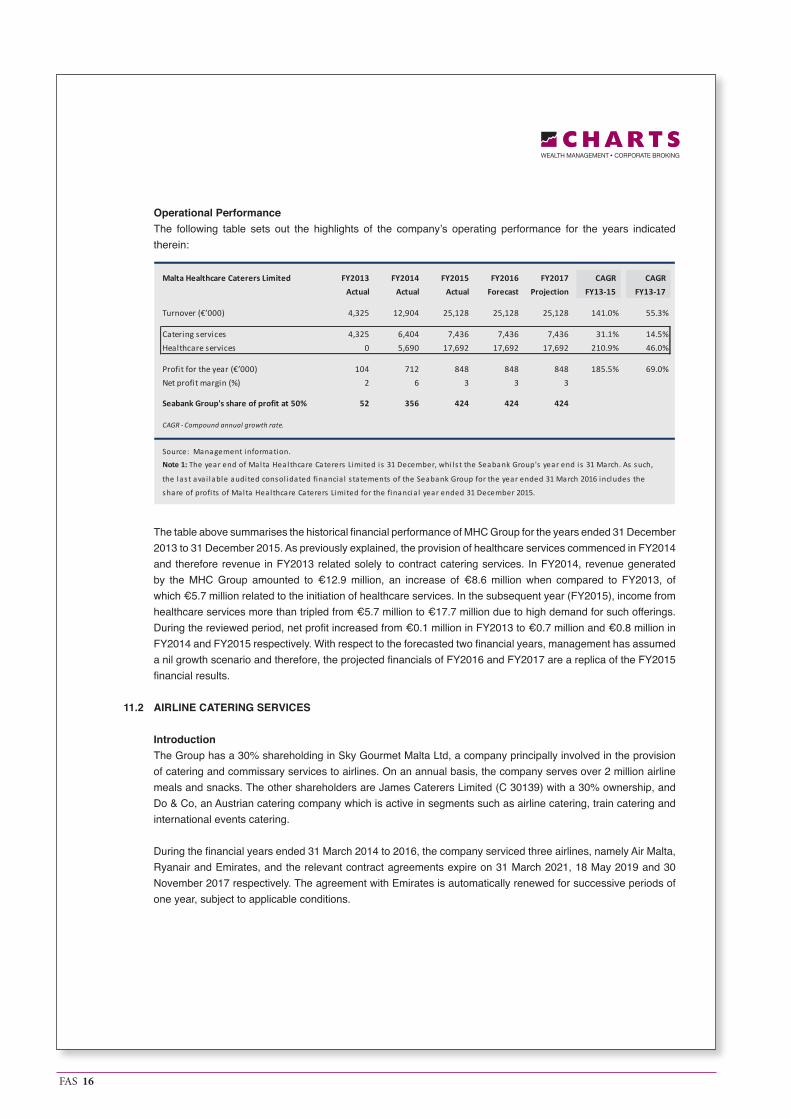
The table above summarises the historical financial performance of MHC Group for the years ended 31 December 2013 to 31 December 2015. As previously explained, the provision of healthcare services commenced in FY2014 and therefore revenue in FY2013 related solely to contract catering services. In FY2014, revenue generated by the MHC Group amounted to €12.9 million, an increase of €8.6 million when compared to FY2013, of which €5.7 million related to the initiation of healthcare services. In the subsequent year (FY2015), income from healthcare services more than tripled from €5.7 million to €17.7 million due to high demand for such offerings. During the reviewed period, net profit increased from €0.1 million in FY2013 to €0.7 million and €0.8 million in FY2014 and FY2015 respectively. With respect to the forecasted two financial years, management has assumed a nil growth scenario and therefore, the projected financials of FY2016 and FY2017 are a replica of the FY2015 financial results.
11.2 AIRLINE CATERING SERVICES
Introduction The Group has a 30% shareholding in Sky Gourmet Malta Ltd, a company principally involved in the provision
of catering and commissary services to airlines. On an annual basis, the company serves over 2 million airline meals and snacks. The other shareholders are James Caterers Limited (C 30139) with a 30% ownership, and Do & Co, an Austrian catering company which is active in segments such as airline catering, train catering and international events catering.
During the financial years ended 31 March 2014 to 2016, the company serviced three airlines, namely Air Malta, Ryanair and Emirates, and the relevant contract agreements expire on 31 March 2021, 18 May 2019 and 30 November 2017 respectively. The agreement with Emirates is automatically renewed for successive periods of one year, subject to applicable conditions.
Malta Healthcare Caterers Limited FY2013 FY2014 FY2015 FY2016 FY2017 CAGR CAGRActual Actual Actual Forecast Projection FY13-15 FY13-17
Turnover (€’000) 4,325 12,904 25,128 25,128 25,128 141.0% 55.3%
Catering services 4,325 6,404 7,436 7,436 7,436 31.1% 14.5%Healthcare services 0 5,690 17,692 17,692 17,692 210.9% 46.0%
Profit for the year (€’000) 104 712 848 848 848 185.5% 69.0%Net profit margin (%) 2 6 3 3 3
Seabank Group's share of profit at 50% 52 356 424 424 424
Source: Management information.
Note 1: The year end of Malta Healthcare Caterers Limited is 31 December, whi ls t the Seabank Group's year end is 31 March. As such,
the last ava i lable audited consol idated financia l s tatements of the Seabank Group for the year ended 31 March 2016 includes the
share of profi ts of Malta Healthcare Caterers Limited for the financia l year ended 31 December 2015.
CAGR - Compound annual growth rate.
FAS 17
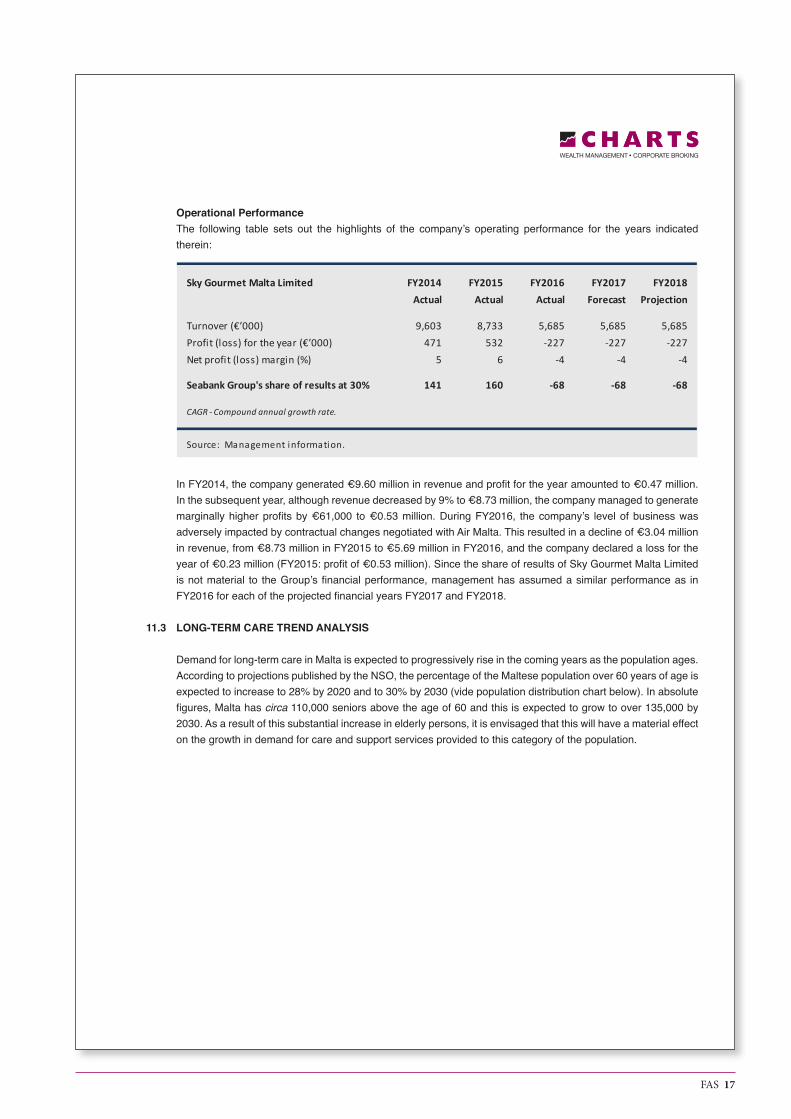
Operational PerformanceThe following table sets out the highlights of the company’s operating performance for the years indicated therein:
In FY2014, the company generated €9.60 million in revenue and profit for the year amounted to €0.47 million. In the subsequent year, although revenue decreased by 9% to €8.73 million, the company managed to generate marginally higher profits by €61,000 to €0.53 million. During FY2016, the company’s level of business was adversely impacted by contractual changes negotiated with Air Malta. This resulted in a decline of €3.04 million in revenue, from €8.73 million in FY2015 to €5.69 million in FY2016, and the company declared a loss for the year of €0.23 million (FY2015: profit of €0.53 million). Since the share of results of Sky Gourmet Malta Limited is not material to the Group’s financial performance, management has assumed a similar performance as in FY2016 for each of the projected financial years FY2017 and FY2018.
11.3 LONG-TERM CARE TREND ANALYSIS
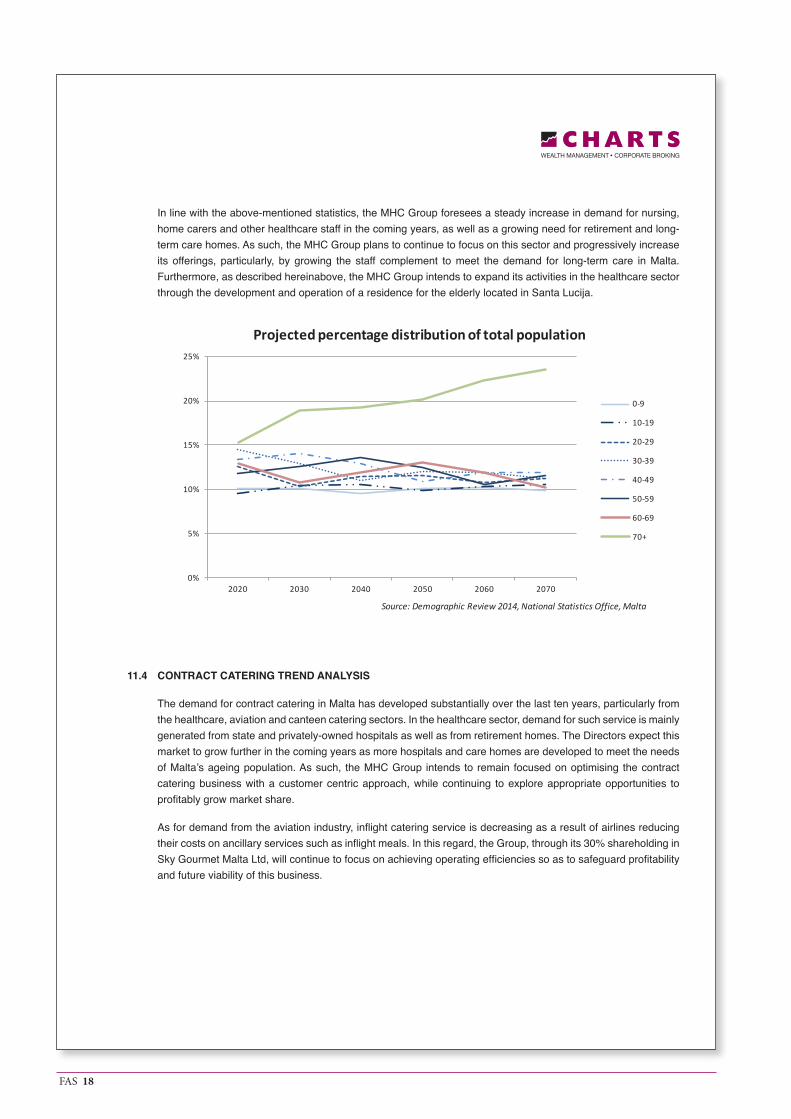
Demand for long-term care in Malta is expected to progressively rise in the coming years as the population ages. According to projections published by the NSO, the percentage of the Maltese population over 60 years of age is expected to increase to 28% by 2020 and to 30% by 2030 (vide population distribution chart below). In absolute figures, Malta has circa 110,000 seniors above the age of 60 and this is expected to grow to over 135,000 by 2030. As a result of this substantial increase in elderly persons, it is envisaged that this will have a material effect on the growth in demand for care and support services provided to this category of the population.
Sky Gourmet Malta Limited FY2014 FY2015 FY2016 FY2017 FY2018Actual Actual Actual Forecast Projection
Turnover (€’000) 9,603 8,733 5,685 5,685 5,685Profit (loss) for the year (€’000) 471 532 -227 -227 -227Net profit (loss) margin (%) 5 6 -4 -4 -4
Seabank Group's share of results at 30% 141 160 -68 -68 -68
Source: Management information.
CAGR - Compound annual growth rate.
FAS 18
In line with the above-mentioned statistics, the MHC Group foresees a steady increase in demand for nursing, home carers and other healthcare staff in the coming years, as well as a growing need for retirement and long-term care homes. As such, the MHC Group plans to continue to focus on this sector and progressively increase its offerings, particularly, by growing the staff complement to meet the demand for long-term care in Malta. Furthermore, as described hereinabove, the MHC Group intends to expand its activities in the healthcare sector through the development and operation of a residence for the elderly located in Santa Lucija.
11.4 CONTRACT CATERING TREND ANALYSIS
The demand for contract catering in Malta has developed substantially over the last ten years, particularly from the healthcare, aviation and canteen catering sectors. In the healthcare sector, demand for such service is mainly generated from state and privately-owned hospitals as well as from retirement homes. The Directors expect this market to grow further in the coming years as more hospitals and care homes are developed to meet the needs of Malta’s ageing population. As such, the MHC Group intends to remain focused on optimising the contract catering business with a customer centric approach, while continuing to explore appropriate opportunities to profitably grow market share.
As for demand from the aviation industry, inflight catering service is decreasing as a result of airlines reducing their costs on ancillary services such as inflight meals. In this regard, the Group, through its 30% shareholding in Sky Gourmet Malta Ltd, will continue to focus on achieving operating efficiencies so as to safeguard profitability and future viability of this business.
0%
5%
10%
15%
20%
25%
2020 2030 2040 2050 2060 2070
Projected percentage distribution of total population
0-9
10-19
20-29
30-39
40-49
50-59
60-69
70+
Source: Demographic Review 2014, National Statistics Office, Malta
FAS 19
11.5 OTHER INVESTMENTS IN ASSOCIATED COMPANIES
The Group owns 33.3% of Porto Azzurro Limited, a company that owns, manages and operates a three star 125-room aparthotel located in Xemxija, Malta. The rooms and apartments are equipped with en-suite bathrooms, a fully equipped kitchenette and other amenities. The hotel has a 24-hour reception, a launderette, mini market, dedicated restaurant and a pizzeria, as well as a number of leisure facilities. During the year ended 31 March 2016, the company generated revenue amounting to €0.84 million (FY2015: €0.79 million) and profits of €0.25 million (FY2015: €0.16 million).
The Group owns 30% of Sky Gourmet Malta Inflight Services Ltd, a company principally involved in the provision of personnel and administration services to Sky Gourmet Malta Limited. During the year ended 31 March 2016, the company generated €1.81 million (FY2015: €1.95 million) in revenue and registered a profit for the year of €0.11 million (FY2015: €0.11 million).
12. PRINCIPAL FUTURE INVESTMENTS
On 1 February 2017, the Group, through DB San Gorg Property Limited, entered into a deed of temporary emphyteusis with the Commissioner of Land, on behalf of the Government of Malta, for the design, build and operation of a tourism and leisure development on the site currently occupied by the Institute of Tourism Studies located in St George’s Bay, St Julians, Malta.
The 99-year temporary emphyteutical concession is subject to a cash consideration of €15.0 million, payable over a period of seven years, with the first payment of €5.0 million payable on signing of the said deed. The balance of €10.0 million is payable in seven equal annual instalments as from January 2018. Upon the issuance of the relevant Planning Authority permit determining the full extent of developable area of the City Centre Project, a consideration shall further be due to Government, or by Government to DB San Gorg Property Limited, as the case may be, which consideration is payable over a period of seven years in seven equal annual instalments, and calculated in accordance with the terms of a schedule annexed to the Emphyteutical Deed. The first instalment is to be paid one week after the issuance of the relevant Planning Authority permit. An additional consideration shall become due should a Planning Authority permit be issued allowing for further developable area than originally permitted, which consideration is to be calculated in accordance with the terms of a schedule annexed to the Emphyteutical Deed. The payment of such additional consideration shall be effected within one week from the issuance of the said Planning Authority permit.
Stamp duty of circa €3.0 million was payable upon signing of deed. The payment of circa €8.0 million (comprising the said first payment and stamp duty) was financed primarily through a bank facility.
In terms of the deed, a total annual ground rent of €1,562,509 shall be payable to Government, of which a total of €1,169,579 is to be allocated for redemption purposes based on a net floor space area of 51,030m2 (comprising residential, office space and garage space). The afore-mentioned annual ground rent shall be temporarily reduced to €1,000 per annum until the earlier of: (a) the issuance of a certificate of completion by an architect; or (b) the lapse of five years from date of deed.
Subject to the issuance of Planning Authority permit, the db Group plans to develop a five-star Hard Rock Hotel, a casino, an exclusive top-floor bar, catering and dining establishments, a congress hall and conference centre, a shopping mall, a car park, office suites and residential units. The cost of construction and development of the above-mentioned project is expected to be funded through a combination of own funds, bank facilities and issuance of debt as well as cash flows generated by the initial instalment of residential units set to be constructed as part of the project.
FAS 20
PART 3 – PERFORMANCE REVIEW
13. FINANCIAL INFORMATION RELATING TO SD FINANCE PLC
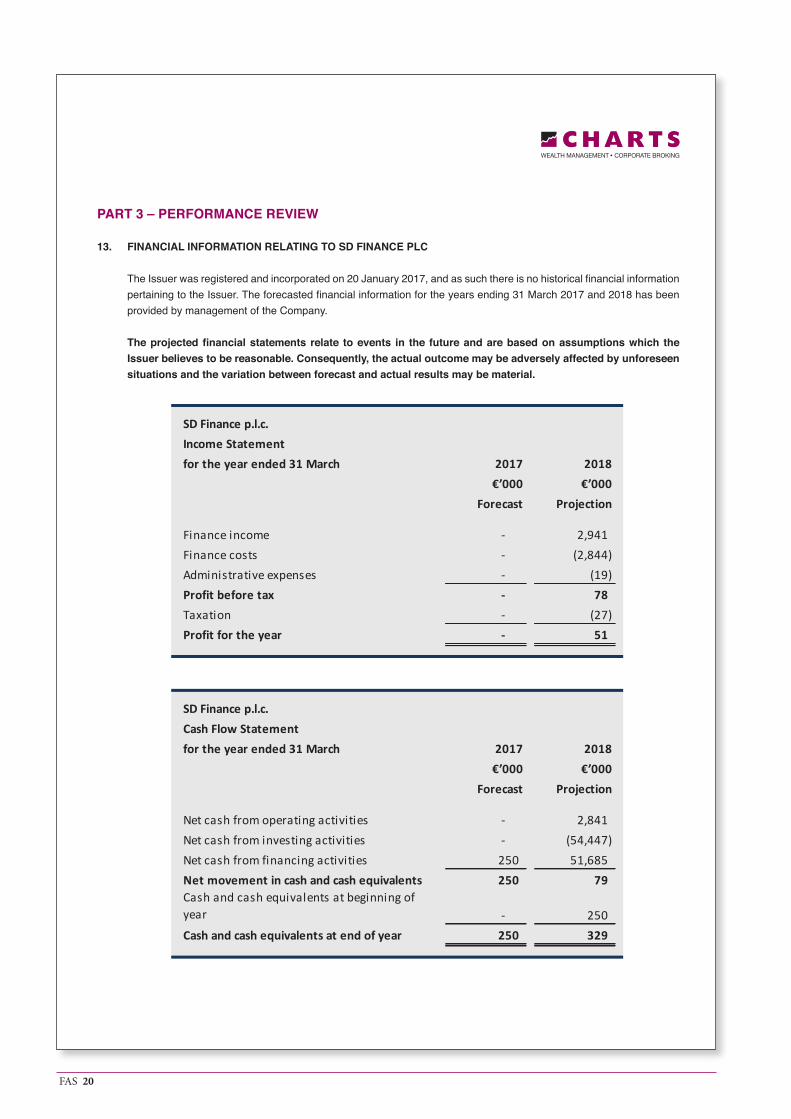
The Issuer was registered and incorporated on 20 January 2017, and as such there is no historical financial information pertaining to the Issuer. The forecasted financial information for the years ending 31 March 2017 and 2018 has been provided by management of the Company.
The projected financial statements relate to events in the future and are based on assumptions which the Issuer believes to be reasonable. Consequently, the actual outcome may be adversely affected by unforeseen situations and the variation between forecast and actual results may be material.
SD Finance p.l.c.Income Statementfor the year ended 31 March 2017 2018
€’000 €’000Forecast Projection
Finance income - 2,941 Finance costs - (2,844) Administrative expenses - (19) Profit before tax - 78 Taxation - (27) Profit for the year - 51
SD Finance p.l.c.Cash Flow Statementfor the year ended 31 March 2017 2018
€’000 €’000Forecast Projection
Net cash from operating activities - 2,841 Net cash from investing activities - (54,447) Net cash from financing activities 250 51,685 Net movement in cash and cash equivalents 250 79 Cash and cash equivalents at beginning of year - 250 Cash and cash equivalents at end of year 250 329
FAS 21
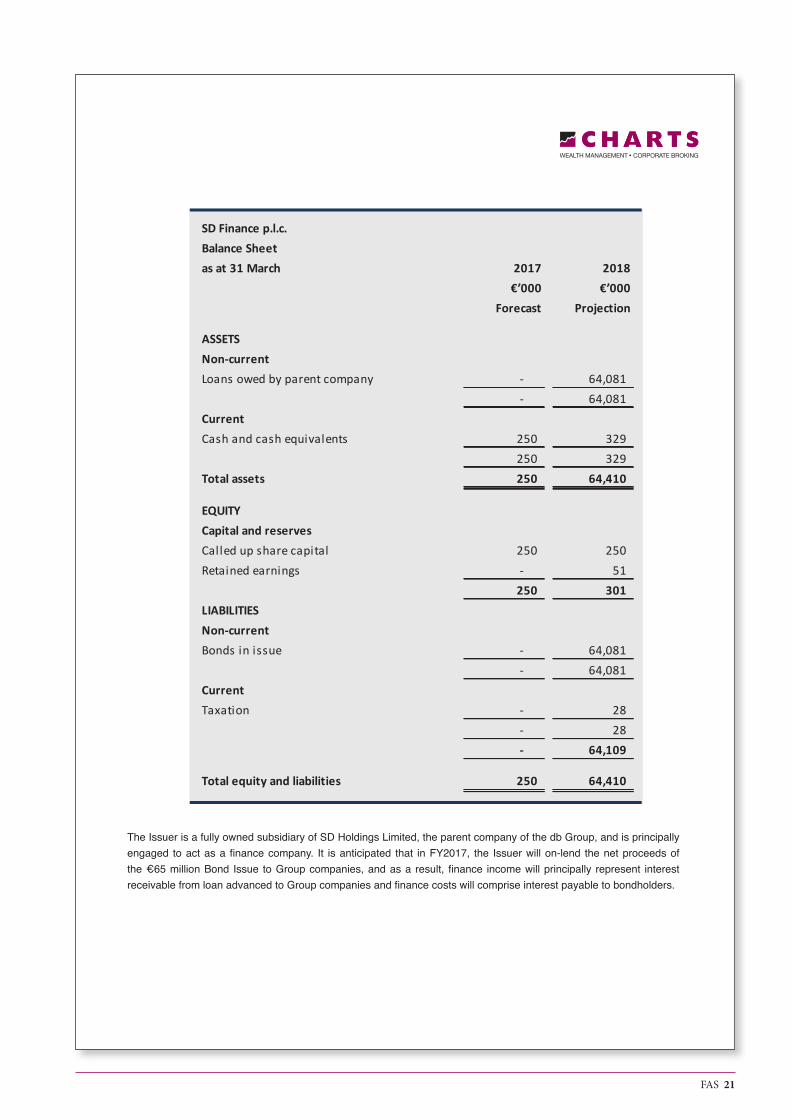
The Issuer is a fully owned subsidiary of SD Holdings Limited, the parent company of the db Group, and is principally engaged to act as a finance company. It is anticipated that in FY2017, the Issuer will on-lend the net proceeds of the €65 million Bond Issue to Group companies, and as a result, finance income will principally represent interest receivable from loan advanced to Group companies and finance costs will comprise interest payable to bondholders.
SD Finance p.l.c.Balance Sheetas at 31 March 2017 2018
€’000 €’000Forecast Projection
ASSETSNon-currentLoans owed by parent company - 64,081
- 64,081 CurrentCash and cash equivalents 250 329
250 329 Total assets 250 64,410
EQUITYCapital and reservesCalled up share capital 250 250 Retained earnings - 51
250 301 LIABILITIESNon-currentBonds in issue - 64,081
- 64,081 CurrentTaxation - 28
- 28 - 64,109
Total equity and liabilities 250 64,410
FAS 22
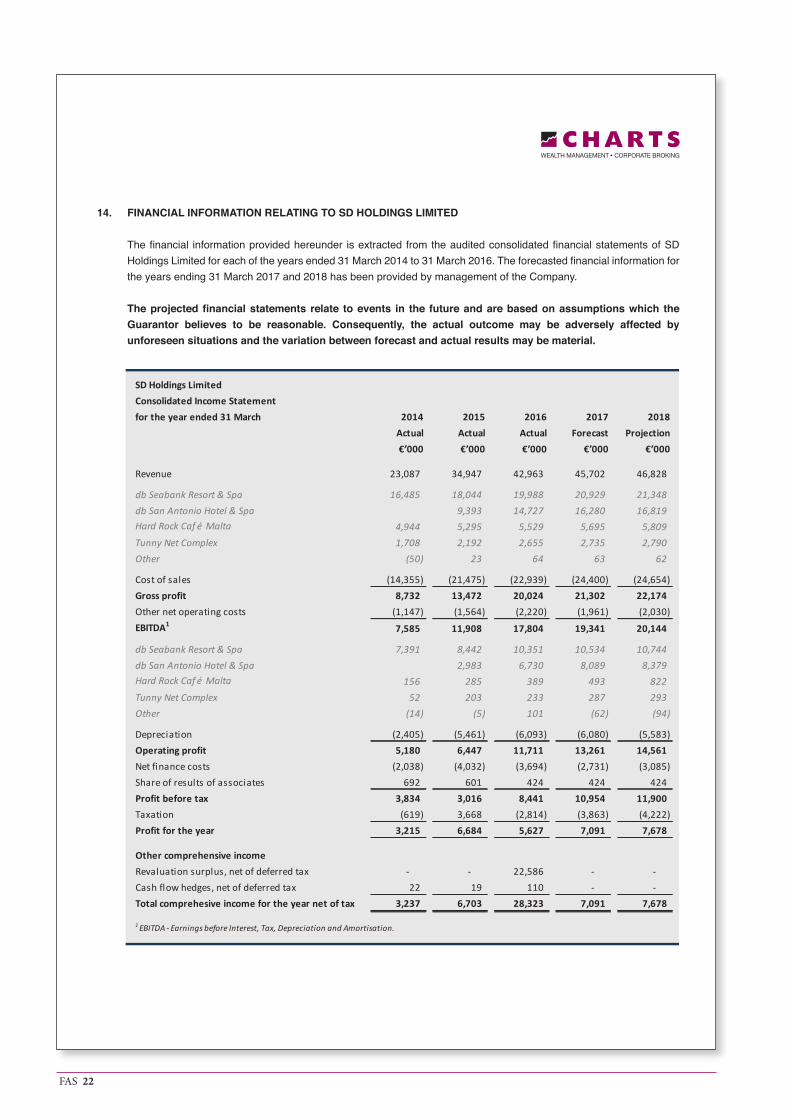
14. FINANCIAL INFORMATION RELATING TO SD HOLDINGS LIMITED
The financial information provided hereunder is extracted from the audited consolidated financial statements of SD Holdings Limited for each of the years ended 31 March 2014 to 31 March 2016. The forecasted financial information for the years ending 31 March 2017 and 2018 has been provided by management of the Company.
The projected financial statements relate to events in the future and are based on assumptions which the Guarantor believes to be reasonable. Consequently, the actual outcome may be adversely affected by unforeseen situations and the variation between forecast and actual results may be material.
SD Holdings Limited Consolidated Income Statementfor the year ended 31 March 2014 2015 2016 2017 2018
Actual Actual Actual Forecast Projection€’000 €’000 €’000 €’000 €’000
Revenue 23,087 34,947 42,963 45,702 46,828
db Seabank Resort & Spa 16,485 18,044 19,988 20,929 21,348 db San Antonio Hotel & Spa 9,393 14,727 16,280 16,819 Hard Rock Caf é Malta 4,944 5,295 5,529 5,695 5,809 Tunny Net Complex 1,708 2,192 2,655 2,735 2,790 Other (50) 23 64 63 62
Cost of sales (14,355) (21,475) (22,939) (24,400) (24,654) Gross profit 8,732 13,472 20,024 21,302 22,174 Other net operating costs (1,147) (1,564) (2,220) (1,961) (2,030) EBITDA1 7,585 11,908 17,804 19,341 20,144
db Seabank Resort & Spa 7,391 8,442 10,351 10,534 10,744 db San Antonio Hotel & Spa 2,983 6,730 8,089 8,379 Hard Rock Caf é Malta 156 285 389 493 822 Tunny Net Complex 52 203 233 287 293 Other (14) (5) 101 (62) (94)
Depreciation (2,405) (5,461) (6,093) (6,080) (5,583) Operating profit 5,180 6,447 11,711 13,261 14,561 Net finance costs (2,038) (4,032) (3,694) (2,731) (3,085) Share of results of associates 692 601 424 424 424 Profit before tax 3,834 3,016 8,441 10,954 11,900 Taxation (619) 3,668 (2,814) (3,863) (4,222) Profit for the year 3,215 6,684 5,627 7,091 7,678
Other comprehensive incomeRevaluation surplus, net of deferred tax - - 22,586 - - Cash flow hedges, net of deferred tax 22 19 110 - - Total comprehesive income for the year net of tax 3,237 6,703 28,323 7,091 7,678
1 EBITDA - Earnings before Interest, Tax, Depreciation and Amortisation.
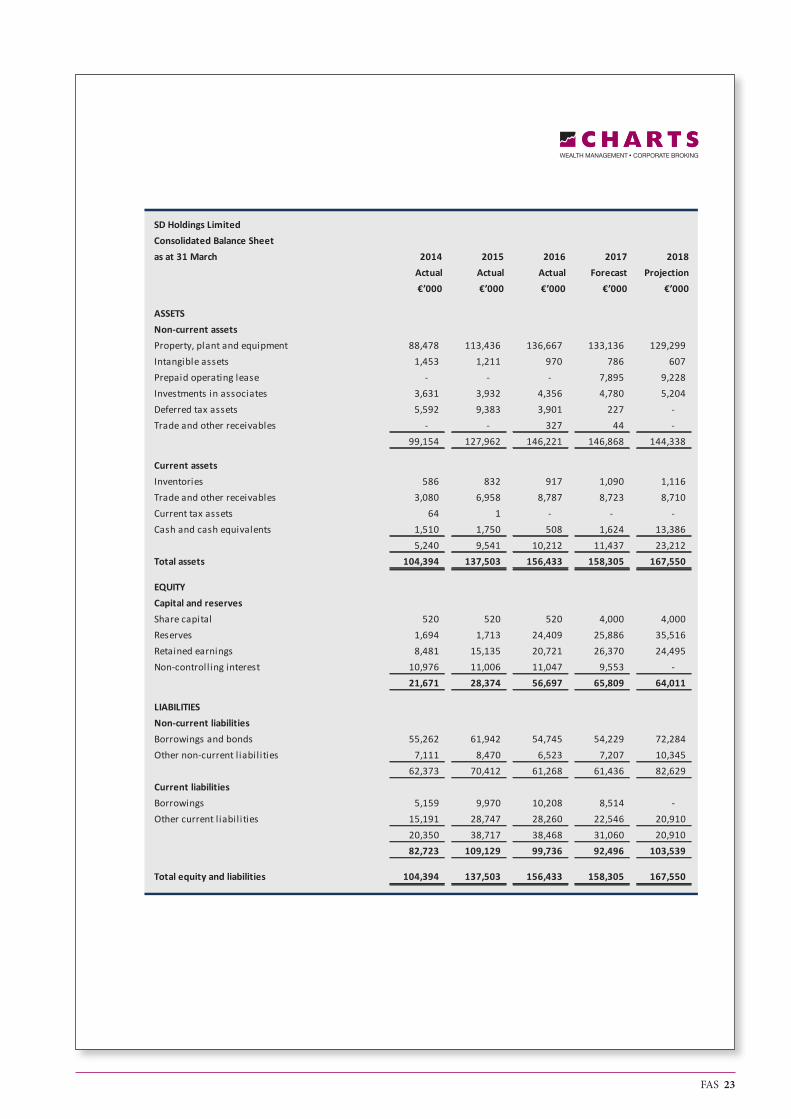
FAS 23
SD Holdings Limited Consolidated Balance Sheetas at 31 March 2014 2015 2016 2017 2018
Actual Actual Actual Forecast Projection€’000 €’000 €’000 €’000 €’000
ASSETSNon-current assetsProperty, plant and equipment 88,478 113,436 136,667 133,136 129,299 Intangible assets 1,453 1,211 970 786 607 Prepaid operating lease - - - 7,895 9,228 Investments in associates 3,631 3,932 4,356 4,780 5,204 Deferred tax assets 5,592 9,383 3,901 227 - Trade and other receivables - - 327 44 -
99,154 127,962 146,221 146,868 144,338
Current assetsInventories 586 832 917 1,090 1,116 Trade and other receivables 3,080 6,958 8,787 8,723 8,710 Current tax assets 64 1 - - - Cash and cash equivalents 1,510 1,750 508 1,624 13,386
5,240 9,541 10,212 11,437 23,212 Total assets 104,394 137,503 156,433 158,305 167,550
EQUITYCapital and reservesShare capital 520 520 520 4,000 4,000 Reserves 1,694 1,713 24,409 25,886 35,516 Retained earnings 8,481 15,135 20,721 26,370 24,495 Non-controll ing interest 10,976 11,006 11,047 9,553 -
21,671 28,374 56,697 65,809 64,011
LIABILITIESNon-current liabilitiesBorrowings and bonds 55,262 61,942 54,745 54,229 72,284 Other non-current l iabil ities 7,111 8,470 6,523 7,207 10,345
62,373 70,412 61,268 61,436 82,629 Current liabilitiesBorrowings 5,159 9,970 10,208 8,514 - Other current l iabil ities 15,191 28,747 28,260 22,546 20,910
20,350 38,717 38,468 31,060 20,910 82,723 109,129 99,736 92,496 103,539
Total equity and liabilities 104,394 137,503 156,433 158,305 167,550
FAS 24
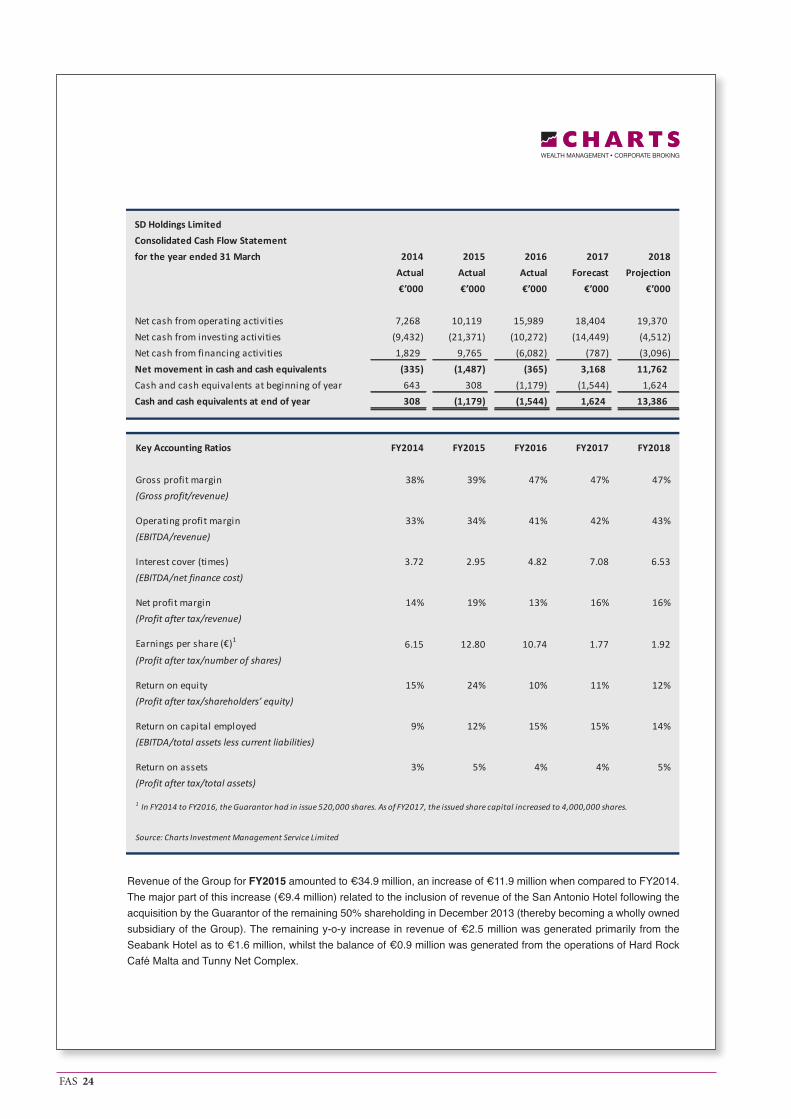
Revenue of the Group for FY2015 amounted to €34.9 million, an increase of €11.9 million when compared to FY2014. The major part of this increase (€9.4 million) related to the inclusion of revenue of the San Antonio Hotel following the acquisition by the Guarantor of the remaining 50% shareholding in December 2013 (thereby becoming a wholly owned subsidiary of the Group). The remaining y-o-y increase in revenue of €2.5 million was generated primarily from the Seabank Hotel as to €1.6 million, whilst the balance of €0.9 million was generated from the operations of Hard Rock Café Malta and Tunny Net Complex.
SD Holdings Limited Consolidated Cash Flow Statementfor the year ended 31 March 2014 2015 2016 2017 2018
Actual Actual Actual Forecast Projection€’000 €’000 €’000 €’000 €’000
Net cash from operating activities 7,268 10,119 15,989 18,404 19,370 Net cash from investing activities (9,432) (21,371) (10,272) (14,449) (4,512) Net cash from financing activities 1,829 9,765 (6,082) (787) (3,096) Net movement in cash and cash equivalents (335) (1,487) (365) 3,168 11,762 Cash and cash equivalents at beginning of year 643 308 (1,179) (1,544) 1,624 Cash and cash equivalents at end of year 308 (1,179) (1,544) 1,624 13,386
Key Accounting Ratios FY2014 FY2015 FY2016 FY2017 FY2018
Gross profit margin 38% 39% 47% 47% 47%(Gross profit/revenue)
Operating profit margin 33% 34% 41% 42% 43%(EBITDA/revenue)
Interest cover (times) 3.72 2.95 4.82 7.08 6.53(EBITDA/net finance cost)
Net profit margin 14% 19% 13% 16% 16%(Profit after tax/revenue)
Earnings per share (€)1 6.15 12.80 10.74 1.77 1.92(Profit after tax/number of shares)
Return on equity 15% 24% 10% 11% 12%(Profit after tax/shareholders’ equity)
Return on capital employed 9% 12% 15% 15% 14%(EBITDA/total assets less current liabilities)
Return on assets 3% 5% 4% 4% 5%(Profit after tax/total assets)
Source: Charts Investment Management Service Limited
1 In FY2014 to FY2016, the Guarantor had in issue 520,000 shares. As of FY2017, the issued share capital increased to 4,000,000 shares.
FAS 25
In FY2015, the Group registered an EBITDA of €11.9 million, a y-o-y increase of €4.3 million (FY2014: €7.6 million). Of this increase, an amount of €3.0 million represented the first-year EBITDA generated by the San Antonio Hotel as a subsidiary of the Group. The other principal contributor to the increase in EBITDA was the Seabank Hotel, where the hotel’s EBITDA increased by €1.0 million from €7.4 million in FY2014 to €8.4 million in FY2015.
Net finance costs increased from €2.0 million in FY2014 to €4.0 in FY2015, as a result of inclusion of interest payable relating to the San Antonio Hotel. With respect to ‘share of results of associates’, in FY2014, an amount of €0.4 million of the aggregate balance of €0.7 million represented the 50% share of profits of the San Antonio Hotel. In FY2015, the removal of the San Antonio Hotel as an associate was compensated for by an increase in share of profits from Malta Healthcare Caterers Limited, which increased from €52,000 in FY2014 to €0.4 million in FY2015.
Overall, the Group registered a profit for FY2015 of €6.7 million (FY2014: €3.2 million) after accounting for a tax credit balance of €3.7 million (FY2014: tax charge of €0.6 million). Total comprehensive income for FY2015, net of tax, amounted to €6.7 million as compared to €3.2 million a year earlier.
In FY2016, revenue of the db Group increased by €8.0 million (+23%) from €34.9 million in FY0215 to €42.9 million. Revenue generated by the Seabank Hotel increased by €1.9 million (+11%) to €20.0 million, whilst the San Antonio Hotel recorded a y-o-y increase of €5.3 million (+57%) from €9.4 million in FY2015 to €14.7 million. The growth registered at the San Antonio Hotel was due to an increase in occupancy levels and a significant increase in revenue per occupied room (RevPOR), and is reflective of a full-year’s impact of the renovated property, the expansion to 513 rooms and the shift to an all-inclusive business model. Revenue generated by Hard Rock Café Malta and the Tunny Net Complex increased in aggregate by €0.7 million (+9%) from €7.5 million in FY2015 to €8.2 million.
EBITDA for the financial year under review increased by €5.9 million from €11.9 million in FY2015 to €17.8 million, substantially generated from the Seabank Hotel and the San Antonio Hotel which registered y-o-y increases of €1.9 million and €3.7 million respectively. As for Hard Rock Café Malta and the Tunny Net Complex, the respective EBITDA for FY2016 broadly matched the EBITDA registered in FY2015.
After accounting for depreciation of €6.1 million (FY2015: €5.5 million), net finance costs of €3.7 million (FY2015: €4.0 million) and share of results of associates of €0.4 million (FY2015: 0.6 million), the Group registered a profit before tax of €8.4 million, a y-o-y increase of €5.4 million when compared to FY2015 (profit before tax: €3.0 million). In FY2016, the property valuations (net of deferred tax) of the Seabank Hotel and the San Antonio Hotel were revised upwards by an aggregate amount of €22.6 million, and as a consequence, the comprehensive income for FY2016 amounted to €28.3 million (FY2015: €6.7 million).
Revenue for FY2017 is projected to increase by €2.7 million (+6%) as compared to the prior year from €43.0 million to €45.7 million, primarily due to a projected increase in revenue generated from the San Antonio Hotel of €1.6 million. Management has assumed that the all-inclusive offering at the aforesaid hotel is still in the early stage of operational development and therefore a relatively high growth rate has been forecasted. Revenue from the Seabank Hotel is projected at €20.9 million, an increase of €0.9 million (+5%) over FY2016. The other group operations are expected to increase y-o-y revenue by 3%.
Operating profit for FY2017 is forecasted at €13.3 million, an increase of €1.5 million (+13%) when compared to €11.7 million registered in FY2016. Net finance costs is projected to decrease from €3.7 million in FY2016 to €2.7 million as a result of further repayments of bank borrowings made during the year and a reduction in the Group’s effective interest rate. Share of results of associates has been projected to remain stable at €0.4 million. After accounting for taxation, the db Group expects to register an increase in profits of €1.5 million (+26%) in FY2017, from €5.6 million in FY2016 to €7.1 million.
As for FY2018, management has assumed an average revenue growth of 2.5% and therefore revenue is forecasted to increase from €45.7 million in FY2017 to €46.8 million. The resultant effect on operating profit is an increase of €1.3 million, from €13.3 million in FY2017 to €14.6 million, and profit for the year is projected at €7.7 million, a growth of €0.6 million (+8%) from a year earlier.
FAS 26
The estimates for the forward years as presented in this document assume that the carrying values of hotel properties will remain constant in FY2017 and FY2018, and therefore no adjustment has been made as to possible impairment or uplift of assets that may be booked and which may materially affect the consolidated income statement and balance sheet values.
Total assets of the Group as at 31 March 2016 amounted to €156.4 million (FY2015: €137.5 million), and principally comprised the Seabank Hotel (2016: €62.7 million, 2015: €54.8 million) and the San Antonio Hotel (2016: €70.0 million, 2015: €51.4 million). Other assets included investments in associates, deferred taxation and trade & other receivables. On 1 February 2017, the Group acquired a 99-year temporary emphyteutical grant from the Government of Malta on a site in St George’s Bay, St Julians, as further described in section 12 of this report. The said acquisition is included as a non-current asset in the balance sheet under the heading ‘Prepaid operating lease’.
Other than equity, the Group was mainly financed, in FY2014 and FY2015, through bank loans and shareholder loans. In October 2016, the Guarantor issued and allotted an additional 3,480,000 ordinary shares of €1 each, fully paid up through the capitalisation of shareholder loans. It is anticipated that, in FY2018, the majority of bank loans (which were primarily used for the development and renovation of the Seabank Hotel and San Antonio Hotel) will be refinanced from proceeds of the proposed Bond Issue.
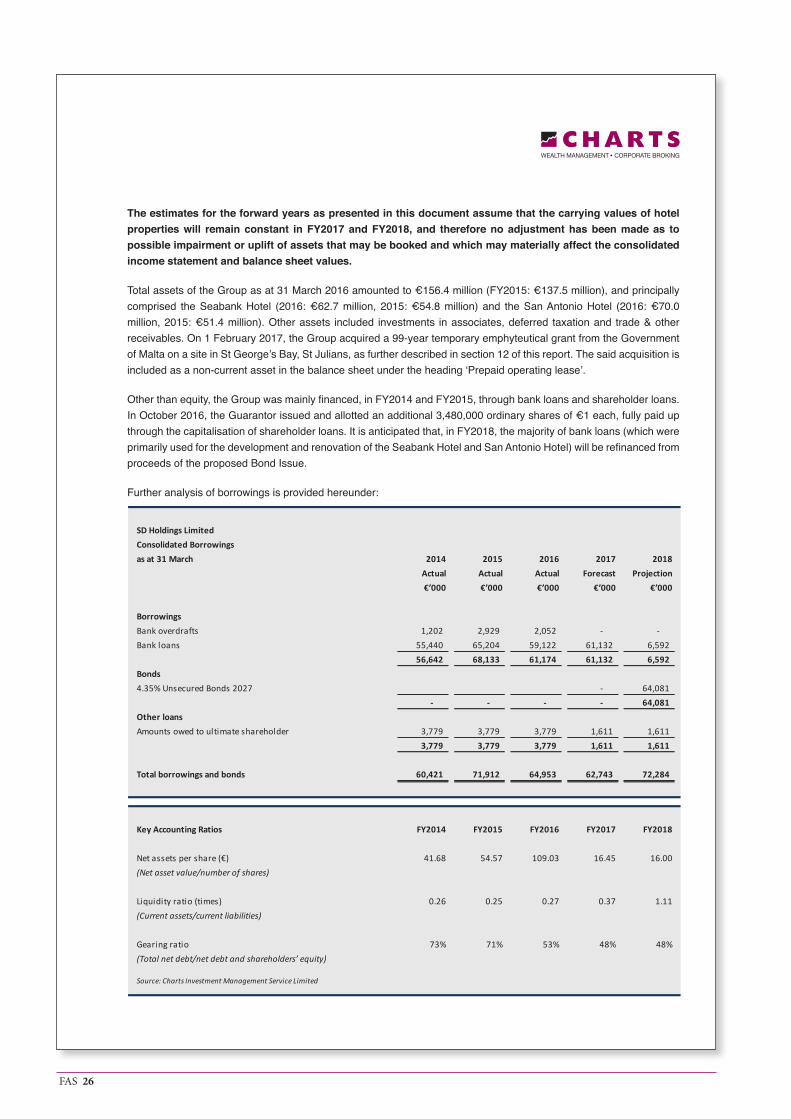
Further analysis of borrowings is provided hereunder:
SD Holdings LimitedConsolidated Borrowingsas at 31 March 2014 2015 2016 2017 2018
Actual Actual Actual Forecast Projection€’000 €’000 €’000 €’000 €’000
BorrowingsBank overdrafts 1,202 2,929 2,052 - - Bank loans 55,440 65,204 59,122 61,132 6,592
56,642 68,133 61,174 61,132 6,592 Bonds4.35% Unsecured Bonds 2027 - 64,081
- - - - 64,081 Other loansAmounts owed to ultimate shareholder 3,779 3,779 3,779 1,611 1,611
3,779 3,779 3,779 1,611 1,611
Total borrowings and bonds 60,421 71,912 64,953 62,743 72,284
Key Accounting Ratios FY2014 FY2015 FY2016 FY2017 FY2018
Net assets per share (€) 41.68 54.57 109.03 16.45 16.00(Net asset value/number of shares)
Liquidity ratio (times) 0.26 0.25 0.27 0.37 1.11(Current assets/current liabilities)
Gearing ratio 73% 71% 53% 48% 48%(Total net debt/net debt and shareholders’ equity)
Source: Charts Investment Management Service Limited
FAS 27
PART 4 – COMPARABLES
The table below compares the db Group and the proposed bond issue to other debt issuers listed on the Malta Stock Exchange and their respective debt securities. Although there are significant variances between the activities of the Group and other issuers (including different industries, principal markets, competition, capital requirements etc), and material differences between the risks associated with the Group’s business and that of other issuers, the comparative analysis provides an indication of the financial performance and strength of the Group.
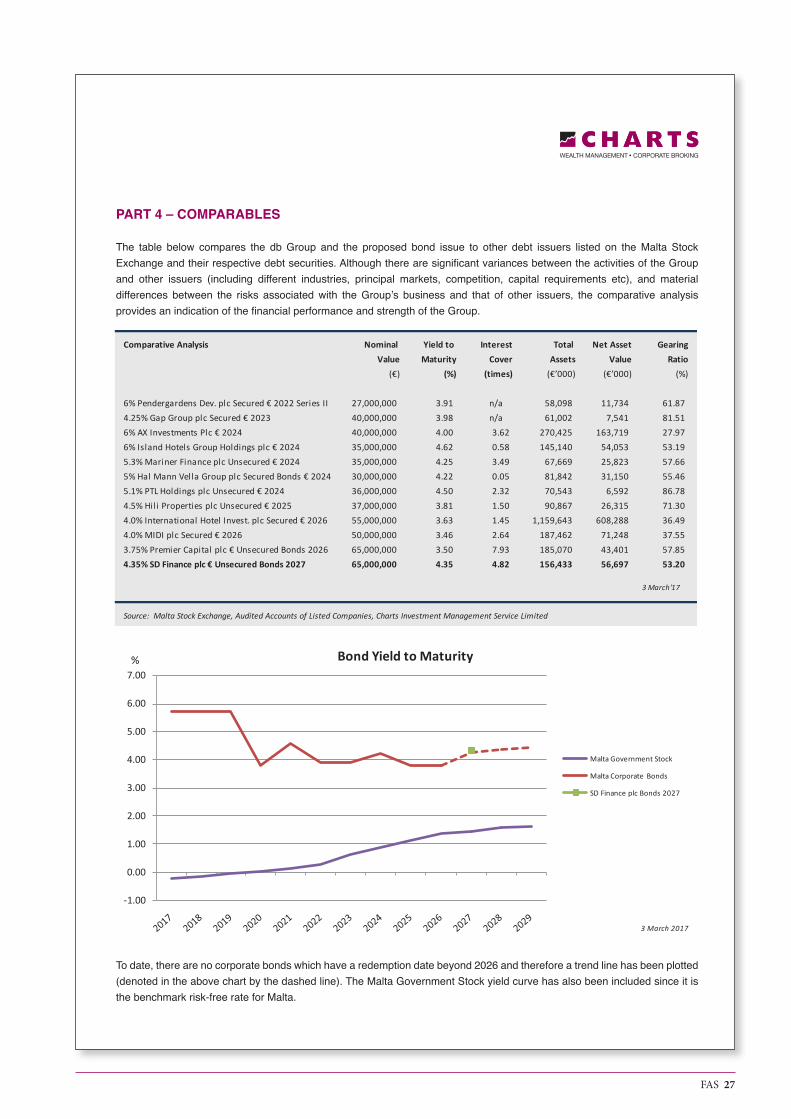
To date, there are no corporate bonds which have a redemption date beyond 2026 and therefore a trend line has been plotted (denoted in the above chart by the dashed line). The Malta Government Stock yield curve has also been included since it is the benchmark risk-free rate for Malta.
Comparative Analysis Nominal Yield to Interest Total Net Asset GearingValue Maturity Cover Assets Value Ratio
(€) (%) (times) (€’000) (€’000) (%)
6% Pendergardens Dev. plc Secured € 2022 Series II 27,000,000 3.91 n/a 58,098 11,734 61.87 4.25% Gap Group plc Secured € 2023 40,000,000 3.98 n/a 61,002 7,541 81.51 6% AX Investments Plc € 2024 40,000,000 4.00 3.62 270,425 163,719 27.97 6% Island Hotels Group Holdings plc € 2024 35,000,000 4.62 0.58 145,140 54,053 53.19 5.3% Mariner Finance plc Unsecured € 2024 35,000,000 4.25 3.49 67,669 25,823 57.66 5% Hal Mann Vella Group plc Secured Bonds € 2024 30,000,000 4.22 0.05 81,842 31,150 55.46 5.1% PTL Holdings plc Unsecured € 2024 36,000,000 4.50 2.32 70,543 6,592 86.78 4.5% Hili Properties plc Unsecured € 2025 37,000,000 3.81 1.50 90,867 26,315 71.30 4.0% International Hotel Invest. plc Secured € 2026 55,000,000 3.63 1.45 1,159,643 608,288 36.49 4.0% MIDI plc Secured € 2026 50,000,000 3.46 2.64 187,462 71,248 37.55 3.75% Premier Capital plc € Unsecured Bonds 2026 65,000,000 3.50 7.93 185,070 43,401 57.85 4.35% SD Finance plc € Unsecured Bonds 2027 65,000,000 4.35 4.82 156,433 56,697 53.20
Source: Malta Stock Exchange, Audited Accounts of Listed Companies, Charts Investment Management Service Limited
3 March'17
-1.00
0.00
1.00
2.00
3.00
4.00
5.00
6.00
7.00
Bond Yield to Maturity
Malta Government Stock
Malta Corporate Bonds
SD Finance plc Bonds 2027
%
3 March 2017
FAS 28
PART 5 - EXPLANATORY DEFINITIONS AND REFERENCES
Income Statement
Revenue Total revenue generated by the Group from its business activities during the financial year, including room reservations, food & beverage and other revenue streams.
Cost of sales Direct costs include cost of food, beverages, consumables, labour expenses and all other direct expenses.
Gross profit Gross profit is the difference between revenue and direct costs. It refers to the profit made by the Group before deducting operating costs, depreciation & amortisation, finance costs, impairment provisions, share of results from associate and affiliate companies and other operating costs.
Operating costs Operating costs include all operating expenses other than direct costs and include general & administration expenses.
EBITDA EBITDA is an abbreviation for earnings before interest, tax, depreciation and amortisation. EBITDA can be used to analyse and compare profitability between companies and industries because it eliminates the effects of financing and accounting decisions.
Share of results of associates The Guarantor owns minority stakes in a number of companies (less than 50% plus one share of a company’s share capital). The results of such companies are not consolidated with the subsidiaries of the db Group, but the Guarantor’s share of profit is shown in the profit and loss account under the heading ‘share of results of associates’.
Profit after tax Profit after tax is the profit made by the Group during the financial year both from its operating as well as non-operating activities.
Key Performance IndicatorsOccupancy level Occupancy level is the percentage of available rooms that were sold during a given
period of time. It is calculated by dividing the number of rooms sold by total number of rooms available.
Revenue per occupied room (RevPOR) RevPOR is calculated by adding all income generated (room accommodation, food & beverage and other income) and dividing it by the number of occupied rooms. A hotel uses this indicator as a performance measure with other hotels in the same category or market to determine how well the hotel property is yielding.
Gross operating profit per available GOPAR is the total revenue of the hotel less expenses incurred earning that revenue,room (GOPAR) divided by the available rooms. This indicator is another performance measure used
in the hotel industry.Revenue generating index (RGI) A revenue generating index measures a hotel’s fair market share of its segment’s
(competitive set, market, etc) revenue per occupied room. If a hotel is capturing its fair market share, the index will be 1; if capturing less than its fair market share, a hotel’s index will be less than 1; and if capturing more than its fair market share, a hotel’s index will be greater than 1.
Gross operating profit generating A gross operating profit generating index measures a hotel’s fair market share of its index (GOPGI) segment’s (competitive set, market, etc) gross operating profit per available room. If
a hotel is capturing its fair market share, the index will be 1; if capturing less than its fair market share, a hotel’s index will be less than 1; and if capturing more than its fair market share, a hotel’s index will be greater than 1.
Profitability RatiosGross profit margin Gross profit margin is the difference between revenue and direct costs expressed as
a percentage of total revenue.Operating profit margin Operating profit margin is operating income or EBITDA as a percentage of total
revenue.Net profit margin Net profit margin is profit after tax achieved during the financial year expressed as a
percentage of total revenue.
FAS 29
Efficiency RatiosReturn on equity Return on equity (ROE) measures the rate of return on the shareholders’ equity of the
owners of issued share capital, computed by dividing profit after tax by shareholders’ equity. Return on capital employed Return on capital employed (ROCE) indicates the efficiency and profitability of a
company’s capital investments, estimated by dividing operating profit by capital employed.
Return on Assets Return on assets (ROA) is computed by dividing profit after tax by total assets.
Equity RatiosEarnings per share Earnings per share (EPS) is the amount of earnings per outstanding share of a
company’s share capital. It is computed by dividing net income available to equity shareholders by total shares outstanding as at balance sheet date.
Cash Flow StatementCash flow from operating activities Cash generated from the principal revenue-producing activities (room revenue, food
& beverage, hotel services, etc) of the Group.Cash flow from investing activities Cash generated from activities dealing with the acquisition and disposal of long-term
assets and other investments of the Group.Cash flow from financing activities Cash generated from the activities that result in change in share capital and
borrowings of the Group.
Balance SheetNon-current assets Non-current asset are the Group’s long-term investments, which full value will not be
realised within the accounting year. Non-current assets are capitalised rather than expensed, meaning that the Group amortises the cost of the asset over the number of years for which the asset will be in use, instead of allocating the entire cost to the accounting year in which the asset was acquired. Such assets include intangible assets (including goodwill on acquisition), investments in associates (Malta Healthcare Caterers Ltd, Porto Azzurro Ltd, Sky Gourmet Ltd and Sky Gourmet Malta Inflight Services Ltd), property, plant & equipment (hotel properties), and deferred tax assets.
Current assets Current assets are all assets of the Group, which are realisable within one year from the balance sheet date. Such amounts include accounts receivable, inventory (food, beverages, consumables, etc), cash and bank balances.
Current liabilities All liabilities payable by the Group within a period of one year from the balance sheet date, and include accounts payable and short-term debt, including current portion of bank loans.
Non-current liabilities The Group’s long-term financial obligations that are not due within the present accounting year. The Group’s non-current liabilities include long-term borrowings and bonds.
Total equity Total equity includes share capital, reserves & other equity components, retained earnings and minority interest.
Financial Strength RatiosLiquidity ratio The liquidity ratio (also known as current ratio) is a financial ratio that measures
whether or not a company has enough resources to pay its debts over the next 12 months. It compares a company’s current assets to its current liabilities.
Interest cover The interest coverage ratio is calculated by dividing a company’s operating profit of one period by the company’s interest expense of the same period.
Gearing ratio The gearing ratio indicates the relative proportion of shareholders’ equity and debt used to finance a company’s assets, and is calculated by dividing a company’s net debt by net debt plus shareholders’ equity.
ReferencesCentral Bank of Malta – Outlook for the Maltese economy (Economic projections 2016 - 2019), December 2016National Statistics Office - Malta (www.nso.gov.mt)Malta Hotels and Restaurants Association (MHRA) Survey (2013, 2014 and 2015)


![SUMMARY OF FINANCIAL STATEMENTS [IFRS ...SUMMARY OF FINANCIAL STATEMENTS [IFRS] (CONSOLIDATED) Financial Results for the Fiscal Year Ended March 31, 2014 May 8, 2014 Takeda Pharmaceutical](https://img.pdfslide.net/doc/110x75/5ece4cbfb1af104f892b6602/summary-of-financial-statements-ifrs-summary-of-financial-statements-ifrs.jpg)


![SUMMARY OF FINANCIAL STATEMENTS [IFRS] (CONSOLIDATED) Financial Results … · SUMMARY OF FINANCIAL STATEMENTS [IFRS] (CONSOLIDATED) Financial Results for the Fiscal Year Ended March](https://img.pdfslide.net/doc/110x75/5e92676282566416065a9900/summary-of-financial-statements-ifrs-consolidated-financial-results-summary.jpg)


![MARCH 2016 [FY2015] Q3 FINANCIAL RESULT SUMMARY · MARCH 2016 [FY2015] Q3 FINANCIAL RESULT SUMMARY February 2016 1) Summary of Result and Forecast (Unit: Billion Yen) Q1 Q2 Q3 Total](https://img.pdfslide.net/doc/110x75/5fcc43cdfc3b99546a3a9ae2/march-2016-fy2015-q3-financial-result-summary-march-2016-fy2015-q3-financial.jpg)


![May 25, 2020 Summary of Consolidated Financial Results for ......May 25, 2020 Summary of Consolidated Financial Results for the Fiscal Year Ended March 31, 2020 [Japanese GAAP] Company](https://img.pdfslide.net/doc/110x75/5f4b70b28b458a767d1aad1d/may-25-2020-summary-of-consolidated-financial-results-for-may-25-2020.jpg)
