Embed Size (px)
Citation preview
FINANCIAL ANALYSIS SUMMARY
Mediterranean Maritime Hub p.l.c. 25th June 2019
FINANCIAL ANALYSIS SUMMARY Mediterranean Maritime Hub Finance p.l.c
1
The Directors
Mediterranean Maritime Hub Finance plc,
Head Office Building
Xatt il-Mollijiet, Mdina Road,
Marsa MRS 1152, Malta
25th June 2019
Dear Sir/Madam,
In accordance with your instructions, and in line with the requirements of the Listing Authority
Policies, we have compiled the Financial Analysis Summary (the “Analysis”) set out on the following
pages and which is being forwarded to you together with this letter.
The purpose of the financial analysis is that of summarising key financial data appertaining to Mediterranean Maritime Hub Finance p.l.c. (the “Issuer”) and MMH Holdings Limited (the “Guarantor”), where the latter is the parent company of the “Group”. The data is derived from various sources or is based on our own computations as follows: a) Historical financial data for the three years ended 2016, 2017 and 2018 have been extracted from
the Issuer’s audited statutory financial statements for the three years in question.
b) The forecast data for the financial year ending 31st December 2019 has been provided by management.
c) Our commentary on the Issuer and Guarantor’s results and financial position is based on the explanations set out by the Issuer in the Prospectus and Listing Authority Policies.
d) The ratios quoted in the Analysis have been computed by us applying the definitions set out in Part 4 of the Analysis.
e) The principal relevant market players listed in Part 3 of the document have been identified by management. Relevant financial data in respect of competitors has been extracted from public sources such as the web sites of the companies concerned or financial statements filed with the Registrar of Companies.
The Analysis is meant to assist investors in the Issuer’s securities and potential investors by summarising the more important financial data of the Group. The Analysis does not contain all data that is relevant to investors or potential investors. The Analysis does not constitute an endorsement by our firm of any securities of the Issuer and should not be interpreted as a recommendation to invest in any of the Issuer’s securities. We shall not accept any liability for any loss or damage arising out of the use of the Analysis. As with all investments, potential investors are encouraged to seek professional advice before investing in the Issuer’s securities. Yours sincerely,
______________ Nick Calamatta Director
FINANCIAL ANALYSIS SUMMARY Mediterranean Maritime Hub Finance p.l.c
2
Table of Contents
Part 1 - Information about the Issuer .................................................................................................. 3
1.1 Group’s key activities and Group Structure ............................................................................ 3
1.2 Directors and key employees .................................................................................................. 6
1.3 Major assets owned by the Group .......................................................................................... 7
1.4 Operational Developments ..................................................................................................... 8
Part 2 - Historical Performance and Forecasts .................................................................................... 9
2.1 Issuer’s Income Statement ..................................................................................................... 9
2.2 Issuer’s Financial Position ..................................................................................................... 10
2.3 Issuer’s Cash Flow Statement ............................................................................................... 11
2.4 Guarantor’s Income Statement ............................................................................................ 12
2.4.1 Guarantor’s Variance Analysis ...................................................................................... 15
2.5 Guarantor’s Balance Sheet ................................................................................................... 16
2.6 Guarantor’s Cash Flow Statement ........................................................................................ 18
Part 3 - Key market and competitor data .......................................................................................... 19
3.1 The Group’s Competitive Environment ................................................................................ 21
3.2 Comparative Analysis ............................................................................................................ 23
Part 4 - Glossary and Definitions ....................................................................................................... 25
FINANCIAL ANALYSIS SUMMARY Mediterranean Maritime Hub Finance p.l.c
3
Part 1 - Information about the Issuer
1.1 Group’s key activities and Group Structure
Mediterranean Maritime Hub Finance Plc (“the Issuer”) was incorporated on 26th July 2016 and is a
fully owned subsidiary company of MMH Holdings Limited (“the Guarantor”). MMH Holdings Limited
(formerly Ablecare Oilfield Services Holdings Limited) was incorporated in Malta in 2008 and as the
holding company, holds shares in a number of subsidiary companies primarily operating in the marine
and oil and gas services sector (“the Group”).
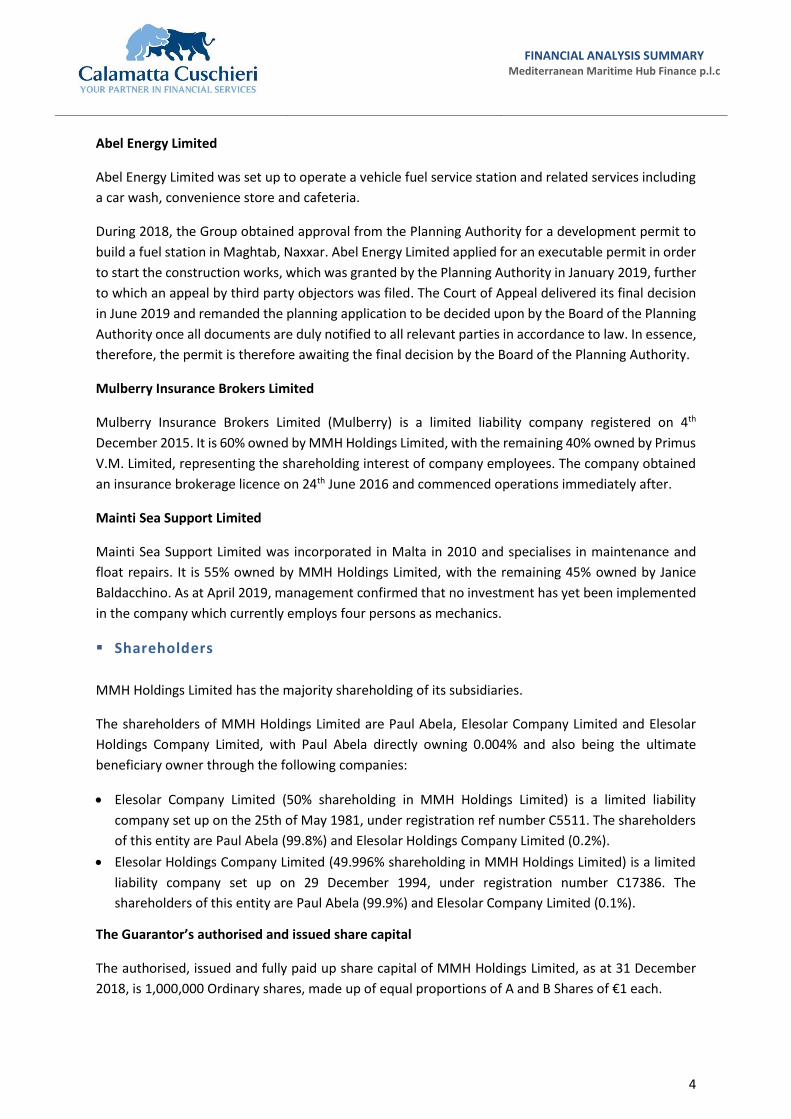
The Group’s complete organisation chart is set out below:
MMH Malta Limited
MMH Malta Limited focuses on the supply of tailor-made services supporting the oil and gas industry,
as well as marine services through its operation of the Mediterranean Maritime Hub. Its services are
mainly of an operational, logistical and maintenance nature, as may be required by oil drilling
companies and their support service providers referred to as the International Oil Companies or ‘IOCs’.
From January 2017 MMH Malta Limited took over the services previously offered by MMH People
Limited, which is now non-trading. Accordingly, MMH Malta Limited now also provides services of
recruitment, contracting and secondment of specialised maintenance personnel and related manning
logistical services for the oil and gas industry, together with the career planning and follow-up of the
same personnel.
MMH People Limited
MMH People Limited transferred its business to MMH Malta Limited in the beginning of 2017 and is
currently non-trading.
MMH Academy Limited
MMH Academy Limited’s objective is to provide education, training, conferences and related services
in the field of oil exploration and engineering.
FINANCIAL ANALYSIS SUMMARY Mediterranean Maritime Hub Finance p.l.c
4
Abel Energy Limited
Abel Energy Limited was set up to operate a vehicle fuel service station and related services including
a car wash, convenience store and cafeteria.
During 2018, the Group obtained approval from the Planning Authority for a development permit to
build a fuel station in Maghtab, Naxxar. Abel Energy Limited applied for an executable permit in order
to start the construction works, which was granted by the Planning Authority in January 2019, further
to which an appeal by third party objectors was filed. The Court of Appeal delivered its final decision
in June 2019 and remanded the planning application to be decided upon by the Board of the Planning
Authority once all documents are duly notified to all relevant parties in accordance to law. In essence,
therefore, the permit is therefore awaiting the final decision by the Board of the Planning Authority.
Mulberry Insurance Brokers Limited
Mulberry Insurance Brokers Limited (Mulberry) is a limited liability company registered on 4th
December 2015. It is 60% owned by MMH Holdings Limited, with the remaining 40% owned by Primus
V.M. Limited, representing the shareholding interest of company employees. The company obtained
an insurance brokerage licence on 24th June 2016 and commenced operations immediately after.
Mainti Sea Support Limited
Mainti Sea Support Limited was incorporated in Malta in 2010 and specialises in maintenance and
float repairs. It is 55% owned by MMH Holdings Limited, with the remaining 45% owned by Janice
Baldacchino. As at April 2019, management confirmed that no investment has yet been implemented
in the company which currently employs four persons as mechanics.
Shareholders
MMH Holdings Limited has the majority shareholding of its subsidiaries.
The shareholders of MMH Holdings Limited are Paul Abela, Elesolar Company Limited and Elesolar
Holdings Company Limited, with Paul Abela directly owning 0.004% and also being the ultimate
beneficiary owner through the following companies:
Elesolar Company Limited (50% shareholding in MMH Holdings Limited) is a limited liability
company set up on the 25th of May 1981, under registration ref number C5511. The shareholders
of this entity are Paul Abela (99.8%) and Elesolar Holdings Company Limited (0.2%).
Elesolar Holdings Company Limited (49.996% shareholding in MMH Holdings Limited) is a limited
liability company set up on 29 December 1994, under registration number C17386. The
shareholders of this entity are Paul Abela (99.9%) and Elesolar Company Limited (0.1%).
The Guarantor’s authorised and issued share capital
The authorised, issued and fully paid up share capital of MMH Holdings Limited, as at 31 December
2018, is 1,000,000 Ordinary shares, made up of equal proportions of A and B Shares of €1 each.
FINANCIAL ANALYSIS SUMMARY Mediterranean Maritime Hub Finance p.l.c
5
Review of the Business
The main business focus of the Group is that of providing a range of services to the marine and oil and
gas service sector through both the provision of manpower and technical personnel to offshore and
onshore oil well operators, as well as logistical support, yard operations, procurement and engineering
services to oil rigs service companies. As a key element of its services portfolio, the Group operates
the Mediterranean Maritime Hub in the innermost part of Valletta’s Grand Harbour, the inauguration
of which has allowed the Group to widen its range of marine-based services and products. The Group’s
portfolio of services is targeted at oil rigs and related operators in the Mediterranean region and West
Africa, as well as the supply of personnel to operators in the North Sea. The principal business
operations of the Group are provided by MMH Malta Limited.
MMH Malta Limited specialises in the specific requirements of the oil and gas and marine sectors,
providing a wide range of services including rig agency and rig stop services, planning, project
recruitment, the contracting of pre-screened and pre-qualified personnel, training, logistics, facilities
provision, supply chain services and project management.
MMH Malta Limited’s key focus is on servicing the needs of oil drilling companies in the EMEA region
(Europe, Middle East and Africa region), and service providers thereto. The strength of MMH Malta
Limited’s provision of services is primarily owed to ongoing relationships, backed by vendor
agreements and Master Service Agreements (MSAs) with some of the world’s largest drilling
companies.
The Group’s track record is marked by the management team’s ability to forge ongoing business
relationships with key players in the oil and gas sector. Over time the Group has grown by increasingly
catering for a wider range of services to its clients. The management team has embarked on the next
phase of the business’s development and has previously demonstrated the intention of expanding the
physical facilities within the Hub, enabling the Group to provide a wider range of services and reduce
dependence on bought-out subcontracted services.
Following the acquisition of the property title in August 2016, the Group was requested by Transport
Malta to allow a temporary relief road to pass through this property in view of major road works in
Marsa. The Group and Transport Malta reached an agreement to compensate the Group for disruption
of the original business plan which is linked to the full utilisation of this property. The amount
negotiated totalled €1.9 million for the period from August 2016 to December 2018 and €800,000 per
annum for the upcoming two years, ending December 2020.
During the first quarter of 2018 the Group set up a business development team to explore
diversification opportunities that would complement existing services being provided by the Hub. The
yachting industry has been identified in such respect whereby through MMH Malta Limited, the Group
is currently also offering maintenance and upkeep services to yachts within the Hub. In this regard,
management confirmed that in 2018 the Group invested in two travel lifts with a capacity of 300 tons
and 700 tons respectively, which both commenced operations in 2019.
This investment required upgrading works on quayside infrastructure and purchase of specialised
lifting equipment. Indeed, two 45m long piers were specifically constructed to cater for two basins of
FINANCIAL ANALYSIS SUMMARY Mediterranean Maritime Hub Finance p.l.c
6
9m and 14m width, capable of accommodating wider commercial vessels such as tugs, supply vessels
and super yachts.
The facilities and support functions typically required to service rig stops comprise:
Quay - This is to facilitate berthing and mooring;
Yard area - This is to load, unload and store equipment and acts as an extension of the rig deck;
Engineering workshop - To facilitate on-shore maintenance of equipment, prior to placing this
back onto the rig;
Procurement services/ ship chandler services - This comprises the procurement of all the goods
that may be required by the rig, which could range from the replacement of the items required,
such as machine parts, to motors and food supplies;
Logistical support - This includes all types of logistics required by the rig, which could range from
Freeport services, customs declarations, permits, physical logistics including the sending and
receiving of rig equipment from hubs etc.; and
Provision of additional manpower - This involves the provision of personnel, often working under
the supervision of the Original Equipment Manufacturers. This service was formerly provided by
MMH People Limited, and was transferred to MMH Malta Limited in January 2017.
It may be noted that prior to the acquisition of the Hub for the purpose of servicing Malta based rig
stops, the Group made use of sub-contracted facilities from other local operators. For the purpose of
servicing non-Malta based rig stops, the Group will continue to make use of sub-contracted foreign
facilities as the need arises.
During the year under review, the Group also completed the development of additional offices over
an area of 600 square meters, the roofing of one of the larger sheds and the setting up of four
dedicated workshops to provide the industry with inspection, maintenance and repair (IMR) services.
As at April 2019, management confirmed that the workshops were fully occupied, whereas the offices
had an 80% occupancy level. Management also confirmed that additional workshops and offices will
be constructed going forward, in line with the respective demand for such facilities.
Moreover, the Group is also currently in the process of setting up a joint venture with PB Group
International Limited. The joint venture aims at consolidating the respective areas of expertise of the
two companies in creating logistics chains and support services in oil and gas projects, all of which will
be based at the Mediterranean Maritime Hub in Marsa.
1.2 Directors and key employees
Board of Directors
During 2014, the Group employed an average number of 54 employees, increasing to 100 as at April
2019. New appointees were mainly recruited in operations and logistics, site management and site
surveillance, and engineering. As at May 2019, Engineering was the largest department carrying 24
employees, followed by Operations and Logistics (17 employees), and by Site Management and
Maintenance (13 employees) and Site Security (8 employees).
As the business continues to transform into a model where most services will increasingly be provided
in-house, the Group is streamlining its workforce in order to be better-equipped to provide one-stop-
shop services to its clients.
FINANCIAL ANALYSIS SUMMARY Mediterranean Maritime Hub Finance p.l.c
7
The Board of Directors of the Issuer is composed of the following persons:
Name Designation
Paul Abela Chairman
Mr. Raymond Ciantar Deputy Chairperson
Ms Angelique Maggi Executive Director
Dr Michael Borg Costanzi Non-Executive Director
Mr Lino Casapinta Non-Executive Director
Mr Victor Denaro Non- Executive Director
The Board of Directors of the Guarantor consists of the following persons:
Name Designation
Mr. Paul Abela Chairman
Ms. Angelique Maggi Deputy Chairperson
Mr. Joseph Maggi Director – Quality & Planning
Mr. Raymond Ciantar Director & CFO
Mr. Duncan Brincat Director – Administration
With effect from 1st May, 2018, Mr. Joseph Maggi was appointed as Group CEO
1.3 Major assets owned by the Group
In January 2015, the Group was selected as the preferred bidder for the concession, to be awarded by
the Government of Malta to rehabilitate the ex-Malta Shipbuilding site – now known as the
Mediterranean Maritime Hub (or the “Hub” or the “Site”).
The Group intends to invest a total of approximately €55 million, in several phases, to rehabilitate the
Site and fully exploit it to its maximum potential as a maritime hub, with all the facilities that typically
come with this, including a dedicated rig servicing centre, facilities for support engineering services
and also a training centre.
The concession is for a period of 65 years under a title of temporary emphyteusis and consists of
approximately 169,000 square metres of land, mainly comprising:
Quays 2 and 3, including lay down area, storage yards, main entrance to Site and a warehouse
Quay 4 and 5, including yard space
Dock
Stand-alone external yards for open storage
Four hangars / shed space for engineering works and internal storage
Three main buildings which comprise warehouse space and space that could be converted into
office space, engineering workshops and additional storage space
Connecting road infrastructure
In line with the Issuer’s prospectus and as further described below in section 1.4 of this Analysis, the
Group is currently in the process of rehabilitating the Hub.
FINANCIAL ANALYSIS SUMMARY Mediterranean Maritime Hub Finance p.l.c
8
1.4 Operational Developments
The Hub update
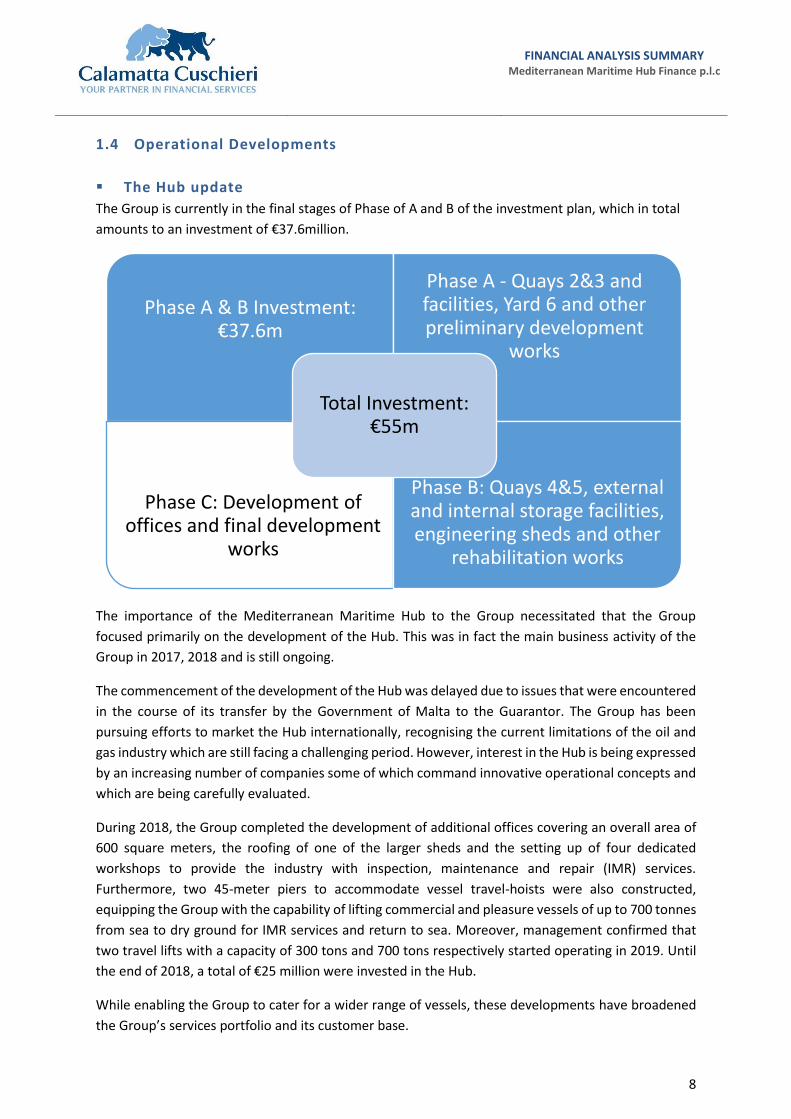
The Group is currently in the final stages of Phase of A and B of the investment plan, which in total
amounts to an investment of €37.6million.
The importance of the Mediterranean Maritime Hub to the Group necessitated that the Group
focused primarily on the development of the Hub. This was in fact the main business activity of the
Group in 2017, 2018 and is still ongoing.
The commencement of the development of the Hub was delayed due to issues that were encountered
in the course of its transfer by the Government of Malta to the Guarantor. The Group has been
pursuing efforts to market the Hub internationally, recognising the current limitations of the oil and
gas industry which are still facing a challenging period. However, interest in the Hub is being expressed
by an increasing number of companies some of which command innovative operational concepts and
which are being carefully evaluated.
During 2018, the Group completed the development of additional offices covering an overall area of
600 square meters, the roofing of one of the larger sheds and the setting up of four dedicated
workshops to provide the industry with inspection, maintenance and repair (IMR) services.
Furthermore, two 45-meter piers to accommodate vessel travel-hoists were also constructed,
equipping the Group with the capability of lifting commercial and pleasure vessels of up to 700 tonnes
from sea to dry ground for IMR services and return to sea. Moreover, management confirmed that
two travel lifts with a capacity of 300 tons and 700 tons respectively started operating in 2019. Until
the end of 2018, a total of €25 million were invested in the Hub.
While enabling the Group to cater for a wider range of vessels, these developments have broadened
the Group’s services portfolio and its customer base.
Phase A & B Investment: €37.6m
Phase A - Quays 2&3 and facilities, Yard 6 and other preliminary development
works
Phase C: Development of offices and final development
works
Phase B: Quays 4&5, external and internal storage facilities, engineering sheds and other
rehabilitation works
Total Investment: €55m
FINANCIAL ANALYSIS SUMMARY Mediterranean Maritime Hub Finance p.l.c
9
Following the acquisition of the property title in August 2016, the Group was requested by Transport
Malta to allow a temporary relief road to pass through this property in view of the major road works
in Marsa. As per management’s assumptions, road works are to be fully completed by the end of 2020.
Fuel station update
During 2018, the Group obtained approval from the Planning Authority for a development permit to
build a fuel station in Maghtab, Naxxar. Abel Energy Limited applied for an executable permit in order
to start the construction works, which was granted by the Planning Authority in January 2019, further
to which an appeal by third party objectors was filed. The Court of Appeal delivered its final decision
in June 2019 and remanded the planning application to be decided upon by the Board of the Planning
Authority once all documents are duly notified to all relevant parties in accordance to law. In essence,
therefore, the permit is therefore awaiting the final decision by the Board of the Planning Authority.
Part 2 - Historical Performance and Forecasts
All financial information presented in this section was derived from the audited accounts of the Issuer
and the Guarantor and from data provided by the Group. Forecasts are based on Management’s
projections for the coming year.
The Issuer was registered and incorporated on 26 July 2016 to issue the Bonds and loan the proceeds
to the Group. The Issuer did not conduct any business and has no trading record prior to the financial
year 2016. The Issuer’s function is solely to act as the financing vehicle for the Group, and as such does
not reflect the performance or financial position of the Group.
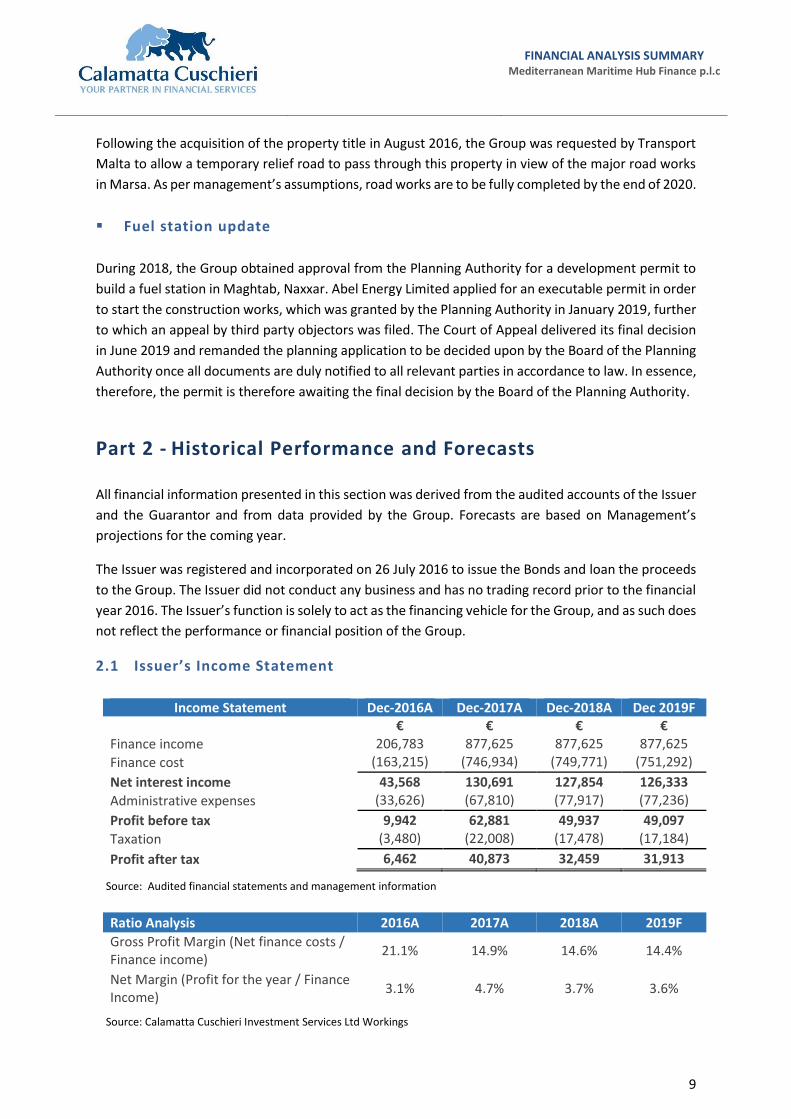
2.1 Issuer’s Income Statement
Income Statement Dec-2016A Dec-2017A Dec-2018A Dec 2019F € € € €
Finance income 206,783 877,625 877,625 877,625
Finance cost (163,215) (746,934) (749,771) (751,292)
Net interest income 43,568 130,691 127,854 126,333
Administrative expenses (33,626) (67,810) (77,917) (77,236)
Profit before tax 9,942 62,881 49,937 49,097
Taxation (3,480) (22,008) (17,478) (17,184)
Profit after tax 6,462 40,873 32,459 31,913
Ratio Analysis 2016A 2017A 2018A 2019F
Gross Profit Margin (Net finance costs / Finance income)
21.1% 14.9% 14.6% 14.4%
Net Margin (Profit for the year / Finance Income)
3.1% 4.7% 3.7% 3.6%
Source: Audited financial statements and management information
Source: Calamatta Cuschieri Investment Services Ltd Workings
FINANCIAL ANALYSIS SUMMARY Mediterranean Maritime Hub Finance p.l.c
10
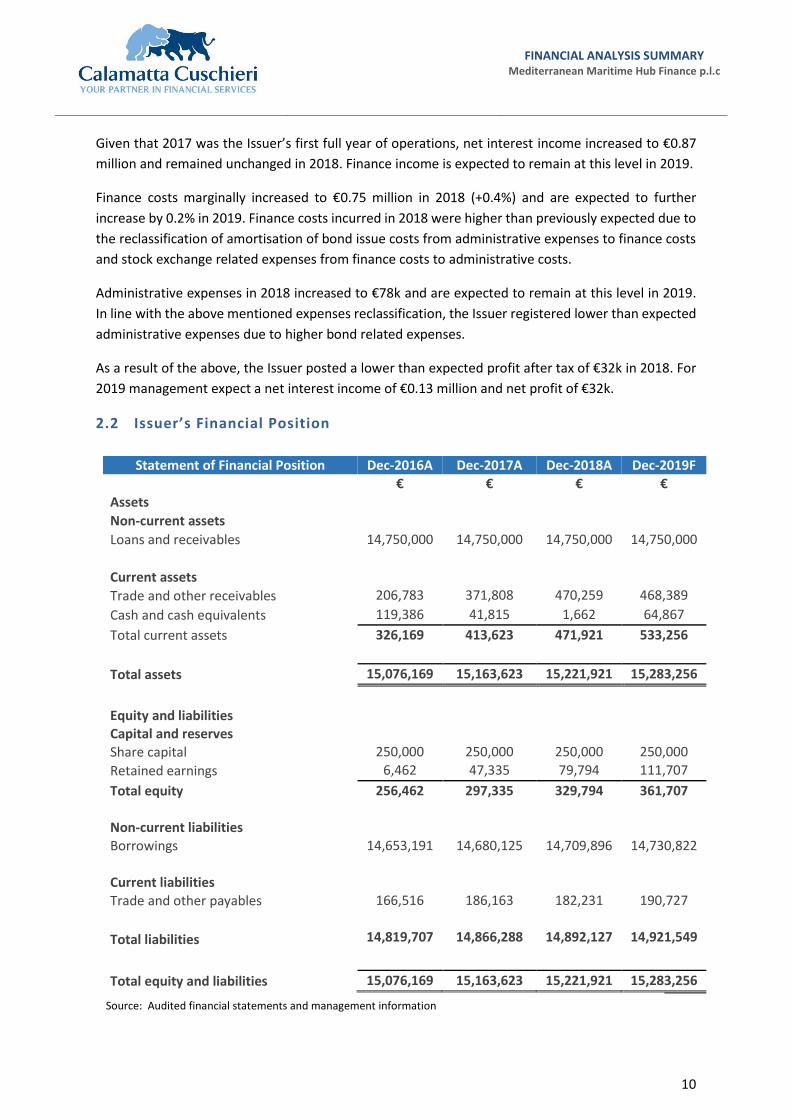
Given that 2017 was the Issuer’s first full year of operations, net interest income increased to €0.87
million and remained unchanged in 2018. Finance income is expected to remain at this level in 2019.
Finance costs marginally increased to €0.75 million in 2018 (+0.4%) and are expected to further
increase by 0.2% in 2019. Finance costs incurred in 2018 were higher than previously expected due to
the reclassification of amortisation of bond issue costs from administrative expenses to finance costs
and stock exchange related expenses from finance costs to administrative costs.
Administrative expenses in 2018 increased to €78k and are expected to remain at this level in 2019.
In line with the above mentioned expenses reclassification, the Issuer registered lower than expected
administrative expenses due to higher bond related expenses.
As a result of the above, the Issuer posted a lower than expected profit after tax of €32k in 2018. For
2019 management expect a net interest income of €0.13 million and net profit of €32k.
2.2 Issuer’s Financial Position
Statement of Financial Position Dec-2016A Dec-2017A Dec-2018A Dec-2019F € € € €
Assets
Non-current assets
Loans and receivables 14,750,000 14,750,000 14,750,000 14,750,000
Current assets
Trade and other receivables 206,783 371,808 470,259 468,389
Cash and cash equivalents 119,386 41,815 1,662 64,867
Total current assets 326,169 413,623 471,921 533,256
Total assets 15,076,169 15,163,623 15,221,921 15,283,256
Equity and liabilities
Capital and reserves
Share capital 250,000 250,000 250,000 250,000
Retained earnings 6,462 47,335 79,794 111,707
Total equity 256,462 297,335 329,794 361,707
Non-current liabilities
Borrowings 14,653,191 14,680,125 14,709,896 14,730,822
Current liabilities
Trade and other payables 166,516 186,163 182,231 190,727
Total liabilities 14,819,707 14,866,288 14,892,127 14,921,549
Total equity and liabilities 15,076,169 15,163,623 15,221,921 15,283,256
Source: Audited financial statements and management information
FINANCIAL ANALYSIS SUMMARY Mediterranean Maritime Hub Finance p.l.c
11
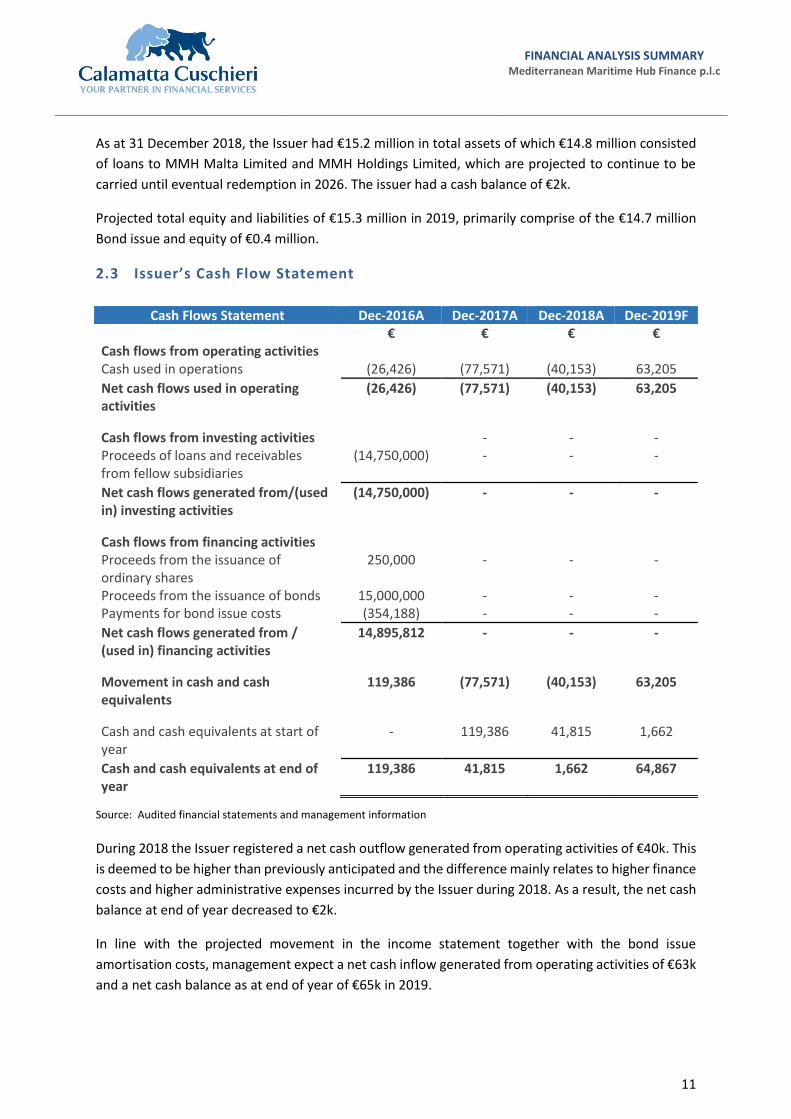
As at 31 December 2018, the Issuer had €15.2 million in total assets of which €14.8 million consisted
of loans to MMH Malta Limited and MMH Holdings Limited, which are projected to continue to be
carried until eventual redemption in 2026. The issuer had a cash balance of €2k.
Projected total equity and liabilities of €15.3 million in 2019, primarily comprise of the €14.7 million
Bond issue and equity of €0.4 million.
2.3 Issuer’s Cash Flow Statement
Cash Flows Statement Dec-2016A Dec-2017A Dec-2018A Dec-2019F € € € €
Cash flows from operating activities
Cash used in operations (26,426) (77,571) (40,153) 63,205
Net cash flows used in operating activities
(26,426) (77,571) (40,153) 63,205
Cash flows from investing activities
- - - Proceeds of loans and receivables from fellow subsidiaries
(14,750,000) - - -
Net cash flows generated from/(used in) investing activities
(14,750,000) - - -
Cash flows from financing activities
Proceeds from the issuance of ordinary shares
250,000 - - -
Proceeds from the issuance of bonds 15,000,000 - - - Payments for bond issue costs (354,188) - - -
Net cash flows generated from / (used in) financing activities
14,895,812 - - -
Movement in cash and cash equivalents
119,386 (77,571) (40,153) 63,205
Cash and cash equivalents at start of year
- 119,386 41,815 1,662
Cash and cash equivalents at end of year
119,386 41,815 1,662 64,867
During 2018 the Issuer registered a net cash outflow generated from operating activities of €40k. This
is deemed to be higher than previously anticipated and the difference mainly relates to higher finance
costs and higher administrative expenses incurred by the Issuer during 2018. As a result, the net cash
balance at end of year decreased to €2k.
In line with the projected movement in the income statement together with the bond issue
amortisation costs, management expect a net cash inflow generated from operating activities of €63k
and a net cash balance as at end of year of €65k in 2019.
Source: Audited financial statements and management information
FINANCIAL ANALYSIS SUMMARY Mediterranean Maritime Hub Finance p.l.c
12
2.4 Guarantor’s Income Statement
Income Statement Dec-2016A Dec-2017A Dec-2018A Dec-2019F € € € €
Revenue 12,624,691 15,733,451 14,469,908 18,772,434 Cost of sales (operating costs) (10,984,560) (12,544,049) (11,571,427) (13,499,734)
Gross profit 1,640,131 3,189,402 2,898,481 5,272,700 Distribution Costs (254,339) (246,281) (255,983) (343,245) Administrative expenses (excl. Depreciation)
(1,529,693) (1,457,364) (1,906,995) (2,046,757)
Other operating expenses/(income) 97,526 82,332 42,845 42,000
EBITDA (46,375) 1,568,089 778,348 2,924,698 Depreciation (327,848) (727,536) (803,682) (886,549)
EBIT (374,223) 840,553 (25,334) 2,038,149 Finance income 5,913 19,411 18,872 1,297 Finance costs (265,783) (755,373) (929,235) (1,032,519)
Profit before tax (634,093) 104,591 (935,697) 1,006,927 Income tax 97,479 230,880 (76,532) (30,658)
Profit after tax (536,614) 335,471 (1,012,229) 976,269
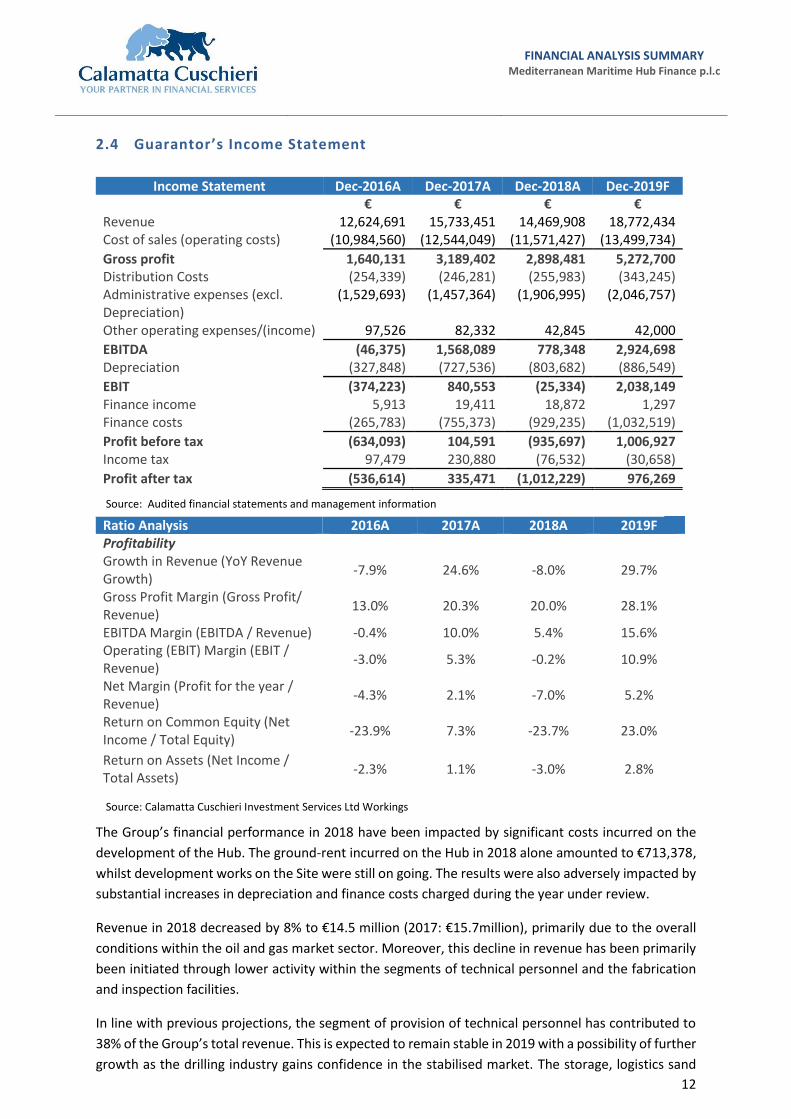
The Group’s financial performance in 2018 have been impacted by significant costs incurred on the
development of the Hub. The ground-rent incurred on the Hub in 2018 alone amounted to €713,378,
whilst development works on the Site were still on going. The results were also adversely impacted by
substantial increases in depreciation and finance costs charged during the year under review.
Revenue in 2018 decreased by 8% to €14.5 million (2017: €15.7million), primarily due to the overall
conditions within the oil and gas market sector. Moreover, this decline in revenue has been primarily
been initiated through lower activity within the segments of technical personnel and the fabrication
and inspection facilities.
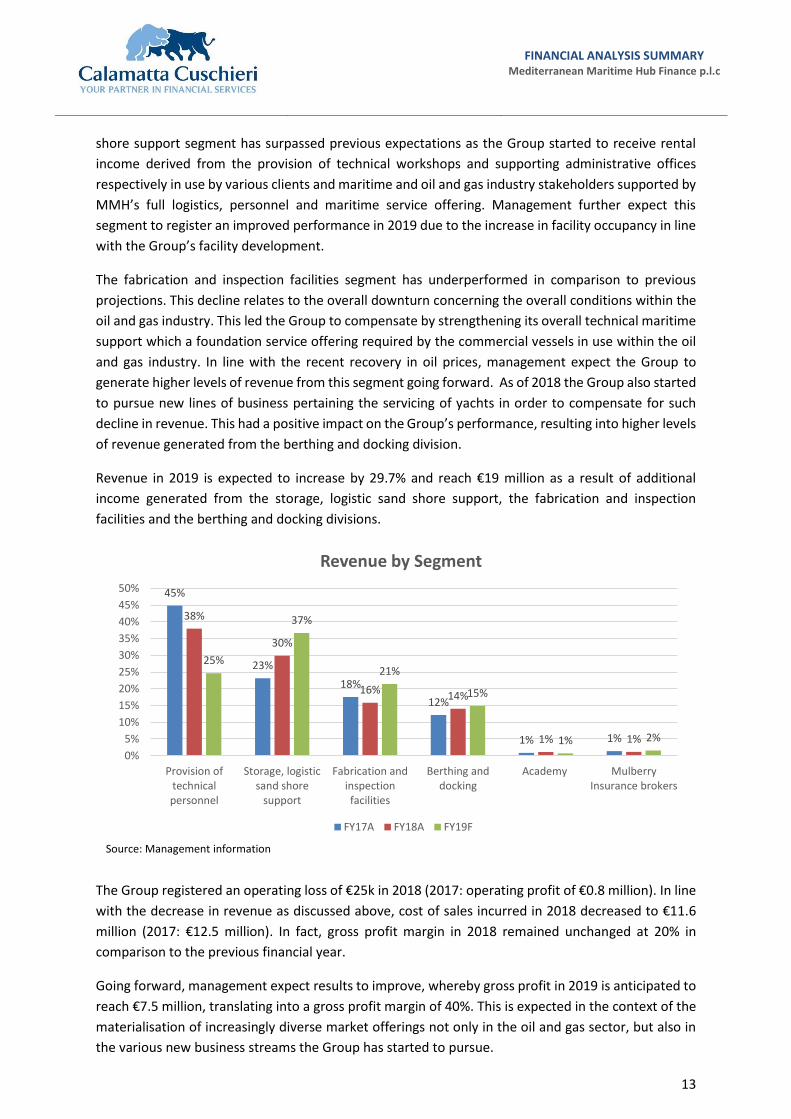
In line with previous projections, the segment of provision of technical personnel has contributed to
38% of the Group’s total revenue. This is expected to remain stable in 2019 with a possibility of further
growth as the drilling industry gains confidence in the stabilised market. The storage, logistics sand
Ratio Analysis 2016A 2017A 2018A 2019F Profitability
Growth in Revenue (YoY Revenue Growth)
-7.9% 24.6% -8.0% 29.7%
Gross Profit Margin (Gross Profit/ Revenue)
13.0% 20.3% 20.0% 28.1%
EBITDA Margin (EBITDA / Revenue) -0.4% 10.0% 5.4% 15.6% Operating (EBIT) Margin (EBIT / Revenue)
-3.0% 5.3% -0.2% 10.9%
Net Margin (Profit for the year / Revenue)
-4.3% 2.1% -7.0% 5.2%
Return on Common Equity (Net Income / Total Equity)
-23.9% 7.3% -23.7% 23.0%
Return on Assets (Net Income / Total Assets)
-2.3% 1.1% -3.0% 2.8%
Source: Audited financial statements and management information
Source: Calamatta Cuschieri Investment Services Ltd Workings
FINANCIAL ANALYSIS SUMMARY Mediterranean Maritime Hub Finance p.l.c
13
shore support segment has surpassed previous expectations as the Group started to receive rental
income derived from the provision of technical workshops and supporting administrative offices
respectively in use by various clients and maritime and oil and gas industry stakeholders supported by
MMH’s full logistics, personnel and maritime service offering. Management further expect this
segment to register an improved performance in 2019 due to the increase in facility occupancy in line
with the Group’s facility development.
The fabrication and inspection facilities segment has underperformed in comparison to previous
projections. This decline relates to the overall downturn concerning the overall conditions within the
oil and gas industry. This led the Group to compensate by strengthening its overall technical maritime
support which a foundation service offering required by the commercial vessels in use within the oil
and gas industry. In line with the recent recovery in oil prices, management expect the Group to
generate higher levels of revenue from this segment going forward. As of 2018 the Group also started
to pursue new lines of business pertaining the servicing of yachts in order to compensate for such
decline in revenue. This had a positive impact on the Group’s performance, resulting into higher levels
of revenue generated from the berthing and docking division.
Revenue in 2019 is expected to increase by 29.7% and reach €19 million as a result of additional
income generated from the storage, logistic sand shore support, the fabrication and inspection
facilities and the berthing and docking divisions.
The Group registered an operating loss of €25k in 2018 (2017: operating profit of €0.8 million). In line
with the decrease in revenue as discussed above, cost of sales incurred in 2018 decreased to €11.6
million (2017: €12.5 million). In fact, gross profit margin in 2018 remained unchanged at 20% in
comparison to the previous financial year.
Going forward, management expect results to improve, whereby gross profit in 2019 is anticipated to
reach €7.5 million, translating into a gross profit margin of 40%. This is expected in the context of the
materialisation of increasingly diverse market offerings not only in the oil and gas sector, but also in
the various new business streams the Group has started to pursue.
45%
23%
18%
12%
1% 1%
38%
30%
16%14%
1% 1%
25%
37%
21%
15%
1% 2%
0%
5%
10%
15%
20%
25%
30%
35%
40%
45%
50%
Provision oftechnicalpersonnel
Storage, logisticsand shore
support
Fabrication andinspectionfacilities
Berthing anddocking
Academy MulberryInsurance brokers
Revenue by Segment
FY17A FY18A FY19F
Source: Management information
FINANCIAL ANALYSIS SUMMARY Mediterranean Maritime Hub Finance p.l.c
14
During 2018 administrative expenses excluding depreciation increased to €1.9 million (2017: €1.5
million). This upsurge in administrative expenses has been initiated through an increase in ground rent
relating to the Hub (2018: €713,378, 2017: €672,614).
Moreover, the Group continued to incur additional expenses specifically related to the Hub, resulting
into a significant spike in wages and salaries of employees, whereby total employee benefit expense
in 2018 amounted to €3 million (2017: €2.2 million).
Administrative expenses in 2019 are projected to marginally increase to €2.0 million in 2019. This is
deemed to be in line with the expected increase in operations in which the Group is anticipated to
undertake going forward.
Depreciation in the year under review increased to €0.8 million (2017: €0.7 million) as a result of the
significant investments in property plant and equipment (“PP&E”) undertaken by the Group during
2018. This eventually led EBIT margin in 2018 to decline to -0.2% in 2018 (2017: 5.3%). Management
expect an operating profit of €2.0 million in 2019, resulting in an EBIT margin of 10.9%.
Finance costs increased to €0.9 million (2017: €0.8 million) as a result of the Bond issue and the bank
interest incurred on the Group’s existing overdraft, which continued to be withdrawn in 2018.
As a result of the above, during 2018 the Group incurred a loss of €1 million in comparison to a profit
of €0.3 million registered in 2017. Management is forecasting a profit after tax of €0.98 million for
2019.
The discrepancy between the actuals for 2018 in comparison to the forecasts for 2019 relate to the
fact that the investments carried out by the Group are expected to fully materialise in 2019 and will
increase the usage of facilities both by the Group itself, its clients and its respective industry. These
new business streams are expected to stabilise and supplement the Hub’s scope as a regional maritime
and oil and gas centre.
FINANCIAL ANALYSIS SUMMARY Mediterranean Maritime Hub Finance p.l.c
15
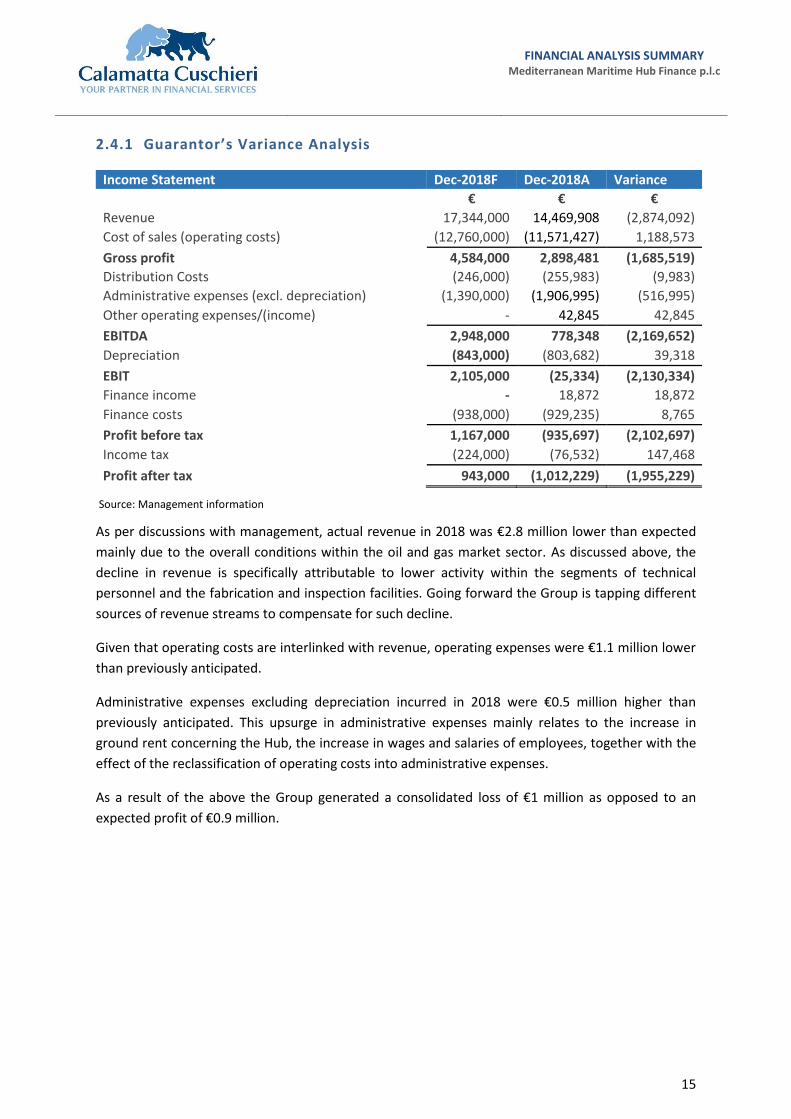
2.4.1 Guarantor’s Variance Analysis
As per discussions with management, actual revenue in 2018 was €2.8 million lower than expected
mainly due to the overall conditions within the oil and gas market sector. As discussed above, the
decline in revenue is specifically attributable to lower activity within the segments of technical
personnel and the fabrication and inspection facilities. Going forward the Group is tapping different
sources of revenue streams to compensate for such decline.
Given that operating costs are interlinked with revenue, operating expenses were €1.1 million lower
than previously anticipated.
Administrative expenses excluding depreciation incurred in 2018 were €0.5 million higher than
previously anticipated. This upsurge in administrative expenses mainly relates to the increase in
ground rent concerning the Hub, the increase in wages and salaries of employees, together with the
effect of the reclassification of operating costs into administrative expenses.
As a result of the above the Group generated a consolidated loss of €1 million as opposed to an
expected profit of €0.9 million.
Income Statement Dec-2018F Dec-2018A Variance € € €
Revenue 17,344,000 14,469,908 (2,874,092)
Cost of sales (operating costs) (12,760,000) (11,571,427) 1,188,573
Gross profit 4,584,000 2,898,481 (1,685,519)
Distribution Costs (246,000) (255,983) (9,983)
Administrative expenses (excl. depreciation) (1,390,000) (1,906,995) (516,995)
Other operating expenses/(income) - 42,845 42,845
EBITDA 2,948,000 778,348 (2,169,652)
Depreciation (843,000) (803,682) 39,318
EBIT 2,105,000 (25,334) (2,130,334)
Finance income - 18,872 18,872
Finance costs (938,000) (929,235) 8,765
Profit before tax 1,167,000 (935,697) (2,102,697)
Income tax (224,000) (76,532) 147,468
Profit after tax 943,000 (1,012,229) (1,955,229)
Source: Management information
FINANCIAL ANALYSIS SUMMARY Mediterranean Maritime Hub Finance p.l.c
16
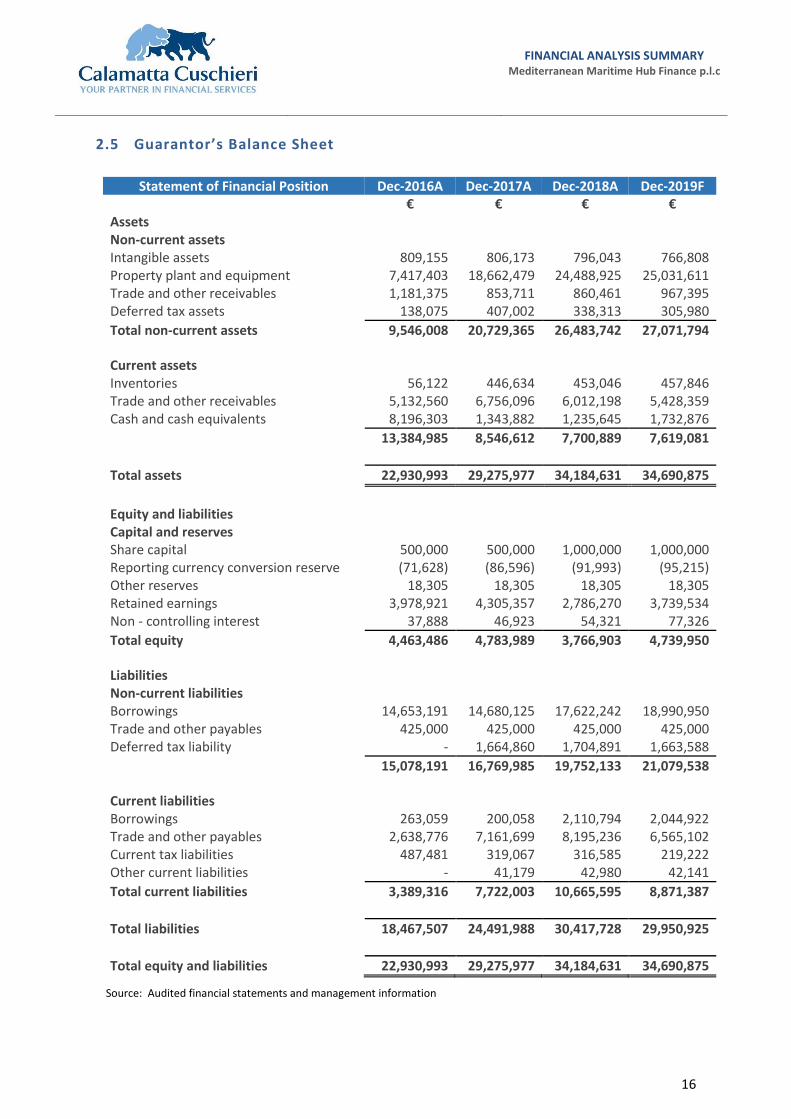
2.5 Guarantor’s Balance Sheet
Statement of Financial Position Dec-2016A Dec-2017A Dec-2018A Dec-2019F € € € €
Assets
Non-current assets
Intangible assets 809,155 806,173 796,043 766,808 Property plant and equipment 7,417,403 18,662,479 24,488,925 25,031,611 Trade and other receivables 1,181,375 853,711 860,461 967,395 Deferred tax assets 138,075 407,002 338,313 305,980
Total non-current assets 9,546,008 20,729,365 26,483,742 27,071,794
Current assets
Inventories 56,122 446,634 453,046 457,846 Trade and other receivables 5,132,560 6,756,096 6,012,198 5,428,359 Cash and cash equivalents 8,196,303 1,343,882 1,235,645 1,732,876
13,384,985 8,546,612 7,700,889 7,619,081
Total assets 22,930,993 29,275,977 34,184,631 34,690,875
Equity and liabilities
Capital and reserves
Share capital 500,000 500,000 1,000,000 1,000,000 Reporting currency conversion reserve (71,628) (86,596) (91,993) (95,215) Other reserves 18,305 18,305 18,305 18,305 Retained earnings 3,978,921 4,305,357 2,786,270 3,739,534 Non - controlling interest 37,888 46,923 54,321 77,326
Total equity 4,463,486 4,783,989 3,766,903 4,739,950
Liabilities
Non-current liabilities
Borrowings 14,653,191 14,680,125 17,622,242 18,990,950 Trade and other payables 425,000 425,000 425,000 425,000 Deferred tax liability - 1,664,860 1,704,891 1,663,588
15,078,191 16,769,985 19,752,133 21,079,538
Current liabilities
Borrowings 263,059 200,058 2,110,794 2,044,922 Trade and other payables 2,638,776 7,161,699 8,195,236 6,565,102 Current tax liabilities 487,481 319,067 316,585 219,222 Other current liabilities - 41,179 42,980 42,141
Total current liabilities 3,389,316 7,722,003 10,665,595 8,871,387
Total liabilities 18,467,507 24,491,988 30,417,728 29,950,925
Total equity and liabilities 22,930,993 29,275,977 34,184,631 34,690,875
Source: Audited financial statements and management information
FINANCIAL ANALYSIS SUMMARY Mediterranean Maritime Hub Finance p.l.c
17
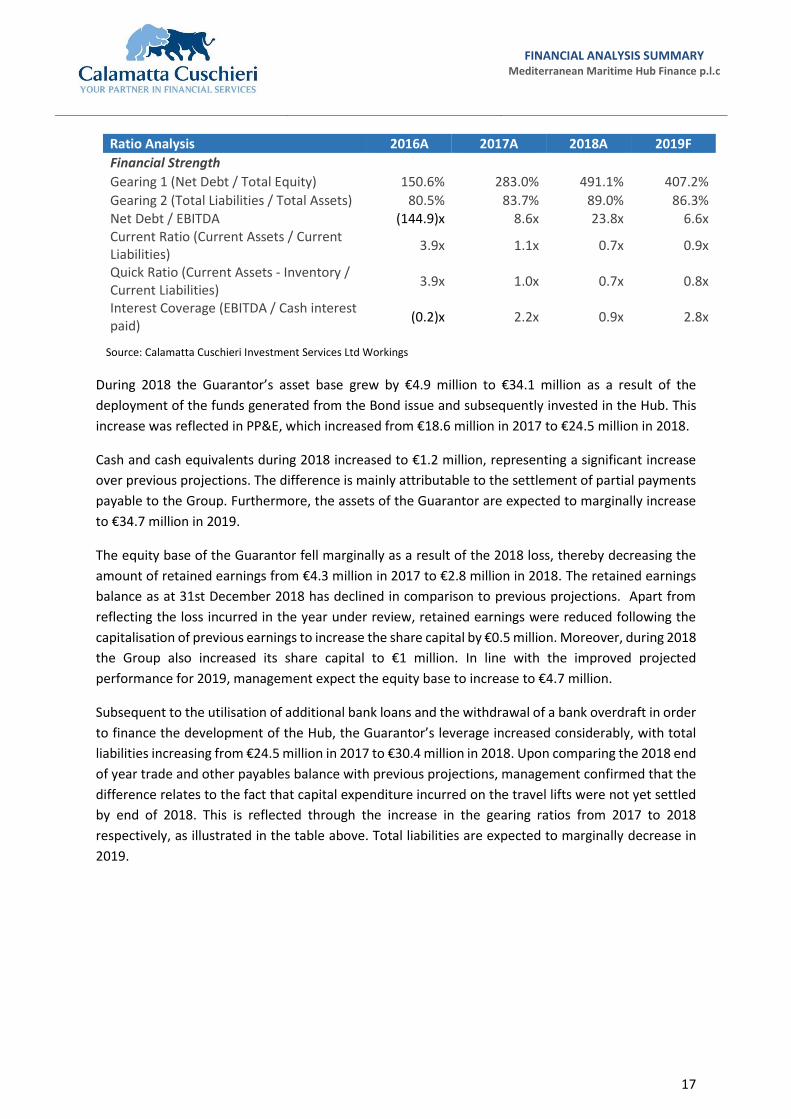
Ratio Analysis 2016A 2017A 2018A 2019F
Financial Strength
Gearing 1 (Net Debt / Total Equity) 150.6% 283.0% 491.1% 407.2%
Gearing 2 (Total Liabilities / Total Assets) 80.5% 83.7% 89.0% 86.3% Net Debt / EBITDA (144.9)x 8.6x 23.8x 6.6x Current Ratio (Current Assets / Current Liabilities)
3.9x 1.1x 0.7x 0.9x
Quick Ratio (Current Assets - Inventory / Current Liabilities)
3.9x 1.0x 0.7x 0.8x
Interest Coverage (EBITDA / Cash interest paid)
(0.2)x 2.2x 0.9x 2.8x
During 2018 the Guarantor’s asset base grew by €4.9 million to €34.1 million as a result of the
deployment of the funds generated from the Bond issue and subsequently invested in the Hub. This
increase was reflected in PP&E, which increased from €18.6 million in 2017 to €24.5 million in 2018.
Cash and cash equivalents during 2018 increased to €1.2 million, representing a significant increase
over previous projections. The difference is mainly attributable to the settlement of partial payments
payable to the Group. Furthermore, the assets of the Guarantor are expected to marginally increase
to €34.7 million in 2019.
The equity base of the Guarantor fell marginally as a result of the 2018 loss, thereby decreasing the
amount of retained earnings from €4.3 million in 2017 to €2.8 million in 2018. The retained earnings
balance as at 31st December 2018 has declined in comparison to previous projections. Apart from
reflecting the loss incurred in the year under review, retained earnings were reduced following the
capitalisation of previous earnings to increase the share capital by €0.5 million. Moreover, during 2018
the Group also increased its share capital to €1 million. In line with the improved projected
performance for 2019, management expect the equity base to increase to €4.7 million.
Subsequent to the utilisation of additional bank loans and the withdrawal of a bank overdraft in order
to finance the development of the Hub, the Guarantor’s leverage increased considerably, with total
liabilities increasing from €24.5 million in 2017 to €30.4 million in 2018. Upon comparing the 2018 end
of year trade and other payables balance with previous projections, management confirmed that the
difference relates to the fact that capital expenditure incurred on the travel lifts were not yet settled
by end of 2018. This is reflected through the increase in the gearing ratios from 2017 to 2018
respectively, as illustrated in the table above. Total liabilities are expected to marginally decrease in
2019.
Source: Calamatta Cuschieri Investment Services Ltd Workings
FINANCIAL ANALYSIS SUMMARY Mediterranean Maritime Hub Finance p.l.c
18
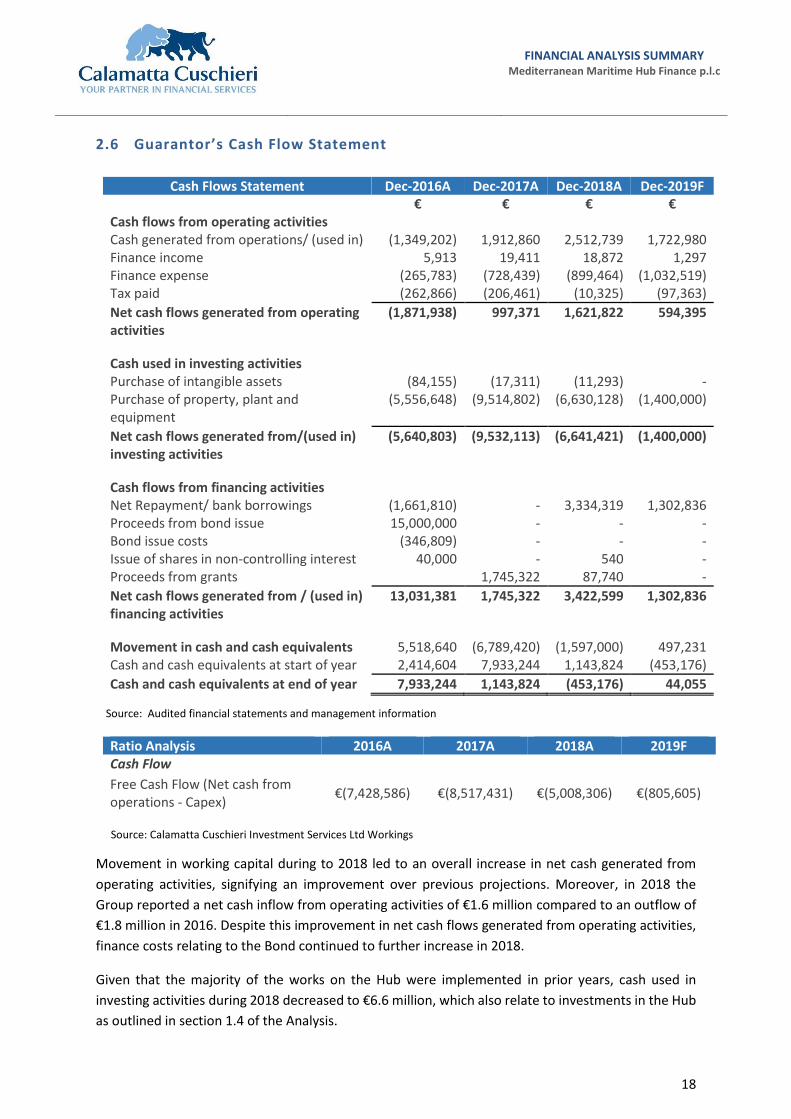
2.6 Guarantor’s Cash Flow Statement
Cash Flows Statement Dec-2016A Dec-2017A Dec-2018A Dec-2019F € € € €
Cash flows from operating activities
Cash generated from operations/ (used in) (1,349,202) 1,912,860 2,512,739 1,722,980 Finance income 5,913 19,411 18,872 1,297 Finance expense (265,783) (728,439) (899,464) (1,032,519) Tax paid (262,866) (206,461) (10,325) (97,363)
Net cash flows generated from operating activities
(1,871,938) 997,371 1,621,822 594,395
Cash used in investing activities
Purchase of intangible assets (84,155) (17,311) (11,293) - Purchase of property, plant and equipment
(5,556,648) (9,514,802) (6,630,128) (1,400,000)
Net cash flows generated from/(used in) investing activities
(5,640,803) (9,532,113) (6,641,421) (1,400,000)
Cash flows from financing activities
Net Repayment/ bank borrowings (1,661,810) - 3,334,319 1,302,836 Proceeds from bond issue 15,000,000 - - - Bond issue costs (346,809) - - - Issue of shares in non-controlling interest 40,000 - 540 - Proceeds from grants
1,745,322 87,740 -
Net cash flows generated from / (used in) financing activities
13,031,381 1,745,322 3,422,599 1,302,836
Movement in cash and cash equivalents 5,518,640 (6,789,420) (1,597,000) 497,231 Cash and cash equivalents at start of year 2,414,604 7,933,244 1,143,824 (453,176)
Cash and cash equivalents at end of year 7,933,244 1,143,824 (453,176) 44,055
Ratio Analysis 2016A 2017A 2018A 2019F Cash Flow
Free Cash Flow (Net cash from operations - Capex)
€(7,428,586) €(8,517,431) €(5,008,306) €(805,605)
Movement in working capital during to 2018 led to an overall increase in net cash generated from
operating activities, signifying an improvement over previous projections. Moreover, in 2018 the
Group reported a net cash inflow from operating activities of €1.6 million compared to an outflow of
€1.8 million in 2016. Despite this improvement in net cash flows generated from operating activities,
finance costs relating to the Bond continued to further increase in 2018.
Given that the majority of the works on the Hub were implemented in prior years, cash used in
investing activities during 2018 decreased to €6.6 million, which also relate to investments in the Hub
as outlined in section 1.4 of the Analysis.
Source: Calamatta Cuschieri Investment Services Ltd Workings
Source: Audited financial statements and management information
FINANCIAL ANALYSIS SUMMARY Mediterranean Maritime Hub Finance p.l.c
19
In line with previous projections, cash from financing activities during 2018 mainly relates to the partial
withdrawal of a bank overdraft undertaken by the Group, in order to finance additional developments
on the Hub.
As a result of the above the Group’s cash and cash equivalent balance at the end of 2018 decreased
to negative €0.5 million from €7.9 million at the end of 2016.
Given that a lower level of capital expenditure is anticipated to be incurred during 2019, management
are forecasting a cash balance at end of year of €44k.
Part 3 - Key market and competitor data
The main activity of the Group is to provide specialised services to the marine, oil and gas industries.
As of 2018 the Group also started to pursue new lines of business pertaining to the servicing of yachts.
This part of this Analysis provides an update relating to the oil and gas and yachting industries.
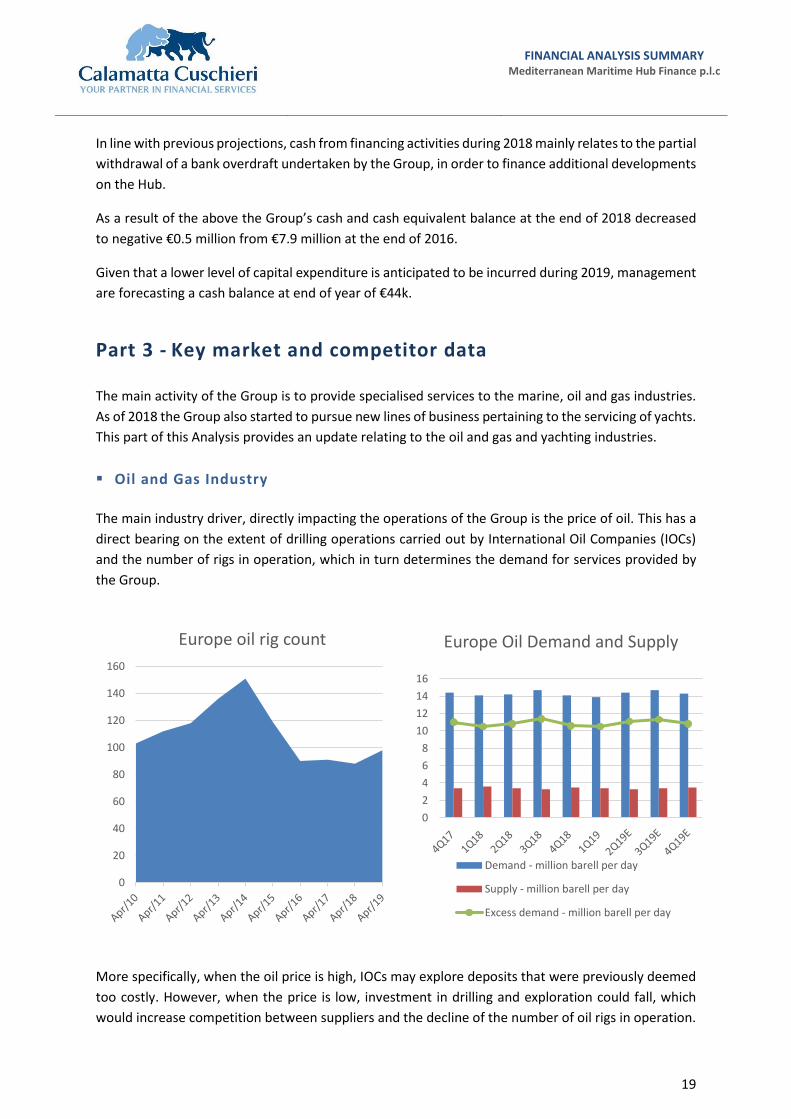
Oil and Gas Industry
The main industry driver, directly impacting the operations of the Group is the price of oil. This has a
direct bearing on the extent of drilling operations carried out by International Oil Companies (IOCs)
and the number of rigs in operation, which in turn determines the demand for services provided by
the Group.
More specifically, when the oil price is high, IOCs may explore deposits that were previously deemed
too costly. However, when the price is low, investment in drilling and exploration could fall, which
would increase competition between suppliers and the decline of the number of oil rigs in operation.
0
20
40
60
80
100
120
140
160
Europe oil rig count
0
2
4
6
8
10
12
14
16
Europe Oil Demand and Supply
Demand - million barell per day
Supply - million barell per day
Excess demand - million barell per day
FINANCIAL ANALYSIS SUMMARY Mediterranean Maritime Hub Finance p.l.c
20
The offshore oil and gas industry has endured a challenging period over the past few years, forcing
the industry as a whole to adapt and transform itself in line with the rapidly-changing energy
requirements within the industry. In an attempt to address this ever growing concern and fully emerge
from this challenging period; operators, service companies and major equipment manufacturers,
started to establish MSAs with potential suppliers. These agreements have nowadays increased in
popularity as they allocate risk and provide indemnification amongst both parties. Given that these
companies operate in a highly volatile environment, such agreements provide the required support
to rationalize their operations into better strategically located and efficient regional hubs.
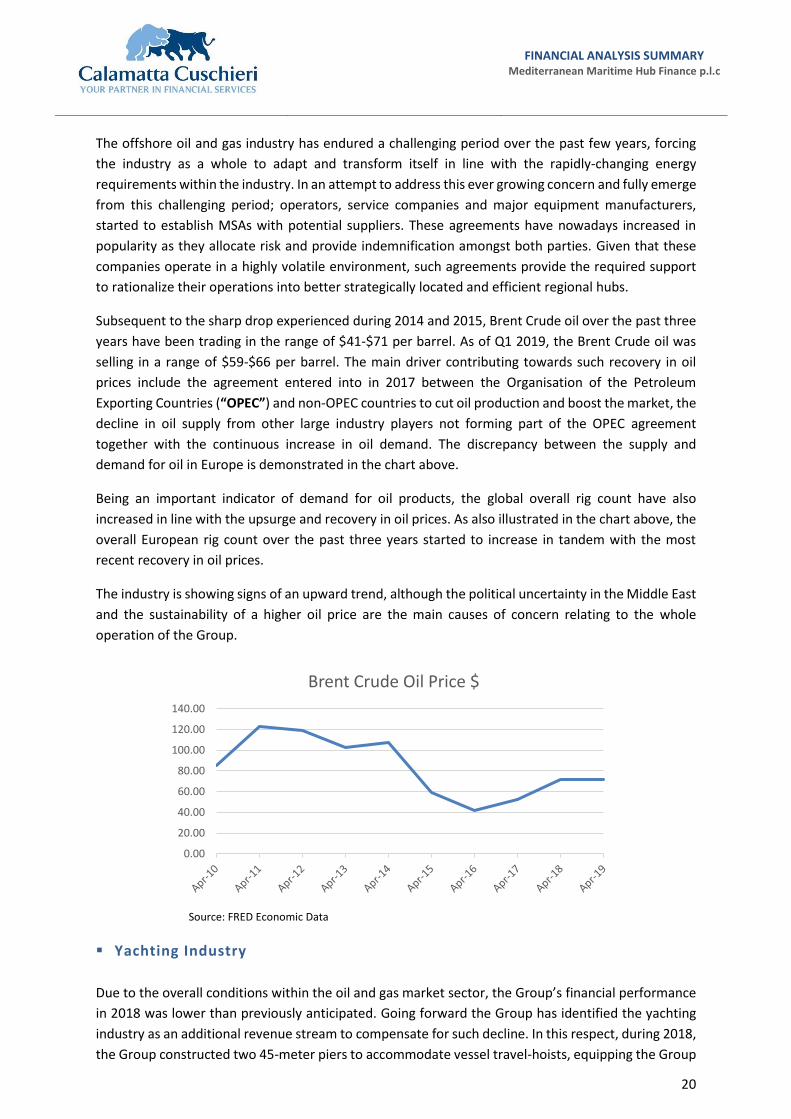
Subsequent to the sharp drop experienced during 2014 and 2015, Brent Crude oil over the past three
years have been trading in the range of $41-$71 per barrel. As of Q1 2019, the Brent Crude oil was
selling in a range of $59-$66 per barrel. The main driver contributing towards such recovery in oil
prices include the agreement entered into in 2017 between the Organisation of the Petroleum
Exporting Countries (“OPEC”) and non-OPEC countries to cut oil production and boost the market, the
decline in oil supply from other large industry players not forming part of the OPEC agreement
together with the continuous increase in oil demand. The discrepancy between the supply and
demand for oil in Europe is demonstrated in the chart above.
Being an important indicator of demand for oil products, the global overall rig count have also
increased in line with the upsurge and recovery in oil prices. As also illustrated in the chart above, the
overall European rig count over the past three years started to increase in tandem with the most
recent recovery in oil prices.
The industry is showing signs of an upward trend, although the political uncertainty in the Middle East
and the sustainability of a higher oil price are the main causes of concern relating to the whole
operation of the Group.
Yachting Industry
Due to the overall conditions within the oil and gas market sector, the Group’s financial performance
in 2018 was lower than previously anticipated. Going forward the Group has identified the yachting
industry as an additional revenue stream to compensate for such decline. In this respect, during 2018,
the Group constructed two 45-meter piers to accommodate vessel travel-hoists, equipping the Group
0.00
20.00
40.00
60.00
80.00
100.00
120.00
140.00
Brent Crude Oil Price $
Source: FRED Economic Data
FINANCIAL ANALYSIS SUMMARY Mediterranean Maritime Hub Finance p.l.c
21
with the capability of lifting commercial and pleasure vessels of up to 700 tonnes from sea to dry
ground for IMR services and return to sea.
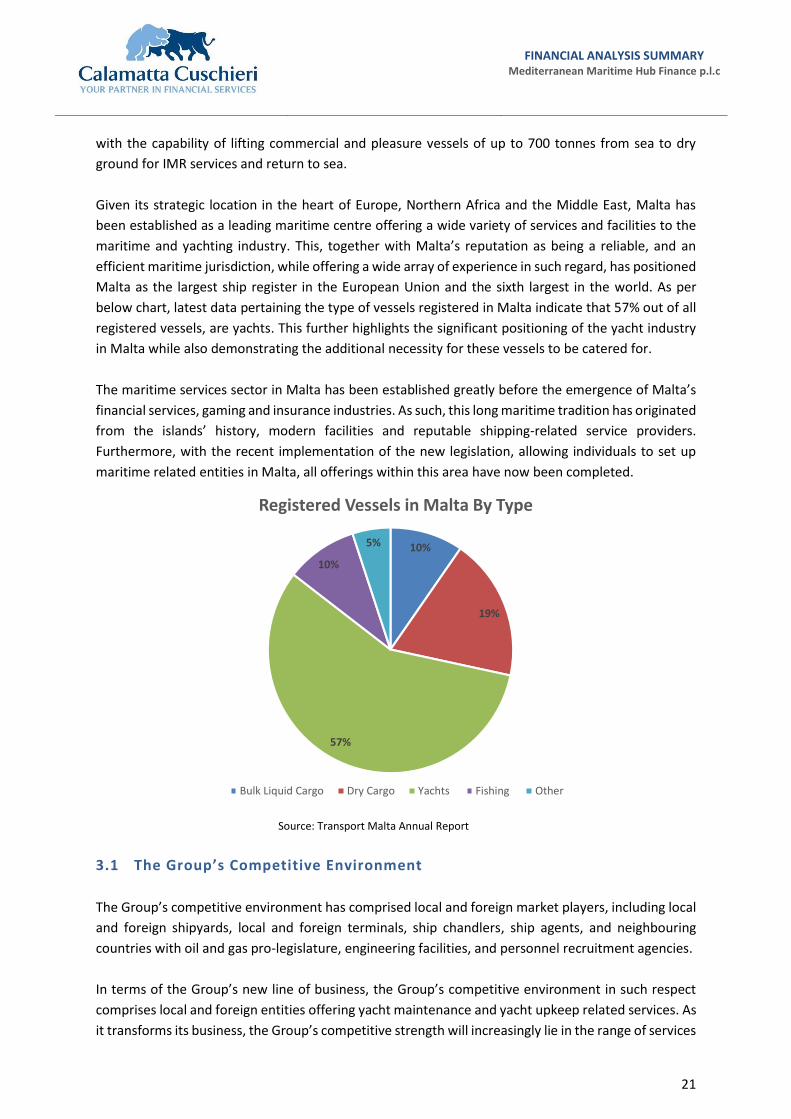
Given its strategic location in the heart of Europe, Northern Africa and the Middle East, Malta has
been established as a leading maritime centre offering a wide variety of services and facilities to the
maritime and yachting industry. This, together with Malta’s reputation as being a reliable, and an
efficient maritime jurisdiction, while offering a wide array of experience in such regard, has positioned
Malta as the largest ship register in the European Union and the sixth largest in the world. As per
below chart, latest data pertaining the type of vessels registered in Malta indicate that 57% out of all
registered vessels, are yachts. This further highlights the significant positioning of the yacht industry
in Malta while also demonstrating the additional necessity for these vessels to be catered for.
The maritime services sector in Malta has been established greatly before the emergence of Malta’s
financial services, gaming and insurance industries. As such, this long maritime tradition has originated
from the islands’ history, modern facilities and reputable shipping-related service providers.
Furthermore, with the recent implementation of the new legislation, allowing individuals to set up
maritime related entities in Malta, all offerings within this area have now been completed.
3.1 The Group’s Competitive Environment
The Group’s competitive environment has comprised local and foreign market players, including local
and foreign shipyards, local and foreign terminals, ship chandlers, ship agents, and neighbouring
countries with oil and gas pro-legislature, engineering facilities, and personnel recruitment agencies.
In terms of the Group’s new line of business, the Group’s competitive environment in such respect
comprises local and foreign entities offering yacht maintenance and yacht upkeep related services. As
it transforms its business, the Group’s competitive strength will increasingly lie in the range of services
10%
19%
57%
10%
5%
Registered Vessels in Malta By Type
Bulk Liquid Cargo Dry Cargo Yachts Fishing Other
Source: Transport Malta Annual Report
FINANCIAL ANALYSIS SUMMARY Mediterranean Maritime Hub Finance p.l.c
22
it provides, resulting in a one-stop shop for rigs within a cost effective, multi-faceted Hub in the centre
of the Mediterranean.
The location, size and facilities of the Mediterranean Maritime Hub offers clients with the unique
regional operational flexibility. This applies to the oil and gas industry as well as to companies with
diverse maritime industries.
The Group is subject to regulation by the local transport regulator –Transport Malta. It is also regulated
by the SEC under the Foreign Corrupt Practices Act of 1977, a United States federal law known
primarily for two of its main provisions, one that addresses accounting transparency requirements
under the Securities Exchange Act of 1934 and another concerning bribery of foreign officials; as well
as the UK Bribery Act of 2010.
It is also an accredited member of the International Association of Drilling Contractors and is
ISO9001:2015 compliant, OHSAS 18001:2007 certified and 14001:2004 compliant. These certifications
demonstrate that the Group aims to ensure client satisfaction, that work is performed in a safe
environment, and with the least environmental impact possible.
FINANCIAL ANALYSIS SUMMARY
Mediterranean Maritime Hub Finance p.l.c
23
3.2 Comparative Analysis
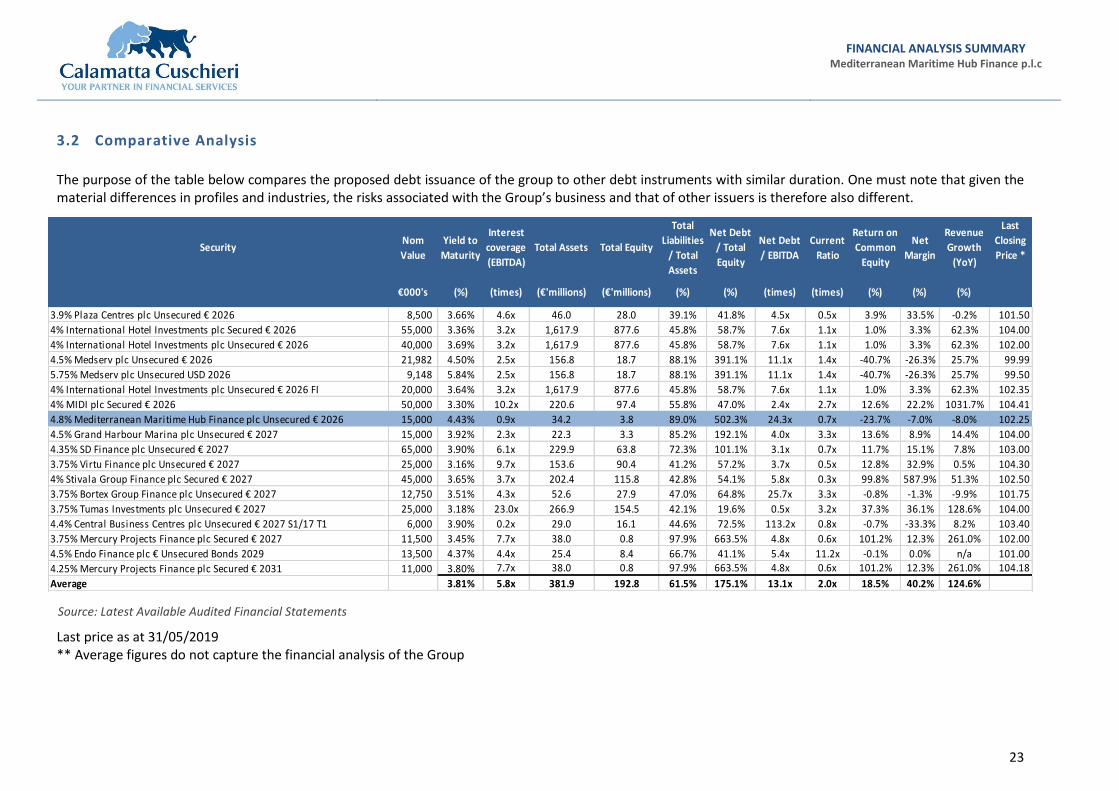
The purpose of the table below compares the proposed debt issuance of the group to other debt instruments with similar duration. One must note that given the material differences in profiles and industries, the risks associated with the Group’s business and that of other issuers is therefore also different.
Last price as at 31/05/2019 ** Average figures do not capture the financial analysis of the Group
Source: Latest Available Audited Financial Statements
SecurityNom
Value
Yield to
Maturity
Interest
coverage
(EBITDA)
Total Assets Total Equity
Total
Liabilities
/ Total
Assets
Net Debt
/ Total
Equity
Net Debt
/ EBITDA
Current
Ratio
Return on
Common
Equity
Net
Margin
Revenue
Growth
(YoY)
Last
Closing
Price *
€000's (%) (times) (€'millions) (€'millions) (%) (%) (times) (times) (%) (%) (%)
3.9% Plaza Centres plc Unsecured € 2026 8,500 3.66% 4.6x 46.0 28.0 39.1% 41.8% 4.5x 0.5x 3.9% 33.5% -0.2% 101.50
4% International Hotel Investments plc Secured € 2026 55,000 3.36% 3.2x 1,617.9 877.6 45.8% 58.7% 7.6x 1.1x 1.0% 3.3% 62.3% 104.00
4% International Hotel Investments plc Unsecured € 2026 40,000 3.69% 3.2x 1,617.9 877.6 45.8% 58.7% 7.6x 1.1x 1.0% 3.3% 62.3% 102.00
4.5% Medserv plc Unsecured € 2026 21,982 4.50% 2.5x 156.8 18.7 88.1% 391.1% 11.1x 1.4x -40.7% -26.3% 25.7% 99.99
5.75% Medserv plc Unsecured USD 2026 9,148 5.84% 2.5x 156.8 18.7 88.1% 391.1% 11.1x 1.4x -40.7% -26.3% 25.7% 99.50
4% International Hotel Investments plc Unsecured € 2026 FI 20,000 3.64% 3.2x 1,617.9 877.6 45.8% 58.7% 7.6x 1.1x 1.0% 3.3% 62.3% 102.35
4% MIDI plc Secured € 2026 50,000 3.30% 10.2x 220.6 97.4 55.8% 47.0% 2.4x 2.7x 12.6% 22.2% 1031.7% 104.41
4.8% Mediterranean Maritime Hub Finance plc Unsecured € 2026 15,000 4.43% 0.9x 34.2 3.8 89.0% 502.3% 24.3x 0.7x -23.7% -7.0% -8.0% 102.25
4.5% Grand Harbour Marina plc Unsecured € 2027 15,000 3.92% 2.3x 22.3 3.3 85.2% 192.1% 4.0x 3.3x 13.6% 8.9% 14.4% 104.00
4.35% SD Finance plc Unsecured € 2027 65,000 3.90% 6.1x 229.9 63.8 72.3% 101.1% 3.1x 0.7x 11.7% 15.1% 7.8% 103.00
3.75% Virtu Finance plc Unsecured € 2027 25,000 3.16% 9.7x 153.6 90.4 41.2% 57.2% 3.7x 0.5x 12.8% 32.9% 0.5% 104.30
4% Stivala Group Finance plc Secured € 2027 45,000 3.65% 3.7x 202.4 115.8 42.8% 54.1% 5.8x 0.3x 99.8% 587.9% 51.3% 102.50
3.75% Bortex Group Finance plc Unsecured € 2027 12,750 3.51% 4.3x 52.6 27.9 47.0% 64.8% 25.7x 3.3x -0.8% -1.3% -9.9% 101.75
3.75% Tumas Investments plc Unsecured € 2027 25,000 3.18% 23.0x 266.9 154.5 42.1% 19.6% 0.5x 3.2x 37.3% 36.1% 128.6% 104.00
4.4% Central Business Centres plc Unsecured € 2027 S1/17 T1 6,000 3.90% 0.2x 29.0 16.1 44.6% 72.5% 113.2x 0.8x -0.7% -33.3% 8.2% 103.40
3.75% Mercury Projects Finance plc Secured € 2027 11,500 3.45% 7.7x 38.0 0.8 97.9% 663.5% 4.8x 0.6x 101.2% 12.3% 261.0% 102.00
4.5% Endo Finance plc € Unsecured Bonds 2029 13,500 4.37% 4.4x 25.4 8.4 66.7% 41.1% 5.4x 11.2x -0.1% 0.0% n/a 101.00
4.25% Mercury Projects Finance plc Secured € 2031 11,000 3.80% 7.7x 38.0 0.8 97.9% 663.5% 4.8x 0.6x 101.2% 12.3% 261.0% 104.18
Average 3.81% 5.8x 381.9 192.8 61.5% 175.1% 13.1x 2.0x 18.5% 40.2% 124.6%
FINANCIAL ANALYSIS SUMMARY Mediterranean Maritime Hub Finance p.l.c
24
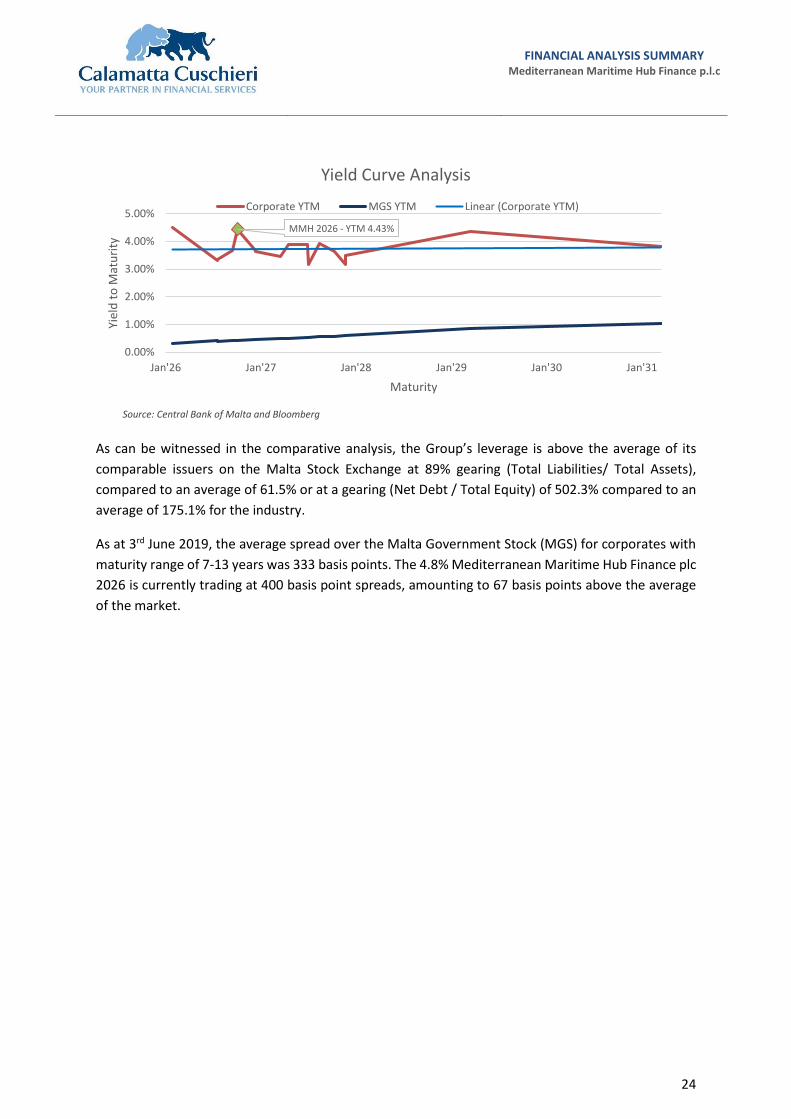
As can be witnessed in the comparative analysis, the Group’s leverage is above the average of its
comparable issuers on the Malta Stock Exchange at 89% gearing (Total Liabilities/ Total Assets),
compared to an average of 61.5% or at a gearing (Net Debt / Total Equity) of 502.3% compared to an
average of 175.1% for the industry.
As at 3rd June 2019, the average spread over the Malta Government Stock (MGS) for corporates with
maturity range of 7-13 years was 333 basis points. The 4.8% Mediterranean Maritime Hub Finance plc
2026 is currently trading at 400 basis point spreads, amounting to 67 basis points above the average
of the market.
MMH 2026 - YTM 4.43%
0.00%
1.00%
2.00%
3.00%
4.00%
5.00%
Jan'26 Jan'27 Jan'28 Jan'29 Jan'30 Jan'31
Yiel
d t
o M
atu
rity
Maturity
Yield Curve Analysis
Corporate YTM MGS YTM Linear (Corporate YTM)
Source: Central Bank of Malta and Bloomberg
FINANCIAL ANALYSIS SUMMARY Mediterranean Maritime Hub Finance p.l.c
25
Part 4 - Glossary and Definitions
Income Statement
Revenue Total revenue generated by the Group/Company from its principal business activities during the financial year.
Costs Costs are expenses incurred by the Group/Company in the production of its revenue.
EBITDA EBITDA is an abbreviation for earnings before interest, tax, depreciation and amortisation. It reflects the Group’s/Company’s earnings purely from operations.
Operating Profit (EBIT) EBIT is an abbreviation for earnings before interest and tax.
Depreciation and Amortisation
An accounting charge to compensate for the decrease in the monetary value of an asset over time and the eventual cost to replace the asset once fully depreciated.
Net Finance Costs The interest accrued on debt obligations less any interest earned on cash bank balances and from intra-group companies on any loan advances.
Net Income The profit made by the Group/Company during the financial year net of any income taxes incurred.
Profitability Ratios
Growth in Revenue (YoY) This represents the growth in revenue when compared with previous financial year.
Gross Profit Margin Gross profit as a percentage of total revenue.
EBITDA Margin EBITDA as a percentage of total revenue.
Operating (EBIT) Margin Operating margin is the EBIT as a percentage of total revenue.
Net Margin Net income expressed as a percentage of total revenue.
Return on Common Equity Return on common equity (ROE) measures the rate of return on the shareholders’ equity of the owners of issued share capital, computed by dividing the net income by the average common equity (average equity of two years financial performance).
Return on Assets Return on assets (ROA) is computed by dividing net income by total assets.
Cash Flow Statement
Cash Flow from Operating Activities (CFO)
Cash generated from the principal revenue producing activities of the Group/Company less any interest incurred on debt.
Cash Flow from Investing Activities
Cash generated from the activities dealing with the acquisition and disposal of long-term assets and other investments of the Group/Company.
Cash Flow from Financing Activities
Cash generated from the activities that result in change in share capital and borrowings of the Group/Company.
Capex Represents the capital expenditure incurred by the Group/Company in a financial year.
Free Cash Flows (FCF) The amount of cash the Group/Company has after it has met its financial obligations. It is calculated by taking Cash Flow from Operating Activities less the Capex of the same financial year.
Balance Sheet
Total Assets What the Group/Company owns which can de further classified into Non-Current Assets and Current Assets.
Non-Current Assets Assets, full value of which will not be realised within the forthcoming accounting year
Current Assets Assets which are realisable within one year from the statement of financial position date.
Inventory Inventory is the term for the goods available for sale and raw materials used to produce goods available for sale.
Cash and Cash Equivalents Cash and cash equivalents are Group/Company assets that are either cash or can be converted into cash immediately.
Total Equity Total Equity is calculated as total assets less liabilities, representing the capital owned by the shareholders, retained earnings, and any reserves.
FINANCIAL ANALYSIS SUMMARY Mediterranean Maritime Hub Finance p.l.c
26
Total Liabilities What the Group/Company owes which can de further classified into Non-Current Liabilities and Current Liabilities.
Non-Current Liabilities Obligations which are due after more than one financial year.
Total Debt All debt obligations inclusive of long and short-term debt.
Net Debt Total debt of a Group/Company less any cash and cash equivalents.
Current Liabilities Obligations which are due within one financial year.
Financial Strength Ratios
Current Ratio The Current ratio (also known as the Liquidity Ratio) is a financial ratio that measures whether or not a company has enough resources to pay its debts over the next 12 months. It compares current assets to current liabilities.
Quick Ratio (Acid Test Ratio) The quick ratio measures a Group’s/Company’s ability to meet its short-term obligations with its most liquid assets. It compares current assets (less inventory) to current liabilities.
Interest Coverage Ratio The interest coverage ratio is calculated by dividing EBITDA of one period by cash interest paid of the same period.
Gearing Ratio Gearing Ratio Level 1 Gearing Ratio Level 2
The gearing ratio indicates the relative proportion of shareholders’ equity and debt used to finance total assets. Is calculated by dividing Net Debt by Total Equity. Is calculated by dividing Total Liabilities by Total Assets.
Net Debt / EBITDA The Net Debt / EBITDA ratio measures the ability of the Group/Company to refinance its debt by looking at the EBITDA.
Other Definitions
Yield to Maturity (YTM) YTM is the rate of return expected on a bond which is held till maturity. It is essentially the internal rate of return on a bond and it equates the present value of bond future cash flows to its current market price.
Occupancy Level The occupancy level is expressed as a percentage and indicates the number of rooms occupied to the total number of available rooms in a given time period.