Embed Size (px)
Citation preview
Financial Astrology Models
Introduction by
Alon Avramson
May 2012
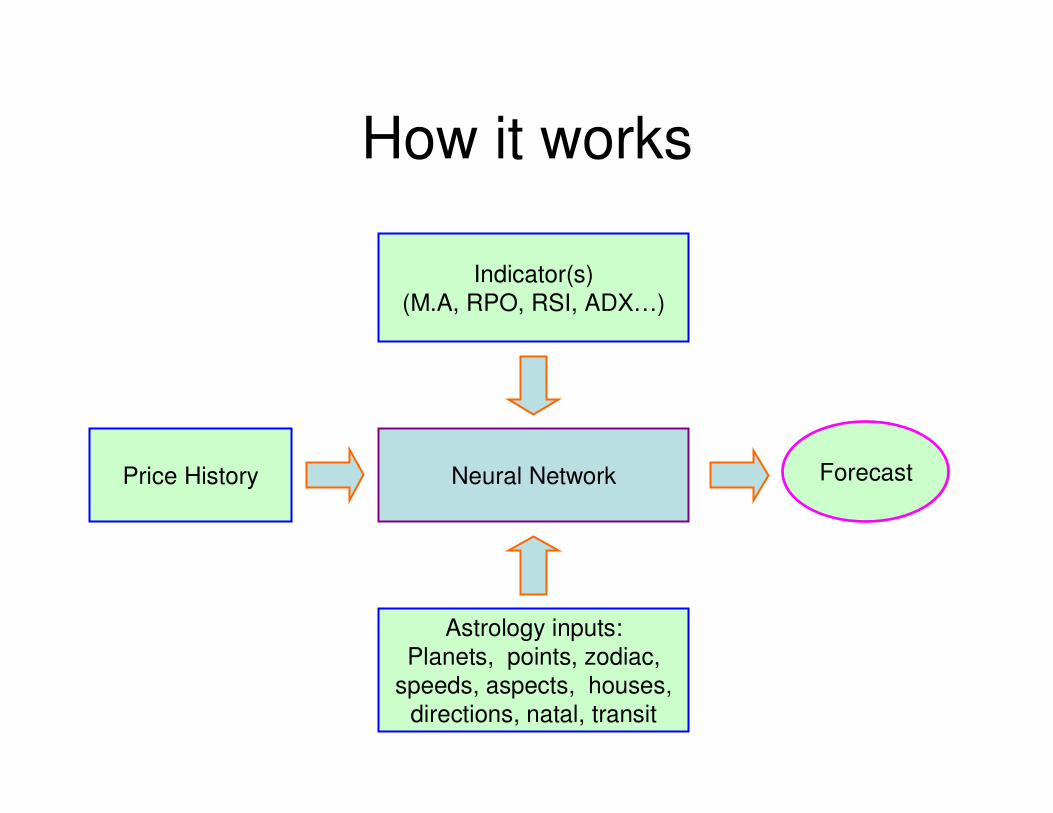
How it works
Neural NetworkPrice History
Astrology inputs:
Planets, points, zodiac,
speeds, aspects, houses,
directions, natal, transit
Indicator(s)
(M.A, RPO, RSI, ADX…)
Forecast
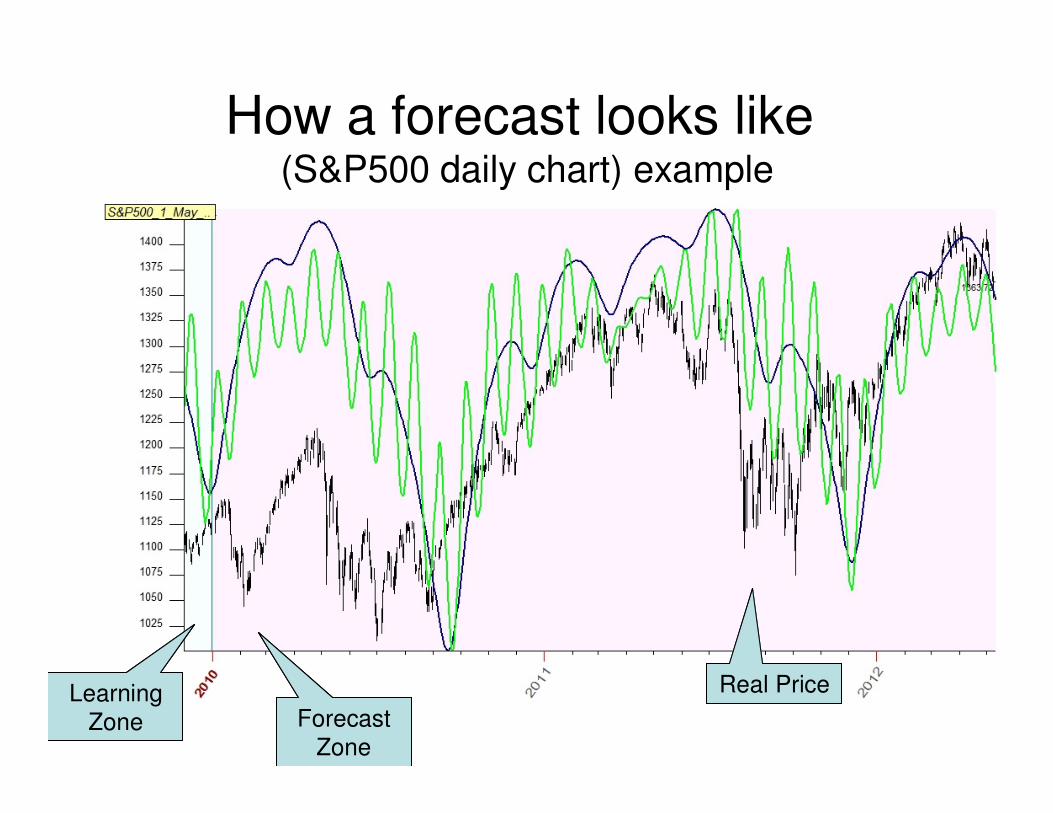
How a forecast looks like (S&P500 daily chart) example
Learning
Zone Forecast
Zone
Real PriceLearning
Zone Forecast
Zone
Real PriceLearning
Zone Forecast
Zone
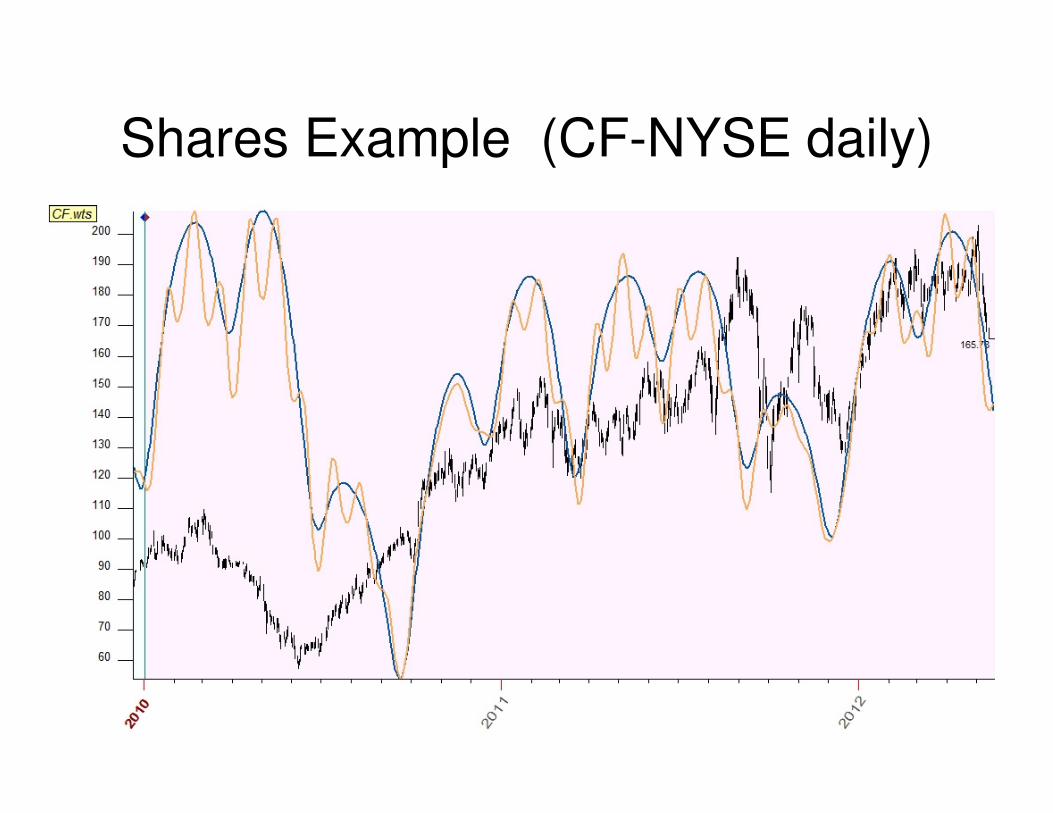
Shares Example (CF-NYSE daily)
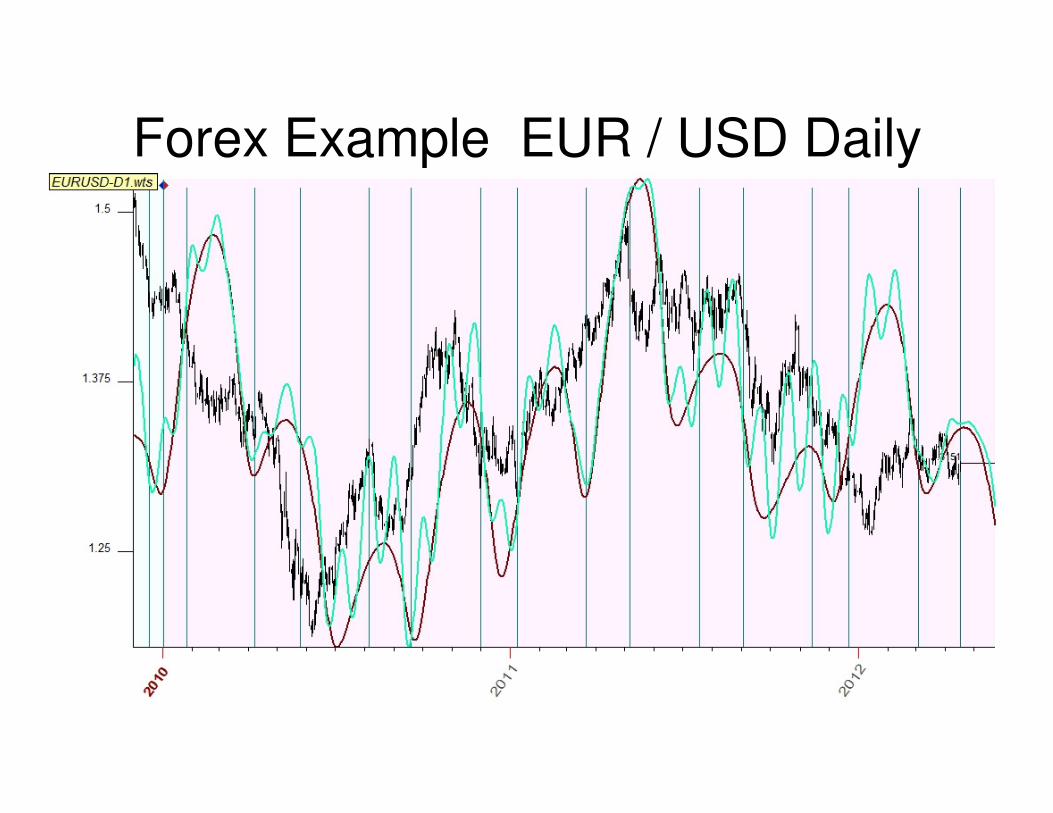
Forex Example EUR / USD Daily
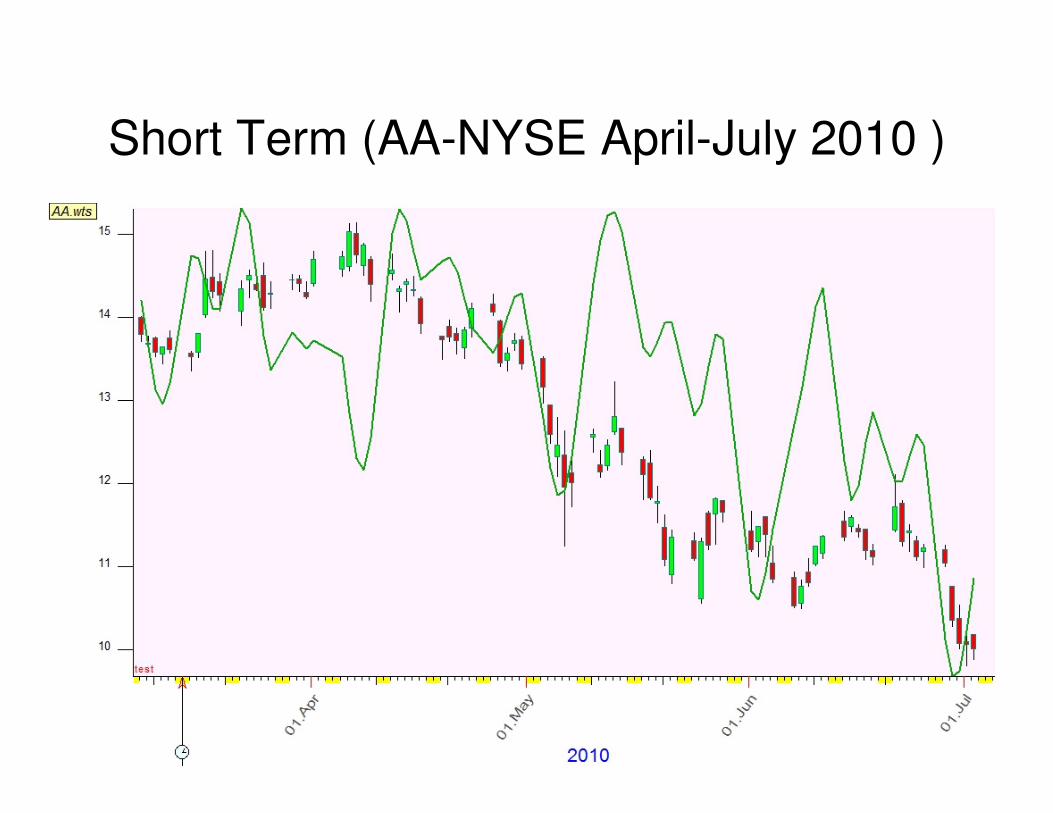
Short Term (AA-NYSE April-July 2010 )
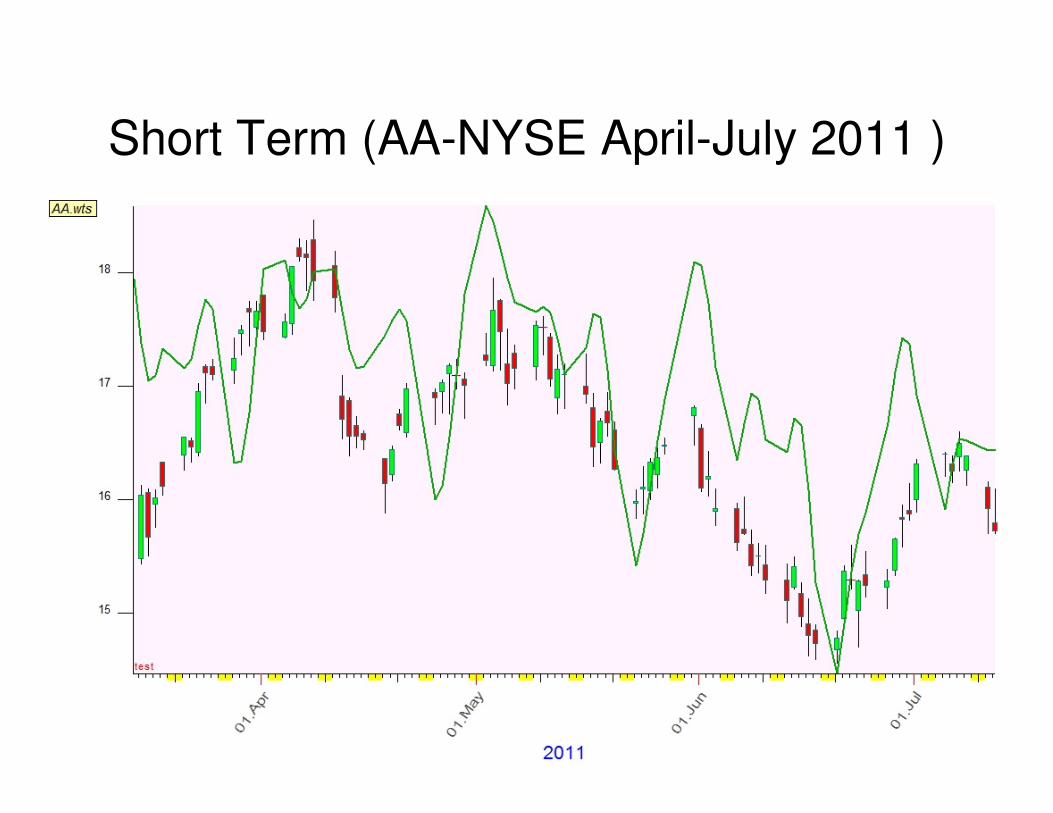
Short Term (AA-NYSE April-July 2011 )
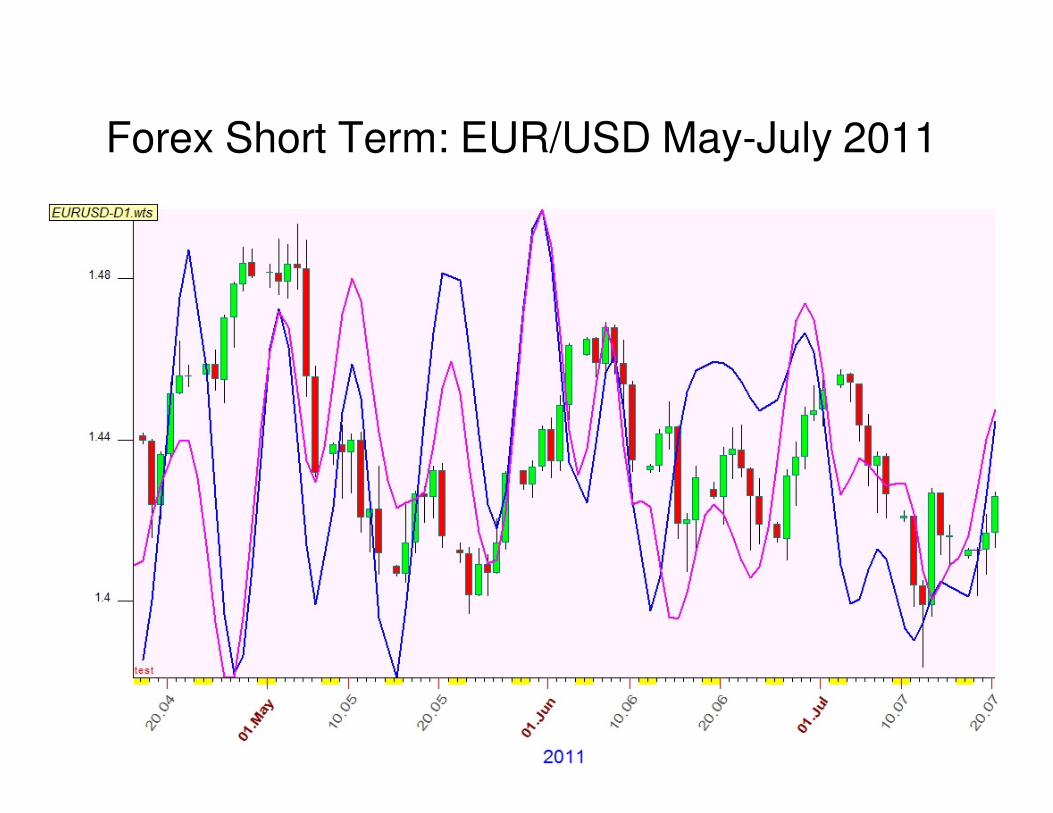
Forex Short Term: EUR/USD May-July 2011
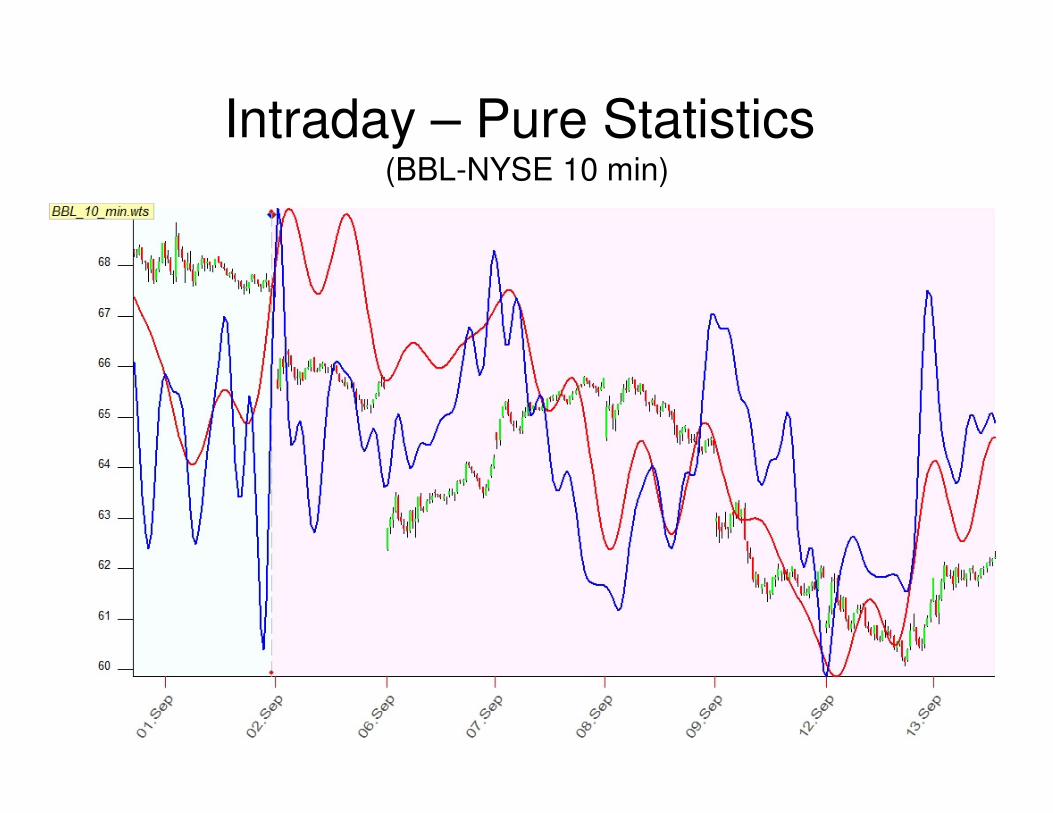
Intraday – Pure Statistics (BBL-NYSE 10 min)
What can be forecast
• Any tradable security with enough price
history and numerous public trades
• The forecast depends on:
– available price history
– indicator used
– astrology model developed for this security
• Models shown here for Daily & Intraday.
Mysticism or Mathematics?
• The models are based on artificial intelligence, mathematics and statistics.
• The Neural Network engine, which is the heart of the model, is based on mathematical methods of artificial intelligence. That engine solves N equations of astronomy combinations, for X bars of price history for specific indicator(s).
How far ahead can we forecast
• Each model has it’s own accuracy and
own relevancy time-frame
• Daily models can last for more than a year
• Intraday models can last for several days
• A more precise model has a shorter
relevancy time-frame
Model Accuracy
• The models are based on statistics and as such, have statistics results
• Some models have been proven to be 80-90% accurate for more than two years, some other models proved to be 60-70% for several months
• Some model may have opposite correlation for a period (see following example)
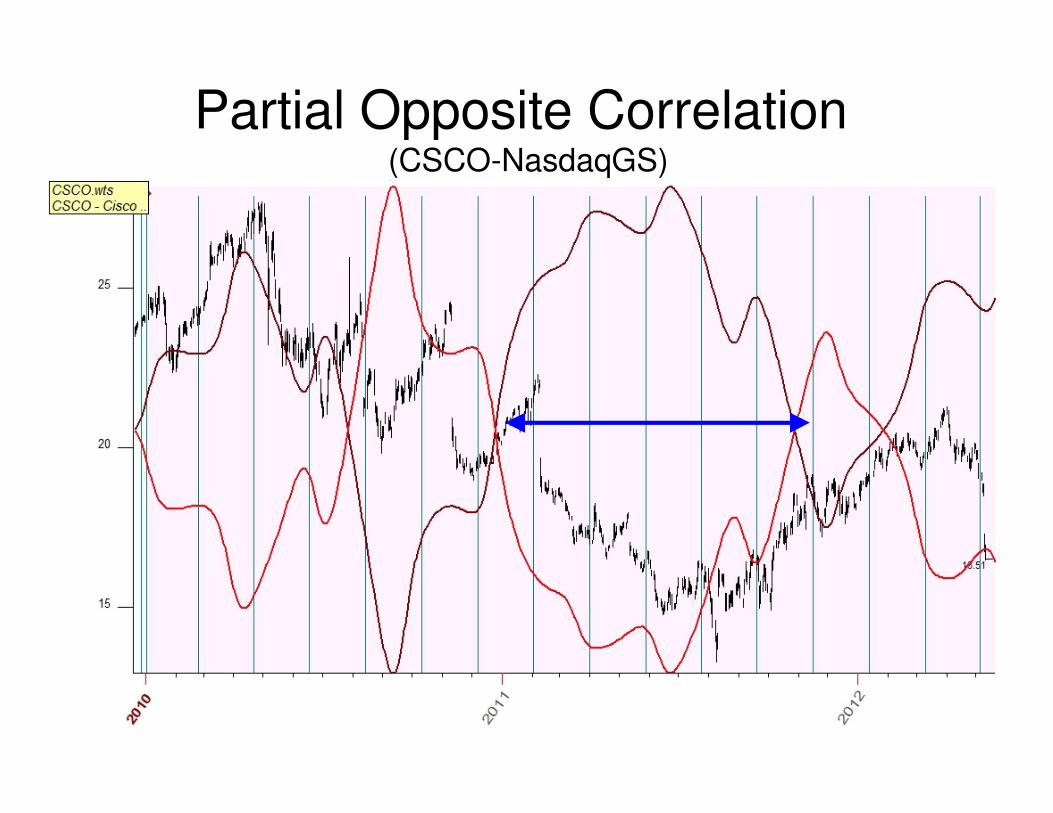
Partial Opposite Correlation (CSCO-NasdaqGS)
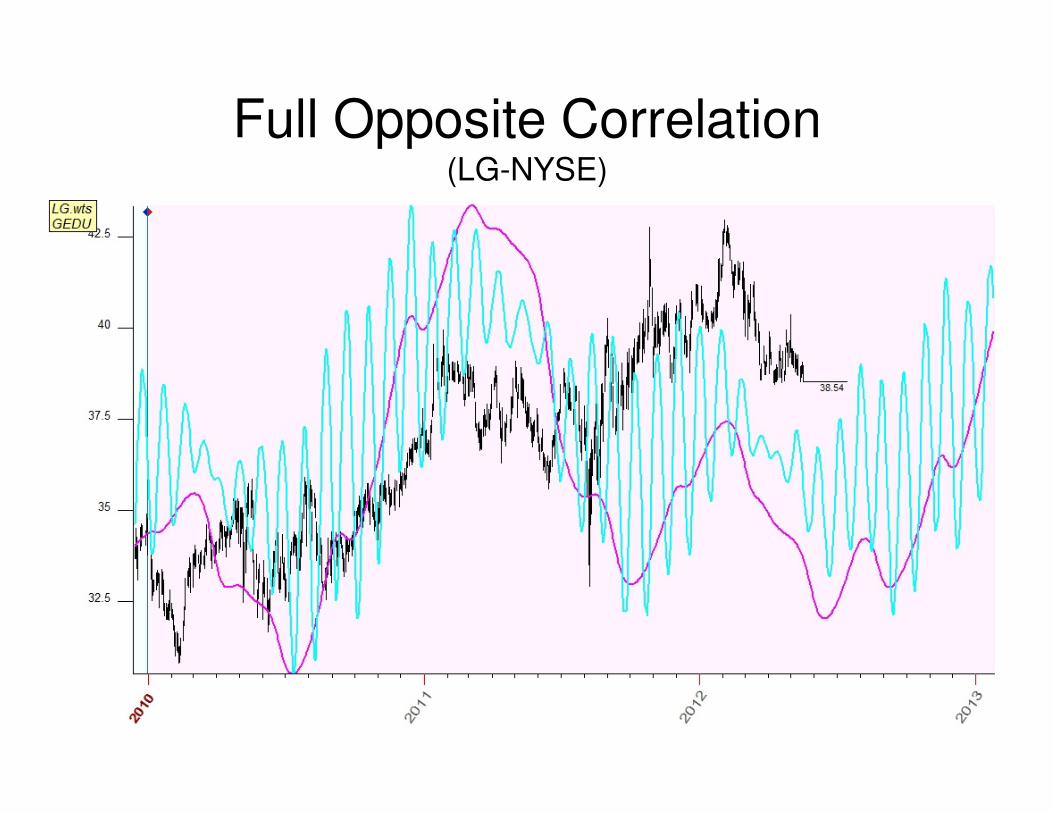
Full Opposite Correlation(LG-NYSE)
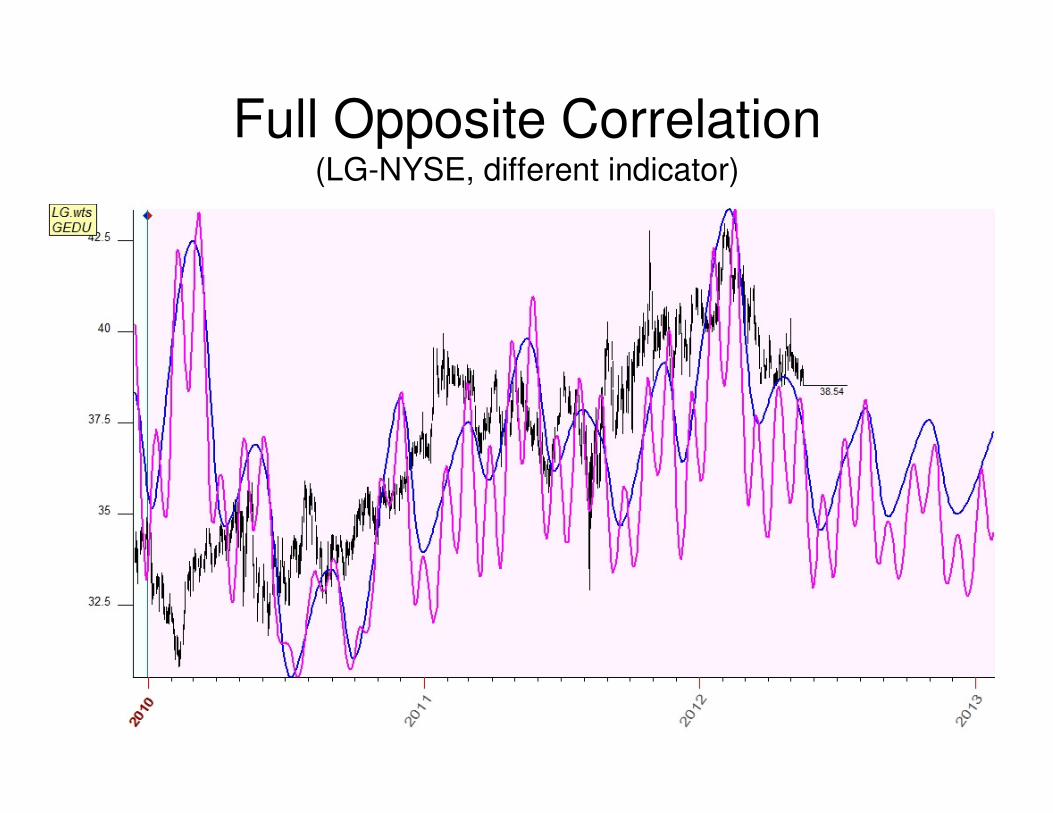
Full Opposite Correlation(LG-NYSE, different indicator)
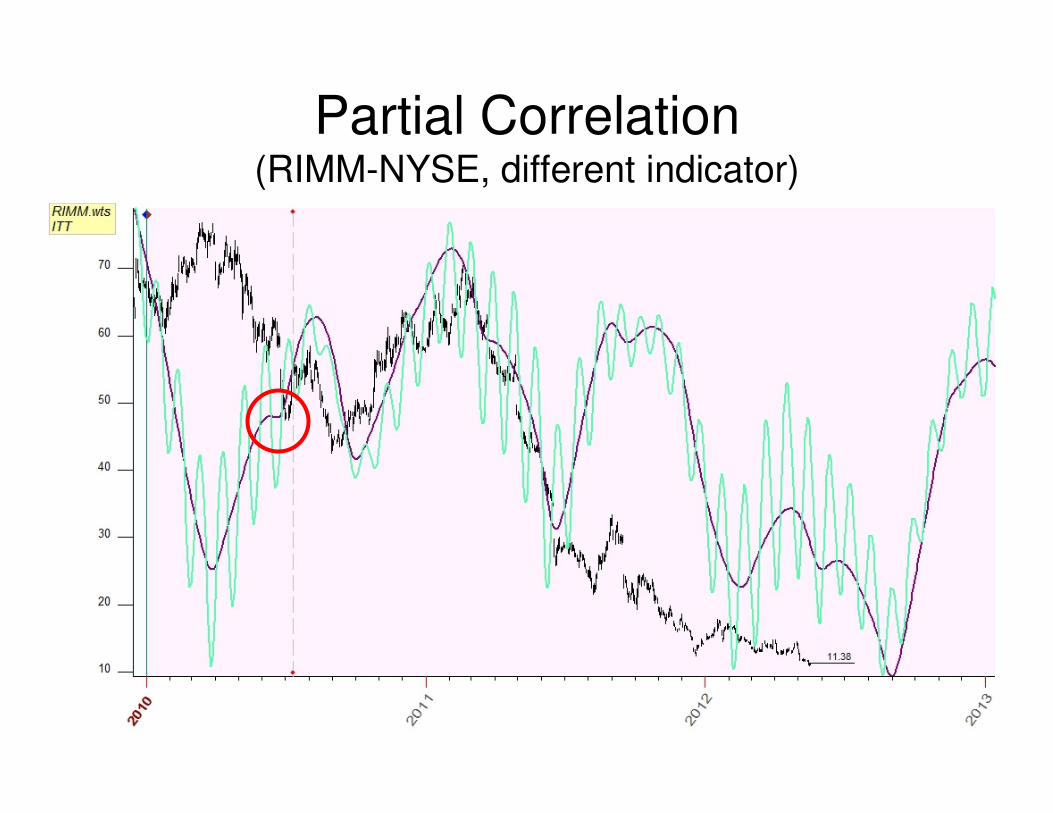
Partial Correlation(RIMM-NYSE, different indicator)
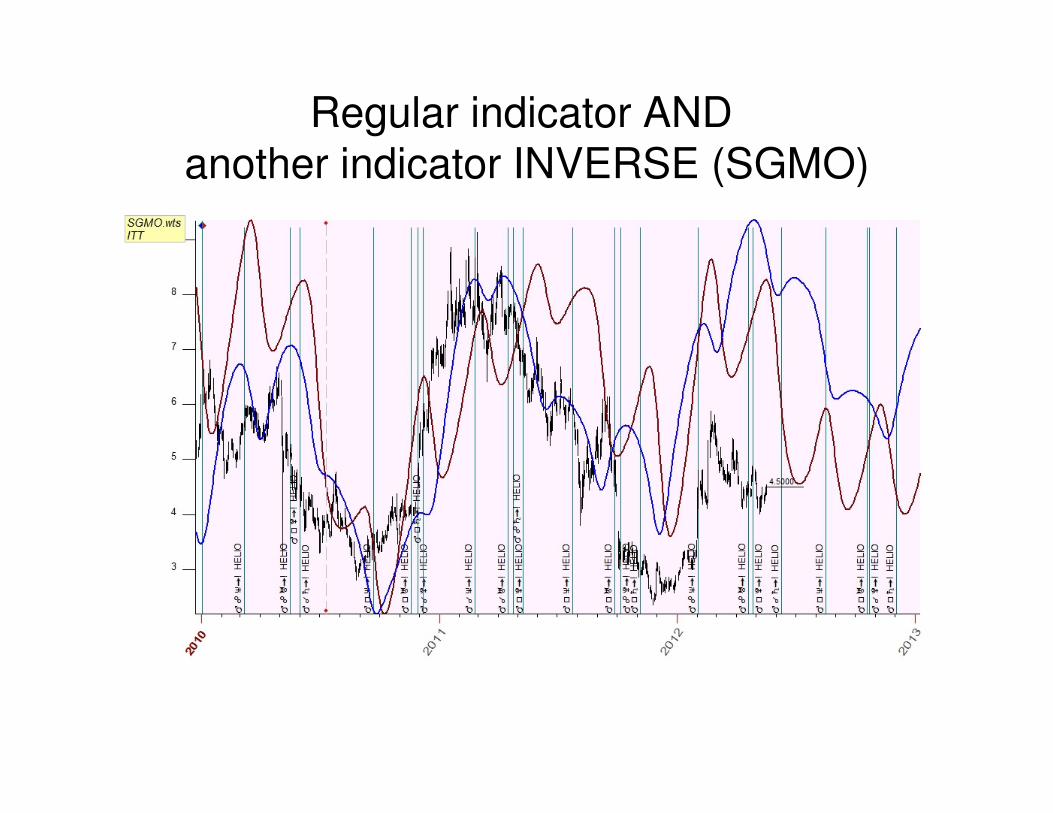
Regular indicator AND
another indicator INVERSE (SGMO)
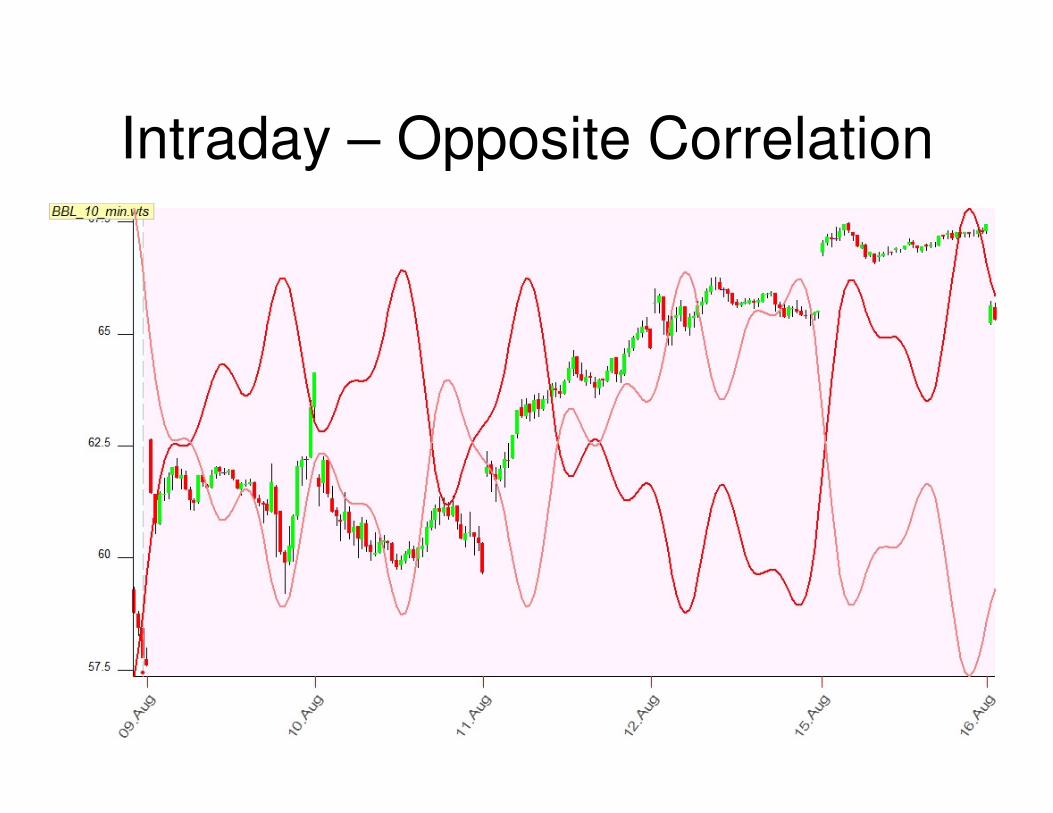
Intraday – Opposite Correlation
Advantages
• Astrology & Astronomy parameters are
known years ahead so the forecast can be
prepared in advance
• Forecast depends on external and known
methods - Astronomy, not only on the
price itself (as in technical analysis)
Challenges
• Opposite correlations – how to forecast
when they appear and when they end.
• Deciding when a model stops working. Some models stop working after several
months and some others after several
years. This issue needs more research.
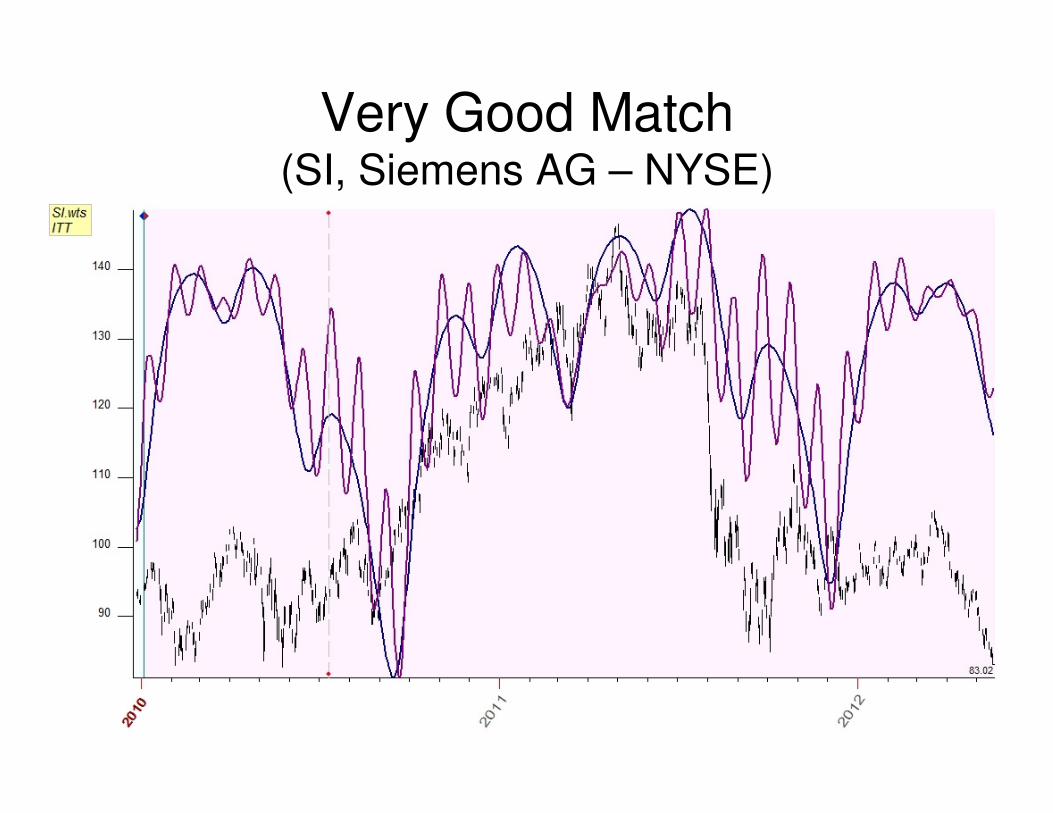
Very Good Match(SI, Siemens AG – NYSE)
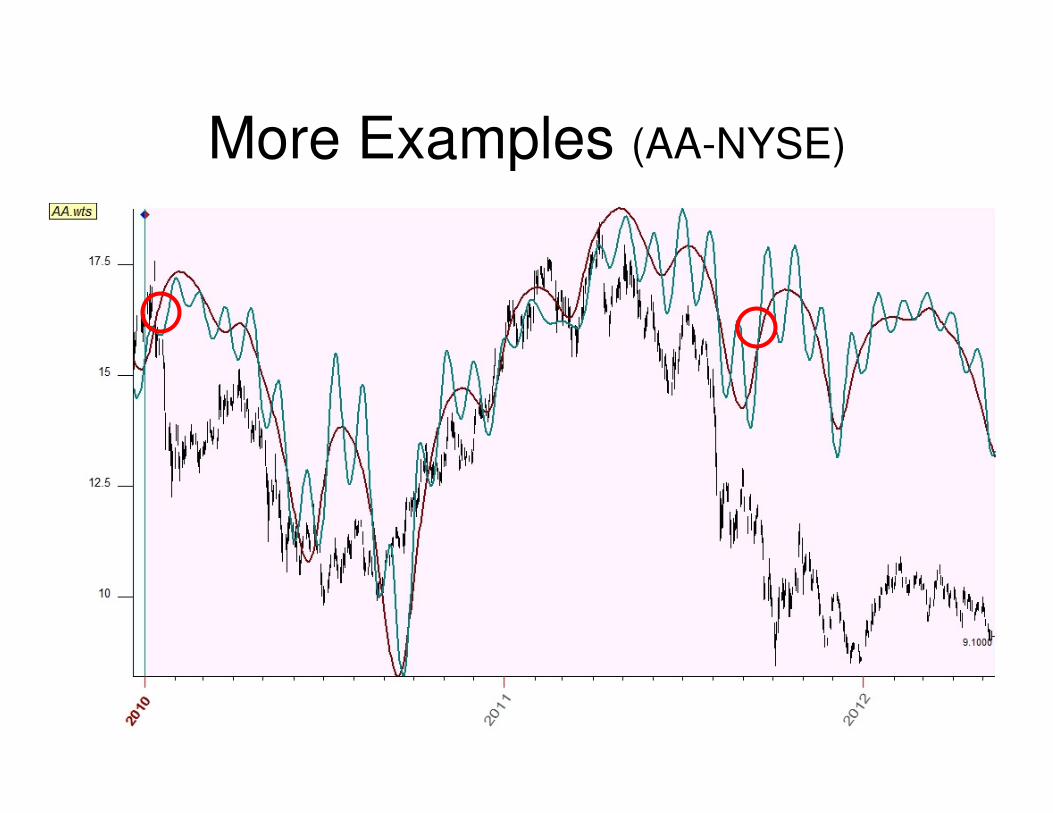
More Examples (AA-NYSE)
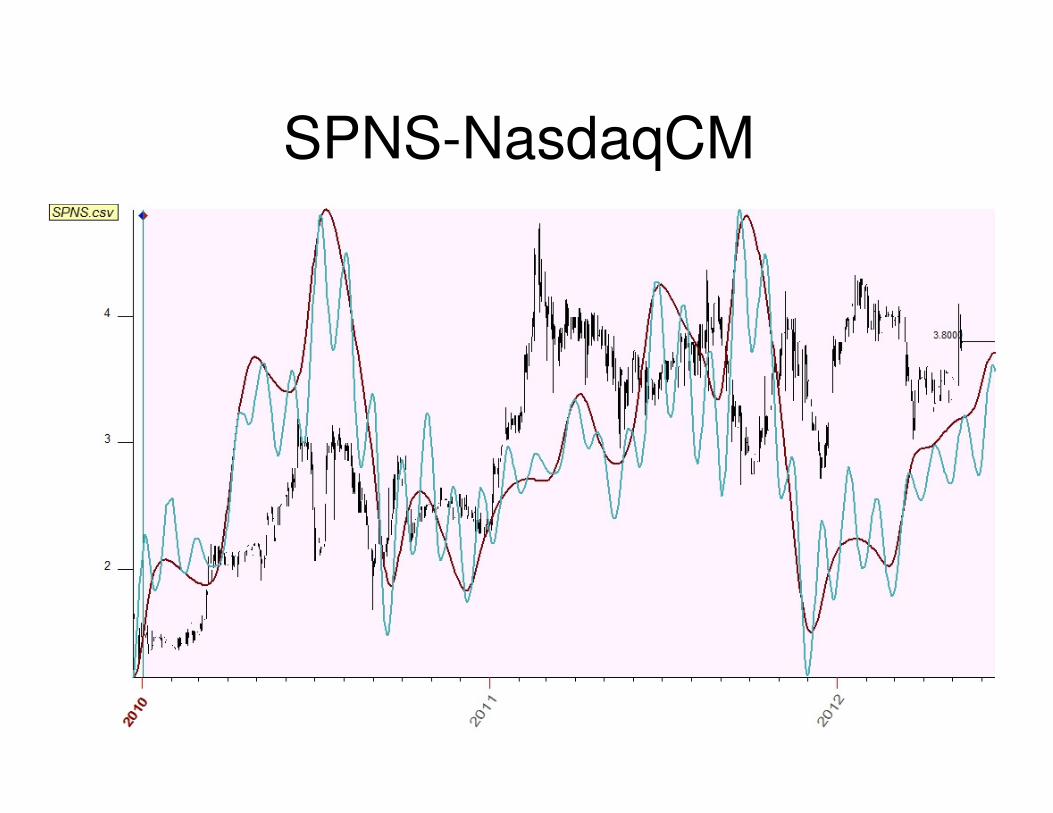
SPNS-NasdaqCM
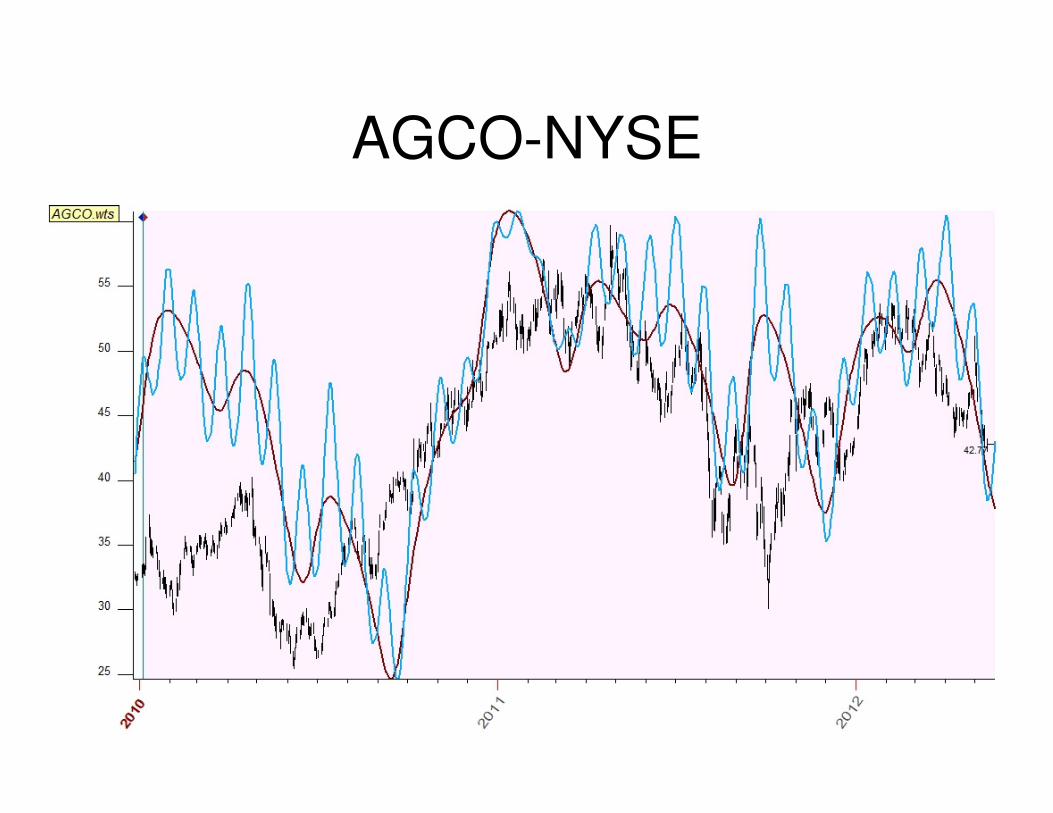
AGCO-NYSE
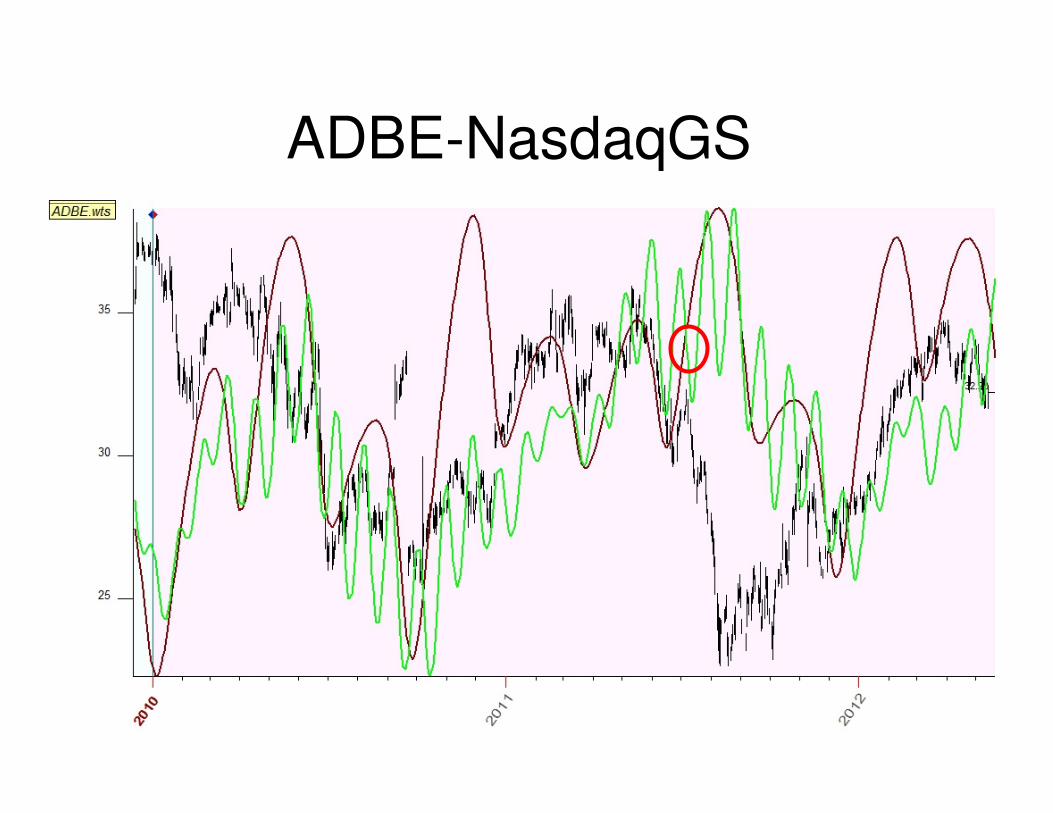
ADBE-NasdaqGS
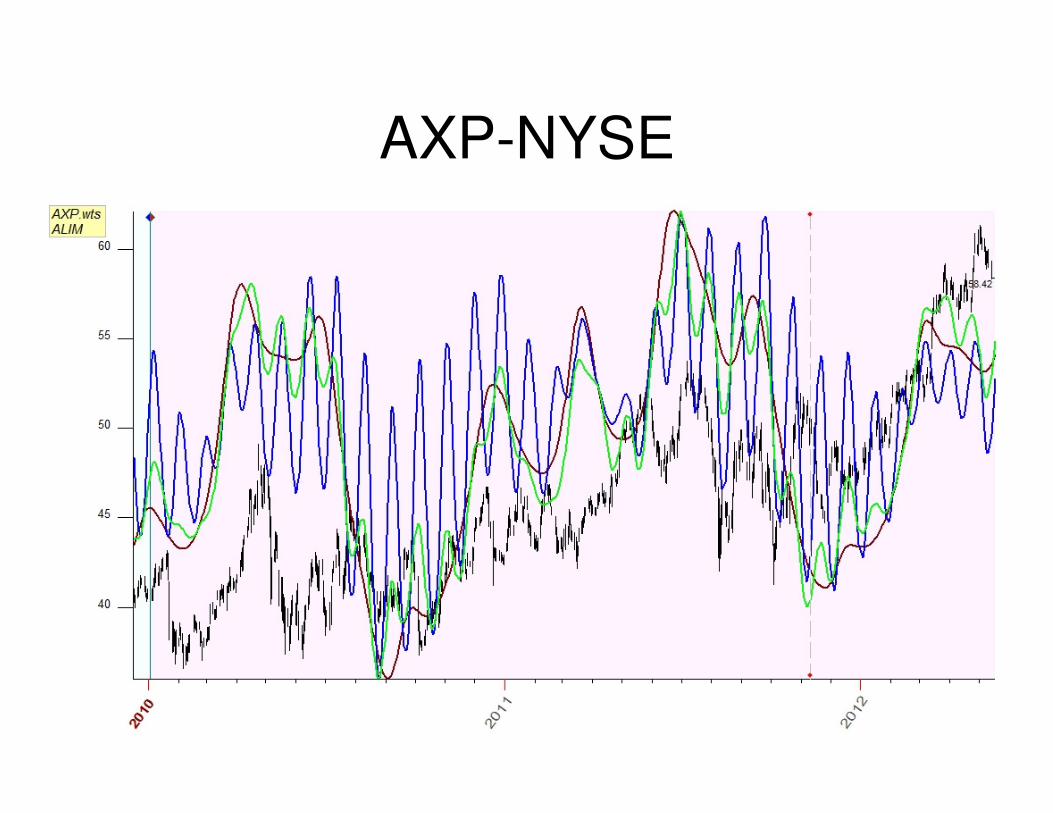
AXP-NYSE
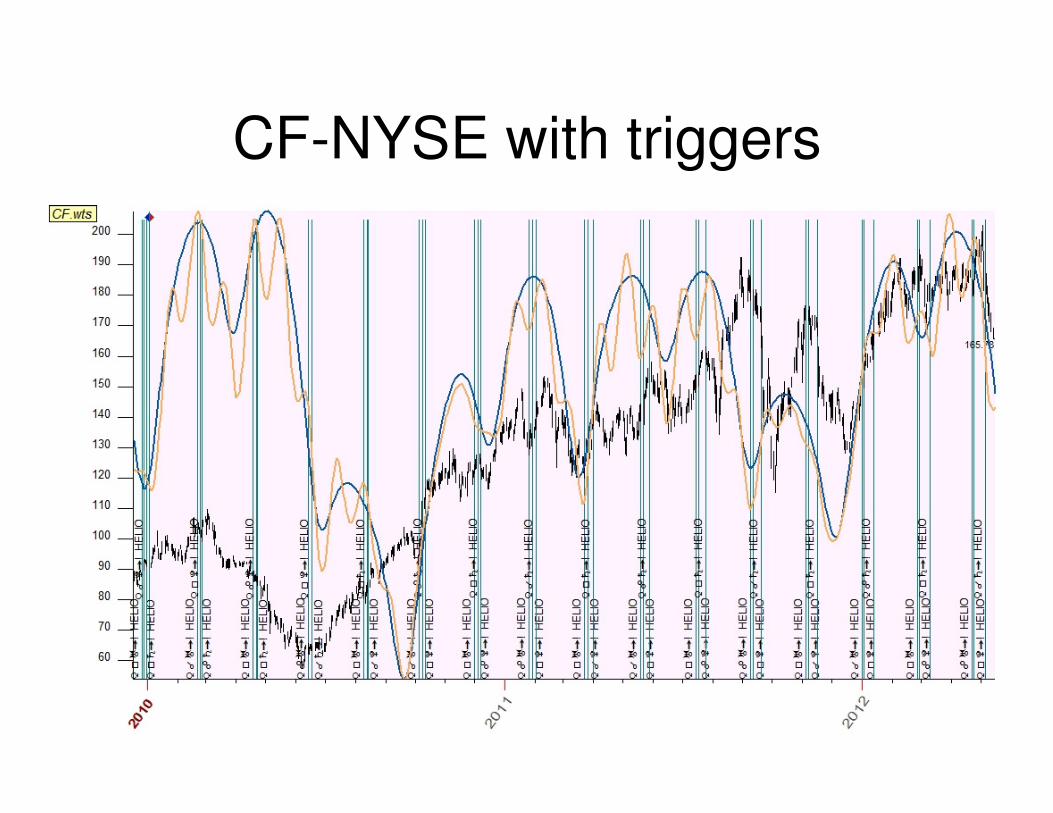
CF-NYSE with triggers
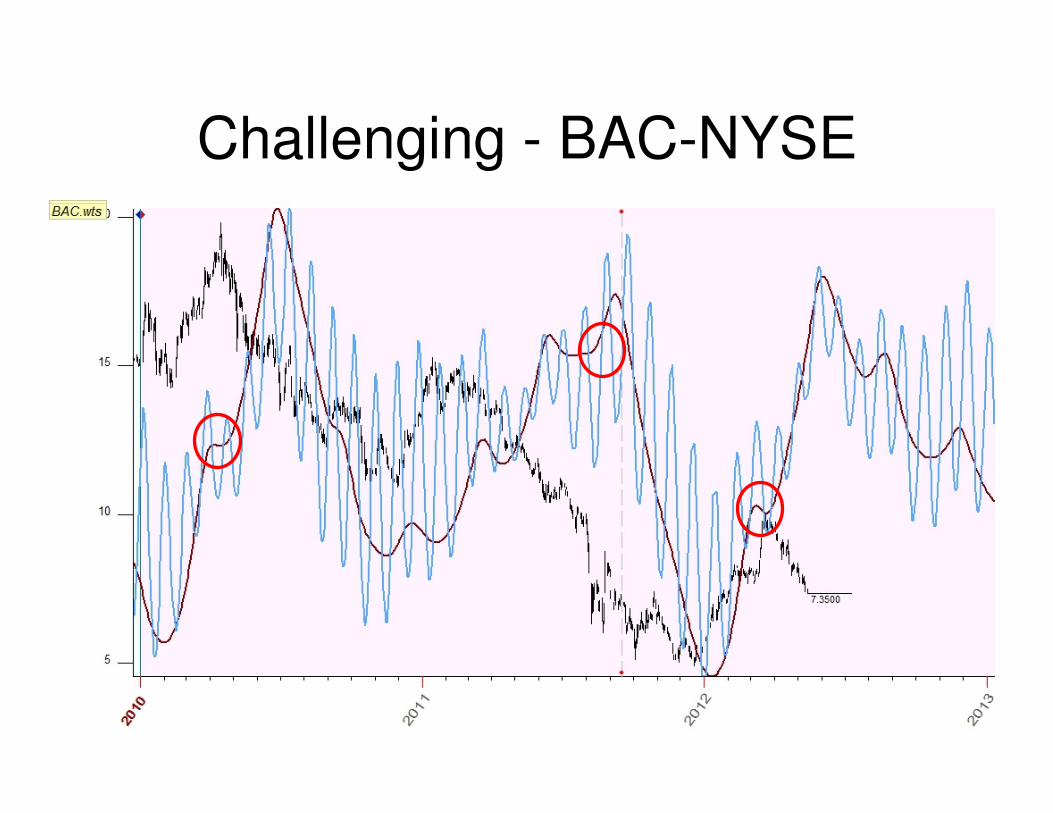
Challenging - BAC-NYSE
Contact
Alon Avramson
Business Analyst, FAME
Forecast Astrology Models Engineering
Website: http://wp.me/1E30P
Email: [email protected]


![[Astrology] Christine Shaw - Predictive Astrology](https://img.pdfslide.net/doc/110x75/55cf8ed9550346703b96468b/astrology-christine-shaw-predictive-astrology-56747d30352a9.jpg)