Embed Size (px)
Citation preview
Financial census of municipalities: 2016
Dr Pali Lehohla
28 June 2017
@StatsSA
#StatsSA
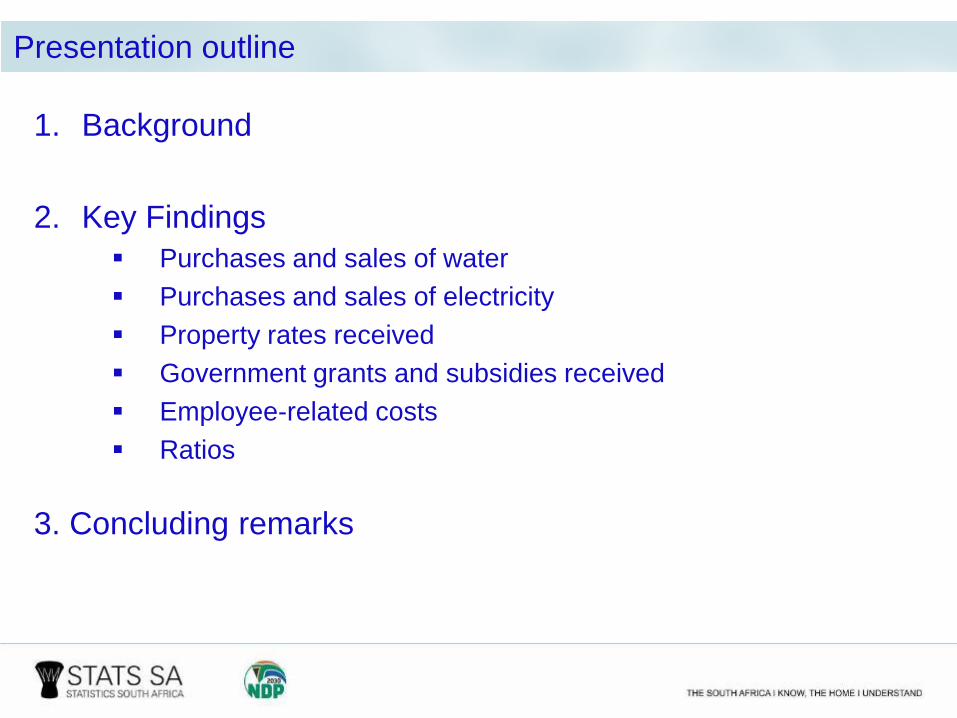
1. Background
2. Key Findings
Purchases and sales of water
Purchases and sales of electricity
Property rates received
Government grants and subsidies received
Employee-related costs
Ratios
3. Concluding remarks
Presentation outline
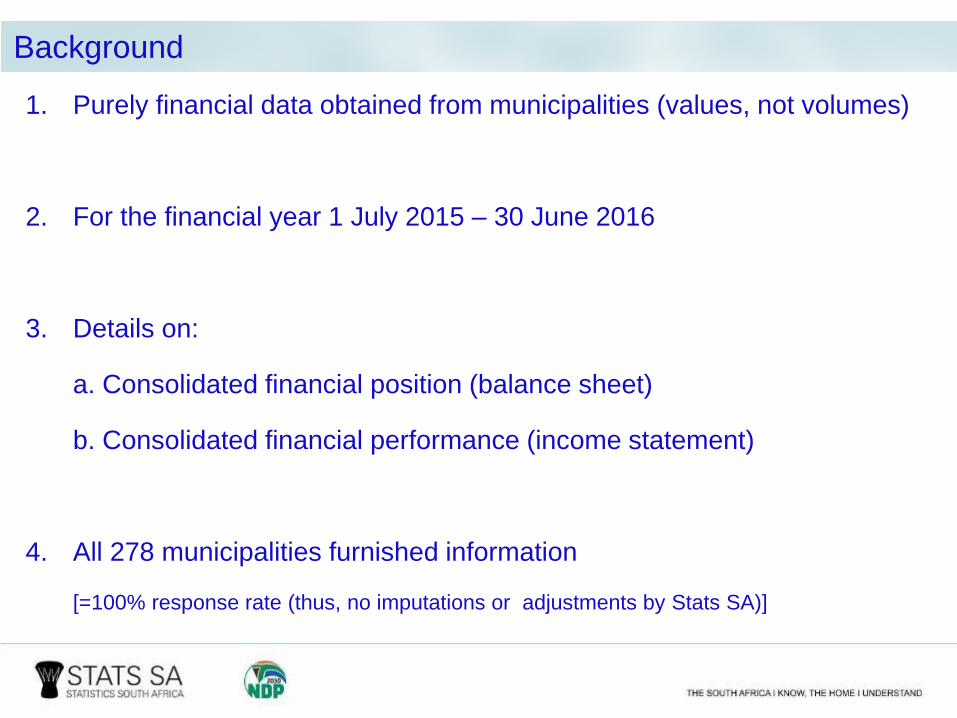
1. Purely financial data obtained from municipalities (values, not volumes)
2. For the financial year 1 July 2015 – 30 June 2016
3. Details on:
a. Consolidated financial position (balance sheet)
b. Consolidated financial performance (income statement)
4. All 278 municipalities furnished information
[=100% response rate (thus, no imputations or adjustments by Stats SA)]
Background
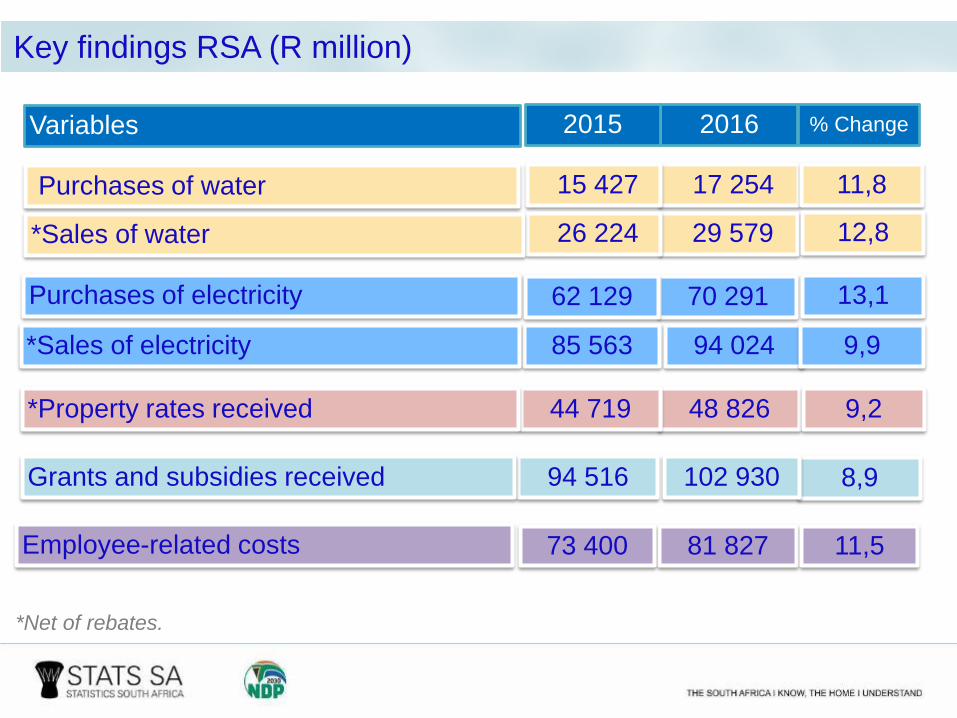
70 291
94 024
62 129
85 563
13,1
9,9
Purchases of electricity
*Sales of electricity
81 82773 400 11,5Employee-related costs
20162015 % ChangeVariables
17 254 11,815 427Purchases of water
29 579 12,826 224*Sales of water
8,9102 93094 516Grants and subsidies received
48 82644 719 9,2*Property rates received
*Net of rebates.
Key findings RSA (R million)
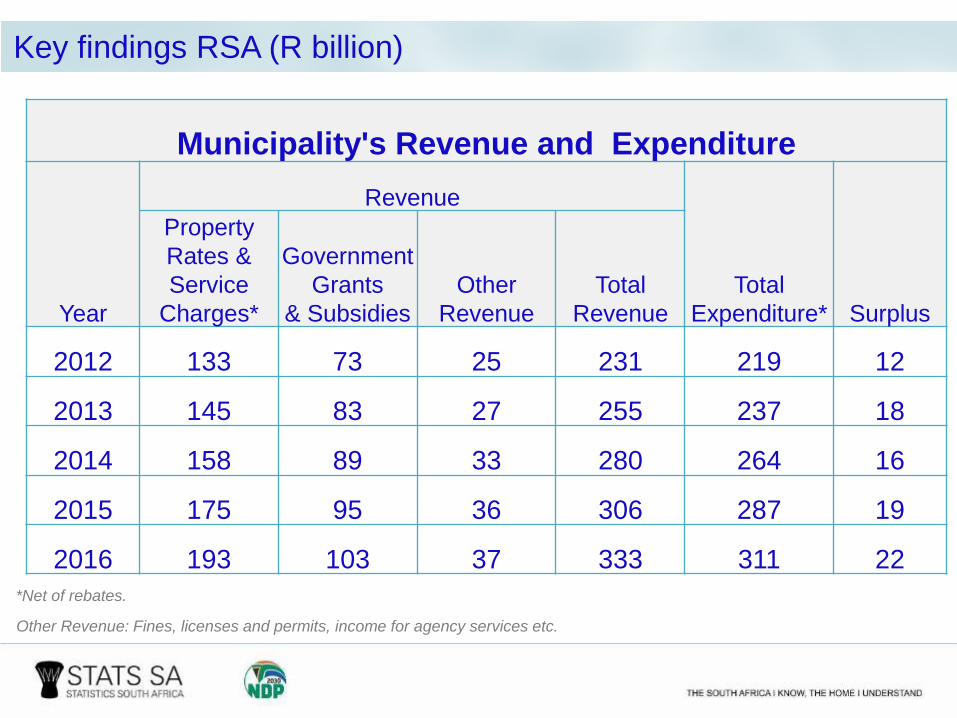
Municipality's Revenue and Expenditure
Year
Revenue
Total
Expenditure* Surplus
Property
Rates &
Service
Charges*
Government
Grants
& Subsidies
Other
Revenue
Total
Revenue
2012 133 73 25 231 219 12
2013 145 83 27 255 237 18
2014 158 89 33 280 264 16
2015 175 95 36 306 287 19
2016 193 103 37 333 311 22
Other Revenue: Fines, licenses and permits, income for agency services etc.
*Net of rebates.
Key findings RSA (R billion)
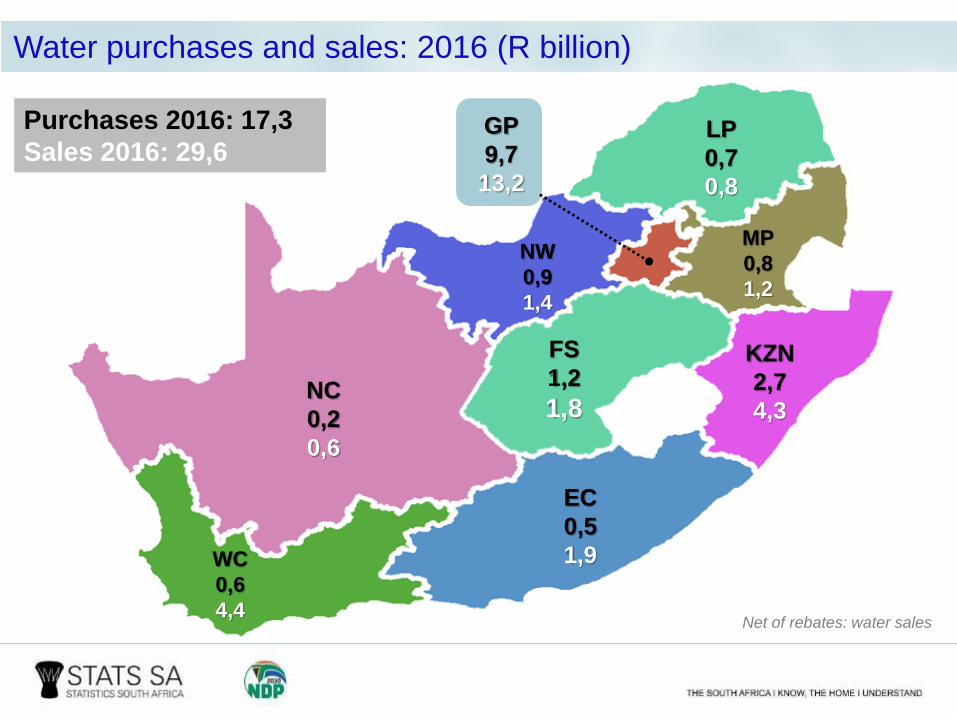
Purchases of water and electricity
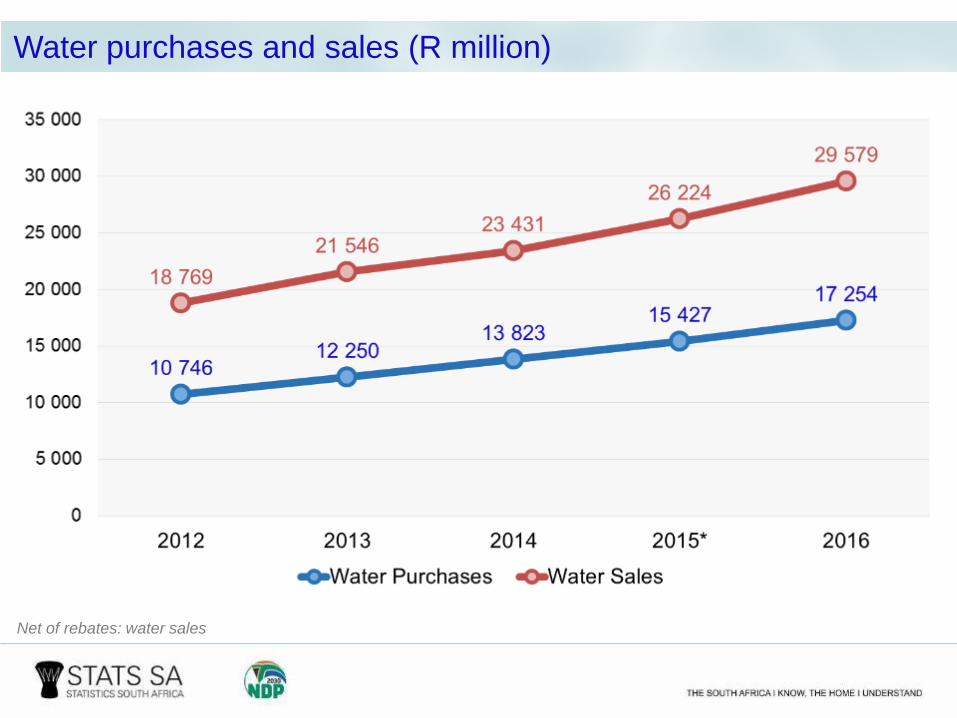
Net of rebates: water sales
Water purchases and sales (R million)
WC
0,6
4,4
EC
0,5
1,9
NC
0,2
0,6
FS
1,2
1,8
KZN
2,7
4,3
NW
0,9
1,4
MP
0,8
1,2
GP
9,7
13,2
LP
0,7
0,8
Purchases 2016: 17,3
Sales 2016: 29,6
Water purchases and sales: 2016 (R billion)
Net of rebates: water sales
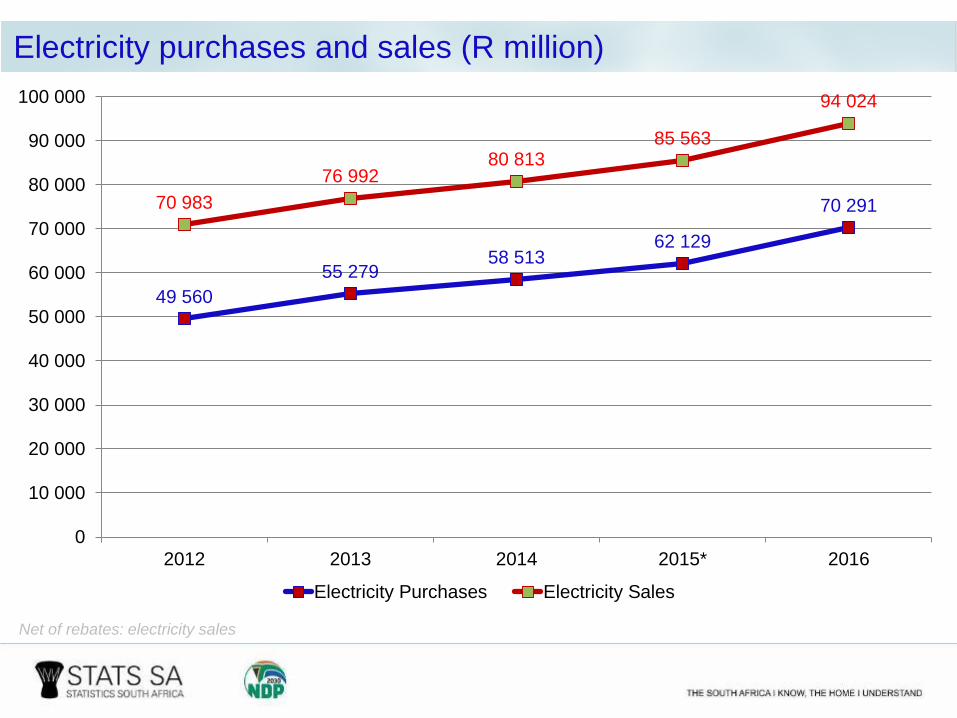
Net of rebates: electricity sales
Electricity purchases and sales (R million)
49 560
55 27958 513
62 129
70 29170 983
76 99280 813
85 563
94 024
0
10 000
20 000
30 000
40 000
50 000
60 000
70 000
80 000
90 000
100 000
2012 2013 2014 2015* 2016
Electricity Purchases Electricity Sales
WC
11,3
16,2
EC
5,2
6,6
NC
1,2
1,6
FS
3,5
3,8
NW
3,2
3,8
MP
3,3
3,5
GP
28,6
39,0LP
1,9
2,5
KZN
12,1
17,0
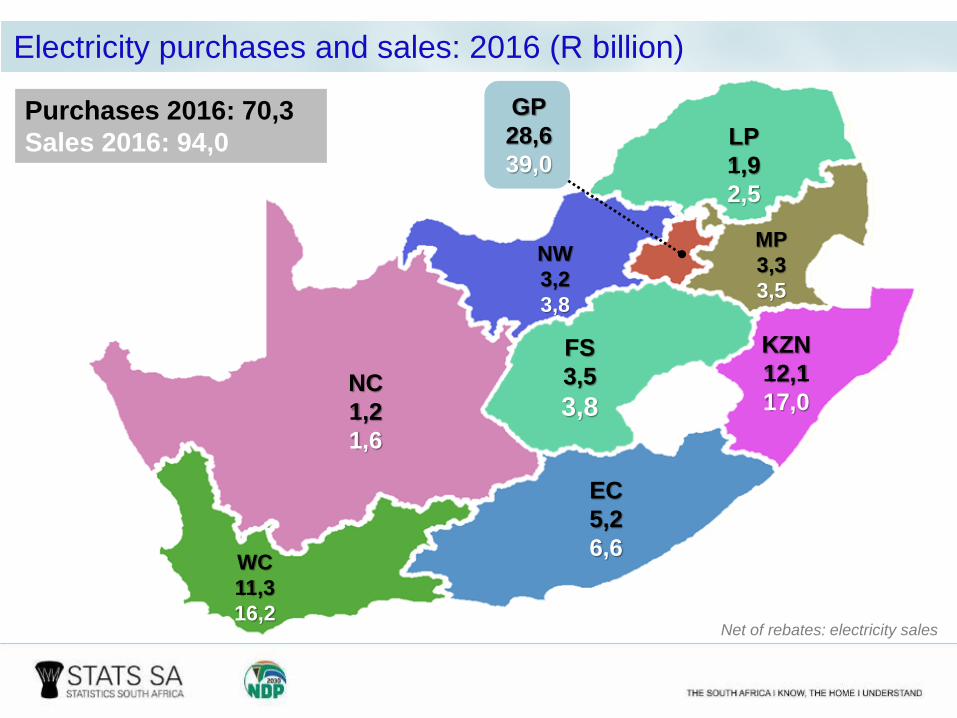
Purchases 2016: 70,3
Sales 2016: 94,0
Electricity purchases and sales: 2016 (R billion)
Net of rebates: electricity sales
Expenditure performance of municipalities
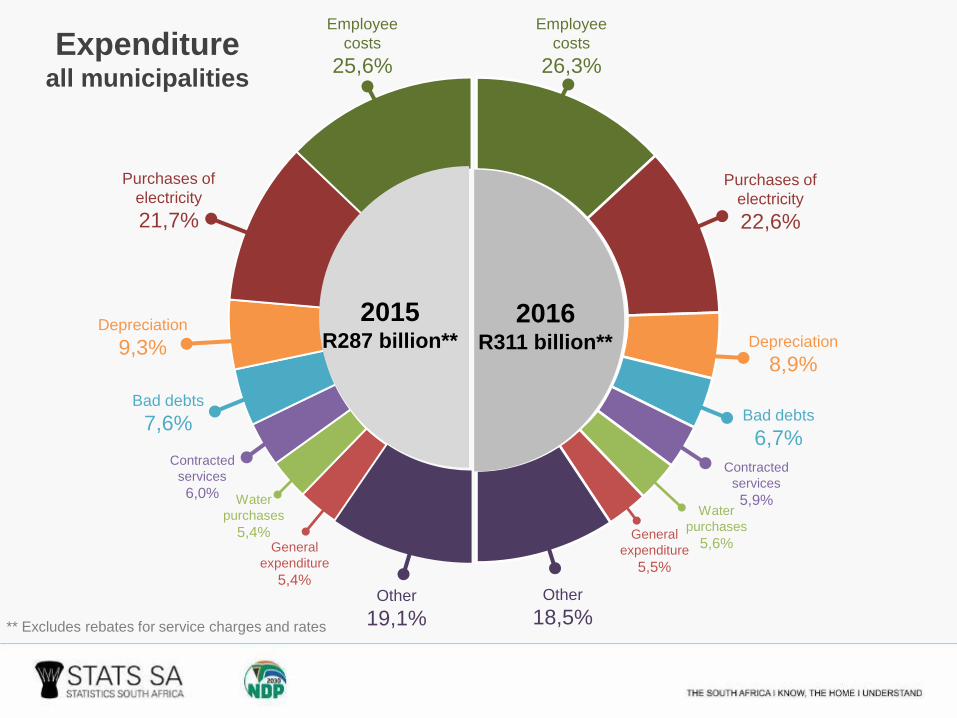
2016R311 billion**
2015R287 billion**
Employee
costs
25,6%
Purchases of
electricity
21,7%
Other
19,1%
Depreciation
9,3%
Water
purchases
5,4%
Contracted
services
6,0%
Bad debts
7,6%
Employee
costs
26,3%
Purchases of
electricity
22,6%
Bad debts
6,7%
Water
purchases
5,6%
Contracted
services
5,9%
Other
18,5%
Depreciation
8,9%
General
expenditure
5,4%
General
expenditure
5,5%
Expenditureall municipalities
** Excludes rebates for service charges and rates
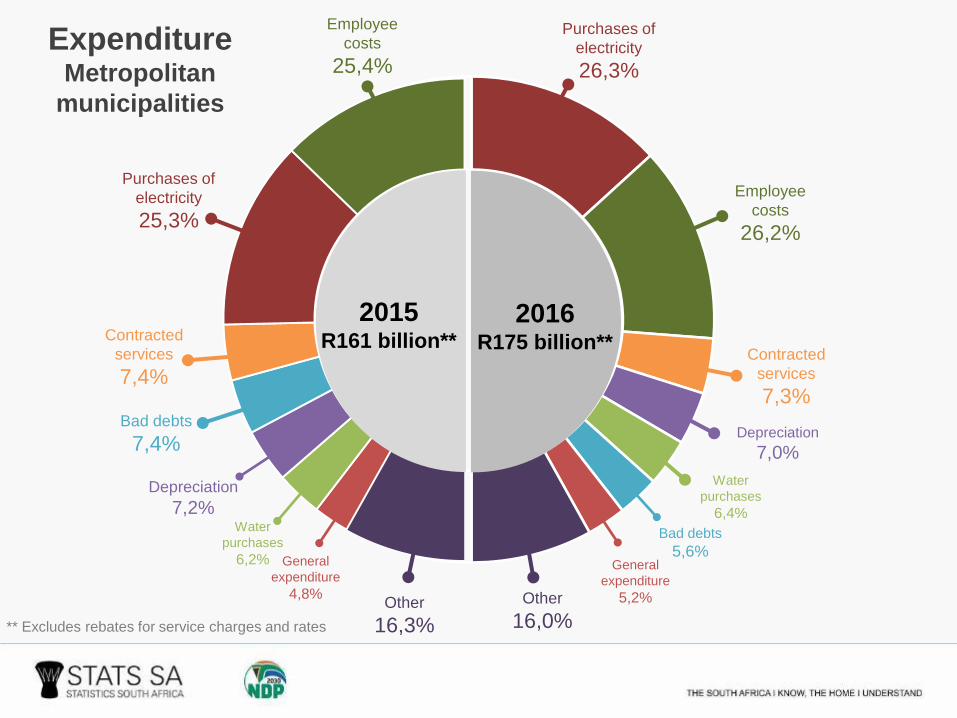
2016R175 billion**
2015R161 billion**
Employee
costs
25,4%
Purchases of
electricity
25,3%
Other
16,3%
Depreciation
7,2%Water
purchases
6,2%
Contracted
services
7,4%
Bad debts
7,4%
Employee
costs
26,2%
Purchases of
electricity
26,3%
Contracted
services
7,3%
Depreciation
7,0%
Water
purchases
6,4%
Bad debts
5,6%
Other
16,0%
General
expenditure
4,8%
General
expenditure
5,2%
ExpenditureMetropolitan
municipalities
** Excludes rebates for service charges and rates
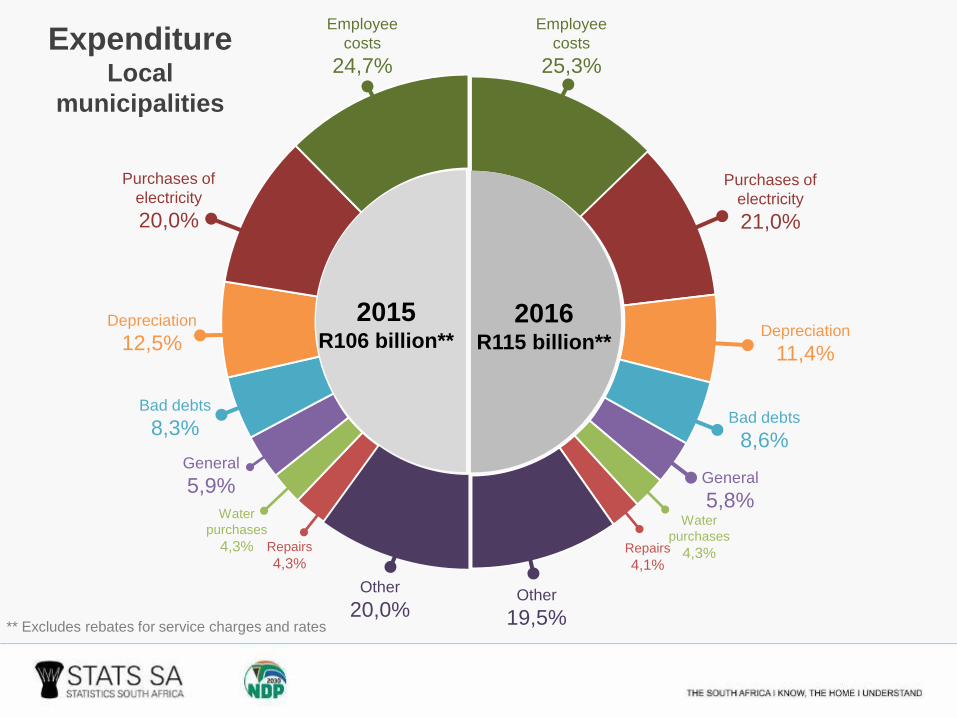
2016R115 billion**
2015R106 billion**
Employee
costs
24,7%
Purchases of
electricity
20,0%
Other
20,0%
Water
purchases
4,3% Repairs
4,3%
Bad debts
8,3%
Depreciation
12,5%
Employee
costs
25,3%
Purchases of
electricity
21,0%
General
5,9%
Depreciation
11,4%
Bad debts
8,6%
General
5,8%Water
purchases
4,3%Repairs
4,1%
Other
19,5%
ExpenditureLocal
municipalities
** Excludes rebates for service charges and rates
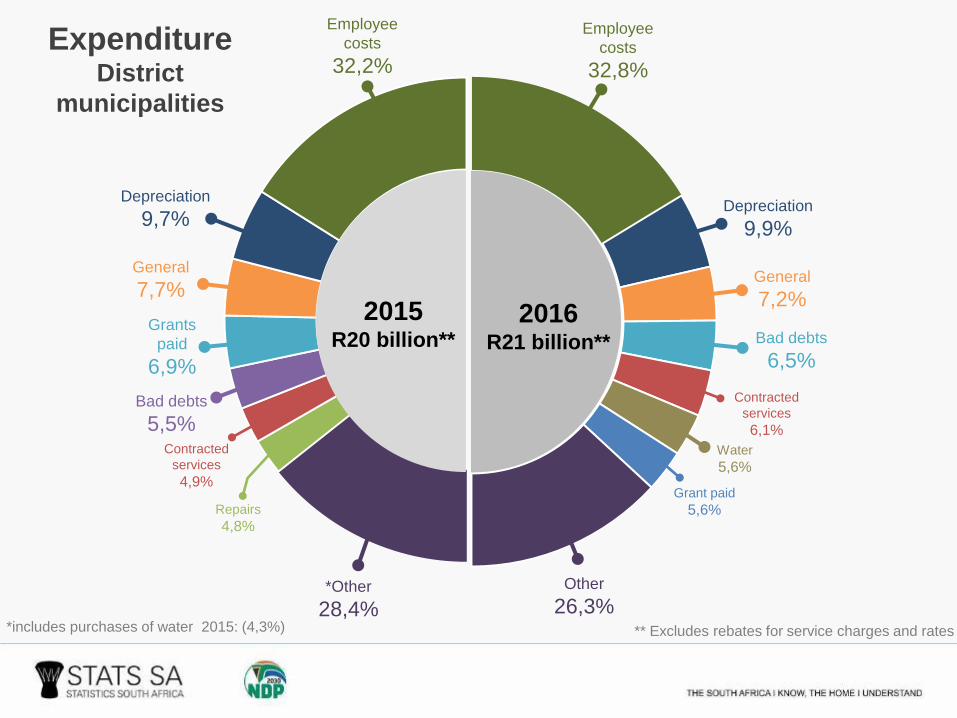
2016R21 billion**
2015R20 billion**
Employee
costs
32,2%
General
7,7%
*Other
28,4%
Depreciation
9,7%
Contracted
services
4,9%
Grants
paid
6,9%
Bad debts
5,5%
Repairs
4,8%
Other
26,3%
Employee
costs
32,8%
General
7,2%
Depreciation
9,9%
Bad debts
6,5%
Contracted
services
6,1%
Water
5,6%
Grant paid
5,6%
ExpenditureDistrict
municipalities
*includes purchases of water 2015: (4,3%) ** Excludes rebates for service charges and rates
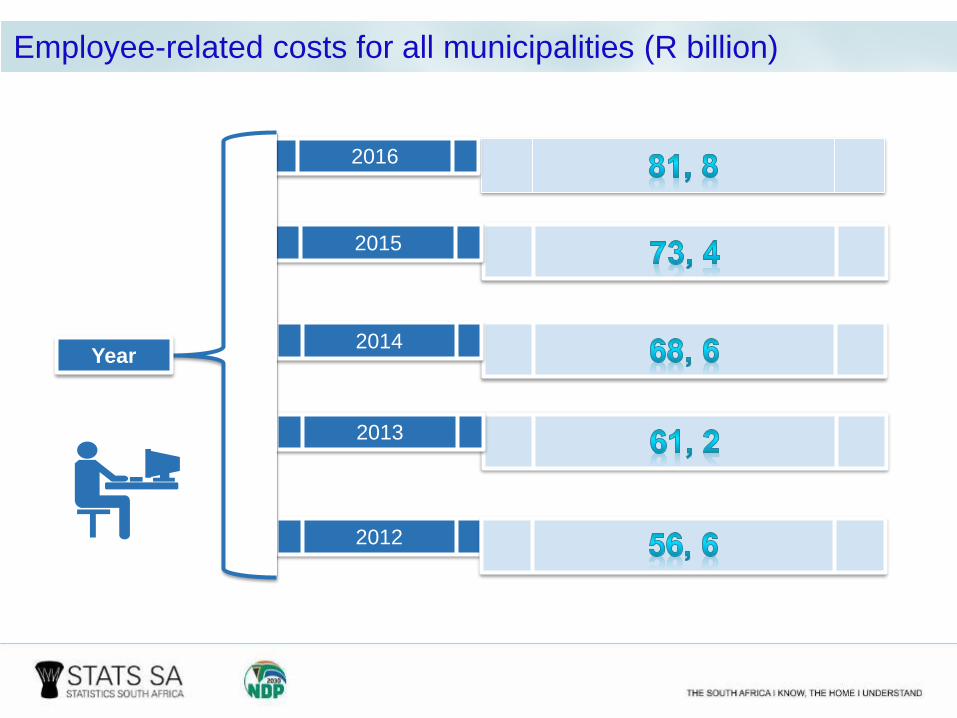
2016
2015
2014
2013
2012
Year
Employee-related costs for all municipalities (R billion)
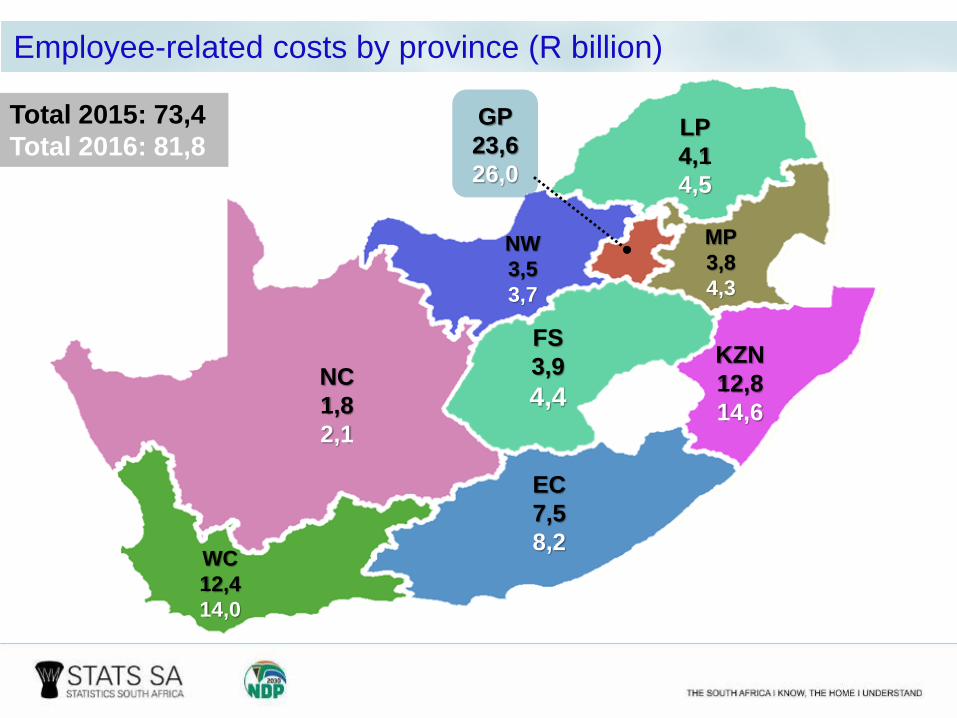
WC
12,4
14,0
EC
7,5
8,2
NC
1,8
2,1
FS
3,9
4,4
KZN
12,8
14,6
NW
3,5
3,7
MP
3,8
4,3
GP
23,6
26,0
LP
4,1
4,5
Total 2015: 73,4
Total 2016: 81,8
Employee-related costs by province (R billion)
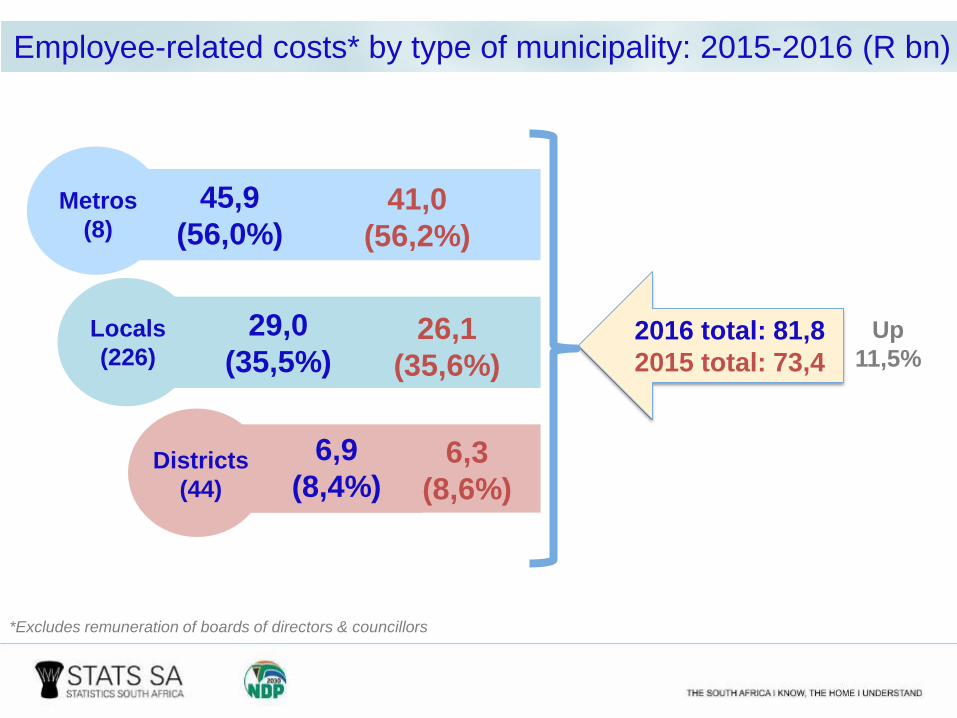
45,9
(56,0%)
6,9
(8,4%)
Metros
(8)
Districts
(44)
41,0
(56,2%)
6,3
(8,6%)
*Excludes remuneration of boards of directors & councillors
29,0
(35,5%)26,1
(35,6%)
2016 total: 81,8
2015 total: 73,4
Employee-related costs* by type of municipality: 2015-2016 (R bn)
Locals
(226)Up
11,5%
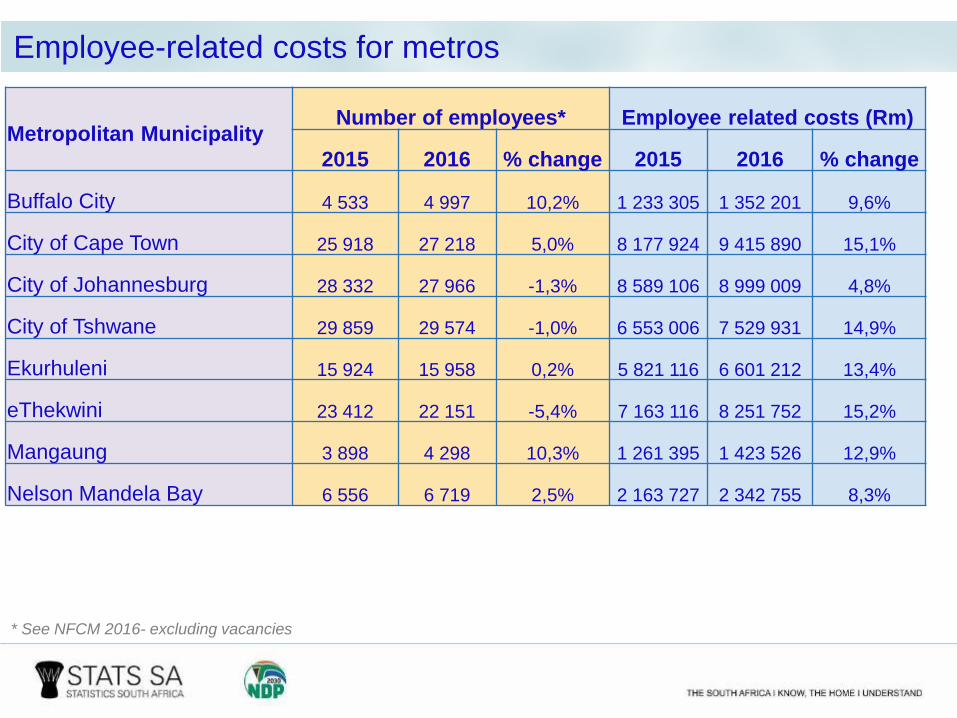
Metropolitan MunicipalityNumber of employees* Employee related costs (Rm)
2015 2016 % change 2015 2016 % change
Buffalo City 4 533 4 997 10,2% 1 233 305 1 352 201 9,6%
City of Cape Town 25 918 27 218 5,0% 8 177 924 9 415 890 15,1%
City of Johannesburg 28 332 27 966 -1,3% 8 589 106 8 999 009 4,8%
City of Tshwane 29 859 29 574 -1,0% 6 553 006 7 529 931 14,9%
Ekurhuleni 15 924 15 958 0,2% 5 821 116 6 601 212 13,4%
eThekwini 23 412 22 151 -5,4% 7 163 116 8 251 752 15,2%
Mangaung 3 898 4 298 10,3% 1 261 395 1 423 526 12,9%
Nelson Mandela Bay 6 556 6 719 2,5% 2 163 727 2 342 755 8,3%
* See NFCM 2016- excluding vacancies
Employee-related costs for metros
Revenue performance of municipalities
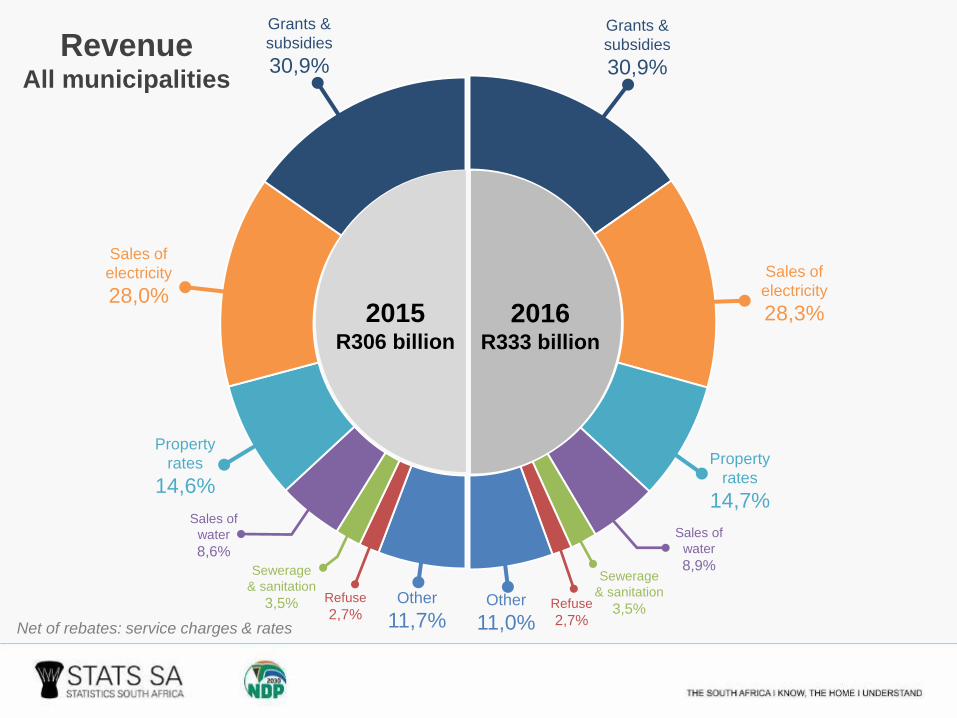
2016R333 billion
2015R306 billion
Sewerage
& sanitation
3,5%
Sales of
electricity
28,0%
Grants &
subsidies
30,9%
Property
rates
14,6%
Sales of
water
8,6%
Other
11,7%
Refuse
2,7%
Grants &
subsidies
30,9%
Sales of
electricity
28,3%
Property
rates
14,7%
Sales of
water
8,9%Sewerage
& sanitation
3,5%Refuse
2,7%
Other
11,0%
RevenueAll municipalities
Net of rebates: service charges & rates
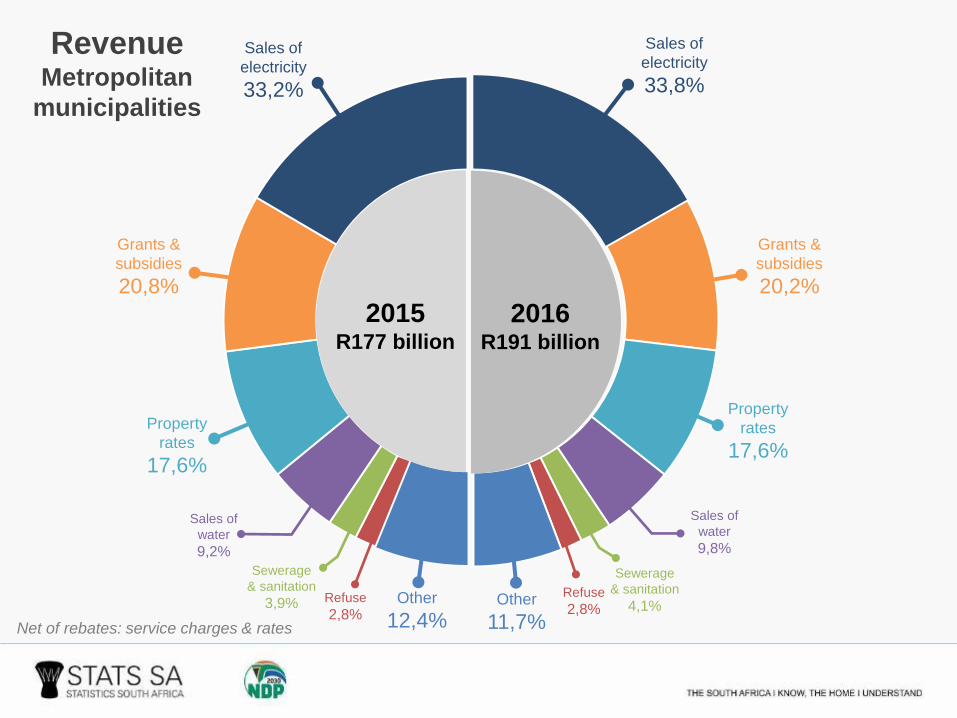
2016R191 billion
2015R177 billion
Sewerage
& sanitation
3,9%
Sales of
electricity
33,2%
Grants &
subsidies
20,8%
Property
rates
17,6%
Sales of
water
9,2%
Other
12,4%
Refuse
2,8%
Sales of
electricity
33,8%
Grants &
subsidies
20,2%
Property
rates
17,6%
Sales of
water
9,8%
Sewerage
& sanitation
4,1%Refuse
2,8%Other
11,7%
RevenueMetropolitan
municipalities
Net of rebates: service charges & rates
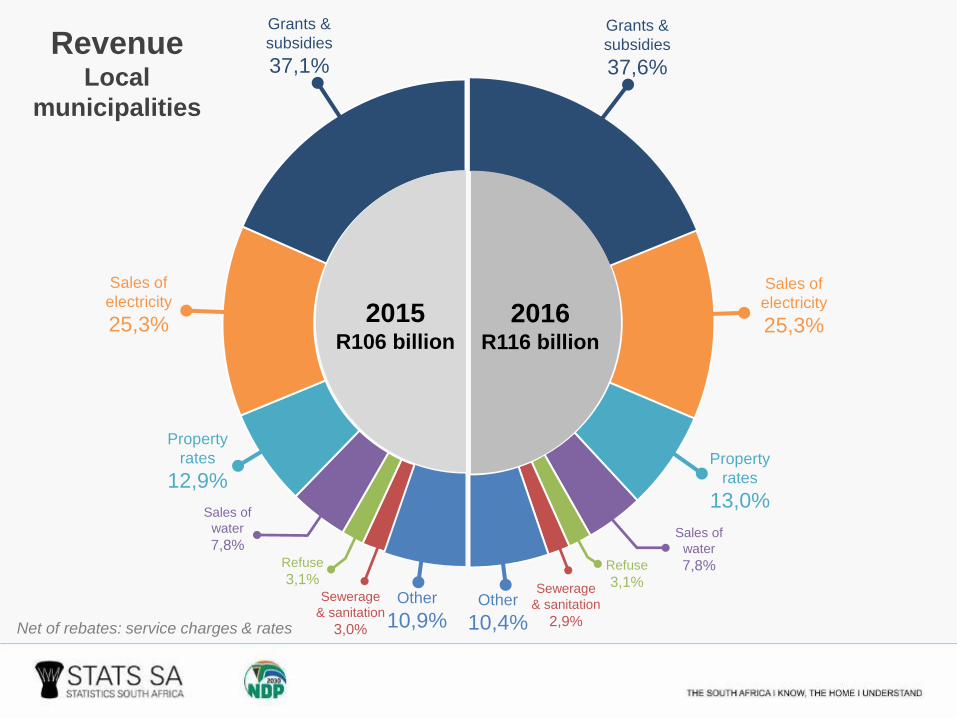
2016R116 billion
2015R106 billion
Sewerage
& sanitation
3,0%
Sales of
electricity
25,3%
Grants &
subsidies
37,1%
Property
rates
12,9%
Sales of
water
7,8%
Other
10,9%
Refuse
3,1%
Grants &
subsidies
37,6%
Sales of
electricity
25,3%
Property
rates
13,0%
Sales of
water
7,8%
Sewerage
& sanitation
2,9%
Refuse
3,1%
Other
10,4%
RevenueLocal
municipalities
Net of rebates: service charges & rates
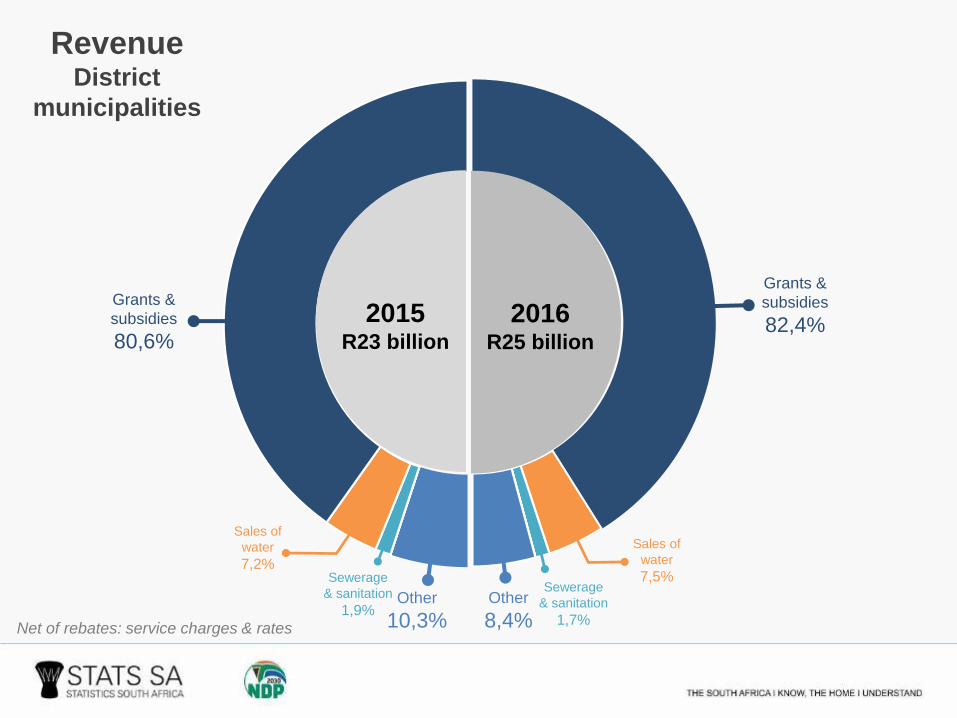
2016R25 billion
2015R23 billion
Sewerage
& sanitation
1,9%
Grants &
subsidies
80,6%
Sales of
water
7,2%
Other
10,3%
Grants &
subsidies
82,4%
Sales of
water
7,5%Sewerage
& sanitation
1,7%
Other
8,4%
RevenueDistrict
municipalities
Net of rebates: service charges & rates
Grants and subsidies are non-repayable funds or transfers by national,
provincial governments and other institutions to municipalities.
Two types of grants:
1. Conditional grants: can only be used for a specific purpose (e.g. MIG
for infrastructure development).
2. Unconditional grants: no specific purpose assigned to those (e.g.
equitable share).
* See MFMA
Grants and subsidies received
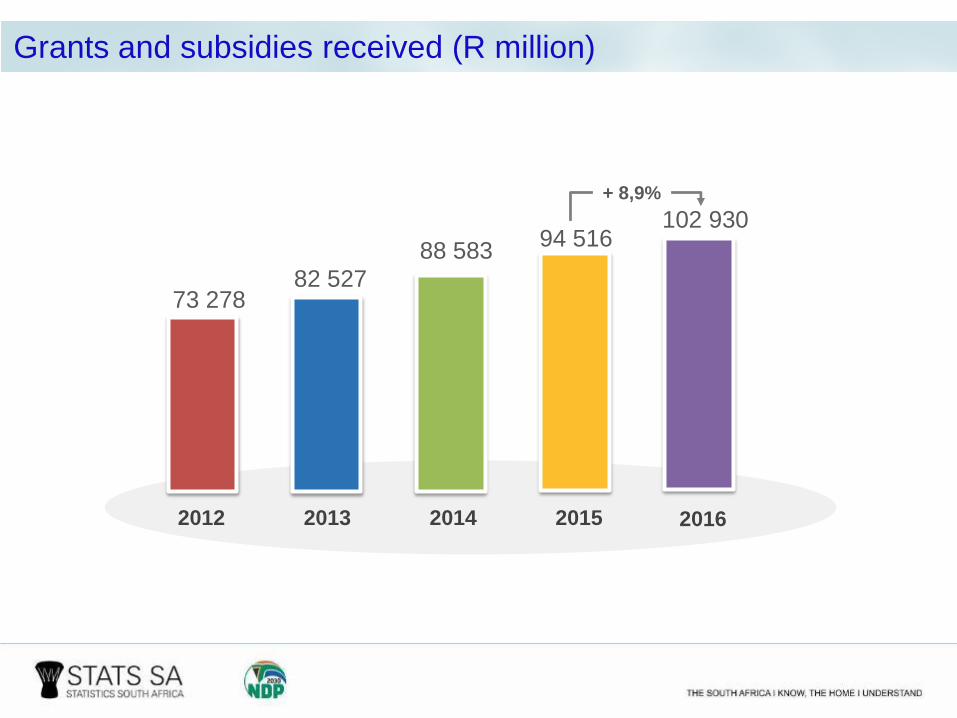
2012 2013 2014 2015
102 930
73 27882 527
88 58394 516
2016
Grants and subsidies received (R million)
+ 8,9%
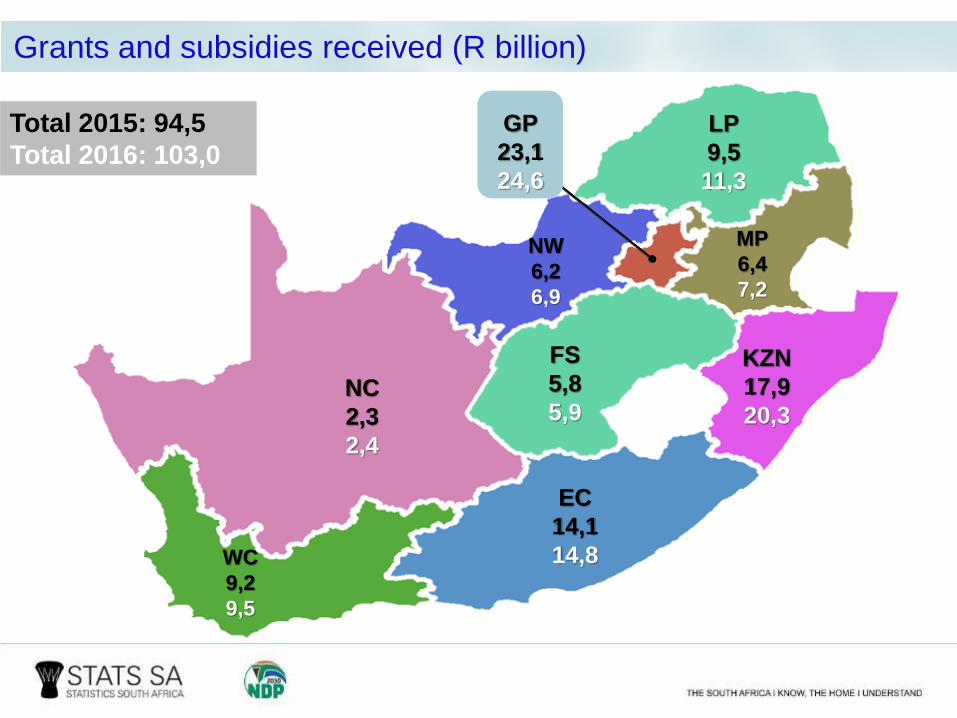
WC
9,2
9,5
EC
14,1
14,8
NC
2,3
2,4
FS
5,8
5,9
KZN
17,9
20,3
NW
6,2
6,9
MP
6,4
7,2
GP
23,1
24,6
LP
9,5
11,3
Grants and subsidies received (R billion)
Total 2015: 94,5
Total 2016: 103,0
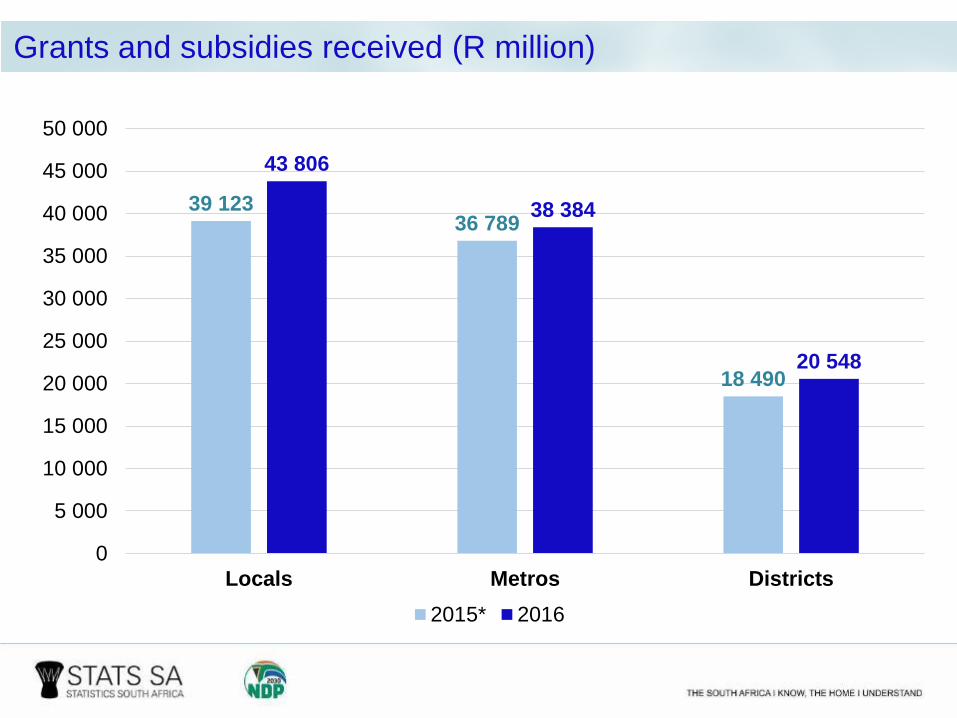
39 12336 789
18 490
43 806
38 384
20 548
0
5 000
10 000
15 000
20 000
25 000
30 000
35 000
40 000
45 000
50 000
Locals Metros Districts
2015* 2016
Grants and subsidies received (R million)
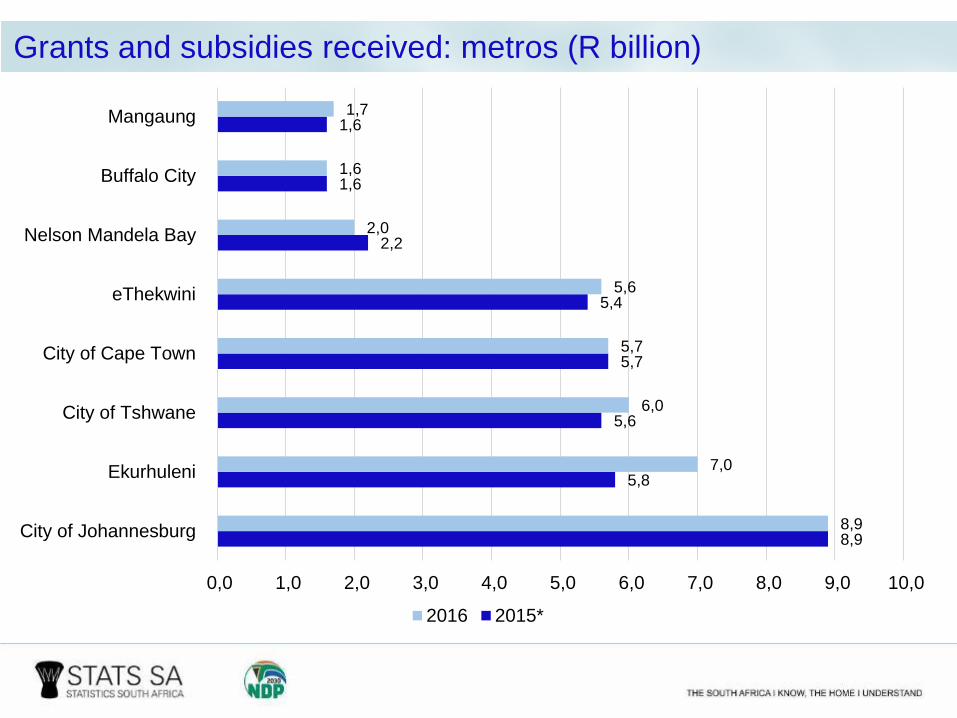
8,9
5,8
5,6
5,7
5,4
2,2
1,6
1,6
8,9
7,0
6,0
5,7
5,6
2,0
1,6
1,7
0,0 1,0 2,0 3,0 4,0 5,0 6,0 7,0 8,0 9,0 10,0
City of Johannesburg
Ekurhuleni
City of Tshwane
City of Cape Town
eThekwini
Nelson Mandela Bay
Buffalo City
Mangaung
2016 2015*
Grants and subsidies received: metros (R billion)
Consumer debtors and trade creditors
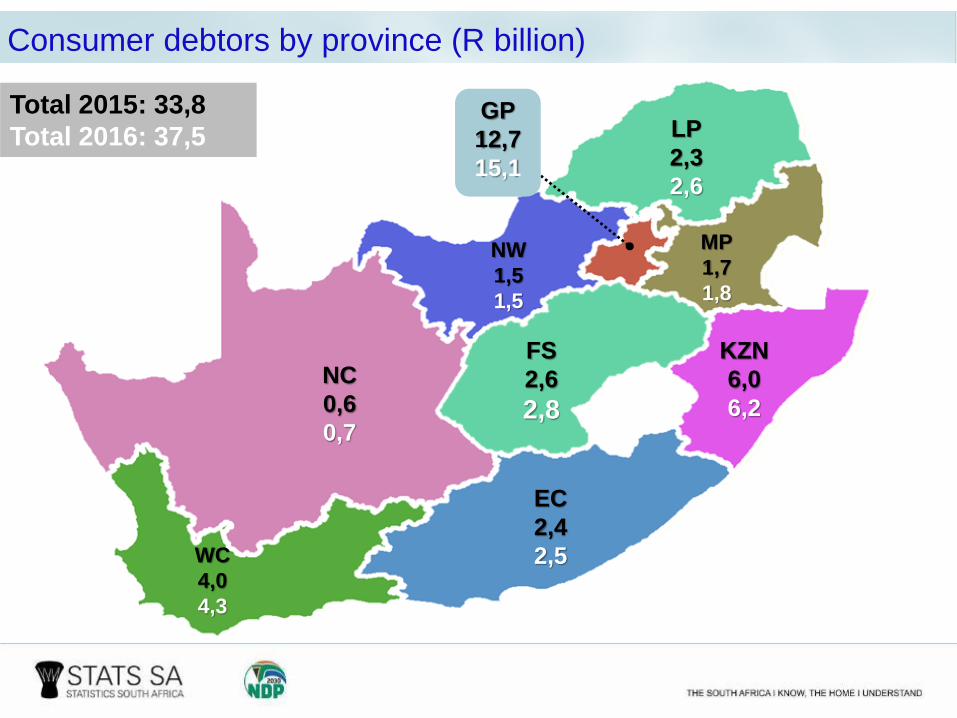
WC
4,0
4,3
EC
2,4
2,5
NC
0,6
0,7
FS
2,6
2,8
KZN
6,0
6,2
NW
1,5
1,5
MP
1,7
1,8
GP
12,7
15,1
LP
2,3
2,6
Total 2015: 33,8
Total 2016: 37,5
Consumer debtors by province (R billion)
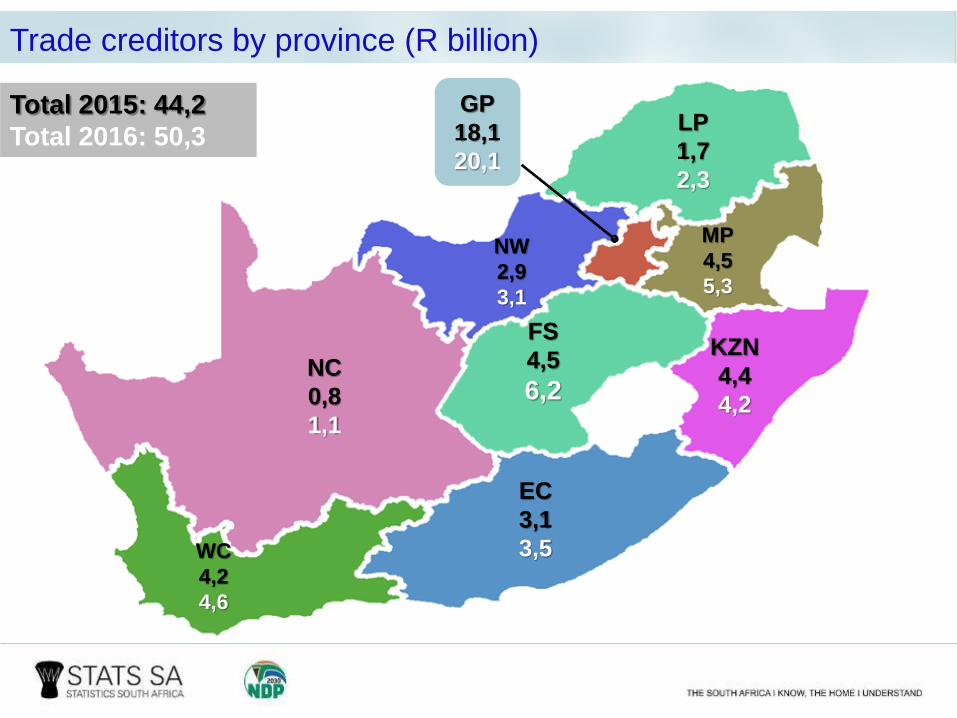
Total 2015: 44,2
Total 2016: 50,3
WC
4,2
4,6
EC
3,1
3,5
NC
0,8
1,1
FS
4,5
6,2
KZN
4,4
4,2
NW
2,9
3,1
MP
4,5
5,3
GP
18,1
20,1
LP
1,7
2,3
Trade creditors by province (R billion)
Municipal financial ratios: 2016
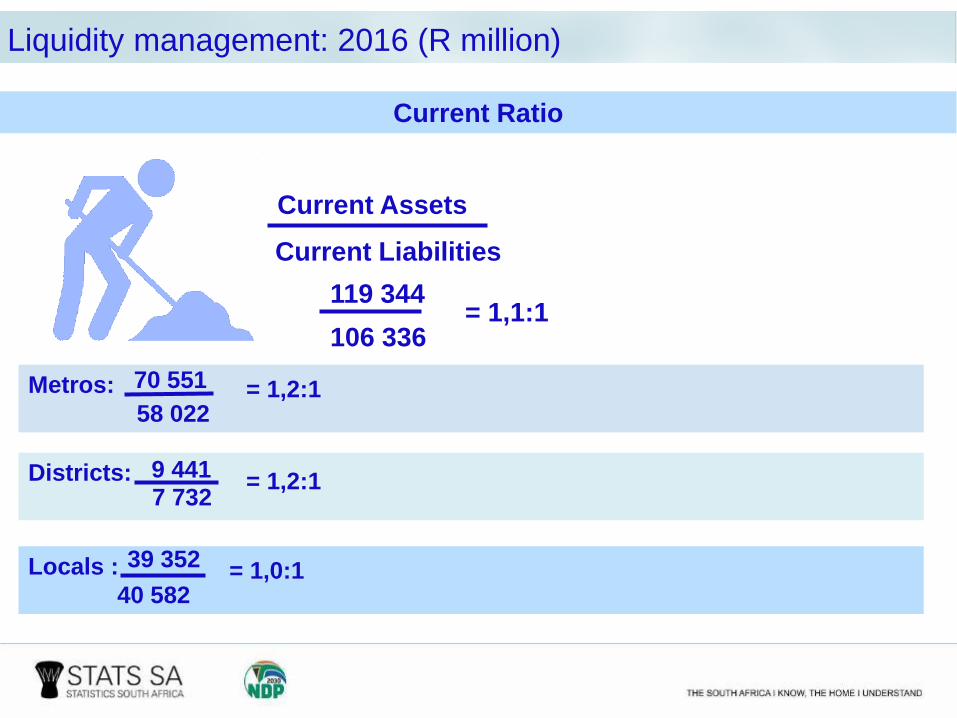
Locals :
Districts:
Metros:
Current Ratio
Current Liabilities
119 344
106 336 = 1,1:1
Current Assets
70 551
58 022= 1,2:1
9 4417 732
= 1,2:1
39 352
40 582= 1,0:1
Liquidity management: 2016 (R million)
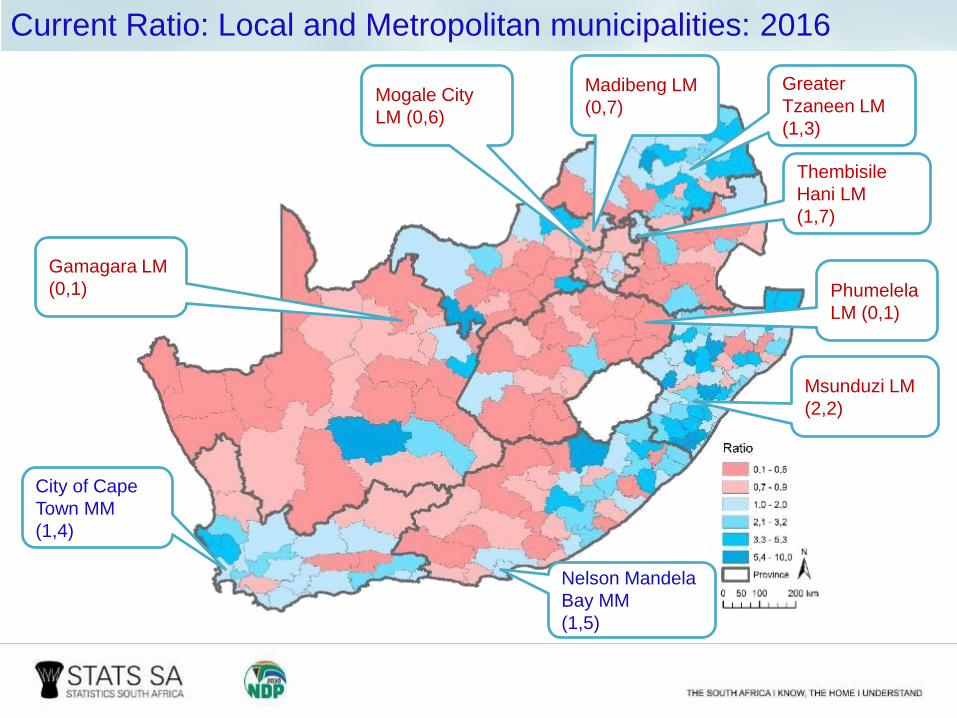
Greater
Tzaneen LM
(1,3)
Madibeng LM
(0,7)
Gamagara LM
(0,1)
Nelson Mandela
Bay MM
(1,5)
Phumelela
LM (0,1)
Msunduzi LM
(2,2)
City of Cape
Town MM
(1,4)
Thembisile
Hani LM
(1,7)
Mogale City
LM (0,6)
Current Ratio: Local and Metropolitan municipalities: 2016
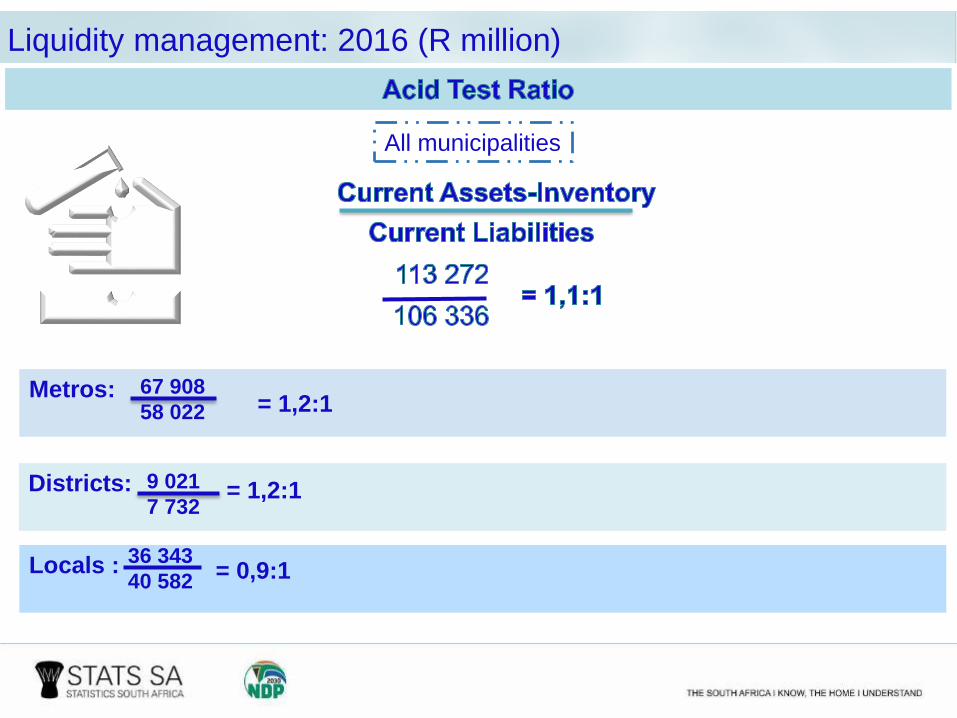
Locals :
Districts:
Metros:
9 021
7 732= 1,2:1
36 343
40 582 = 0,9:1
67 908
58 022 = 1,2:1
All municipalities
Liquidity management: 2016 (R million)
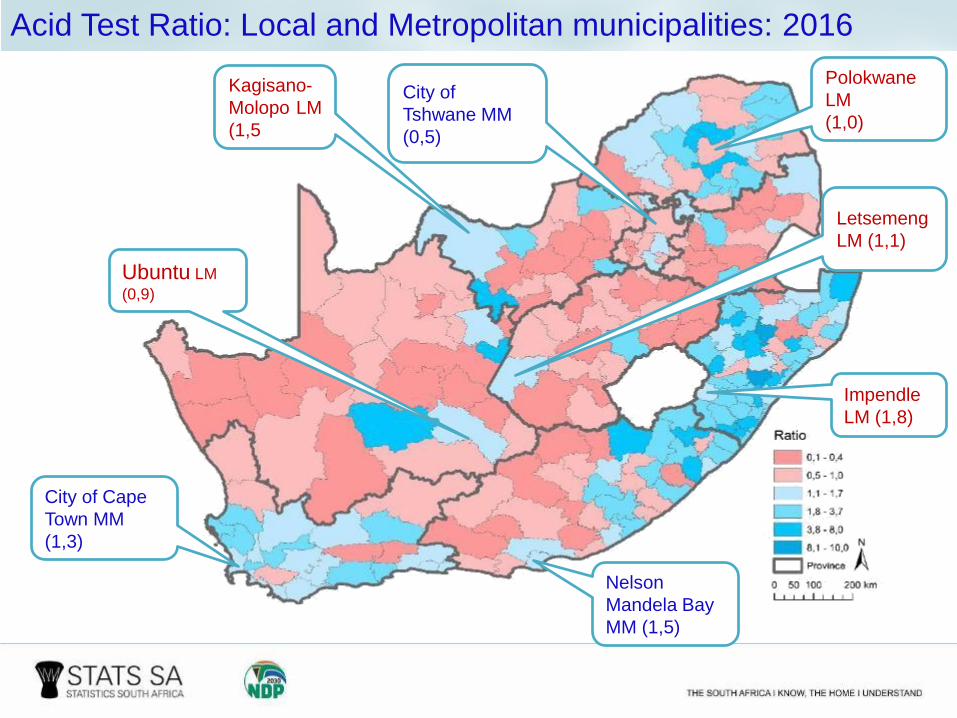
Nelson
Mandela Bay
MM (1,5)
City of
Tshwane MM
(0,5)
City of Cape
Town MM
(1,3)
Polokwane
LM
(1,0)
Letsemeng
LM (1,1)
Kagisano-
Molopo LM
(1,5
Ubuntu LM
(0,9)
Impendle
LM (1,8)
Acid Test Ratio: Local and Metropolitan municipalities: 2016
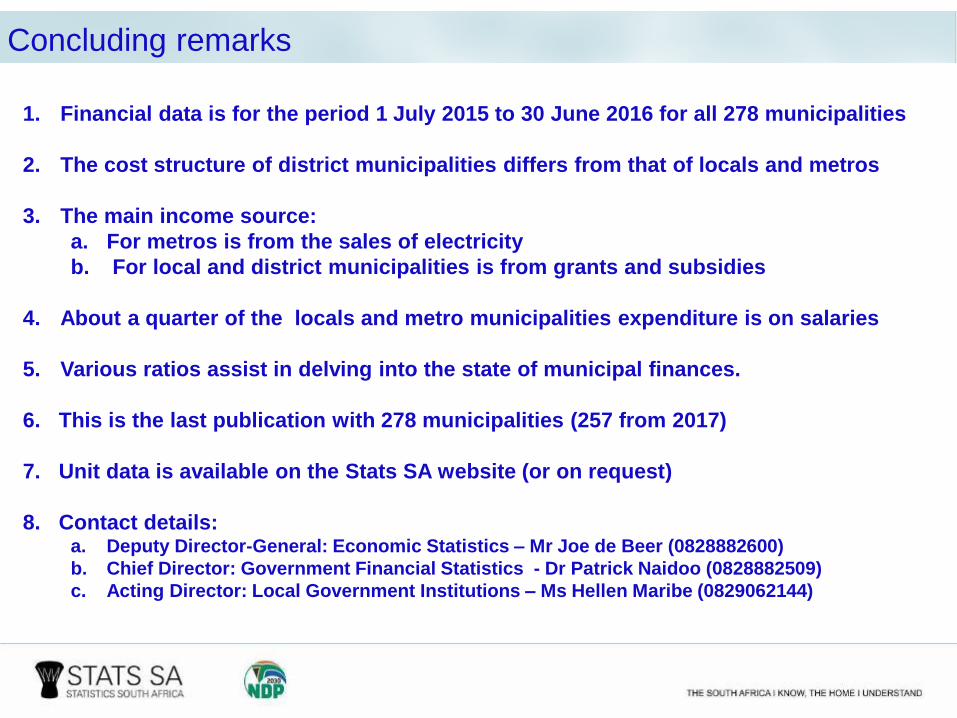
1. Financial data is for the period 1 July 2015 to 30 June 2016 for all 278 municipalities
2. The cost structure of district municipalities differs from that of locals and metros
3. The main income source:
a. For metros is from the sales of electricity
b. For local and district municipalities is from grants and subsidies
4. About a quarter of the locals and metro municipalities expenditure is on salaries
5. Various ratios assist in delving into the state of municipal finances.
6. This is the last publication with 278 municipalities (257 from 2017)
7. Unit data is available on the Stats SA website (or on request)
8. Contact details: a. Deputy Director-General: Economic Statistics – Mr Joe de Beer (0828882600)
b. Chief Director: Government Financial Statistics - Dr Patrick Naidoo (0828882509)
c. Acting Director: Local Government Institutions – Ms Hellen Maribe (0829062144)
Concluding remarks