Embed Size (px)
Citation preview
FINANCIAL INCLUSION ANDDEVELOPMENT
MANDIRA SARMA1* and JESIM PAIS2
1Jawaharlal Nehru University, New Delhi, India2Institute for Studies in Industrial Development, New Delhi, India
Abstract: An important question raised in the literature is whether development leads to an
all-inclusive financial system. This paper attempts to examine the relationship between
financial inclusion and development by empirically identifying country specific factors that
are associated with the level of financial inclusion. It finds that levels of human development
and financial inclusion in a country move closely with each other. Among socio-economic and
infrastructure related factors, income, inequality, literacy, urbanisation and physical infra-
structure for connectivity and information are important. Health of the banking sector does not
seem to have an unambiguous effect on financial inclusion whereas ownership pattern does
seem to matter. Copyright # 2010 John Wiley & Sons, Ltd.
Keywords: financial inclusion; index of financial inclusion; human development index;
banking; development
JEL Classification: G21; O16; O50
1 INTRODUCTION
Financial inclusion refers to a process that ensures the ease of access, availability and usage
of the formal financial system for all members of an economy. An inclusive financial
system has several merits. It facilitates efficient allocation of productive resources and thus
can potentially reduce the cost of capital. In addition, access to appropriate financial
services can significantly improve the day-to-day management of finances. An inclusive
financial system can help in reducing the growth of informal sources of credit (such as
money lenders) that are often found to be exploitative. Thus, an all-inclusive financial
system enhances efficiency and welfare by providing avenues for secure and safe saving
practices and by facilitating a whole range of efficient financial services.
The importance of an inclusive financial system is widely recognised in the policy circles
and recently financial inclusion has become a policy priority in many countries. Initiatives for
Journal of International Development
J. Int. Dev. 23, 613–628 (2011)
Published online 7 May 2010 in Wiley Online Library
(wileyonlinelibrary.com) DOI: 10.1002/jid.1698
*Correspondence to: Mandira Sarma, Centre for International Trade and Development, School of InternationalStudies, Jawaharlal Nehru University, New Delhi 110067, India.E-mail: [email protected]; [email protected]
Copyright # 2010 John Wiley & Sons, Ltd.
financial inclusion have come from the financial regulators, the governments and the banking
industry. Legislativemeasures have been initiated in some countries, for example, in theUnited
States, the Community Reinvestment Act (1997) requires banks to offer credit throughout their
area of operation and prohibits them from targeting only the rich neighbourhoods. In France,
the Law on Exclusion (1998) emphasises an individual’s right to have a bank account. In the
United Kingdom, a ‘Financial Inclusion Task Force’ was constituted by the government in
2005 in order to monitor the development on financial inclusion.
The banking sector has also taken a lead role in promoting financial inclusion. The German
Bankers’ Association introduced a voluntary code in 1996 providing for an ‘everyman’
current banking account that facilitates basic banking transactions. In South Africa, a low cost
bank account called ‘Mzansi’ was launched for financially excluded people in 2004 by the
South African Banking Association. In India, the Reserve Bank of India (RBI) has initiated
several measures to achieve greater financial inclusion such as facilitating ‘no-frills’ accounts
and ‘General Credit Cards’ for low deposit and credit. Alternate financial institutions such as
micro-finance institutions and ‘Self-Help Groups’ have also been promoted in some countries
in order to reach financial services to the excluded.
Literature on financial exclusion has defined it in the context of a larger issue of social
exclusion of certain groups of people from the mainstream of the society. Leyshon and
Thrift (1995) define financial exclusion as referring to those processes that serve to
prevent certain social groups and individuals from gaining access to the formal
financial system. Carbo et al. (2005) have defined financial exclusion as broadly the
inability (however occasioned) of some societal groups to access the financial
system. According to Conroy (2005), financial exclusion is a process that prevents poor
and disadvantaged social groups from gaining access to the formal financial systems of
their countries. According to Mohan (2006) financial exclusion signifies the lack of access
by certain segments of the society to appropriate, low-cost, fair and safe financial products
and services from mainstream providers. AGovernment Committee on financial inclusion
in India defines financial inclusion as the process of ensuring access to financial services
and timely and adequate credit where needed by vulnerable groups such as the weaker
sections and low income groups at an affordable cost (Rangarajan Committee, 2008).
Thus, the definitions on financial inclusion/exclusion, conceptual as well as functional,
provide an indication that financial exclusion occurs mainly among people who are at the
margins of the society. Further, the literature on financial inclusion has also adequately pointed
out that it is a complex phenomenon, having several dimensions. Therefore, an appropriate
measure of financial inclusion has to bemultidimensional. There is a vast literature on financial
inclusion and the measure most commonly used by scholars is the number of banked persons,
often proxied by the average number of bank accounts per 1000 population. Sarma (2008) has
developed a multidimensional index of financial inclusion (IFI). This index incorporates
information on three dimensions of financial inclusion, namely accessibility, availability and
usage of banking services. The IFI is computed in a manner that it captures information on
banking penetration, availability of banking services and usage of the banking system, in a
single number lying between 0 and 1. Higher value of IFI implies higher level of financial
inclusion. Because it captures information on multiple aspects of financial inclusion in a single
number, the IFI provides a better measure of financial inclusion than individual indicators such
as those used in Beck et al. (2007). In this paper we, therefore, use the IFI developed by Sarma
(2008) to investigate macro level factors that can be associated with financial inclusion.
The issues of financial exclusion have been of interest to scholars for some time now. Of
the issues raised in academic debates, an important question is whether economic
Copyright # 2010 John Wiley & Sons, Ltd. J. Int. Dev. 23, 613–628 (2011)
DOI: 10.1002/jid
614 M. Sarma and J. Pais
development leads to an all-inclusive financial system. It has been observed that even
‘well-developed’ financial systems such as those in the US and the UK have not succeeded
to be ‘all-inclusive’ and certain segments of the population remain outside the formal
financial systems.1 Another issue of interest is whether low level of financial inclusion is
associated with high-income inequality (Kempson et al., 2004).
This paper attempts to examine the relationship between financial inclusion and
development. In doing so, it attempts to empirically identify country specific factors that
are associated with the level of financial inclusion. Empirical literature on determinants of
financial exclusion mostly comprises analysis based on primary surveys within a country or
a region.2 In a recent paper, Beck et al. (2007) have studied financial sector outreach and its
determinants by using cross-country data. They have used several indicators of banking
sector outreach and examined the determinants of each of these indicators separately.
This paper first attempts to understand the relationship between IFI and the Human
Development Index (HDI), the most widely used development index. Then it presents the
results of an empirical analysis that determine country specific factors associated with the
level of financial inclusion. We find that at the macro level, the factors responsible for
financial exclusion are similar to those found in individual countries through survey-based
analysis. Our results are also in line with Beck et al. (2007). We organise this paper as
follows. Section 2 we briefly describes the Index of Financial Inclusion (IFI). In Section 3
we present the broad relationship between IFI and HDI, followed by an empirical analysis
of factors significantly associated with IFI in Section 4. Section 5 concludes the paper.
2 INDEX OF FINANCIAL INCLUSION (IFI)3
The index of financial inclusion is a measure of inclusiveness of the financial sector of a
country. It is constructed as a multidimensional index that captures information on various
aspects of financial inclusion such as banking penetration, availability of banking services
and usage of the banking system. The IFI incorporates information on these dimensions in
one single number lying between 0 and 1, where 0 denotes complete financial exclusion
and 1 indicates complete financial inclusion in an economy. Sarma (2008) has developed a
method of computing the IFI for several dimensions of financial inclusion. Based on the
availability of comparable data, Sarma (2008) has computed the values of IFI using the
three basic dimensions of financial inclusion—accessibility, availability and usage of
banking services. Accessibility has been measured by the penetration of the banking
system proxied by the number of bank accounts (hereafter A/Cs) per 1000 population.4
Availability has been measured by the number of bank branches and number of ATMs per
1For a review of financial exclusion in developed economies and the policy response to it, see Kempson et al.(2004).2See, for example, Solo and Manroth (2006) for Colombia, Seidman and Tescher (2005) for the US, Corr (2006)for Ireland, Collard et al. (2001) for UK, Djankov et al. (2008) for Mexico and European Commission (2008) forthe European Union.3The section draws mainly from Sarma (2008).4The size of the ‘banked’ population (or number of persons having a bank A/C) per 1000 persons is the mostappropriate measure of banking penetration and thus of accessibility. However, such data are not readily availableand therefore the number of bank A/Cs per 1000 persons has been considered as a proxy measure of bankingpenetration. An important drawback here is that this figure is likely to provide an overestimate of the population of‘banked’ people, as the number of persons with multiple bank accounts is likely to be higher than the number ofpersons jointly sharing a bank account with others. Despite such a drawback, number of bank A/Cs per 1000population is used in the computation of the index, as consistent data on the number of bank A/Cs is available for alarge number of countries.
Copyright # 2010 John Wiley & Sons, Ltd. J. Int. Dev. 23, 613–628 (2011)
DOI: 10.1002/jid
Financial Inclusion and Development 615
100 000 people. The proxy used for the usage dimension is the volume of credit plus
deposit relative to the GDP. A dimension index for each of these dimensions has been first
computed by the following formula:
di ¼ Ai � mi
Mi � mi
(1)
where Ai is the actual value of dimension i, mi is the lower limit for dimension i, given by
the observed minimum for dimension i andMi is the upper limit for dimension i, given by
the empirical 94th quantile for dimension i.
For the availability dimension, two separate indexes are first calculated; one for bank
branch and the second for ATMs. A weighted average of these two indexes, using 2/3rd
weight for bank branch index and 1/3rd weight for ATM index is considered as the index
for the availability dimension.
After calculating the dimension indexes, they are given the following weights—1 for the
index of accessibility (penetration), 0.5 for the index of availability and 0.5 for the index of
usage. The reason for giving less weight for the indexes of availability and usage
dimensions in the present index is the lack of adequate data on some important indicators
that completely characterise these dimensions. For example, as far as availability of
banking services is concerned, many countries have moved towards internet banking, thus
reducing the importance of physical bank outlets. Therefore, using data only on physical
outlets (such as bank branches and ATMs) can give an incomplete picture of the availability
of banking services. Similarly, using data on credit and deposit can only partially depict the
usage of the financial system as other services of the banking system such as payments,
transfers and remittances are not included. In the absence of such data, a complete
characterisation of these dimensions is not possible.
After giving weights to the dimensions, the final IFI is computed as follows:
IFI ¼ 1�ffiffiffiffiffiffiffiffiffiffiffiffiffiffiffiffiffiffiffiffiffiffiffiffiffiffiffiffiffiffiffiffiffiffiffiffiffiffiffiffiffiffiffiffiffiffiffiffiffiffiffiffiffiffiffiffiffiffiffiffiffiffiffiffiffiffiffiffiffiffiffiffið1� piÞ2 þ ð0:5� aiÞ2 þ ð0:5� uiÞ2
1:5
s
where pi, ai and ui denote, respectively, the weighted dimension indexes for the dimensions
accessibility (or penetration), availability and usage.
Earlier studies on financial inclusion have used individual indicators separately to assess
the extent of financial inclusion (see e.g. Beck et al., 2007). Some of the most common
indicators used in earlier studies are number of bank A/Cs (per 1000 persons), number of
bank branches (per million people), number of ATMs (per million people), amount of bank
credit and amount of bank deposit. All these indicators provide important and useful
information on the outreach of the financial system of an economy. However, given that the
process of financial exclusion is itself complex and multidimensional, these indicators, if
used individually, will provide only partial information on the inclusiveness of the financial
system. On this, Kempson et al. (2004) have observed, with reference to some ‘apparently
very highly-banked countries’, that merely having a bank account is not enough for an
inclusive financial system. It is also important that the banking services are adequately
utilised. Thus, any one single indicator fails to adequately capture the extent of financial
inclusion. The IFI in Sarma (2008) by incorporating information on three important
dimensions of financial inclusion provides a more comprehensive measure of financial
inclusion. The IFI is constructed by following a multidimensional approach of index
construction similar to that used by UNDP for computation of the well-known Human
Copyright # 2010 John Wiley & Sons, Ltd. J. Int. Dev. 23, 613–628 (2011)
DOI: 10.1002/jid
616 M. Sarma and J. Pais
Development Index (HDI); however, certain methodological improvements make IFI free
from some of the widely criticised shortcomings of the HDI.5 Nevertheless, the IFI is not
without its limitations. Like any macro index, it suffers from loss of country specific
information owing to the aggregative nature of the data.
The extent of financial inclusion across different countries as seen from the ranking of
these countries using the IFI is generally on expected lines, which in itself, is not surprising.
However, there are some unexpected results. For example, Spain (IFI 0.784) is ranked
higher than Norway (IFI 0.595).6 Apart from data related issues, an important reason for
this apparently unexpected result is the whole multidimensionality of the index. While it is
nobody’s argument that the proportion of population in Norway having bank accounts is
higher than in Spain, this is only one of the dimensions of financial inclusion. People have
to have access to banks (number of ATMs, bank branches and recently internet banking)
and finally people have to use their bank accounts (as measured by the credit and deposit
data). In the latter two dimensions, Spain ranks few notches above Norway.7 Thus in a
sense, the higher IFI value for Spain when compared with Norway is not unexpected—
given that financial inclusion is viewed here in a more comprehensive and holistic manner.
The gap between the IFI values for Spain and Norway may appear unexpected and for
this, we believe, the exclusion of data on internet banking, payments and remittances and
other such data are responsible. To that extent, the index needs improvements.
Adequate, appropriate and comparable data for a large number of countries is the
essence of a robust IFI. Lack of adequate and appropriate cross-country data may lead to
inconsistencies in the ranking of countries with respect to achievement in financial
inclusion. For example, in most advanced industrial countries, financial services have
turned electronic or virtual (as against cash or paper). Electronic banking through the
internet (or internet banking) has grown rapidly in recent years in these countries and this
process has often been at the expense of the growth of conventional banking services such
as the bank branches and ATMs.8 In this situation, to the extent that internet banking has
grown in these countries, the lack of data on internet banking is likely to provide under-
estimates for their respective IFI values. This also partly explains the lower IFI value of
Norway when compared with Spain in the earlier example. If data on the extent of internet
banking could be utilised, the IFI might have generated much more robust values.
Notwithstanding a few apparent inconsistencies like this, the IFI measures for many
other European Countries are in broad agreement with Eurobarometer Survey of the
European Commission (2008). Further, as the IFI measures are computed by using
consistent secondary data available from internationally well-known sources, we are able
to carry out cross-country empirical research that this paper aims to address.
We use the IFI computed by Sarma (2008) for 54 countries.9 From within this group of
54 countries, however, we have excluded countries that can be unambiguously
5For methodological details of construction of IFI see Sarma (2008).6See Table 1 for IFI values and ranks of other countries.7As per the WDI (2006) database of World Bank, Spain had 112 bank branches and 148 ATMs per 100 000 adultpeople, while Norway had only 29 bank branches and 60 ATMs per 100 000 adult people. According to IFS (2006)data base of the International Monetary Fund, the credit to GDP and deposit to GDP ratios are 1.3 and 0.9,respectively, in Spain and 0.8 and 0.5, respectively, in Norway.8Another example is the whole range of banking services provided by telephone, both fixed lines and mobile phones.9Sarma (2008) has also estimated a second set of IFI based only on two dimensions (availability and usage) forwhich data are available for a larger set of 100 countries. We do not use the two-dimensional IFI in this paper asone of the most important dimensions viz., accessibility, is not incorporated in the two-dimensional IFI. The datafor computing the IFI is from World Bank’s WDI database and from World Bank’s website.
Copyright # 2010 John Wiley & Sons, Ltd. J. Int. Dev. 23, 613–628 (2011)
DOI: 10.1002/jid
Financial Inclusion and Development 617
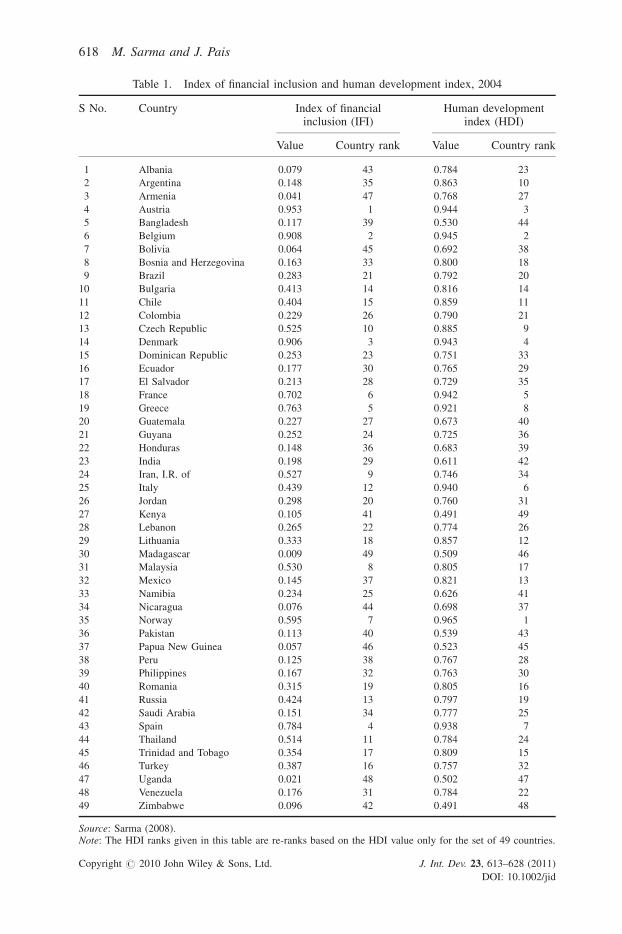
Table 1. Index of financial inclusion and human development index, 2004
S No. Country Index of financialinclusion (IFI)
Human developmentindex (HDI)
Value Country rank Value Country rank
1 Albania 0.079 43 0.784 23
2 Argentina 0.148 35 0.863 10
3 Armenia 0.041 47 0.768 27
4 Austria 0.953 1 0.944 3
5 Bangladesh 0.117 39 0.530 44
6 Belgium 0.908 2 0.945 2
7 Bolivia 0.064 45 0.692 38
8 Bosnia and Herzegovina 0.163 33 0.800 18
9 Brazil 0.283 21 0.792 20
10 Bulgaria 0.413 14 0.816 14
11 Chile 0.404 15 0.859 11
12 Colombia 0.229 26 0.790 21
13 Czech Republic 0.525 10 0.885 9
14 Denmark 0.906 3 0.943 4
15 Dominican Republic 0.253 23 0.751 33
16 Ecuador 0.177 30 0.765 29
17 El Salvador 0.213 28 0.729 35
18 France 0.702 6 0.942 5
19 Greece 0.763 5 0.921 8
20 Guatemala 0.227 27 0.673 40
21 Guyana 0.252 24 0.725 36
22 Honduras 0.148 36 0.683 39
23 India 0.198 29 0.611 42
24 Iran, I.R. of 0.527 9 0.746 34
25 Italy 0.439 12 0.940 6
26 Jordan 0.298 20 0.760 31
27 Kenya 0.105 41 0.491 49
28 Lebanon 0.265 22 0.774 26
29 Lithuania 0.333 18 0.857 12
30 Madagascar 0.009 49 0.509 46
31 Malaysia 0.530 8 0.805 17
32 Mexico 0.145 37 0.821 13
33 Namibia 0.234 25 0.626 41
34 Nicaragua 0.076 44 0.698 37
35 Norway 0.595 7 0.965 1
36 Pakistan 0.113 40 0.539 43
37 Papua New Guinea 0.057 46 0.523 45
38 Peru 0.125 38 0.767 28
39 Philippines 0.167 32 0.763 30
40 Romania 0.315 19 0.805 16
41 Russia 0.424 13 0.797 19
42 Saudi Arabia 0.151 34 0.777 25
43 Spain 0.784 4 0.938 7
44 Thailand 0.514 11 0.784 24
45 Trinidad and Tobago 0.354 17 0.809 15
46 Turkey 0.387 16 0.757 32
47 Uganda 0.021 48 0.502 47
48 Venezuela 0.176 31 0.784 22
49 Zimbabwe 0.096 42 0.491 48
Source: Sarma (2008).Note: The HDI ranks given in this table are re-ranks based on the HDI value only for the set of 49 countries.
Copyright # 2010 John Wiley & Sons, Ltd. J. Int. Dev. 23, 613–628 (2011)
DOI: 10.1002/jid
618 M. Sarma and J. Pais
characterised as overseas financial centres (OFC).10 The OFCs are defined by the IMF as
centres ‘where the bulk of financial sector activity is offshore on both sides of the balance
sheet (that is the counterparties of the majority of financial institutions’ liabilities and assets
are non-residents), where the transactions are initiated elsewhere, and where the majority
of the institutions involved are controlled by non-residents’.11 Thus, the empirical
investigation in this paper is based on the data for 49 countries.
3 IFI AND HDI
Table 1 presents the IFI computed for 49 countries and the corresponding human
development index (HDI) along with their ranks. Austria, with an IFI value of 0.95 leads
the list while Madagascar with an IFI value of 0.01 ranks the lowest in financial inclusion.
In line with Sarma (2008), countries having IFI value between 0.5 and 1 are classified as
high IFI countries, those having IFI values between 0.3 and 0.5 are termed medium IFI
countries and the rest having IFI values below 0.3 are classified as low IFI countries. By this
classification, only 11 of the 49 countries classify as high IFI countries. These include high-
income and OECD countries such as Belgium, Denmark, Spain, Greece, France and
Norway.12 The high IFI countries also include middle-income countries such as Malaysia
(upper middle-income) and Iran and Thailand (lower middle-income). The medium IFI
countries are nine of the 49 in the list. Of these, Italy and Trinidad and Tobago are high-
income countries while the rest such as Russia, Bulgaria, Chile, Turkey, Lithuania,
Romania and Jordan are upper middle-income countries (UMC). While it is not surprising
that the list of low IFI countries is dominated by low-income countries, there are some
exceptions. For example, Saudi Arabia, a high-income country is found to have low IFI.
Similarly, Brazil, Lebanon, Venezuela, Argentina and Mexico, from the upper middle-
income category are found to be having low IFI.
A comparison of IFI with human development index (HDI) shows that all the countries
with high and medium IFI values belong to the group that is classified by the UNDP as
countries with high human development (HDI> 0.7). Saudi Arabia, a high HDI country is
found to have a low IFI value. Other countries having a high or medium HDI but a low IFI
are Brazil, Lebanon, Venezuela, Argentina and Mexico.
On the one hand, countries such as Albania, Armenia, Peru and Mexico have relatively
higher levels of human development as compared to their levels of financial inclusion. On
the other hand there are countries such as Iran, Thailand, Turkey and Namibia that perform
relatively better in financial inclusion than in human development.
Notwithstanding these exceptions, IFI and HDI seem to move in the same direction. As
observed from Table 1, the IFI and HDI for the set of 49 countries move closely with each
other. The correlation coefficient between IFI and HDI values and ranks is found to be
10From among the estimations by Sarma (2008) we have excluded Fiji, Malta, Mauritius, Singapore andSwitzerland.11OFCs as defined by the IMF refer to economies that have relatively large numbers of financial institutionsengaged primarily in business with non-residents, wherein the financial sector’s external assets and liabilities aredisproportionately large when compared with domestic financial intermediation. OFCs are also known to provideone or more of the following services: low or zero taxation; moderate or light financial regulation; banking secrecyand anonymity (IMF, 2000).12The World Development Report classifies economies into four income groups depending on the gross nationalincome (GNI) per capita, calculated using the World Bank Atlas method. The groups are: low income (LIC), $905or less; lower middle income (LMC), $906–3595; upper middle income (UMC), $3596–11 115; and high income,$11 116 or more.
Copyright # 2010 John Wiley & Sons, Ltd. J. Int. Dev. 23, 613–628 (2011)
DOI: 10.1002/jid
Financial Inclusion and Development 619
about 0.74 and is statistically significant.13 From this, it can be generally concluded that
countries having high level of human development are also the countries with a relatively
high level of financial inclusion.
Region-wise, we find that a majority of the East European countries had medium level of
financial inclusion, while a large number of Latin American countries had low financial
inclusion. All countries in south Asia and Sub-Saharan Africa for whom IFI values were
computed have low levels of financial inclusion. As data on east and southeast Asian
countries are limited, we are unable to make any further comment on their performance.
Small countries with a relatively large emigrant worker population may have relatively
higher levels of financial inclusion if the emigrant workers use the banking system for
remittances. For example, countries such as Jordan, Guyana and the Dominican Republic
have a relatively large emigrant population and a share of remittances to GDP of over 15
per cent. In these countries, the higher IFI rank compared with HDI rank can perhaps be
attributed to this phenomenon. However, as noted in the literature on migration and
remittances, a large share of remittances to less developed countries occurs through
informal sources including family channels, travelling friends, local money lenders and a
complex network of informal remittance systems (Puri and Ritzema, 1999; El Qorchi et al.,
2003; COMPAS, 2005).14 Hence, it is not possible to establish a relationship between
migration, remittances and financial inclusion.
4 FACTORS ASSOCIATED WITH FINANCIAL INCLUSION
The factors that affect financial inclusion are likely to be several and their interaction with each
other complex. At themoment, without going into the complexity of the how a large number of
factors together affect the level of financial inclusion in a country, we attempt to simply identify
factors that are associated, with some degree of significance, to the index of financial inclusion.
We do this by carrying out three sets of regressions of the IFI on three different sets of variables
that relate, respectively, to socio-economic factors, physical infrastructure and the banking
sector. In a sense, the three sets of variables indicating socio-economic factors, factors relating
to physical infrastructure and banking sector factors are independent of each other.15 Further,
data on all variables are not available for the 49 countries for which IFI values are available. If
we include all variables or regressors in a single regression equation, the number of
observations (countries) in the panel reduces to 20, leaving us with very little statistical
precision. This also partly explains our resort to three separate regressions.
The first regression is a regression of the IFI on a set of socio-economic variables such as
income, employment, inequality, literacy and so on. The second regression attempts to
capture the role of physical infrastructure. The third regression attempts to see the affect of
banking sector variables such as soundness indicators, ownership pattern and prevailing
rate of interest on financial inclusion. The data for the regressions are from the World
Development Indicators (WDI) for the latest/comparable year.16
13The calculated value of the t-statistic is 7.489, which is significant at 0.0001 level of significance.14The terms used to describe informal remittance systems vary from country to country, however, despite thedifferent names used, the operational mechanisms are similar (Maimbo 2004).15In other words, better performance or achievements of a country in one set of factors does not necessarily implysimilar performance in the other set.16WDI obtains data from national governments and from other international multilateral organisations such as theIMF, ILO and so on. We have also attempted regression estimations using data that are directly provided by theInternational Financial Statistics of the IMF for banking variables, ILO for employment Statistics and so on andthe results remain the same.
Copyright # 2010 John Wiley & Sons, Ltd. J. Int. Dev. 23, 613–628 (2011)
DOI: 10.1002/jid
620 M. Sarma and J. Pais
In the regression equations, the dependent variable is a logit transformation of the index
of financial inclusion described earlier. Unlike the IFI which lies between 0 and 1, the
transformed variable lies between�1 and1. This allows us to carry out the classical OLS
regression. The transformed variable is a monotonically increasing function of IFI, and
hence it preserves the same ordering as IFI. The transformed variable is a logit function of
the original variable IFI, as defined below.
Y ¼ lnIFI
1� IFI
� �
The general form of the regression equation is
Y ¼ a0 þ a1X1 þ a2X2 þ . . .þ anXn þ e
Where X1, X2, and so on are regressor variables, a1, a2 and so on are the parameters to be
estimated from the data and e is the error term following classical OLS assumptions. The
rate of change of Y with respect to a unit change in the variable Xi will be given by the
derivative of y with respect to Xi, which is
dY
dXi
¼ ai expðaiXiÞ1þ expðaiXið Þ2
Thus, the direction of change in Y corresponding to a unit change in Xi is determined by
the sign of ai while the magnitude of the change depends on the value of ai as well as Xi.
4.1 Results of the Regression on Socio-economic Variables
The literature on financial inclusion has identified financial exclusion as reflection of a
broader problem of ‘social exclusion’. In the industrialised and high income countries
having a well-developed banking system, studies have shown that the exclusion from the
financial system occurs to persons who belong to low-income groups, the ethnic minorities,
immigrants, the aged and so on (Kempson and Whyley, 1998; Connolly and Hajaj, 2001;
Barr, 2004). There is also a geographical factor; people living in rural areas and in locations
that are remote from urban financial centres are more likely to be financially excluded
(Leyshon and Thrift, 1995; Kempson andWhyley, 2001). Further, countries with low levels
of income inequality tend to have relatively high level of financial inclusion (Kempson and
Whyley, 1998; Buckland et al., 2005). In other words, the levels of financial inclusion
inevitably rise in response to both prosperity and declining inequalities.
Another factor that has been associated with financial inclusion is employment
(Goodwin et al., 2000). The unemployed or those with irregular and insecure employment
are less likely to participate in the financial system. Studies have found that payment of
wages through automated cash transfer (ACT) has been one of the main influences on
financial inclusion in the UK. Recent evidence also suggests that the continued payment of
social security benefits and the State pension in cash is significantly related to financial
exclusion (Kempson and Whyley, 1999).
Informal sector or the informal economy accounts for a large and significant share of
employment in several less developed countries (ILO, 2002). In these countries and
elsewhere in the industrialised countries, formal sector employment could imply
participation in the formal financial system through receiving wages and salaries routed
Copyright # 2010 John Wiley & Sons, Ltd. J. Int. Dev. 23, 613–628 (2011)
DOI: 10.1002/jid
Financial Inclusion and Development 621
through the formal banking system. Formal employment also implies inclusion in
employment related social security system, benefits of which are availed through the
formal banking system. Thus, the proportion of formal sector employment would be an
important indicator of the level of financial inclusion. Since we have not found reliable
cross-country data on the proportion of formal sector workers, in the present analysis, this
aspect is not being covered.17
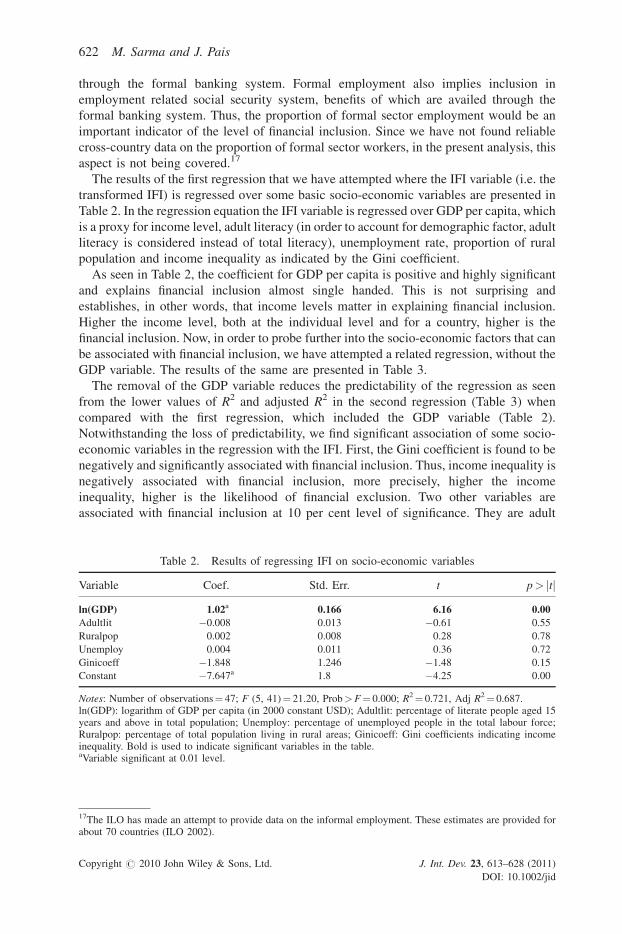
The results of the first regression that we have attempted where the IFI variable (i.e. the
transformed IFI) is regressed over some basic socio-economic variables are presented in
Table 2. In the regression equation the IFI variable is regressed over GDP per capita, which
is a proxy for income level, adult literacy (in order to account for demographic factor, adult
literacy is considered instead of total literacy), unemployment rate, proportion of rural
population and income inequality as indicated by the Gini coefficient.
As seen in Table 2, the coefficient for GDP per capita is positive and highly significant
and explains financial inclusion almost single handed. This is not surprising and
establishes, in other words, that income levels matter in explaining financial inclusion.
Higher the income level, both at the individual level and for a country, higher is the
financial inclusion. Now, in order to probe further into the socio-economic factors that can
be associated with financial inclusion, we have attempted a related regression, without the
GDP variable. The results of the same are presented in Table 3.
The removal of the GDP variable reduces the predictability of the regression as seen
from the lower values of R2 and adjusted R2 in the second regression (Table 3) when
compared with the first regression, which included the GDP variable (Table 2).
Notwithstanding the loss of predictability, we find significant association of some socio-
economic variables in the regression with the IFI. First, the Gini coefficient is found to be
negatively and significantly associated with financial inclusion. Thus, income inequality is
negatively associated with financial inclusion, more precisely, higher the income
inequality, higher is the likelihood of financial exclusion. Two other variables are
associated with financial inclusion at 10 per cent level of significance. They are adult
Table 2. Results of regressing IFI on socio-economic variables
Variable Coef. Std. Err. t p> jtjln(GDP) 1.02a 0.166 6.16 0.00Adultlit �0.008 0.013 �0.61 0.55
Ruralpop 0.002 0.008 0.28 0.78
Unemploy 0.004 0.011 0.36 0.72
Ginicoeff �1.848 1.246 �1.48 0.15
Constant �7.647a 1.8 �4.25 0.00
Notes: Number of observations¼ 47; F (5, 41)¼ 21.20, Prob>F¼ 0.000; R2¼ 0.721, Adj R2¼ 0.687.ln(GDP): logarithm of GDP per capita (in 2000 constant USD); Adultlit: percentage of literate people aged 15years and above in total population; Unemploy: percentage of unemployed people in the total labour force;Ruralpop: percentage of total population living in rural areas; Ginicoeff: Gini coefficients indicating incomeinequality. Bold is used to indicate significant variables in the table.aVariable significant at 0.01 level.
17The ILO has made an attempt to provide data on the informal employment. These estimates are provided forabout 70 countries (ILO 2002).
Copyright # 2010 John Wiley & Sons, Ltd. J. Int. Dev. 23, 613–628 (2011)
DOI: 10.1002/jid
622 M. Sarma and J. Pais
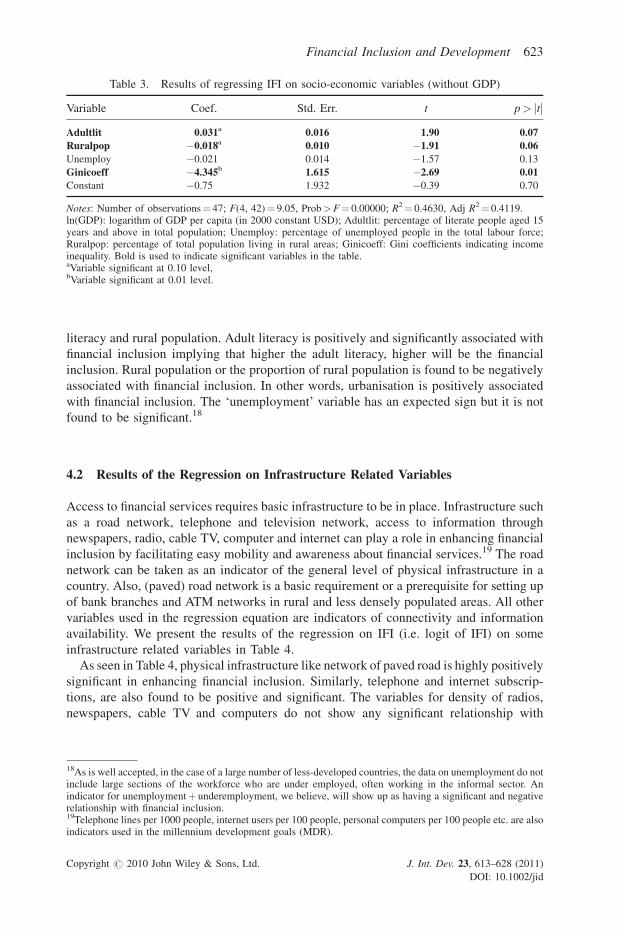
literacy and rural population. Adult literacy is positively and significantly associated with
financial inclusion implying that higher the adult literacy, higher will be the financial
inclusion. Rural population or the proportion of rural population is found to be negatively
associated with financial inclusion. In other words, urbanisation is positively associated
with financial inclusion. The ‘unemployment’ variable has an expected sign but it is not
found to be significant.18
4.2 Results of the Regression on Infrastructure Related Variables
Access to financial services requires basic infrastructure to be in place. Infrastructure such
as a road network, telephone and television network, access to information through
newspapers, radio, cable TV, computer and internet can play a role in enhancing financial
inclusion by facilitating easy mobility and awareness about financial services.19 The road
network can be taken as an indicator of the general level of physical infrastructure in a
country. Also, (paved) road network is a basic requirement or a prerequisite for setting up
of bank branches and ATM networks in rural and less densely populated areas. All other
variables used in the regression equation are indicators of connectivity and information
availability. We present the results of the regression on IFI (i.e. logit of IFI) on some
infrastructure related variables in Table 4.
As seen in Table 4, physical infrastructure like network of paved road is highly positively
significant in enhancing financial inclusion. Similarly, telephone and internet subscrip-
tions, are also found to be positive and significant. The variables for density of radios,
newspapers, cable TV and computers do not show any significant relationship with
Table 3. Results of regressing IFI on socio-economic variables (without GDP)
Variable Coef. Std. Err. t p> jtjAdultlit 0.031a 0.016 1.90 0.07Ruralpop �0.018a 0.010 �1.91 0.06Unemploy �0.021 0.014 �1.57 0.13
Ginicoeff �4.345b 1.615 �2.69 0.01Constant �0.75 1.932 �0.39 0.70
Notes: Number of observations¼ 47; F(4, 42)¼ 9.05, Prob>F¼ 0.00000; R2¼ 0.4630, Adj R2¼ 0.4119.ln(GDP): logarithm of GDP per capita (in 2000 constant USD); Adultlit: percentage of literate people aged 15years and above in total population; Unemploy: percentage of unemployed people in the total labour force;Ruralpop: percentage of total population living in rural areas; Ginicoeff: Gini coefficients indicating incomeinequality. Bold is used to indicate significant variables in the table.aVariable significant at 0.10 level,bVariable significant at 0.01 level.
18As is well accepted, in the case of a large number of less-developed countries, the data on unemployment do notinclude large sections of the workforce who are under employed, often working in the informal sector. Anindicator for unemploymentþ underemployment, we believe, will show up as having a significant and negativerelationship with financial inclusion.19Telephone lines per 1000 people, internet users per 100 people, personal computers per 100 people etc. are alsoindicators used in the millennium development goals (MDR).
Copyright # 2010 John Wiley & Sons, Ltd. J. Int. Dev. 23, 613–628 (2011)
DOI: 10.1002/jid
Financial Inclusion and Development 623
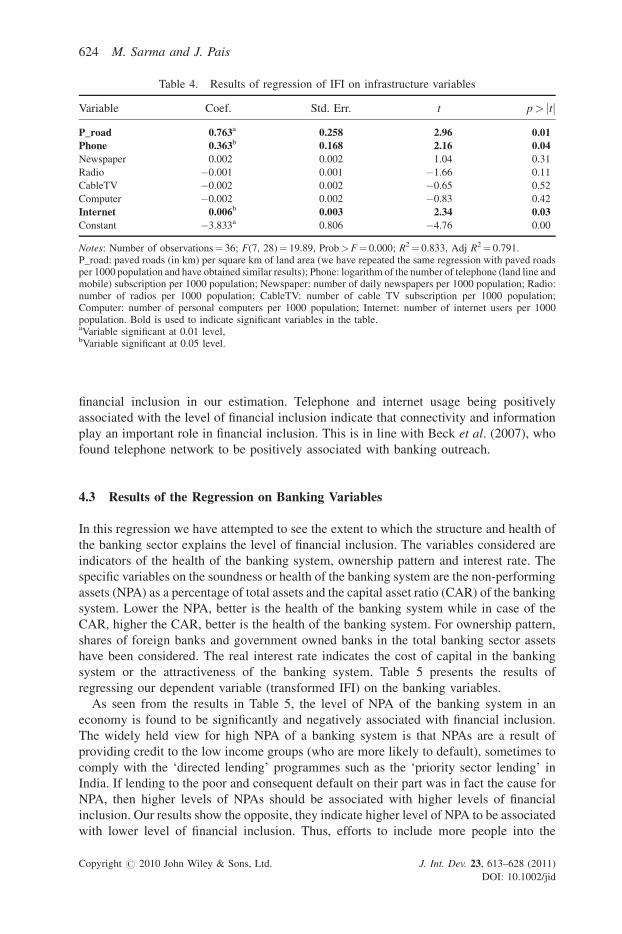
financial inclusion in our estimation. Telephone and internet usage being positively
associated with the level of financial inclusion indicate that connectivity and information
play an important role in financial inclusion. This is in line with Beck et al. (2007), who
found telephone network to be positively associated with banking outreach.
4.3 Results of the Regression on Banking Variables
In this regression we have attempted to see the extent to which the structure and health of
the banking sector explains the level of financial inclusion. The variables considered are
indicators of the health of the banking system, ownership pattern and interest rate. The
specific variables on the soundness or health of the banking system are the non-performing
assets (NPA) as a percentage of total assets and the capital asset ratio (CAR) of the banking
system. Lower the NPA, better is the health of the banking system while in case of the
CAR, higher the CAR, better is the health of the banking system. For ownership pattern,
shares of foreign banks and government owned banks in the total banking sector assets
have been considered. The real interest rate indicates the cost of capital in the banking
system or the attractiveness of the banking system. Table 5 presents the results of
regressing our dependent variable (transformed IFI) on the banking variables.
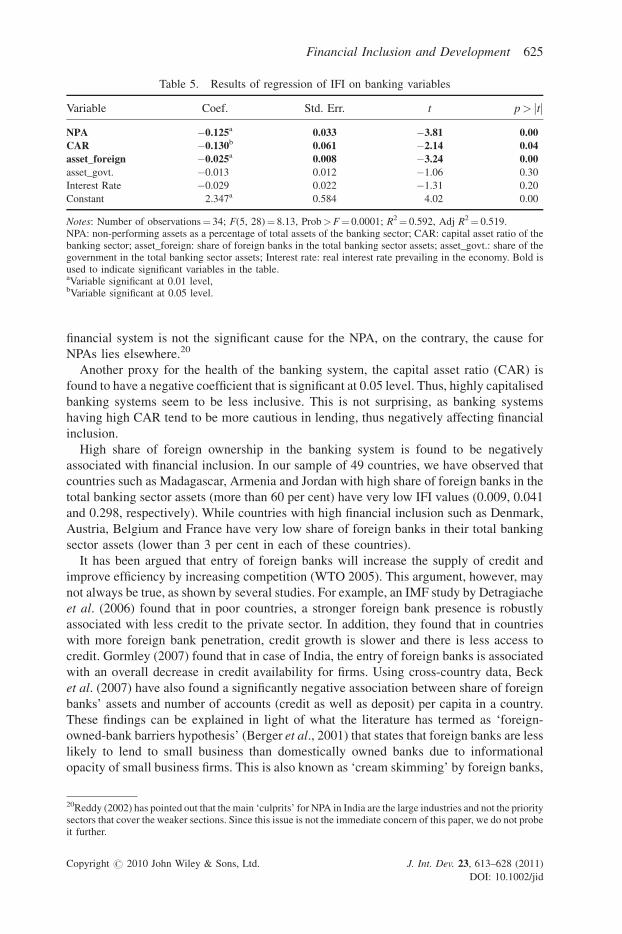
As seen from the results in Table 5, the level of NPA of the banking system in an
economy is found to be significantly and negatively associated with financial inclusion.
The widely held view for high NPA of a banking system is that NPAs are a result of
providing credit to the low income groups (who are more likely to default), sometimes to
comply with the ‘directed lending’ programmes such as the ‘priority sector lending’ in
India. If lending to the poor and consequent default on their part was in fact the cause for
NPA, then higher levels of NPAs should be associated with higher levels of financial
inclusion. Our results show the opposite, they indicate higher level of NPA to be associated
with lower level of financial inclusion. Thus, efforts to include more people into the
Table 4. Results of regression of IFI on infrastructure variables
Variable Coef. Std. Err. t p> jtjP_road 0.763a 0.258 2.96 0.01Phone 0.363b 0.168 2.16 0.04Newspaper 0.002 0.002 1.04 0.31
Radio �0.001 0.001 �1.66 0.11
CableTV �0.002 0.002 �0.65 0.52
Computer �0.002 0.002 �0.83 0.42
Internet 0.006b 0.003 2.34 0.03Constant �3.833a 0.806 �4.76 0.00
Notes: Number of observations¼ 36; F(7, 28)¼ 19.89, Prob>F¼ 0.000; R2¼ 0.833, Adj R2¼ 0.791.P_road: paved roads (in km) per square km of land area (we have repeated the same regression with paved roadsper 1000 population and have obtained similar results); Phone: logarithm of the number of telephone (land line andmobile) subscription per 1000 population; Newspaper: number of daily newspapers per 1000 population; Radio:number of radios per 1000 population; CableTV: number of cable TV subscription per 1000 population;Computer: number of personal computers per 1000 population; Internet: number of internet users per 1000population. Bold is used to indicate significant variables in the table.aVariable significant at 0.01 level,bVariable significant at 0.05 level.
Copyright # 2010 John Wiley & Sons, Ltd. J. Int. Dev. 23, 613–628 (2011)
DOI: 10.1002/jid
624 M. Sarma and J. Pais
financial system is not the significant cause for the NPA, on the contrary, the cause for
NPAs lies elsewhere.20
Another proxy for the health of the banking system, the capital asset ratio (CAR) is
found to have a negative coefficient that is significant at 0.05 level. Thus, highly capitalised
banking systems seem to be less inclusive. This is not surprising, as banking systems
having high CAR tend to be more cautious in lending, thus negatively affecting financial
inclusion.
High share of foreign ownership in the banking system is found to be negatively
associated with financial inclusion. In our sample of 49 countries, we have observed that
countries such as Madagascar, Armenia and Jordan with high share of foreign banks in the
total banking sector assets (more than 60 per cent) have very low IFI values (0.009, 0.041
and 0.298, respectively). While countries with high financial inclusion such as Denmark,
Austria, Belgium and France have very low share of foreign banks in their total banking
sector assets (lower than 3 per cent in each of these countries).
It has been argued that entry of foreign banks will increase the supply of credit and
improve efficiency by increasing competition (WTO 2005). This argument, however, may
not always be true, as shown by several studies. For example, an IMF study by Detragiache
et al. (2006) found that in poor countries, a stronger foreign bank presence is robustly
associated with less credit to the private sector. In addition, they found that in countries
with more foreign bank penetration, credit growth is slower and there is less access to
credit. Gormley (2007) found that in case of India, the entry of foreign banks is associated
with an overall decrease in credit availability for firms. Using cross-country data, Beck
et al. (2007) have also found a significantly negative association between share of foreign
banks’ assets and number of accounts (credit as well as deposit) per capita in a country.
These findings can be explained in light of what the literature has termed as ‘foreign-
owned-bank barriers hypothesis’ (Berger et al., 2001) that states that foreign banks are less
likely to lend to small business than domestically owned banks due to informational
opacity of small business firms. This is also known as ‘cream skimming’ by foreign banks,
Table 5. Results of regression of IFI on banking variables
Variable Coef. Std. Err. t p> jtjNPA �0.125a 0.033 �3.81 0.00CAR �0.130b 0.061 �2.14 0.04asset_foreign �0.025a 0.008 �3.24 0.00asset_govt. �0.013 0.012 �1.06 0.30
Interest Rate �0.029 0.022 �1.31 0.20
Constant 2.347a 0.584 4.02 0.00
Notes: Number of observations¼ 34; F(5, 28)¼ 8.13, Prob>F¼ 0.0001; R2¼ 0.592, Adj R2¼ 0.519.NPA: non-performing assets as a percentage of total assets of the banking sector; CAR: capital asset ratio of thebanking sector; asset_foreign: share of foreign banks in the total banking sector assets; asset_govt.: share of thegovernment in the total banking sector assets; Interest rate: real interest rate prevailing in the economy. Bold isused to indicate significant variables in the table.aVariable significant at 0.01 level,bVariable significant at 0.05 level.
20Reddy (2002) has pointed out that the main ‘culprits’ for NPA in India are the large industries and not the prioritysectors that cover the weaker sections. Since this issue is not the immediate concern of this paper, we do not probeit further.
Copyright # 2010 John Wiley & Sons, Ltd. J. Int. Dev. 23, 613–628 (2011)
DOI: 10.1002/jid
Financial Inclusion and Development 625
which means that foreign banks indulge in serving only the wealthy borrowers due to
informational asymmetries. Our finding on the negative association between financial
inclusion and foreign banks’ asset share seems to be in line with these evidences.
Share of government ownership in the banking system, our results show, does not have a
significant association with financial inclusion. This can be interpreted as the inefficacy of
state owned banks in bringing about financial inclusion. Finally, the interest rate does not
show any significant relationship with financial inclusion.
5 CONCLUSION
Literature has identified financial exclusion as a manifestation of social exclusion. In this
paper we have attempted a cross-country study on factors associated with financial
inclusion. Using an index of financial inclusion (Sarma, 2008), we first describe the broad
relationship between financial inclusion and human development. We find that level of
human development and that of financial inclusion are strongly positively correlated,
although few exceptions exist.
Our empirical analysis confirms that income as measured by per capita GDP is an
important factor in explaining the level of financial inclusion in a country. Going beyond
per capita GDP, we find that income inequality, adult literacy and urbanisation are also
important factors. Further, physical and electronic connectivity and information
availability, indicated by road network, telephone and internet usage, also play positive
role in enhancing financial inclusion. These findings strengthen the assertion that financial
exclusion is indeed a reflection of social exclusion, as countries having lowGDP per capita,
relatively higher levels of income inequality, low rates of literacy, low urbanisation and
poor connectivity seem to be less financially inclusive.
From among the banking sector variables, we find that the proportion of NPAs is
negatively associated with financial inclusion, indicating contrary to the widely held view
that NPAs are a result of providing credit to the low income groups that enhances financial
inclusion. The capital asset ratio (CAR) is seen to be negatively associated with financial
inclusion. In other words, when the CAR of a country is high, the banking system tends to
be more cautious in opening its doors to the financially excluded. Foreign ownership in the
banking sector is seen to be negatively affecting financial inclusion, while government
ownership does not have a significant effect. Finally, interest rate does not seem to be
significantly associated with financial inclusion.
This study does not cover the effects of public policy initiatives specifically aimed
at improving financial inclusion. The effects of such initiatives on financial inclusion
can be expected to be positive and significant. However, initiatives such as facilitating low
cost bank accounts for the financially excluded may improve only one dimension viz.,
banking penetration. Improvement in other dimensions such as availability and usage does
require a general improvement in the physical and banking infrastructure and human
development.
To conclude, our study shows that building of financially inclusive societies would
require attempts to reduce income inequality, enhance literacy levels and improve physical
and communication infrastructure. Our study also indicates that policy makers should rely
more on domestic banks than foreign-owned banks for achieving higher levels of financial
inclusion.
Copyright # 2010 John Wiley & Sons, Ltd. J. Int. Dev. 23, 613–628 (2011)
DOI: 10.1002/jid
626 M. Sarma and J. Pais
REFERENCES
Barr M. 2004. Banking the poor. Yale Journal on Regulation 21: 122–239.
Beck T, Demirguc-Kunt A, Soledad M, Peria M. 2007. Reaching out: access to and use of banking
services across countries. Journal of Financial Economics 85(1): 234–266.
Berger AN, Klapper LF, Udell GF. 2001. The ability of banks to lend to informationally opaque small
business. Journal of Banking and Finance 25: 2127–2167.
Buckland J, Guenther B, Boichev G, Geddie H, MutchM. 2005. There Are No Banks Here: Financial
and Insurance Exclusion Services in Winnipeg’s North End. Winnipeg Inner-City Research
Alliance (WIRA). University of Winnipeg: Canada.
Carbo S, Gardener EPM, Molyneux P. 2005. Financial Exclusion. Palgrave MacMillan: England.
Conroy J. 2005. APEC and financial exclusion: missed opportunities for collective action? Asia-
Pacific Development Journal 12(1): 53–79.
Collard S, Kempson E, Whyley C. 2001. Tackling Financial Exclusion – An Area-Based Approach.
The Policy Press: UK.
COMPAS. 2005. Report on Informal Remittance Systems in Africa, Caribbean and Pacific (ACP)
countries. ESRC Centre on Migration, Policy and Society (COMPAS), University of Oxford.
Connolly C, Hajaj K. 2001. Financial Services and Social Exclusion. Financial Services Consumer
Policy Centre, University of New South Wales.
Corr C. 2006. Financial Exclusion in Ireland: An Exploratory Study and Policy Review. Combat
Poverty Agency Research Series 39.
Detragiache E, Tressel T, Gupta P. 2006. Foreign banks in poor countries: theory and evidence. IMF
Working Paper WP/06/18, International Monetary Fund, Washington, D.C.
Djankov S,Miranda P, Seira E, Sharma S. 2008.Who are the Unbanked?World Bank Policy Research
Working Paper 4647, World Bank, Washington, D.C.
El Qorchi M, Maimbo SM, Wilson JW. 2003. Informal funds transfer systems: an analysis of the
informal Hawala system. Occasional Paper No. 222, International Monetary Fund, Washington,
D.C.
European Commission. 2008. Financial services provision and prevention of financial exclusion.
Report by the Director General for Employment, Social Affairs and Equal Opportunities, European
Commission.
Goodwin D, Adelman L, Middleton S, Ashworth K. 2000. Debt, money management and access to
financial services: evidence from the 1999 PSE Survey of Britain. 1999 PSE Survey Working
Paper 8, Centre for Research in Social Policy, Loughborough University.
Gormley TA. 2007. Banking Competition in Developing Countries: Does Foreign Bank Entry
Improve Credit Access? John M. Olin School of Business, Washington University: St. Louis.
ILO. 2002. Women and Men in the Informal Economy: A Statistical Picture. International Labour
Office: Geneva.
Kempson E, Atkinson A, Pilley O. 2004. Policy level response to financial exclusion in developed
economies: lessons for developing countries. Report of Personal Finance Research Centre,
University of Bristol.
Kempson E, Whyley C. 1998. Access to Current Accounts. British Bankers’ Association: London.
Kempson E, Whyley C. 1999. Kept Out or Opted Out? Policy Press: Bristol.
Kempson E, Whyley C. 2001. Payment of Pension and Benefits. Department for Work and Pension:
London.
Leyshon A, Thrift N. 1995. Geographies of financial exclusion: financial abandonment in Britain and
the United States. Transactions of the Institute of British Geographers, New Series 20(3): 312–341.
Copyright # 2010 John Wiley & Sons, Ltd. J. Int. Dev. 23, 613–628 (2011)
DOI: 10.1002/jid
Financial Inclusion and Development 627
Maimbo SM. 2004. The regulation and supervision of informal remittance systems: emerging
oversight strategies. Paper presented at the IMF Seminar on Current Developments in Monetary
and Financial Law, Washington D.C.
Mohan R. 2006. Economic growth, financial deepening and financial inclusion. Address at the
Annual Bankers’ Conference 2006, Hyderabad on November 3, 2006. Available at: http://
rbidocs.rbi.org.in/rdocs/Speeches/PDFs/73697.pdf), accessed in July 2007.
Puri S, Ritzema T. 1999. Migrant worker remittances, micro-finance and the informal economy:
prospects and issues. Working Paper No. 21, Social Finance Unit, International Labour Office,
Geneva.
Rangarajan Committee. 2008. Report of the Committee on Financial Inclusion. Government of India.
Reddy PK. 2002. A comparative study of non performing assets in India in the global context –
similarities and dissimilarities, remedial measures. Working Paper, Indian Institute of Manage-
ment, Ahmedabad.
Sarma M. 2008. Index of financial inclusion. ICRIER Working Paper No 215, June 2008.
Seidman E, Tescher J. 2005. From Unbanked to Homeowner: Improving the Supply of Financial
Services for Low-Income, Low-Asset Customers. In Building Assets, Building Credit: Creating
Wealth in Low-income Communities. Retsinas NP, Belsky ES (eds.). Brookings Institution Press:
Washington, DC, pp. 316–347.
Solo TM, Manroth A. 2006. Access to financial services in Colombia – the unbanked in Bogota.
World Bank Policy Research Paper 3834.
WTO. 2005. Liberalization of Financial Services, Communication From Australia, Bahrain, Canada,
The European Communities, Japan, Norway, Oman, Panama, Singapore, Switzerland, The
Separate Customs Territory Of Taiwan, Penghu, Kinmen and Matsu, and the United States
(TN/S/W/43, S/FIN/W/43, (05-2335); available at: http://trade.ec.europa.eu/doclib/docs/2005/
december/tradoc_126552.pdf), accessed in September 2008.
Copyright # 2010 John Wiley & Sons, Ltd. J. Int. Dev. 23, 613–628 (2011)
DOI: 10.1002/jid
628 M. Sarma and J. Pais