Embed Size (px)
Citation preview
American Journal of Transplantation 2006; 6: 1257–1263Blackwell Munksgaard
C© 2006 The AuthorsJournal compilation C© 2006 The American Society of
Transplantation and the American Society of Transplant Surgeons
doi: 10.1111/j.1600-6143.2006.01329.xMinireview
Financial Outcomes in Transplantation—A Provider’sPerspective
M. M. Abecassis∗
Feinberg School of Medicine, Northwestern University,Chicago, Illinois, USA∗Corresponding author: Michael M. Abecassis,[email protected]
Despite a relatively large body of literature on health-care economics, including the economics of transplan-tation, there is a paucity of literature on financial out-comes of transplant procedures. Yet, there is a greatneed for transplant professionals to understand the fi-nancial elements of their transplant programs. Theseinclude, among others, reimbursement, cost and netincome. This type of analysis requires a thoroughunderstanding of the complex interactions betweenpayers and providers of care and an understanding ofaccounting practices within the individual institutionincluding the details of cost accounting. This minire-view will address the essential components of the eval-uation of financial outcomes in transplantation.
Key words: Business of transplantation, finance,financial evaluation, financial outcomes, transplantcenter economics, transplant profitability
Received 18 January 2006, revised 17 February 2006and accepted for publication 21 February 2006
Introduction
In the past, the majority of physicians and surgeons have
not paid as much attention to financial outcomes as they
have to clinical outcomes. Although health-care economic
studies have been used to evaluate new medical treat-
ments and technologies, these analyses have typically fo-
cused on cost-effectiveness (1,2), and not on financial out-
comes. Transplantation procedures have been evaluated
for cost-effectiveness utilizing various paradigms, and al-
though the details of these economic evaluations contain
multiple assumptions that may question the relevance of
the analyses, in general, transplantation is felt to be cost-
effective (3). For example, it is well established that kidney
transplantation is cost-effective by reducing cost in the
long-term when compared to chronic dialysis. Economic
analyses, such as cost-effectiveness studies, measure
societal relative values defined by specific economic pa-
rameters. For instance, the value of a new technology is
evaluated in the context of a pareto-optimal perspective in
order to maximize the total societal value. Thus, the cost
of an intervention is compared to the cost of other thera-
peutic options to determine if the intervention in question
results in overall cost reduction. Alternatively, the cost of
a procedure is compared to the societal gain measured by
quality-adjusted life years saved. In most studies, a dollar
value is assigned to each life year saved, in order to cal-
culate the potential economic benefit of the intervention
under evaluation. In contrast to these types of economic
analyses, financial evaluations are calculations of cost ver-
sus revenue (4). Financial outcomes are defined by a num-
ber of ‘margins’. The bottom line of a financial evaluation
consists of a margin which is in turn defined by the reim-
bursement (revenue) minus the total cost (production cost)
for a specific procedure. Financial outcomes in transplan-
tation can be calculated for a specific patient encounter
or procedure based on knowledge of the cost allocated to
the encounter and of the specific revenue recognized for
the particular encounter. Alternatively, aggregate financial
evaluations can be performed for a spectrum of services
provided for a particular transplant recipient, for a cohort
of recipients from a single payer, for organ-specific cohorts
and for the transplant program as a whole at a particular
institution. An accurate evaluation of the financial outcome
for a clinical event is predicated on a clear understanding
of the accounting practices that determine cost allocation
and revenue recognition, including any reconciliation that
may occur downstream in the revenue cycle. One of the
caveats of financial analyses is that cost-accounting prac-
tices may vary greatly between institutions. For instance,
an institution may choose to allocate indirect costs to the
transplant cost center, thus magnifying its impact on the
profitability of the transplant program, whereas another
institution may elect to allocate those costs across the
institution as a whole, thus improving the profitability of
the transplant cost center. Therefore, any financial evalu-
ation must be adjusted for accounting practices, such as
allocation of indirect costs, which may impact the calcula-
tion of the production costs. Similarly, the revenue is de-
fined by the type of contractual agreement between the
payer and the provider for the particular service provided,
as well as by the manner in which the provider recog-
nizes revenue in a particular revenue cycle, especially in
the context of reimbursement for bundled services. This
mini-review will provide a framework for evaluating finan-
cial outcomes in transplantation specifically from a provider
perspective.
1257
Abecassis
Providers and Payers
We will limit the definition of providers to hospitals and
physicians, since most contractual agreements for the pro-
vision of transplant services include these two groups.
It should be clear that the relationship between hospi-
tals and physicians may vary greatly between institutions.
For the physicians, the provider under contract consists
of the physicians’ employer. The hospital may employ the
physicians, and in this case, there is only one contracted
provider, whereas in the case where the physicians are em-
ployed by a practice plan, or the school of medicine, there
are two providers under contract who may need to develop
their own internal contractual agreements: the physicians
and the hospital. For instance, a practice plan may charge
a hospital for services rendered by physicians on behalf of
the hospital’s transplant program. In this case, the hospi-
tal will receive payments from the payer and in turn will
compensate the practice plan for services rendered. Alter-
natively, the physicians and the hospital could both bill the
payer separately, in which case revenue is recognized in-
dividually by each party against their respective charges.
These peculiarities will affect financial evaluations greatly,
especially in the calculation of costs, and in the recognition
of revenue.
The payers can be divided into regulatory payers, namely
Medicare and Medicaid (Center for Medicare and Medi-
caid Services, CMS), and commercial payers. It should be
noted that the commercial payers consist primarily of trans-
plant payer networks. These payers differ greatly from the
typical third-party commercial payer because coverage for
transplant services is typically ‘carved out’ of most pa-
tients’ coverage benefits (5). Therefore, when hospitals
or physician-groups contract for general medical and sur-
gical care of patients covered by specific insurers, trans-
plant benefits are not included. Instead, these carved-out
services are contracted separately. Most insurers will not
contract directly with providers for these services. Rather,
they will outsource contracting for these services to large
transplant payer networks in exchange for some type of
monetary compensation consisting of either part of the
insurance premium fee, or alternatively a ‘broker’ fee of
sorts. Therefore, an insurer will pay a certain amount for a
‘case-rate’, and in turn, the ‘broker’ will pay a contracted
rate to the provider that is the balance of the insurer’s fee
minus the broker’s fee. There are about a dozen such net-
works that manage the majority of transplant procedures
in the United States. These networks compete for insurer
groups to provide ‘transplant network benefits’ to patients
otherwise insured by third-party payers. Reimbursement
from the regulatory payers is straightforward for the most
part, whereas reimbursement from commercial payers can
be extremely complex, especially in terms of recognizing
revenue against cost. For the most part, reimbursement
from commercial payers is predicated on the principles of
managed care. This means that the financial risk is shared
between the payer and the provider. Instead of a one-to-
one relationship between cost and reimbursement (indem-
nity insurance) where the payer assumes all the financial
risk, in managed care arrangements, the provider will as-
sume part of the risk, especially in ‘bad cases’, where costs
become exceedingly high due to clinical complications.
Under these conditions, reimbursement may be essen-
tially ‘capped’ under a case-rate or under a global payment
schedule. For commercial payers, this payment methodol-
ogy may involve all components of cost, including physi-
cians, hospital and organ acquisition, whereas for regula-
tory payers, this type of global reimbursement is applicable
namely to hospitalization charges.
Financial evaluations must take into consideration these
complex interactions between providers and payers in or-
der to allocate costs and recognize revenues appropriately
(Figure 1).
Cost Allocation
In transplantation, there are three components of cost:
physician services, hospital services and organ acquisition
costs (OACs). The latter is unique to transplantation and
causes the most confusion. OACs are defined by a set of
CMS regulations (6) which are subject to some interpreta-
tion, but which in turn are auditable by the Office of the
Inspector General (7). Costs attributable to OAC include,
in addition to the cost of the procuring all organ(s) trans-
planted, any costs incurred in the evaluation of all potential
recipients and living donors at a specific institution for a
defined period of time, regardless of whether the patients
become actual transplant recipients. This may include the
salaries and benefits of all personnel involved in these ac-
tivities, as well as indirect costs directly attributable to
these activities, including office rent, computers, office
supplies, etc. In addition, physician services necessary for
these evaluations can be charged to the organ-specific or-
gan acquisition cost center (OACC). The OAC also includes
any costs incurred in maintaining organ-specific recipient
candidate waiting lists, such as the cost of immunologi-
cal testing necessary to define the status of the potential
recipient.
Hospital services for transplantation can be defined in
terms of the type of patient encounter. The most straight-
forward consists of the transplant admission or episode.
Costs assigned to this episode typically include costs in-
curred from 24 hours prior to the transplant procedure to
the time of discharge of the patient from the hospital. Thus,
if the patient is in the hospital for any period of time prior to
the transplant, or if the patient is readmitted to the hospital
following transplantation, costs associated with these pe-
riods of care are not included in the calculation of cost for
the transplant procedure unless the contractual arrange-
ment does not allow for the separation of the cost related
1258 American Journal of Transplantation 2006; 6: 1257–1263
Financial Outcomes in Transplantation
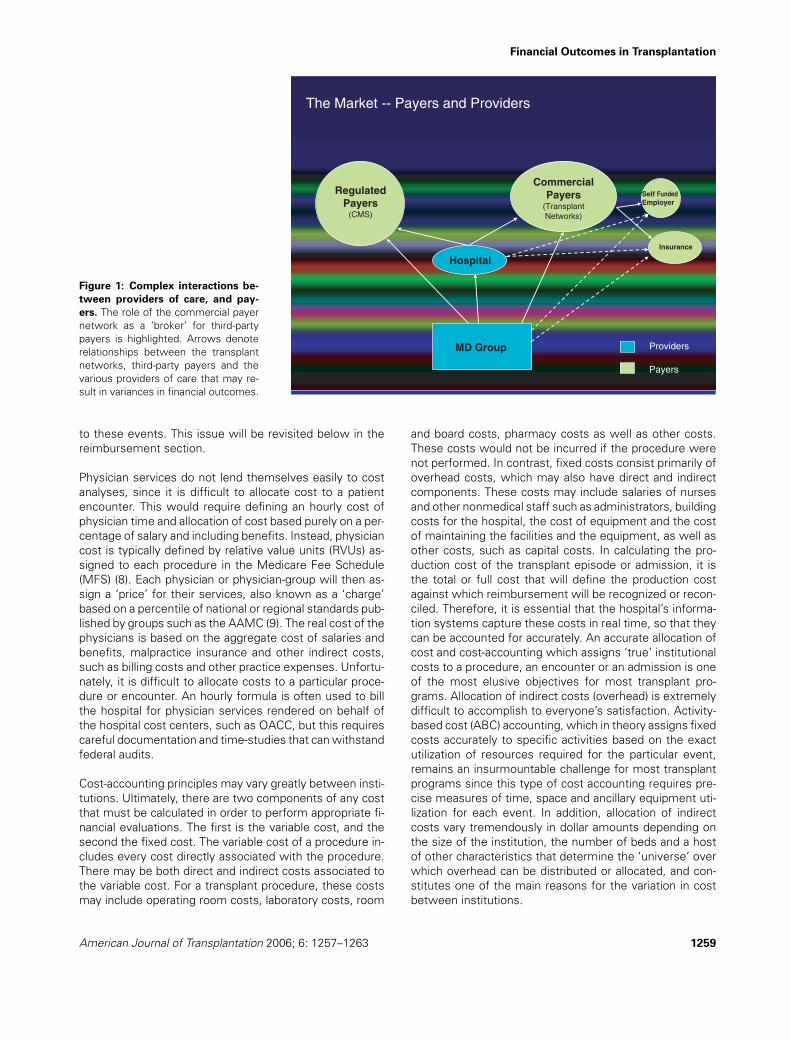
The Market -- Payers and Providers
Regulated
Payers(CMS)
Commercial
Payers(Transplant
Networks)
Self Funded
Employer
Insurance
Hospital
MD Group Providers
Payers
Figure 1: Complex interactions be-tween providers of care, and pay-ers. The role of the commercial payer
network as a ‘broker’ for third-party
payers is highlighted. Arrows denote
relationships between the transplant
networks, third-party payers and the
various providers of care that may re-
sult in variances in financial outcomes.
to these events. This issue will be revisited below in the
reimbursement section.
Physician services do not lend themselves easily to cost
analyses, since it is difficult to allocate cost to a patient
encounter. This would require defining an hourly cost of
physician time and allocation of cost based purely on a per-
centage of salary and including benefits. Instead, physician
cost is typically defined by relative value units (RVUs) as-
signed to each procedure in the Medicare Fee Schedule
(MFS) (8). Each physician or physician-group will then as-
sign a ‘price’ for their services, also known as a ‘charge’
based on a percentile of national or regional standards pub-
lished by groups such as the AAMC (9). The real cost of the
physicians is based on the aggregate cost of salaries and
benefits, malpractice insurance and other indirect costs,
such as billing costs and other practice expenses. Unfortu-
nately, it is difficult to allocate costs to a particular proce-
dure or encounter. An hourly formula is often used to bill
the hospital for physician services rendered on behalf of
the hospital cost centers, such as OACC, but this requires
careful documentation and time-studies that can withstand
federal audits.
Cost-accounting principles may vary greatly between insti-
tutions. Ultimately, there are two components of any cost
that must be calculated in order to perform appropriate fi-
nancial evaluations. The first is the variable cost, and the
second the fixed cost. The variable cost of a procedure in-
cludes every cost directly associated with the procedure.
There may be both direct and indirect costs associated to
the variable cost. For a transplant procedure, these costs
may include operating room costs, laboratory costs, room
and board costs, pharmacy costs as well as other costs.
These costs would not be incurred if the procedure were
not performed. In contrast, fixed costs consist primarily of
overhead costs, which may also have direct and indirect
components. These costs may include salaries of nurses
and other nonmedical staff such as administrators, building
costs for the hospital, the cost of equipment and the cost
of maintaining the facilities and the equipment, as well as
other costs, such as capital costs. In calculating the pro-
duction cost of the transplant episode or admission, it is
the total or full cost that will define the production cost
against which reimbursement will be recognized or recon-
ciled. Therefore, it is essential that the hospital’s informa-
tion systems capture these costs in real time, so that they
can be accounted for accurately. An accurate allocation of
cost and cost-accounting which assigns ‘true’ institutional
costs to a procedure, an encounter or an admission is one
of the most elusive objectives for most transplant pro-
grams. Allocation of indirect costs (overhead) is extremely
difficult to accomplish to everyone’s satisfaction. Activity-
based cost (ABC) accounting, which in theory assigns fixed
costs accurately to specific activities based on the exact
utilization of resources required for the particular event,
remains an insurmountable challenge for most transplant
programs since this type of cost accounting requires pre-
cise measures of time, space and ancillary equipment uti-
lization for each event. In addition, allocation of indirect
costs vary tremendously in dollar amounts depending on
the size of the institution, the number of beds and a host
of other characteristics that determine the ‘universe’ over
which overhead can be distributed or allocated, and con-
stitutes one of the main reasons for the variation in cost
between institutions.
American Journal of Transplantation 2006; 6: 1257–1263 1259
Abecassis
Global Case Rate
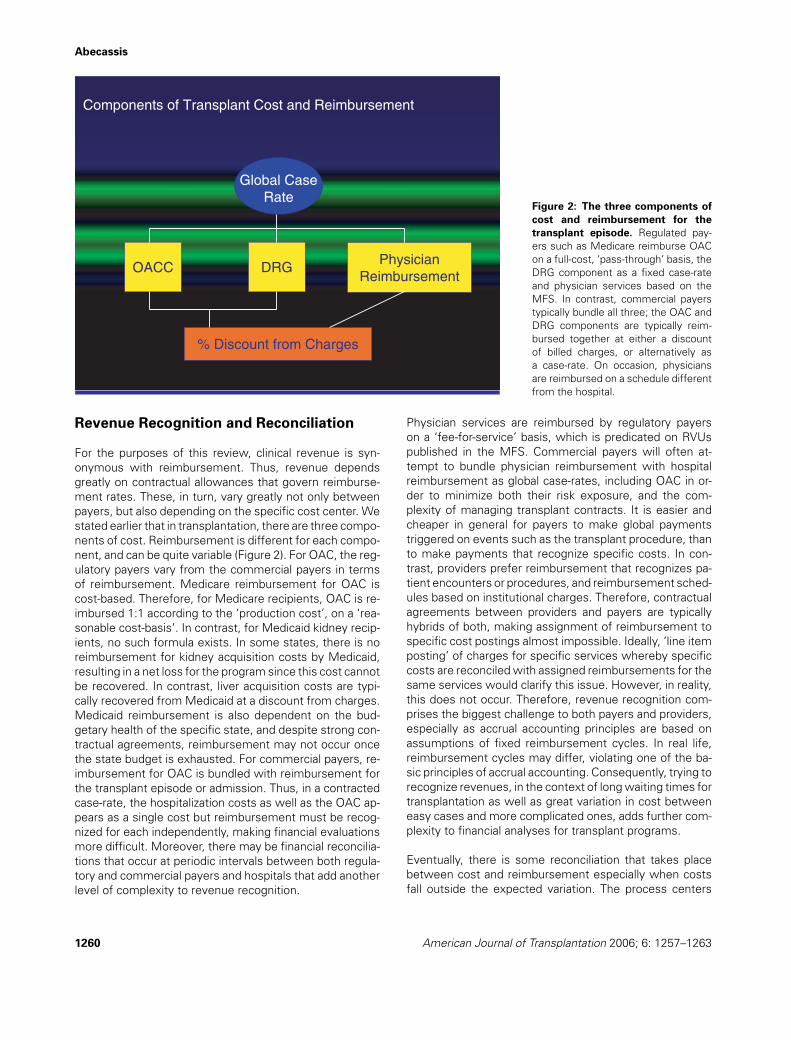
Components of Transplant Cost and Reimbursement
OACC DRGPhysician
Reimbursement
% Discount from Charges
Figure 2: The three components ofcost and reimbursement for thetransplant episode. Regulated pay-
ers such as Medicare reimburse OAC
on a full-cost, ‘pass-through’ basis, the
DRG component as a fixed case-rate
and physician services based on the
MFS. In contrast, commercial payers
typically bundle all three; the OAC and
DRG components are typically reim-
bursed together at either a discount
of billed charges, or alternatively as
a case-rate. On occasion, physicians
are reimbursed on a schedule different
from the hospital.
Revenue Recognition and Reconciliation
For the purposes of this review, clinical revenue is syn-
onymous with reimbursement. Thus, revenue depends
greatly on contractual allowances that govern reimburse-
ment rates. These, in turn, vary greatly not only between
payers, but also depending on the specific cost center. We
stated earlier that in transplantation, there are three compo-
nents of cost. Reimbursement is different for each compo-
nent, and can be quite variable (Figure 2). For OAC, the reg-
ulatory payers vary from the commercial payers in terms
of reimbursement. Medicare reimbursement for OAC is
cost-based. Therefore, for Medicare recipients, OAC is re-
imbursed 1:1 according to the ‘production cost’, on a ‘rea-
sonable cost-basis’. In contrast, for Medicaid kidney recip-
ients, no such formula exists. In some states, there is no
reimbursement for kidney acquisition costs by Medicaid,
resulting in a net loss for the program since this cost cannot
be recovered. In contrast, liver acquisition costs are typi-
cally recovered from Medicaid at a discount from charges.
Medicaid reimbursement is also dependent on the bud-
getary health of the specific state, and despite strong con-
tractual agreements, reimbursement may not occur once
the state budget is exhausted. For commercial payers, re-
imbursement for OAC is bundled with reimbursement for
the transplant episode or admission. Thus, in a contracted
case-rate, the hospitalization costs as well as the OAC ap-
pears as a single cost but reimbursement must be recog-
nized for each independently, making financial evaluations
more difficult. Moreover, there may be financial reconcilia-
tions that occur at periodic intervals between both regula-
tory and commercial payers and hospitals that add another
level of complexity to revenue recognition.
Physician services are reimbursed by regulatory payers
on a ‘fee-for-service’ basis, which is predicated on RVUs
published in the MFS. Commercial payers will often at-
tempt to bundle physician reimbursement with hospital
reimbursement as global case-rates, including OAC in or-
der to minimize both their risk exposure, and the com-
plexity of managing transplant contracts. It is easier and
cheaper in general for payers to make global payments
triggered on events such as the transplant procedure, than
to make payments that recognize specific costs. In con-
trast, providers prefer reimbursement that recognizes pa-
tient encounters or procedures, and reimbursement sched-
ules based on institutional charges. Therefore, contractual
agreements between providers and payers are typically
hybrids of both, making assignment of reimbursement to
specific cost postings almost impossible. Ideally, ‘line item
posting’ of charges for specific services whereby specific
costs are reconciled with assigned reimbursements for the
same services would clarify this issue. However, in reality,
this does not occur. Therefore, revenue recognition com-
prises the biggest challenge to both payers and providers,
especially as accrual accounting principles are based on
assumptions of fixed reimbursement cycles. In real life,
reimbursement cycles may differ, violating one of the ba-
sic principles of accrual accounting. Consequently, trying to
recognize revenues, in the context of long waiting times for
transplantation as well as great variation in cost between
easy cases and more complicated ones, adds further com-
plexity to financial analyses for transplant programs.
Eventually, there is some reconciliation that takes place
between cost and reimbursement especially when costs
fall outside the expected variation. The process centers
1260 American Journal of Transplantation 2006; 6: 1257–1263
Financial Outcomes in Transplantation
on the concept of ‘stop loss’, also known as ‘outlier pro-
tection’. Medicare has well-established outlier thresholds
that allow hospitals to reconcile costs with reimburse-
ment. Once hospital charges exceed the Diagnosis Related
Group (DRG) reimbursement beyond a threshold gap (set
by Medicare), reimbursement converts to a percentage of
charges rather than a fixed amount (10). This percentage
is set low enough that profit is unlikely, yet high enough so
that the hospital can recover its costs. Unfortunately, the
‘gap’ between the costs required to trigger the outlier pro-
tection and the fixed reimbursement is large enough that
this type of protection only affects outliers far in excess
of cost. Therefore all transplant recipients whose cost falls
between the two (‘in the gap’) trigger no further reimburse-
ment beyond the set DRG payment. Commercial payers
have similar language built into their contracts so that a
‘floor’ forms the basis for outlier reimbursement. There
are ‘inlier’ and ‘outlier’ thresholds that define ‘ceilings’ and
‘floors’, respectively, for case-rate reimbursements when
billed charges fall outside the expected range. Nonethe-
less, it is clear that as the cost increases as a result of
the various cost-drivers, the reimbursement-to-cost ratio
decreases, regardless of outlier protection language.
Reimbursement from commercial payers depends entirely
on the language of the contractual agreement between
the payer and the provider(s) (11). A potential threat to
providers is that with the proliferation of transplant cen-
ters, transplant services can become commoditized. Com-
modities are defined as products or services that have little
or no differentiation such that their purchase can be made
from a number of providers in a price-sensitive manner.
Any market where products or services command premi-
ums (margins) because of their differentiation will attract
new providers in search of those margins. If the barriers to
entry are high, the market will not allow new providers to
enter. If these barriers are lowered, new providers will en-
ter the market, erode margins and the products or services
become commodities. This trend is becoming apparent in
the transplant market and there may be two immediate
consequences. First, transplant programs must become
cost-efficient in order to compete (12). It is clear that as
a result of the managed care infiltration of the transplant
market, this is rapidly occurring. This is not necessarily a
bad thing, since it lowers the cost of transplantation. The
vast majority of transplant programs have become cost-
conscious in order to compete effectively. Second, trans-
plant programs must introduce differentiation back into the
services they provide, in order to be able to command a pre-
mium. Differentiation of product services has occurred as
a result of innovation by transplant physicians. Examples
of this include laparoscopic donor nephrectomy and living
donor procedures beyond the standard living donor kidney
transplant, only to name a couple. However, it is clear that
transplant payer networks also compete for market share
among the hundreds of third-party payers who seek their
volume discounts and transplant case management exper-
tise in order to minimize the risk they assume for their
covered lives. As these networks describe their transplant
coverage products to their potential clients, they too must
differentiate these products. When the networks compose
their lists of preferred providers they must balance the is-
sues of patient access to transplant centers versus the
notion of selected transplant centers of excellence. The
former is attractive to third-party payers and ultimately to
patients, since it eliminates restriction to access, whereas
the latter allows the networks to achieve both clinical and
financial objectives that define their respective networks.
Financial Evaluation and Performance
Financial evaluation requires a clear understanding of cost
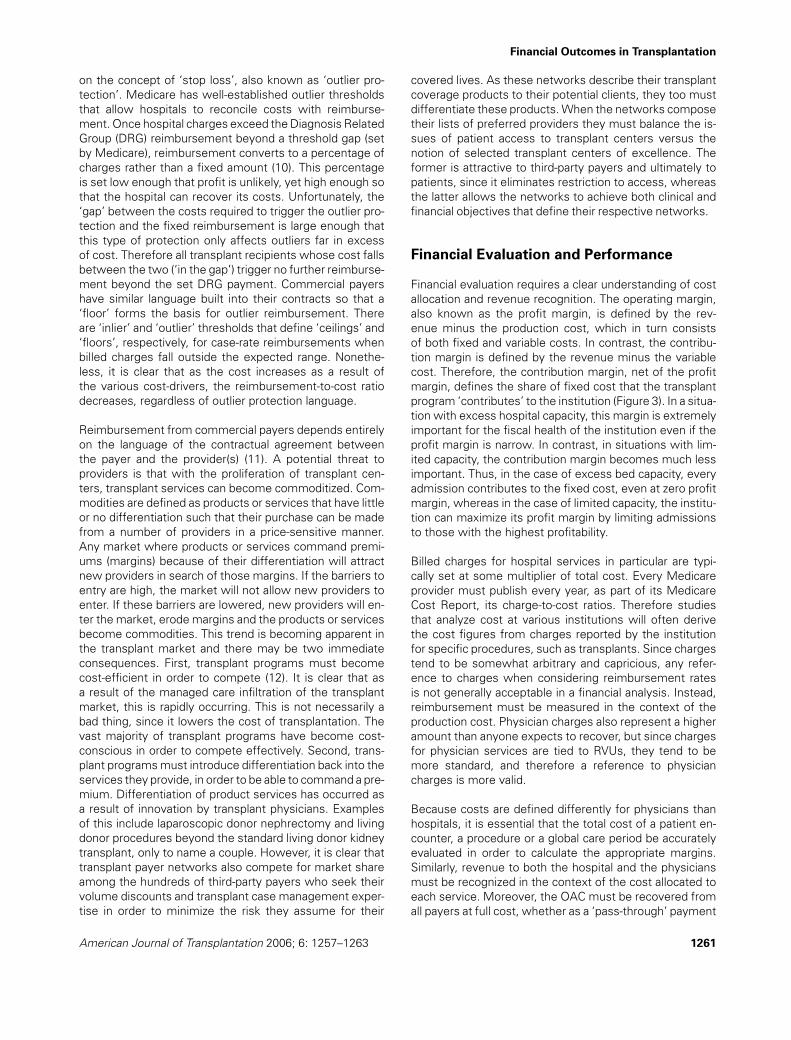
allocation and revenue recognition. The operating margin,
also known as the profit margin, is defined by the rev-
enue minus the production cost, which in turn consists
of both fixed and variable costs. In contrast, the contribu-
tion margin is defined by the revenue minus the variable
cost. Therefore, the contribution margin, net of the profit
margin, defines the share of fixed cost that the transplant
program ‘contributes’ to the institution (Figure 3). In a situa-
tion with excess hospital capacity, this margin is extremely
important for the fiscal health of the institution even if the
profit margin is narrow. In contrast, in situations with lim-
ited capacity, the contribution margin becomes much less
important. Thus, in the case of excess bed capacity, every
admission contributes to the fixed cost, even at zero profit
margin, whereas in the case of limited capacity, the institu-
tion can maximize its profit margin by limiting admissions
to those with the highest profitability.
Billed charges for hospital services in particular are typi-
cally set at some multiplier of total cost. Every Medicare
provider must publish every year, as part of its Medicare
Cost Report, its charge-to-cost ratios. Therefore studies
that analyze cost at various institutions will often derive
the cost figures from charges reported by the institution
for specific procedures, such as transplants. Since charges
tend to be somewhat arbitrary and capricious, any refer-
ence to charges when considering reimbursement rates
is not generally acceptable in a financial analysis. Instead,
reimbursement must be measured in the context of the
production cost. Physician charges also represent a higher
amount than anyone expects to recover, but since charges
for physician services are tied to RVUs, they tend to be
more standard, and therefore a reference to physician
charges is more valid.
Because costs are defined differently for physicians than
hospitals, it is essential that the total cost of a patient en-
counter, a procedure or a global care period be accurately
evaluated in order to calculate the appropriate margins.
Similarly, revenue to both the hospital and the physicians
must be recognized in the context of the cost allocated to
each service. Moreover, the OAC must be recovered from
all payers at full cost, whether as a ‘pass-through’ payment
American Journal of Transplantation 2006; 6: 1257–1263 1261
Abecassis
Figure 3: Relationship betweenbilled charges, reimbursement (rev-enue), full cost (fixed plus variable),and contribution and profit mar-gins. Note that the contribution margin
includes fixed cost and profit margin,
since it represents reimbursement net
of variable cost.
from regulatory payers or as an internal transfer to the OAC
from global payments from the payer network. It is impor-
tant to understand that the OAC may be as much as two
or three times the cost of the transplant admission, es-
pecially for kidney transplants. Since reimbursement from
regulatory payers does not allow for any profit in OACC,
the profitability of the transplant program relies entirely on
the margin of the hospitalization. Therefore, the reimburse-
ment minus the cost of the hospitalization or admission
for the transplant will ultimately define the profitability of
the transplant program. This means that close attention to
cost-drivers, such as length-of-stay, resource utilization and
pharmacy costs, will define profit margins. Length-of-stay
is an excellent surrogate for cost, since per diem utiliza-
tion of resources generally drives inpatient costs. For com-
mercial payers, since the reimbursement for OAC and the
hospitalization is bundled, the OAC will also define the prof-
itability and the competitive advantage (or disadvantage) of
the transplant program. The higher the OAC, and the least
cost-efficient the program, the lower the profitability (13).
Conclusion
Financial outcomes and performance should take a dis-
tant third place to standard quality measures such as
clinical outcomes and patient satisfaction. Clearly, finan-
cial performance should compromise neither. Clinical out-
comes can be risk-adjusted in order to assess clinical
performance. In contrast, financial outcomes do not typi-
cally involve incremental risk-adjustment and therefore dif-
ficult cases result in significant financial risk exposure for
both the provider and the insurer. Managed care contracts
spread the financial risk, and outlier protection blunts the
financial impact of risk for both parties, but only when
billed charges exceed contracted thresholds. Nonetheless,
high-risk cases can impact negatively on the financial per-
formance of all parties with the exception of the payer
networks. In high-risk cases, provider charges may be as-
tronomical, but the providers will get reimbursed based on
outlier protection, at a fraction of their charges and typi-
cally without profit. The insurers are exposed to financial
risk as well based on the standard case-rate plus the out-
lier payments. Reinsurance, which is typically acquired by
insurers to cover catastrophic risk, will soften the blow
for the insurer. In contrast, the payer network will recover
their fee regardless, but in high-risk cases, will be able to
demonstrate to their client, the insurer, that belonging
to the payer network has resulted in significant savings
to the insurer, thus reiterating the importance of the payer
networks.
For the provider, financial evaluations can be reported in
a number of ways, the most important being the cost-to-
reimbursement ratio. This ratio can be calculated for the
transplant episode by organ type, by payer, and for the
program as a whole. A clear financial analysis will allow
the transplant center to decipher both the cost and the
reimbursement. Profitability can then be optimized either
by reducing the cost, or by maximizing revenue through a
reassessment of contractual agreements. The former may
require a better understanding of allocation of indirect costs
to the program by the institution. The latter may necessi-
tate an evaluation of the strategic importance of each payer
to the program. Thus, a program may choose to accept a
lower margin from a payer it views to be important in terms
of market share, whereas it may accept nothing short of
a wide margin from a less important payer. Alternatively, a
1262 American Journal of Transplantation 2006; 6: 1257–1263
Financial Outcomes in Transplantation
program may set a certain margin threshold for all payers,
regardless of how the payer is viewed by the institution.
Despite the best pricing strategies, the institution will ulti-
mately discover that their pricing will be influenced by that
of the competitors in their respective markets. This type of
price sensitivity is most obvious in markets saturated with
both providers and payer networks. One of the antidotes to
such commoditization consists of building brand strength,
whereby the payer sees inclusion of a certain payer as es-
sential by virtue of their ‘brand’ recognition. However, few
transplant centers can achieve such a marketable brand.
Alternatively, transplant centers may provide unique ser-
vices that command a premium in the market place. There-
fore, the profitability of a program is ultimately defined first
by its ability to obtain favorable reimbursement, as defined
by payer market forces, and second by adopting both cost
containment and differentiating strategies.
Although this manuscript provides a framework for the fi-
nancial evaluation of transplantation for programs in the
United States, most of the concepts discussed can also
apply to programs in countries with single payer systems,
such as Canada, and to transplant programs in most coun-
tries in Europe and Asia. Ultimately, successful financial
outcomes depend on reimbursement for transplant ser-
vices that exceed their production costs. Finance, after all,
is a universal discipline.
References
1. Doubilet P, Weinstein MC, McNeil BJ. Use and misuse of the
term cost-effective. N Engl J Med 1986; 314: 253–256.
2. Weinstein MC, Siegel JE, Gold MR, Kamlet MS, Russell LB, for
the Panel on Cost-Effectiveness in Health and Medicine. Rec-
ommendations of the Panel on Cost-Effectiveness in Health and
Medicine. JAMA 1996; 276: 1253–1258.
3. Evans RW. Cost-effectiveness analysis of transplantation. Surg
Clin North Am 1986; 66: 603–616.
4. Torgerson D, Raftery J. Measuring outcomes in economic evalu-
ations. BMJ 1999; 318: 1413.
5. Evans RW. Discount pricing and the “cost” of liver transplantation.
Liver Transpl 2000; 6: 119–121.
6. 42 CFR 412.100.
7. www.oig.hhs.gov.
8. http://www.cms.hhs.gov/PhysicianFeeSched/.
9. AAMC Data Book. Association of American Medical Colleges,
Washington, DC.
10. Axelrod DA, Koffron AJ, Baker T et al. The economic impact of
MELD on liver transplant centers. Am J Transpl 2005; 5: 2297–
2301.
11. Ziller EC, Coburn AF, McBride TD, Andrews C. Patterns of indi-
vidual health insurance coverage. Health Affairs (Millwood) 2004;
23: 210–221.
12. Evans RW. Cost containment and managed care in liver transplan-
tation. Acta Gastroenterol Belg 1999; 62: 363–371.
13. Abecassis MM, Kaufman DB, Stuart FP. Organ transplantation fi-
nance. In: Stuart FP, Abecassis MM, Kaufman DB, eds. Organ
Transplantation, 2nd Ed. Georgetown, TX: Landes Bioscience,
2003, chap 19.
Glossary
Pareto-optimality: the best that could be achieved with-
out disadvantaging anyone in the society.
Financial outcome: profitability assessment.
Billed charges: amount billed to payer; retail pricing.
Case-rate: contracted price; wholesale pricing.
Global case-rate: contracted price for defined period of
care.
Revenue: reimbursement.
Revenue recognition: reimbursement is recognized
when it is either accrued or received by the provider.
Revenue cycle: time period between billing for a service
and recognizing reimbursement.
Revenue reconciliation: reimbursement is adjusted
from the amount accrued to the amount paid by the payer.
Production cost: total (full) cost of providing a service.
Direct cost: cost allocated directly to a cost center.
Indirect cost: overhead allocated to a cost center in pro-
portion to the direct cost.
Fixed cost: cost of infrastructure required to provide a
service; consists of both direct and indirect costs.
Variable cost: incremental cost of providing a service;
consists of both direct and indirect costs.
Cost allocation: mainly related to indirect or fixed costs;
a portion of overhead is allocated to an encounter or a pro-
cedure based on an estimated proportion.
Activity-based cost (ABC) allocation: indirect or fixed
costs allocated based on a calculated proportion of total
utilization.
Outlier: unusually high cost or charges.
Outlier threshold: amount of billed charges at which
additional reimbursement beyond contracted case-rate or
global amount is triggered.
Floor: a percentage of charges below which reimburse-
ment occurs at a percentage of charges rather than the
contracted case-rate.
Stop loss: outlier protection designed to reimburse
provider at a predetermined floor to minimize risk expo-
sure.
Contribution margin: reimbursement minus variable
cost.
Profit margin: reimbursement minus production cost.
Net income: profit margin; operating margin; bottom
line.
American Journal of Transplantation 2006; 6: 1257–1263 1263