Embed Size (px)
Citation preview
2C H A P T E R
Financial Sustainability of Protected Areas in Latin America and the Caribbean:
Investment PolIcy GuIdance
1 C H A P T E R
United nations development programme (Undp)
UNDP, through projects financed by the GEF and other sources, has supported the establishment, consolidation and effective management of protected areas in Latin America and the Caribbean for almost two decades. The Energy and Environment Programme of UNDP for Latin America and Caribbean has identified Protected Area Financing as pivotal to ensuring effective protected area systems in the region thereby enabling the provision of key ecosystem services. The Regional Bureau of Latin America and the Caribbean has funded the cost of preparation of this report with support from the Government of Spain.
To assist governments of the region to address the issue of financial sustainability of their protected area systems, UNDP produced, in 2007, a Financial Sustainability Scorecard as an instrument to assist managers and decision makers to identify and present financial needs and gaps in a systematic and periodic manner. In addition, UNDP is continually increasing its portfolio of projects supporting protected area financial sustainability.
the natUre ConservanCy (tnC)
The Nature Conservancy has provided substantial support to countries through technical advice and funding to advance the financial sustainability of national protected areas systems. These include key aspects such as: financial analysis to determine protected area needs and financial gaps and development and implementation of financial mechanismsto fill financial gaps, including those resulting from the establishments of new protected
areas. These have helped to ensure full ecological representation and sustained effective management, which are foundational elements of the CBD’s Programme of Work on Protected Areas. Efforts have been made to work with countries in the formulation of business–oriented financial plans and to measure progress towards financial sustainability. TNC has also worked with national governments to profile commitments in public platforms and to broker regional collaboration with the aim of securing enabling public policy and public and private funding flows. In particular, through undertaking economic analyses of the value of ecosystem services, TNC has facilitated improved understanding of the role of biodiversity and protected areas in supporting sustainable development and in addressing major threats such as climate change that affects livelihoods that are depending on ecosystem services.
The key partners driving the Protected Area Financing Initiative are the UNDP and TNC in the LAC region. Since the initiation of this project a total number of 18 UNDP country offices and 14 experts from TNC have been engaged in the development and implementation of the initiative along with 20 national governments (including 5 states in Brazil).
Financial Sustainability of Protected Areas in Latin America and the Caribbean: Investment Policy GuidanceAndrew Bovarnick1, Jaime Fernandez-Baca2, Jose Galindo3, Helen Negret4
1 Undp lead natural resource economist
2 lead consultant for mesoamerica+
3 lead consultant for south america
4 Undp Biodiversity regional technical adviser
© Copyright UNDP 2010
Citation of Publication:Bovarnick, A., J. Fernandez-Baca, J. Galindo, and H. Negret, Financial Sustainability of Protected Areas in Latin America and the Caribbean: Investment Policy Guidance, United Nations Development Programme (UNDP) and The Nature Conservancy (TNC), 2010. Reproduction of this publication for educational or other non-commercial purposes is authorized without prior written permission from the copyright holder provided the source is fully acknowledged. Reproduction of this publication for resale or other commercial purposes is prohibited without prior written permission of the copyright holder. The designation of geographical entities in this book, and the presentation of the material, do not imply the expression of any opinion whatsoever on the part of participating organizations concerning the legal status of any country, territory, or area, or of its authorities, or concerning the delimitation of its frontiers or boundaries. This initiative has been sponsored by UNDP and TNC. The reports are informed by the results of the Scorecard workshops in each country and follow up consultations. However, the authors are responsible for the analytical content of this report. The views expressed in this publi-cation are those of its authors and do not necessarily represent those of UNDP, TNC, or of the governments or organizations sponsoring the initiative.
For further information please contact:Andrew BovarnickSenior Technical AdvisorLead Natural Resource EconomistUnited Nations Development [email protected]
Lila GilDirector of External Affairs for Latin AmericaThe Nature [email protected]
Editing: Marybeth Shea/Fast Lines, Inc.Art Direction/Design: Jean Manuel Wegimont/Fast Lines, Inc.
©Ch
ris Pa
gue/
TNC
3Co u n T Ry T E A m s
Country teams
Argentina
Diana Uribelarrea, Administración de Parques Nacionales (APN), Directora de Conservación; Eduardo Horacio Álvarez, APN, Jefe de Manejo de Sistemas; Guillermo Martin, APN, Director de Uso de Recursos; Héctor Espina, APN, Presidente de la Dirección; Javier Digregorio, APN, Dirección de Uso de Recursos; María Angélica Borri, APN, Dirección Nacional de Asuntos Internos; Lucas Bustos, Mariano Altamira, APN, Dirección de Uso de Recursos; Silvina Abate, APN, Dirección de Manejo; Aristobulo Maranta, APN, Director del Parque Nacional El Palmar; María Florencia Tanga, APN, Parque Nacional El Palmar; Pablo Tello, APN, Centro de Delegación Regional; Patricia López Sáenz, APN, Delegación Regional del Noroeste de Argentina; Paula Cichero, APN, Delegación Regional del Noreste de Argentina; Ignacio Sagasti, APN, Programas de IBRD y GEF; Santiago Cogorno, APN, Programa del IADB; Diego Moreno, Fundación Vida Silvestre Argentina (FVSA), Director General; German Pale, FVSA, Áreas Protegidas Marinas y Costeras; María José Pacha, FVSA, Coordinadora de Taller; Sarah Jones, FVSA, Directora de Programas Internacionales; Daniel Tomasini, UNDP, Cordinador de Medio Ambiente y Desarrollo Sostenible; Gustavo Iglesias, TNC, Áreas Protegidas Públicas.
Belize
Emily Waight-Aldana, Ministry of Economic Development; Eugene Waight, Ministry of Agriculture and Fisheries; Bert Pacheco, Friends of Swallow Caye, Beverly Wade, Fisheries Department; Isaias Majil, Fisheries Department; James Azueta, Fisheries Department; Cindy Joseph, Rancho Dolores Environment and Development Co. Ltd.; Spanish Creek Wildlife Sanctuary; Dominique Lizama, Belize Audubon Society; Edilberto Romero, Programme for Belize (PFB), Director; Nellie Catzim, National Protected Areas Commission, Coordinator; Ruby Nicholas, PFB; Ellen McRae, The Siwa-ban Foundation; Elma Kay, University of Belize; Florentino Pop, Aguacaliente Management Team; Hyacinth Ysaguirre, Steadfast Tourism and Conservation Association (STACA); Imani Morrison, Oak Foundation; Kristian Parker, Oak Foundation; Leonardo Lacerda, Oak Foundation; Jessie Young, Baboon Sanctuary; Joseph Villafranco, Toledo Institute for Development and Environment (TIDE); Lisel Alamilla, Ya’axché Conservation Trust, Executive Director; Nancy Marin, Friends of Conservation and Develop-ment; Valdemar Andrade, Protected Areas Conservation Fund; Vincent Gillet, Coastal Zone Authority; Wilber Sabido, Forest Department, Chief; Yvette Alonzo, Association of Protected Areas Management Organizations (APAMO); Diane Wade, UNDP; Ismirla Tillet-Andrade, UNDP; Ivel Zuniga, UNDP, Programme Officer; Alex Martinez, TNC, Country Director; Natalie Rosado, TNC, Conservation Program Manager.
Bolivia
Adrián Nogales Morales, Servicio Nacional de Áreas Protegidas (SERNAP), Director Ejecutivo; Angélica Lanza, SERNAP, Técnica de Seguimiento;Crisanto Melgar Souza, SERNAP, Dirección de Monitoreo Ambiental, Director Legal; Dino Palacios, Federación de Asociaciones Municipales (FAM), Director Ejecutivo; Douglas Ibañez Reaza, TNC, Asistente Responsable de Bolivia; Dr. Carlos Ugarte Ochoa, Ministerio de Ambiente y Agua, Técnico de la Dirección de Monitoreo Ambiental; Edwin Camacho Olguin, SERNAP, Director de Planificación; Eloterio Choque M., SERNAP, Técnico de la Dirección de Manejo; Ernesto Aramayo B., Fundación para el Desarrollo del Sistema Nacional de Áreas Protegidas (FUNDESNAP), Dirección de Administración y Finanzas (DAF); Francisco Molura C., Técnico del Programa Biodiversidad y Áreas Protegidas (BIAP); Imke Oeting, FUNDESNAP, Responsable por el Manejo de la Recaudación de Fondos; Irene Cobo A., Técnica del Viceministerio de Inversión Pública y Financiamiento Externo (VIPFE); Jaime Edgar Vásquez Sarate, SERNAP, Técnico de la Dirección de Planificación, Seguimiento y Evaluación; Jaime Galarza R., Técnico del Proyecto SERNAP-MAPZA; Jaime Vásquez, SERNAP, Técnico de la Dirección de Planificación; Jorge Choquehuanca, SERNAP, Técnico de la Dirección de Planificación; José Coello, SERNAP, Dirección de Monitoreo Ambiental; Katherine Macarena Antonio S., TNC, Coordinadora de Instituciones Financieras; Olaf Westekmann, SERNAP, Asesor Técnico; Oswaldo Quisbert, SERNAP,Dirección de Planificación, Consultor; Ramiro Armando Lizondo Rada, SERNAP, Dirección de Planificación, Técnico de Planificación y Proyecto; Ramiro Ibáñez J., SERNAP, Técnico de la Dirección de Monitoreo Ambiental; Rómulo Herrera, SERNAP, Técnico Legal-Ambiental; Sergio Eguino, FUNDESNAP, Director Ejecutivo; Teofilo Hidalgo M., SERNAP, Técnico de la Dirección de Monitoreo Ambiental; Xavier Claros R., UBREMA, Técnico.
Brazil
Rio Grande do SulAna Cristina Tomazzoni; Celso Lanz Latorre de Souza; Fabiano Minossi Silva; Luiz Alberto Mendonça; Marcio Geroldini; Marcos Barreira de Oliveira; Paola Stumpf; Paulo Grubler; Roberta Dalsotto; Romulo Valim; Salete Beatriz Ferreira; Vania Mara Agnelo da Costa; Kathia Vasconcellos, consultant.
Espirito SantoAline Alvarenga; Alvaro Bridi; André Tebaldi; Dulciléa Costa; Érica Munaro; Fabiano Novelli; Felipe Saiter; Gustavo Braga da Rosa; João Henrique; Josiane Trabarch; Leonardo Brioschi; Maria Otávia Crepaldi; Rita Mendes; Roberta Souza; Savana Nunes; Terence Jorge Ramos; Deusdedet Alle Son, consultant; Analuce Freitas, TNC.
Minas GeraisAline Tristão; José Carlos de Carvalho; Luis Paulo Pinto; Mariotoni Machado; Nádia Aparecida Silva Araujo; Ronaldo José Ferreira Magalhães; Monica Fonseca, CI; Eduardo Figueiredo, consultant; Analuce Freitas, TNC.
Rio de JaneiroAlba Simon; Alexandre Reis; Aline Schneider; Ana Carolina Maia; André Ilha; André Villaça; Beth Roballo; Cristiana Maria de Azevedo; Cristiana Pompeo; Daniela Albuquerque; Eduardo Lardosa; Érika Campagnoli; Evandro Sathler; Fabiana Bandeira; Flavio Castro; Heloísa Bartolo Brandão; José Luis Monsores; Luiz Dias da Motta Lima; Luiz Felipe Leal Esteves; Marcelo Felipe; Marco Aurélio Brancatto; Marco Aurélio Silva; Marilene Sobral; Milton Monteiro; Mônica Magalhães; Neila Cortes; Patrícia Figueiredo; Pedro Bastos; Ciro Moura, APA
4 Fi n a n c i a l s u s t a i n a b i l i t y s co re c a rd
Guandu; Alexandre Prado, CI; Leonardo Geluda, FUNBIO; Manuela Mosse, FUNBIO; Carlos Alberto Mesquita, IBIO; Juliana Silveira Correa, PEIG; Maria Lucila Spolidoro, PESC; Adriano Lopes de Melo, PESET; Fernando Matias, PESET; Theodoros Panagoulias, PETP; Thomas Wittur, PPMA-RJ; Ricardo Ganem, RBA; Felipe Queiroz, RBAG; Luciana Sodré, REJ; Rodrigo Rocha, REJ; Ana Lucia Camphora, consultant; Lucio Figueiredo Matias, consultant; Analuce Freitas, TNC.
ParanaDionísio Janhaki; Francisco A. Torres de Oliveira; Guilherme C. Vasconcellos; João Btista Campos, Director of Biodiversity; Juarez Cordeiro de Oliveira; Junia Heloisa Woehl; Márcia G. Pires Tossulino; Maria do Rocio C. Rocha; Wilson Loureiro; Carolina Regina Cury Muller, consultant; Analuce Freitas, TNC.
Chile
No national workshop was held. The scorecard was completed during the process of a GEF UNDP project development by representatives from different Chilean organizations (see methodology). Representatives from a number of different Chilean institutions were also present at the South America sub-regional workshop held in CEPAL to launch the programme and gain commitment from the countries for participation. These were as follows: Consultor; Beatriz Ramírez, CONAMA; Daniel Álvarez, CONAMA, Jefe Unidad de Áreas Protegidas, Departamento de Protección de Recursos Naturales; Diego Flores, CONAMA, Gina Michea Anfossi, CONAF, Encargada de Calidad de Atención e Inversión en Áreas Prote-gidas y Comunidades; Miguel Díaz, CONAF, Jefe de Departamento de Áreas Protegidas y Comunidades; Marcela Olmo, CONAMA; Miguel Stutzin, CONAMA, Jefe Departamento de Protección de Recursos Naturales; Rafael Asenjo, Coordinador del Programa UNDP/GEF Sostenibi-lidad Financiera; Victoria Alonso, TNC, Especialista en Tierras Privadas; Francisco Solis, TNC, Representante para Chile; María Elena Zúñiga, Coordinadora Sudamérica, Estrategia de Áreas Protegidas; Marcia Torres, TNC, Administradora; Mark Gerrits, TNC; Arnaldo Rodríguez, TNC.
There were also representatives from a number of international agencies at this sub-regional workshop; Mario Mengareli, FAO, Oficial Forestal; Carlos De Miguel, CEPAL, Oficial de Asuntos Ambientales; José Javier Gómez, CEPAL, Oficial de Asuntos Económicos.
Colombia
Alberto Galán Sarmiento, Fondo Patrimonio Natural, Director; Andrés Felipe García, Parques Nacionales Naturales, Jefe, Oficina de Planeación y Seguimiento; Margarita Domínguez, Parques Nacionales Naturales, Oficina de Cooperación Internacional; Nuria Consuelo Villadiego Medina, Parques Nacionales Naturales, Subdirectora Administrativa y Financiera; Carlos Mario Tamayo Saldarriaga, Parques Nacionales, Encargado de la Oficina de Sostenibilidad Financiera; Virginia Salazar, Parques Nacionales Naturales, Oficina de Sostenibilidad Financiera y Servicios Ambientales; Carlos Mario Tamayo, Parques Nacionales Naturales, Coordinador Área de Sostenibilidad y Servicios Ambientales; Eduardo Velazco Abad, Parques Nacionales Naturales, Director Territorial Suroccidente; Fabio Villamizar Durán, Parques Nacionales Naturales, Director Territorial Norandina; Luz Elvira Angarita Jiménez, Parques Nacionales Naturales, Directora Territorial Caribe; Pedro Nel Vallejo, Parques Nacionales Naturales, Director Territorial Noroccidente; Yaneth Noguera, Parques Nacionales Naturales, Directora Territorial Surandina; Luisz Olmedo Martínez. PNUD, Oficial de Programas de Medio Ambiente y Desarrollo Sostenible; José Galindo, Consultor PNUD; Juan Carlos López, TNC, Especialista en Fondos Públicos, Asuntos Externos; María Fernanda Acosta, TNC, Especialista Financiera.
Costa Rica
Jenny Asch, MINAE, Encargada Programa Marino; Marco Tulio Castro, MINAE, Coordinador Administrativo; Marco Vinicio Araya, MINAE, Gerente de Áreas Silvestres Protegidas; Patricia Marín, MINAE, Oficina de Cooperación y Proyectos; Sabrina Loaiciga, MINAE, Asesora Legal; Sandra Jiménez, MINAE, Coordinadora Estrategia Financiera; Vanessa Zamora, PNUD Costa Rica; Irene Suárez, TNC, Asuntos Externos; Keylin Vargas, TNC, Asistente Estrategias Nacionales.
Cuba
Armelio del Monte Navarro, CANEC; Aylem Hernández Ávila, Centro Nacional de Áreas Protegidas (CNAP); Bertha Crespo, Ministerio del Interior, Cuba, CGB; Carlos A. Díaz Maza, Ministerio de la Agricultura (FONADEF); Carlos García Díaz, Ministerio de la Pesca; Daniela de las Mercedes Arellano Acosta, Agencia de Medio Ambiente, Cuba, Directora Proyecto Sabana Camagüey; Elena de la Guardia Llansó, Flora y Fauna; Enrique Daniel Polo Vilato, Ministerio de Ciencia, Tecnología y Medio Ambiente (CITMA); Enrique Hernández Hernández, CNAP; Francisca Navarrete Limonta, Guantánamo; Gloria Gómez, ISPJAE, Cuba, Profesora; Gretel Garcell Sansón, INSMET; Hakna Ferro Azcona, IES; José Luis Corvea Porras, PN Viñales; Laura Delgado Sánchez, CNAP; María de los Angeles Entralgo Flores, MEP, Cuba, Funcionaria Dirección de Macroeconomía; Maritza García García, CNAP; Martha Sánchez Rumayor, Banco Central de Cuba, Directora Adjunta; Raúl Garrido, CITMA; Rene Tomás Capote Fuentes, IES; Reniel Concepción, CNAP; Susana Perera Valderrama, CNAP; Telmo Lorenzo Ledo Llanes, Ministerio del Turismo; Yadisley Rodríguez Díaz, Flora y Fauna; Yinsay Capote Regueiferos, MFP, Cuba, Directora de Política Finan-ciera; Yoel Martínez Maqueira, PN Viñales; Yoel Vázquez Pérez, ECOVIDA Pinar del Río; Gricel Acosta Acosta, PNUD Cuba; Adrian Barrance, Consultor PNUD.
Dominican Republic
Alfredo Martínez, Ministerio de Medio Ambiente y Recursos Naturales (MARN), Encargado del Equipo Técnico de la Dirección de Áreas Protegidas; Bernardo Bidó, MARN, Sub-encargado de Contabilidad; Bethania Fernández, MARN, Encargada del Departamento Legal;
5Co u n T Ry T E A m s
Carmen Castellanos, MARN, Encargada de Ingresos; Celeste Oneida Severino, MARN, Encargada del Departamento de Tesorería; Clara Moore, MARN, Encargado del Departamento de Contabilidad; David A. Rodríguez, Consultor; Dennis Cabrera, MARN, Dirección Admin-istrativa; Eihard Molina, Proyecto NISP, Jefe de la Unidad de Seguimiento a los Acuerdos de Convencion de la Diversidad Biológica; Evaydee Pérez, Consultora; Fausto Ogando, MARN, Encargado de Suministros; Fernando Amador, MARN, Encargado de Almacén; Franklyn Ferreira, MARN, Dirección de Tecnología; Genaro Agramonte Parra, E.N., Tte. Coronel, MARN, Encargado de la División de Protección y Vigilancia; Germán Dominici, MARN, Encargado del Departamento de Gestión; Héctor Carvajal Yubelka Capellán, MARN, Encargado de Almacén de la Dirección de Áreas Protegidas; Jonathan Delance, Proyecto de Reingeniería, Coordinador del Proyecto de Reingeniería; José M. Mateo, Ing., MARN, Dirección de Áreas Protegidas; José R. Almonte, MARN, OSPP Director; Leonardo Liriano, Administrador de Cabo Cabrón; María A. Docampo, MARN, Directora de Proyectos Especiales, Oficina de Planificacion de Proyectos-OSPP; María Eugenia Morales, UNDP, Especialista en M&E; Mercedes Margarita Pequera Méndez, MARN, Técnica de la Dirección de Biodiversidad; Pedro Arias, MARN, Encargado del Departamento de Ordenación de la Dirección de Áreas Protegidas; Pedro Sánchez, MARN, Encargado de Compras; Pedro Tejeda, MARN, Dirección Financiera; Priscilla Peña, MARN, Asistente Técnica del Subsecretario; Rafael Macario, MARN, Encargado de Tesorería Áreas Prote-gidas; Ramón E. Castillo, Administrador de RC Ébano Verde; Ramona Herarte, MARN, Encargada de Contabilidad Áreas Protegidas; Ricardo Contreras, MARN, Encargado Administrativo; Roberto Sánchez, Consultor; Néstor Sánchez, TNC, Asuntos Externos.
Ecuador
Antonio Matamoros, Ministerio de Ambiente (MAE), Dirección Nacional de Biodiversidad; Edgar Rivera, MAE, Dirección Nacional de Biodi-versidad; Isabel Endara, MAE, Dirección Nacional de Biodiversidad; Marcela Aguirre, Fondo Ambiental Nacional; Mónica Tello, MAE; Patricio Hermida, MAE, Distrito 6; Samuel Sangüeza, Fondo Ambiental Nacional; Vicente Álvarez, MAE, Parque Nacional Machalilla; Wilson Rojas, Dirección Nacional de Biodiversidad; José Galindo, Consultor UNDP; José Vicente Troya, UNDP; María Mercedes Proaño, UNDP; María Fernanda Acosta, TNC, Especialista Sostenibilidad Financiera; Tatiana Eguez, TNC, Especialista Áreas Protegidas.
El Salvador
Alfonso Sermeño Martínez, Dirección General de Patrimonio Natural del Ministerio de Medio Ambiente y Recursos Naturales (DGPN/MARN), Especialista en Manejo de ANP, Gerencia de ANP, Ana Patricia Vásquez, Asociación Salvadoreña de Conservación del Medio Am-biente; Andrés Sánchez, DGPN/MARN, Técnico en Gestión de ANP, Gerencia de ANP; Arnulfo Ruíz, Asociación Coordinación de Comu-nidades para el Desarrollo del Cacahuatique (CODECA); Blanca Estela Juárez, Fundación de Asistencia Técnica para el Desarrollo Comunal Salvadoreño (ASISTEDCOS); Carlos Enrique Figueroa, DGPN/MARN, Técnico en Gestión de ANP, Gerencia de ANP; Daisy Herrera de Thomas, Fondo de la Iniciativa para las Américas (FIAES); Fidel Magaña, MARN, Jefe Unidad Financiera Institucional; Héctor Humberto Portillo, Centro Agronómico Tropical de Investigación y Enseñanza; Hjalmar Iván Márquez, Fundación Tecleña pro Conservación del Medio Ambiente; Jeannette Monterrosa, DGPN/AECID, Técnico Apoyo Planificación; Kathy Castro de Morales, DGPN/MARN, Técnico en Economía Ambiental; Luis Antonio Henríquez R., MARN/AECID, Técnico en Cuencas; Maximiliano Jovel, Fundación Ecológica de El Sal-vador (SalvaNATURA); Nancy Xiomara Chiquillo, Fondo de Actividades Especiales (FAE)/MARN; Roxana Ortiz, MARN, Asistente Jurídico de la Directora General Patrimonio Natural; Víctor Emmanuel Cuchilla, DGPN/MARN, Técnico en Gestión de ANP, Gerencia de ANP; Víctor Manuel Rodríguez, DGPN/AECID, Técnico en Cuencas MARN/AECID; Walter Rojas, Áreas Naturales y Corredor Biológico/MARN, Gerente de Áreas Naturales; Zulma Ricord de Mendoza, Patrimonio Natural a.i., Directora General de Patrimonio Natural a.i.
Guatemala
Eduardo Fernando Deleón M., Consejo Nacional de Áreas Protegidas (CONAP)/DRAD; Fernando Castro Escobar, CONAP; Manuel Benedicto Lucas López, CONAP; Melvin Hernández, CONAP; Mónica Velásquez, CONAP; David Vargas, CONAP; José Horacio Ramírez Pérez, CONAP/ALUX; Julio C. Castro Salguero, CONAP-Sur Oriente; Luís Armando Ruíz M., CONAP-NISP; Hugo Milián, I.I.A.; Juan Galvez, FARMA; Sergio Vega, MARM/FARMA; María Alejandra Paiz Leonardo, INAB; Nora Edith Rojas Prado, IAB-CEFE; Ana Lucía Orozco Rubio, UNDP; Carmen María López, TNC; Jorge Cardona, TNC.
Honduras
Andrés Alegría, ICF/Departamento de Áreas Protegidas; Eula Eduvigues Domínguez, ICF/Áreas Protegidas; Arnulfo Messen, ICF; Carlos García, DIBIO/SERNA; Francisco Aceituno, DIBIO/SERNA; Sandra Mendoza, DIBIO/SERNA; Jania Sierra, UPEG/SERNA; José A. Galdámez, BICA/CONSULTOR INDEP; Lourdes González, SEFIN; Marcela Aguilar, Secretaría de Finanzas, Departamento de Finanzas; Ana María Obando, SERNA/TNC, Consultora; Víctor Archaga, TNC, Asuntos Externos.
Mexico
Adrián Méndez Barrera (CONAP–Oficinas Centrales); Allan Rhodes, (CONAP–Oficinas Centrales); Iran Álvarez (CONAP–Oficinas Centrales); José Juan Arreola (CONAP–Oficinas Centrales); Juanita García (CONAP–Oficinas Centrales); Liliana Rojas (CONAP–Oficinas Centrales); Pilar López Portillo (CONAP–Oficinas Centrales); Maria de la Paz Díaz Hernández (CONAP–Oficinas Centrales); Fabián Jiménez (CONAP–Dirección Regional del Noroeste y Alto Golfo de California); Fabiana Arévalo (CONAP–Dirección Regional de Frontera Sur Istmo y Pacifico Sur); Gustavo Alberto Elton Benhumea (CONAP–Dirección Regional de Occidente y Pacifico Centro); Gustavo González (CONAP–Dirección Regional de Centro y Eje Neovolcánico); Javier Jiménez (CONAP–Dirección Regional de Frontera Sur Istmo y Pacifico Sur); Juan Carlos Romero (CONAP–Dirección Regional del Golfo de México y Planicie Costera); Julio Alberto Carrera López (CONAP–Director Regional del Noreste y Sierra Madre Oriental); María Elena Rodarte (CONAP–Dirección Regional del Norte y Sierra Madre Occidental); Ricardo Gómez, (CONAP–
6 Fi n a n c i a l s u s t a i n a b i l i t y s co re c a rd
Dirección Regional de la Península de Yucatán y Caribe Mexicano); Andrew Rhodes (FANP–FMCN); Alejandro Castillo (CONANP–PNUD); Kyoko Bourns (PNUD); Susana Rojas González de Castilla (Consultora PNUD–TNC); José María Makepeace (Consultor PNUD–TNC); Juan E. Bezaury Creel (TNC México); Alejandra Reta (TNC México).
Nicaragua
Francisco Gadea Castillo, MARENA–DGPN, Director General; Freddy Rivera, MARENA/SINAP, Director del SINAP DGPN; Germán Cruz A, MARENA, SINAP, DGPN, Coord. Técnico Planificación Estratégica SINAP; Abigail Calero, MARENA/SINAP, Especialista Áreas Protegidas; Edgard Gaitán, MARENA, Conductor – SINAP; Wilber Noguera, MARENA, Resp. Oficina de Presupuesto; Xiomara Medrano, MARENA, Especialista SINAP; Berenice Maranhao Arróliga, RSP La Máquina, Propietaria; Claudia Belli, Red RSP/RSP Montibelli, Presidente de la Red RSP Gerente Montibelli; Claudia Urbina, INTA, Directora de Planificación; Diana Navarrete, Ministerio de Energía y Mina, Ing. de Proyecto; Freddy Cruz, RSP Estancia El Congo, Propietario; Giovanni Carranza, Ministerio de Energía y Mina, Especialista Ambiental; Ismael Miranda, FIDER/Tisey-Estanzuela, Contador General FIDER; Jacinto Cedeño, FUNDENIC, Directivo; Sandra Tijerino, FUNDENIC/Cerro Musún, Asesora; José Alberto Gutiérrez, SELVA/Padre Ramos, Director Ejecutivo; Juan Monjarréz, Ejército de Nicaragua, Jefe de Depto; Márvin Acuña G., Foro Miraflor, Administrador General; Márvin Ocampo, Instituto Nicaragüense de Acueducto y Alcantarillado (INAA), Unidad Inspector y Calidad Ambiental; Roberto García López, AMUNIC, Responsable UGA; Pablo Castillo, AMUNIC, Asistente Técnico; Ramón Ortiz, AMUNIC, Conductor; Rafael Praslin, Sábalos Lodge, Mercadeo; Raquel Quezada, INTUR, Coordinadora de la Unidad Ambiental; Róger A. Montenegro, DR, Técnico UGA; Ronald Guevara, Foro Miraflor, Técnico; Verónica P. Franger, RSP Greenfields, Representante Legal; William Áreas Calvo, LIDER/Volcán Cosiguina, Director; María Fernanda Sánchez, PNUD, Oficial de Proyecto PNUD; Norvin Sepúlveda, TNC, Director de Programa; María Victoria Urquijo, TNC, Oficial Relaciones Externas.
Panama
Edgar Arauz, ANAM, Jefe del Departamento de Áreas Protegidas; Roberto Vásquez, ANAM, Jefe de Departamento; Virginia Fernández, ANAM, Administradora del SINAP; Antonio Chang K., DAPUS-ANAM, Abogado; Raúl Pinedo, DAPUS-ANAM, Economista; Margarita Guerra, DPPA-ANAM, Analista; Pedro Madero, ANAM, Analista de Contabilidad; Bedsy González, ANAM, Técnico Áreas Protegidas; Darío Luque, ANAM, Técnico Biodiversidad; Camilo Arauz, MEF, Director de Crédito Público; José Santamaría, Fundación NATURA, Asistente Gerencia de Proyectos; Marlouis Alvarado, TNC, Asistente de Programa; Olga Robles, PNUD, Oficial de Programa.
Paraguay
Raúl Ayala, Secretaría de Ambiente (SEAM) Director General; Carlos Britos, DGCPB, SEAM, Director General de Conservación y Protección de la Biodiversidad; Juan C. Aranda Pérez, DAP, SEAM, Director; Sandra Lerna, SEAM, Dirección Financiera, Directora; Mario Garcéle, SEAM, Jefe de Departamento; Elizabeth Martínez, DAP, SEAM, Técnica; Patricio Ortiz, DEIA, SEAM, Técnico; Sandra Aranda, DAP, SEAM, Técnica; Enrique Bragairag, SEAM/PNUD/GEF, Plan Estratégico; Oscar Ferreiro, Proyecto Paraguay Silvestre 98G33, ATP; Héctor D. Alonso, Proyecto Paraguay Silvestre 98G33, Asistente ATP.
Peru
Ada Ruth Castillo Ordinola, INRENA, Coordinadora ANP; Alberto Zamudio, INRENA, Coordinador; Camila Germaná, INRENA, Coordinador; Alberto Paniagua, PROFONANPE, Director Ejecutivo; Gustavo Suárez de Freitas, PROFONANPE, Coordinador Pronanp; Odile Sánchez, PROFONANPE, ACBT; Eduardo García, SERNANP, Coordinador de Áreas Protegidas; Fernando León, MIMAN, Asesor; Isabel Renner, PDRS-GTZ, Asesora Técnica; Lucía Ruiz, CIMA, Directora Ejecutiva; Sonia Domínguez, MEDA, Gerente General; Luis Espinel, CI, Director Ejecutivo; Raúl Tolmos, PNUD, Oficial de Programa; Gabriel Quijandría, TNC, Representante de Perú; Juan José Rodríguez, TNC, Coordinador.
Uruguay
Alicia Torres, Dirección Nacional del Medio Ambiente; Víctor Cantón, División Biodiversidad y AP, Director; Guillermo Scarlato Zunino, Proyecto SNAP, Coordinador General; Laura García Tagliani, Proyecto SNAP, Coordinadora; Álvaro Salazar, Proyecto SNAP, Economista; Bibiana Lanzilotta, Proyecto SNAP, Economista; María Eugenia Cedrés, Proyecto SNAP, Asistente; Marcelo Cousillas, Dirección Nacional del Medio Ambiente, Asesor Legal; Pedro Apezteguia, Ministerio de Economía y Finanzas, Asesor; Walter Monzo López, DINAMA, Asesor Financiero; Flavio Scasso, Unidad de Programa PNUD.
Venezuela
Rafael Andrade, INPARQUES, Director; Ramón Quintero, INPARQUES, Director; Ángel González, INPARQUES, Director Recreación; José Montenegro Mago, INPARQUES, Director Regional para el Estado de Sucre; Francis Migoogna, INPARQUES, Consultor Jurídico; Beatriz Durán, INPARQUES, Jefe de División; Neida Paiva A., INPARQUES, Jefe de División; Román Gerardo Pineda Duran, INPARQUES, Ingeniero Civil Jefe; Belkys González, INPARQUES, Profesional I; Emanuela Febo, INPARQUES, Profesional I; Anaís Britos, INPARQUES, Técnico; Juan Carlos Velásquez, INPARQUES; América Cairos, MINAMB-PRBDO, Administradora; Víctor Andrade, Consultor; Antonio Sánchez, Consultor; José Galindo, Consultor, PNUD, Ricardo Petit, Oficial de Programas; PNUD Venezuela; María Fernanda Acosta, TNC, Especialista Financiera; Lila Gil, TNC, Representante de País.
7AC k n o w l E d g E m E n T s
Acknowledgements:
Special thanks to Marlon Flores, Maria Elena Zuniga, Michelle Libby for their pivotal roles in leading the TNC team inputs for the application of the Scorecard and for the sub-regional reports. Thanks also to Luis Pabon, Tarsicio Granizo, and Lila Gil now leading the TNC team in this project; Patricia Perez, the project manager in the LAC Regional Service Centre UNDP; Ericka Espino, Programme Associ-ate LAC-RSC-UNDP; Nick Remple, Regional Practice Leader for the Environment and Energy Group UNDP-LAC; Trevor Sandwith, TNC; Jamie Ervin, UNDP Early Action Grants Programme; and Juan Carlos Rivera and Julio Zambrano from Mentefactura consulting company that provided key support to the data analysis.
Thanks also to those that provided Peer Reviews: John Clausen, Jason Cole, Midori Paxton, and Maxim Vergeichik.
Disclaimer: Some data in this report may contain certain inconsistencies and inaccuracies as the data comes from the national Scorecard workshops and associated follow-up during report preparation. There has been a consultation phase during which data was submitted to all governments for verification. However, the finance of protected areas can be complex with various sources of financing. Therefore the data in this report should be seen as an approximation and is intended to be used to identify overall trends and used for debate and further investigation.
8 Fi n a n c i a l s u s t a i n a b i l i t y s co re c a rd
©W
ill Va
n Ove
rbee
k/TN
C
9AC R o nym s
acronyms
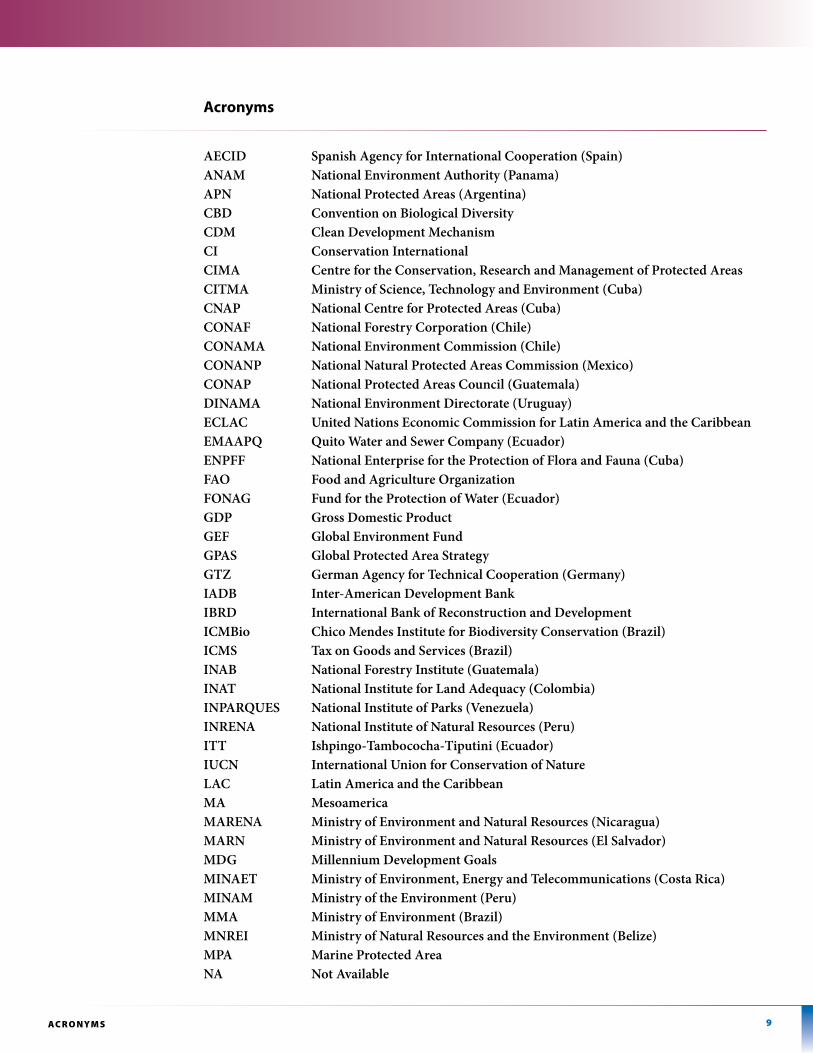
AECID Spanish Agency for International Cooperation (Spain)ANAM National Environment Authority (Panama)APN National Protected Areas (Argentina)CBD Convention on Biological DiversityCDM Clean Development Mechanism CI Conservation InternationalCIMA Centre for the Conservation, Research and Management of Protected Areas CITMA Ministry of Science, Technology and Environment (Cuba)CNAP National Centre for Protected Areas (Cuba)CONAF National Forestry Corporation (Chile)CONAMA National Environment Commission (Chile)CONANP National Natural Protected Areas Commission (Mexico)CONAP National Protected Areas Council (Guatemala)DINAMA National Environment Directorate (Uruguay)ECLAC United Nations Economic Commission for Latin America and the Caribbean EMAAPQ Quito Water and Sewer Company (Ecuador)ENPFF National Enterprise for the Protection of Flora and Fauna (Cuba)FAO Food and Agriculture OrganizationFONAG Fund for the Protection of Water (Ecuador)GDP Gross Domestic ProductGEF Global Environment Fund GPAS Global Protected Area StrategyGTZ German Agency for Technical Cooperation (Germany)IADB Inter-American Development Bank IBRD International Bank of Reconstruction and DevelopmentICMBio Chico Mendes Institute for Biodiversity Conservation (Brazil)ICMS Tax on Goods and Services (Brazil)INAB National Forestry Institute (Guatemala) INAT National Institute for Land Adequacy (Colombia)INPARQUES National Institute of Parks (Venezuela)INRENA National Institute of Natural Resources (Peru)ITT Ishpingo-Tambococha-Tiputini (Ecuador)IUCN International Union for Conservation of Nature LAC Latin America and the Caribbean MA Mesoamerica MARENA Ministry of Environment and Natural Resources (Nicaragua) MARN Ministry of Environment and Natural Resources (El Salvador)MDG Millennium Development GoalsMINAET Ministry of Environment, Energy and Telecommunications (Costa Rica)MINAM Ministry of the Environment (Peru)MMA Ministry of Environment (Brazil)MNREI Ministry of Natural Resources and the Environment (Belize)MPA Marine Protected AreaNA Not Available
10 Fi n a n c i a l s u s t a i n a b i l i t y s co re c a rd
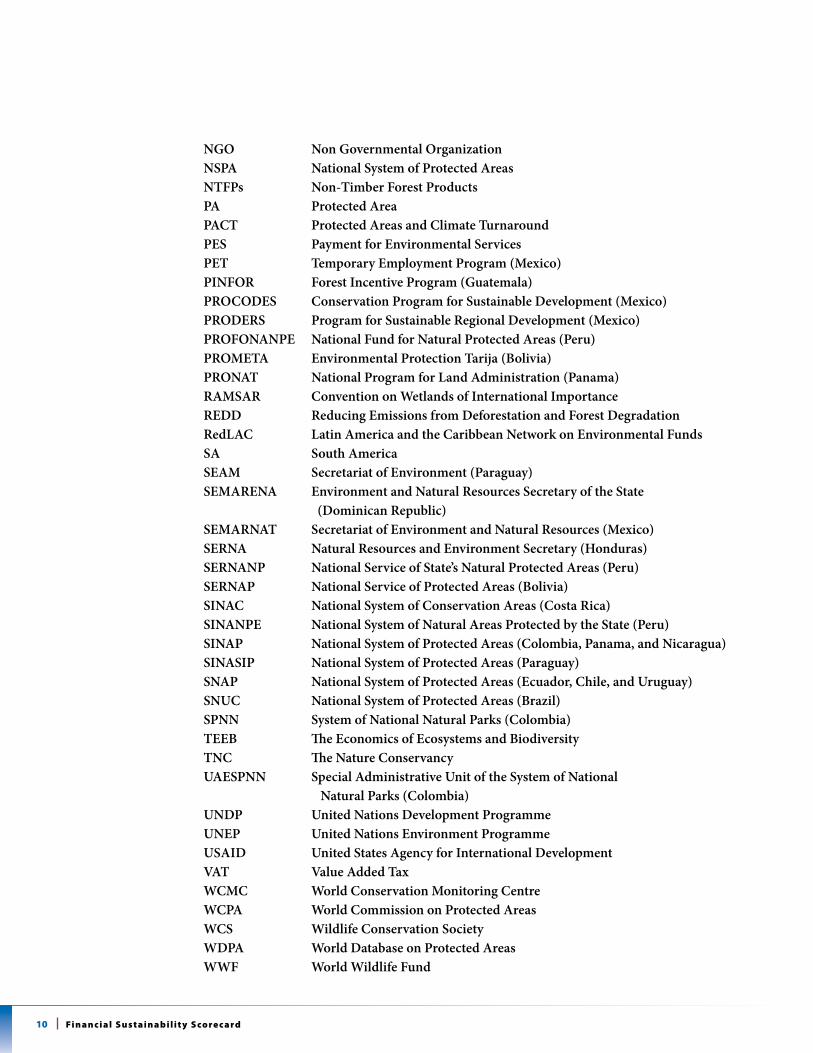
NGO Non Governmental OrganizationNSPA National System of Protected AreasNTFPs Non-Timber Forest ProductsPA Protected AreaPACT Protected Areas and Climate TurnaroundPES Payment for Environmental Services PET Temporary Employment Program (Mexico) PINFOR Forest Incentive Program (Guatemala)PROCODES Conservation Program for Sustainable Development (Mexico)PRODERS Program for Sustainable Regional Development (Mexico)PROFONANPE National Fund for Natural Protected Areas (Peru)PROMETA Environmental Protection Tarija (Bolivia)PRONAT National Program for Land Administration (Panama)RAMSAR Convention on Wetlands of International ImportanceREDD Reducing Emissions from Deforestation and Forest DegradationRedLAC Latin America and the Caribbean Network on Environmental FundsSA South AmericaSEAM Secretariat of Environment (Paraguay)SEMARENA Environment and Natural Resources Secretary of the State (Dominican Republic)SEMARNAT Secretariat of Environment and Natural Resources (Mexico) SERNA Natural Resources and Environment Secretary (Honduras)SERNANP National Service of State’s Natural Protected Areas (Peru) SERNAP National Service of Protected Areas (Bolivia)SINAC National System of Conservation Areas (Costa Rica)SINANPE National System of Natural Areas Protected by the State (Peru)SINAP National System of Protected Areas (Colombia, Panama, and Nicaragua)SINASIP National System of Protected Areas (Paraguay)SNAP National System of Protected Areas (Ecuador, Chile, and Uruguay)SNUC National System of Protected Areas (Brazil)SPNN System of National Natural Parks (Colombia)TEEB The Economics of Ecosystems and BiodiversityTNC The Nature ConservancyUAESPNN Special Administrative Unit of the System of National Natural Parks (Colombia)UNDP United Nations Development ProgrammeUNEP United Nations Environment ProgrammeUSAID United States Agency for International Development VAT Value Added TaxWCMC World Conservation Monitoring Centre WCPA World Commission on Protected AreasWCS Wildlife Conservation SocietyWDPA World Database on Protected AreasWWF World Wildlife Fund
11TA b l E o F Co n T E n T s
Executive Summary......................................................................................................................................................................... 13 Main Conclusions.......................................................................................................................................................................................... 14 The UNDP Financial Sustainability Scorecard and the Consultative Process................................................. 15 Key Financial Data........................................................................................................................................................................................... 16 Sustainability Analysis.................................................................................................................................................................................. 18 Recommendations: Policy Guidance................................................................................................................................................ 19 Looking Ahead................................................................................................................................................................................................... 22
Chapter 1. Introduction.................................................................................................................................................................. 231.1 Background and Objectives of this Report...................................................................................................................... 231.2 Protected Area Systems in LAC................................................................................................................................................ 251.3 The Value of Protected Area Systems.................................................................................................................................. 271.4 Financial Sustainability of Protected Area Systems.................................................................................................. 31
Chapter 2. Financial Sustainability Scorecard for National Systems of Protected Areas...................... 372.1 Financial Sustainability Scorecard for National Systems of Protected Areas........................................ 372.2 Scorecard Application Methodology.................................................................................................................................... 382.3 Protected Areas Systems Covered by the Report................................................................................................ ........392.4 Quantitative Financial Data Collected.................................................................................................................................442.5 Qualitative Data Collected............................................................................................................................................................ 46
Chapter 3. Financial Analysis..................................................................................................................................................... 493.1 Available Funding of Protected Area Systems............................................................................................................... 493.2 Funding Needs and Gaps for Protected Area Systems............................................................................................ 73
Chapter 4. Sustainability Analysis............................................................................................................................................ 894.1 Overview of the Structural Foundations of PA Financing................................................................................... 894.2. The Governance of Protected Area Financing Systems......................................................................................... 944.3 Component 1: Legal, Policy and Regulatory Support — Results by Elements.................................... 994.4 Business Planning and Tools for Cost-Effective Management....................................................................... 1114.5. Component 2: Business Planning and Tools for Cost-Effective Management — Results by Elements.......................................................................................................................................................................... 1174.6 Tools for Revenue Generation by Protected Areas................................................................................................. 1234.7 Component 3: Tools for Revenue Generation by Protected Areas — Results by Elements..........................................................................................................................................................................129
Chapter 5. Conclusions and Recommendations...........................................................................................................1375.1 Conclusions............................................................................................................................................................................................ 1375.2 Recommendations: Policy Guidance................................................................................................................................. 143
Annex 1. Glossary................................................................................................................................................................................................... 148Annex 2. Use of Correlations in PA-financing Data.................................................................................................................... 151Annex 3. References.............................................................................................................................................................................................. 152Endnotes......................................................................................................................................................................................................................... 154
table of Contents
12 Fi n a n c i a l s u s t a i n a b i l i t y s co re c a rd
©m
arian
a sev
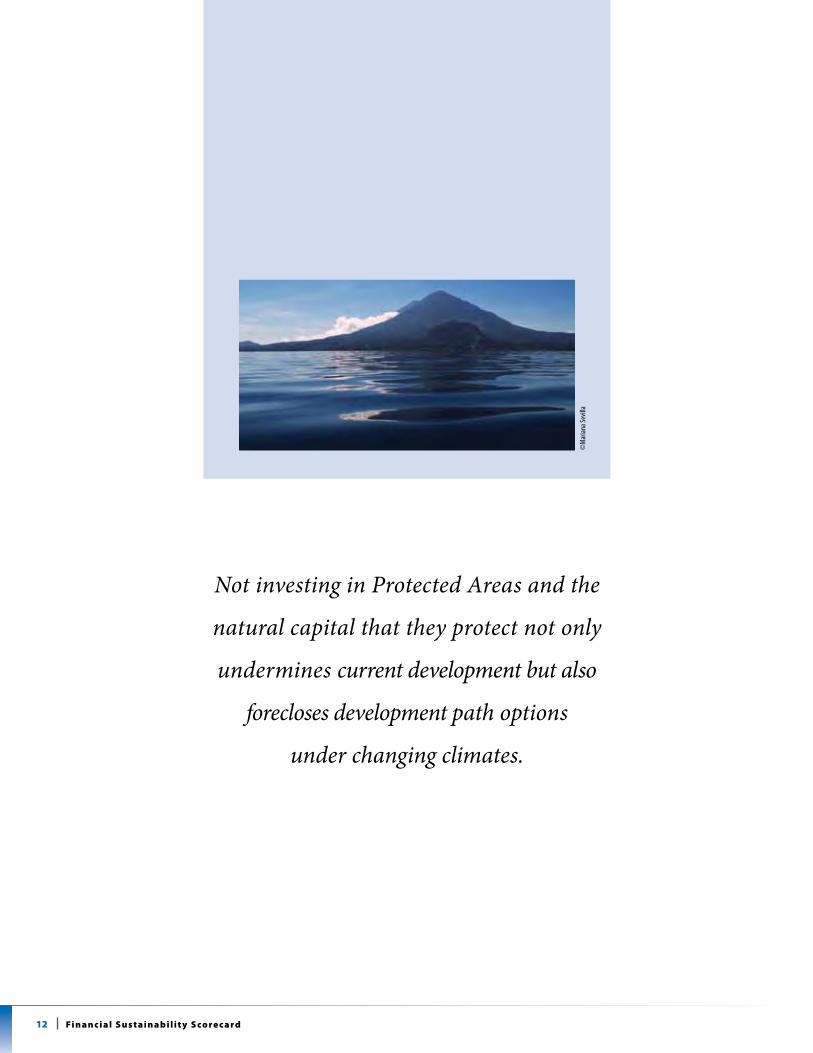
illaNot investing in Protected Areas and the
natural capital that they protect not only
undermines current development but also
forecloses development path options
under changing climates.
13E x E C u T i v E s u m m A Ry
T his groundbreaking Report compares and aggregates official financial data and qualitative insights about the health of Protected Area (PA) financial sustainability for 20 Latin American and Caribbean (LAC) countries1.
Locally and regionally, the PAs analysed provide direct and indirect benefits over their combined area for a population of 564 million people in these 20 countries. Globally, LAC PA systems contain and support many important benefits in the areas of biodiversity conservation, human development, and, increasingly, ecosystems services to manage carbon sequestration.
The quantity, type, level, and immediate useful-ness of the data presented in the full document is unprecedented. Policy makers, practitioners, and researchers will find the information neces-sary for regional and national planning, and a clear, robust analytical basis for rethinking investments to improve the financial sustain-ability of PAs. While these findings reveal the level of financial gap faced in the region, they also show that reducing the gap is achievable and affordable, so that PAs can be effectively man-aged to the benefit of all.
Stakeholders have perceived financial sustain-ability of PAs as a ‘black box’. This black box arises from a lack of understanding of the ele-ments comprising PA financial systems and the absence of specific financial information about both PA needs and funding. A major roadblock to PA financial sustainability has been this lack of detailed information on financing.
This Report opens the black box by providing a wealth of information available by region, subregion and — most importantly — by country.
executive summary
©Hu
go a
rna/
tnc
14 Fi n a n c i a l s u s t a i n a b i l i t y s co re c a rd
The size of the financing gap between the cur-rent underfunding of PA systems and a situa-tion of sustainability for PA systems is now known. PA stakeholders now have a specific tar-get for PA financial sustainability.
Main Conclusions
This Report’s overarching findings are:
PA systems are underfunded, resulting in insufficient management: Official data from 19 countries studied show that total available resources for PA systems in the region are nearly $402 million per year2 but the available resources need to be analysed in relation to actual management needs and costs in PAs. Estimates on the basic management needs for national PA systems, aggregated for the region, show a financing gap (available funds minus financial needs) for PAs of $314 million/year (excluding Venezuela) to simply address basic management activities. The PA financing gap to achieve a more rigorous management (opti-mal needs) is approximately $700 million/year (excluding Venezuela). This regional funding gap for PAs is particularly concerning, considering that the LAC region contains almost 40 percent of the Earth’s biodiversity (see Table 3.16).
Current levels of PA underfunding are at risk of worsening: The financial situation for LAC PAs is actually worse because (i) funding needs are likely to increase in the future to achieve increased conservation measures for all major ecosystems and to respond to climate change, and (ii) current PA funding is not secure and, therefore, vulnerable to external factors that could reduce available funds, thereby increas-ing the funding gap.
While the general rule is underfunding, countries vary widely in their attention to PA financing: Investment per hectare in Latin
America varies considerably between countries and between Mesoamerica+3 and South Amer-ica (see Figure 4.8).
Addressing financial gaps is affordable for governments in the region: Basic managment costs could be met if the annual government allocation to PA budgets in the region increases by a factor of 3, to cover the existing annual financing gap of $314 million (excluding Vene-zuela). This is the average factor, derived from the 18 countries reporting their funding gaps; however, the range of factors by individual country is considerable.
LAC Governments allocate only a small frac-tion of their financial resources to PAs: first.
• Only 1 percent of total national environmen-tal budgets are allocated to PAs.
• Just 0.006 percent of GDP, on average, is allo-cated to PAs in the region.
Closing these financing gaps, at even the basic level, seems entirely feasible and affordable for governments to make the necessary budgetary adjustments to ensure sound PA management4.
Box 1. Elements of a PA Financing System
The elements of a PA financing system address four key questions: (a) what has to be financed? (b) what does this financing cost? (c) what are the institutional arrangements required to support the financing system? and (d) what are the funding sources?
The Financial Sustainability Scorecard for National Systems of Protected Areas examines these elements.
©sim
on W
illiam
s/tnc
15E x E C u T i v E s u m m A Ry
the Undp Financial sustainability scorecard and the Consultative process
The data in this Report was generated through applica-tion of the UNDP Financial Sustainability Scorecard for National Systems of Protected Areas. This Score-card is a comprehensive analytical tool that can be used to look at quantitative and qualitative aspects of PA systems and their situational context. PA system authorities should complete the Scorecard each year to provide annual data that allows stakeholders to view changes over time. The first year’s results of the Score-card provide baseline data (primarily data from 2008). Scorecard findings will assist those working on PA sus-tainability—PA authorities, governments, interna-tional donors, and other stakeholders—in tracking their collective progress by country toward making PA systems more financially sustainable. The quantitative and qualitative elements of PA financing are enumer-ated in the three-part structure of the Scorecard. Part I, assessing the overall financial health of the PA system.
Part II, assessing specific elements of financial analysis.
Part III, summarizing these findings in a scoring framework.
The financial analysis findings rely extensively on the quantitative data derived from application of Part I of the Scorecard. Data, primarily from government sources by country, was collected in these areas:
A. Available Finances (see Figures 3.2 and 3.3 for a graphical depiction of fund composition) 1. Total central government budget funds 2. Extra-budgetary funds (including inter- national cooperation channelled through government, trust funds, NGOs, and founda- tions, and some governmental instruments, including fees and dedicated taxes, etc.) 3. Percent of PA-generated revenues retained by PA system for re-investment
These three above-noted sources add up to the total finances available to the PA system.
B. Costs and Financing Needs 1. Total expenditures for PAs 2. Estimation of PA system financing needs (basic and optimal management scenarios)
C. Annual Financing Gap 1. Basic management gap (see Figure 3.18) 2. Optimal management gap (see Figure 3.20)
Box 2. The Risks of not Funding PAs
Without funds, PAs cannot hire staff to plan, manage, or patrol these lands. Without funds, PAs cannot train staff. Without funds, PAs cannot invest in infrastruc-ture that will attract tourists that will, in turn, bring in foreign currency. Without funds, PAs cannot work with local communities on buffer zone management.
Without funds, research into species cannot be conducted. Essentially, without adequate funds, PAs cannot conserve biodiversity or provide healthy functioning ecosystems. Ecosystem degradation will result in the loss of goods and services important for local community livelihoods, as well as for production sectors such as agriculture,
tourism, and energy. Protection against extreme climate events will also be reduced and cost effective opportunities to increase resilience to climate change will be lost. Not investing in PAs and the natural capital that they protect not only undermines current development but also forecloses development path options under changing climates.
Investment in PAs offers a no-regret solution, delivering benefits for development now and for the future. As the TEEB for Policy Makers Report argues: with investment in PAs, “…no matter how you slice the figures up, you come up with a ratio of benefits to costs that’s between 25-to-one and 100-to-one”1.1. Based on evaluating 1,100 studies ranging across different countries and different ecosystem services.
16 Fi n a n c i a l s u s t a i n a b i l i t y s co re c a rd
While Part I of the Scorecard yields a financial snapshot by country, Part II looks at the situa-tional context for PA systems in each country in a rigorous and systematic way. Part III of the Scorecard develops aggregated scores across all analytical categories. UNDP maintains the cur-rent version of the Scorecard, with modifica-tion and updating as needed, going forward5.
Key Financial data
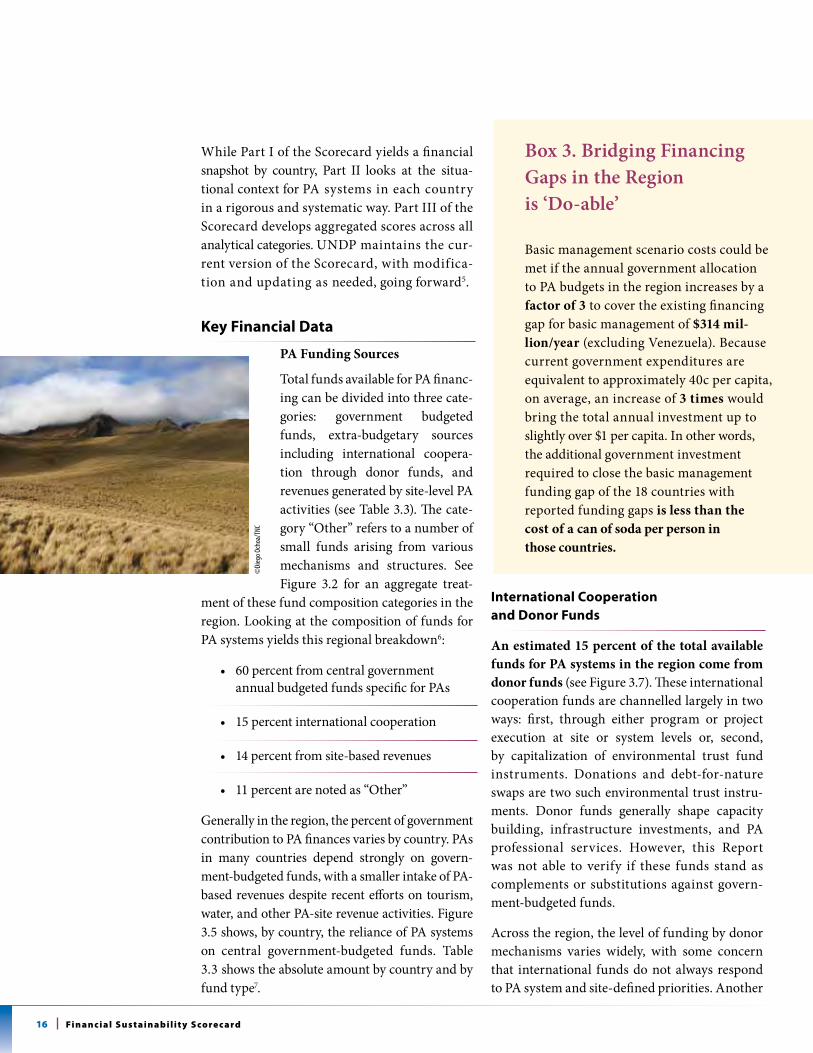
PA Funding Sources
Total funds available for PA financ-ing can be divided into three cate-gories: government budgeted funds, extra-budgetary sources including international coopera-tion through donor funds, and revenues generated by site-level PA activities (see Table 3.3). The cate-gory “Other” refers to a number of small funds arising from various mechanisms and structures. See Figure 3.2 for an aggregate treat-
ment of these fund composition categories in the region. Looking at the composition of funds for PA systems yields this regional breakdown6:
• 60percentfromcentralgovernment annual budgeted funds specific for PAs
• 15percentinternationalcooperation
• 14percentfromsite-basedrevenues
• 11percentarenotedas“Other”
Generally in the region, the percent of government contribution to PA finances varies by country. PAs in many countries depend strongly on govern-ment-budgeted funds, with a smaller intake of PA-based revenues despite recent efforts on tourism, water, and other PA-site revenue activities. Figure 3.5 shows, by country, the reliance of PA systems on central government-budgeted funds. Table 3.3 shows the absolute amount by country and by fund type7.
international Cooperation and donor Funds
An estimated 15 percent of the total available funds for PA systems in the region come from donor funds (see Figure 3.7). These international cooperation funds are channelled largely in two ways: first, through either program or project execution at site or system levels or, second, by capitalization of environmental trust fund instruments. Donations and debt-for-nature swaps are two such environmental trust instru-ments. Donor funds generally shape capacity building, infrastructure investments, and PA professional services. However, this Report was not able to verify if these funds stand as complements or substitutions against govern-ment-budgeted funds.
Across the region, the level of funding by donor mechanisms varies widely, with some concern that international funds do not always respond to PA system and site-defined priorities. Another
Box 3. Bridging Financing Gaps in the Region is ‘Do-able’
Basic management scenario costs could be met if the annual government allocation to PA budgets in the region increases by a factor of 3 to cover the existing financing gap for basic management of $314 mil-lion/year (excluding Venezuela). Because current government expenditures are equivalent to approximately 40c per capita, on average, an increase of 3 times would bring the total annual investment up to slightly over $1 per capita. In other words, the additional government investment required to close the basic management funding gap of the 18 countries with reported funding gaps is less than the cost of a can of soda per person in those countries.
©di
ego o
choa
/tnc
17E x E C u T i v E s u m m A Ry
concern about donor funds is that the accounting and financial management tracking of these monies does not always harmonize with a country’s existing accounting and managerial structures.
Despite these problems identified with international cooperation on PA needs, stakeholders point out a role for increased donor funds, particularly in the strong and emerging donor-priority areas that link environ-mental investments with poverty reduction and cli-mate change. PA systems of the LAC region receive less than 2 percent of all international funds for develop-ment aid. Figure 3.7 shows international cooperation by country as a fraction of total available funds. Figure 3.17 displays the same information as a function of international aid as present or absent within a country.
site-based pa revenues
PA sites report a variety of revenue activities at the park level, including entrance fees, recreation and tourism permits, concessions, payments for environ-ment services (PES), and other fees including scien-tific research. Site-based revenues in the region totalled only $2.6 million, representing 10 percent of available funds for PA systems. See Figure 3.10 for composition of site-based revenue opportunities.
In light of all the effort to support and stimulate site-based revenues, the total amount appears relatively limited. This Report concludes that government bud-gets remain the most important source of funding for PAs. However, important opportunities present them-selves to increase site-based revenue generation, to complement government budgets through higher gate fees, and to focus attention on concession and PES mechanisms (see Figure 3.11). Interestingly, PES pro-grams have, thus far, fallen short of expectation, only contributing 1 percent of site-based revenues. Stake-holders should acknowledge that many PA revenues are still legally required to be sent from the actual site to the central government; these funds do not always return to the originating PA location. This normal practice results in weak incentives for expansion or, in some cases, even the initiation of revenue-activities at the PA level.
Box 4. Scorecard Workshops
Each participating country spent one to two days holding multi-stakeholder workshops to prepare the Scorecard. This was the first time that different groups within government and NGOs had held focused discussions on PA finances. In all, 378 PA government staff and practitioners participated in applying the Financial Sustainability Scorecard across the 20 countries. As a result of feedback from this process, UNDP has published a second edition of the Scorecard, Financial Sustainability Scorecard for National Systems of Protected Areas, 2010.
©m
ark G
odfre
y/tn
c
18 Fi n a n c i a l s u s t a i n a b i l i t y s co re c a rd
sustainability analysis
Part II of the Scorecard provides qualitative analysis about how the situational context of PAs contributes significantly to understanding the governance setting concerning conservation financing for PAs.
Part II of the Scorecard is compartmentalized into three components, each fundamental for a fully functioning financial system at the site and system levels.
1. Legal, regulatory, and institutional frame- works that enable sustainable financing
2. Business planning and tools for cost- effective management
3. Tools for revenue generation and mobilisation
Each component is divided into elements, which are further divided into sub-elements. The Scorecard includes structured guidance for assessing and scoring each sub-element. This assessment can help a country identify those areas of governance structure that need to be improved to enhance its PA financing system. Component 1: Legal, regulatory, and institu-tional frameworks that enable sustainable financing is particularly compelling because these elements describe the climate in which PAs and PA systems must operate. Figure 4.8 and Table 4.1 show detailed information about the elements that comprise Component 1. Fig-ure 4.11 and Table 4.3 present findings on ele-ments that comprise Component 2. Figure 4.14 and Table 4.4 present findings on elements that comprise Component 3.
part ii Findings
PA financing systems are composed of multiple elements, which need to be unravelled with each element understood, investigated, and addressed: Financial sustainability requires an integrated approach that facilitates an enabling
legal, institutional, and political environment. The Scorecard’s elements promote standards and concrete goals for national-level decision mak-ing and for South-South cooperation. If these elements are all addressed, then the entire sys-tem will improve significantly. Indeed, a direct, positive, and strong correlation was found between the total score in Part II of the Score-card and the size of the national PA system financial gap. Countries achieving higher scores on governance, planning, and revenue mecha-nisms tended to have smaller financial gaps. In other words, solid structural foundations of the situational context appear to be causally-linked with achieving financial sustainability. However, PA financing systems require substantial strengthening to be able to move toward sus-tainability: The highest total score in the region for Part II of the Scorecard was almost 60 per-cent of the maximum, while the lowest score was 9 percent. The regional average score was 45 per-cent. As these scores increase, these improve-ments in situational context for countries should lead to reduced financial gaps at national levels.
Within the region, certain country patterns and clusters can be used to prioritize interna-tional assistance efforts: Country scores clus-tered into three groups, based on relative strength of financial planning for PAs: (i) rela-tively strong, at 50 percent or above (Costa Rica, Cuba, Colombia, and Argentina), (ii) in need of strengthening, with scores between 30 percent and 50 percent (Mexico, Panama, Honduras, the Dominican Republic, Ecuador, Bolivia, Peru, and Venezuela), and (iii) in need of substantial strengthening, with scores below 30 percent (Belize, El Salvador, Guatemala, Nicaragua, Brazil, Paraguay, Chile, and Uruguay).
PAs are a cost-effective investment for govern-ments because they generate high economic returns for public-sector budgets: In a full cost-analysis framework, the benefits of PAs outweigh the costs, particularly when ecosys-tem services are valued and counted in the cost-
19E x E C u T i v E s u m m A Ry
benefit process. However, PA systems have a low capacity to mobilize political interest and negotiate for budget increases. This is partly due to the lack of economic data on the eco-nomic contributions of PAs to local, sectoral, and national development. This weak capacity is also partly due to a lack of national financial strategies that show a blueprint for how funds will be managed, generated, and invested.
Financial and business planning for PAs, at site and system levels, need improvement: Financial and business planning for PAs is at a preliminary stage. These professional develop-ment efforts should be strengthened and deployed widely. Specifically, PA authorities need financial experts to supervise the planning and investment processes at both system and site level.
Site-based revenue generation is not bringing in the funds expected, but through basic improvements could become a more impor-tant source of funds for PA systems: PA reve-nue generation is still underdeveloped, repre-senting only 11 percent of total PA system funds. Increased revenues from both tourism and PES are feasible and should be supported by PA authorities. By seeding infrastructure funding, revenue will increase over time.
recommendations: policy guidance
This Report brings PA stakeholders together in terms of both knowledge and informed policy making:
•National government policy makers canidentify specific actions for policy and institutional reforms that will improve the supportive context for PA system financing.
•National government budget decisionmak-ers now have clear data on the needs, bene-fits, and cost-effectiveness of increasing PA system investment.
•PA authorities can identify financing ele-ments for strengthening and improving PA finance practices that will increase confi-dence that government budgets for PAs will be used cost-effectively and contribute not only to biodiversity conservation but also national development.
•Donors and NGOs can determine wheretheir support will have the greatest impact, by system and by elements in each system.
• Researchers have baseline data on which toundertake more elaborate and useful finan-cial analysis in PA systems.
The information also supports South-South cooperation in the hope that each country can find other countries to provide good examples of how to strengthen the weak elements of their system.
Recommendation 1: Set targets for available finances for National Systems of PAs
Set financial targets for: (i) meeting the costs of basic management standards of PA systems and their constituent PAs, (ii) the costs of establishing optimal management costs, (iii) the costs of also addressing ecological gaps, and (iv) additional costs for covering increased costs of management due to climate change. To this end, each country should have a thorough financial needs assess-ment to permit sound financial planning and the setting of targets. A standard methodology should be developed so that data generated using the methodology will be widely accepted and can be collected in a cost-effective manner. This should include determining how many sites per system require costing and differentiating between capi-tal investment needs and on-going operational costs. Such a financial needs assessment should also include buffer zone management.
Recommendation 2: Increase available finances to meet targets
On average, the countries in the Report that have calculated their financial management needs
20 Fi n a n c i a l s u s t a i n a b i l i t y s co re c a rd
and gaps should increase the total available funds8 for their PA systems by 1.8 times, to meet basic management needs. Countries need to break down sources of funding and determine where the increases should be made. The income categories are annual government budgets, extra-budgetary options (international coopera-tion and donor assistance, including country-level trust funds and national dedicated taxes, among other instruments) and site-based PA revenues. Specific findings and recommenda-tions by these three income categories are:
(1) Strengthen annual government budget negotiations: If increases in government bud-gets were the only source to meet basic manage-ment needs, on average, current government budgets for PAs would need to be increased 3 times. This is the average across 18 countries; however, the ranges are significant for consider-ation of individual countries.
Table 3.3 shows figures by country regarding gov-ernment-budgeted funds. The budget per capita figures and the budget as a percentage of GDP are prima facie compelling evidence for reasonable increases. To achieve these budget negotiations, the following support is recommended:
•APAsystem-leveleconomicvaluationstudy,which is clearly communicated to relevant Ministries and policy makers,
•A national financial strategy detailing howfunds will be spent and why they are needed (based on the financial needs and gaps assessment),
•Improvedaccountingandreportingoffunduse, and
•Improvedmanagementoffunds(seeRecom-mendation 3).
(2) Develop strategic extra-budgetary sources of revenue: These extra-budgetary funds can be secured from both international assistance and country sources. In countries, dedicated taxes should be introduced to recognize PA contribu-
tions to economic growth, such as in the cases of water provision and tourism. These can be pow-erful sources of funds. For example, a $5 tax for every tourist visiting LAC could eventually cover 100 percent of the current funding gap for the basic management needs of the PA systems.
Extra-budgetary funds from international donors should also be increased because they only receive less than 2 percent of the interna-tional funds for development aid. Donor fund-ing should become more strategic and focused on building PA system capacities so the govern-ment can strengthen the elements of its PA financing systems. If donor funds focus on sup-porting this capacity building for the transition to well-functioning finance systems, then gov-ernment budget increases can focus on reducing the gap for PA management needs.
(3) Improve site-based PA revenue mechanisms: Tourism and PES revenues should be supported by PA authorities through the funding needed for the infrastructure to bring in more revenue. Countries should also diversify revenue-genera-tion mechanisms including, among others, emerging instruments such as REDD+9 related payments. Within PA systems, these actions are recommended to improve revenue generation:
•Financialexpertsshouldberecruitedtoplanand manage these revenue mechanisms, which are still too often left to currently employed PA staff with more scientific backgrounds.
•Reformoflegalframeworksisneededtoensure that site-based incentives exist such that:
- PAs that generate revenues are permitted to use them to meet basic management needs; this condition will help PAs to generate revenues.
- PAs share a portion of their revenue with buffer zone communities; this condition offers these communities the incentive to assist in management of the PA.
©m
ark G
odfre
y/tn
c
21E x E C u T i v E s u m m A Ry
© a
ndre
w Bo
varn
ick
•A strong communication strategy and cam-paign to inform civil society and visitors about PAs and their fee structures, to increase support for higher fees.
Progress on each of these actions can be moni-tored by applying the Scorecard over time.
Recommendation 3: Strengthen the management and investment of funds
Each country can meet this recommendation through developing or improving the following Scorecard elements, identified as critical to financial sustainability:
•Centralized and standardized financialaccounting system to manage and share all useful financial data for PAs within a PA system. This data will provide key input into financial planning, budget negotiation, and performance monitoring;
•Amanagement and business plan for eachPA in the system10;
•A financial plan for each PA system, prepa- red in a participatory manner and updated annually;
•Methods are in place for allocating fundsacross PAs within the system, based on appropriate criteria; and
•Afinancial reporting systemforPAs tousefor management purposes and for sharing information within the system.
Recommendation 4: Undertake targeted skills capacity-building programmes
A major gap in PA management is in financial expertise. Capacity-building efforts should build financial knowledge and skills at PA site and system levels. All training courses for PA managers should include financial skills mod-ules and tools for cost-effective management. PA manager support-staff should also be trained in basic financial planning.
However, the most important capacity-building action is for all PA systems to hire economists, financial planners, and tourism revenue experts at national and sub-national levels. Sub-national experts can then support several PA sites, mak-ing this action cost-effective.
Recommendation 5: Improve and standardize financial data generation at PA system level
Simple and standard data generation systems are the first step toward financial sustainability; all PA systems must develop such a system. The data to be collected needs to encompass PA manage-ment needs and costs, revenue generation, and
22 Fi n a n c i a l s u s t a i n a b i l i t y s co re c a rd
budgets and expenditures (operational and capi-tal). Accounting software should be installed for this purpose. PA site managers should be trained on costing activities and using accounting soft-ware. Because financial data sharing is essential, co-managers should also record and share data on site revenues. Donor projects and trust funds should also provide data to PA authorities on site and system expenditures annually, by standard units and activities. Coordinated information sharing means that data can be incorporated and aggregated at the system level.
PA management plans should act as the founda-tion for all cost estimates, which then need to be aggregated up to the system level. Where a system does not have management plans for all sites, extrapolation can be used: costs of typi-cal PAs can estimate costs in PA sites lacking management plans. PA headquarters costs — both operational and capacity-building needs — should then be added to the site-level cost data for full PA system cost data. Revenues should be tracked using sound and transparent electronic visitor information recording systems.
looking ahead
The Scorecard should serve as a frame of reference to generate the necessary finan-cial data fundamental to all financial planning and budget negotiations. The data in this Report should be considered as a baseline for future monitoring. The Scorecard should be applied in a partici-patory manner annually. For complete-ness, the Scorecard should also be filled in for PA sub-systems within countries.
UNDP and TNC will continue to provide support to all countries that wish to advance toward financial sustainability for their PA systems and to undertake the recommendations provided.
PA stakeholders hope that this Report will also stimulate other practitioners to come together, providing coordinated and focused support to help governments in the region generate data and transition toward fully functioning PA systems: These actions will help manage PA contri-butions to biodiversity conservation and national sustainable development.
© Sc
ott W
arren
/TNC
23i n T R o d u C T i o n
Protected Area (PA) systems are essential strategic national instruments for ensuring long-term conservation of biodiversity, including species, ecosystems, and ecosystem services, and for protecting cultural and
spiritual values. Ecosystem services are the source of many non-market benefits, including water provision and regulation, carbon sequestration, and both adap-tation and resilience to climate change. By ‘hosting’ these essential ecosystem services, PA systems are key instruments in national development.
1.1 Background and objectives of this report
If PAs are the cornerstone of global biodiversity and environmental health of the planet, ensuring that PAs are sufficiently financed to be well man-aged is at the heart of global maintenance. In most developing countries, PAs remain underfunded. As a result, for decades, the world’s PAs have been degraded, encroached upon, targeted by poach-ers — in short, their natural assets have been di-minished, which in turn reduces their key role in national sustainable development. These negative impacts for PAs and their host countries stem
from insufficient management. This management problem results directly from underfunding and an absence of financial planning. The precarious financial situation of PAs sets off a cascade of in-terrelated problems.
Without funds, PAs cannot hire staff to plan, manage, and patrol. Without funds, PAs cannot train staff. Without funds, PAs cannot invest in infrastructure that will attract tourists, which in turn can bring in foreign currency. Without funds, PAs cannot work with local communi-ties on buffer zone management. Without funds, research into species cannot be done. Without
C h a p t e r 1
introduction
© Er
ika N
ortem
ann/
TNC
24 Fi n a n c i a l s u s t a i n a b i l i t y s co re c a rd
funds, management standards cannot reach the levels needed to conserve biodiversity nor keep ecosystems healthy. Healthy ecosystems provide goods and services to national development.
Establishing sustainable financing for PAs may be the single most important step for the global community in these crucial and interdependent policy challenges: reducing climate change and vulnerability to the impacts of climate change, providing water, and conserving biodiversity.
Until now, however, sustainable financing has been viewed in a limited manner and as a ‘black box’. Stakeholders know the general problem of PA underfunding; nevertheless, the inner work-ings and details of this problem are not clear enough for sound policy responses and robust management. This lack of information drives many problems for PAs. The problem of under-funding derives directly from a lack of reliable in-formation regarding the costs of PA management and the functional availability of funding. More-over, efforts thus far tend to focus on revenue gen-eration and not on the overarching management of revenues and investments. This revenue focus is often plagued by two problems: first, where site-based revenues eventually go and, second, how these revenues are managed and invested to improve PA management. Furthermore, revenue generation efforts have been limited compared to the financial needs of PAs. Some financial prac-tices in PAs, however, are encouraging.
This Report, for the first time, unravels the na-tional financing systems of PAs across the entire continent. The findings present how Latin Amer-ican and Caribbean (LAC) PA financing systems work, identifying the levels of funding, funding gaps, and both policy and programme areas that can be easily improved to finally address and achieve sustainable financing for LAC PAs. In other words, this Report opens the black box to shed light with a wealth of data and clarity about policy options.
Without data, neither plans nor targets are pos-sible, and hence, no path for improvement can be made. The Report, in presenting all of this new data, lays out the problems, describes national financial targets for both basic and optimal PA management scenarios, and sketches a simple road map for what to improve. The Report is not itself a guide on how to improve the systems; rather, it provides information and tools. This new wealth of reliable information will stimulate thinking that practitioners can apply to national PA systems.
Meanwhile, recent efforts in these countries show that economic benefit arguments can strengthen budget negotiations that affect PAs. These eco-nomic benefits arguments — when combined with more transparent use of funds, evidence of cost-effective management, and the related ac-tivities of clear PA financing and management — can result in higher annual government budgets for PA systems.
This Report builds on these country initiatives, thereby generating comprehensive and stan-dardized data, and makes recommendations for strengthening PA financing. In doing so, this Report will be a major tool for the LAC region in improving the financial sustainability of their PA systems.
Data on PA financing is presented for 20 countries in the region, providing a valuable opportunity for comparative analysis. Stakeholders will appreci-ate seeing the detail about regional patterns and trends. This rich set of information about LAC PA systems has never previously existed at the re-gional level. Globally, such information sets do not exist at regional levels in Asia, Europe, or Africa, suggesting that this pioneering initiative should be replicated across other regions to increase global knowledge and understanding of PA finances.
Thus, this Report can be used to inform decisions on investments for PAs in Latin America. This
Mark
Godfr
ey/T
NC
25i n T R o d u C T i o n
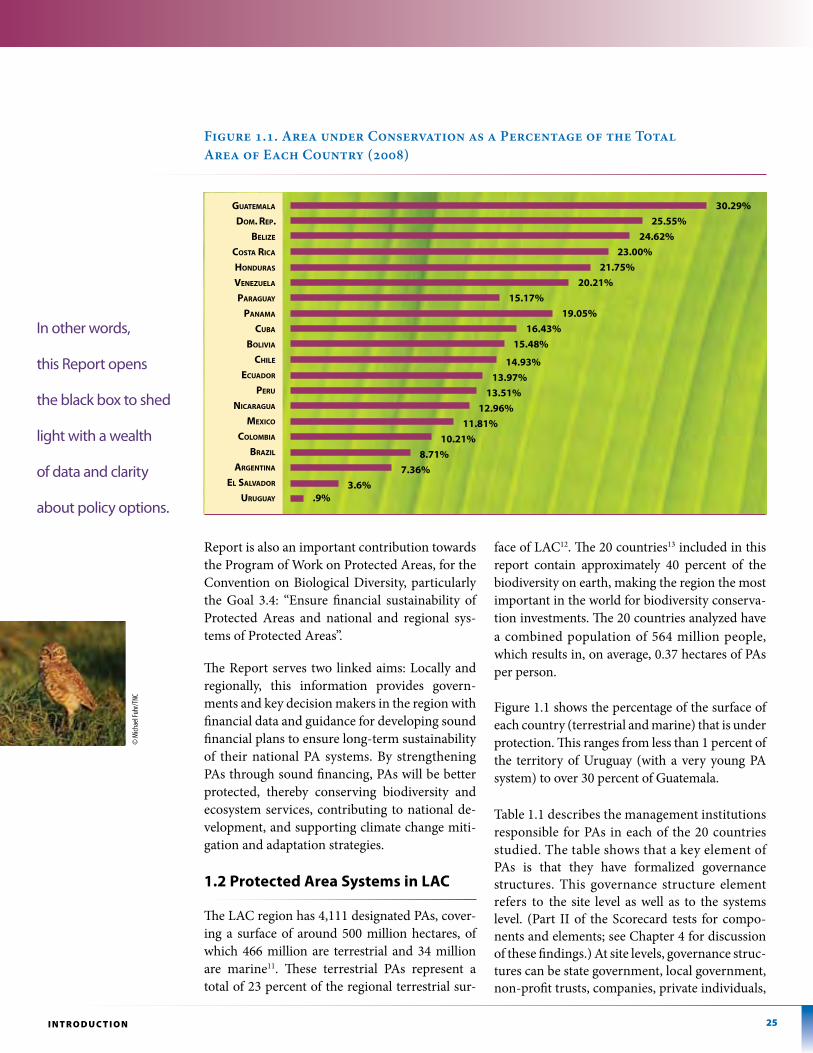
Figure 1.1. Area under Conservation as a Percentage of the Total Area of Each Country (2008)
Guatemala
Dom. Rep.
Belize
Costa RiCa
HonDuRas
Venezuela
paRaGuay
panama
CuBa
BoliVia
CHile
eCuaDoR
peRu
niCaRaGua
mexiCo
ColomBia
BRazil
aRGentina
el salVaDoR
uRuGuay
30.29%
25.55%
24.62%
23.00%
21.75%
20.21%
15.17%
19.05%
16.43%
15.48%
14.93%
13.97%
13.51%
12.96%
11.81%
10.21%
8.71%
7.36%
3.6%.9%
Report is also an important contribution towards the Program of Work on Protected Areas, for the Convention on Biological Diversity, particularly the Goal 3.4: “Ensure financial sustainability of Protected Areas and national and regional sys-tems of Protected Areas”.
The Report serves two linked aims: Locally and regionally, this information provides govern-ments and key decision makers in the region with financial data and guidance for developing sound financial plans to ensure long-term sustainability of their national PA systems. By strengthening PAs through sound financing, PAs will be better protected, thereby conserving biodiversity and ecosystem services, contributing to national de-velopment, and supporting climate change miti-gation and adaptation strategies.
1.2 protected area systems in laC
The LAC region has 4,111 designated PAs, cover-ing a surface of around 500 million hectares, of which 466 million are terrestrial and 34 million are marine11. These terrestrial PAs represent a total of 23 percent of the regional terrestrial sur-
face of LAC12. The 20 countries13 included in this report contain approximately 40 percent of the biodiversity on earth, making the region the most important in the world for biodiversity conserva-tion investments. The 20 countries analyzed have a combined population of 564 million people, which results in, on average, 0.37 hectares of PAs per person.
Figure 1.1 shows the percentage of the surface of each country (terrestrial and marine) that is under protection. This ranges from less than 1 percent of the territory of Uruguay (with a very young PA system) to over 30 percent of Guatemala.
Table 1.1 describes the management institutions responsible for PAs in each of the 20 countries studied. The table shows that a key element of PAs is that they have formalized governance structures. This governance structure element refers to the site level as well as to the systems level. (Part II of the Scorecard tests for compo-nents and elements; see Chapter 4 for discussion of these findings.) At site levels, governance struc-tures can be state government, local government, non-profit trusts, companies, private individuals,
© m
ichae
l Fuh
r/tnc
In other words,
this Report opens
the black box to shed
light with a wealth
of data and clarity
about policy options.
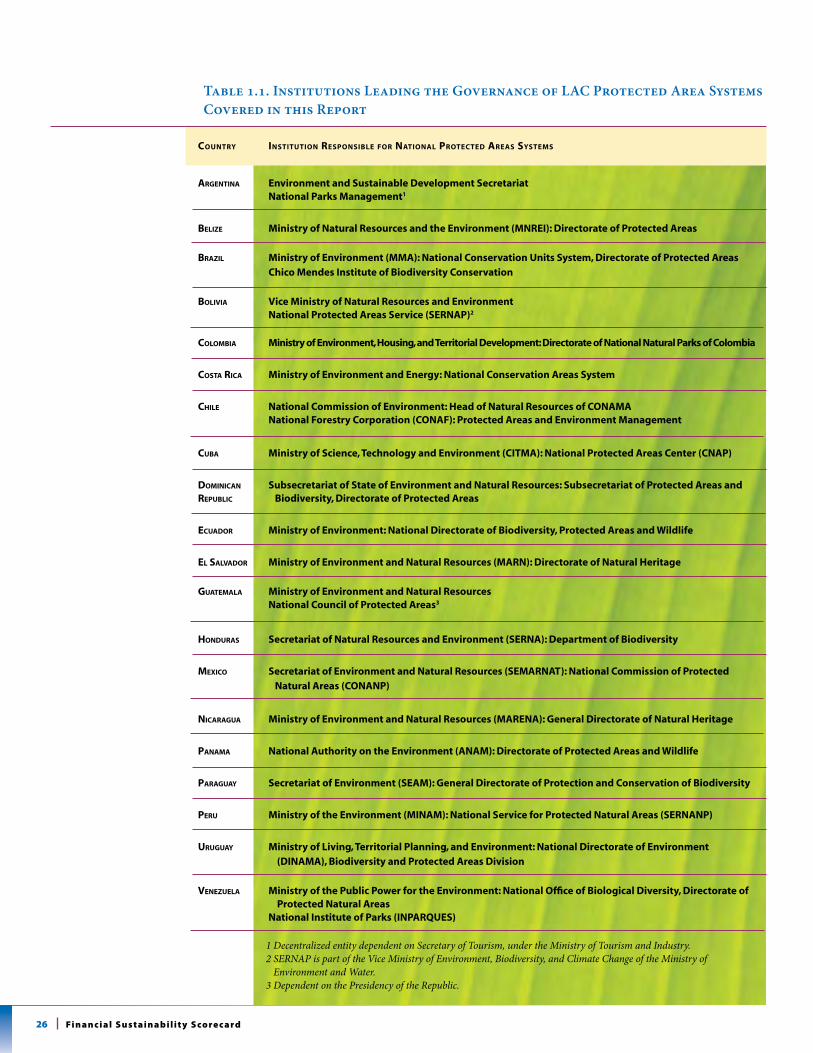
26 Fi n a n c i a l s u s t a i n a b i l i t y s co re c a rd
Table 1.1. Institutions Leading the Governance of LAC Protected Area Systems Covered in this Report
CountRy institution ResponsiBle foR national pRoteCteD aReas systems
aRGentina environment and Sustainable Development Secretariat National parks Management1
Belize Ministry of Natural resources and the environment (MNreI): Directorate of protected areas
BRazil Ministry of environment (MMa): National Conservation Units System, Directorate of protected areas Chico Mendes Institute of Biodiversity Conservation
BoliVia Vice Ministry of Natural resources and environment National protected areas Service (SerNap)2
ColomBia Ministry of environment, housing, and territorial Development: Directorate of National Natural parks of Colombia
Costa RiCa Ministry of environment and energy: National Conservation areas System
CHile National Commission of environment: head of Natural resources of CONaMa National Forestry Corporation (CONaF): protected areas and environment Management
CuBa Ministry of Science, technology and environment (CItMa): National protected areas Center (CNap)
DominiCan Subsecretariat of State of environment and Natural resources: Subsecretariat of protected areas andRepuBliC Biodiversity, Directorate of protected areas
eCuaDoR Ministry of environment: National Directorate of Biodiversity, protected areas and Wildlife
el salVaDoR Ministry of environment and Natural resources (MarN): Directorate of Natural heritage
Guatemala Ministry of environment and Natural resources National Council of protected areas3
HonDuRas Secretariat of Natural resources and environment (SerNa): Department of Biodiversity
mexiCo Secretariat of environment and Natural resources (SeMarNat): National Commission of protected Natural areas (CONaNp)
niCaRaGua Ministry of environment and Natural resources (MareNa): General Directorate of Natural heritage
panama National authority on the environment (aNaM): Directorate of protected areas and Wildlife
paRaGuay Secretariat of environment (SeaM): General Directorate of protection and Conservation of Biodiversity
peRu Ministry of the environment (MINaM): National Service for protected Natural areas (SerNaNp)
uRuGuay Ministry of Living, territorial planning, and environment: National Directorate of environment (DINaMa), Biodiversity and protected areas Division
Venezuela Ministry of the public power for the environment: National Office of Biological Diversity, Directorate of protected Natural areas
National Institute of parks (INparQUeS)
1 Decentralized entity dependent on Secretary of Tourism, under the Ministry of Tourism and Industry.2 SERNAP is part of the Vice Ministry of Environment, Biodiversity, and Climate Change of the Ministry of
Environment and Water.3 Dependent on the Presidency of the Republic.
27i n T R o d u C T i o n
communities, or indigenous peoples’ groups. At sys-tems levels, typically, the governance structure is based on central government institutions. Each man-agement approach implies a different financial struc-ture in terms of funding sources, financial systems, and associated management costs14.
PAs under similar governance structures are normally grouped together into networks or systems. In many countries, “national” PA systems traditionally consist of PAs on public land under the hand of a central gov-ernment. Because PAs on public lands on their own rarely meet national conservation targets, some coun-tries are expanding their national systems to include different networks of PAs operating at different levels and under a range of governance structures. These combinations of PAs in networks or systems can in-clude state, municipal, and private sub-systems.
The financial, governance, and situational complexity of PAs requires a specialized methodological tool for assessment and management. The Financial Sustain-ability Scorecard for National Systems of Protected Areas (henceforth ‘Scorecard’)15 was tailored to the needs of PA system finance. At the time this Scorecard was ap-plied (2008), with the exception of Argentina, Peru16, and Guatemala, the governance structure of the nation-al protected systems in assessed countries was headed by institutions directly linked to the highest environ-mental authority (typically, a Ministry or Secretary of the Environment) within a country. In some countries, the role of leading a national system and defining its policies and norms is placed under the Ministry of the Environment, while the execution of activities within PA sites falls under a separate institution, like a park authority, state government, or local organization (e.g., Bolivia, Brazil, etc.). Only two countries, Guatemala and Paraguay, have direct links from the PA system to the Presidency of the country. None of the national PA systems have direct links to the Ministries of Finance or Planning, despite the strategic role these systems play in land use and territorial planning. The arrangement of these different governance structures in PA systems yields food for thought about best practices.
Advantages and disadvantages attend different institu-tional placement and hierarchical levels for PA system governance. One lesson common across these gover-nance variations is that, at the very least, strong coor-
dination is needed with national budgetary processes if sustainable financing is to be achieved. See Chapter 2, “Financial Sustainability Scorecard for National Sys-tems of Protected Areas”, for detailed discussion of the elements used in the financial analysis of PAs and their systems. See also Chapters 3 and 4 for specific findings yielded by this Scorecard process.
1.3 the value of protected area systems
Well-managed and ecologically representative na-tional PA systems are essential to conserve a country’s national capital, preserve its biodiversity assets, and thereby provide and protect ecosystem services that support national sustainable development and human welfare. The provision of these crucial benefits is not free; costs are associated with PA management, both in terms of direct expenditures and opportunity costs (alternative uses). These costs require national govern-ments to set aside funding for PAs every year and, in effect, to “give up” potential revenues from allowing the land to be developed for other uses. Thus, decision makers need clarity over the type and degree of these naturally-based ecosystem services and benefits. This way, decision makers can consider development strate-gies in a “full cost” framework.
This introduction chapter summarizes the linkages be-tween PA-situated ecosystem services and both national development and human well-being. The economic benefits provided by these ecosystem services are traced to specific production sectors. This descriptive sum-mary, therefore, provides the backdrop against which discussion of financial sustainability in the remaining chapters of this Report should be viewed. Specifically, this summary review of ecosystem services underlines the risks and potential losses that LAC countries can face if their PA systems are not well funded. Finally — and significantly — this ecosystem services information contributes to building the case that the cost of sustain-ably funding PA systems is outweighed by the many benefits derived from these essential natural systems.
Precise monetary valuation of the services provided by PAs is complex and is hindered by a paucity of data. Eco-nomic valuation of ecosystem services and other non-market contributors to human economic systems and, indeed human welfare is quickly taking shape as a practical discipline.
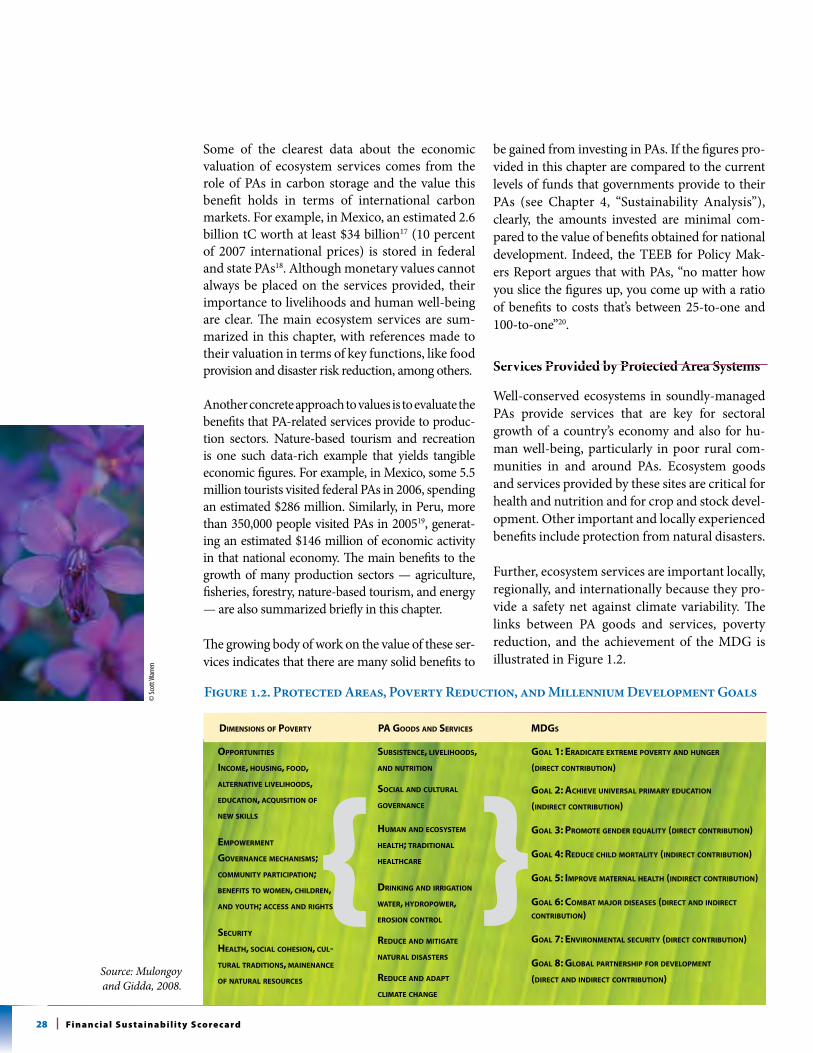
28 Fi n a n c i a l s u s t a i n a b i l i t y s co re c a rd
Some of the clearest data about the economic valuation of ecosystem services comes from the role of PAs in carbon storage and the value this benefit holds in terms of international carbon markets. For example, in Mexico, an estimated 2.6 billion tC worth at least $34 billion17 (10 percent of 2007 international prices) is stored in federal and state PAs18. Although monetary values cannot always be placed on the services provided, their importance to livelihoods and human well-being are clear. The main ecosystem services are sum-marized in this chapter, with references made to their valuation in terms of key functions, like food provision and disaster risk reduction, among others.
Another concrete approach to values is to evaluate the benefits that PA-related services provide to produc-tion sectors. Nature-based tourism and recreation is one such data-rich example that yields tangible economic figures. For example, in Mexico, some 5.5 million tourists visited federal PAs in 2006, spending an estimated $286 million. Similarly, in Peru, more than 350,000 people visited PAs in 200519, generat-ing an estimated $146 million of economic activity in that national economy. The main benefits to the growth of many production sectors — agriculture, fisheries, forestry, nature-based tourism, and energy — are also summarized briefly in this chapter.
The growing body of work on the value of these ser-vices indicates that there are many solid benefits to
be gained from investing in PAs. If the figures pro-vided in this chapter are compared to the current levels of funds that governments provide to their PAs (see Chapter 4, “Sustainability Analysis”), clearly, the amounts invested are minimal com-pared to the value of benefits obtained for national development. Indeed, the TEEB for Policy Mak-ers Report argues that with PAs, “no matter how you slice the figures up, you come up with a ratio of benefits to costs that’s between 25-to-one and 100-to-one”20.
Services Provided by Protected Area Systems
Well-conserved ecosystems in soundly-managed PAs provide services that are key for sectoral growth of a country’s economy and also for hu-man well-being, particularly in poor rural com-munities in and around PAs. Ecosystem goods and services provided by these sites are critical for health and nutrition and for crop and stock devel-opment. Other important and locally experienced benefits include protection from natural disasters.
Further, ecosystem services are important locally, regionally, and internationally because they pro-vide a safety net against climate variability. The links between PA goods and services, poverty reduction, and the achievement of the MDG is illustrated in Figure 1.2.
Figure 1.2. Protected Areas, Poverty Reduction, and Millennium Development Goals
Source: Mulongoy and Gidda, 2008.
oppoRtunities
inCome, HousinG, fooD,
alteRnatiVe liVeliHooDs,
eDuCation, aCquisition of
new skills
empoweRment
GoVeRnanCe meCHanisms;
Community paRtiCipation;
Benefits to women, CHilDRen,
anD youtH; aCCess anD RiGHts
seCuRity
HealtH, soCial CoHesion, Cul-
tuRal tRaDitions, mainenanCe
of natuRal ResouRCes
Dimensions of poVeRty pa GooDs anD seRViCes
suBsistenCe, liVeliHooDs,
anD nutRition
soCial anD CultuRal
GoVeRnanCe
Human anD eCosystem
HealtH; tRaDitional
HealtHCaRe
DRinkinG anD iRRiGation
wateR, HyDRopoweR,
eRosion ContRol
ReDuCe anD mitiGate
natuRal DisasteRs
ReDuCe anD aDapt
Climate CHanGe
mDGs
Goal 1: eRaDiCate extReme poVeRty anD HunGeR
(DiReCt ContRiBution)
Goal 2: aCHieVe uniVeRsal pRimaRy eDuCation
(inDiReCt ContRiBution)
Goal 3: pRomote GenDeR equality (DiReCt ContRiBution)
Goal 4: ReDuCe CHilD moRtality (inDiReCt ContRiBution)
Goal 5: impRoVe mateRnal HealtH (inDiReCt ContRiBution)
Goal 6: ComBat majoR Diseases (DiReCt anD inDiReCt ContRiBution)
Goal 7: enViRonmental seCuRity (DiReCt ContRiBution)
Goal 8: GloBal paRtneRsHip foR DeVelopment
(DiReCt anD inDiReCt ContRiBution)
{ }
© sc
ott W
arre
n
29i n T R o d u C T i o n
Water provision for human settlements: Many of the region’s largest human settlements benefit directly from PAs through the provision of fresh water. In Venezuela, 18 national parks supply wa-ter to 83 percent of the country’s population that is living in large urban areas. In Brazil, water sup-ply for Belo Horizonte and Rio de Janeiro comes from eight and five PAs, respectively. In Colom-bia, water for 31 percent of the population (20 million) comes from 16 PAs, while in Ecuador the PA system ensures water provision for more than 60 percent of the population.
Disaster management and prevention: When natural systems are degraded, their effectiveness in reducing the consequences of natural hazards such as heavy rain, flooding, hurricanes, earth-quakes, or drought is diminished. LAC has the highest rate of natural disasters in the world after Asia. Well-managed PAs maintain natural habitat and systems, reducing the effects of natural di-sasters. Thus, PAs and PA systems are important in the prevention of flood and storm surges by providing space for floodwaters to disperse and by buffering impacts on natural vegetation. In Mexico, low-lying coastal areas are vulnerable to sea-level rise; in those areas where PAs have been established (the Grijalva-Mezcapala-Usumacin-ta Delta Complex, Los Petenes, and Sian Ka’an Chetumal Bays), residents and communities re-ceived increased protection, specifically through the benefits of minimized coastal erosion and reduced damage from storms and tidal surges.
Vulnerability to disaster will be increasingly im-portant in the face of climate change. By increasing ecosystem resilience, PAs play a role in adapting to climate change and safeguarding existing disaster management and prevention services under new climate scenarios. This ‘hedge’ against change, in turn, will reduce negative impacts expected from climate change, such as landslip, rock falls and ava-lanches, tidal waves and storm surges, hurricanes and storms, flooding, drought and desertification, and fire. See additional notes on climate change and ecosystem services at the end of this section.
Nutritional and health care services: PAs of-fer ecosystem services beneficial to health. These
benefits range from habitat protection and the re-lated provision of goods for nutrition and health, to the slowed expansion of vector-borne diseases that thrive in degraded ecosystems. Another im-portant ecosystem health benefit is access to tradi-tional medicines. PAs conserve species with cur-rent or potential medicinal services. The emerging sector of pharmaceuticals based on indigenous genetic material should also be considered. Cli-mate change is likely to aggravate shortages of food and traditional medicines and to increase the spread of certain disease vectors. PAs reduce the vulnerability of these food and health supply services under changing climate scenarios. Addi-tional ecosystem services that play a role in nutri-tion and health include fish spawning, wild food, shelter, and agro-biodiversity.
Cultural and spiritual: PAs protect the territories and rights of indigenous communities. Important benefits to these communities include land and resources for them to continue traditional life-styles and customs. Land also allows these people to conserve and control their destinies. This situ-ation is common throughout the region, particu-larly in South America, where many indigenous lands overlap with PAs within national systems. In Venezuela alone, 32 different indigenous ethnic groups (57,000 people) live in PAs that provide hunting areas, sacred areas, and shelter.
Climate change-related services: Carbon capture and storage in living and dead vegetation (forests, grasslands, inland waters, marine systems, soil, and humus) enable climate change mitigation by storing and removing carbon that would otherwise be emitted into or retained within the atmosphere. PAs have a key role to play by serving as impor-tant reservoirs or sinks of carbon and by capturing carbon dioxide from the atmosphere. Some 312 Gt of carbon is stored in the world’s PA network globally, a figure that represents 15 percent of the world’s terrestrial carbon stock21. In LAC, with its significant forest endowment, the figures are sig-nificant, with PA contributions notably high. In South America, it is estimated that 26.8 percent of the total carbon stock is found in PAs (total is 341 Gt, and 91 Gt in PAs) and 25.2 percent in Meso-america+22 (16 Gt total and 4 Gt in PAs).
The following descriptive entries summarize examples of services provided by PAs in LAC.
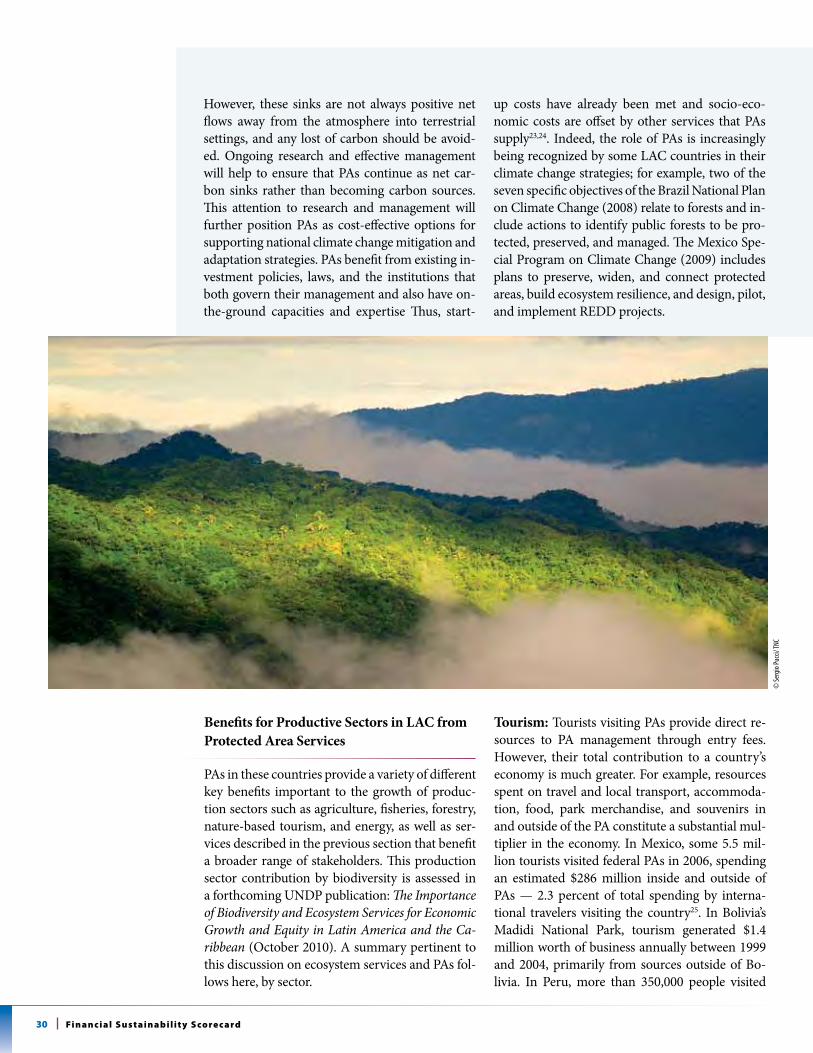
30 Fi n a n c i a l s u s t a i n a b i l i t y s co re c a rd
Benefits for Productive Sectors in LAC from Protected Area Services
PAs in these countries provide a variety of different key benefits important to the growth of produc-tion sectors such as agriculture, fisheries, forestry, nature-based tourism, and energy, as well as ser-vices described in the previous section that benefit a broader range of stakeholders. This production sector contribution by biodiversity is assessed in a forthcoming UNDP publication: The Importance of Biodiversity and Ecosystem Services for Economic Growth and Equity in Latin America and the Ca-ribbean (October 2010). A summary pertinent to this discussion on ecosystem services and PAs fol-lows here, by sector.
Tourism: Tourists visiting PAs provide direct re-sources to PA management through entry fees. However, their total contribution to a country’s economy is much greater. For example, resources spent on travel and local transport, accommoda-tion, food, park merchandise, and souvenirs in and outside of the PA constitute a substantial mul-tiplier in the economy. In Mexico, some 5.5 mil-lion tourists visited federal PAs in 2006, spending an estimated $286 million inside and outside of PAs — 2.3 percent of total spending by interna-tional travelers visiting the country25. In Bolivia’s Madidi National Park, tourism generated $1.4 million worth of business annually between 1999 and 2004, primarily from sources outside of Bo-livia. In Peru, more than 350,000 people visited
However, these sinks are not always positive net flows away from the atmosphere into terrestrial settings, and any lost of carbon should be avoid-ed. Ongoing research and effective management will help to ensure that PAs continue as net car-bon sinks rather than becoming carbon sources. This attention to research and management will further position PAs as cost-effective options for supporting national climate change mitigation and adaptation strategies. PAs benefit from existing in-vestment policies, laws, and the institutions that both govern their management and also have on-the-ground capacities and expertise Thus, start-
up costs have already been met and socio-eco-nomic costs are offset by other services that PAs supply23,24. Indeed, the role of PAs is increasingly being recognized by some LAC countries in their climate change strategies; for example, two of the seven specific objectives of the Brazil National Plan on Climate Change (2008) relate to forests and in-clude actions to identify public forests to be pro-tected, preserved, and managed. The Mexico Spe-cial Program on Climate Change (2009) includes plans to preserve, widen, and connect protected areas, build ecosystem resilience, and design, pilot, and implement REDD projects.
© se
rgio
Pucc
i/ tn
c
31i n T R o d u C T i o n
PAs in 2005, generating $1.7 million in entrance fees for the PA agency and an estimated $146 million of economic ac-tivity in the national economy26.
Fisheries: Marine protected areas (MPAs) are considered an instrument for improving fisheries management
and marine protection through seasonal and longer-term closures. These policies improve income for local fishermen. The policies also protect spawning fish and nursery areas, preserve vulnerable habitats, and reduce fishing pressure on species stocks. The economic value of the fish catch in MPAs in Chile under management with at least the basic protection scenario and based on producer prices (supply) is estimated at $19 million27.
Agriculture: The role of water provision from PAs is also key in agriculture. In Colombia, for example, small- and large-scale irrigation accounts for 40 percent of water demand, with most water resources coming from rivers that originate in the SPNN. In Peru, an es-timated 376,000 hectares are irrigated with water from national PAs producing an agricultural output worth about $514 million. The Pirai River in Bolivia supports the agro industry in the middle watershed with an es-timated value of $500 million per year. Fifty percent of the Pirai River flow comes from Amboro National Park and Management Area28. Pollination services provided by natural ecosystems are also important to agriculture. One study shows that tropical forest patches in Costa Rica, which provide habitat to many pollinating spe-cies, contributed an average of $62,000 per year for one farm (7 percent of the total farm income)29. Similarly, the role of PAs in conserving the wild relative species of domestic crops facilitates crop breeding and pollination services, all the while providing sustainable food for communities. For example, in Costa Rica the Volcan Irazu National Park conserves wild avocado and avo-cado near-relative species30; Argentina’s Nahuel Huapi National Park protects the wild relatives of potatoes31; and finally, Bolivia’s Madidi National Park conserves several types of wild pineapple32.
Hydropower: In Bolivia, the Sama Reserve provides 80 percent of the water supply for the San Jacinto Hydro-metric System, which in turn supplies an estimated 25 percent of the electricity consumed in Tarija. Without adequate protection of the Sama Reserve ecosystems, a
decrease in water supply for the hydroelectric system could result in an annual loss estimated at $230,00033.
1.4 Financial sustainability of protected area systems
Defining Financial Sustainability of Protected Areas
Financial sustainability is achieved when a PA system secures sufficient and stable resources over the long term to meet its total management costs. These sustain-ing resources come from different sources, including government budgets and extra budgetary funds, and from international cooperation sources, but they also come from revenues generated in PA sites within the system. However, PA agencies are often ill-equipped to respond to income-generating opportunities that PAs provide through consumptive and non-consumptive uses of biodiversity.
Securing adequate funds is a necessary but not sufficient condition for PA sustainability; managers must also consider the quality, form, timing, targeting, uses, and sources of funding. This means that PA management must be two-pronged. One prong is a funding “supply” issue of generating more revenue across the system. The second prong, equally important, concerns a “demand” side challenge of managing PA financing needs (at sites and at a central level). PA financial sustainability needs to be addressed from both sides of this balanced finan-cial equation.
PA financial sustainability can, therefore, also be defined as the ability, first, to secure sufficient, stable, and long-term financial resources and, second, to allocate these resources in a timely manner and in appropriate forms, to cover the full costs of PAs. This complete approach can ensure that PAs are managed effectively and efficiently, with respect to conservation and other objectives.
For a country to achieve financial sustainability for PAs and PA systems, the country needs strong and effective institutions to generate, manage, and invest funds in the national PA system. In the long term, financial sustain-ability should go beyond ensuring resources to bridge the financial gap; PA systems should seek the possibility to allow and facilitate effective participation and benefit sharing with the different stakeholders of PA systems.
© steffen Reichle/ tnc
32 Fi n a n c i a l s u s t a i n a b i l i t y s co re c a rd
What Is Financial Sustainability?
Protected area “financial sustainabil-ity” refers to the ability of a country to meet all costs associated with the management of a protected area system. The system level is defined here simply as the aggregation of PA sites and central level operations. This implies a funding “supply” issue of generating more revenue across the system, but just as importantly, a “demand” side challenge of managing PA financing needs (at sites and at the central level). PA financial sustainabil-ity needs to be addressed from both sides of the financial equation.
From the Financial Sustainability Scorecard for National Systems of Protected Areas. Updated version available at www.undp.org/gef/05/kmanagement/newpublication.html (Bovarnick, 2008).
The Importance of Protected Area System-Level Financing
PAs are recognized to be cornerstones of biodi-versity conservation and of the ecosystem services these crucial natural areas provide. On the other hand, many PAs are recognized to have serious management deficiencies, due in large part to un-derfunding and poor fund use. For example, often these funds are not used in a cost-effective man-ner. The reasons for the “twin” problems of un-derfunding and poor fund use boil down to one overarching problem: Planning how to fund PAs has not been given sufficient attention.
The global community advocates that more land and natural resources should be conserved but has not provided adequate funds with which to ac-complish the stated world goal of increased con-servation. On the ground, in many PAs, this is the common situation: staff and other resources are stretched ever more thinly in many places; all the
while, available funds fail to meet the minimum — or basic scenario — needs. Even with professional development of current staff, more staff are needed, which necessarily means increased annual operation costs for salaries, vehicles, offices, and equipment. Beyond the annual budget process looms a need for capital budgeting: most PAs require vital capital investment to improve PA infrastructure, both for wildlife management and tourism needs.
Hence, PA financing is critical for sound PA man-agement and for the development of long-term financing systems; together, financing and man-agement reform are required for PA sustainability.
To develop comprehensive, sustainable finance solutions, stakeholders should first approach PA financing from a system perspective rather than addressing it on a site-by-site basis. This system-level focus is important when considering and addressing PA financing because:
• Manyconstructiveactivitiesarerequiredatanational level and not just at site levels, such as policy reform, fund management, and set-ting of PA fees. These activities form the con-text in which many decisions are made, like setting conservation and financial targets, which can affect all PAs.
• Manypro-PAactivitiesrequirecoordinatedefforts and support from several government institutions, particularly the Ministry of Fi-nance. This coordination is best achieved through a centralized management and fi-nancing system.
• Siteswilloftenrequiresimilaractivitiesliketraining and monitoring; providing these ac-tivities centrally is cost effective.
• Fundraisingcanbemoreeffectiveifcoordi-nated centrally.
• System-level planning allows cross-subsidi-zation between sites.
• Harmonizedfeesystemscanreducecompe-tition issues between sites.
i n T R o d u C T i o n
Elements of a Protected Area Financing System
The elements of a PA financing system address four key questions: a. What has to be financed? b. What does it cost? c. What are the institutional arrangements? d. What are the sources of funds?
a. What Has to Be Financed? An accurate and comprehensive assessment of management needs across a PA system enables in-formed decisions on funding needs, priorities, and opportunities for savings. The following six expen-diture categories are usually used in the region to group hundreds of different items and resources needed for PA management; slight differences might arise from country to country based on ex-penditure compatibility with various governmen-tal accounting systems.
Recurrent Costs (Operational) •Humanresources:salariesforpardirec-
tor, managers, park guards, scientists, community liaison officers, tourism specialists, and a financial specialist
•Maintenance:officeandvehicular maintenance, path maintenance•Utilities:water,electricity,and communications•Basicequipment:GPSdevices,boots, uniforms, machetes, torches, etc.
Capital Costs (Investment)• Infrastructure,capitalequipment,andvehi-
cles; these include paths, visitor centers, ranger towers, demarcation posts, roads, gates, etc.
•Professionalservicesforone-timebase-levelstudies and ongoing training events
These operation and capital costs are typically incurred at both a central system level and at the PA site level. At the central level, capacity building costs are also incurred. At the PA site level, costs are generated in carrying out management activi-ties (see Box 1.1). These costs reflect both opera-tional needs and investments.
© sergio Pucci/ tnc
33
© anabela Garcia /tnc
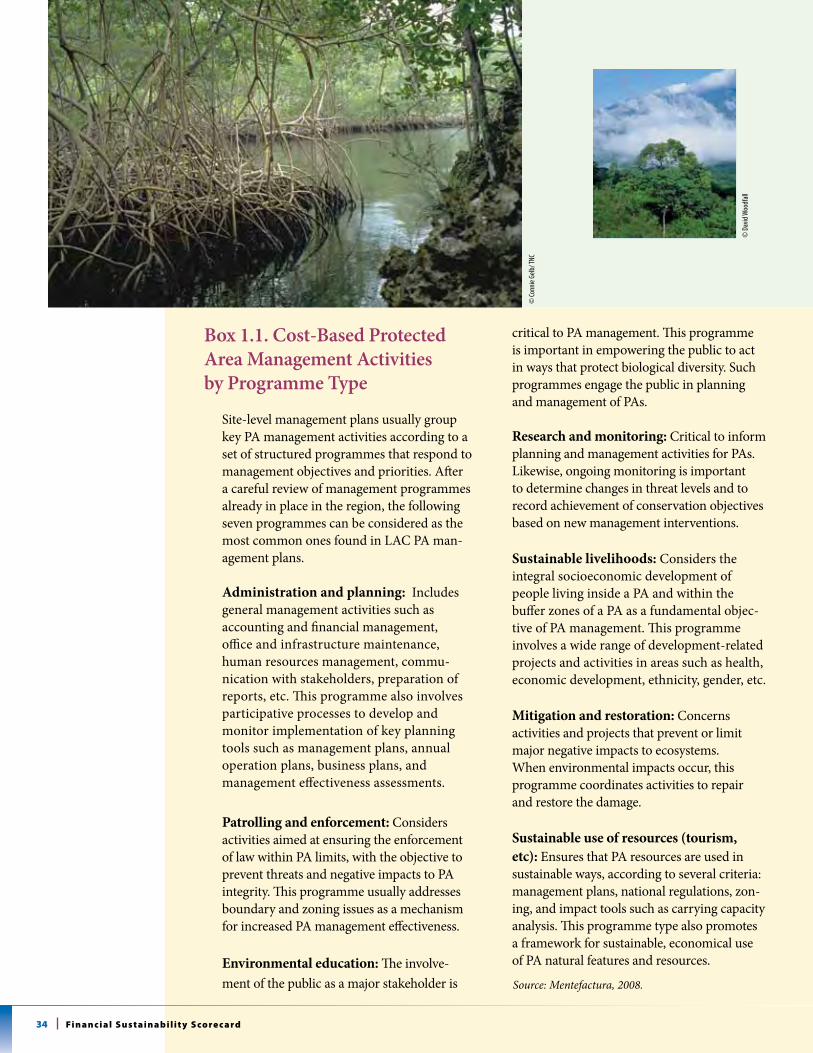
34 Fi n a n c i a l s u s t a i n a b i l i t y s co re c a rd
Box 1.1. Cost-Based Protected Area Management Activities by Programme Type
Site-level management plans usually group key PA management activities according to a set of structured programmes that respond to management objectives and priorities. After a careful review of management programmes already in place in the region, the following seven programmes can be considered as the most common ones found in LAC PA man-agement plans.
Administration and planning: Includes general management activities such as accounting and financial management, office and infrastructure maintenance, human resources management, commu-nication with stakeholders, preparation of reports, etc. This programme also involves participative processes to develop and monitor implementation of key planning tools such as management plans, annual operation plans, business plans, and management effectiveness assessments.
Patrolling and enforcement: Considers activities aimed at ensuring the enforcement of law within PA limits, with the objective to prevent threats and negative impacts to PA integrity. This programme usually addresses boundary and zoning issues as a mechanism for increased PA management effectiveness.
Environmental education: The involve-ment of the public as a major stakeholder is
critical to PA management. This programme is important in empowering the public to act in ways that protect biological diversity. Such programmes engage the public in planning and management of PAs.
Research and monitoring: Critical to inform planning and management activities for PAs. Likewise, ongoing monitoring is important to determine changes in threat levels and to record achievement of conservation objectives based on new management interventions.
Sustainable livelihoods: Considers the integral socioeconomic development of people living inside a PA and within the buffer zones of a PA as a fundamental objec-tive of PA management. This programme involves a wide range of development-related projects and activities in areas such as health, economic development, ethnicity, gender, etc.
Mitigation and restoration: Concerns activities and projects that prevent or limit major negative impacts to ecosystems. When environmental impacts occur, this programme coordinates activities to repair and restore the damage.
Sustainable use of resources (tourism, etc): Ensures that PA resources are used in sustainable ways, according to several criteria: management plans, national regulations, zon-ing, and impact tools such as carrying capacity analysis. This programme type also promotes a framework for sustainable, economical use of PA natural features and resources.
Source: Mentefactura, 2008.
© co
nnie
Gelb
/ tnc
© d
avid
Woo
dfall
35i n T R o d u C T i o n
b. What Does It Cost? Costs should be determined based on specific PA management needs, which consider conservation objectives and are complemented by sound finan-cial data for constituent PAs of the system. This cost information should be generated through the PA management planning process both at the site and system levels. These plans and their corre-sponding cost analysis procedures should demon-strate cost-effectiveness. Further, these cost-anal-ysis findings should be shared so that Ministries of Finance understand and agree on the conser-vation objectives and related activities for which PA funding will be requested. This financial data, then, allows for financial planning.
c. What Are the Institutional Arrangements?An analysis of financing for PAs requires clarify-ing which government ministries and agencies have what particular management and financial responsibilities for which specific parts of a PA system. In some countries, different ministries manage different sub-systems or networks. In oth-er countries, PA staff salaries come directly from the Treasury entity, while police or coast guards play a role in enforcement. Therefore, clarity about these two areas is key: first, a breakdown of all budget support from different authorities and, second, lucidity on specific enforcement or line-level responsibilities. Knowing these two arenas of authority permits sound estimation of real costs, budget development, and financial needs analysis across all relevant institutions. For these reasons, stakeholders will find useful a political document presented to and approved by the pertinent gov-ernment entity that outlines and details the objec-tives, policies, and intended actions that will be part of a national PA financing system34.
A supportive, enabling environment, with an ap-propriate set of policies and laws that allow PAs to generate, retain, manage, and invest funds, is an essential foundation for site-based work. There-fore, stakeholders must analyze and identify the legal barriers to revenue generation and alloca-tion. Additional laws and policies supporting site-based revenues and taxes are important for gener-ation of revenue streams. Ensuring that revenues are retained within the PA system is helpful for
maintaining the generated income and increasing the system budget. Laws that permit or promote sharing of PA revenues with local communities can also assist in sharing local economic benefits and building community partnerships. See Chap-ter 4, “Sustainability Analysis”, for an analysis of this supportive, enabling environment.
Once funds are received from the central budget process or from area or system-generated rev-enues, PA staff must manage and administer the funds in ways that promote cost efficiency and management effectiveness. This active and en-gaged management stance allows for long-term planning and security, providing incentives and opportunities for managers. Institutional gov-ernance structures must enable and require the operation of effective, transparent mechanisms for management and allocation of funds and for accounting for revenues and expenditures. Such professional management requires sufficient hu-man capacity to use financial tools, specifically those data management and accounting systems that can be used by system-level and site-level fi-nancial planners and managers. Human and tech-nological resources are required to optimize the use of generated funds in PA management. The in-troduction of professional and transparent man-agement mechanisms will improve fee collection and eliminate leakage. Promoting cost efficiency and management effectiveness also addresses questions of optimal deployment of human and other resources to avoid duplication of tasks be-tween individuals, departments, or institutions. Co-management arrangements with communi-ties, NGOs, or the private sector demonstrate clear efficiency benefits and help address capacity gaps where the required skills are not available within the PA institution.
d. What Are the Sources of Funds? In general, PA funding sources include pub-lic funding, revenue generation, donor funds, and in-kind resources. Public funding through government budgeting is often the most impor-tant source to fund recurrent costs, although the amounts are usually not enough to cover basic management costs. Economic valuations of goods
36 Fi n a n c i a l s u s t a i n a b i l i t y s co re c a rd
and services provided by PAs, compared to fi-nancing gaps, are useful to present to Ministries of Finance toshow how much governments should invest in their PA systems. Full-cost presentations that pair economic valuation of ecosystem servic-es with financing gaps can be site-based for select PAs, especially those demonstrating local eco-nomic benefit. However, these presentations about ecosystem service benefits and PA financing gaps are also useful undertakings for the entire system. In effect, this system-level presentation is powerful in the aggregating of benefits. Economic benefit arguments — combined with more transparent use of funds, evidence of cost-effective manage-ment, and clear plans — are proven to strengthen budget negotiations and can result in higher an-nual government budgets for PA systems.
A funding portfolio, going beyond conventional mechanisms and including multiple funding sources, is a key element of PA financial stabil-ity and sustainability. Diversification of revenue sources is a powerful strategy to reduce PA vul-nerability to external shocks. Thus, PA systems should explore and develop mechanisms for gen-erating new financial flows as a critical element in creating financial sustainability. For instance, tourism entrance and user fees are the most com-mon PA revenue sources, but other revenue op-tions include payment for water services, carbon offsets, debt renegotiation and swaps, and tourism concessions. Additionally, revenue sources could also include national policy instruments such as departure taxes or water fees.
Financial and business planning for PAs needs to be undertaken on a regular and systematic ba-sis. Effective financial planning requires accurate knowledge not only of revenue amounts but also
of expenditure levels, patterns, and requirements. Options for balancing the costs/revenues equation should include equal consideration of revenue in-creases and cost control. Good financial planning enables PA managers to make strategic financial decisions, such as re-allocating spending to match management priorities. Financial planning also creates a culture of fiscal prudence, ongoing iden-tification of appropriate cost reductions, and alert-ness to potential cash flow problems.
The following chapters in this Report address in detail the methodology and findings of this com-prehensive assessment of conservation financing for PAs and PA systems.
Chapter 2, “Financial Sustainability Scorecard for National Systems of Protected Areas”, presents the elements of financial analysis for manage-ment and planning contained in the Scorecard. This Scorecard was developed by UNDP to as-sist those working on PA sustainability — project teams and governments — in tracking their prog-ress in making PA systems financially sustainable. The Scorecard has three sections. Part I assesses the overall financial health of the PA system. Part II assesses specific elements of the complex envi-ronment within which PAs and PA systems must operate. Part III summarizes these findings in a scoring framework.
Chapter 3, “Financial Analysis”, relies extensively on quantitative data derived from application of Part I of the Financial Sustainability Scorecard. Readers will find data by country, as well as com-parative regional analysis. This chapter provides snapshot views of a PA system’s financial accounts.
Chapter 4, “Sustainability Analysis”, builds on the snapshots of data shown in Chapter 3 and presents the findings from applying Part II of the Financial Sustainability Scorecard. The findings are arranged by a structured, standardized approach that dis-cusses, by element, how to improve PA financing.
Chapter 5 summarizes the conclusions learned from the Scorecard process and offers recommen-dations to policy makers for strengthening the fi-nancial sustainability of national PA systems.
© scott Warren
A funding portfolio,
going beyond conven-
tional mechanisms and
including multiple
funding sources, is a
key element of PA
financial stability and
sustainability.
37F i n A n C i A l s u s TA i n A b i l i T y s Co R E C A R d
2.1 Financial sustainability scorecard for national systems of protected areas
The Scorecard is structured to look at all elements of a financing system. These elements, in them-selves, provide guidance on what a framework for a PA financing system should be composed of. Assessing each element, particularly the qualita-tive elements that describe the country context, can help a country identify those areas of its gov-ernance structure that need to be improved to enhance a particular PA financing system.
The Scorecard has three sections:
Part I – Assessing the overall financial status of the PA system; this section includes basic PA information and a financial analysis of the national PA system.
Part II – Assessing qualitative elements of the financing system; this section focuses on the governance structure of the PA systems studied.
Part III – Scoring across all elements and analytical categories.
T he purpose of the Financial Sustainability Scorecard for National Systems of Protected Areas (Scorecard) is to assist governments, donors, and NGOs in investigating and recording significant aspects of a protected area (PA)
financing system — accounts and underlying structural foundations — to show both current health and status and to indicate if the system is moving holisti-cally over the long term toward an improved financial situation. The Scorecard is designed for national systems of PAs, but this instrument could be used by sub-national systems, namely state, regional, or municipal systems, or by entities or networks of Marine Protected Areas (MPAs).
C h a p t e r 2
Financial sustainability scorecard for national systems of protected areas
©se
rgio
Rossi
38 Fi n a n c i a l s u s t a i n a b i l i t y s co re c a rd
Part I requires financial data to determine the costs, revenues, and financing gaps of a PA system, both in the current year and as a forecast for the future. This part of the Scorecard provides a quantitative analysis of a PA system and shows the financial data needed by PA planners to determine financial targets and, hence, the additional funds required to finance effective management of their PA system. Because different countries have different accounting systems, certain data requirements may vary in relevance for each country. However, where financial data is absent, the first activity of the PA authority should be to generate and collect this data.
Part II of the Scorecard facilitates a qualitative analy-sis and is compartmentalized into the three funda-mental components necessary for a fully-functioning financial system at the site and system levels. Each component is divided into elements, which are further divided into sub-elements. Structured guidance is provided for assessing and scoring each sub-element. This assessment can help a country identify which areas of its governance structure need to be improved to enhance its PA financing system. The three compo-nents for Part II are:
• Legal,regulatory,andinstitutionalframeworksthat enable sustainable financing
• Businessplanningandtoolsforcost-effectivemanagement
• Toolsforrevenuegenerationandmobilization
For Part II of the Scorecard, the percentage of achieve-ment of each component should be presented. This allows a comparison of progress from component to component and can aid countries in identifying where weaknesses and strengths reside within their financ-ing systems. Where lower scores are identified, the corresponding areas should be a focus for future inter-vention and capacity building. The percentage report-ing choice will also permit comparison across coun-tries. This percentage reporting choice is useful information for countries but is particularly helpful when looking at the region and subregions.
The Scorecard should be completed every year to show the annual situation in a PA system and changes over time. The first year the Scorecard is completed becomes the baseline year, with this ‘reference’ condition stay-ing fixed. Then, if the Scorecard is completed every
subsequent year, the results can be compared to the baseline data to show the annual progress of a national PA financing system.
In each country, certain elements may be more impor-tant than they are for other countries. Sometimes, certain elements will be more difficult to achieve than other elements. In this case, country teams have the flexibility to modify the current weighting system and change the number of points allocated to a certain ele-ment so the scoring better suits national conditions. Any modification to scoring should be transparent and footnoted.
Additionally, if a specific element or sub-element is not appropriate for a country, then the element and its associated maximum scores can be taken out of the total possible scoring. In this way, the total score can be adjusted to fit country conditions. Because this means the total possible score may vary across countries due to composition elements/sub-elements in scoring, the annual scores should be presented as a percentage (actual score compared to total possible score).
2.2 scorecard application methodology
This Report is based on data generated through appli-cation of the UNDP Financial Sustainability Scorecard for National Systems of Protected Areas in 20 countries across the region during 200835. This report also pres-ents information about PA sub-systems from five Bra-zilian States — Rio de Janeiro, Rio Grande do Sul, Parana, Minas Gerais, and Espirito Santo. See Table 2 for list of countries arranged by sub-region.
To generate this data across so many countries, UNDP trained key experts in applying and interpret-ing the UNDP Scorecard. In turn, these experts led two subregional workshops to train TNC, UNDP, and government staff in South America and Mesoamer-ica+ on how to complete the Scorecard. These train-ing workshops also raised interest in and understand-ing of the Scorecard tool. One subregional workshop was held in Santiago, Chile (September 2008) with 41 representatives of 10 South American countries; this workshop included seven Directors of Protected Area Systems, four heads of departments, and a range of technical staff including legal specialists, economists, and advisors. The second subregional workshop, for Mesoamerica+, was held in San Jose, Costa Rica (Sep-
©an
drew
Bova
rnic
39F i n A n C i A l s u s TA i n A b i l i T y s Co R E C A R d
tember 2008) with 39 representatives from eight dif-ferent countries, including five Directors of Protected Area Authorities and five heads of PA Departments. All countries participating in these subregional work-shops expressed strong support for the Scorecard as a practical and useful tool. Furthermore, all agreed to apply this tool in their countries within the context of the UNDP-TNC partnership program.
Countries Covered
The UNDP Scorecard was prepared in 20 countries in the following two subregions:
1 This region will be referred to as Mesoamerica+. 2 English-speaking Caribbean countries were not included in this initiative. Planning for the next round of support to the region includes these countries.
At the country level, experts worked with govern-ment agencies for several months to collect data for Part I of the Scorecard. Subsequently, national work-shops (each lasting two days) were organized to pre-pare Part II of the Scorecard. The national workshops brought together key stakeholders to review and dis-cuss the Scorecard. Several additional months were taken after the workshops for data collection comple-tion. Data from Scorecards and the accompanying draft country reports were verified by respective gov-ernments through a consultation process carried out by UNDP and TNC (late 2008 to early 2009).
The interactive application of the Scorecard enabled participants to consider specific findings on finances and other quantitative measures, along with qualita-tive aspects of the context in which PAs and PA sys-tems function. Specifically, participants were able to
• determinetheirPAsystem’soverallfinancialstatus
•assesskeyelements(orlackthereof)oftheirfinancing systems (for example, governance frameworks that enable sustainable PA finance)
• learnaboutbusinessplanningandothertoolsforcost-effective management
• considertoolsandsystemsforrevenuegenerationand mobilization
• identifywhichelementsrequiredstrengtheningtoadvance sustainability of their PA systems
This consultative process also enabled the exchange of views and discussion between stakeholders within each country on the status of different elements of financial sustainability and strategies to correct deficiencies.
In all, the Report preparation process trained 378 PA government staff and practitioners on applying the PA Financial Sustainability Scorecard.
2.3 protected areas systems Covered by the report
Financial information collected from application of the Scorecard came from the PA systems of 20 coun-tries in Mesoamerica+ and South America. The finan-cial data generated covered 1,748 PAs with a total sur-face of 207 million hectares. This aggregated land figure represents 10 percent of the combined surface of the 20 countries and nearly 42 percent of the sur-face of all LAC PA systems. The total also represents approximately 15 percent of the world’s surface that is covered under some conservation category36.
For the purpose of Scorecard application, each coun-try was asked to provide a classification scheme for its PA systems. The majority of countries classified systems according to who managed the PAs (e.g., central government, local governments, co-manag-ers, etc.). Other countries classified their systems as terrestrial or marine PA systems, while still other countries used classifications based on management categories. Each country’s national authority chose the PA systems for Scorecard application. These deci-sions were based largely on data availability. Hence, the types of systems analyzed varied greatly
MesoaMerica, Belize, Costa RiCa, el salvadoR, Mexico, and Guatemala, HonduRas, mexiCo, the caribbean niCaRaGua, Panama, CuBa, and tHe dominiCan RePuBliC
south aMerica noRtHeRn andes: ColomBia eCuadoR, and venezuela soutHeRn andes: aRGentina, Bolivia, CHile, PaRaGuay, PeRu, and uRuGuay BRazil: FedeRal and seleCted states: Rio de JaneiRo, Rio GRande do sul, PaRana, minas GeRais, and esPiRito santo.
©andrew Bovarnic
©an
drew
Bova
rnic
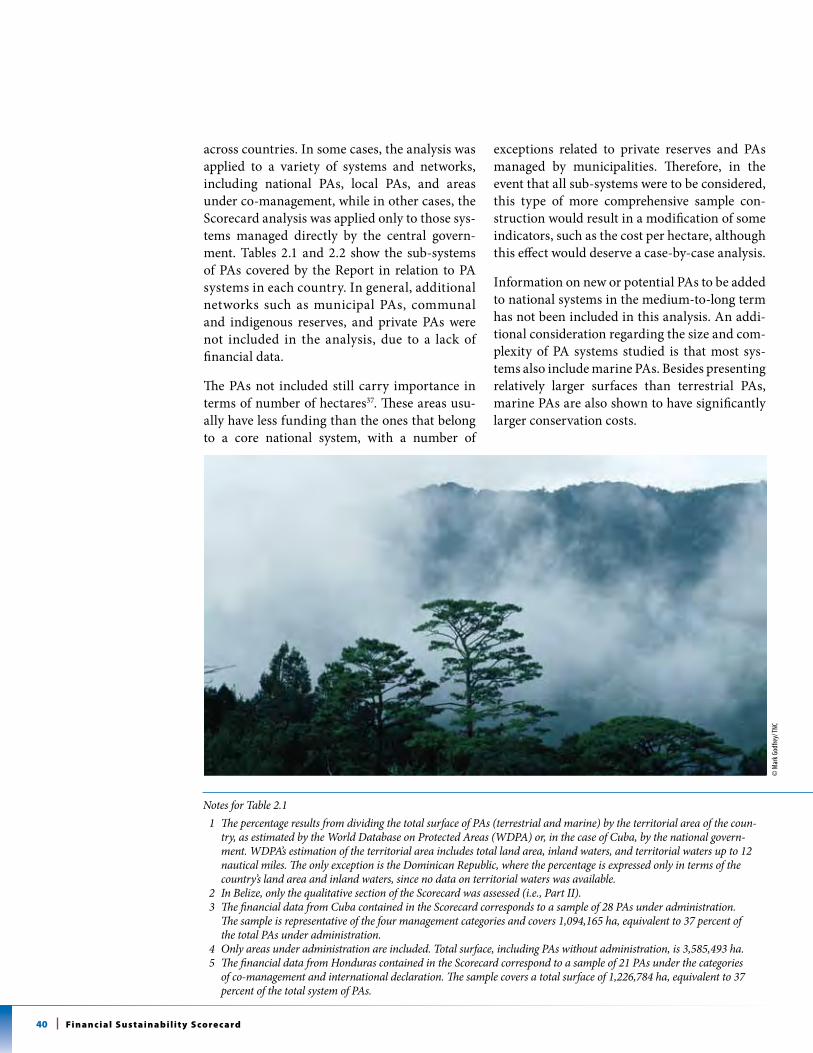
40 Fi n a n c i a l s u s t a i n a b i l i t y s co re c a rd
across countries. In some cases, the analysis was applied to a variety of systems and networks, including national PAs, local PAs, and areas under co-management, while in other cases, the Scorecard analysis was applied only to those sys-tems managed directly by the central govern-ment. Tables 2.1 and 2.2 show the sub-systems of PAs covered by the Report in relation to PA systems in each country. In general, additional networks such as municipal PAs, communal and indigenous reserves, and private PAs were not included in the analysis, due to a lack of financial data.
The PAs not included still carry importance in terms of number of hectares37. These areas usu-ally have less funding than the ones that belong to a core national system, with a number of
exceptions related to private reserves and PAs managed by municipalities. Therefore, in the event that all sub-systems were to be considered, this type of more comprehensive sample con-struction would result in a modification of some indicators, such as the cost per hectare, although this effect would deserve a case-by-case analysis.
Information on new or potential PAs to be added to national systems in the medium-to-long term has not been included in this analysis. An addi-tional consideration regarding the size and com-plexity of PA systems studied is that most sys-tems also include marine PAs. Besides presenting relatively larger surfaces than terrestrial PAs, marine PAs are also shown to have significantly larger conservation costs.
Notes for Table 2.11 The percentage results from dividing the total surface of PAs (terrestrial and marine) by the territorial area of the coun-
try, as estimated by the World Database on Protected Areas (WDPA) or, in the case of Cuba, by the national govern-ment. WDPA’s estimation of the territorial area includes total land area, inland waters, and territorial waters up to 12 nautical miles. The only exception is the Dominican Republic, where the percentage is expressed only in terms of the country’s land area and inland waters, since no data on territorial waters was available.
2 In Belize, only the qualitative section of the Scorecard was assessed (i.e., Part II).3 The financial data from Cuba contained in the Scorecard corresponds to a sample of 28 PAs under administration.
The sample is representative of the four management categories and covers 1,094,165 ha, equivalent to 37 percent of the total PAs under administration.
4 Only areas under administration are included. Total surface, including PAs without administration, is 3,585,493 ha. 5 The financial data from Honduras contained in the Scorecard correspond to a sample of 21 PAs under the categories
of co-management and international declaration. The sample covers a total surface of 1,226,784 ha, equivalent to 37 percent of the total system of PAs.
© m
ark G
odfre
y/ tn
c
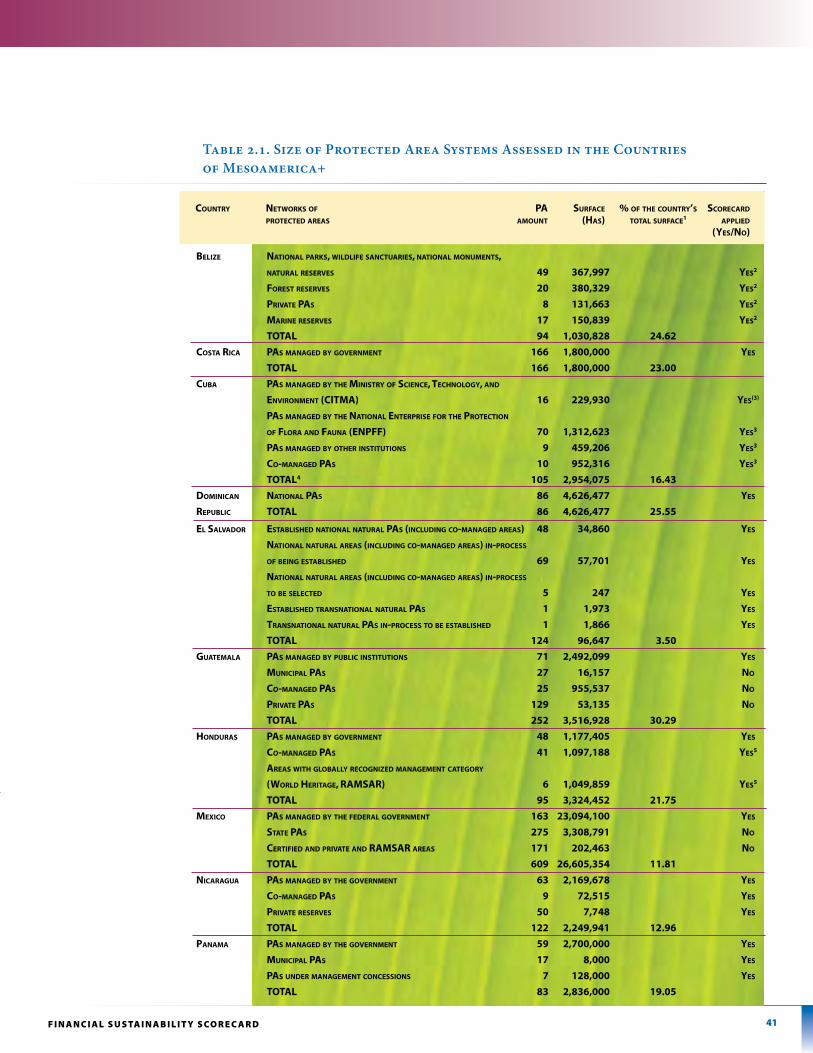
41F i n A n C i A l s u s TA i n A b i l i T y s Co R E C A R d
Table 2.1. Size of Protected Area Systems Assessed in the Countries of Mesoamerica+
Belize national paRks, wilDlife sanCtuaRies, national monuments,
natuRal ReseRVes 49 367,997 yes2
foRest ReseRVes 20 380,329 yes2
pRiVate pas 8 131,663 yes2
maRine ReseRVes 17 150,839 yes2
tOtaL 94 1,030,828 24.62
Costa RiCa pas manaGeD By GoVeRnment 166 1,800,000 yes
tOtaL 166 1,800,000 23.00
CuBa pas manaGeD By tHe ministRy of sCienCe, teCHnoloGy, anD
enViRonment (Citma) 16 229,930 yes(3)
pas manaGeD By tHe national enteRpRise foR tHe pRoteCtion
of floRa anD fauna (enpff) 70 1,312,623 yes3
pas manaGeD By otHeR institutions 9 459,206 yes3
Co-manaGeD pas 10 952,316 yes3
tOtaL4 105 2,954,075 16.43
DominiCan national pas 86 4,626,477 yes
RepuBliC tOtaL 86 4,626,477 25.55
el salVaDoR estaBlisHeD national natuRal pas (inCluDinG Co-manaGeD aReas) 48 34,860 yes
national natuRal aReas (inCluDinG Co-manaGeD aReas) in-pRoCess
of BeinG estaBlisHeD 69 57,701 yes
national natuRal aReas (inCluDinG Co-manaGeD aReas) in-pRoCess
to Be seleCteD 5 247 yes
estaBlisHeD tRansnational natuRal pas 1 1,973 yes
tRansnational natuRal pas in-pRoCess to Be estaBlisHeD 1 1,866 yes
tOtaL 124 96,647 3.50
Guatemala pas manaGeD By puBliC institutions 71 2,492,099 yes
muniCipal pas 27 16,157 no
Co-manaGeD pas 25 955,537 no
pRiVate pas 129 53,135 no
tOtaL 252 3,516,928 30.29
HonDuRas pas manaGeD By GoVeRnment 48 1,177,405 yes
Co-manaGeD pas 41 1,097,188 yes5
aReas witH GloBally ReCoGnizeD manaGement CateGoRy
(woRlD HeRitaGe, RamsaR) 6 1,049,859 yes5
tOtaL 95 3,324,452 21.75
mexiCo pas manaGeD By tHe feDeRal GoVeRnment 163 23,094,100 yes
state pas 275 3,308,791 no
CeRtifieD anD pRiVate anD RamsaR aReas 171 202,463 no
tOtaL 609 26,605,354 11.81
niCaRaGua pas manaGeD By tHe GoVeRnment 63 2,169,678 yes
Co-manaGeD pas 9 72,515 yes
pRiVate ReseRVes 50 7,748 yes
tOtaL 122 2,249,941 12.96
panama pas manaGeD By tHe GoVeRnment 59 2,700,000 yes
muniCipal pas 17 8,000 yes
pas unDeR manaGement ConCessions 7 128,000 yes
tOtaL 83 2,836,000 19.05
CountRy netwoRks of pa suRfaCe % of tHe CountRy’s sCoReCaRD
pRoteCteD aReas amount (Has) total suRfaCe1 applieD (yes/no)
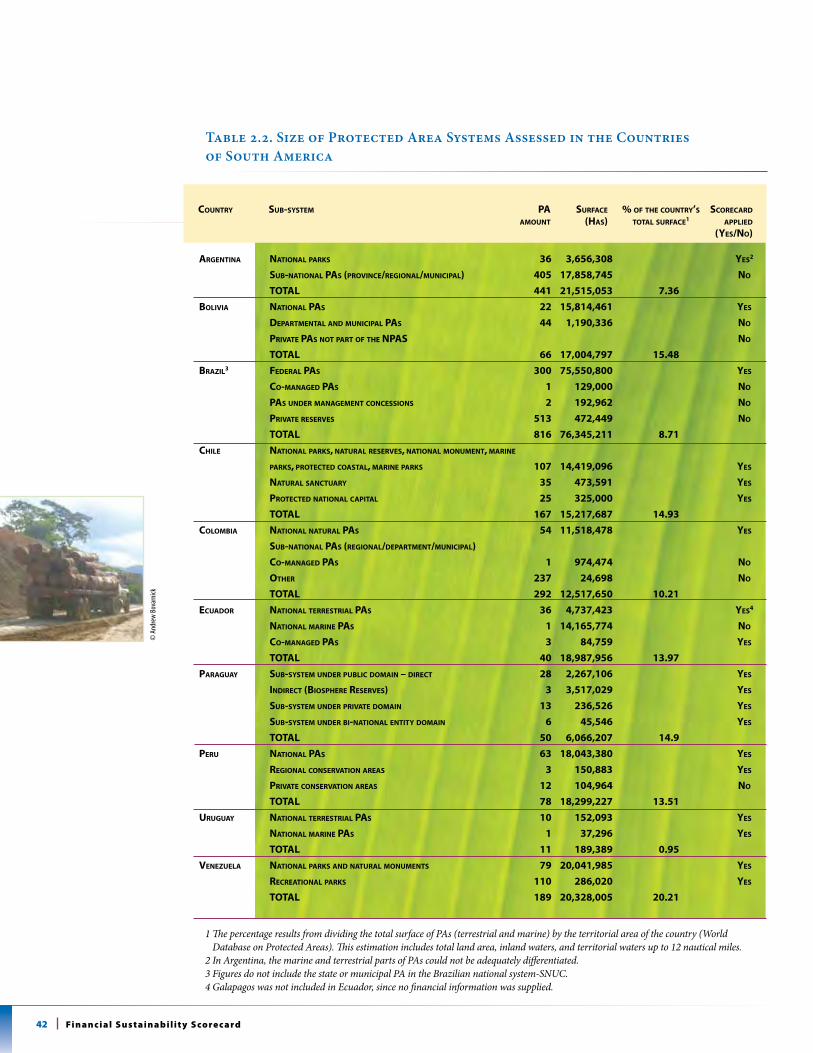
42 Fi n a n c i a l s u s t a i n a b i l i t y s co re c a rd
Table 2.2. Size of Protected Area Systems Assessed in the Countries of South America
aRGentina national paRks 36 3,656,308 yes2
suB-national pas (pRoVinCe/ReGional/muniCipal) 405 17,858,745 no
tOtaL 441 21,515,053 7.36
BoliVia national pas 22 15,814,461 yes
DepaRtmental anD muniCipal pas 44 1,190,336 no
pRiVate pas not paRt of tHe npas no
tOtaL 66 17,004,797 15.48
BRazil3 feDeRal pas 300 75,550,800 yes
Co-manaGeD pas 1 129,000 no
pas unDeR manaGement ConCessions 2 192,962 no
pRiVate ReseRVes 513 472,449 no
tOtaL 816 76,345,211 8.71
CHile national paRks, natuRal ReseRVes, national monument, maRine
paRks, pRoteCteD Coastal, maRine paRks 107 14,419,096 yes
natuRal sanCtuaRy 35 473,591 yes
pRoteCteD national Capital 25 325,000 yes
tOtaL 167 15,217,687 14.93
ColomBia national natuRal pas 54 11,518,478 yes
suB-national pas (ReGional/DepaRtment/muniCipal)
Co-manaGeD pas 1 974,474 no
otHeR 237 24,698 no
tOtaL 292 12,517,650 10.21
eCuaDoR national teRRestRial pas 36 4,737,423 yes4
national maRine pas 1 14,165,774 no
Co-manaGeD pas 3 84,759 yes
tOtaL 40 18,987,956 13.97
paRaGuay suB-system unDeR puBliC Domain – DiReCt 28 2,267,106 yes
inDiReCt (BiospHeRe ReseRVes) 3 3,517,029 yes
suB-system unDeR pRiVate Domain 13 236,526 yes
suB-system unDeR Bi-national entity Domain 6 45,546 yes
tOtaL 50 6,066,207 14.9
peRu national pas 63 18,043,380 yes
ReGional ConseRVation aReas 3 150,883 yes
pRiVate ConseRVation aReas 12 104,964 no
tOtaL 78 18,299,227 13.51
uRuGuay national teRRestRial pas 10 152,093 yes
national maRine pas 1 37,296 yes
tOtaL 11 189,389 0.95
Venezuela national paRks anD natuRal monuments 79 20,041,985 yes
ReCReational paRks 110 286,020 yes
tOtaL 189 20,328,005 20.21
1 The percentage results from dividing the total surface of PAs (terrestrial and marine) by the territorial area of the country (World Database on Protected Areas). This estimation includes total land area, inland waters, and territorial waters up to 12 nautical miles.
2 In Argentina, the marine and terrestrial parts of PAs could not be adequately differentiated.3 Figures do not include the state or municipal PA in the Brazilian national system-SNUC.4 Galapagos was not included in Ecuador, since no financial information was supplied.
CountRy suB-system pa suRfaCe % of tHe CountRy’s sCoReCaRD
amount (Has) total suRfaCe1 applieD (yes/no)
© a
ndre
w Bo
varn
ick
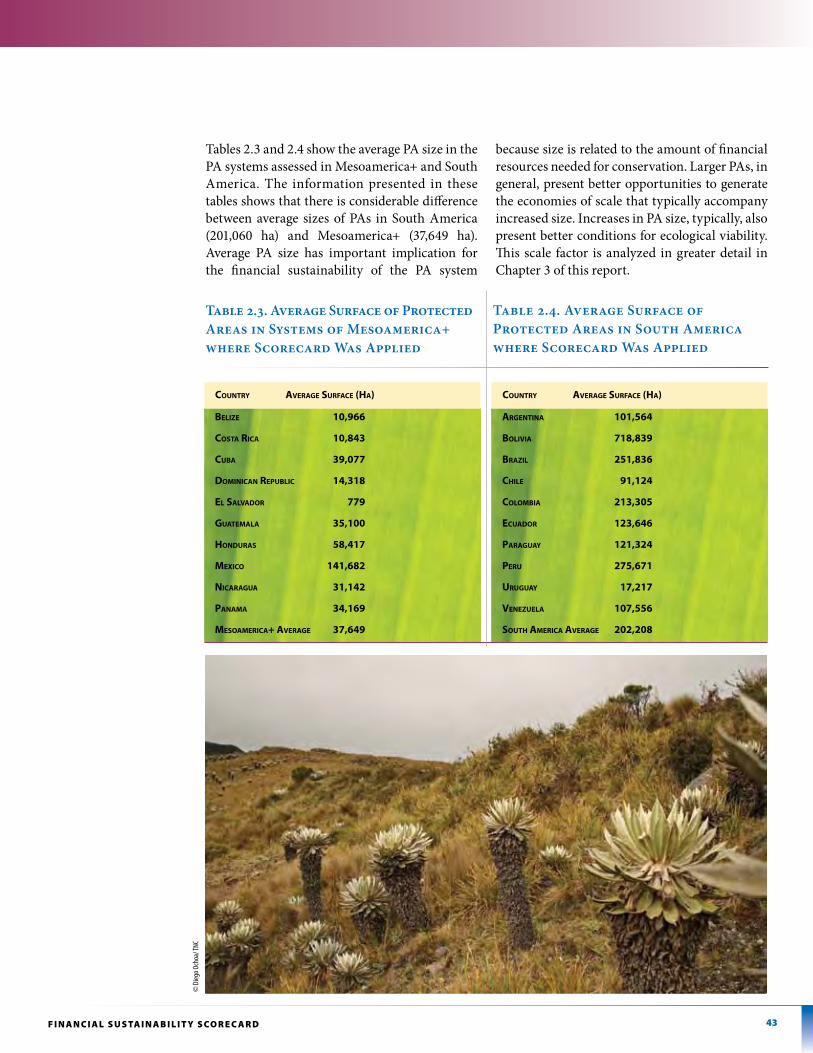
43F i n A n C i A l s u s TA i n A b i l i T y s Co R E C A R d
Tables 2.3 and 2.4 show the average PA size in the PA systems assessed in Mesoamerica+ and South America. The information presented in these tables shows that there is considerable difference between average sizes of PAs in South America (201,060 ha) and Mesoamerica+ (37,649 ha). Average PA size has important implication for the financial sustainability of the PA system
because size is related to the amount of financial resources needed for conservation. Larger PAs, in general, present better opportunities to generate the economies of scale that typically accompany increased size. Increases in PA size, typically, also present better conditions for ecological viability. This scale factor is analyzed in greater detail in Chapter 3 of this report.
Table 2.3. Average Surface of Protected Areas in Systems of Mesoamerica+ where Scorecard Was Applied
Table 2.4. Average Surface of Protected Areas in South America where Scorecard Was Applied
Belize 10,966
Costa RiCa 10,843
CuBa 39,077
DominiCan RepuBliC 14,318
el salVaDoR 779
Guatemala 35,100
HonDuRas 58,417
mexiCo 141,682
niCaRaGua 31,142
panama 34,169
mesoameRiCa+ aVeRaGe 37,649
CountRy aVeRaGe suRfaCe (Ha)
aRGentina 101,564
BoliVia 718,839
BRazil 251,836
CHile 91,124
ColomBia 213,305
eCuaDoR 123,646
paRaGuay 121,324
peRu 275,671
uRuGuay 17,217
Venezuela 107,556
soutH ameRiCa aVeRaGe 202,208
CountRy aVeRaGe suRfaCe (Ha)
© d
iego o
choa
/ tnc
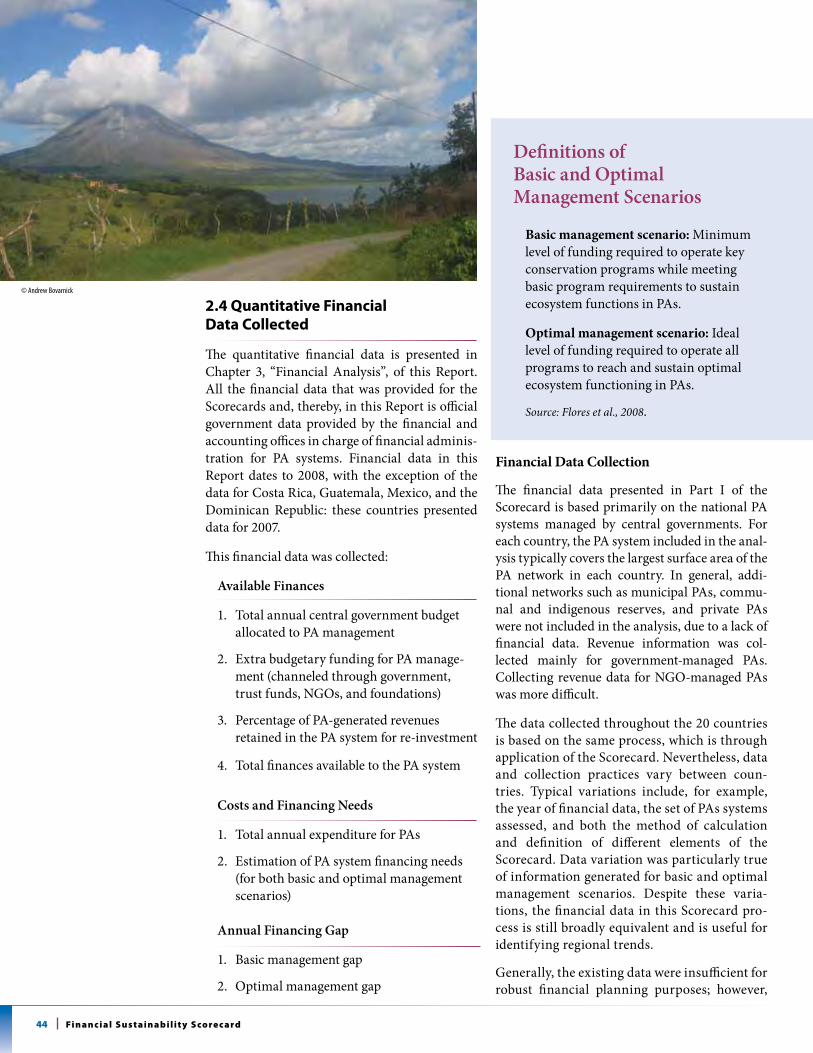
44 Fi n a n c i a l s u s t a i n a b i l i t y s co re c a rd
2.4 Quantitative Financial data Collected
The quantitative financial data is presented in Chapter 3, “Financial Analysis”, of this Report. All the financial data that was provided for the Scorecards and, thereby, in this Report is official government data provided by the financial and accounting offices in charge of financial adminis-tration for PA systems. Financial data in this Report dates to 2008, with the exception of the data for Costa Rica, Guatemala, Mexico, and the Dominican Republic: these countries presented data for 2007.
This financial data was collected:
Available Finances
1. Total annual central government budget allocated to PA management
2. Extra budgetary funding for PA manage-ment (channeled through government, trust funds, NGOs, and foundations)
3. Percentage of PA-generated revenues retained in the PA system for re-investment
4. Total finances available to the PA system
Costs and Financing Needs
1. Total annual expenditure for PAs
2. Estimation of PA system financing needs (for both basic and optimal management scenarios)
Annual Financing Gap
1. Basic management gap
2. Optimal management gap
Definitions of Basic and Optimal Management Scenarios
Basic management scenario: Minimum level of funding required to operate key conservation programs while meeting basic program requirements to sustain ecosystem functions in PAs.
Optimal management scenario: Ideal level of funding required to operate all programs to reach and sustain optimal ecosystem functioning in PAs.
Source: Flores et al., 2008.
Financial Data Collection
The financial data presented in Part I of the Scorecard is based primarily on the national PA systems managed by central governments. For each country, the PA system included in the anal-ysis typically covers the largest surface area of the PA network in each country. In general, addi-tional networks such as municipal PAs, commu-nal and indigenous reserves, and private PAs were not included in the analysis, due to a lack of financial data. Revenue information was col-lected mainly for government-managed PAs. Collecting revenue data for NGO-managed PAs was more difficult.
The data collected throughout the 20 countries is based on the same process, which is through application of the Scorecard. Nevertheless, data and collection practices vary between coun-tries. Typical variations include, for example, the year of financial data, the set of PAs systems assessed, and both the method of calculation and definition of different elements of the Scorecard. Data variation was particularly true of information generated for basic and optimal management scenarios. Despite these varia-tions, the financial data in this Scorecard pro-cess is still broadly equivalent and is useful for identifying regional trends.
Generally, the existing data were insufficient for robust financial planning purposes; however,
© andrew Bovarnick
identifying these information gaps holds huge policy value. For example, this Scorecard analy-sis reveals specific data gaps existing with regard to PA costs, extra-budgetary funds, and financial needs.
•Sounddatagenerally exists forgovernmentbudgets and expenditures. Total annual gov-ernment budget information is available for PAs at the site and system levels, through official channels. This information can be tracked on an annual basis. There are excep-tions; for example, Ecuador maintains detailed site-level data (due to a decentral-ized system) but does not have financial data aggregated at a system level. For different reasons, Chile and the Dominican Republic
have incomplete PA site-level expenditure data.
•The weakest area of data in terms of quality and availability of infor-mation appears in sys-tem-level financial gaps. Less than half of coun-tries had undertaken a national process to iden-tify the financial needs and gaps of their PA systems. Most of these countries needed assess-
ments; where countries had assessments, these documents needed revision or updat-ing. The rest of the countries either did not have information on the financial needs of their PA systems or presented preliminary estimates that do not support a detailed financial needs analysis.
In some cases, financial data exists but is not available to the public and, likewise, is often not available to decision makers. This problem of elusive data makes it difficult to generate and present overall system-level financial data. The several situations that drive limited data avail-ability for sites and systems pose a grave problem: Ministries of Finance — and other stakeholders — do not know the extent to which PA systems are underfunded.
Box 2.1. Observation from Stakeholder Workshops
During the workshop process, several Ministries of Finance in the region, including that of Paraguay, stated that with improved data on financial gaps and revenue generation, like the ele-ments presented in the Scorecard, they would be able and willing to consider increasing annual budget allocations to PA systems. This situation is likely to be the case for a majority of countries in the region. Therefore, a priority for the region and for donors is to generate and provide this information to Ministries of Finance.
Table 2.5 shows the main information gaps in each country. Reasons for the limited nature of financial data include the following:
• Untilrecently,manycountrieshavenotdevel-oped comprehensive financial information systems. The predominance of science back-grounds for most PA staff members and the ongoing lack of specialized human resources in finance at site and system levels might be a barrier to accurate PA financial information.
• Each PA system authority has its own datasets and does not share or aggregate them. Decentralization schemes might also have an effect in the availability of aggregate system-level data.
• Many PAs still do not have managementplans; thus, accurate PA management cost analysis and financial need assessments still cannot be undertaken, particularly at a sys-tem level.
• PAsystemauthoritiestendtohaveunderde-veloped accounting systems and supporting databases.
• Many PA costs are divided between minis-tries. For example, staff salaries are often paid
45F i n A n C i A l s u s TA i n A b i l i T y s Co R E C A R d
© andy drumm/tnc
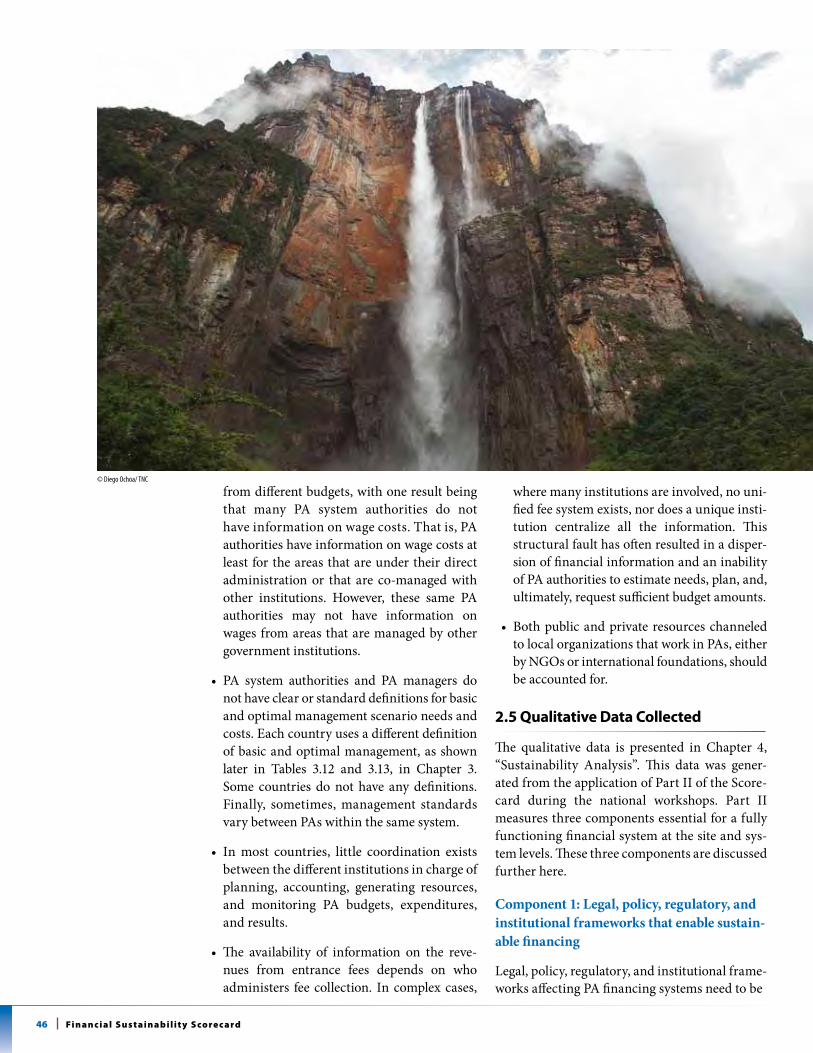
46 Fi n a n c i a l s u s t a i n a b i l i t y s co re c a rd
from different budgets, with one result being that many PA system authorities do not have information on wage costs. That is, PA authorities have information on wage costs at least for the areas that are under their direct administration or that are co-managed with other institutions. However, these same PA authorities may not have information on wages from areas that are managed by other government institutions.
• PA system authorities and PAmanagers donot have clear or standard definitions for basic and optimal management scenario needs and costs. Each country uses a different definition of basic and optimal management, as shown later in Tables 3.12 and 3.13, in Chapter 3. Some countries do not have any definitions. Finally, sometimes, management standards vary between PAs within the same system.
• Inmost countries, little coordination existsbetween the different institutions in charge of planning, accounting, generating resources, and monitoring PA budgets, expenditures, and results.
• The availability of information on the reve-nues from entrance fees depends on who administers fee collection. In complex cases,
where many institutions are involved, no uni-fied fee system exists, nor does a unique insti-tution centralize all the information. This structural fault has often resulted in a disper-sion of financial information and an inability of PA authorities to estimate needs, plan, and, ultimately, request sufficient budget amounts.
• Bothpublicandprivateresourceschanneledto local organizations that work in PAs, either by NGOs or international foundations, should be accounted for.
2.5 Qualitative data Collected
The qualitative data is presented in Chapter 4, “Sustainability Analysis”. This data was gener-ated from the application of Part II of the Score-card during the national workshops. Part II measures three components essential for a fully functioning financial system at the site and sys-tem levels. These three components are discussed further here.
Component 1: Legal, policy, regulatory, and institutional frameworks that enable sustain-able financing
Legal, policy, regulatory, and institutional frame-works affecting PA financing systems need to be
© diego ochoa/ tnc
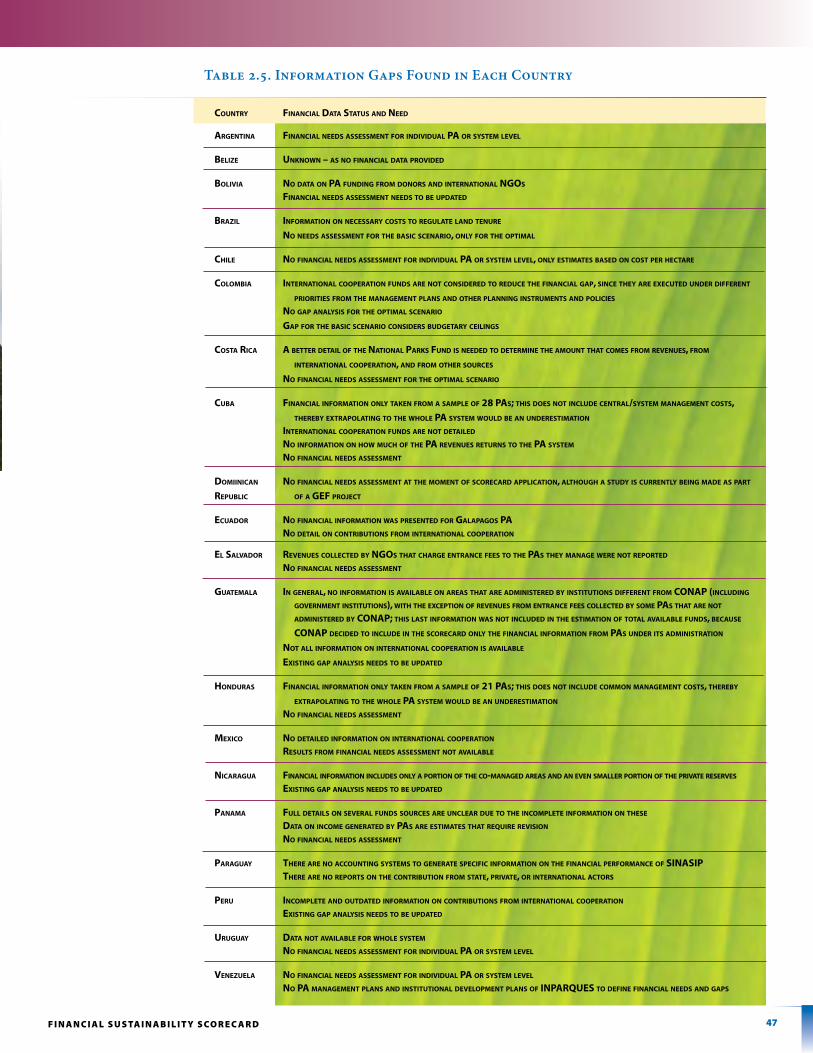
47F i n A n C i A l s u s TA i n A b i l i T y s Co R E C A R d
Table 2.5. Information Gaps Found in Each Country
CountRy finanCial Data status anD neeD
aRGentina finanCial neeDs assessment foR inDiViDual pa oR system leVel
Belize unknown – as no finanCial Data pRoViDeD
BoliVia no Data on pa funDinG fRom DonoRs anD inteRnational nGos finanCial neeDs assessment neeDs to Be upDateD
BRazil infoRmation on neCessaRy Costs to ReGulate lanD tenuRe
no neeDs assessment foR tHe BasiC sCenaRio, only foR tHe optimal
CHile no finanCial neeDs assessment foR inDiViDual pa oR system leVel, only estimates BaseD on Cost peR HeCtaRe
ColomBia inteRnational CoopeRation funDs aRe not ConsiDeReD to ReDuCe tHe finanCial Gap, sinCe tHey aRe exeCuteD unDeR DiffeRent
pRioRities fRom tHe manaGement plans anD otHeR planninG instRuments anD poliCies
no Gap analysis foR tHe optimal sCenaRio
Gap foR tHe BasiC sCenaRio ConsiDeRs BuDGetaRy CeilinGs
Costa RiCa a BetteR Detail of tHe national paRks funD is neeDeD to DeteRmine tHe amount tHat Comes fRom ReVenues, fRom
inteRnational CoopeRation, anD fRom otHeR souRCes
no finanCial neeDs assessment foR tHe optimal sCenaRio
CuBa finanCial infoRmation only taken fRom a sample of 28 pas; tHis Does not inCluDe CentRal/system manaGement Costs,
tHeReBy extRapolatinG to tHe wHole pa system woulD Be an unDeRestimation
inteRnational CoopeRation funDs aRe not DetaileD no infoRmation on How muCH of tHe pa ReVenues RetuRns to tHe pa system
no finanCial neeDs assessment
DomiiniCan no finanCial neeDs assessment at tHe moment of sCoReCaRD appliCation, altHouGH a stuDy is CuRRently BeinG maDe as paRt
RepuBliC of a Gef pRojeCt
eCuaDoR no finanCial infoRmation was pResenteD foR GalapaGos pa no Detail on ContRiButions fRom inteRnational CoopeRation
el salVaDoR ReVenues ColleCteD By nGos tHat CHaRGe entRanCe fees to tHe pas tHey manaGe weRe not RepoRteD
no finanCial neeDs assessment
Guatemala in GeneRal, no infoRmation is aVailaBle on aReas tHat aRe aDministeReD By institutions DiffeRent fRom Conap (inCluDinG GoVeRnment institutions), witH tHe exCeption of ReVenues fRom entRanCe fees ColleCteD By some pas tHat aRe not aDministeReD By Conap; tHis last infoRmation was not inCluDeD in tHe estimation of total aVailaBle funDs, BeCause
Conap DeCiDeD to inCluDe in tHe sCoReCaRD only tHe finanCial infoRmation fRom pas unDeR its aDministRation
not all infoRmation on inteRnational CoopeRation is aVailaBle
existinG Gap analysis neeDs to Be upDateD
HonDuRas finanCial infoRmation only taken fRom a sample of 21 pas; tHis Does not inCluDe Common manaGement Costs, tHeReBy
extRapolatinG to tHe wHole pa system woulD Be an unDeRestimation
no finanCial neeDs assessment
mexiCo no DetaileD infoRmation on inteRnational CoopeRation
Results fRom finanCial neeDs assessment not aVailaBle
niCaRaGua finanCial infoRmation inCluDes only a poRtion of tHe Co-manaGeD aReas anD an eVen smalleR poRtion of tHe pRiVate ReseRVes
existinG Gap analysis neeDs to Be upDateD
panama full Details on seVeRal funDs souRCes aRe unCleaR Due to tHe inComplete infoRmation on tHese Data on inCome GeneRateD By pas aRe estimates tHat RequiRe ReVision
no finanCial neeDs assessment
paRaGuay tHeRe aRe no aCCountinG systems to GeneRate speCifiC infoRmation on tHe finanCial peRfoRmanCe of sinasip tHeRe aRe no RepoRts on tHe ContRiBution fRom state, pRiVate, oR inteRnational aCtoRs
peRu inComplete anD outDateD infoRmation on ContRiButions fRom inteRnational CoopeRation
existinG Gap analysis neeDs to Be upDateD
uRuGuay Data not aVailaBle foR wHole system
no finanCial neeDs assessment foR inDiViDual pa oR system leVel
Venezuela no finanCial neeDs assessment foR inDiViDual pa oR system leVel
no pa manaGement plans anD institutional DeVelopment plans of inpaRques to Define finanCial neeDs anD Gaps
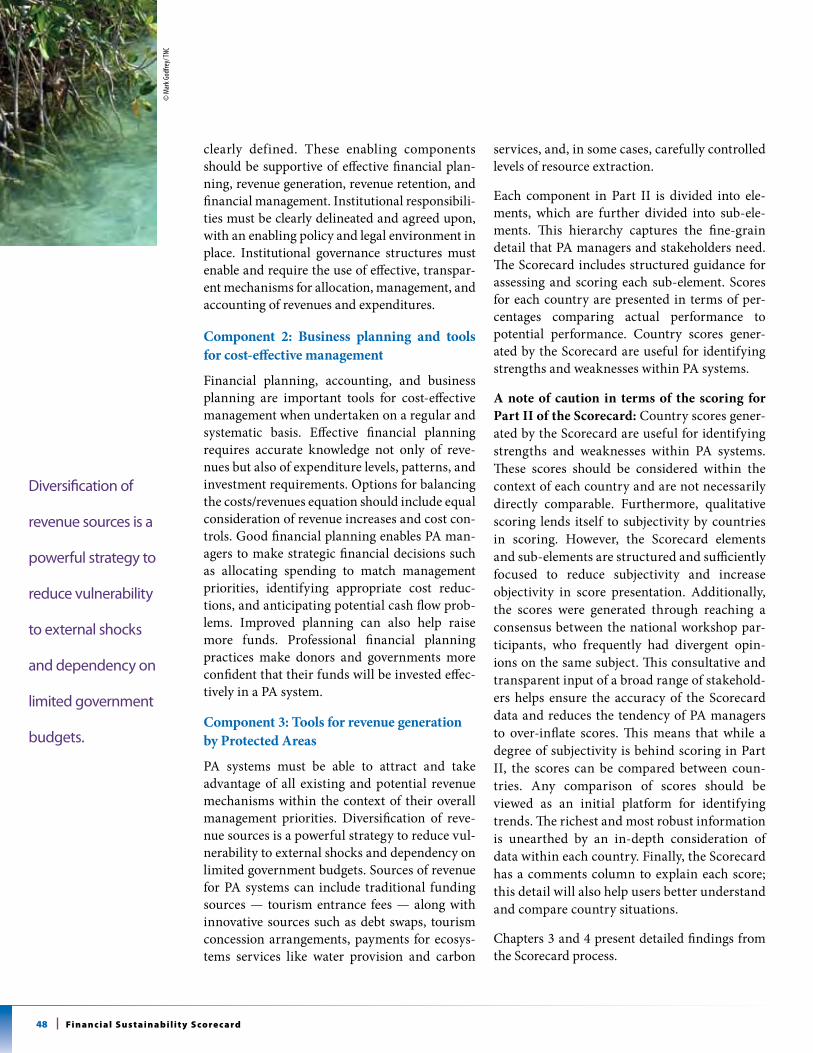
48 Fi n a n c i a l s u s t a i n a b i l i t y s co re c a rd
clearly defined. These enabling components should be supportive of effective financial plan-ning, revenue generation, revenue retention, and financial management. Institutional responsibili-ties must be clearly delineated and agreed upon, with an enabling policy and legal environment in place. Institutional governance structures must enable and require the use of effective, transpar-ent mechanisms for allocation, management, and accounting of revenues and expenditures.
Component 2: Business planning and tools for cost-effective management
Financial planning, accounting, and business planning are important tools for cost-effective management when undertaken on a regular and systematic basis. Effective financial planning requires accurate knowledge not only of reve-nues but also of expenditure levels, patterns, and investment requirements. Options for balancing the costs/revenues equation should include equal consideration of revenue increases and cost con-trols. Good financial planning enables PA man-agers to make strategic financial decisions such as allocating spending to match management priorities, identifying appropriate cost reduc-tions, and anticipating potential cash flow prob-lems. Improved planning can also help raise more funds. Professional financial planning practices make donors and governments more confident that their funds will be invested effec-tively in a PA system.
Component 3: Tools for revenue generation by Protected Areas
PA systems must be able to attract and take advantage of all existing and potential revenue mechanisms within the context of their overall management priorities. Diversification of reve-nue sources is a powerful strategy to reduce vul-nerability to external shocks and dependency on limited government budgets. Sources of revenue for PA systems can include traditional funding sources — tourism entrance fees — along with innovative sources such as debt swaps, tourism concession arrangements, payments for ecosys-tems services like water provision and carbon
services, and, in some cases, carefully controlled levels of resource extraction.
Each component in Part II is divided into ele-ments, which are further divided into sub-ele-ments. This hierarchy captures the fine-grain detail that PA managers and stakeholders need. The Scorecard includes structured guidance for assessing and scoring each sub-element. Scores for each country are presented in terms of per-centages comparing actual performance to potential performance. Country scores gener-ated by the Scorecard are useful for identifying strengths and weaknesses within PA systems.
A note of caution in terms of the scoring for Part II of the Scorecard: Country scores gener-ated by the Scorecard are useful for identifying strengths and weaknesses within PA systems. These scores should be considered within the context of each country and are not necessarily directly comparable. Furthermore, qualitative scoring lends itself to subjectivity by countries in scoring. However, the Scorecard elements and sub-elements are structured and sufficiently focused to reduce subjectivity and increase objectivity in score presentation. Additionally, the scores were generated through reaching a consensus between the national workshop par-ticipants, who frequently had divergent opin-ions on the same subject. This consultative and transparent input of a broad range of stakehold-ers helps ensure the accuracy of the Scorecard data and reduces the tendency of PA managers to over-inflate scores. This means that while a degree of subjectivity is behind scoring in Part II, the scores can be compared between coun-tries. Any comparison of scores should be viewed as an initial platform for identifying trends. The richest and most robust information is unearthed by an in-depth consideration of data within each country. Finally, the Scorecard has a comments column to explain each score; this detail will also help users better understand and compare country situations.
Chapters 3 and 4 present detailed findings from the Scorecard process.
© m
ark G
odfre
y/ tn
c
Diversification of
revenue sources is a
powerful strategy to
reduce vulnerability
to external shocks
and dependency on
limited government
budgets.
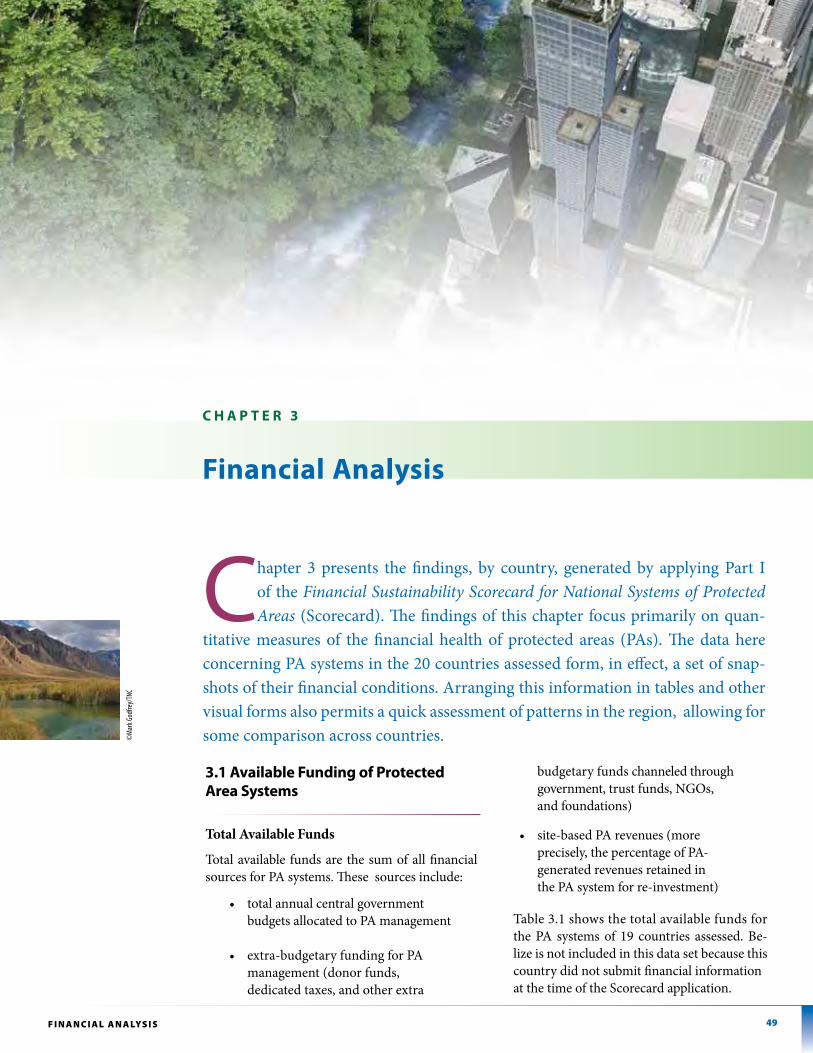
49F i n A n C i A l A n A lys i s
3.1 available Funding of protected area systems
Total Available Funds
Total available funds are the sum of all financial sources for PA systems. These sources include:
• totalannualcentralgovernmentbudgets allocated to PA management
• extra-budgetaryfundingforPA management (donor funds, dedicated taxes, and other extra
budgetary funds channeled through government, trust funds, NGOs, and foundations)
• site-basedPArevenues(moreprecisely, the percentage of PA- generated revenues retained in the PA system for re-investment)
Table 3.1 shows the total available funds for the PA systems of 19 countries assessed. Be-lize is not included in this data set because this country did not submit financial informationat the time of the Scorecard application.
C hapter 3 presents the findings, by country, generated by applying Part I of the Financial Sustainability Scorecard for National Systems of Protected Areas (Scorecard). The findings of this chapter focus primarily on quan-
titative measures of the financial health of protected areas (PAs). The data here concerning PA systems in the 20 countries assessed form, in effect, a set of snap-shots of their financial conditions. Arranging this information in tables and other visual forms also permits a quick assessment of patterns in the region, allowing for some comparison across countries.
C h a p t e r 3
Financial analysis
©m
ark G
odfre
y/tn
c
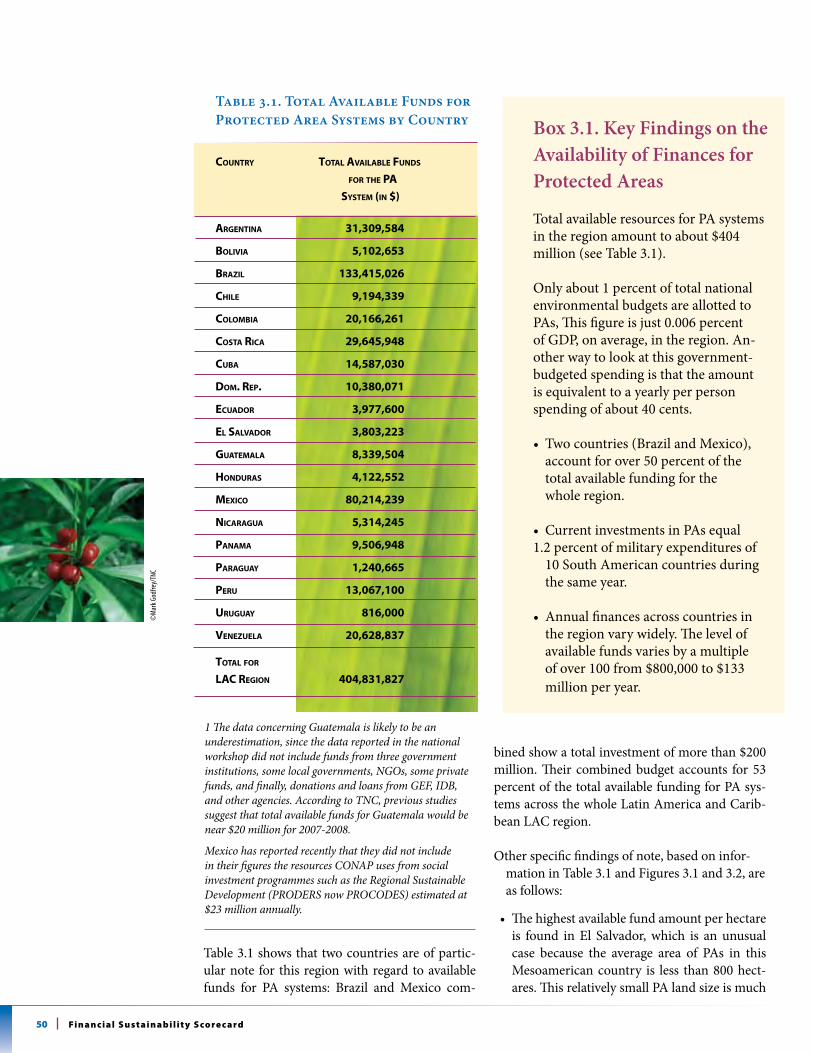
50 Fi n a n c i a l s u s t a i n a b i l i t y s co re c a rd
Table 3.1 shows that two countries are of partic-ular note for this region with regard to available funds for PA systems: Brazil and Mexico com-
bined show a total investment of more than $200 million. Their combined budget accounts for 53 percent of the total available funding for PA sys-tems across the whole Latin America and Carib-bean LAC region.
Other specific findings of note, based on infor-mation in Table 3.1 and Figures 3.1 and 3.2, are as follows:
• Thehighestavailablefundamountperhectareis found in El Salvador, which is an unusual case because the average area of PAs in this Mesoamerican country is less than 800 hect-ares. This relatively small PA land size is much
1 The data concerning Guatemala is likely to be an underestimation, since the data reported in the national workshop did not include funds from three government institutions, some local governments, NGOs, some private funds, and finally, donations and loans from GEF, IDB, and other agencies. According to TNC, previous studies suggest that total available funds for Guatemala would be near $20 million for 2007-2008.
Mexico has reported recently that they did not include in their figures the resources CONAP uses from social investment programmes such as the Regional Sustainable Development (PRODERS now PROCODES) estimated at $23 million annually.
©m
ark G
odfre
y/tn
c
Box 3.1. Key Findings on the Availability of Finances for Protected Areas
Total available resources for PA systems in the region amount to about $404 million (see Table 3.1).
Only about 1 percent of total national environmental budgets are allotted to PAs, This figure is just 0.006 percent of GDP, on average, in the region. An-other way to look at this government-budgeted spending is that the amount is equivalent to a yearly per person spending of about 40 cents.
• Twocountries(BrazilandMexico),account for over 50 percent of the total available funding for the
whole region.
• CurrentinvestmentsinPAsequal1.2 percent of military expenditures of
10 South American countries during the same year.
• Annualfinancesacrosscountriesinthe region vary widely. The level of available funds varies by a multiple
of over 100 from $800,000 to $133 million per year.
Table 3.1. Total Available Funds for Protected Area Systems by Country
country total available Funds For the Pa systeM (in $)
argentina 31,309,584
bolivia 5,102,653
brazil 133,415,026
chile 9,194,339
coloMbia 20,166,261
costa rica 29,645,948
cuba 14,587,030
doM. reP. 10,380,071
ecuador 3,977,600
el salvador 3,803,223
guateMala 8,339,504
honduras 4,122,552
Mexico 80,214,239
nicaragua 5,314,245
PanaMa 9,506,948
Paraguay 1,240,665
Peru 13,067,100
uruguay 816,000
venezuela 20,628,837
total For lac region 404,831,827
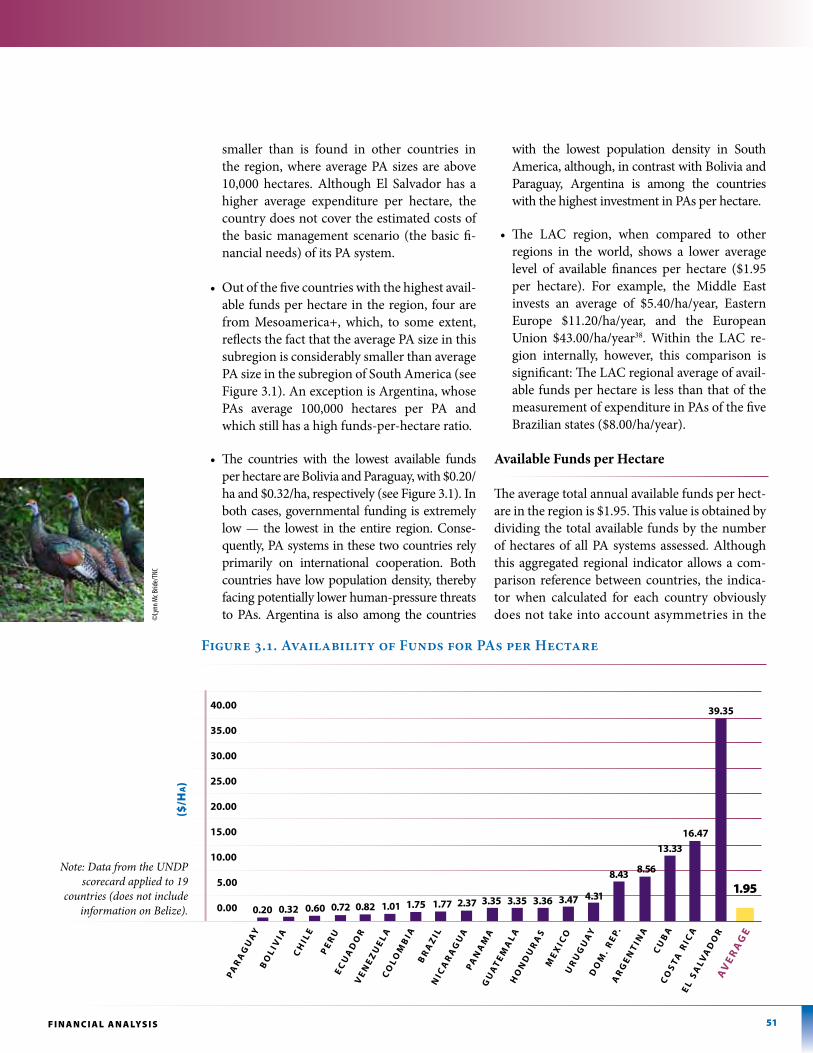
51F i n A n C i A l A n A lys i s
smaller than is found in other countries in the region, where average PA sizes are above 10,000 hectares. Although El Salvador has a higher average expenditure per hectare, the country does not cover the estimated costs of the basic management scenario (the basic fi-nancial needs) of its PA system.
• Outofthefivecountrieswiththehighestavail-able funds per hectare in the region, four are from Mesoamerica+, which, to some extent, reflects the fact that the average PA size in this subregion is considerably smaller than average PA size in the subregion of South America (see Figure 3.1). An exception is Argentina, whose PAs average 100,000 hectares per PA and which still has a high funds-per-hectare ratio.
• The countries with the lowest available fundsper hectare are Bolivia and Paraguay, with $0.20/ha and $0.32/ha, respectively (see Figure 3.1). In both cases, governmental funding is extremely low — the lowest in the entire region. Conse-quently, PA systems in these two countries rely primarily on international cooperation. Both countries have low population density, thereby facing potentially lower human-pressure threats to PAs. Argentina is also among the countries
with the lowest population density in South America, although, in contrast with Bolivia and Paraguay, Argentina is among the countries with the highest investment in PAs per hectare.
• The LAC region, when compared to otherregions in the world, shows a lower average level of available finances per hectare ($1.95 per hectare). For example, the Middle East invests an average of $5.40/ha/year, Eastern Europe $11.20/ha/year, and the European Union $43.00/ha/year38. Within the LAC re-gion internally, however, this comparison is significant: The LAC regional average of avail-able funds per hectare is less than that of the measurement of expenditure in PAs of the five Brazilian states ($8.00/ha/year).
Available Funds per Hectare
The average total annual available funds per hect-are in the region is $1.95. This value is obtained by dividing the total available funds by the number of hectares of all PA systems assessed. Although this aggregated regional indicator allows a com-parison reference between countries, the indica-tor when calculated for each country obviously does not take into account asymmetries in the
Figure 3.1. Availability of Funds for PAs per Hectare
40.00
35.00
30.00
25.00
20.00
15.00
10.00
5.00
0.00
1.95
39.35
16.47
0.20 0.32 0.60 0.72 0.82 1.01 1.75 1.77 2.37 3.35 3.35 3.36 3.47 4.31
8.43 8.56
13.33
pa
ra
GU
ay
BO
LI V
I a
Ch
I Le
pe
rU
eC
Ua
DO
r
CO
LOM
BIa
NI C
ar
aG
Ua
p
aN
aM
aG
Ua
te
Ma
La
h
ON
DU
ra
SM
ex
I CO
Ur
UG
Ua
y D
OM
. r
ep.
ar
Ge
Nt
INa
CU
Ba
CO
St
a r
I Ca
eL
Sa
LVa
DO
ra
Ve
ra
Ge
Br
az
I L
($/H
a)
Note: Data from the UNDP scorecard applied to 19
countries (does not include information on Belize).
Ve
Ne
zU
eL
a
©ly
nn m
c Brid
e/tn
c
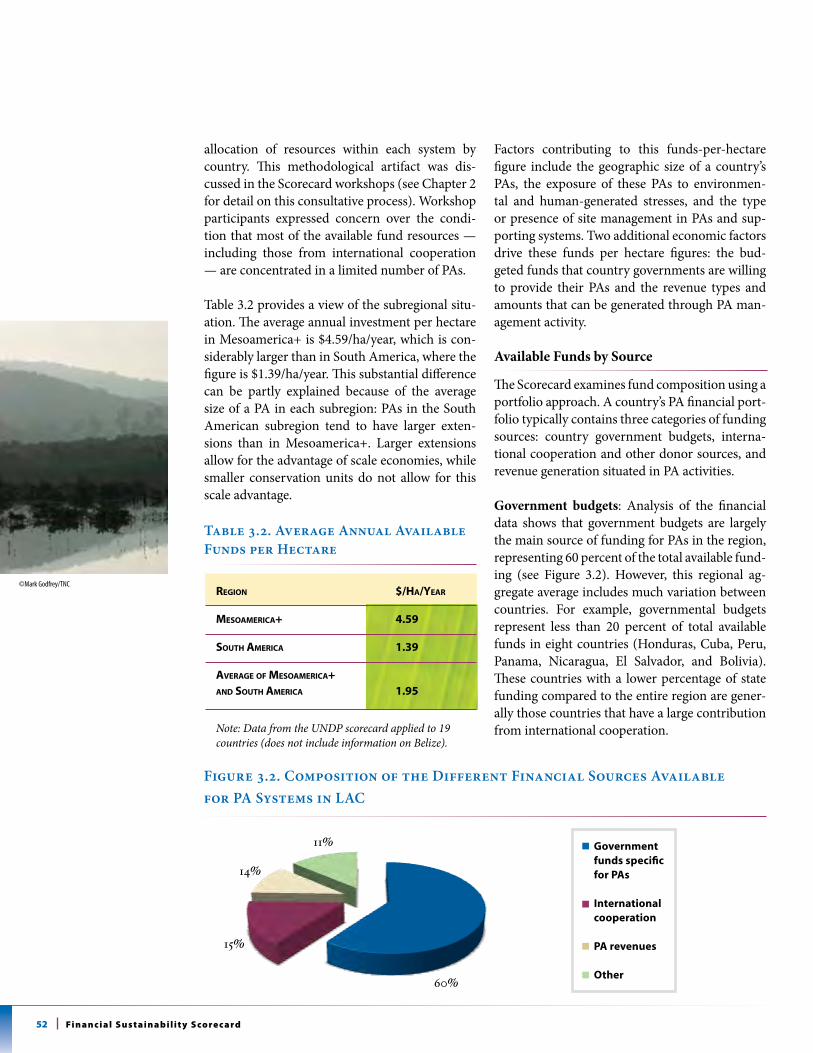
52 Fi n a n c i a l s u s t a i n a b i l i t y s co re c a rd
allocation of resources within each system by country. This methodological artifact was dis-cussed in the Scorecard workshops (see Chapter 2 for detail on this consultative process). Workshop participants expressed concern over the condi-tion that most of the available fund resources — including those from international cooperation — are concentrated in a limited number of PAs.
Table 3.2 provides a view of the subregional situ-ation. The average annual investment per hectare in Mesoamerica+ is $4.59/ha/year, which is con-siderably larger than in South America, where the figure is $1.39/ha/year. This substantial difference can be partly explained because of the average size of a PA in each subregion: PAs in the South American subregion tend to have larger exten-sions than in Mesoamerica+. Larger extensions allow for the advantage of scale economies, while smaller conservation units do not allow for this scale advantage.
Table 3.2. Average Annual Available Funds per Hectare
region $/ha/year
MesoaMerica+ 4.59
south aMerica 1.39
average oF MesoaMerica+ and south aMerica 1.95
Note: Data from the UNDP scorecard applied to 19 countries (does not include information on Belize).
Factors contributing to this funds-per-hectare figure include the geographic size of a country’s PAs, the exposure of these PAs to environmen-tal and human-generated stresses, and the type or presence of site management in PAs and sup-porting systems. Two additional economic factors drive these funds per hectare figures: the bud-geted funds that country governments are willing to provide their PAs and the revenue types and amounts that can be generated through PA man-agement activity. Available Funds by Source
The Scorecard examines fund composition using a portfolio approach. A country’s PA financial port-folio typically contains three categories of funding sources: country government budgets, interna-tional cooperation and other donor sources, and revenue generation situated in PA activities.
Government budgets: Analysis of the financial data shows that government budgets are largely the main source of funding for PAs in the region, representing 60 percent of the total available fund-ing (see Figure 3.2). However, this regional ag-gregate average includes much variation between countries. For example, governmental budgets represent less than 20 percent of total available funds in eight countries (Honduras, Cuba, Peru, Panama, Nicaragua, El Salvador, and Bolivia). These countries with a lower percentage of state funding compared to the entire region are gener-ally those countries that have a large contribution from international cooperation.
Figure 3.2. Composition of the Different Financial Sources Available for PA Systems in LAC
Government funds specific for pas
International cooperation
pa revenues
Other
©mark Godfrey/tnc
11%
14%
15%
60%
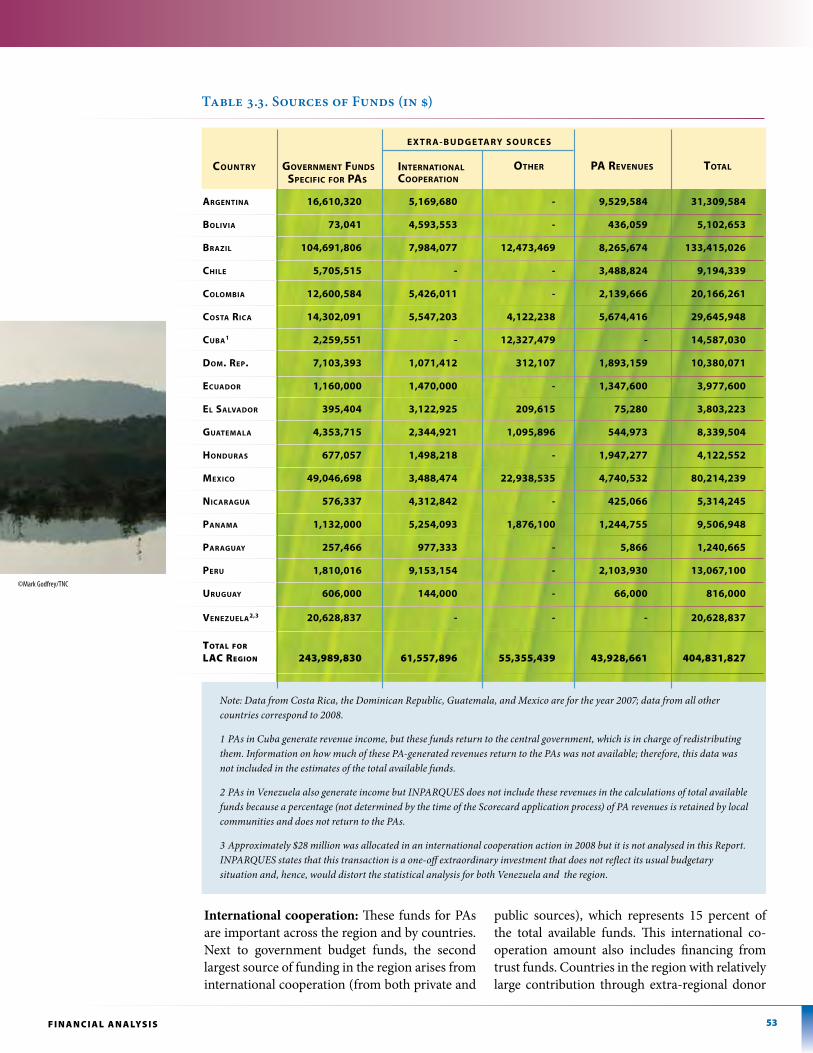
53F i n A n C i A l A n A lys i s
International cooperation: These funds for PAs are important across the region and by countries. Next to government budget funds, the second largest source of funding in the region arises from international cooperation (from both private and
public sources), which represents 15 percent of the total available funds. This international co-operation amount also includes financing from trust funds. Countries in the region with relatively large contribution through extra-regional donor
Note: Data from Costa Rica, the Dominican Republic, Guatemala, and Mexico are for the year 2007; data from all other countries correspond to 2008.
1 PAs in Cuba generate revenue income, but these funds return to the central government, which is in charge of redistributing them. Information on how much of these PA-generated revenues return to the PAs was not available; therefore, this data was not included in the estimates of the total available funds.
2 PAs in Venezuela also generate income but INPARQUES does not include these revenues in the calculations of total available funds because a percentage (not determined by the time of the Scorecard application process) of PA revenues is retained by local communities and does not return to the PAs.
3 Approximately $28 million was allocated in an international cooperation action in 2008 but it is not analysed in this Report. INPARQUES states that this transaction is a one-off extraordinary investment that does not reflect its usual budgetary situation and, hence, would distort the statistical analysis for both Venezuela and the region.
argentina 16,610,320 5,169,680 - 9,529,584 31,309,584
bolivia 73,041 4,593,553 - 436,059 5,102,653
brazil 104,691,806 7,984,077 12,473,469 8,265,674 133,415,026
chile 5,705,515 - - 3,488,824 9,194,339
coloMbia 12,600,584 5,426,011 - 2,139,666 20,166,261
costa rica 14,302,091 5,547,203 4,122,238 5,674,416 29,645,948
cuba1 2,259,551 - 12,327,479 - 14,587,030
doM. reP. 7,103,393 1,071,412 312,107 1,893,159 10,380,071
ecuador 1,160,000 1,470,000 - 1,347,600 3,977,600
el salvador 395,404 3,122,925 209,615 75,280 3,803,223
guateMala 4,353,715 2,344,921 1,095,896 544,973 8,339,504
honduras 677,057 1,498,218 - 1,947,277 4,122,552
mexiCo 49,046,698 3,488,474 22,938,535 4,740,532 80,214,239
nicaragua 576,337 4,312,842 - 425,066 5,314,245
PanaMa 1,132,000 5,254,093 1,876,100 1,244,755 9,506,948
Paraguay 257,466 977,333 - 5,866 1,240,665
Peru 1,810,016 9,153,154 - 2,103,930 13,067,100
uruguay 606,000 144,000 - 66,000 816,000
venezuela2,3 20,628,837 - - - 20,628,837
ToTal for laC region 243,989,830 61,557,896 55,355,439 43,928,661 404,831,827
CountRy GoVeRnment funDs speCifiC foR pas
otHeR pa ReVenuesinteRnational
CoopeRation
e x t r a - B U D G e ta ry S O U r C e S
Table 3.3. Sources of Funds (in $)
total
©mark Godfrey/tnc
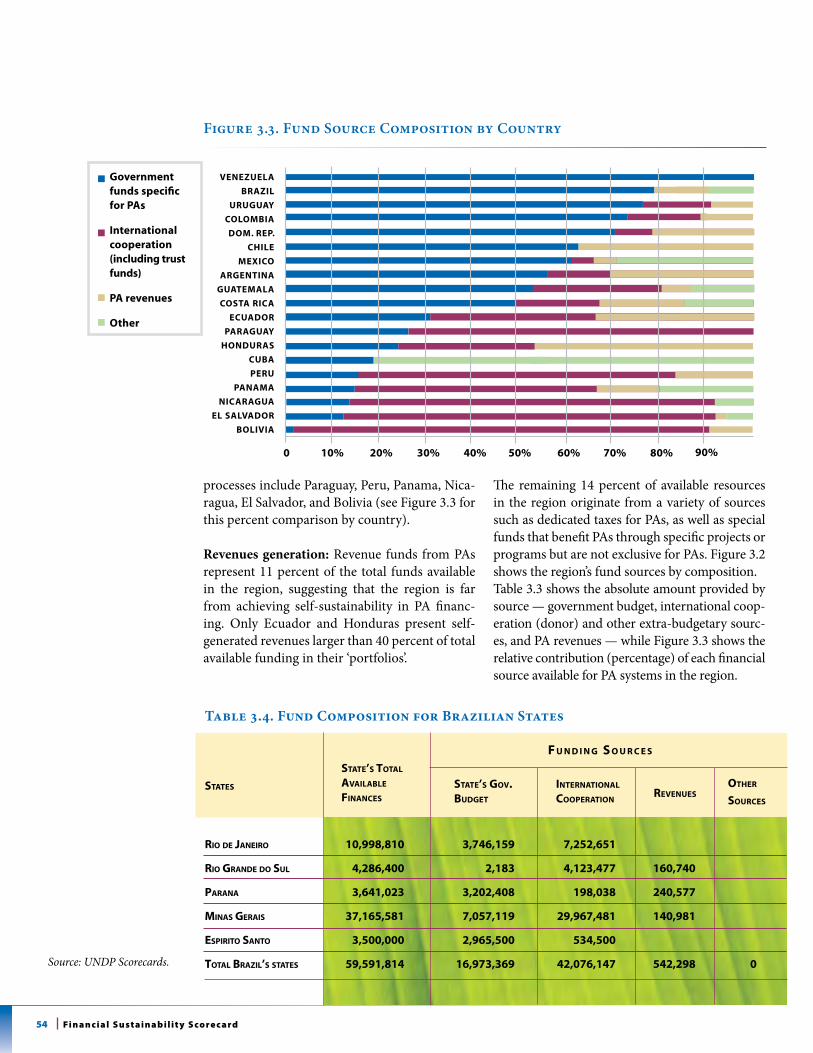
54 Fi n a n c i a l s u s t a i n a b i l i t y s co re c a rd
processes include Paraguay, Peru, Panama, Nica-ragua, El Salvador, and Bolivia (see Figure 3.3 for this percent comparison by country).
Revenues generation: Revenue funds from PAs represent 11 percent of the total funds available in the region, suggesting that the region is far from achieving self-sustainability in PA financ-ing. Only Ecuador and Honduras present self-generated revenues larger than 40 percent of total available funding in their ‘portfolios’.
The remaining 14 percent of available resources in the region originate from a variety of sources such as dedicated taxes for PAs, as well as special funds that benefit PAs through specific projects or programs but are not exclusive for PAs. Figure 3.2 shows the region’s fund sources by composition.Table 3.3 shows the absolute amount provided by source — government budget, international coop-eration (donor) and other extra-budgetary sourc-es, and PA revenues — while Figure 3.3 shows the relative contribution (percentage) of each financial source available for PA systems in the region.
Figure 3.3. Fund Source Composition by Country
VeNezUeLa
BrazIL
UrUGUay
COLOMBIa
DOM. rep.
ChILe
MexICO
arGeNtINa
GUateMaLa
COSta rICa
eCUaDOr
paraGUay
hONDUraS
CUBa
perU
paNaMa
NICaraGUa
eL SaLVaDOr
BOLIVIa
0 20% 40% 60% 80%
Government funds specific for pas
International cooperation (including trust funds)
pa revenues
Other
10% 30% 50% 70% 90%
Table 3.4. Fund Composition for Brazilian States
states
rio de Janeiro 10,998,810 3,746,159 7,252,651
rio grande do sul 4,286,400 2,183 4,123,477 160,740
Parana 3,641,023 3,202,408 198,038 240,577
Minas gerais 37,165,581 7,057,119 29,967,481 140,981
esPirito santo 3,500,000 2,965,500 534,500
total brazil’s states 59,591,814 16,973,369 42,076,147 542,298 0
state’s total available Finances
state’s gov.budget
international cooPeration
other sources
F u n d i n g s o u r c e s
revenues
Source: UNDP Scorecards.
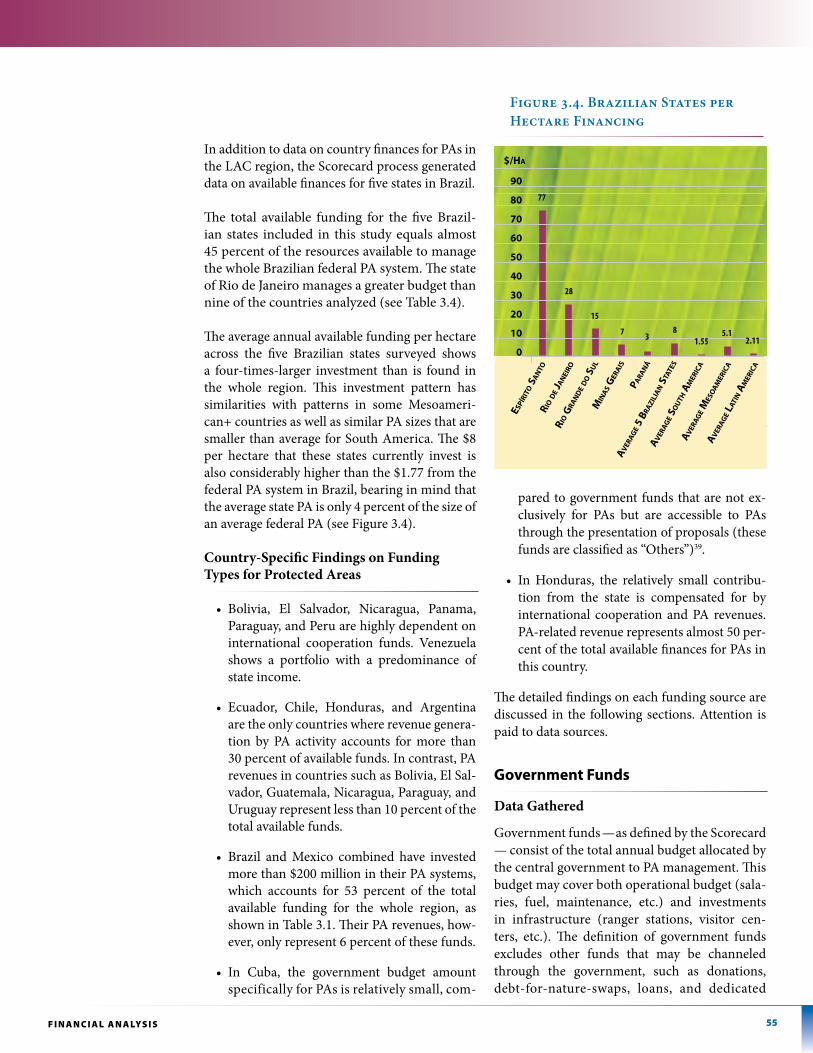
55F i n A n C i A l A n A lys i s
In addition to data on country finances for PAs in the LAC region, the Scorecard process generated data on available finances for five states in Brazil.
The total available funding for the five Brazil-ian states included in this study equals almost 45 percent of the resources available to manage the whole Brazilian federal PA system. The state of Rio de Janeiro manages a greater budget than nine of the countries analyzed (see Table 3.4).
The average annual available funding per hectare across the five Brazilian states surveyed shows a four-times-larger investment than is found in the whole region. This investment pattern has similarities with patterns in some Mesoameri-can+ countries as well as similar PA sizes that are smaller than average for South America. The $8 per hectare that these states currently invest is also considerably higher than the $1.77 from the federal PA system in Brazil, bearing in mind that the average state PA is only 4 percent of the size of an average federal PA (see Figure 3.4).
Country-Specific Findings on Funding Types for Protected Areas
• Bolivia, El Salvador, Nicaragua, Panama,Paraguay, and Peru are highly dependent on international cooperation funds. Venezuela shows a portfolio with a predominance of state income.
• Ecuador, Chile, Honduras, and Argentinaare the only countries where revenue genera-tion by PA activity accounts for more than 30 percent of available funds. In contrast, PA revenues in countries such as Bolivia, El Sal-vador, Guatemala, Nicaragua, Paraguay, and Uruguay represent less than 10 percent of the total available funds.
• Brazil andMexico combined have investedmore than $200 million in their PA systems, which accounts for 53 percent of the total available funding for the whole region, as shown in Table 3.1. Their PA revenues, how-ever, only represent 6 percent of these funds.
• In Cuba, the government budget amountspecifically for PAs is relatively small, com-
pared to government funds that are not ex-clusively for PAs but are accessible to PAs through the presentation of proposals (these funds are classified as “Others”)39.
• InHonduras, the relatively small contribu-tion from the state is compensated for by international cooperation and PA revenues. PA-related revenue represents almost 50 per-cent of the total available finances for PAs in this country.
The detailed findings on each funding source are discussed in the following sections. Attention is paid to data sources.
government Funds
Data Gathered
Government funds — as defined by the Scorecard — consist of the total annual budget allocated by the central government to PA management. This budget may cover both operational budget (sala-ries, fuel, maintenance, etc.) and investments in infrastructure (ranger stations, visitor cen-ters, etc.). The definition of government funds excludes other funds that may be channeled through the government, such as donations, debt-for-nature-swaps, loans, and dedicated
Figure 3.4. Brazilian States per Hectare Financing
90
80
70
60
50
40
30
20
10
0
espíR
ito
sa
nto
Rio D
e ja
nei
Ro
Rio G
Ran
De D
o s
ul
min
as G
eRa
is
paRa
ná
aV
eRaG
e 5 B
Razi
lia
n s
tate
s
aV
eRaG
e so
utH
am
eRiC
a
aV
eRaG
e mes
oa
meR
iCa
aV
eRaG
e lat
in a
meR
iCa
$/Ha
77
28
15
7 8 5.13 1.55 2.11
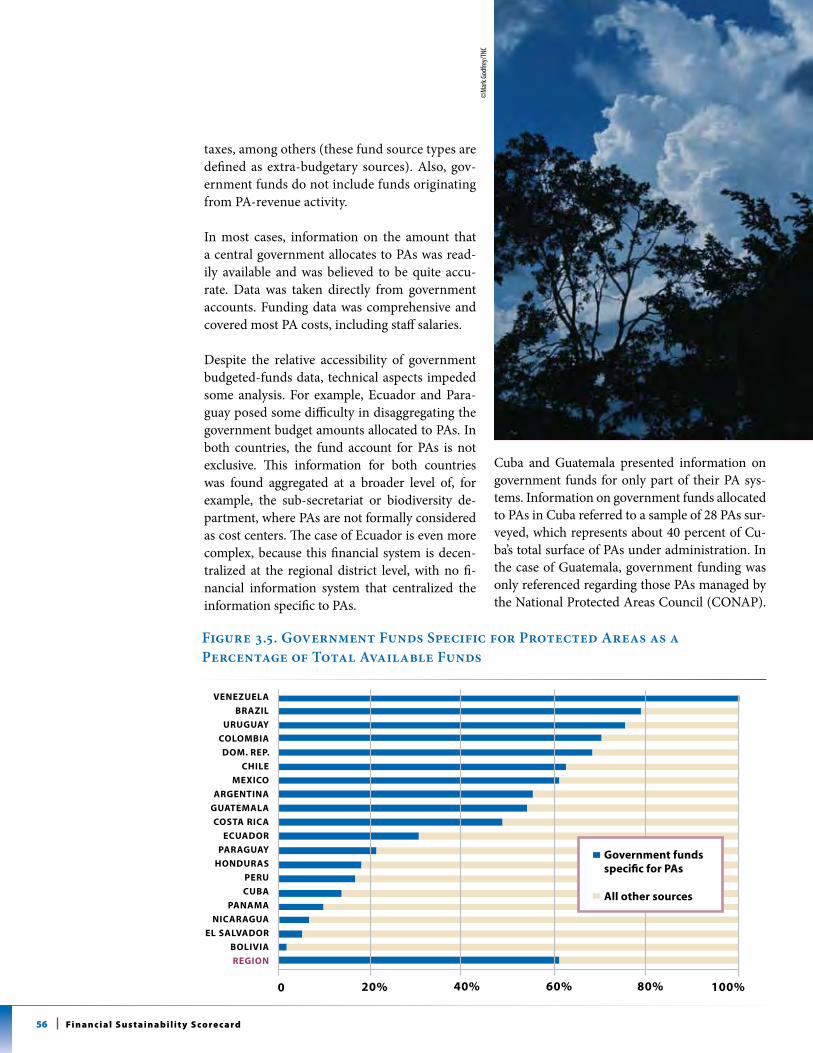
56 Fi n a n c i a l s u s t a i n a b i l i t y s co re c a rd
taxes, among others (these fund source types are defined as extra-budgetary sources). Also, gov-ernment funds do not include funds originating from PA-revenue activity.
In most cases, information on the amount that a central government allocates to PAs was read-ily available and was believed to be quite accu-rate. Data was taken directly from government accounts. Funding data was comprehensive and covered most PA costs, including staff salaries.
Despite the relative accessibility of government budgeted-funds data, technical aspects impeded some analysis. For example, Ecuador and Para-guay posed some difficulty in disaggregating the government budget amounts allocated to PAs. In both countries, the fund account for PAs is not exclusive. This information for both countries was found aggregated at a broader level of, for example, the sub-secretariat or biodiversity de-partment, where PAs are not formally considered as cost centers. The case of Ecuador is even more complex, because this financial system is decen-tralized at the regional district level, with no fi-nancial information system that centralized the information specific to PAs.
Cuba and Guatemala presented information on government funds for only part of their PA sys-tems. Information on government funds allocated to PAs in Cuba referred to a sample of 28 PAs sur-veyed, which represents about 40 percent of Cu-ba’s total surface of PAs under administration. In the case of Guatemala, government funding was only referenced regarding those PAs managed by the National Protected Areas Council (CONAP).
Figure 3.5. Government Funds Specific for Protected Areas as a Percentage of Total Available Funds
VeNezUeLa
BrazIL
UrUGUay
COLOMBIa
DOM. rep.
ChILe
MexICO
arGeNtINa
GUateMaLa
COSta rICa
eCUaDOr
paraGUay
hONDUraS
perU
CUBa
paNaMa
NICaraGUa
eL SaLVaDOr
BOLIVIa
reGION
0 20% 40% 60% 80% 100%
Government funds specific for pas
all other sources
©m
ark G
odfre
y/tn
c
57F i n A n C i A l A n A lys i s
Financial information on PAs managed by other gov-ernment institutions (such as the Forests National Insti-tute, the General Directorate of Cultural and National Heritage, San Carlos National University, and others) was not shared among these institutions.
With respect to actual or real expenditure of allocated government funds, data from the year before the Score-card process was available for all South American coun-tries and for Costa Rica, El Salvador, Guatemala, Mexi-co, and the Dominican Republic in the Mesoamerican+ region. This data was not available for Belize, Hondu-ras, Nicaragua, Panama, and Cuba.
Results
Figure 3.5 shows the contribution of government budgeted funds to total available funds for PAs in each country. In most countries, government funds cover recurrent costs such as salaries and operations. However, in some countries — including Argentina, Venezuela, Colombia, and Ecuador — resources are also used for infrastructure investment, vehicles, and professional services.
Regional Trends• Analysis revealswidevariationacross countries
in percentage of dependency on government budgets for available resources for PAs, varying between 1 percent (Bolivia) and a reported 100 percent (Venezuela40) of total finances. In US dol-lars, amounts of annual government budget allo-cations vary between $73,000 and $104 million.
• However, a clear predominance of governmentalparticipation in PA finances can be observed in the entire region: seven countries (Venezuela, Bra-zil, Uruguay, Colombia, the Dominican Republic, Chile, and Mexico) declare state participation of more than 60 percent of the available funds for PAs by each country. PA systems in South America, in general, show greater state participation than in Mesoamerica+. Such reliance on government bud-gets comes with a risk, particularly during periods of economic recession and budgetary contraction.
• Wealthier governments of South American coun-tries tend to provide a higher percentage of funds to PAs, in the form of budgeted amounts, than is
provided by the other two large fund sources: in-ternational cooperation and revenue generation. Lower-income countries in the region provide less government support for PAs, meaning that these countries tend to show higher reliance on donor funds in their PA portfolios.
• Although no time-series data is available withwhich to verify the evolution of government-fund allocations to conservation from 2000 to the pres-ent, the general feedback of participants in national workshops was that this government portion of the portfolio allocation has been growing. Exceptions were found in Bolivia and Paraguay, where stake-holders did not believe government budgets in their countries have been increasing over time.
Country-specific Findings• Allocationofgovernment fundstoPAs inArgen-
tina has grown over the last six years. However, the contribution has still not reached the level of invest-ment that existed before the macroeconomic crisis in this country, which began earlier this decade.
• ParticipantsinthenationalworkshopinColombiareported that the financial situation of its PA sys-tem has improved by several orders of magnitude during the last few years, resulting from an impor-tant growth in state investment, as well as from PA revenues.
• InEcuador,atthebeginningofitsnationalwork-shop, authorities presented a long list of committed financial resources, projects, and significant invest-ments that will benefit its PA system in the short and medium terms. These investments were not, however, included in the government allocation figures submitted by authorities for the Scorecard.
• InChile,observersexpectthatimplementationofanew GEF-funded project “Building a Comprehen-sive National Protected Area System for Chile”: a financial and operational framework that started early 2009, will promote a doubling of annual state expenditures on PAs within the next two years.
• TherecentlyapprovedGEFprojectintheDomini-can Republic for re-engineering its PA system also has a target to increase the annual state expendi-ture for PAs.
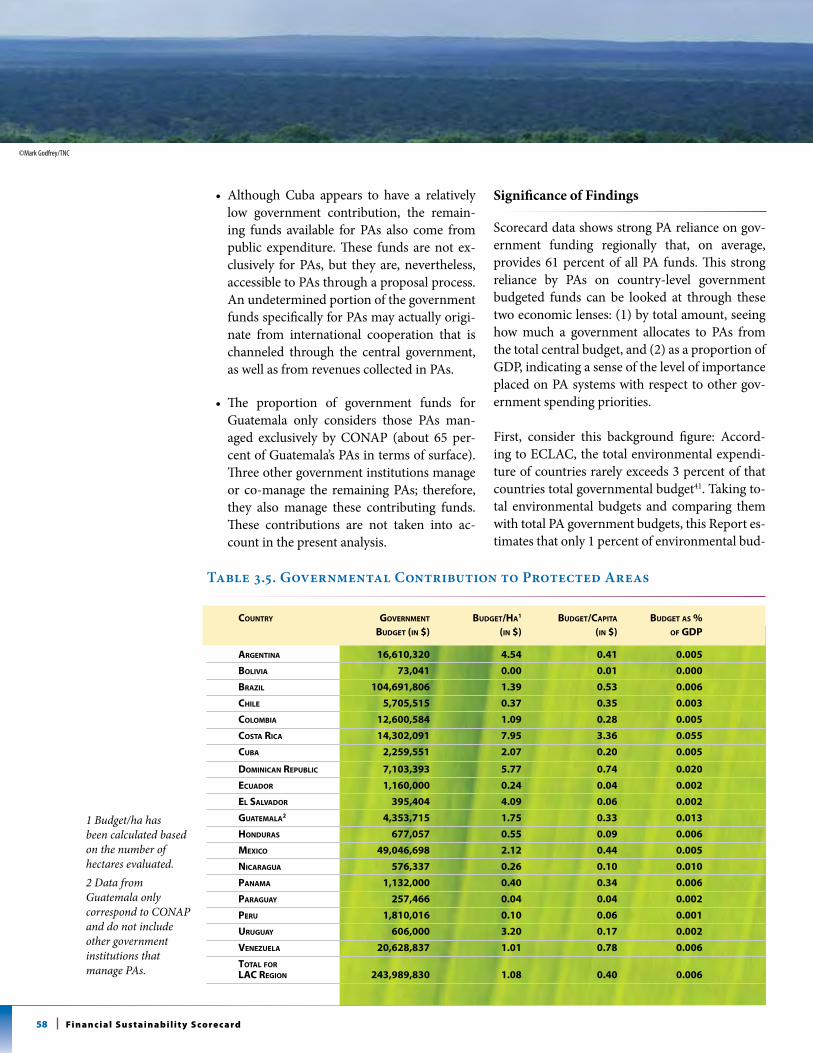
58 Fi n a n c i a l s u s t a i n a b i l i t y s co re c a rd
• AlthoughCuba appears to have a relativelylow government contribution, the remain-ing funds available for PAs also come from public expenditure. These funds are not ex-clusively for PAs, but they are, nevertheless, accessible to PAs through a proposal process. An undetermined portion of the government funds specifically for PAs may actually origi-nate from international cooperation that is channeled through the central government, as well as from revenues collected in PAs.
• The proportion of government funds forGuatemala only considers those PAs man-aged exclusively by CONAP (about 65 per-cent of Guatemala’s PAs in terms of surface). Three other government institutions manage or co-manage the remaining PAs; therefore, they also manage these contributing funds. These contributions are not taken into ac-count in the present analysis.
Significance of Findings
Scorecard data shows strong PA reliance on gov-ernment funding regionally that, on average, provides 61 percent of all PA funds. This strong reliance by PAs on country-level government budgeted funds can be looked at through these two economic lenses: (1) by total amount, seeing how much a government allocates to PAs from the total central budget, and (2) as a proportion of GDP, indicating a sense of the level of importance placed on PA systems with respect to other gov-ernment spending priorities.
First, consider this background figure: Accord-ing to ECLAC, the total environmental expendi-ture of countries rarely exceeds 3 percent of that countries total governmental budget41. Taking to-tal environmental budgets and comparing them with total PA government budgets, this Report es-timates that only 1 percent of environmental bud-
Table 3.5. Governmental Contribution to Protected Areas
CountRy GoVeRnment BuDGet/Ha1 BuDGet/Capita BuDGet as % BuDGet (in $) (in $) (in $) of GDp
aRGentina 16,610,320 4.54 0.41 0.005
BoliVia 73,041 0.00 0.01 0.000
BRazil 104,691,806 1.39 0.53 0.006
CHile 5,705,515 0.37 0.35 0.003
ColomBia 12,600,584 1.09 0.28 0.005
Costa RiCa 14,302,091 7.95 3.36 0.055
CuBa 2,259,551 2.07 0.20 0.005
DominiCan RepuBliC 7,103,393 5.77 0.74 0.020
eCuaDoR 1,160,000 0.24 0.04 0.002
el salVaDoR 395,404 4.09 0.06 0.002
Guatemala2 4,353,715 1.75 0.33 0.013
HonDuRas 677,057 0.55 0.09 0.006
mexiCo 49,046,698 2.12 0.44 0.005
niCaRaGua 576,337 0.26 0.10 0.010
panama 1,132,000 0.40 0.34 0.006
paRaGuay 257,466 0.04 0.04 0.002
peRu 1,810,016 0.10 0.06 0.001
uRuGuay 606,000 3.20 0.17 0.002
Venezuela 20,628,837 1.01 0.78 0.006
total foR laC ReGion 243,989,830 1.08 0.40 0.006
1 Budget/ha has been calculated based on the number of hectares evaluated.2 Data from Guatemala only correspond to CONAP and do not include other government institutions that manage PAs.
©mark Godfrey/tnc
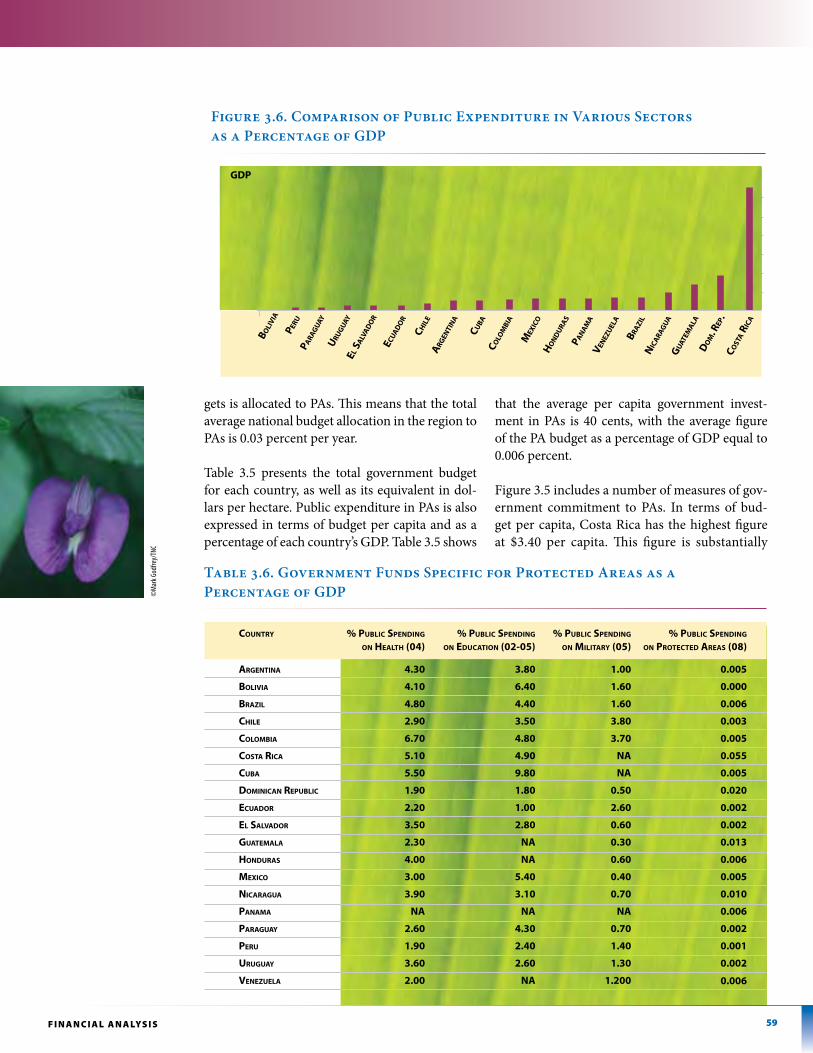
59F i n A n C i A l A n A lys i s
gets is allocated to PAs. This means that the total average national budget allocation in the region to PAs is 0.03 percent per year.
Table 3.5 presents the total government budget for each country, as well as its equivalent in dol-lars per hectare. Public expenditure in PAs is also expressed in terms of budget per capita and as a percentage of each country’s GDP. Table 3.5 shows
that the average per capita government invest-ment in PAs is 40 cents, with the average figure of the PA budget as a percentage of GDP equal to 0.006 percent.
Figure 3.5 includes a number of measures of gov-ernment commitment to PAs. In terms of bud-get per capita, Costa Rica has the highest figure at $3.40 per capita. This figure is substantially
Table 3.6. Government Funds Specific for Protected Areas as a Percentage of GDP
country % Public sPending % Public sPending % Public sPending % Public sPending
on health (04) on education (02-05) on Military (05) on Protected areas (08)
aRGentina 4.30 3.80 1.00 0.005
BoliVia 4.10 6.40 1.60 0.000
BRazil 4.80 4.40 1.60 0.006
CHile 2.90 3.50 3.80 0.003
ColomBia 6.70 4.80 3.70 0.005
Costa RiCa 5.10 4.90 na 0.055
CuBa 5.50 9.80 na 0.005
DominiCan RepuBliC 1.90 1.80 0.50 0.020
eCuaDoR 2.20 1.00 2.60 0.002
el salVaDoR 3.50 2.80 0.60 0.002
Guatemala 2.30 na 0.30 0.013
HonDuRas 4.00 na 0.60 0.006
mexiCo 3.00 5.40 0.40 0.005
niCaRaGua 3.90 3.10 0.70 0.010
panama na na na 0.006
paRaGuay 2.60 4.30 0.70 0.002
peRu 1.90 2.40 1.40 0.001
uRuGuay 3.60 2.60 1.30 0.002
Venezuela 2.00 na 1.200 0.006
Figure 3.6. Comparison of Public Expenditure in Various Sectors as a Percentage of GDP
0.06%
0.05%
0.04%
0.03%
0.02%
0.01%
0.00%
Boli
Via
GDp
mex
iCo
peRu
Ho
nD
uRa
s
paRa
Gu
ay
pan
am
a
uRu
Gu
ay
Ven
ezu
ela
el sa
lVa
Do
R
BRazi
l
CHil
e
eCua
Do
R
niC
aRa
Gu
a
aRG
enti
na
Gu
atem
ala
CuBa
Do
m. R
ep.
Colo
mBi
a
Cost
a R
iCa
©m
ark G
odfre
y/tn
c
60 Fi n a n c i a l s u s t a i n a b i l i t y s co re c a rd
higher than all the other country figures, with the next highest country being the Dominican Republic with $0.74 per capita. This high relative level of budget support provided by Costa Rica for PAs indicates that this environmental commitment can be a highly cost-effective investment by governments in the region. Costa Rica is well known for its high economic returns from ecotourism.
Table 3.6 then compares this percentage with public ex-penditure in other sectors, illustrating the low propor-tion of funds that PA systems receive compared to other sectors. Government investment in PA conservation is several orders of magnitude lower than other sectors.
Figure 3.6 compares the public spending on PAs in each country as a percentage of their respective GDPs. The data confirms that, in most countries of the re-gion, public spending on PAs represents less than 0.1 percent of GDP. Costa Rica is the country with the highest percentage of public spending with respect to GDP, with 0.05 percent, followed by the Dominican Republic (0.02 percent), Nicaragua (0.01 percent), and Guatemala (0.01 percent), while Bolivia has the lowest percentage (0.0004 percent).
This comparatively low investment by governments in PA conservation compared to other sectors reflects, in part, the finding that across the region, PA systems are still not fully integrated into social and economic de-velopment. Further, PA systems are not perceived as fundamental components of the linked systems of so-cial and economic development. Environmental policy
in the region tends to focus on problems more directly related to population density: Urban problems of air and water quality are the priorities of environmental expenses and budgeting in the region. However, this focus on urban water demands for consumers and in-dustry should also look at the role PAs play in ecosys-tem services and water provision. In some cases, up to 80 percent of drinking water for urban populations comes from PAs. Policymakers rarely make the essen-tial link between the value of PA in provision of water to urban populations and the budget amounts allocat-ed to PA financing.
Considered more broadly, the role that PAs play in ecosystem services is poorly understood by many gov-ernment policy makers. Current levels of state funding present clear signs of an unsustainable model, con-sidering the many and varied PA-sheltered goods and services provided in the region. Indeed, this lack of knowledge exacerbates the problem of unsustainabil-ity for countries and the region by allowing the mate-rial base for economic growth to be based primarily on natural resources exploitation. A true and full cost-benefit analysis from the public investment perspec-tive should also consider PA roles in the provision of basic necessities such as water. Ecosystem valuation numbers and proxies will help fill the missing variables in cost-benefit analysis concerning PAs. See Chapter 1 for a brief overview of this topic.
Looking at PAs from a real-asset perspective is instruc-tive. Assuming only their real estate value, LAC PA sys-
©tim
othy
Bouc
her/t
nc
61F i n A n C i A l A n A lys i s
tems might be worth $110 billon. To manage and care for this asset, which represents 23 percent of the entire regional surface, governments in the region are expending yearly only 3 percent of the land’s value. From a land-value perspective alone, governments in the region are under-investing in PAs. This under-investment becomes ever more stark when two other profoundly powerful PA benefits are considered: first, that PA systems in the region protect almost 40 percent of the earth’s biodiversity; and second, that these systems, due in part to this ecological bounty, are some of the most important touristic attractions globally.
extra-Budgetary sources: international Cooperation/donor Funds
Data Gathered
Donor funds are defined by the Scorecard as an extra-budgetary source of funds for PAs. De-pending on needs and structures of the receiving country, donor funds may be channeled through a variety of institutions, including the govern-ment, trust funds, and NGOs, or directly by the donor. Data collected on donor funds included both public (bilateral or multilateral international cooperation) and private sources (private foun-dations, individual donors, and NGOs, among others). In one sense, “donor funds” or “dona-tions” refer to funds that originate outside of the country. Therefore, donations made to PAs by lo-cal private firms (as in the case of Brazil) were not included under this category, but they appear under “other extra-budgetary sources”.
In general, this analysis was not able to disag-gregate by recipient country the channels for in-ternational cooperation. The data did not permit identification or tracking of donor funds by the paths of trust fund, central government funnel, or pass-through by NGOs or other institutions. Therefore, data collected on donor funds was mostly aggregate. An additional problem with presenting data on donor sources concerns the total figures themselves. Some of the informa-tion on donor funds presented by country and in the aggregate underestimates the real amounts that are available for PAs. The principal reason
for this underestimation is that capturing precise data on complete donor fund contributions to PA management is extremely difficult. This informa-tion gap was especially clear in Bolivia, Ecuador, Paraguay, Peru, Guatemala, Mexico, and Cuba, where financial reporting instruments on inter-national cooperation projects are either weak or absent. Other countries follow reporting proce-dures that make donor information more trans-parent. For example, in some countries, such as Argentina and Uruguay, official procedures exist that obligate donors to declare expenses in PAs, especially when these donors are multilateral or bilateral sources.
Cuba and Venezuela were two particular cases of note with respect to international cooperation. In Venezuela, participants in the national workshop declared that the PA system of their country does not receive funds from international cooperation, with the exception of a GEF PA financial sustain-ability project, which was in the planning stage during the Scorecard national workshop. If this international cooperation comes through, these PA funds would be considered within the state budget. Similarly, in Cuba, international cooper-ation funds are managed at the central level, with the government in charge of channeling funds to PAs, according to their needs.
In Brazil, however, international funding plays different roles depending on the governance of the system. For the federal system, international funding represents less than 10 percent of the to-tal funds, while for some states in Brazil, inter-national funding represents 90 percent of total funds for investments. Nevertheless, for Brazil in this Report, only the funds available for the fed-eral system were considered.
Results
An estimated 15 percent of the total available funds for PA systems in the region come from international cooperation as donor funds (Fig-ure 3.7). Funds are channeled either through program and project execution (at the site and system levels) or through capitalization of trust funds (donations or debt-for-nature swaps). The largest donor supporting PAs in the region
©Jo
nath
an Ke
rr/tn
c
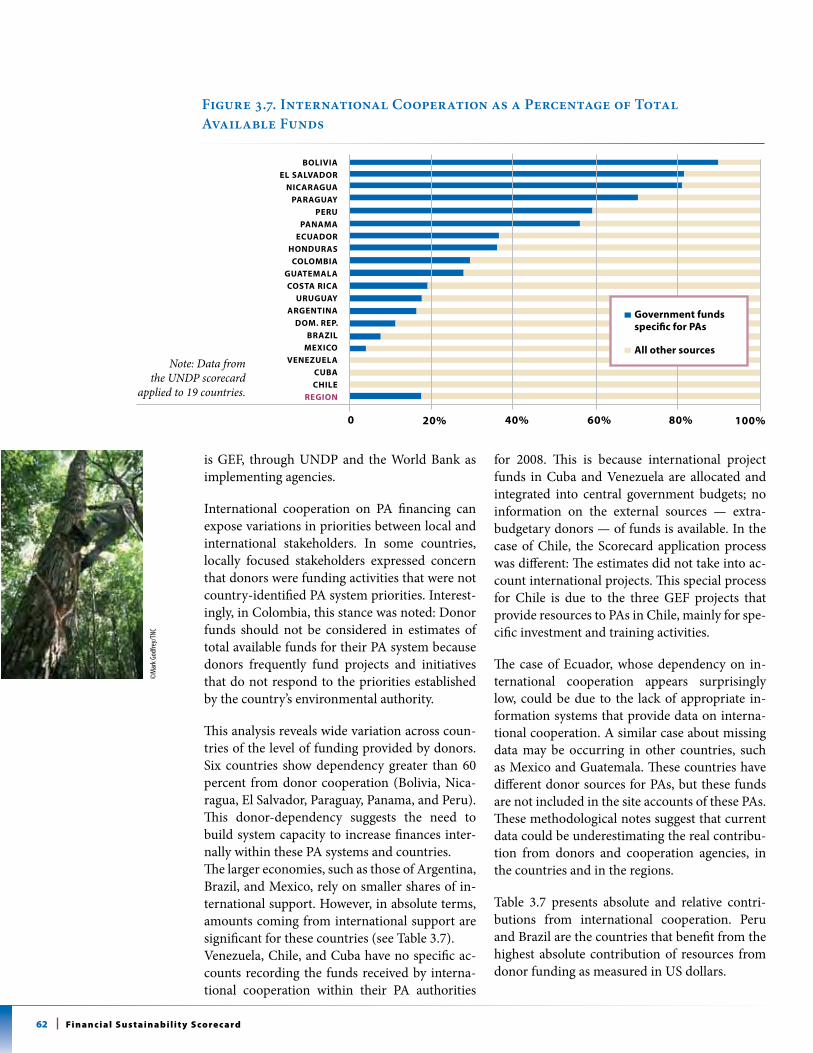
62 Fi n a n c i a l s u s t a i n a b i l i t y s co re c a rd
is GEF, through UNDP and the World Bank as implementing agencies.
International cooperation on PA financing can expose variations in priorities between local and international stakeholders. In some countries, locally focused stakeholders expressed concern that donors were funding activities that were not country-identified PA system priorities. Interest-ingly, in Colombia, this stance was noted: Donor funds should not be considered in estimates of total available funds for their PA system because donors frequently fund projects and initiatives that do not respond to the priorities established by the country’s environmental authority.
This analysis reveals wide variation across coun-tries of the level of funding provided by donors. Six countries show dependency greater than 60 percent from donor cooperation (Bolivia, Nica-ragua, El Salvador, Paraguay, Panama, and Peru). This donor-dependency suggests the need to build system capacity to increase finances inter-nally within these PA systems and countries. The larger economies, such as those of Argentina, Brazil, and Mexico, rely on smaller shares of in-ternational support. However, in absolute terms, amounts coming from international support are significant for these countries (see Table 3.7).Venezuela, Chile, and Cuba have no specific ac-counts recording the funds received by interna-tional cooperation within their PA authorities
for 2008. This is because international project funds in Cuba and Venezuela are allocated and integrated into central government budgets; no information on the external sources — extra-budgetary donors — of funds is available. In the case of Chile, the Scorecard application process was different: The estimates did not take into ac-count international projects. This special process for Chile is due to the three GEF projects that provide resources to PAs in Chile, mainly for spe-cific investment and training activities.
The case of Ecuador, whose dependency on in-ternational cooperation appears surprisingly low, could be due to the lack of appropriate in-formation systems that provide data on interna-tional cooperation. A similar case about missing data may be occurring in other countries, such as Mexico and Guatemala. These countries have different donor sources for PAs, but these funds are not included in the site accounts of these PAs. These methodological notes suggest that current data could be underestimating the real contribu-tion from donors and cooperation agencies, in the countries and in the regions.
Table 3.7 presents absolute and relative contri-butions from international cooperation. Peru and Brazil are the countries that benefit from the highest absolute contribution of resources from donor funding as measured in US dollars.
Figure 3.7. International Cooperation as a Percentage of Total Available Funds
BOLIVIa
eL SaLVaDOr
NICaraGUa
paraGUay
perU
paNaMa
eCUaDOr
hONDUraS
COLOMBIa
GUateMaLa
COSta rICa
UrUGUay
arGeNtINa
DOM. rep.
BrazIL
MexICO
VeNezUeLa
CUBa
ChILe
reGION
0 20% 40% 60% 80% 100%
Government funds specific for pas
all other sourcesNote: Data from
the UNDP scorecard applied to 19 countries.
©m
ark G
odfre
y/tn
c
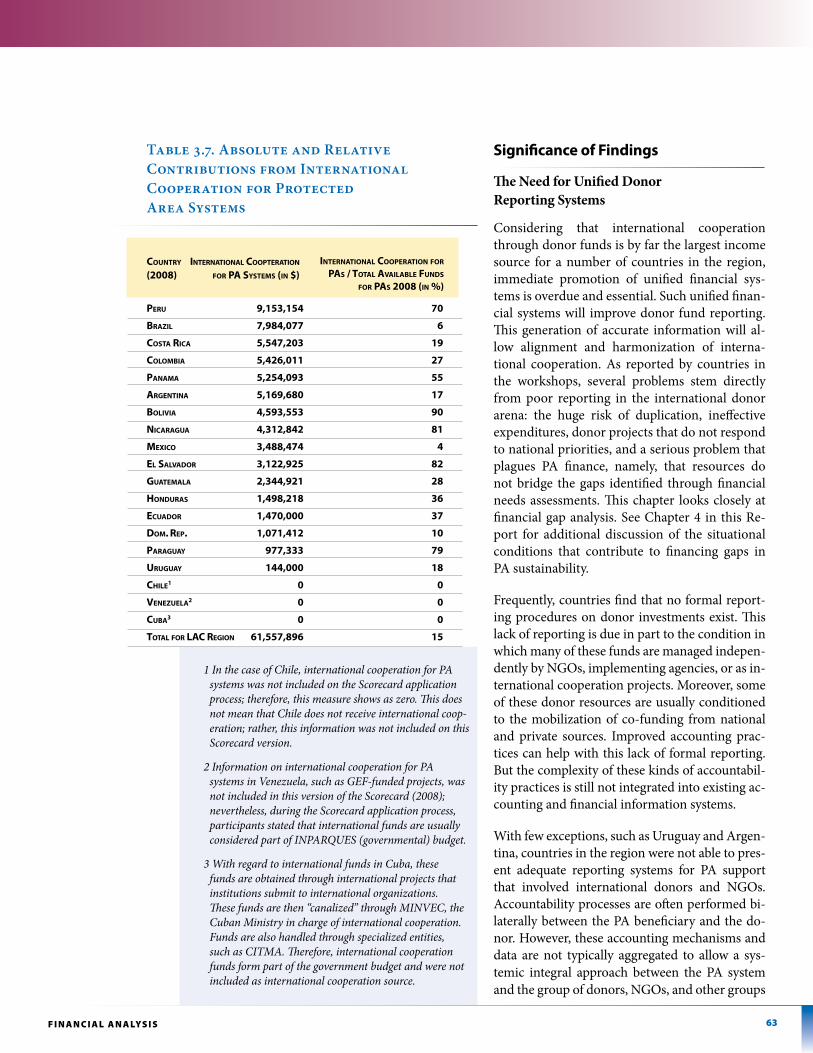
63F i n A n C i A l A n A lys i s
1 In the case of Chile, international cooperation for PA systems was not included on the Scorecard application process; therefore, this measure shows as zero. This does not mean that Chile does not receive international coop-eration; rather, this information was not included on this Scorecard version.
2 Information on international cooperation for PA systems in Venezuela, such as GEF-funded projects, was not included in this version of the Scorecard (2008); nevertheless, during the Scorecard application process, participants stated that international funds are usually considered part of INPARQUES (governmental) budget.
3 With regard to international funds in Cuba, these funds are obtained through international projects that institutions submit to international organizations. These funds are then “canalized” through MINVEC, the Cuban Ministry in charge of international cooperation. Funds are also handled through specialized entities, such as CITMA. Therefore, international cooperation funds form part of the government budget and were not included as international cooperation source.
significance of Findings
The Need for Unified Donor Reporting Systems
Considering that international cooperation through donor funds is by far the largest income source for a number of countries in the region, immediate promotion of unified financial sys-tems is overdue and essential. Such unified finan-cial systems will improve donor fund reporting. This generation of accurate information will al-low alignment and harmonization of interna-tional cooperation. As reported by countries in the workshops, several problems stem directly from poor reporting in the international donor arena: the huge risk of duplication, ineffective expenditures, donor projects that do not respond to national priorities, and a serious problem that plagues PA finance, namely, that resources do not bridge the gaps identified through financial needs assessments. This chapter looks closely at financial gap analysis. See Chapter 4 in this Re-port for additional discussion of the situational conditions that contribute to financing gaps in PA sustainability.
Frequently, countries find that no formal report-ing procedures on donor investments exist. This lack of reporting is due in part to the condition in which many of these funds are managed indepen-dently by NGOs, implementing agencies, or as in-ternational cooperation projects. Moreover, some of these donor resources are usually conditioned to the mobilization of co-funding from national and private sources. Improved accounting prac-tices can help with this lack of formal reporting. But the complexity of these kinds of accountabil-ity practices is still not integrated into existing ac-counting and financial information systems.
With few exceptions, such as Uruguay and Argen-tina, countries in the region were not able to pres-ent adequate reporting systems for PA support that involved international donors and NGOs. Accountability processes are often performed bi-laterally between the PA beneficiary and the do-nor. However, these accounting mechanisms and data are not typically aggregated to allow a sys-temic integral approach between the PA system and the group of donors, NGOs, and other groups
Table 3.7. Absolute and Relative Contributions from International Cooperation for Protected Area Systems
CountRy inteRnational CoopteRation (2008) foR pa systems (in $)
peRu 9,153,154 70
BRazil 7,984,077 6
Costa RiCa 5,547,203 19
ColomBia 5,426,011 27
panama 5,254,093 55
aRGentina 5,169,680 17
BoliVia 4,593,553 90
niCaRaGua 4,312,842 81
mexiCo 3,488,474 4
el salVaDoR 3,122,925 82
Guatemala 2,344,921 28
HonDuRas 1,498,218 36
eCuaDoR 1,470,000 37
Dom. Rep. 1,071,412 10
paRaGuay 977,333 79
uRuGuay 144,000 18
CHile1 0 0
Venezuela2 0 0
CuBa3 0 0
total foR laC ReGion 61,557,896 15
inteRnational CoopeRation foR pas / total aVailaBle funDs
foR pas 2008 (in %)
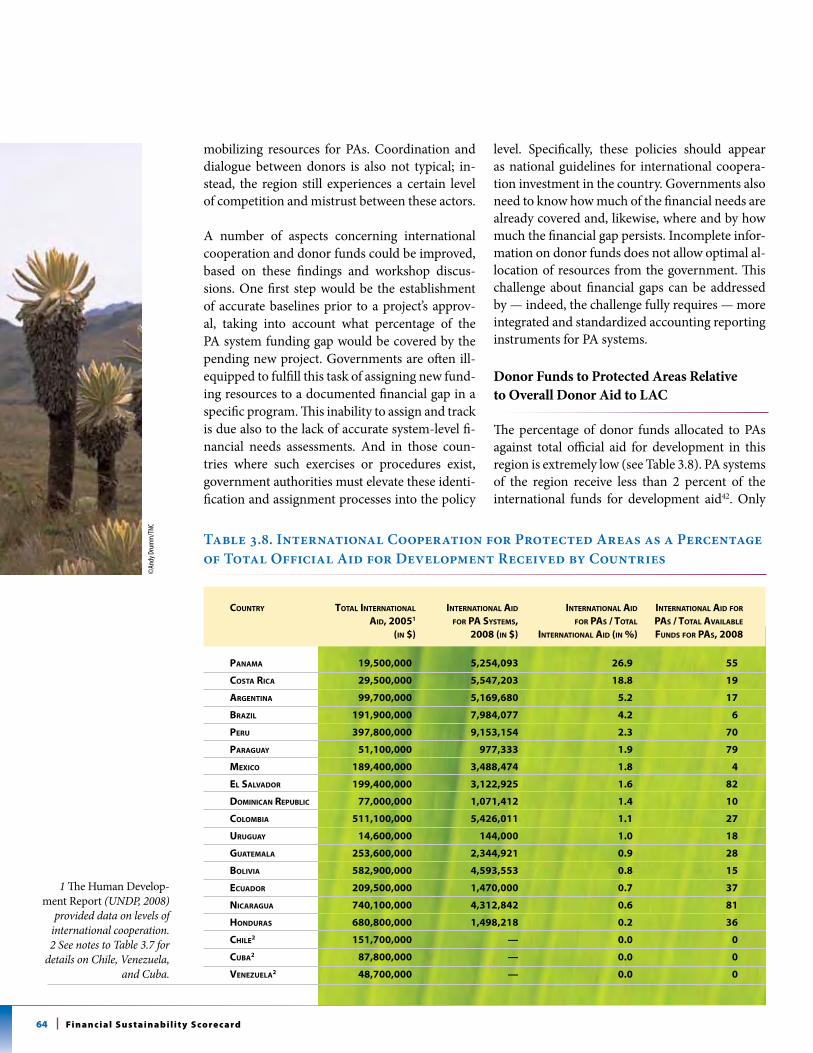
64 Fi n a n c i a l s u s t a i n a b i l i t y s co re c a rd
mobilizing resources for PAs. Coordination and dialogue between donors is also not typical; in-stead, the region still experiences a certain level of competition and mistrust between these actors.
A number of aspects concerning international cooperation and donor funds could be improved, based on these findings and workshop discus-sions. One first step would be the establishment of accurate baselines prior to a project’s approv-al, taking into account what percentage of the PA system funding gap would be covered by the pending new project. Governments are often ill-equipped to fulfill this task of assigning new fund-ing resources to a documented financial gap in a specific program. This inability to assign and track is due also to the lack of accurate system-level fi-nancial needs assessments. And in those coun-tries where such exercises or procedures exist, government authorities must elevate these identi-fication and assignment processes into the policy
level. Specifically, these policies should appear as national guidelines for international coopera-tion investment in the country. Governments also need to know how much of the financial needs are already covered and, likewise, where and by how much the financial gap persists. Incomplete infor-mation on donor funds does not allow optimal al-location of resources from the government. This challenge about financial gaps can be addressed by — indeed, the challenge fully requires — more integrated and standardized accounting reporting instruments for PA systems.
Donor Funds to Protected Areas Relative to Overall Donor Aid to LAC
The percentage of donor funds allocated to PAs against total official aid for development in this region is extremely low (see Table 3.8). PA systems of the region receive less than 2 percent of the international funds for development aid42. Only
1 The Human Develop-ment Report (UNDP, 2008)
provided data on levels of international cooperation. 2 See notes to Table 3.7 for
details on Chile, Venezuela, and Cuba.
Table 3.8. International Cooperation for Protected Areas as a Percentage of Total Official Aid for Development Received by Countries
international aid For Pas / total available Funds For Pas, 2008
international aid For Pas / total
international aid (in %)
international aid For Pa systeMs,
2008 (in $)
total international aid, 20051
(in $)
CountRy
PanaMa 19,500,000 5,254,093 26.9 55
costa rica 29,500,000 5,547,203 18.8 19
argentina 99,700,000 5,169,680 5.2 17
brazil 191,900,000 7,984,077 4.2 6
Peru 397,800,000 9,153,154 2.3 70
Paraguay 51,100,000 977,333 1.9 79
Mexico 189,400,000 3,488,474 1.8 4
el salvador 199,400,000 3,122,925 1.6 82
doMinican rePublic 77,000,000 1,071,412 1.4 10
coloMbia 511,100,000 5,426,011 1.1 27
uruguay 14,600,000 144,000 1.0 18
guateMala 253,600,000 2,344,921 0.9 28
bolivia 582,900,000 4,593,553 0.8 15
ecuador 209,500,000 1,470,000 0.7 37
nicaragua 740,100,000 4,312,842 0.6 81
honduras 680,800,000 1,498,218 0.2 36
chile2 151,700,000 — 0.0 0
cuba2 87,800,000 — 0.0 0
venezuela2 48,700,000 — 0.0 0
©an
dy d
rum
m/t
nc
65F i n A n C i A l A n A lys i s
four countries in the region have more than 4 percent of total international support targeted to PAs: Panama, Costa Rica, Brazil, and Argentina.
The perception of many participants in the national workshops is that, during the last decade, the region saw a decrease in the flow of international cooperation funds to support PA systems. Such decreases in PA sup-port in these countries resulted from changing priorities of international donors and emerging issues like poverty alleviation and climate change. This insight about inter-national funds and shifting priorities suggests specific strategies for PA stakeholders. The synergies between the benefits that PAs provide, in terms of both poverty alleviation and both climate change mitigation and ad-aptation, are quite strong. PA authorities could access more international donor funds by increasing fundrais-ing capacity and better demonstrating the role of PAs in contributing to mutually held objectives between PA stakeholders and international donors. Economic valua-tion of ecosystem services would play a large role in this persuasion process.
At the time this Report was finalized, the fourth GEF cycle had made an annual average contribution of $28.6 million to the PA systems in South America and Meso-america+. Assuming all of these resources were reported by countries under international cooperation, the GEF alone contributes with almost 46 percent of the total in-vestment in PA systems from this source.
The Role of Trust Funds
In Bolivia, El Salvador, Panama, and Peru, a significant proportion of donor funds is administered through envi-ronmental trust funds. Trust funds are long-term instru-ments to direct donor funds that improve the availability and permanence of donor funds over time. Countries without trust funds in place typically depend on inter-national cooperation through new donor projects to support and invest in their PA systems. This condition of project-specific support, rather than durable trust funds, is not necessarily a disadvantage for PA conserva-tion finance. One strength of stream-of-project funds, as opposed to the trust fund condition, is that projects are often targeted toward identified needs, which can leave to the government the fiscal responsibility to cover stan-dard operational costs.
Box 3.2 Latin America and the Carib-bean Network on Environmental Funds (RedLAC) Contribution to PAs in LAC
The region is home to 18 environmental trust funds. These funds support a total of 660 PAs in 12 countries and 1 region (Mesoamerican Reef), 45 traditional population areas, 150 private areas, 455 public areas, and 10 other areas.
The majority of these trust funds (17) support PA con-solidation projects including investment in equipment and infrastructure; establishment of councils, training, and community participation encouragement; and scientific research and biodiversity monitoring. Most trust funds (16 of 18) include fund-management plan formulation and institutional strengthening activities for organizations responsible for PA system manage-ment. The costs of signalization, vigilance and control, and park guard training are often covered by these funds (15 out of 18).
The resources managed by environmental trust funds are mobilized through different types of financial mechanisms. For example, RedLAC funds administer a total of $328.7 million dedicated to PAs. This total is divided into endowment funds (55.4 percent), sinking funds (14.9 percent), revolving funds (0.5 percent), and other mechanisms (29.3 percent) — this last type is specifically for a mixed fund of $11 million and of par-tial disbursements of $83 million from one of the funds (Profonanpe, from Peru). In 2008, all of the RedLAC funds together disbursed $31.5 million for PAs1.
Regarding the origin of these trust fund resources, international donations are still the most important (11 funds receive international donor resources for PAs). Private national donations or government budget resources are also important, as reported by seven and six funds, respectively. Among other sources cited by half of the funds, US government debt-for-nature swaps stand out. Only one fund reported market mechanisms as an important source. Another fund applies legal mechanisms as a source. This shows that the latter two sources — market mechanisms and legal mechanisms — are areas that environmental trust fund makers should explore to mobilize additional resources for PAs.
1 REDLAC, 2009
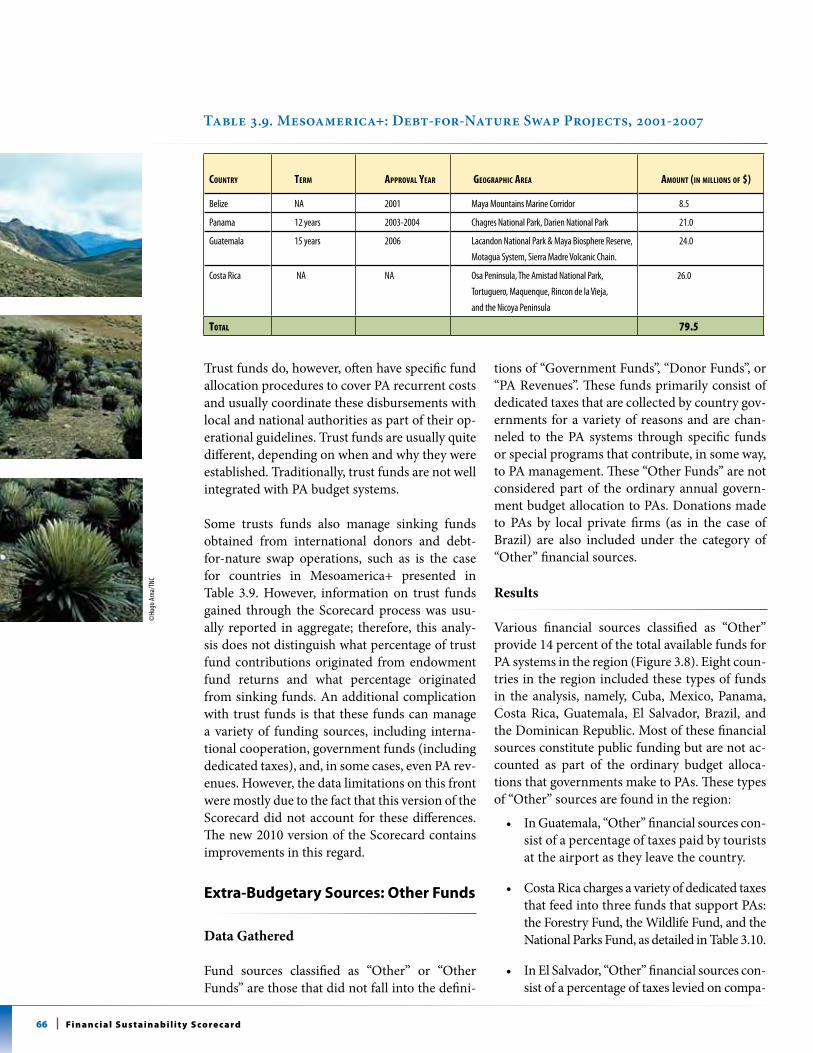
66 Fi n a n c i a l s u s t a i n a b i l i t y s co re c a rd
Trust funds do, however, often have specific fund allocation procedures to cover PA recurrent costs and usually coordinate these disbursements with local and national authorities as part of their op-erational guidelines. Trust funds are usually quite different, depending on when and why they were established. Traditionally, trust funds are not well integrated with PA budget systems.
Some trusts funds also manage sinking funds obtained from international donors and debt-for-nature swap operations, such as is the case for countries in Mesoamerica+ presented in Table 3.9. However, information on trust funds gained through the Scorecard process was usu-ally reported in aggregate; therefore, this analy-sis does not distinguish what percentage of trust fund contributions originated from endowment fund returns and what percentage originated from sinking funds. An additional complication with trust funds is that these funds can manage a variety of funding sources, including interna-tional cooperation, government funds (including dedicated taxes), and, in some cases, even PA rev-enues. However, the data limitations on this front were mostly due to the fact that this version of the Scorecard did not account for these differences. The new 2010 version of the Scorecard contains improvements in this regard.
extra-Budgetary sources: other Funds
Data Gathered
Fund sources classified as “Other” or “Other Funds” are those that did not fall into the defini-
tions of “Government Funds”, “Donor Funds”, or “PA Revenues”. These funds primarily consist of dedicated taxes that are collected by country gov-ernments for a variety of reasons and are chan-neled to the PA systems through specific funds or special programs that contribute, in some way, to PA management. These “Other Funds” are not considered part of the ordinary annual govern-ment budget allocation to PAs. Donations made to PAs by local private firms (as in the case of Brazil) are also included under the category of “Other” financial sources.
Results
Various financial sources classified as “Other” provide 14 percent of the total available funds for PA systems in the region (Figure 3.8). Eight coun-tries in the region included these types of funds in the analysis, namely, Cuba, Mexico, Panama, Costa Rica, Guatemala, El Salvador, Brazil, and the Dominican Republic. Most of these financial sources constitute public funding but are not ac-counted as part of the ordinary budget alloca-tions that governments make to PAs. These types of “Other” sources are found in the region:
• In Guatemala, “Other” financial sources con-sist of a percentage of taxes paid by tourists at the airport as they leave the country.
• CostaRicachargesavarietyofdedicatedtaxes that feed into three funds that support PAs: the Forestry Fund, the Wildlife Fund, and the National Parks Fund, as detailed in Table 3.10.
• InElSalvador,“Other”financialsourcescon-sist of a percentage of taxes levied on compa-
Table 3.9. Mesoamerica+: Debt-for-Nature Swap Projects, 2001-2007
Country term ApprovAl yeAr GeoGrAphiC AreA Amount (in millions of $)
Belize na 2001 maya mountains marine corridor 8.5
Panama 12 years 2003-2004 chagres national Park, darien national Park 21.0
Guatemala 15 years 2006 lacandon national Park & maya Biosphere Reserve,
motagua system, sierra madre volcanic chain.
24.0
costa Rica na na osa Peninsula, the amistad national Park,
tortuguero, maquenque, Rincon de la vieja,
and the nicoya Peninsula
26.0
ToTal 79.5
©Hu
go a
rna/
tnc
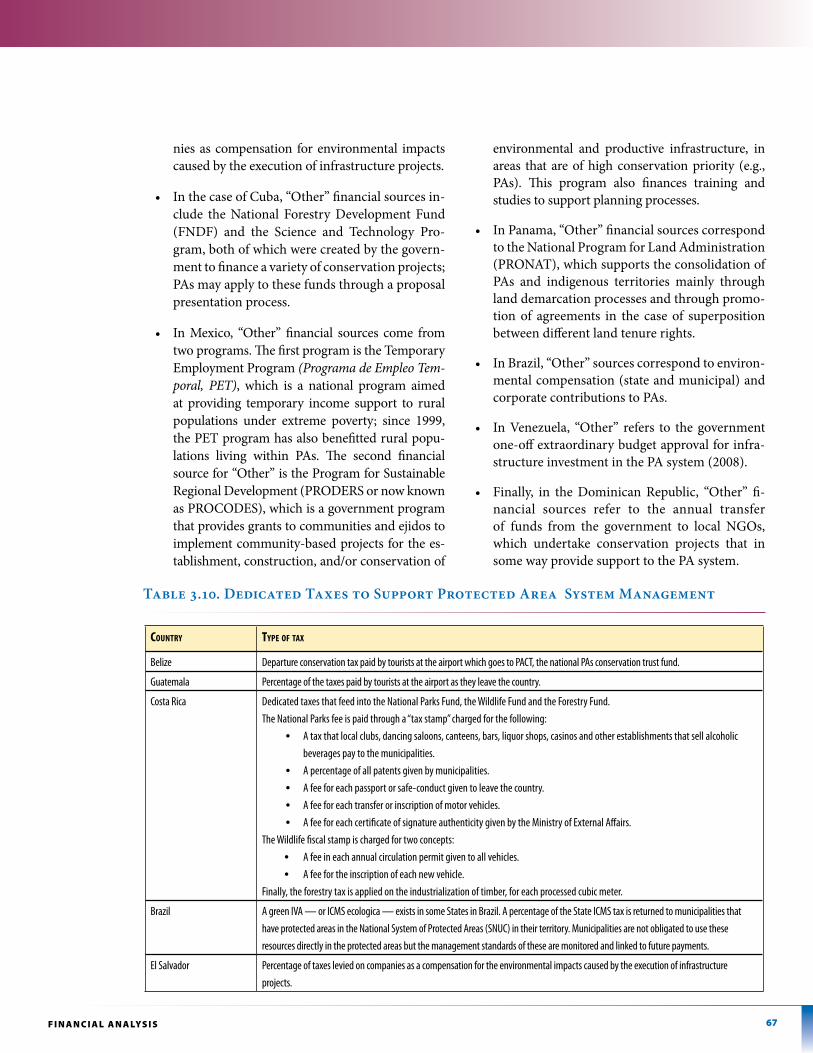
67F i n A n C i A l A n A lys i s
nies as compensation for environmental impacts caused by the execution of infrastructure projects.
• In the case of Cuba, “Other” financial sources in-clude the National Forestry Development Fund (FNDF) and the Science and Technology Pro-gram, both of which were created by the govern-ment to finance a variety of conservation projects; PAs may apply to these funds through a proposal presentation process.
• In Mexico, “Other” financial sources come from two programs. The first program is the Temporary Employment Program (Programa de Empleo Tem-poral, PET), which is a national program aimed at providing temporary income support to rural populations under extreme poverty; since 1999, the PET program has also benefitted rural popu-lations living within PAs. The second financial source for “Other” is the Program for Sustainable Regional Development (PRODERS or now known as PROCODES), which is a government program that provides grants to communities and ejidos to implement community-based projects for the es-tablishment, construction, and/or conservation of
environmental and productive infrastructure, in areas that are of high conservation priority (e.g., PAs). This program also finances training and studies to support planning processes.
• In Panama, “Other” financial sources correspond to the National Program for Land Administration (PRONAT), which supports the consolidation of PAs and indigenous territories mainly through land demarcation processes and through promo-tion of agreements in the case of superposition between different land tenure rights.
• In Brazil, “Other” sources correspond to environ-mental compensation (state and municipal) and corporate contributions to PAs.
• InVenezuela, “Other” refers to thegovernmentone-off extraordinary budget approval for infra-structure investment in the PA system (2008).
• Finally, in the Dominican Republic, “Other” fi-nancial sources refer to the annual transfer of funds from the government to local NGOs, which undertake conservation projects that in some way provide support to the PA system.
Country term ApprovAl yeAr GeoGrAphiC AreA Amount (in millions of $)
Belize na 2001 maya mountains marine corridor 8.5
Panama 12 years 2003-2004 chagres national Park, darien national Park 21.0
Guatemala 15 years 2006 lacandon national Park & maya Biosphere Reserve,
motagua system, sierra madre volcanic chain.
24.0
costa Rica na na osa Peninsula, the amistad national Park,
tortuguero, maquenque, Rincon de la vieja,
and the nicoya Peninsula
26.0
ToTal 79.5
Table 3.10. Dedicated Taxes to Support Protected Area System Management
Country type of tAx
Belize departure conservation tax paid by tourists at the airport which goes to Pact, the national Pas conservation trust fund.
Guatemala Percentage of the taxes paid by tourists at the airport as they leave the country.
costa Rica dedicated taxes that feed into the national Parks Fund, the Wildlife Fund and the Forestry Fund. the national Parks fee is paid through a “tax stamp” charged for the following:
• a tax that local clubs, dancing saloons, canteens, bars, liquor shops, casinos and other establishments that sell alcoholic beverages pay to the municipalities.
• a percentage of all patents given by municipalities. • a fee for each passport or safe-conduct given to leave the country. • a fee for each transfer or inscription of motor vehicles.• a fee for each certificate of signature authenticity given by the ministry of external affairs.
the Wildlife fiscal stamp is charged for two concepts: • a fee in each annual circulation permit given to all vehicles.• a fee for the inscription of each new vehicle.
Finally, the forestry tax is applied on the industrialization of timber, for each processed cubic meter.
Brazil a green Iva — or Icms ecologica — exists in some states in Brazil. a percentage of the state Icms tax is returned to municipalities that have protected areas in the national system of Protected areas (snuc) in their territory. municipalities are not obligated to use these resources directly in the protected areas but the management standards of these are monitored and linked to future payments.
el salvador Percentage of taxes levied on companies as a compensation for the environmental impacts caused by the execution of infrastructure projects.
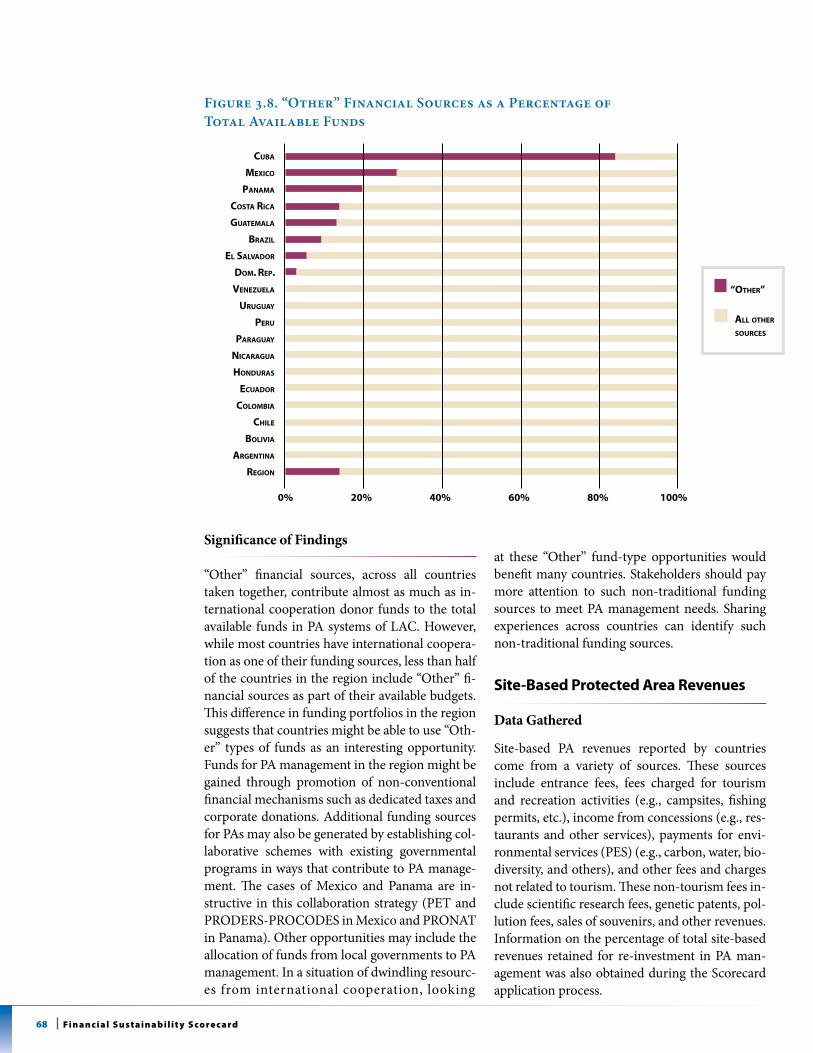
68 Fi n a n c i a l s u s t a i n a b i l i t y s co re c a rd
Significance of Findings
“Other” financial sources, across all countries taken together, contribute almost as much as in-ternational cooperation donor funds to the total available funds in PA systems of LAC. However, while most countries have international coopera-tion as one of their funding sources, less than half of the countries in the region include “Other” fi-nancial sources as part of their available budgets. This difference in funding portfolios in the region suggests that countries might be able to use “Oth-er” types of funds as an interesting opportunity. Funds for PA management in the region might be gained through promotion of non-conventional financial mechanisms such as dedicated taxes and corporate donations. Additional funding sources for PAs may also be generated by establishing col-laborative schemes with existing governmental programs in ways that contribute to PA manage-ment. The cases of Mexico and Panama are in-structive in this collaboration strategy (PET and PRODERS-PROCODES in Mexico and PRONAT in Panama). Other opportunities may include the allocation of funds from local governments to PA management. In a situation of dwindling resourc-es from international cooperation, looking
at these “Other” fund-type opportunities would benefit many countries. Stakeholders should pay more attention to such non-traditional funding sources to meet PA management needs. Sharing experiences across countries can identify such non-traditional funding sources.
site-Based protected area revenues
Data Gathered
Site-based PA revenues reported by countries come from a variety of sources. These sources include entrance fees, fees charged for tourism and recreation activities (e.g., campsites, fishing permits, etc.), income from concessions (e.g., res-taurants and other services), payments for envi-ronmental services (PES) (e.g., carbon, water, bio-diversity, and others), and other fees and charges not related to tourism. These non-tourism fees in-clude scientific research fees, genetic patents, pol-lution fees, sales of souvenirs, and other revenues. Information on the percentage of total site-based revenues retained for re-investment in PA man-agement was also obtained during the Scorecard application process.
CuBa
mexiCo
panama
Costa RiCa
Guatemala
BRazil
el salVaDoR
Dom. Rep.
Venezuela
uRuGuay
peRu
paRaGuay
niCaRaGua
HonDuRas
eCuaDoR
ColomBia
CHile
BoliVia
aRGentina
ReGion
0% 20% 40% 60% 80% 100%
“otHeR”
all otHeR souRCes
Figure 3.8. “Other” Financial Sources as a Percentage of Total Available Funds
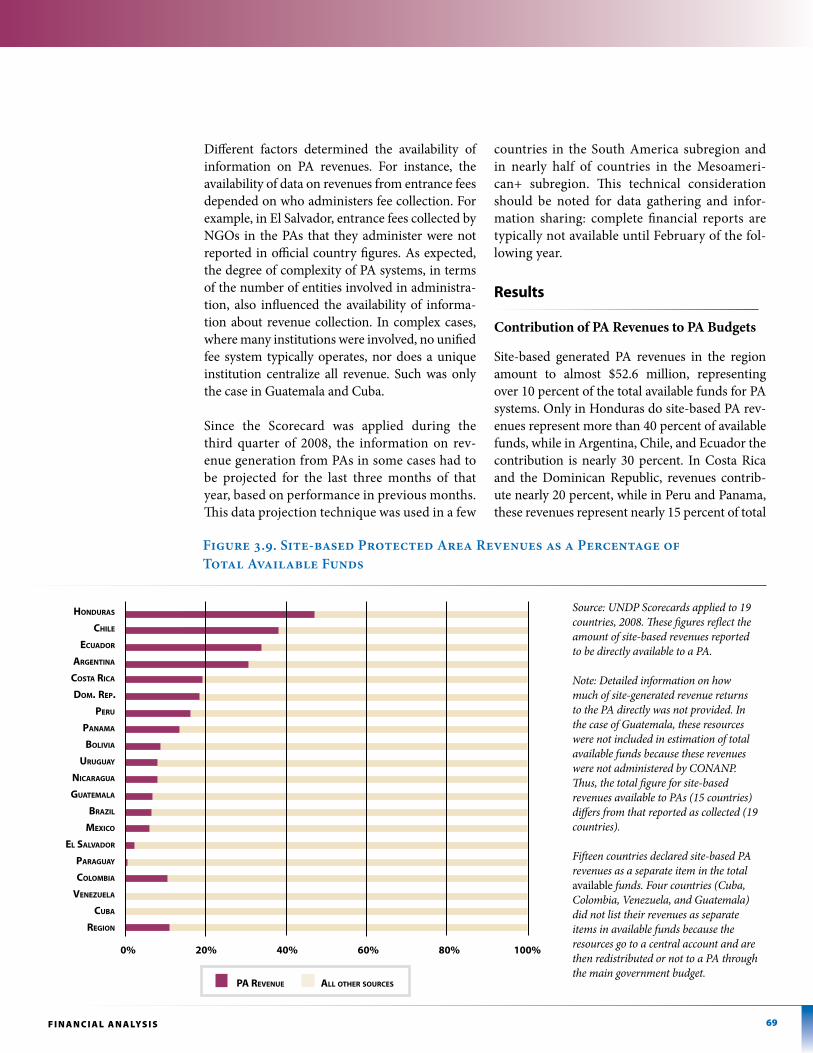
69F i n A n C i A l A n A lys i s
Figure 3.9. Site-based Protected Area Revenues as a Percentage of Total Available Funds
pa ReVenue all otHeR souRCes
HonDuRas
CHile
eCuaDoR
aRGentina
Costa RiCa
Dom. Rep.
peRu
panama
BoliVia
uRuGuay
niCaRaGua
Guatemala
BRazil
mexiCo
el salVaDoR
paRaGuay
ColomBia
Venezuela
CuBa
ReGion
0% 20% 40% 60% 80% 100%
Different factors determined the availability of information on PA revenues. For instance, the availability of data on revenues from entrance fees depended on who administers fee collection. For example, in El Salvador, entrance fees collected by NGOs in the PAs that they administer were not reported in official country figures. As expected, the degree of complexity of PA systems, in terms of the number of entities involved in administra-tion, also influenced the availability of informa-tion about revenue collection. In complex cases, where many institutions were involved, no unified fee system typically operates, nor does a unique institution centralize all revenue. Such was only the case in Guatemala and Cuba.
Since the Scorecard was applied during the third quarter of 2008, the information on rev-enue generation from PAs in some cases had to be projected for the last three months of that year, based on performance in previous months. This data projection technique was used in a few
countries in the South America subregion and in nearly half of countries in the Mesoameri-can+ subregion. This technical consideration should be noted for data gathering and infor-mation sharing: complete financial reports are typically not available until February of the fol-lowing year.
results
Contribution of PA Revenues to PA Budgets
Site-based generated PA revenues in the region amount to almost $52.6 million, representing over 10 percent of the total available funds for PA systems. Only in Honduras do site-based PA rev-enues represent more than 40 percent of available funds, while in Argentina, Chile, and Ecuador the contribution is nearly 30 percent. In Costa Rica and the Dominican Republic, revenues contrib-ute nearly 20 percent, while in Peru and Panama, these revenues represent nearly 15 percent of total
Source: UNDP Scorecards applied to 19 countries, 2008. These figures reflect the amount of site-based revenues reported to be directly available to a PA.
Note: Detailed information on how much of site-generated revenue returns to the PA directly was not provided. In the case of Guatemala, these resources were not included in estimation of total available funds because these revenues were not administered by CONANP. Thus, the total figure for site-based revenues available to PAs (15 countries) differs from that reported as collected (19 countries).
Fifteen countries declared site-based PA revenues as a separate item in the total available funds. Four countries (Cuba, Colombia, Venezuela, and Guatemala) did not list their revenues as separate items in available funds because the resources go to a central account and are then redistributed or not to a PA through the main government budget.
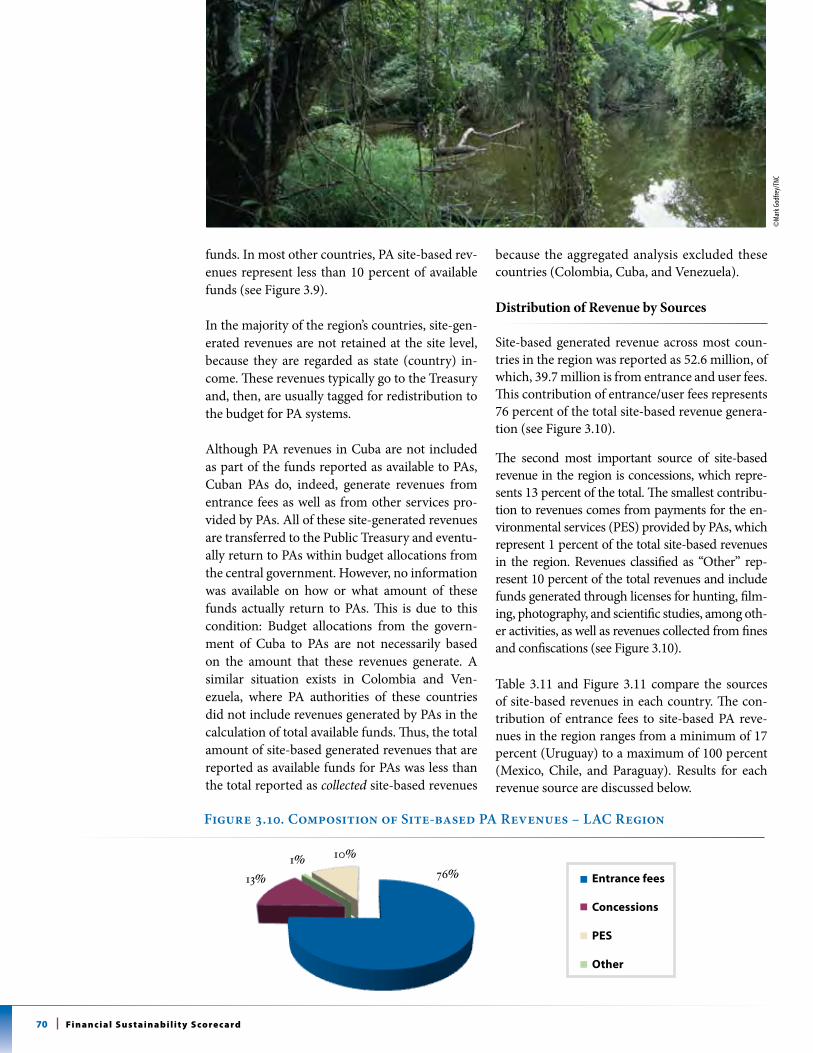
70 Fi n a n c i a l s u s t a i n a b i l i t y s co re c a rd
funds. In most other countries, PA site-based rev-enues represent less than 10 percent of available funds (see Figure 3.9).
In the majority of the region’s countries, site-gen-erated revenues are not retained at the site level, because they are regarded as state (country) in-come. These revenues typically go to the Treasury and, then, are usually tagged for redistribution to the budget for PA systems.
Although PA revenues in Cuba are not included as part of the funds reported as available to PAs, Cuban PAs do, indeed, generate revenues from entrance fees as well as from other services pro-vided by PAs. All of these site-generated revenues are transferred to the Public Treasury and eventu-ally return to PAs within budget allocations from the central government. However, no information was available on how or what amount of these funds actually return to PAs. This is due to this condition: Budget allocations from the govern-ment of Cuba to PAs are not necessarily based on the amount that these revenues generate. A similar situation exists in Colombia and Ven-ezuela, where PA authorities of these countries did not include revenues generated by PAs in the calculation of total available funds. Thus, the total amount of site-based generated revenues that are reported as available funds for PAs was less than the total reported as collected site-based revenues
because the aggregated analysis excluded these countries (Colombia, Cuba, and Venezuela).
Distribution of Revenue by Sources
Site-based generated revenue across most coun-tries in the region was reported as 52.6 million, of which, 39.7 million is from entrance and user fees. This contribution of entrance/user fees represents 76 percent of the total site-based revenue genera-tion (see Figure 3.10).
The second most important source of site-based revenue in the region is concessions, which repre-sents 13 percent of the total. The smallest contribu-tion to revenues comes from payments for the en-vironmental services (PES) provided by PAs, which represent 1 percent of the total site-based revenues in the region. Revenues classified as “Other” rep-resent 10 percent of the total revenues and include funds generated through licenses for hunting, film-ing, photography, and scientific studies, among oth-er activities, as well as revenues collected from fines and confiscations (see Figure 3.10).
Table 3.11 and Figure 3.11 compare the sources of site-based revenues in each country. The con-tribution of entrance fees to site-based PA reve-nues in the region ranges from a minimum of 17 percent (Uruguay) to a maximum of 100 percent (Mexico, Chile, and Paraguay). Results for each revenue source are discussed below.
Figure 3.10. Composition of Site-based PA Revenues – LAC Region
entrance fees
Concessions
peS
Other
©m
ark G
odfre
y/tn
c
Entrance fees
Concessions
PSE
Otros
13% 76%1% 10%
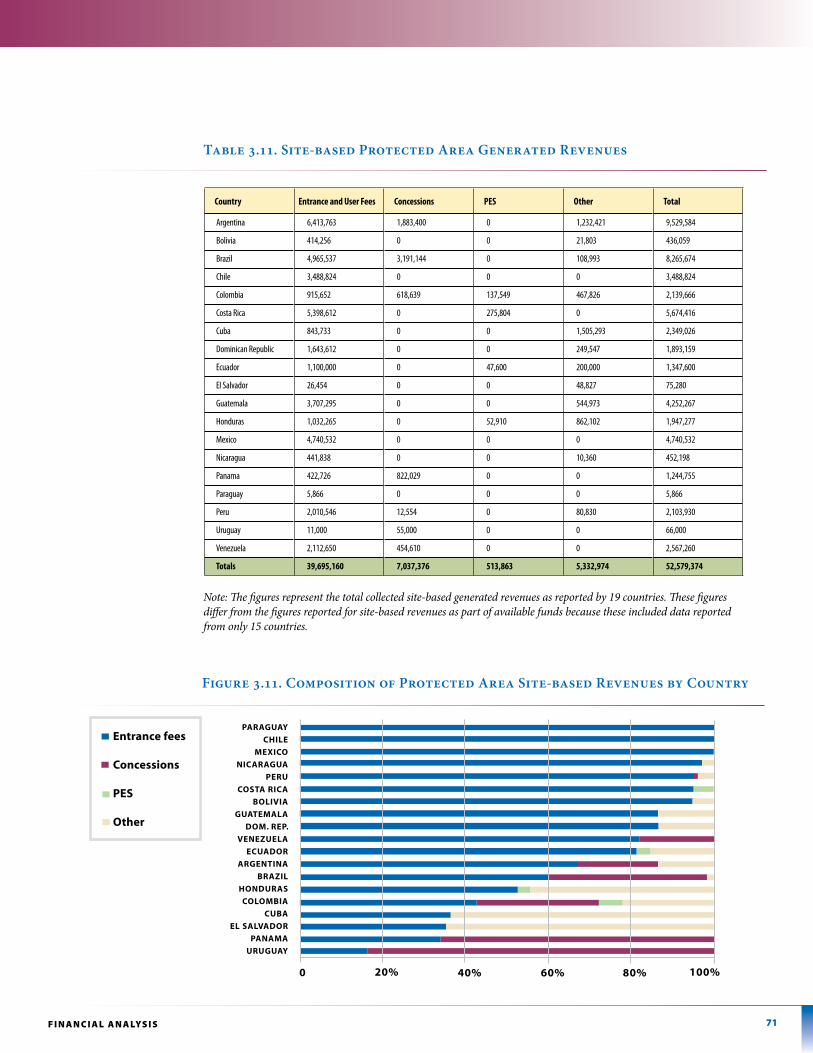
71F i n A n C i A l A n A lys i s
Table 3.11. Site-based Protected Area Generated Revenues
paraGUay
ChILe
MexICO
NICaraGUa
perU
COSta rICa
BOLIVIa
GUateMaLa
DOM. rep.
VeNezUeLa
eCUaDOr
arGeNtINa
BrazIL
hONDUraS
COLOMBIa
CUBa
eL SaLVaDOr
paNaMa
UrUGUay
0 20% 40% 60% 80% 100%
Figure 3.11. Composition of Protected Area Site-based Revenues by Country
entrance fees
Concessions
peS
Other
Note: The figures represent the total collected site-based generated revenues as reported by 19 countries. These figures differ from the figures reported for site-based revenues as part of available funds because these included data reported from only 15 countries.
Country Entrance and User Fees Concessions PES Other Total
argentina 6,413,763 1,883,400 0 1,232,421 9,529,584
Bolivia 414,256 0 0 21,803 436,059
Brazil 4,965,537 3,191,144 0 108,993 8,265,674
chile 3,488,824 0 0 0 3,488,824
colombia 915,652 618,639 137,549 467,826 2,139,666
costa Rica 5,398,612 0 275,804 0 5,674,416
cuba 843,733 0 0 1,505,293 2,349,026
dominican Republic 1,643,612 0 0 249,547 1,893,159
ecuador 1,100,000 0 47,600 200,000 1,347,600
el salvador 26,454 0 0 48,827 75,280
Guatemala 3,707,295 0 0 544,973 4,252,267
Honduras 1,032,265 0 52,910 862,102 1,947,277
mexico 4,740,532 0 0 0 4,740,532
nicaragua 441,838 0 0 10,360 452,198
Panama 422,726 822,029 0 0 1,244,755
Paraguay 5,866 0 0 0 5,866
Peru 2,010,546 12,554 0 80,830 2,103,930
uruguay 11,000 55,000 0 0 66,000
venezuela 2,112,650 454,610 0 0 2,567,260
Totals 39,695,160 7,037,376 513,863 5,332,974 52,579,374
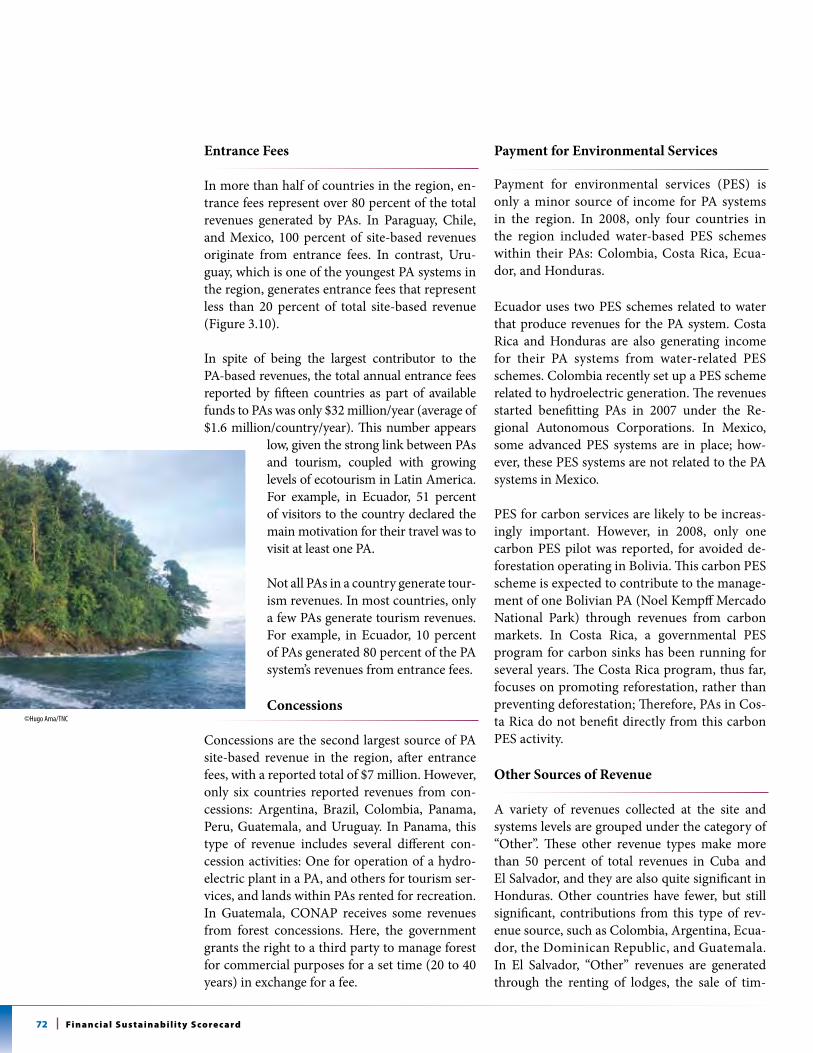
72 Fi n a n c i a l s u s t a i n a b i l i t y s co re c a rd
Entrance Fees
In more than half of countries in the region, en-trance fees represent over 80 percent of the total revenues generated by PAs. In Paraguay, Chile, and Mexico, 100 percent of site-based revenues originate from entrance fees. In contrast, Uru-guay, which is one of the youngest PA systems in the region, generates entrance fees that represent less than 20 percent of total site-based revenue (Figure 3.10).
In spite of being the largest contributor to the PA-based revenues, the total annual entrance fees reported by fifteen countries as part of available funds to PAs was only $32 million/year (average of $1.6 million/country/year). This number appears
low, given the strong link between PAs and tourism, coupled with growing levels of ecotourism in Latin America. For example, in Ecuador, 51 percent of visitors to the country declared the main motivation for their travel was to visit at least one PA.
Not all PAs in a country generate tour-ism revenues. In most countries, only a few PAs generate tourism revenues. For example, in Ecuador, 10 percent of PAs generated 80 percent of the PA system’s revenues from entrance fees.
Concessions
Concessions are the second largest source of PA site-based revenue in the region, after entrance fees, with a reported total of $7 million. However, only six countries reported revenues from con-cessions: Argentina, Brazil, Colombia, Panama, Peru, Guatemala, and Uruguay. In Panama, this type of revenue includes several different con-cession activities: One for operation of a hydro-electric plant in a PA, and others for tourism ser-vices, and lands within PAs rented for recreation. In Guatemala, CONAP receives some revenues from forest concessions. Here, the government grants the right to a third party to manage forest for commercial purposes for a set time (20 to 40 years) in exchange for a fee.
Payment for Environmental Services
Payment for environmental services (PES) is only a minor source of income for PA systems in the region. In 2008, only four countries in the region included water-based PES schemes within their PAs: Colombia, Costa Rica, Ecua-dor, and Honduras.
Ecuador uses two PES schemes related to water that produce revenues for the PA system. Costa Rica and Honduras are also generating income for their PA systems from water-related PES schemes. Colombia recently set up a PES scheme related to hydroelectric generation. The revenues started benefitting PAs in 2007 under the Re-gional Autonomous Corporations. In Mexico, some advanced PES systems are in place; how-ever, these PES systems are not related to the PA systems in Mexico.
PES for carbon services are likely to be increas-ingly important. However, in 2008, only one carbon PES pilot was reported, for avoided de-forestation operating in Bolivia. This carbon PES scheme is expected to contribute to the manage-ment of one Bolivian PA (Noel Kempff Mercado National Park) through revenues from carbon markets. In Costa Rica, a governmental PES program for carbon sinks has been running for several years. The Costa Rica program, thus far, focuses on promoting reforestation, rather than preventing deforestation; Therefore, PAs in Cos-ta Rica do not benefit directly from this carbon PES activity.
Other Sources of Revenue
A variety of revenues collected at the site and systems levels are grouped under the category of “Other”. These other revenue types make more than 50 percent of total revenues in Cuba and El Salvador, and they are also quite significant in Honduras. Other countries have fewer, but still significant, contributions from this type of rev-enue source, such as Colombia, Argentina, Ecua-dor, the Dominican Republic, and Guatemala. In El Salvador, “Other” revenues are generated through the renting of lodges, the sale of tim-
©Hugo arna/tnc
73F i n A n C i A l A n A lys i s
ber and firewood, and the commercialization of other products and services; These revenues are also generated from the sale of hunting licenses and services given by the Environmental Infor-mation System of the Environmental and Natu-ral Resources Ministry. In the case of Honduras, “Other” revenues include donations from people to particular PAs (“founding members of PAs”), as well as the sale of licenses or permits for TV shows (‘reality’ shows), scientific expeditions, and plant harvesting. In Guatemala, “Other” rev-enues are generated through the sale of resource extraction services and hunting licenses. In the Dominican Republic, “Other” revenues are those collected at the PA system level, including re-search permits and licenses.
Significance of Findings
Although in most countries 100 percent of these revenues (fees, concessions, PES schemes, and other site-based opportunities) are invested in PA systems, their contribution is still far from ensuring self-sustainability. The fact that, in most countries, only a few PAs generate tourism rev-enue suggests that entry fees and tourism-related PA revenues have the potential to be increased substantially in many countries. This revenue activity can be accomplished through increas-ing fee levels, improving collection effectiveness, and, where appropriate, promoting increased visitation to select PAs. Therefore, entry fees are not the only area ripe for revenue generation in-creases at the site level.
The Scorecard results show room to increase rev-enues substantially from concessions, since this mechanism is still not being applied in many countries of the region. Concession activity has great potential for revenue generation because concessions are the second largest source for PA-generated revenue in the region.
Payment for environmental services schemes, however promising, have thus far been limited. In spite of high hopes surrounding PES schemes as a potential source of income, this strategy still falls short of becoming a significant PA funding source in the region. This situation may reflect the fact that implementation of PES schemes for
water and biodiversity services has proven to be more complex than originally envisioned. On the other hand, implementing PES schemes for reducing carbon emissions from deforestation and forest degradation (REDD+) is at a very pre-liminary stage. How much the implementation of REDD+ programs will actually contribute to financial sustainability of existing PA systems re-mains to be seen.
Another revenue source that appears to have a good potential for growth are the revenues classified as “Other”, whereby some countries contribute a significant amount to total avail-able PA funds. The variety of types of revenue included under this category shows significant room for expansion and innovation, depend-ing on the particular characteristics of each PA site or system.
In spite of the fact that revenue sources, consid-ered broadly, have only been used at a fraction of their potential, PA site-generated revenues are still significant in reducing government cost burdens for their maintenance. An estimate of the cost recovery for governments, comparing revenues generated with government budget in-vested, is 17 percent on average.
3.2 Funding needs and gaps for protected area systems
Funding Needs
Data Gathered
Financial needs were estimated by this Scorecard process for two management scenarios: basic and optimal. The difference between available fund-ing and the financial needs for basic and optimal management scenarios yields the financial gap. This financial gap — really two gaps, reflecting the basic and optimal scenarios — is an impor-tant part of financial planning.
These two management scenarios effectively cap-ture and standardize levels of management priori-ties, differentiating which programmes and activi-ties are considered fundamental in the short and
The fact that, in
most countries, only
a few PAs generate
tourism revenue
suggests that entry
fees and tourism-
related PA revenues
have the potential
to be increased
substantially ...
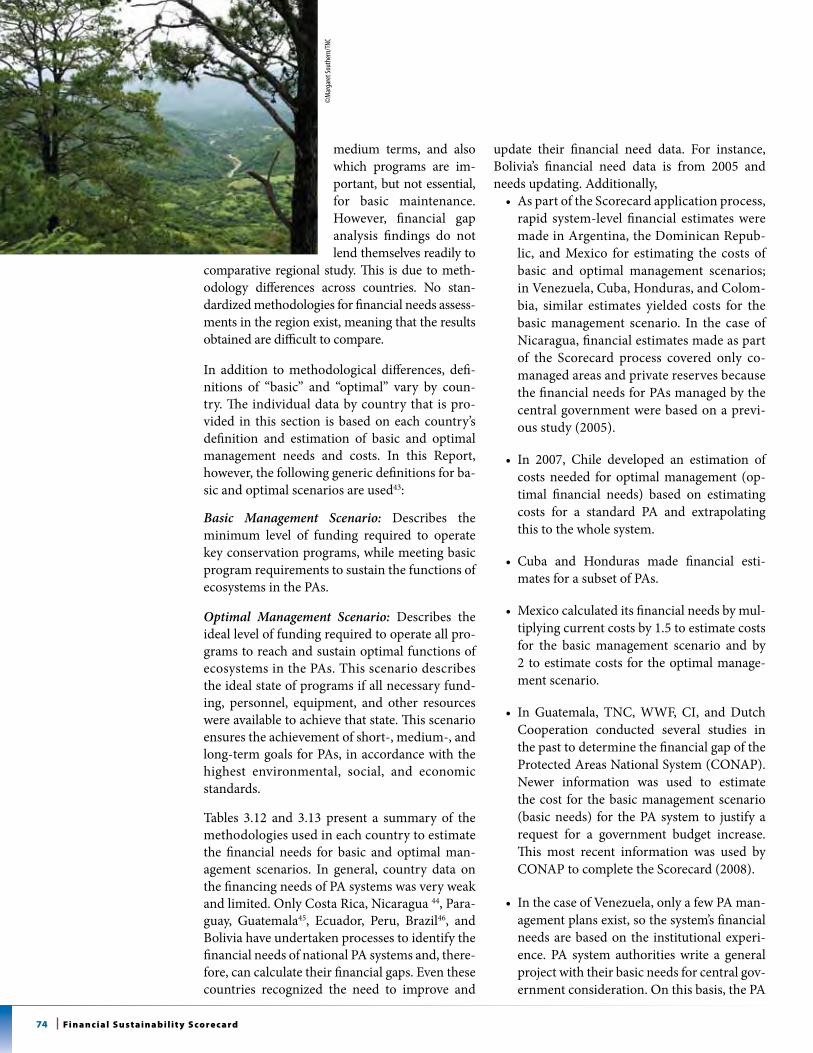
74 Fi n a n c i a l s u s t a i n a b i l i t y s co re c a rd
medium terms, and also which programs are im-portant, but not essential, for basic maintenance. However, financial gap analysis findings do not lend themselves readily to
comparative regional study. This is due to meth-odology differences across countries. No stan-dardized methodologies for financial needs assess-ments in the region exist, meaning that the results obtained are difficult to compare.
In addition to methodological differences, defi-nitions of “basic” and “optimal” vary by coun-try. The individual data by country that is pro-vided in this section is based on each country’s definition and estimation of basic and optimal management needs and costs. In this Report, however, the following generic definitions for ba-sic and optimal scenarios are used43:
Basic Management Scenario: Describes the minimum level of funding required to operate key conservation programs, while meeting basic program requirements to sustain the functions of ecosystems in the PAs.
Optimal Management Scenario: Describes the ideal level of funding required to operate all pro-grams to reach and sustain optimal functions of ecosystems in the PAs. This scenario describes the ideal state of programs if all necessary fund-ing, personnel, equipment, and other resources were available to achieve that state. This scenario ensures the achievement of short-, medium-, and long-term goals for PAs, in accordance with the highest environmental, social, and economic standards.
Tables 3.12 and 3.13 present a summary of the methodologies used in each country to estimate the financial needs for basic and optimal man-agement scenarios. In general, country data on the financing needs of PA systems was very weak and limited. Only Costa Rica, Nicaragua 44, Para-guay, Guatemala45, Ecuador, Peru, Brazil46, and Bolivia have undertaken processes to identify the financial needs of national PA systems and, there-fore, can calculate their financial gaps. Even these countries recognized the need to improve and
update their financial need data. For instance, Bolivia’s financial need data is from 2005 and needs updating. Additionally, • As part of the Scorecard application process,
rapid system-level financial estimates were made in Argentina, the Dominican Repub-lic, and Mexico for estimating the costs of basic and optimal management scenarios; in Venezuela, Cuba, Honduras, and Colom-bia, similar estimates yielded costs for the basic management scenario. In the case of Nicaragua, financial estimates made as part of the Scorecard process covered only co-managed areas and private reserves because the financial needs for PAs managed by the central government were based on a previ-ous study (2005).
• In 2007, Chile developed an estimation ofcosts needed for optimal management (op-timal financial needs) based on estimating costs for a standard PA and extrapolating this to the whole system.
• Cuba and Honduras made financial esti-mates for a subset of PAs.
• Mexicocalculateditsfinancialneedsbymul-tiplying current costs by 1.5 to estimate costs for the basic management scenario and by 2 to estimate costs for the optimal manage-ment scenario.
• InGuatemala, TNC,WWF,CI, andDutchCooperation conducted several studies in the past to determine the financial gap of the Protected Areas National System (CONAP). Newer information was used to estimate the cost for the basic management scenario (basic needs) for the PA system to justify a request for a government budget increase. This most recent information was used by CONAP to complete the Scorecard (2008).
• InthecaseofVenezuela,onlyafewPAman-agement plans exist, so the system’s financial needs are based on the institutional experi-ence. PA system authorities write a general project with their basic needs for central gov-ernment consideration. On this basis, the PA
©m
arga
ret s
outh
ern/
tnc
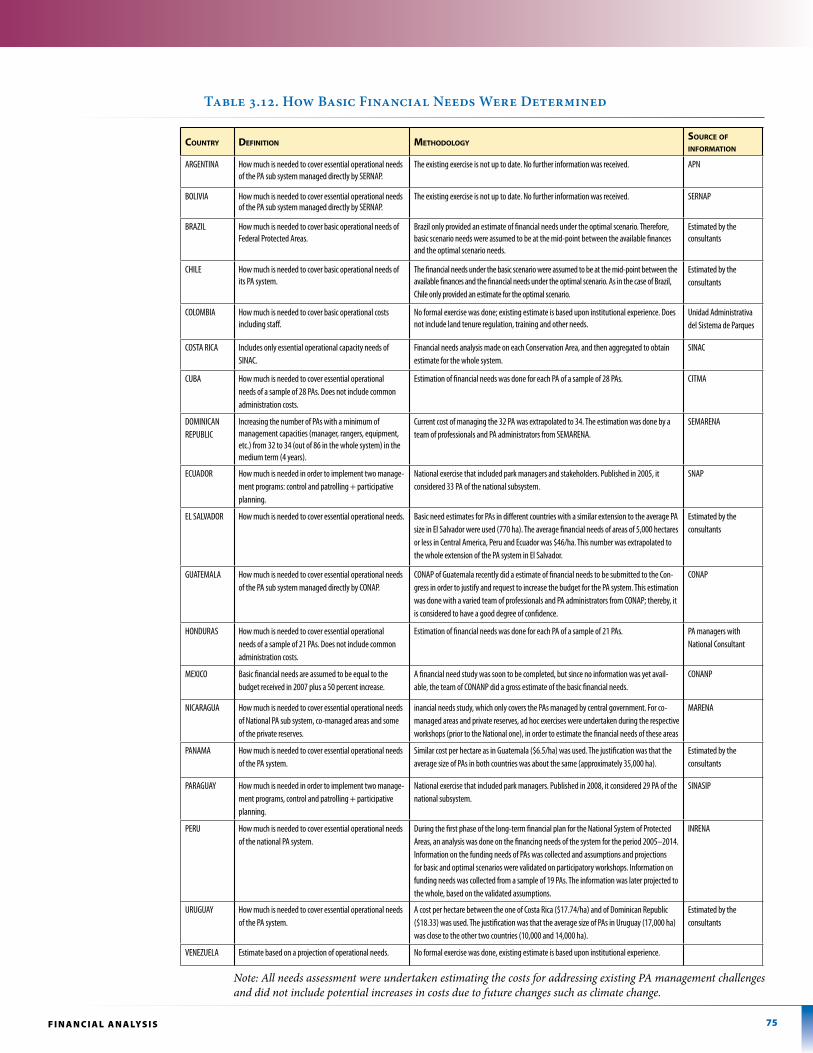
75F i n A n C i A l A n A lys i s
Table 3.12. How Basic Financial Needs Were Determined
country deFinition Methodologysource oF inForMation
aRGentIna How much is needed to cover essential operational needs of the Pa sub system managed directly by seRnaP.
the existing exercise is not up to date. no further information was received. aPn
BolIvIa How much is needed to cover essential operational needs of the Pa sub system managed directly by seRnaP.
the existing exercise is not up to date. no further information was received. seRnaP
BRaZIl How much is needed to cover basic operational needs of Federal Protected areas.
Brazil only provided an estimate of financial needs under the optimal scenario. therefore, basic scenario needs were assumed to be at the mid-point between the available finances and the optimal scenario needs.
estimated by the consultants
cHIle How much is needed to cover basic operational needs of its Pa system.
the financial needs under the basic scenario were assumed to be at the mid-point between the available finances and the financial needs under the optimal scenario. as in the case of Brazil, chile only provided an estimate for the optimal scenario.
estimated by the consultants
colomBIa How much is needed to cover basic operational costs including staff.
no formal exercise was done; existing estimate is based upon institutional experience. does not include land tenure regulation, training and other needs.
unidad administrativa del sistema de Parques
costa RIca Includes only essential operational capacity needs of sInac.
Financial needs analysis made on each conservation area, and then aggregated to obtain estimate for the whole system.
sInac
cuBa How much is needed to cover essential operational needs of a sample of 28 Pas. does not include common administration costs.
estimation of financial needs was done for each Pa of a sample of 28 Pas. cItma
domInIcan RePuBlIc
Increasing the number of Pas with a minimum of management capacities (manager, rangers, equipment, etc.) from 32 to 34 (out of 86 in the whole system) in the medium term (4 years).
current cost of managing the 32 Pa was extrapolated to 34. the estimation was done by a team of professionals and Pa administrators from semaRena.
semaRena
ecuadoR How much is needed in order to implement two manage-ment programs: control and patrolling + participative planning.
national exercise that included park managers and stakeholders. Published in 2005, it considered 33 Pa of the national subsystem.
snaP
el salvadoR How much is needed to cover essential operational needs. Basic need estimates for Pas in different countries with a similar extension to the average Pa size in el salvador were used (770 ha). the average financial needs of areas of 5,000 hectares or less in central america, Peru and ecuador was $46/ha. this number was extrapolated to the whole extension of the Pa system in el salvador.
estimated by the consultants
Guatemala How much is needed to cover essential operational needs of the Pa sub system managed directly by conaP.
conaP of Guatemala recently did a estimate of financial needs to be submitted to the con-gress in order to justify and request to increase the budget for the Pa system. this estimation was done with a varied team of professionals and Pa administrators from conaP; thereby, it is considered to have a good degree of confidence.
conaP
HonduRas How much is needed to cover essential operational needs of a sample of 21 Pas. does not include common administration costs.
estimation of financial needs was done for each Pa of a sample of 21 Pas. Pa managers with national consultant
meXIco Basic financial needs are assumed to be equal to the budget received in 2007 plus a 50 percent increase.
a financial need study was soon to be completed, but since no information was yet avail-able, the team of conanP did a gross estimate of the basic financial needs.
conanP
nIcaRaGua How much is needed to cover essential operational needs of national Pa sub system, co-managed areas and some of the private reserves.
inancial needs study, which only covers the Pas managed by central government. For co-managed areas and private reserves, ad hoc exercises were undertaken during the respective workshops (prior to the national one), in order to estimate the financial needs of these areas
maRena
Panama How much is needed to cover essential operational needs of the Pa system.
similar cost per hectare as in Guatemala ($6.5/ha) was used. the justification was that the average size of Pas in both countries was about the same (approximately 35,000 ha).
estimated by the consultants
PaRaGuay How much is needed in order to implement two manage-ment programs, control and patrolling + participative planning.
national exercise that included park managers. Published in 2008, it considered 29 Pa of the national subsystem.
sInasIP
PeRu How much is needed to cover essential operational needs of the national Pa system.
during the first phase of the long-term financial plan for the national system of Protected areas, an analysis was done on the financing needs of the system for the period 2005–2014. Information on the funding needs of Pas was collected and assumptions and projections for basic and optimal scenarios were validated on participatory workshops. Information on funding needs was collected from a sample of 19 Pas. the information was later projected to the whole, based on the validated assumptions.
InRena
uRuGuay How much is needed to cover essential operational needs of the Pa system.
a cost per hectare between the one of costa Rica ($17.74/ha) and of dominican Republic ($18.33) was used. the justification was that the average size of Pas in uruguay (17,000 ha) was close to the other two countries (10,000 and 14,000 ha).
estimated by the consultants
veneZuela estimate based on a projection of operational needs. no formal exercise was done, existing estimate is based upon institutional experience.
Note: All needs assessment were undertaken estimating the costs for addressing existing PA management challenges and did not include potential increases in costs due to future changes such as climate change.
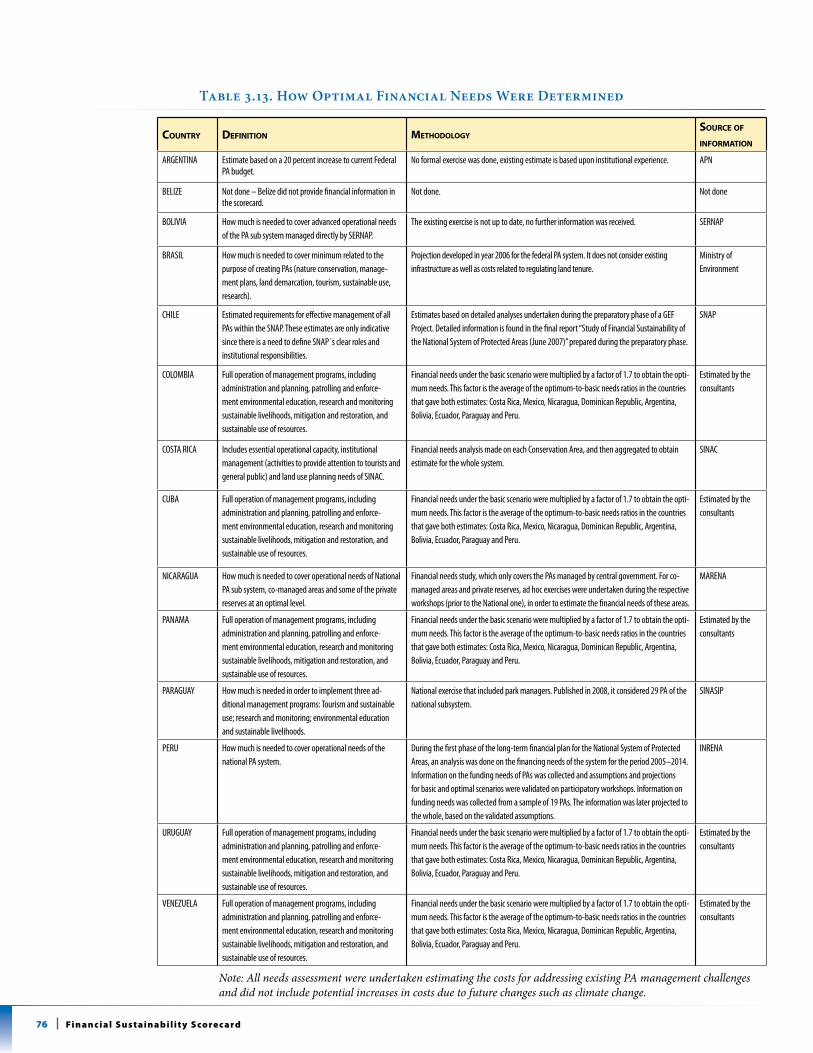
76 Fi n a n c i a l s u s t a i n a b i l i t y s co re c a rd
Table 3.13. How Optimal Financial Needs Were Determined
country deFinition Methodologysource oF inForMation
aRGentIna estimate based on a 20 percent increase to current Federal Pa budget.
no formal exercise was done, existing estimate is based upon institutional experience. aPn
BelIZe not done – Belize did not provide financial information in the scorecard.
not done. not done
BolIvIa How much is needed to cover advanced operational needs of the Pa sub system managed directly by seRnaP.
the existing exercise is not up to date, no further information was received. seRnaP
BRasIl How much is needed to cover minimum related to the purpose of creating Pas (nature conservation, manage-ment plans, land demarcation, tourism, sustainable use, research).
Projection developed in year 2006 for the federal Pa system. It does not consider existing infrastructure as well as costs related to regulating land tenure.
ministry of environment
cHIle estimated requirements for effective management of all Pas within the snaP. these estimates are only indicative since there is a need to define snaP´s clear roles and institutional responsibilities.
estimates based on detailed analyses undertaken during the preparatory phase of a GeF Project. detailed information is found in the final report “study of Financial sustainability of the national system of Protected areas (June 2007)” prepared during the preparatory phase.
snaP
colomBIa Full operation of management programs, including administration and planning, patrolling and enforce-ment environmental education, research and monitoring sustainable livelihoods, mitigation and restoration, and sustainable use of resources.
Financial needs under the basic scenario were multiplied by a factor of 1.7 to obtain the opti-mum needs. this factor is the average of the optimum-to-basic needs ratios in the countries that gave both estimates: costa Rica, mexico, nicaragua, dominican Republic, argentina, Bolivia, ecuador, Paraguay and Peru.
estimated by the consultants
costa RIca Includes essential operational capacity, institutional management (activities to provide attention to tourists and general public) and land use planning needs of sInac.
Financial needs analysis made on each conservation area, and then aggregated to obtain estimate for the whole system.
sInac
cuBa Full operation of management programs, including administration and planning, patrolling and enforce-ment environmental education, research and monitoring sustainable livelihoods, mitigation and restoration, and sustainable use of resources.
Financial needs under the basic scenario were multiplied by a factor of 1.7 to obtain the opti-mum needs. this factor is the average of the optimum-to-basic needs ratios in the countries that gave both estimates: costa Rica, mexico, nicaragua, dominican Republic, argentina, Bolivia, ecuador, Paraguay and Peru.
estimated by the consultants
nIcaRaGua How much is needed to cover operational needs of national Pa sub system, co-managed areas and some of the private reserves at an optimal level.
Financial needs study, which only covers the Pas managed by central government. For co-managed areas and private reserves, ad hoc exercises were undertaken during the respective workshops (prior to the national one), in order to estimate the financial needs of these areas.
maRena
Panama Full operation of management programs, including administration and planning, patrolling and enforce-ment environmental education, research and monitoring sustainable livelihoods, mitigation and restoration, and sustainable use of resources.
Financial needs under the basic scenario were multiplied by a factor of 1.7 to obtain the opti-mum needs. this factor is the average of the optimum-to-basic needs ratios in the countries that gave both estimates: costa Rica, mexico, nicaragua, dominican Republic, argentina, Bolivia, ecuador, Paraguay and Peru.
estimated by the consultants
PaRaGuay How much is needed in order to implement three ad-ditional management programs: tourism and sustainable use; research and monitoring; environmental education and sustainable livelihoods.
national exercise that included park managers. Published in 2008, it considered 29 Pa of the national subsystem.
sInasIP
PeRu How much is needed to cover operational needs of the national Pa system.
during the first phase of the long-term financial plan for the national system of Protected areas, an analysis was done on the financing needs of the system for the period 2005–2014. Information on the funding needs of Pas was collected and assumptions and projections for basic and optimal scenarios were validated on participatory workshops. Information on funding needs was collected from a sample of 19 Pas. the information was later projected to the whole, based on the validated assumptions.
InRena
uRuGuay Full operation of management programs, including administration and planning, patrolling and enforce-ment environmental education, research and monitoring sustainable livelihoods, mitigation and restoration, and sustainable use of resources.
Financial needs under the basic scenario were multiplied by a factor of 1.7 to obtain the opti-mum needs. this factor is the average of the optimum-to-basic needs ratios in the countries that gave both estimates: costa Rica, mexico, nicaragua, dominican Republic, argentina, Bolivia, ecuador, Paraguay and Peru.
estimated by the consultants
veneZuela Full operation of management programs, including administration and planning, patrolling and enforce-ment environmental education, research and monitoring sustainable livelihoods, mitigation and restoration, and sustainable use of resources.
Financial needs under the basic scenario were multiplied by a factor of 1.7 to obtain the opti-mum needs. this factor is the average of the optimum-to-basic needs ratios in the countries that gave both estimates: costa Rica, mexico, nicaragua, dominican Republic, argentina, Bolivia, ecuador, Paraguay and Peru.
estimated by the consultants
Note: All needs assessment were undertaken estimating the costs for addressing existing PA management challenges and did not include potential increases in costs due to future changes such as climate change.
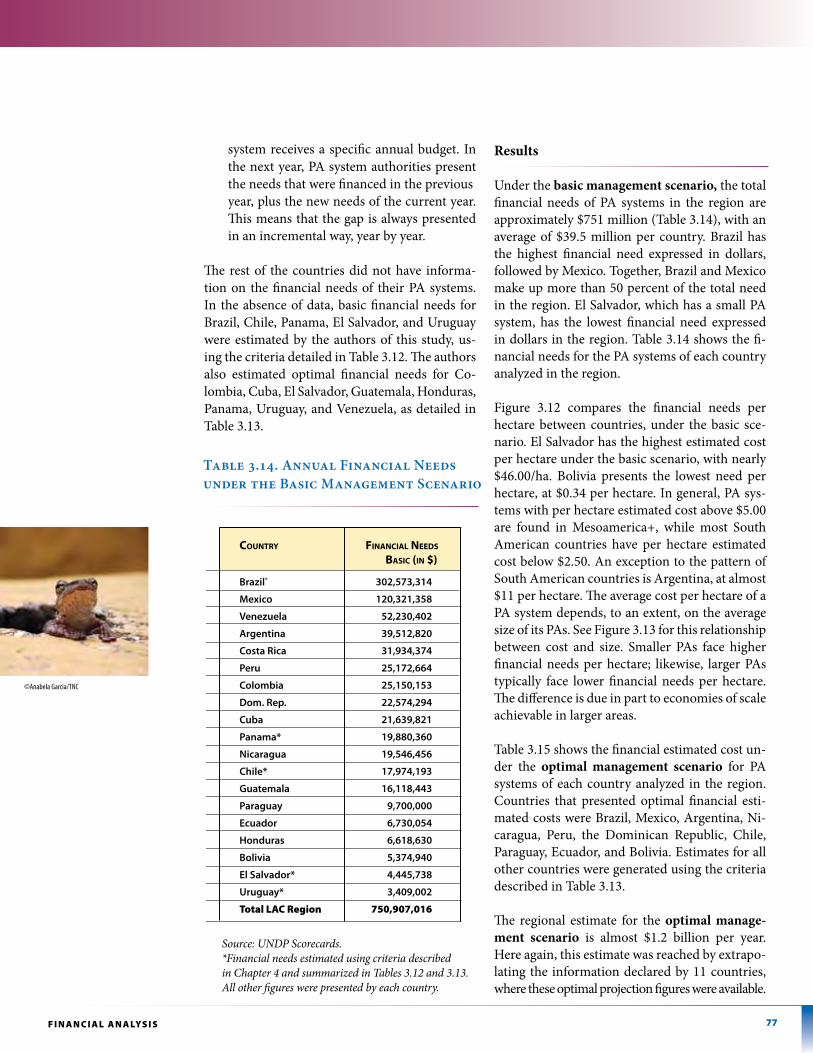
77F i n A n C i A l A n A lys i s
system receives a specific annual budget. In the next year, PA system authorities present the needs that were financed in the previous
year, plus the new needs of the current year. This means that the gap is always presented in an incremental way, year by year.
The rest of the countries did not have informa-tion on the financial needs of their PA systems. In the absence of data, basic financial needs for Brazil, Chile, Panama, El Salvador, and Uruguay were estimated by the authors of this study, us-ing the criteria detailed in Table 3.12. The authors also estimated optimal financial needs for Co-lombia, Cuba, El Salvador, Guatemala, Honduras, Panama, Uruguay, and Venezuela, as detailed in Table 3.13.
Results
Under the basic management scenario, the total financial needs of PA systems in the region are approximately $751 million (Table 3.14), with an average of $39.5 million per country. Brazil has the highest financial need expressed in dollars, followed by Mexico. Together, Brazil and Mexico make up more than 50 percent of the total need in the region. El Salvador, which has a small PA system, has the lowest financial need expressed in dollars in the region. Table 3.14 shows the fi-nancial needs for the PA systems of each country analyzed in the region.
Figure 3.12 compares the financial needs per hectare between countries, under the basic sce-nario. El Salvador has the highest estimated cost per hectare under the basic scenario, with nearly $46.00/ha. Bolivia presents the lowest need per hectare, at $0.34 per hectare. In general, PA sys-tems with per hectare estimated cost above $5.00 are found in Mesoamerica+, while most South American countries have per hectare estimated cost below $2.50. An exception to the pattern of South American countries is Argentina, at almost $11 per hectare. The average cost per hectare of a PA system depends, to an extent, on the average size of its PAs. See Figure 3.13 for this relationship between cost and size. Smaller PAs face higher financial needs per hectare; likewise, larger PAs typically face lower financial needs per hectare. The difference is due in part to economies of scale achievable in larger areas.
Table 3.15 shows the financial estimated cost un-der the optimal management scenario for PA systems of each country analyzed in the region. Countries that presented optimal financial esti-mated costs were Brazil, Mexico, Argentina, Ni-caragua, Peru, the Dominican Republic, Chile, Paraguay, Ecuador, and Bolivia. Estimates for all other countries were generated using the criteria described in Table 3.13.
The regional estimate for the optimal manage-ment scenario is almost $1.2 billion per year. Here again, this estimate was reached by extrapo-lating the information declared by 11 countries, where these optimal projection figures were available.
Table 3.14. Annual Financial Needs under the Basic Management Scenario
Source: UNDP Scorecards.*Financial needs estimated using criteria described in Chapter 4 and summarized in Tables 3.12 and 3.13. All other figures were presented by each country.
Brazil*
Mexico
Venezuela
Argentina
Costa Rica
Peru
Colombia
Dom. Rep.
Cuba
Panama*
Nicaragua
Chile*
Guatemala
Paraguay
Ecuador
Honduras
Bolivia
El Salvador*
Uruguay*
Total lAC Region
302,573,314
120,321,358
52,230,402
39,512,820
31,934,374
25,172,664
25,150,153
22,574,294
21,639,821
19,880,360
19,546,456
17,974,193
16,118,443
9,700,000
6,730,054
6,618,630
5,374,940
4,445,738
3,409,002
750,907,016
country Financial needs
basic (in $)
©anabela Garcia/tnc
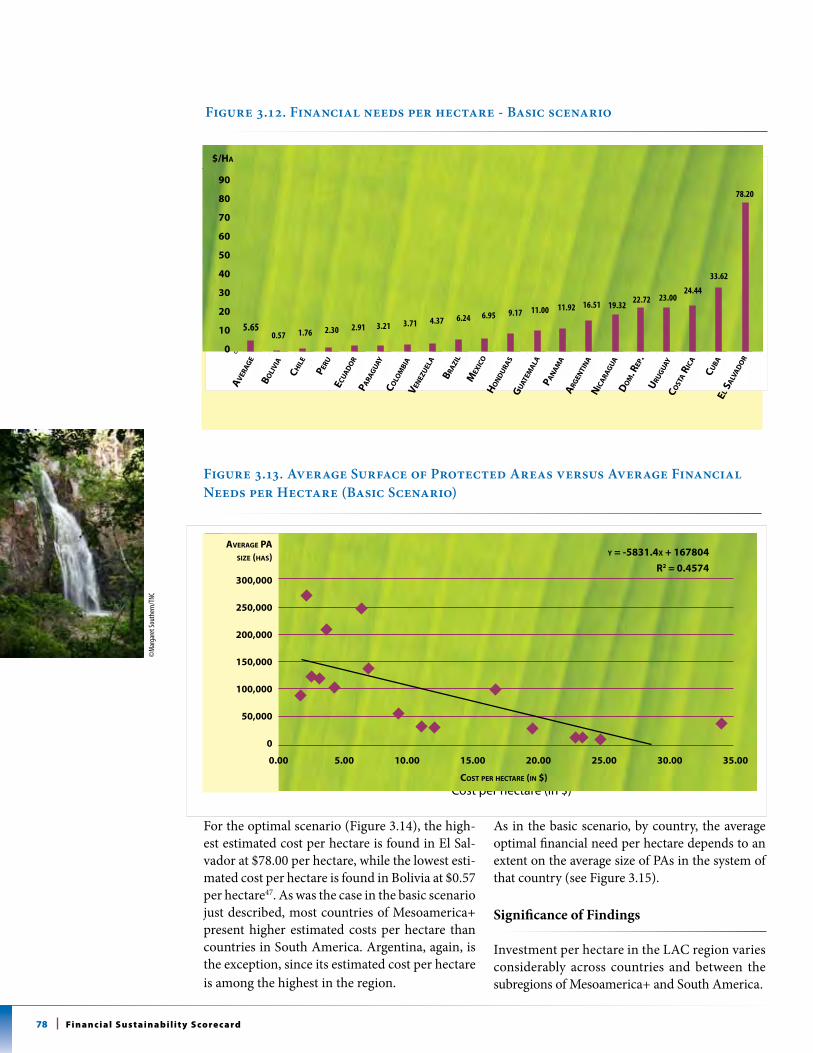
78 Fi n a n c i a l s u s t a i n a b i l i t y s co re c a rd
For the optimal scenario (Figure 3.14), the high-est estimated cost per hectare is found in El Sal-vador at $78.00 per hectare, while the lowest esti-mated cost per hectare is found in Bolivia at $0.57 per hectare47. As was the case in the basic scenario just described, most countries of Mesoamerica+ present higher estimated costs per hectare than countries in South America. Argentina, again, is the exception, since its estimated cost per hectare is among the highest in the region.
As in the basic scenario, by country, the average optimal financial need per hectare depends to an extent on the average size of PAs in the system of that country (see Figure 3.15).
Significance of Findings
Investment per hectare in the LAC region varies considerably across countries and between the subregions of Mesoamerica+ and South America.
Figure 3.13. Average Surface of Protected Areas versus Average Financial Needs per Hectare (Basic Scenario)
y = -5831.4x + 167804
R2 = 0.4574
0
50,000
100,000
150,000
200,000
250,000
300,000
0.00 5.00 10.00 15.00 20.00 25.00 30.00 35.00
Cost per hectare (in $)
Average PA size (has)
300,000
250,000
200,000
150,000
100,000
50,000
0
aVeRaGe pa size (Has)
0.00 5.00 10.00 15.00 20.00 25.00 30.00 35.00
Cost peR HeCtaRe (in $)
y = -5831.4x + 167804
R2 = 0.4574
Figure 3.12. Financial needs per hectare - Basic scenario
5.6473273410.5690993831.7580888612.2997586662.9115755073.2145292773.7118845134.3679487196.2438994956.9467300319.17193434110.9952907811.917
16.5102792219.32098709
22.718781282324.44444444
33.62169512
78.2
0
10
20
30
40
50
60
70
80
90
Average BoliviaChile Peru
Ecuador ParaguayColombiaVenezuela
BrazilMexico
HondurasGuatemalaPanama
ArgentinaNicaraguaDom. Rep.Uruguay
Costa Rica
Cuba
El Salvador
$/Ha
90
80
70
60
50
40
30
20
10
0
aV
eRaG
e
Boli
Via
CHil
e
peRu
eCua
Do
Rpa
RaG
uay
Colo
mBi
aV
enez
uel
a
BRazi
l
mex
iCo
Ho
nD
uRa
sG
uat
ema
la
pan
am
aa
RGen
tin
a
Do
m. R
ep.
uRu
Gu
ayCo
sta R
iCa
CuBa
el sa
lVa
Do
R
$/Ha
niC
aRa
Gu
a
0.57 1.76 2.30 2.91 3.21 3.71 4.37 6.24 6.95 9.17 11.00 11.92 16.51
78.20
33.62
24.4423.0022.72
19.32
5.65
©m
arga
ret s
outh
ern/
tnc
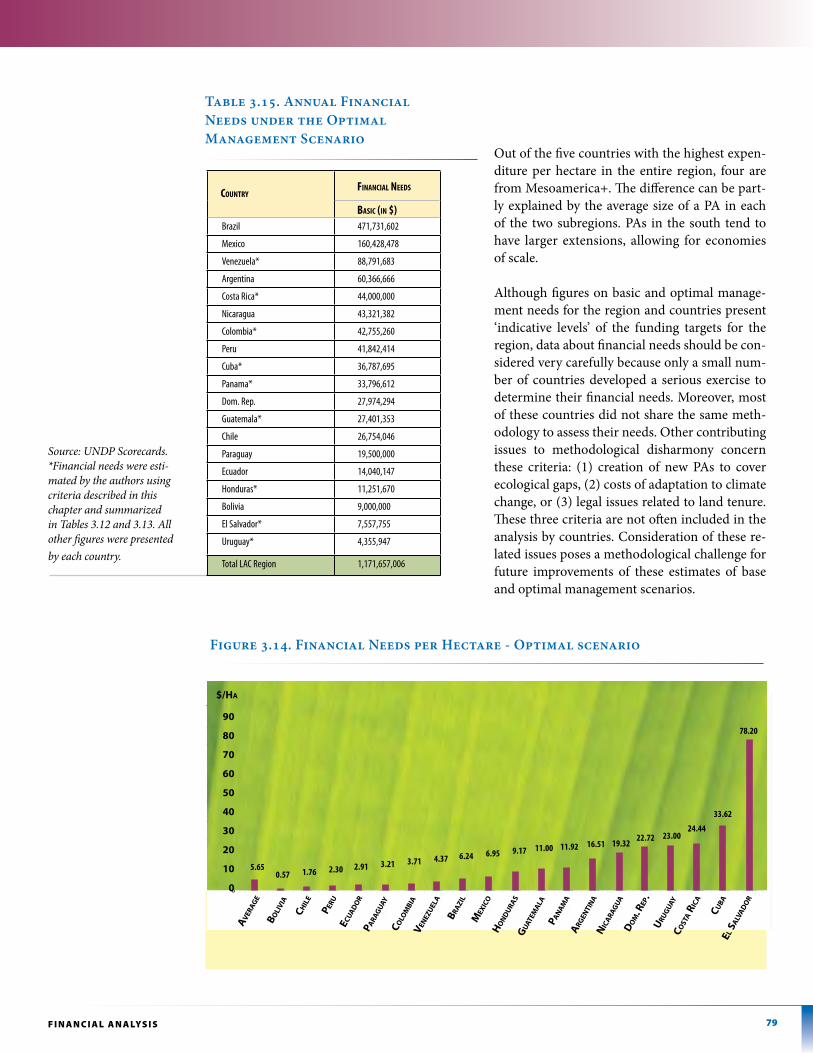
79F i n A n C i A l A n A lys i s
Out of the five countries with the highest expen-diture per hectare in the entire region, four are from Mesoamerica+. The difference can be part-ly explained by the average size of a PA in each of the two subregions. PAs in the south tend to have larger extensions, allowing for economies of scale.
Although figures on basic and optimal manage-ment needs for the region and countries present ‘indicative levels’ of the funding targets for the region, data about financial needs should be con-sidered very carefully because only a small num-ber of countries developed a serious exercise to determine their financial needs. Moreover, most of these countries did not share the same meth-odology to assess their needs. Other contributing issues to methodological disharmony concern these criteria: (1) creation of new PAs to cover ecological gaps, (2) costs of adaptation to climate change, or (3) legal issues related to land tenure. These three criteria are not often included in the analysis by countries. Consideration of these re-lated issues poses a methodological challenge for future improvements of these estimates of base and optimal management scenarios.
Table 3.15. Annual Financial Needs under the Optimal Management Scenario
Source: UNDP Scorecards. *Financial needs were esti-mated by the authors using criteria described in this chapter and summarized in Tables 3.12 and 3.13. All other figures were presented by each country.
Figure 3.14. Financial Needs per Hectare - Optimal scenario
5.6473273410.5690993831.7580888612.2997586662.9115755073.2145292773.7118845134.3679487196.2438994956.9467300319.17193434110.9952907811.917
16.5102792219.32098709
22.718781282324.44444444
33.62169512
78.2
0
10
20
30
40
50
60
70
80
90
Average BoliviaChile Peru
Ecuador ParaguayColombiaVenezuela
BrazilMexico
HondurasGuatemalaPanama
ArgentinaNicaraguaDom. Rep.Uruguay
Costa Rica
Cuba
El Salvador
$/Ha
90
80
70
60
50
40
30
20
10
0
aV
eRaG
e
Boli
Via
CHil
e
peRu
eCua
Do
Rpa
RaG
uay
Colo
mBi
aV
enez
uel
a
BRazi
l
mex
iCo
Ho
nD
uRa
sG
uat
ema
la
pan
am
aa
RGen
tin
a
Do
m. R
ep.
uRu
Gu
ayCo
sta R
iCa
CuBa
el sa
lVa
Do
R
$/Ha
niC
aRa
Gu
a
5.650.57 1.76 2.30 2.91 3.21 3.71 4.37 6.24 6.95 9.17 11.00 11.92 16.51
78.20
33.62
24.4423.0022.72
19.32
Country finAnCiAl needs
BAsiC (in $)Brazil 471,731,602
mexico 160,428,478
venezuela* 88,791,683
argentina 60,366,666
costa Rica* 44,000,000
nicaragua 43,321,382
colombia* 42,755,260
Peru 41,842,414
cuba* 36,787,695
Panama* 33,796,612
dom. Rep. 27,974,294
Guatemala* 27,401,353
chile 26,754,046
Paraguay 19,500,000
ecuador 14,040,147
Honduras* 11,251,670
Bolivia 9,000,000
el salvador* 7,557,755
uruguay* 4,355,947
total lac Region 1,171,657,006
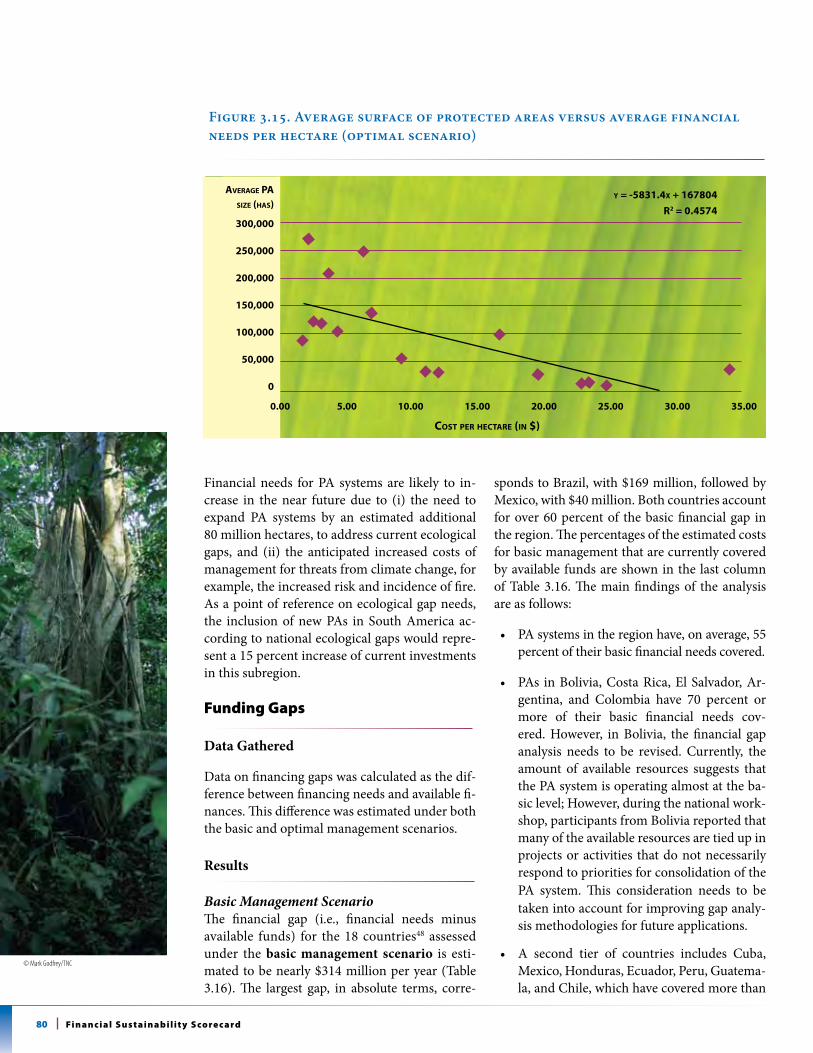
80 Fi n a n c i a l s u s t a i n a b i l i t y s co re c a rd
Financial needs for PA systems are likely to in-crease in the near future due to (i) the need to expand PA systems by an estimated additional 80 million hectares, to address current ecological gaps, and (ii) the anticipated increased costs of management for threats from climate change, for example, the increased risk and incidence of fire. As a point of reference on ecological gap needs, the inclusion of new PAs in South America ac-cording to national ecological gaps would repre-sent a 15 percent increase of current investments in this subregion.
Funding gaps
Data Gathered
Data on financing gaps was calculated as the dif-ference between financing needs and available fi-nances. This difference was estimated under both the basic and optimal management scenarios.
Results
Basic Management ScenarioThe financial gap (i.e., financial needs minus available funds) for the 18 countries48 assessed under the basic management scenario is esti-mated to be nearly $314 million per year (Table 3.16). The largest gap, in absolute terms, corre-
sponds to Brazil, with $169 million, followed by Mexico, with $40 million. Both countries account for over 60 percent of the basic financial gap in the region. The percentages of the estimated costs for basic management that are currently covered by available funds are shown in the last column of Table 3.16. The main findings of the analysis are as follows:
• PAsystemsintheregionhave,onaverage,55 percent of their basic financial needs covered.
• PAs inBolivia,CostaRica,ElSalvador,Ar-gentina, and Colombia have 70 percent or more of their basic financial needs cov-ered. However, in Bolivia, the financial gap analysis needs to be revised. Currently, the amount of available resources suggests that the PA system is operating almost at the ba-sic level; However, during the national work-shop, participants from Bolivia reported that many of the available resources are tied up in projects or activities that do not necessarily respond to priorities for consolidation of the PA system. This consideration needs to be taken into account for improving gap analy-sis methodologies for future applications.
• A second tier of countries includes Cuba,Mexico, Honduras, Ecuador, Peru, Guatema-la, and Chile, which have covered more than
Figure 3.15. Average surface of protected areas versus average financial needs per hectare (optimal scenario)
300,000
250,000
200,000
150,000
100,000
50,000
0
aVeRaGe pa size (Has)
0.00 5.00 10.00 15.00 20.00 25.00 30.00 35.00
Cost peR HeCtaRe (in $)
y = -5831.4x + 167804
R2 = 0.4574
© Mark Godfrey/TNC
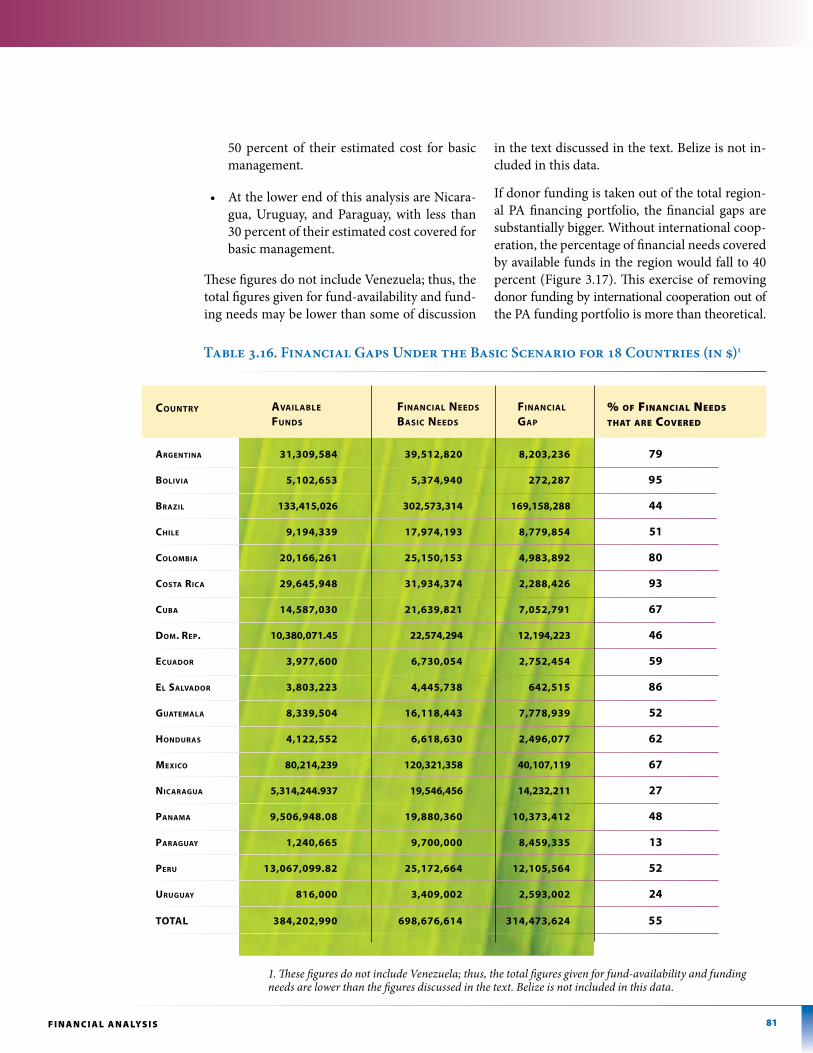
81F i n A n C i A l A n A lys i s
50 percent of their estimated cost for basic management.
• AtthelowerendofthisanalysisareNicara-gua, Uruguay, and Paraguay, with less than 30 percent of their estimated cost covered for basic management.
These figures do not include Venezuela; thus, the total figures given for fund-availability and fund-ing needs may be lower than some of discussion
in the text discussed in the text. Belize is not in-cluded in this data.
If donor funding is taken out of the total region-al PA financing portfolio, the financial gaps are substantially bigger. Without international coop-eration, the percentage of financial needs covered by available funds in the region would fall to 40 percent (Figure 3.17). This exercise of removing donor funding by international cooperation out of the PA funding portfolio is more than theoretical.
Table 3.16. Financial Gaps Under the Basic Scenario for 18 Countries (in $)1
aRGentina 31,309,584 39,512,820 8,203,236 79
BoliVia 5,102,653 5,374,940 272,287 95
BRazil 133,415,026 302,573,314 169,158,288 44
CHile 9,194,339 17,974,193 8,779,854 51
ColomBia 20,166,261 25,150,153 4,983,892 80
Costa RiCa 29,645,948 31,934,374 2,288,426 93
CuBa 14,587,030 21,639,821 7,052,791 67
Dom. Rep. 10,380,071.45 22,574,294 12,194,223 46
eCuaDoR 3,977,600 6,730,054 2,752,454 59
el salVaDoR 3,803,223 4,445,738 642,515 86
Guatemala 8,339,504 16,118,443 7,778,939 52
HonDuRas 4,122,552 6,618,630 2,496,077 62
mexiCo 80,214,239 120,321,358 40,107,119 67
niCaRaGua 5,314,244.937 19,546,456 14,232,211 27
panama 9,506,948.08 19,880,360 10,373,412 48
paRaGuay 1,240,665 9,700,000 8,459,335 13
peRu 13,067,099.82 25,172,664 12,105,564 52
uRuGuay 816,000 3,409,002 2,593,002 24
total 384,202,990 698,676,614 314,473,624 55
CountRy aVailaBle funDs
finanCial neeDs
BasiC neeDs
finanCial
Gap
% of finanCial needs THaT are Covered
1. These figures do not include Venezuela; thus, the total figures given for fund-availability and funding needs are lower than the figures discussed in the text. Belize is not included in this data.
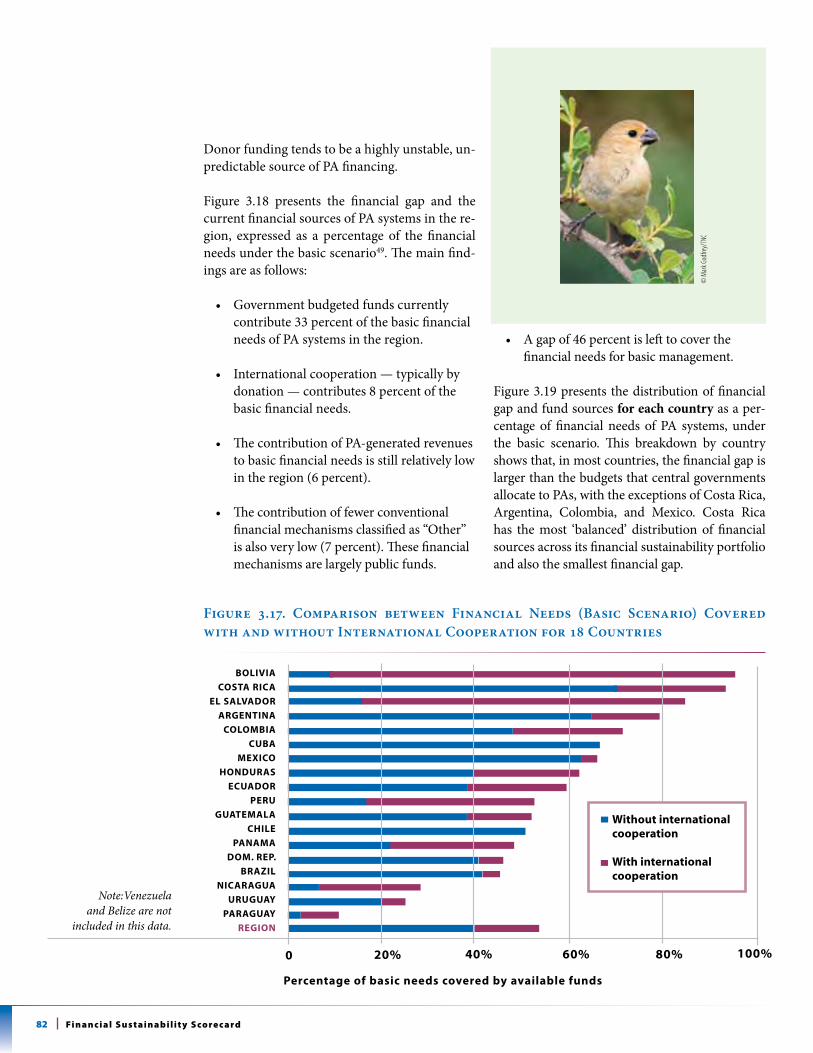
Figure 3.17. Comparison between Financial Needs (Basic Scenario) Covered with and without International Cooperation for 18 Countries
82 Fi n a n c i a l s u s t a i n a b i l i t y s co re c a rd
Donor funding tends to be a highly unstable, un-predictable source of PA financing.
Figure 3.18 presents the financial gap and the current financial sources of PA systems in the re-gion, expressed as a percentage of the financial needs under the basic scenario49. The main find-ings are as follows:
• Governmentbudgetedfundscurrentlycontribute 33 percent of the basic financial needs of PA systems in the region.
• Internationalcooperation—typicallybydonation — contributes 8 percent of the basic financial needs.
• ThecontributionofPA-generatedrevenuesto basic financial needs is still relatively low in the region (6 percent).
• Thecontributionoffewerconventionalfinancial mechanisms classified as “Other” is also very low (7 percent). These financial mechanisms are largely public funds.
• Agapof46percentislefttocoverthefinancial needs for basic management.
Figure 3.19 presents the distribution of financial gap and fund sources for each country as a per-centage of financial needs of PA systems, under the basic scenario. This breakdown by country shows that, in most countries, the financial gap is larger than the budgets that central governments allocate to PAs, with the exceptions of Costa Rica, Argentina, Colombia, and Mexico. Costa Rica has the most ‘balanced’ distribution of financial sources across its financial sustainability portfolio and also the smallest financial gap.
© M
ark Go
dfrey
/TNC
BOLIVIa
COSta rICa
eL SaLVaDOr
arGeNtINa
COLOMBIa
CUBa
MexICO
hONDUraS
eCUaDOr
perU
GUateMaLa
ChILe
paNaMa
DOM. rep.
BrazIL
NICaraGUa
UrUGUay
paraGUay
reGION
0 20% 40% 60% 80% 100%
Without international cooperation
With internationalcooperation
Note:Venezuela and Belize are not
included in this data.
percentage of basic needs covered by available funds
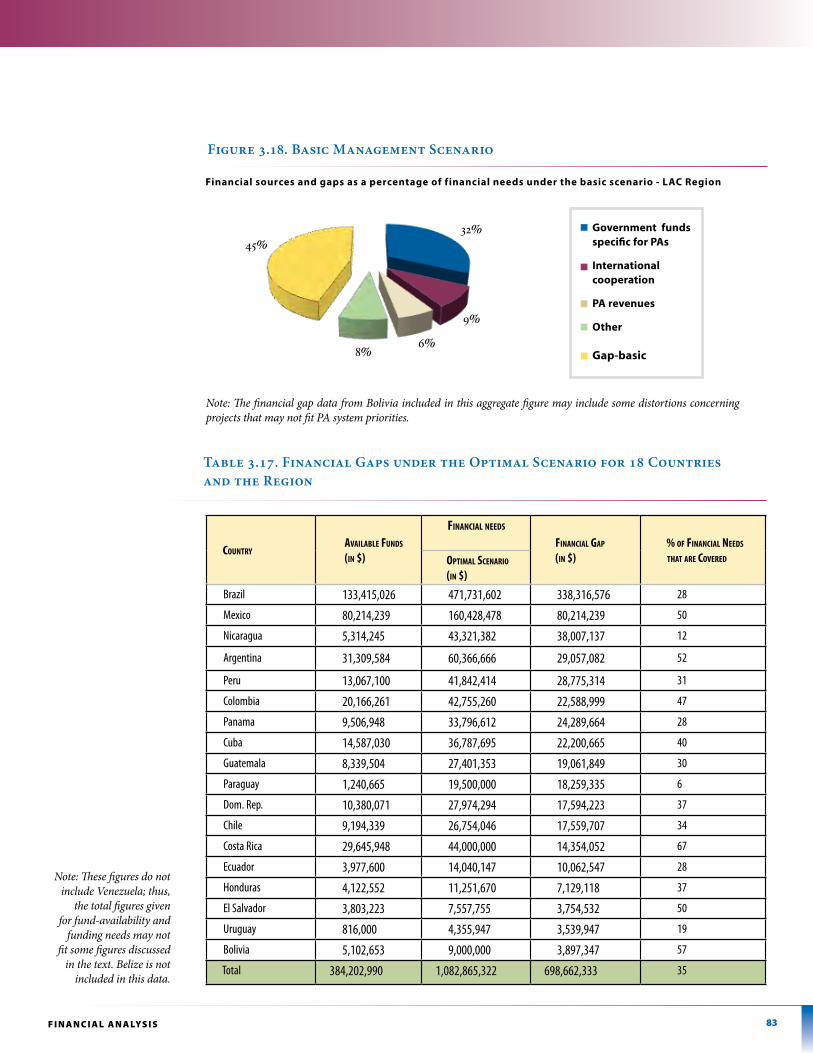
83F i n A n C i A l A n A lys i s
Figure 3.18. Basic Management Scenario
Financial sources and gaps as a percentage of financial needs under the basic scenario - laC region
Government funds specific for PA
International cooperation
PA revenues
"Other"
Gap - basic
Financial sources and gaps as a percentage of financial needs under the basic scenario
LAC region
45%32%
8%6%
9%
Government funds specific for pas
International cooperation
pa revenues
Other
Gap-basic
Note: The financial gap data from Bolivia included in this aggregate figure may include some distortions concerning projects that may not fit PA system priorities.
Note: These figures do not include Venezuela; thus,
the total figures given for fund-availability and
funding needs may not fit some figures discussed
in the text. Belize is not included in this data.
Table 3.17. Financial Gaps under the Optimal Scenario for 18 Countries and the Region
Country AvAilABle funds
(in $)
finAnCiAl needs
finAnCiAl GAp
(in $) % of finAnCiAl needs
thAt Are Covered optimAl sCenArio (in $)
Brazil 133,415,026 471,731,602 338,316,576 28
mexico 80,214,239 160,428,478 80,214,239 50
nicaragua 5,314,245 43,321,382 38,007,137 12
argentina 31,309,584 60,366,666 29,057,082 52
Peru 13,067,100 41,842,414 28,775,314 31
colombia 20,166,261 42,755,260 22,588,999 47
Panama 9,506,948 33,796,612 24,289,664 28
cuba 14,587,030 36,787,695 22,200,665 40
Guatemala 8,339,504 27,401,353 19,061,849 30
Paraguay 1,240,665 19,500,000 18,259,335 6
dom. Rep. 10,380,071 27,974,294 17,594,223 37
chile 9,194,339 26,754,046 17,559,707 34
costa Rica 29,645,948 44,000,000 14,354,052 67
ecuador 3,977,600 14,040,147 10,062,547 28
Honduras 4,122,552 11,251,670 7,129,118 37
el salvador 3,803,223 7,557,755 3,754,532 50
uruguay 816,000 4,355,947 3,539,947 19
Bolivia 5,102,653 9,000,000 3,897,347 57
total 384,202,990 1,082,865,322 698,662,333 35
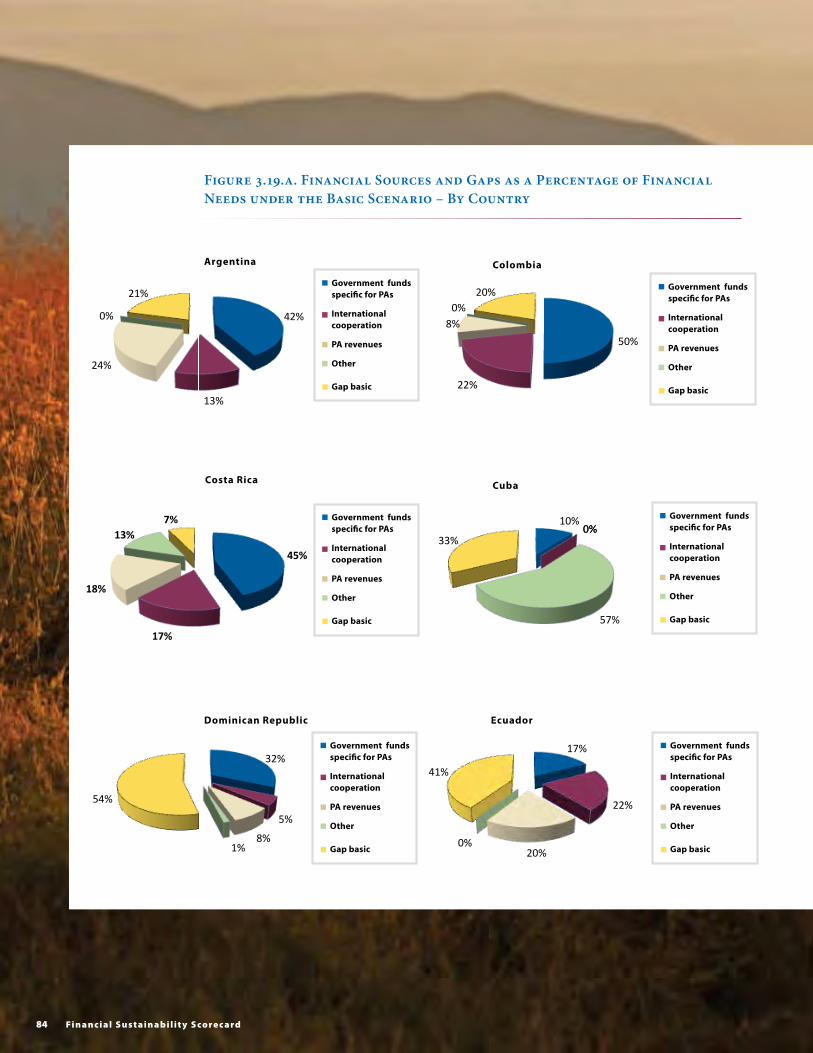
84 Fi n a n c i a l s u s t a i n a b i l i t y s co re c a rd
Government funds specific for pas
International cooperation
pa revenues
Other
Gap basic
Government funds specific for pas
International cooperation
pa revenues
Other
Gap basic
Government funds specific for pas
International cooperation
pa revenues
Other
Gap basic
Government funds specific for pas
International cooperation
pa revenues
Other
Gap basic
Government funds specific for pas
International cooperation
pa revenues
Other
Gap basic
Government funds specific for pas
International cooperation
pa revenues
Other
Gap basic
Figure 3.19.a. Financial Sources and Gaps as a Percentage of Financial Needs under the Basic Scenario – By Country
argentina Colombia
dominican republic ecuador
CubaCosta rica
42%
13%
24%
0%
21%
50%
22%
8% 0%
20%
45%
17%
18%
13% 7% 10%
0% 0%
57%
33%
32%
5%
8% 1%
54%
17%
22%
20% 0%
41%
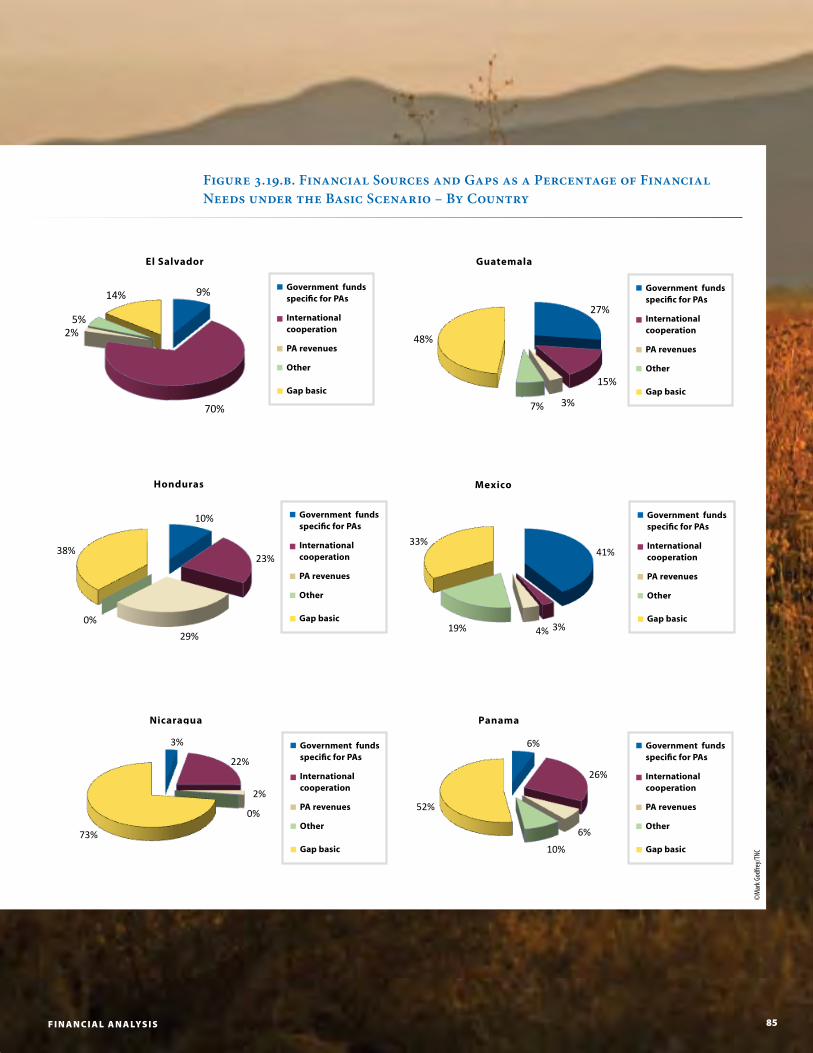
85F i n A n C i A l A n A lys i s
Government funds specific for pas
International cooperation
pa revenues
Other
Gap basic
Government funds specific for pas
International cooperation
pa revenues
Other
Gap basic
Government funds specific for pas
International cooperation
pa revenues
Other
Gap basic
Government funds specific for pas
International cooperation
pa revenues
Other
Gap basic
Government funds specific for pas
International cooperation
pa revenues
Other
Gap basic
Government funds specific for pas
International cooperation
pa revenues
Other
Gap basic
Figure 3.19.b. Financial Sources and Gaps as a Percentage of Financial Needs under the Basic Scenario – By Country
el salvador guatemala
nicaragua
panama
mexicohonduras
9%
70%
2% 5%
14% 27%
15%
3% 7%
48%
10%
23%
29%
0%
38% 41%
3% 4% 19%
33%
3%
22%
2%
0%
73%
6%
26%
6%
10%
52%
panama
©m
ark G
odfre
y/tn
c
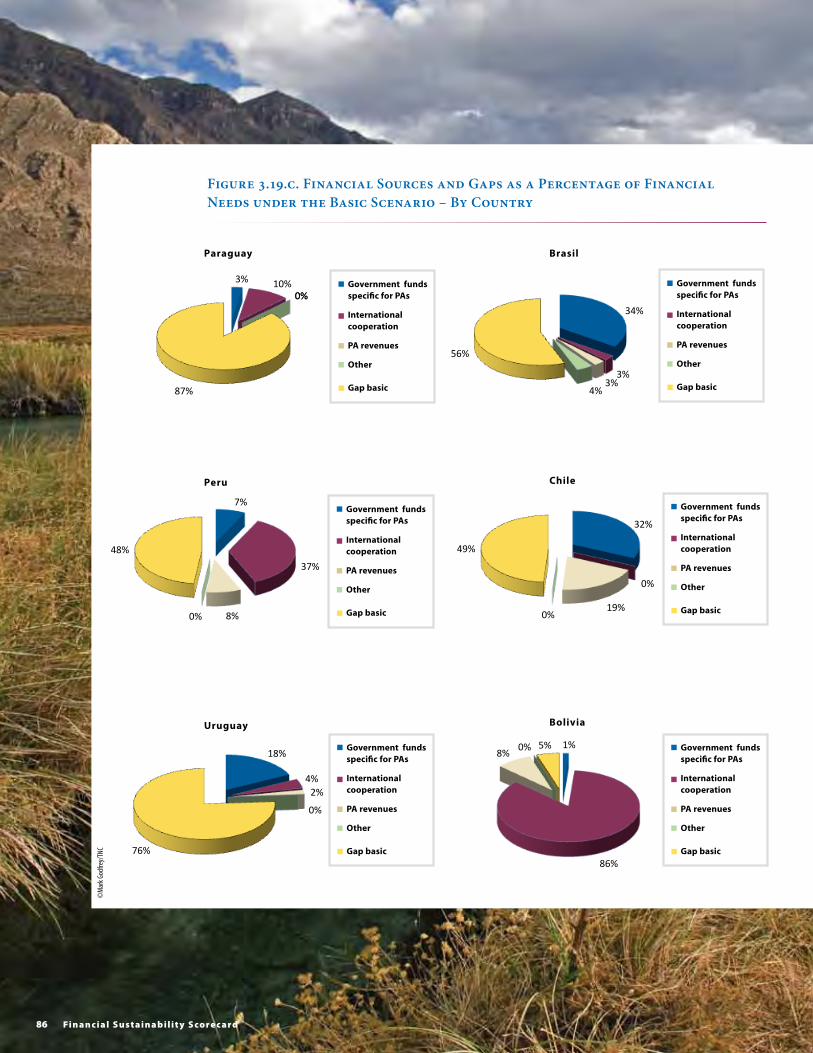
86 Fi n a n c i a l s u s t a i n a b i l i t y s co re c a rd
Government funds specific for pas
International cooperation
pa revenues
Other
Gap basic
Government funds specific for pas
International cooperation
pa revenues
Other
Gap basic
Government funds specific for pas
International cooperation
pa revenues
Other
Gap basic
Government funds specific for pas
International cooperation
pa revenues
Other
Gap basic
Government funds specific for pas
International cooperation
pa revenues
Other
Gap basic
Government funds specific for pas
International cooperation
pa revenues
Other
Gap basic
Figure 3.19.c. Financial Sources and Gaps as a Percentage of Financial Needs under the Basic Scenario – By Country
paraguay Brasil
Uruguay Bolivia
Chileperu
3% 10% 0% 0%
87%
34%
3% 3%
4%
56%
7%
37%
8% 0%
48%
32%
0%
19% 0%
49%
18%
4% 2%
0%
76%
1%
86%
8% 0% 5%
©m
ark G
odfre
y/tn
c
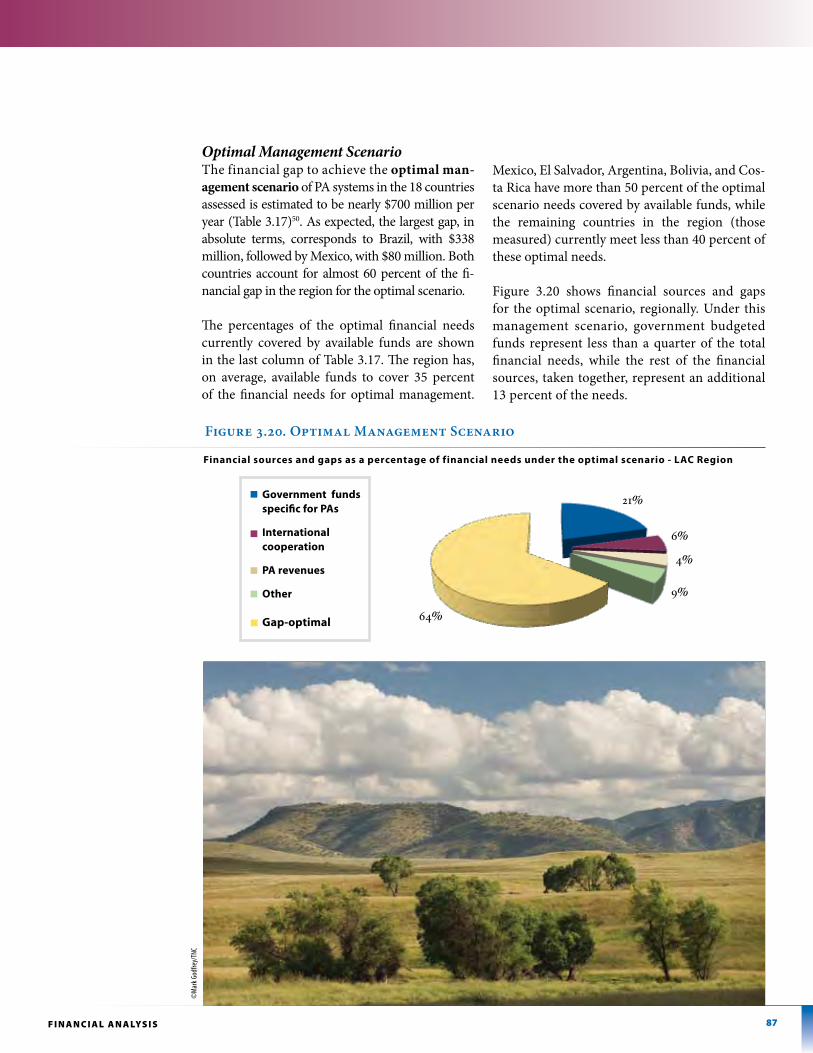
87F i n A n C i A l A n A lys i s
Optimal Management ScenarioThe financial gap to achieve the optimal man-agement scenario of PA systems in the 18 countries assessed is estimated to be nearly $700 million per year (Table 3.17)50. As expected, the largest gap, in absolute terms, corresponds to Brazil, with $338 million, followed by Mexico, with $80 million. Both countries account for almost 60 percent of the fi-nancial gap in the region for the optimal scenario.
The percentages of the optimal financial needs currently covered by available funds are shown in the last column of Table 3.17. The region has, on average, available funds to cover 35 percent of the financial needs for optimal management.
Mexico, El Salvador, Argentina, Bolivia, and Cos-ta Rica have more than 50 percent of the optimal scenario needs covered by available funds, while the remaining countries in the region (those measured) currently meet less than 40 percent of these optimal needs.
Figure 3.20 shows financial sources and gaps for the optimal scenario, regionally. Under this management scenario, government budgeted funds represent less than a quarter of the total financial needs, while the rest of the financial sources, taken together, represent an additional 13 percent of the needs.
Figure 3.20. Optimal Management Scenario
Financial sources and gaps as a percentage of financial needs under the optimal scenario - laC region
Government funds specific for pas
International cooperation
pa revenues
Other
Gap-optimal
©m
ark G
odfre
y/tn
c
Government funds specific for PA
International cooperation
PA revenues
"Other"
Gap - optimal
Financial sources and gaps as a percentage of financial needs under the optimal scenario
LAC region
64%
21%
4%
6%
9%
88 Fi n a n c i a l s u s t a i n a b i l i t y s co re c a rd
significance of Findings
The total regional funding gap of $314 million (excluding Venezuela) under the basic manage-ment scenario and nearly $700 million (exclud-ing Venezuela) under the optimal management scenario for the 18 countries investigated is par-ticularly concerning when one considers that the LAC region contains almost 40 percent of the earth’s biodiversity (see Tables 3.16 (basic) and 3.17 (optimal)).
Moreover, current financial sources are unstable and are at risk of decreasing, since almost 75 percent of available funding relies on govern-mental budgets (61 percent) and international cooperation (14 percent). Both funding sources depend on a number of variables that are out of the control of PA systems. These variables include donor priorities, political regimes, elections, eco-nomic conditions, and so forth. Furthermore, the 75 percent of PA-generated revenue-based income depends on tourism, which is sensitive to conditions like security or natural disasters and a healthy global economy. The only source that offers relative stability, including long-term availability of funds, are trust funds, whose con-tribution is still relatively low, accounting for ap-proximately 7 percent of the total available fund-ing in the region.
Basic management scenario costs could be met if the annual government allocation to PA budgets
in the region increases by a factor of 3 to cover the existing financing gap for basic management of $314 million/year (excluding Venezuela). This current amount of government budgeted funding is equivalent to about only 40c per capita per year. This average figure for the region, however, dif-fers for countries in the region, meaning that not all countries face this relatively ‘do-able’ per capita increase in the government budget fund type.
The five countries closest to funding their basic PA management scenario needs are Bolivia, Costa Rica, El Salvador, Argentina, and Colombia. All of these countries averaged available resources greater than 70 percent of their basic needs. On the other hand, Venezuela, Nicaragua, Uruguay, and Paraguay aver-aged less than 40 percent of their basic needs.
Given the size of these gaps by country and the condition that governments allocate only a small fraction of financial resources to PA, it would seem entirely feasible and affordable for govern-ments to make the necessary budgetary increases to ensure sound PA management.
Summary of Financial Results PA systems in the region received nearly $403 million in 2008 across all fund sources51. This amount equals 0.01 percent of the regional GDP, close to a yearly per capita investment of about 70 cents, which is the average cost of a canned soft drink. Total available funding for PAs in the re-gion is close to the yearly budget of top European football clubs.
When compared to the financing gaps (Table 3.16), these results suggest that the region is cur-rently operating with almost half of the financial capacity needed to achieve what is defined as a basic management scenario for most countries. This situation clearly indicates the urgent need to mobilize additional financial resources for PA conservation across the region.
Chapter 4 builds on this financial discussion of Part I of the Financial Sustainability Scorecard by presenting the results of Part II of the Scorecard. Part II describes the situational context of PAs and PA systems in the region.
©diego ochoa/tnc
89s u s TA i n A b i l i T y A n A lys i s
Introduction
This qualitative analysis complements the quanti-tative analysis of financial data (Part I of the Score-card) presented in Chapter 3, which is, in essence, a set of snapshots by country of PA system financial accounts. Annual financial data in itself does not reveal the underlying structure, health, and future direction of a PA system’s finance. A PA system’s sustainability also depends on the situational con-text that includes the country’s legal, regulatory, and institutional structures; PA access to business planning and management tools; and PA abilities to generate revenue from the system’s lands.
Another limitation on financial analysis con-cerns the present versus mid- and long-term time frames. For example, in one year, a PA could experience a very high level of income due to donor support, a capital injection from a debt-for-nature swap, or a jump in tourism. Similarly, a PA may face extraordinary bud-get pressures to income losses incurred in a number of ways, including a drop in country-budget funds due to economic conditions, ex-penses in the wake of a fire or other disasters, or renewal of capital infrastructure.
T his chapter assesses the structural foundations of what enables and promotes long-term financial improvements for protected areas (PAs). This sustainabil-ity analysis uses Part II of the Financial Sustainability Scorecard for National
Systems of Protected Areas (Scorecard), and the in-country application and workshop process described in Chapter 2.
C h a p t e r 4
sustainability analysis
4.1 Overview of the Structural Foundations of pa Financing
©m
arci
egge
rs/tn
c
90 Fi n a n c i a l s u s t a i n a b i l i t y s co re c a rd
Understanding the situational context permits arranging these financial snapshots into a com-plete and comprehensive “album” that is useful for understanding the structural foundations for PAs in the region and by country.
Part II of the UNDP Scorecard was developed to provide necessary information on the structural foundations of a PA system’s financial sustain-ability. These results are more qualitative than those assessed by Part I of the Scorecard, form-ing a companion analysis. Although Part II of the Scorecard is a qualitative assessment, the meth-odology of the Scorecard provides a structured and standardized approach to score each compo-nent and element that are important to make a PA financing system function effectively.
At the beginning of this chapter, readers are guided by a discussion of the components, ele-ments, and sub-elements of this rigorous qualita-tive analysis. This three-tiered approach ensures that the fine detail of each country’s situational context is revealed. Applying this structure with-in countries as a first step permits two valuable data sets to emerge: first, the rich data, by coun-try, about each country’s particular situational context for PAs and PA systems that permits localized assessment and reform; and, second, when taken together — by region, subregion, and country — an overall LAC picture that be-gins to emerge.
description of the three Components of protected area Financing systems
For the purposes of analyzing PA financial sus-tainability, Part II of the Scorecard breaks down a national PA system into three main components for assessment:
1. Legal, regulatory, and institutional frameworks2. Business planning and tools for cost- effective management3. Tools for revenue generation by protected areas
Next, these components are divided into elements. Elements are described here, with discussion of
the scoring that captures the degree of develop-ment of each element. Scores note the presence — or absence — of these elements by country. Scores range between zero and a top score (usu-ally 3 points).
A note of caution: Country scores generated by Part II of the Scorecard are useful for identify-ing strengths and weaknesses within PA systems. These scores should be considered within the context of each country and are not necessar-ily directly or immediately comparable. Further-more, qualitative scoring lends itself to subjectiv-ity by countries in scoring. Analysis should bear this small subjectivity-artifact in mind. However, the Scorecard elements and sub-elements are structured and sufficiently focused to reduce subjectivity and increase objectivity in present-ing scores. Any comparison of scores should be viewed as an initial preview for identifying trends and then serve as a platform for in-depth exploration by each country. The Scorecard has a comments column to explain each score; this in-formation can be used to better understand and compare country situations.
Component 1: Legal, regulatory, and institutional frameworks
This section analyses and assesses the following elements, each of which is further divided into sub-elements:
• Legal,policy,andregulatorysupportforrevenue generation by PAs
• Legal,policy,andregulatorysupportforrevenue retention and sharing within the PA system
• Legalandregulatoryconditionsforestablishing funds (endowment, sinking, or revolving)
• Legal,policy,andregulatorysupportforalternative institutional arrangements for PA management to reduce cost burden to government
• NationalPAfinancingstrategies• EconomicvaluationofPAsystems
(ecosystem services, tourism-based employment, etc.)
©an
dy d
rum
m/t
nc©
susa
n ell
is/tn
c
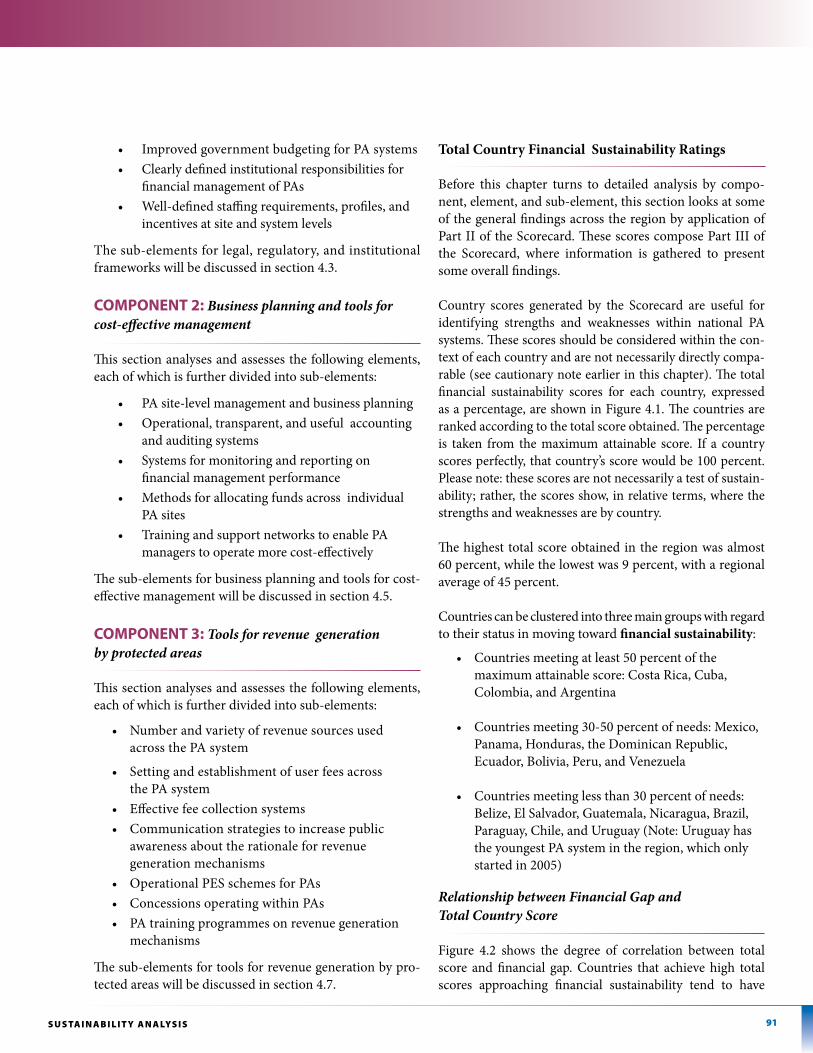
91s u s TA i n A b i l i T y A n A lys i s
• ImprovedgovernmentbudgetingforPAsystems• Clearlydefinedinstitutionalresponsibilitiesfor
financial management of PAs• Well-definedstaffingrequirements,profiles,and
incentives at site and system levels
The sub-elements for legal, regulatory, and institutional frameworks will be discussed in section 4.3.
Component 2: Business planning and tools for cost-effective management
This section analyses and assesses the following elements, each of which is further divided into sub-elements:
• PAsite-levelmanagementandbusinessplanning• Operational,transparent,andusefulaccounting
and auditing systems• Systemsformonitoringandreportingon financial management performance• Methodsforallocatingfundsacrossindividual
PA sites• TrainingandsupportnetworkstoenablePA
managers to operate more cost-effectively
The sub-elements for business planning and tools for cost-effective management will be discussed in section 4.5.
Component 3: Tools for revenue generation by protected areas
This section analyses and assesses the following elements, each of which is further divided into sub-elements:
• Numberandvarietyofrevenuesourcesused across the PA system
• Settingandestablishmentofuserfeesacross the PA system• Effectivefeecollectionsystems• Communicationstrategiestoincreasepublic awareness about the rationale for revenue generation mechanisms• OperationalPESschemesforPAs• ConcessionsoperatingwithinPAs• PAtrainingprogrammesonrevenuegeneration
mechanisms
The sub-elements for tools for revenue generation by pro-tected areas will be discussed in section 4.7.
Total Country Financial Sustainability Ratings
Before this chapter turns to detailed analysis by compo-nent, element, and sub-element, this section looks at some of the general findings across the region by application of Part II of the Scorecard. These scores compose Part III of the Scorecard, where information is gathered to present some overall findings.
Country scores generated by the Scorecard are useful for identifying strengths and weaknesses within national PA systems. These scores should be considered within the con-text of each country and are not necessarily directly compa-rable (see cautionary note earlier in this chapter). The total financial sustainability scores for each country, expressed as a percentage, are shown in Figure 4.1. The countries are ranked according to the total score obtained. The percentage is taken from the maximum attainable score. If a country scores perfectly, that country’s score would be 100 percent. Please note: these scores are not necessarily a test of sustain-ability; rather, the scores show, in relative terms, where the strengths and weaknesses are by country.
The highest total score obtained in the region was almost 60 percent, while the lowest was 9 percent, with a regional average of 45 percent.
Countries can be clustered into three main groups with regard to their status in moving toward financial sustainability:
• Countriesmeetingatleast50percentofthe maximum attainable score: Costa Rica, Cuba, Colombia, and Argentina
• Countriesmeeting30-50percentofneeds:Mexico,Panama, Honduras, the Dominican Republic,
Ecuador, Bolivia, Peru, and Venezuela
• Countriesmeetinglessthan30percentofneeds:Belize, El Salvador, Guatemala, Nicaragua, Brazil, Paraguay, Chile, and Uruguay (Note: Uruguay has the youngest PA system in the region, which only started in 2005)
Relationship between Financial Gap and Total Country Score
Figure 4.2 shows the degree of correlation between total score and financial gap. Countries that achieve high total scores approaching financial sustainability tend to have
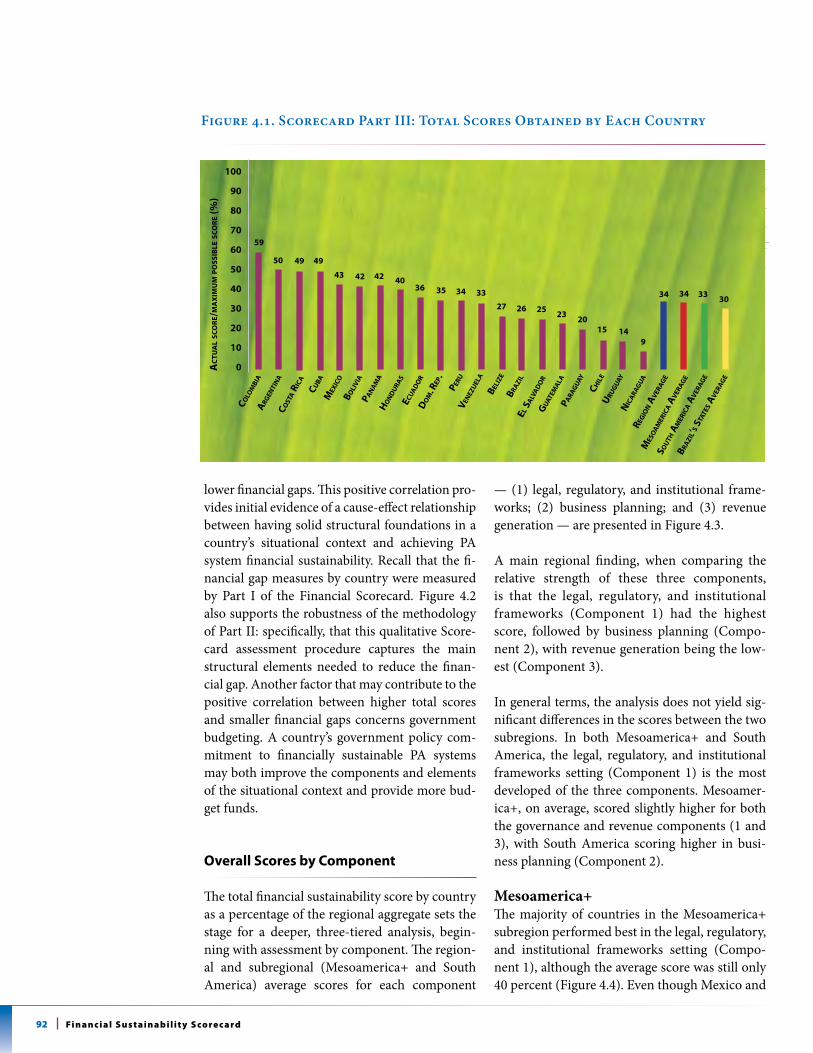
92 Fi n a n c i a l s u s t a i n a b i l i t y s co re c a rd
lower financial gaps. This positive correlation pro-vides initial evidence of a cause-effect relationship between having solid structural foundations in a country’s situational context and achieving PA system financial sustainability. Recall that the fi-nancial gap measures by country were measured by Part I of the Financial Scorecard. Figure 4.2 also supports the robustness of the methodology of Part II: specifically, that this qualitative Score-card assessment procedure captures the main structural elements needed to reduce the finan-cial gap. Another factor that may contribute to the positive correlation between higher total scores and smaller financial gaps concerns government budgeting. A country’s government policy com-mitment to financially sustainable PA systems may both improve the components and elements of the situational context and provide more bud-get funds.
overall scores by Component
The total financial sustainability score by country as a percentage of the regional aggregate sets the stage for a deeper, three-tiered analysis, begin-ning with assessment by component. The region-al and subregional (Mesoamerica+ and South America) average scores for each component
— (1) legal, regulatory, and institutional frame-works; (2) business planning; and (3) revenue generation — are presented in Figure 4.3.
A main regional finding, when comparing the relative strength of these three components, is that the legal, regulatory, and institutional frameworks (Component 1) had the highest score, followed by business planning (Compo-nent 2), with revenue generation being the low-est (Component 3).
In general terms, the analysis does not yield sig-nificant differences in the scores between the two subregions. In both Mesoamerica+ and South America, the legal, regulatory, and institutional frameworks setting (Component 1) is the most developed of the three components. Mesoamer-ica+, on average, scored slightly higher for both the governance and revenue components (1 and 3), with South America scoring higher in busi-ness planning (Component 2).
Mesoamerica+The majority of countries in the Mesoamerica+ subregion performed best in the legal, regulatory, and institutional frameworks setting (Compo-nent 1), although the average score was still only 40 percent (Figure 4.4). Even though Mexico and
Figure 4.1. Scorecard Part III: Total Scores Obtained by Each Country
100
90
80
70
60
50
40
30
20
10
0
aRG
enti
na
Cost
a R
iCa
CuBa
mex
iCo
Boli
Via
pan
am
aH
on
Du
Ras
Do
m. R
ep.
peRu
Ven
ezu
ela
BRazi
lel s
alV
aD
oR
Gu
atem
ala
paRa
Gu
ay
uRu
Gu
ayn
iCa
RaG
ua
mes
oa
meR
iCa a
VeR
aGe
sou
tH a
meR
iCa a
VeR
aGe
BRazi
l’s s
tate
s aV
eRaG
e
Colo
mBi
a
59
50 49
43 42 42 40
49
eCua
Do
R
36 35 34 33
27
Beliz
e
26 2523
2015 14
CHil
e
ReGio
n a
VeR
aGe
9
34 34 3330
aC
tu
al
sC
oR
e/m
ax
imu
m p
os
siB
le s
Co
Re
(%)
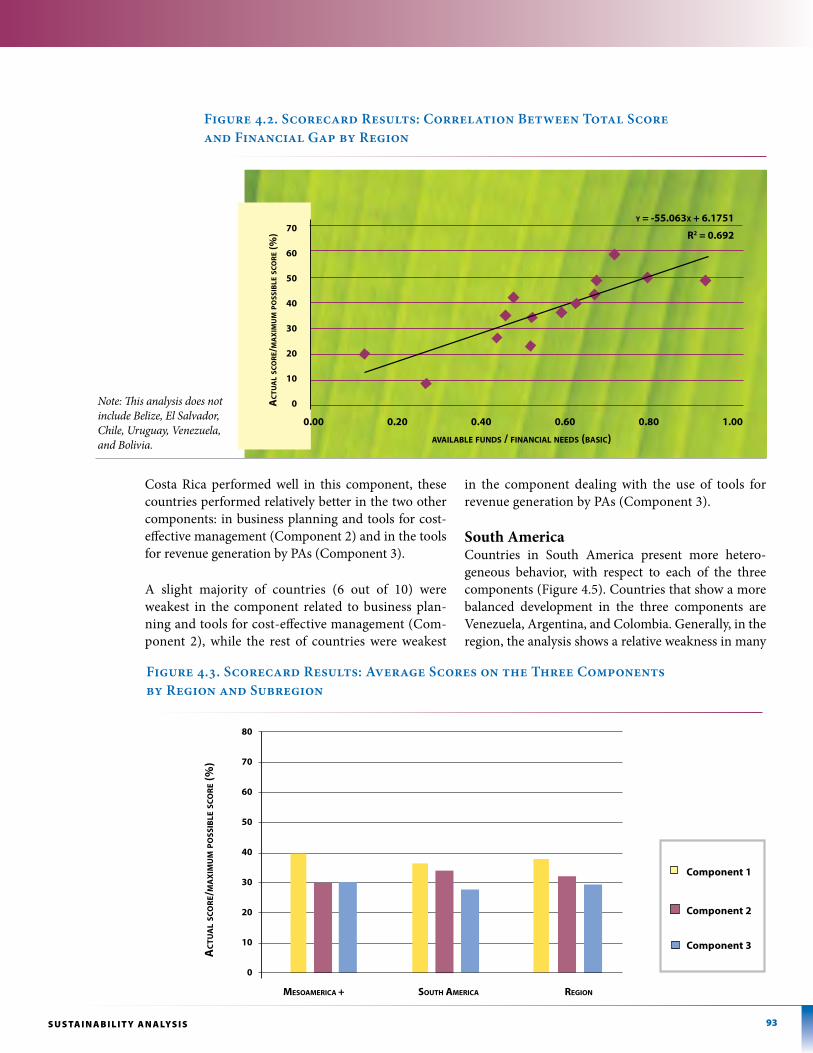
93s u s TA i n A b i l i T y A n A lys i s
Costa Rica performed well in this component, these countries performed relatively better in the two other components: in business planning and tools for cost-effective management (Component 2) and in the tools for revenue generation by PAs (Component 3).
A slight majority of countries (6 out of 10) were weakest in the component related to business plan-ning and tools for cost-effective management (Com-ponent 2), while the rest of countries were weakest
in the component dealing with the use of tools for revenue generation by PAs (Component 3).
South AmericaCountries in South America present more hetero-geneous behavior, with respect to each of the three components (Figure 4.5). Countries that show a more balanced development in the three components are Venezuela, Argentina, and Colombia. Generally, in the region, the analysis shows a relative weakness in many
Note: This analysis does not include Belize, El Salvador, Chile, Uruguay, Venezuela, and Bolivia.
Figure 4.2. Scorecard Results: Correlation Between Total Score and Financial Gap by Region
70
60
50
40
30
20
10
0
0.00 0.20 0.40 0.60 0.80 1.00
aVailaBle funDs / finanCial neeDs (BasiC)
y = -55.063x + 6.1751
R2 = 0.692
Figure 4.3. Scorecard Results: Average Scores on the Three Components by Region and Subregion
mesoameRiCa + soutH ameRiCa ReGion
80
70
60
50
40
30
20
10
0
aC
tu
al
sC
oR
e/m
ax
imu
m p
os
siB
le s
Co
Re
(%)
aC
tu
al
sC
oR
e/m
ax
imu
m p
os
siB
le s
Co
Re
(%)
Component 1
Component 2
Component 3
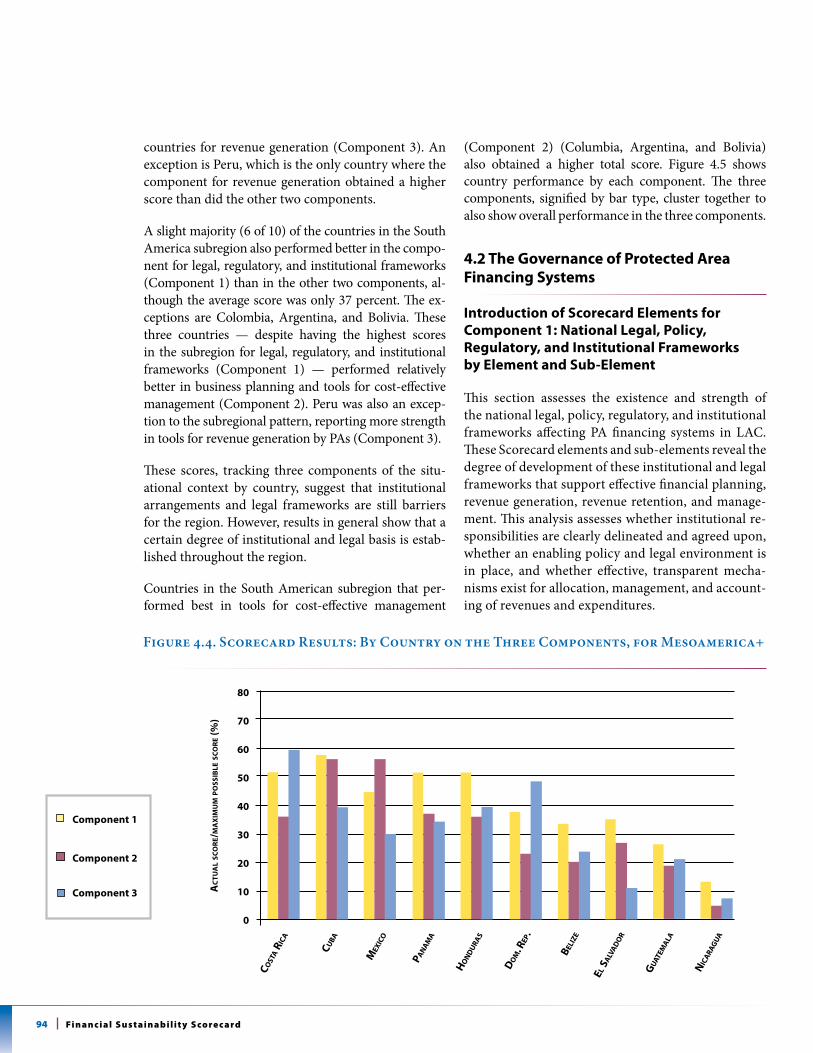
94 Fi n a n c i a l s u s t a i n a b i l i t y s co re c a rd
countries for revenue generation (Component 3). An exception is Peru, which is the only country where the component for revenue generation obtained a higher score than did the other two components.
A slight majority (6 of 10) of the countries in the South America subregion also performed better in the compo-nent for legal, regulatory, and institutional frameworks (Component 1) than in the other two components, al-though the average score was only 37 percent. The ex-ceptions are Colombia, Argentina, and Bolivia. These three countries — despite having the highest scores in the subregion for legal, regulatory, and institutional frameworks (Component 1) — performed relatively better in business planning and tools for cost-effective management (Component 2). Peru was also an excep-tion to the subregional pattern, reporting more strength in tools for revenue generation by PAs (Component 3).
These scores, tracking three components of the situ-ational context by country, suggest that institutional arrangements and legal frameworks are still barriers for the region. However, results in general show that a certain degree of institutional and legal basis is estab-lished throughout the region.
Countries in the South American subregion that per-formed best in tools for cost-effective management
(Component 2) (Columbia, Argentina, and Bolivia) also obtained a higher total score. Figure 4.5 shows country performance by each component. The three components, signified by bar type, cluster together to also show overall performance in the three components.
4.2 the governance of protected area Financing systems
introduction of scorecard elements for Component 1: national legal, policy, regulatory, and institutional Frameworks by element and sub-element
This section assesses the existence and strength of the national legal, policy, regulatory, and institutional frameworks affecting PA financing systems in LAC. These Scorecard elements and sub-elements reveal the degree of development of these institutional and legal frameworks that support effective financial planning, revenue generation, revenue retention, and manage-ment. This analysis assesses whether institutional re-sponsibilities are clearly delineated and agreed upon, whether an enabling policy and legal environment is in place, and whether effective, transparent mecha-nisms exist for allocation, management, and account-ing of revenues and expenditures.
Figure 4.4. Scorecard Results: By Country on the Three Components, for Mesoamerica+
80
70
60
50
40
30
20
10
0
aC
tu
al
sC
oR
e/m
ax
imu
m p
os
siB
le s
Co
Re
(%)
Component 1
Component 2
Component 3
Cost
a R
iCa
CuBa
mex
iCo
pan
am
a
Ho
nD
uRa
s
Do
m. R
ep.
Beliz
e
el sa
lVa
Do
R
Gu
atem
ala
niC
aRa
Gu
a
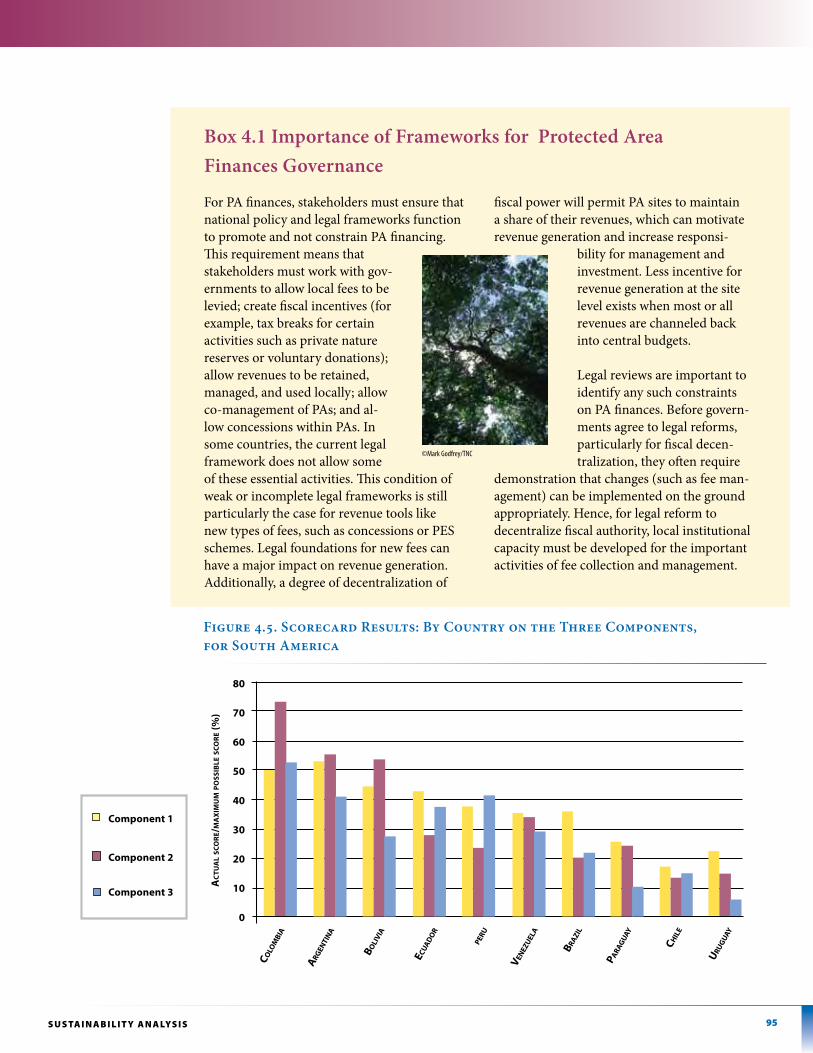
Box 4.1 Importance of Frameworks for Protected Area Finances Governance
For PA finances, stakeholders must ensure that national policy and legal frameworks function to promote and not constrain PA financing. This requirement means that stakeholders must work with gov-ernments to allow local fees to be levied; create fiscal incentives (for example, tax breaks for certain activities such as private nature reserves or voluntary donations); allow revenues to be retained, managed, and used locally; allow co-management of PAs; and al-low concessions within PAs. In some countries, the current legal framework does not allow some of these essential activities. This condition of weak or incomplete legal frameworks is still particularly the case for revenue tools like new types of fees, such as concessions or PES schemes. Legal foundations for new fees can have a major impact on revenue generation. Additionally, a degree of decentralization of
fiscal power will permit PA sites to maintain a share of their revenues, which can motivate revenue generation and increase responsi-
bility for management and investment. Less incentive for revenue generation at the site level exists when most or all revenues are channeled back into central budgets.
Legal reviews are important to identify any such constraints on PA finances. Before govern-ments agree to legal reforms, particularly for fiscal decen-tralization, they often require
demonstration that changes (such as fee man-agement) can be implemented on the ground appropriately. Hence, for legal reform to decentralize fiscal authority, local institutional capacity must be developed for the important activities of fee collection and management.
95s u s TA i n A b i l i T y A n A lys i s
80
70
60
50
40
30
20
10
0
Colo
mBi
a
aRG
enti
na
Boli
Via
eCua
Do
R
peRu
Ven
ezu
ela
BRazi
l
paRa
Gu
ay
CHil
e
uRu
Gu
ay
Figure 4.5. Scorecard Results: By Country on the Three Components, for South America
aC
tu
al
sC
oR
e/m
ax
imu
m p
os
siB
le s
Co
Re
(%)
©mark Godfrey/tnc
Component 1
Component 2
Component 3
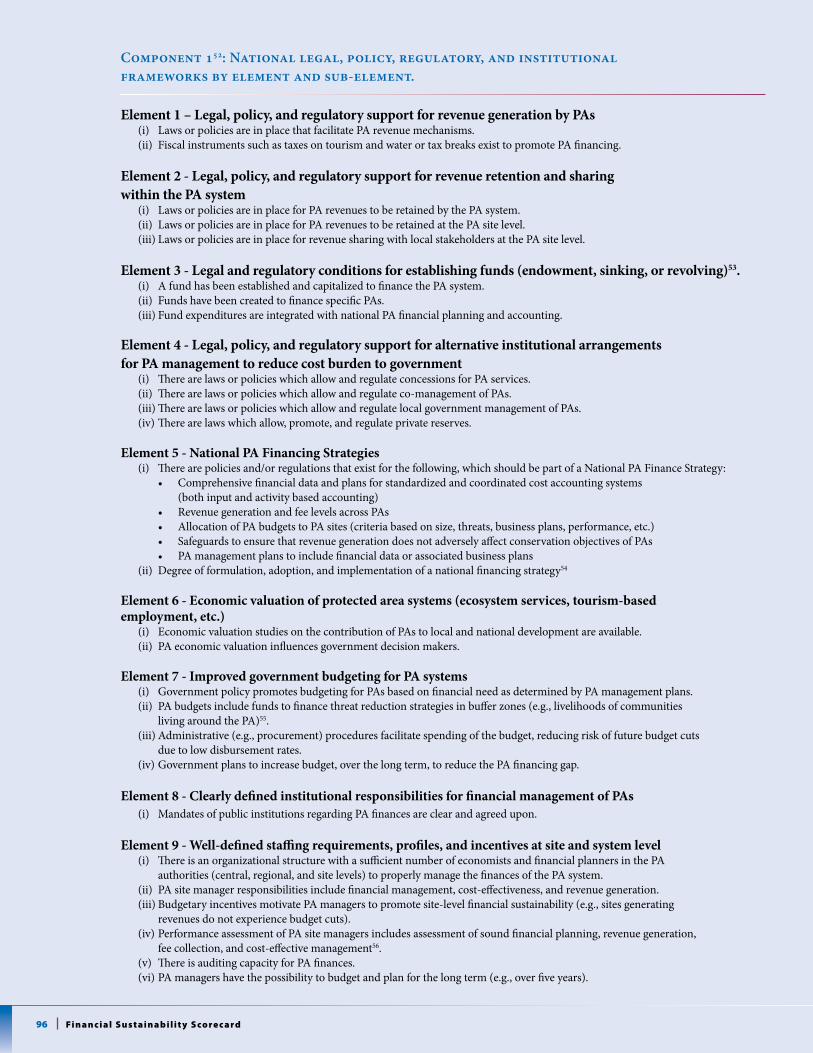
96 Fi n a n c i a l s u s t a i n a b i l i t y s co re c a rd
Component 152: National legal, policy, regulatory, and institutional frameworks by element and sub-element.
Element 1 – Legal, policy, and regulatory support for revenue generation by PAs (i) Laws or policies are in place that facilitate PA revenue mechanisms. (ii) Fiscal instruments such as taxes on tourism and water or tax breaks exist to promote PA financing.
Element 2 - Legal, policy, and regulatory support for revenue retention and sharing within the PA system (i) Laws or policies are in place for PA revenues to be retained by the PA system. (ii) Laws or policies are in place for PA revenues to be retained at the PA site level. (iii) Laws or policies are in place for revenue sharing with local stakeholders at the PA site level.
Element 3 - Legal and regulatory conditions for establishing funds (endowment, sinking, or revolving)53. (i) A fund has been established and capitalized to finance the PA system. (ii) Funds have been created to finance specific PAs. (iii) Fund expenditures are integrated with national PA financial planning and accounting.
Element 4 - Legal, policy, and regulatory support for alternative institutional arrangements for PA management to reduce cost burden to government (i) There are laws or policies which allow and regulate concessions for PA services. (ii) There are laws or policies which allow and regulate co-management of PAs. (iii) There are laws or policies which allow and regulate local government management of PAs. (iv) There are laws which allow, promote, and regulate private reserves.
Element 5 - National PA Financing Strategies (i) There are policies and/or regulations that exist for the following, which should be part of a National PA Finance Strategy: • Comprehensivefinancialdataandplansforstandardizedandcoordinatedcostaccountingsystems (both input and activity based accounting) • RevenuegenerationandfeelevelsacrossPAs • AllocationofPAbudgetstoPAsites(criteriabasedonsize,threats,businessplans,performance,etc.) • SafeguardstoensurethatrevenuegenerationdoesnotadverselyaffectconservationobjectivesofPAs • PAmanagementplanstoincludefinancialdataorassociatedbusinessplans (ii) Degree of formulation, adoption, and implementation of a national financing strategy54
Element 6 - Economic valuation of protected area systems (ecosystem services, tourism-based employment, etc.) (i) Economic valuation studies on the contribution of PAs to local and national development are available. (ii) PA economic valuation influences government decision makers.
Element 7 - Improved government budgeting for PA systems (i) Government policy promotes budgeting for PAs based on financial need as determined by PA management plans. (ii) PA budgets include funds to finance threat reduction strategies in buffer zones (e.g., livelihoods of communities living around the PA)55. (iii) Administrative (e.g., procurement) procedures facilitate spending of the budget, reducing risk of future budget cuts due to low disbursement rates. (iv) Government plans to increase budget, over the long term, to reduce the PA financing gap.
Element 8 - Clearly defined institutional responsibilities for financial management of PAs (i) Mandates of public institutions regarding PA finances are clear and agreed upon.
Element 9 - Well-defined staffing requirements, profiles, and incentives at site and system level (i) There is an organizational structure with a sufficient number of economists and financial planners in the PA authorities (central, regional, and site levels) to properly manage the finances of the PA system. (ii) PA site manager responsibilities include financial management, cost-effectiveness, and revenue generation. (iii) Budgetary incentives motivate PA managers to promote site-level financial sustainability (e.g., sites generating revenues do not experience budget cuts). (iv) Performance assessment of PA site managers includes assessment of sound financial planning, revenue generation, fee collection, and cost-effective management56. (v) There is auditing capacity for PA finances. (vi) PA managers have the possibility to budget and plan for the long term (e.g., over five years).
97s u s TA i n A b i l i T y A n A lys i s
regional performance and Key Findings for protected area Financing governance Frameworks
The Latin American and Caribbean region, in general, showed the greatest strength in some aspects related to PA financing governance frameworks. Nonetheless, the average performance in the region for the overall governance framework component met less than 40 percent of needs. This average score — and the find-ing that the country with the highest score for the governance framework achieved less than 60 percent — indicates that gaps and inconsistencies exist in the region’s legal and institutional frameworks. These gaps and inconsistencies need to be addressed by country and by the region.
Figures 4.6 and 4.7 show the results obtained on the governance frameworks of PA financing systems as-sessed in each country. The data also includes infor-mation from the PA systems of five Brazilian states. Countries that met more than 50 percent of needs were Cuba, Costa Rica, Panama, Honduras, Argentina, and Colombia. Countries that achieved less than 30 per-cent needs in the governance framework of Compo-nent 1 were Guatemala, Nicaragua, Paraguay, Uruguay, and Chile. No country in the LAC region scored under 10 percent.
Figure 4.8 shows the scores obtained in each of the nine elements that make up the governance framework (Component 1). These are the average scores of the 20 countries in Mesoamerica+ and South America that completed Part II of the Scorecard. As Figure 4.8 shows,
• The rudimentary governance conditions for op-erational PA financing systems are in place in many countries. This finding provides clarity on institution-al arrangements for PA finances and the legal frame-works for alternative management arrangements for PAs, such as co-management or private reserves.
• EconomicvaluationofthenaturalresourcesinPAsis still very limited.
• Staffcapacityandrevenueretentionatthesitelevelare also relatively weak elements for PA financial governance.
Table 4.1 presents the results for each country by each of the nine elements that constitute Component 1.
Key findings about the elements in Component 1: National legal, policy, regulatory, and institutional framework. Findings by sub-elements are discussed following this overview analysis.
• Laws for revenue generation by PAs: Countries in both Mesoamerica+ and South America achieved an average score of 40 percent for Element 1, indi-cating that in general PAs are permitted legally to generate revenues. However, a common denomi-nator in the region reveals that while general laws support revenue generation by PAs, specific regu-lations and operational guidelines are lacking that would support implementation of these laws. Also, newer revenue mechanisms such as PES and con-cessions are still sometimes legally constrained.
• Laws for revenue retention and sharing: Most countries have some sort of policies or laws for revenue retention at the PA system levels (Element 2). However, a similar policy mechanism for reve-nue retention at PA sites is less common. This lack of revenue retention structure at the PA level led the region to have an average score of 35 percent in this element.
• Legal and regulatory conditions for establish-ing trust funds: The range of results obtained for Element 3 varied widely in the region. Half of the countries in the region, equally distributed between Mesoamerica+ and South America, ob-tained scores of more than 50 percent. However, six countries obtained scores of 0 percent, showing that these countries have not yet introduced any legal frameworks to permit trust funds.
• Alternative institutional arrangements for PAs: These mechanisms are relatively well es-tablished in the region, particularly for co-management of PAs, thus pushing the score of Element 4 to the second highest of the nine ele-ments in this Component.
©m
ark G
odfre
y/tn
c
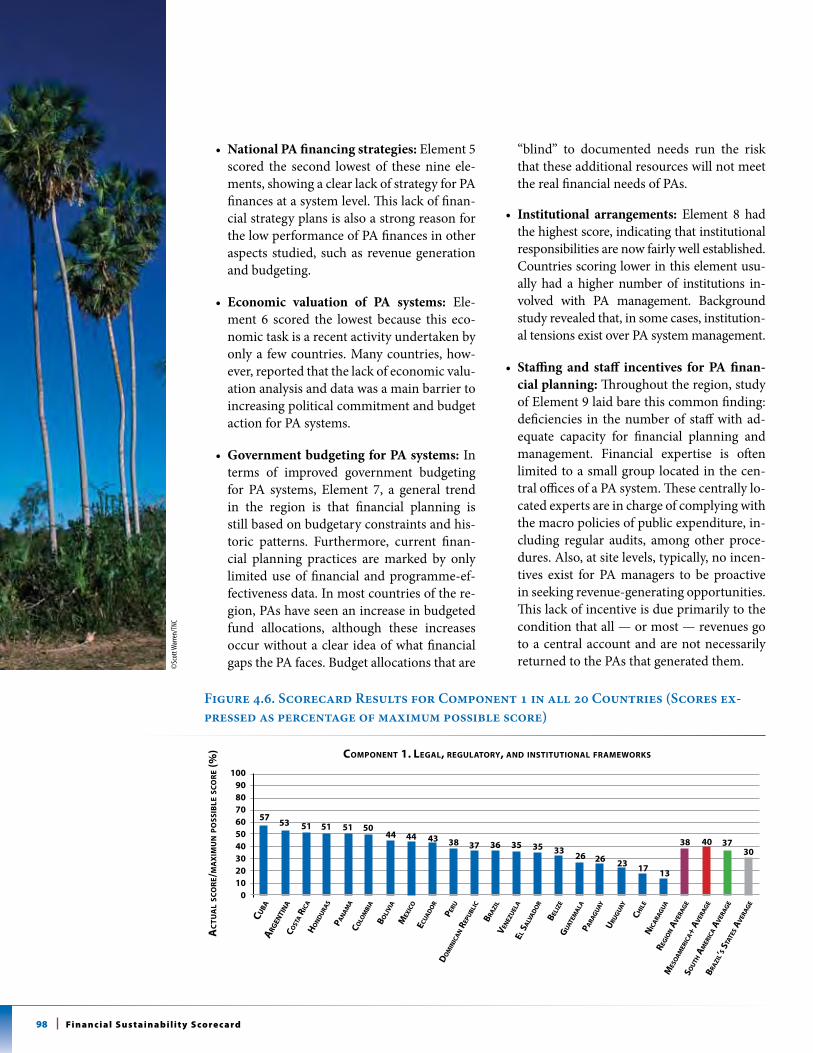
98 Fi n a n c i a l s u s t a i n a b i l i t y s co re c a rd
• National PA financing strategies: Element 5 scored the second lowest of these nine ele-ments, showing a clear lack of strategy for PA finances at a system level. This lack of finan-cial strategy plans is also a strong reason for the low performance of PA finances in other aspects studied, such as revenue generation and budgeting.
• Economic valuation of PA systems: Ele-ment 6 scored the lowest because this eco-nomic task is a recent activity undertaken by only a few countries. Many countries, how-ever, reported that the lack of economic valu-ation analysis and data was a main barrier to increasing political commitment and budget action for PA systems.
• Government budgeting for PA systems: In terms of improved government budgeting for PA systems, Element 7, a general trend in the region is that financial planning is still based on budgetary constraints and his-toric patterns. Furthermore, current finan-cial planning practices are marked by only limited use of financial and programme-ef-fectiveness data. In most countries of the re-gion, PAs have seen an increase in budgeted fund allocations, although these increases occur without a clear idea of what financial gaps the PA faces. Budget allocations that are
“blind” to documented needs run the risk that these additional resources will not meet the real financial needs of PAs.
• Institutional arrangements: Element 8 had the highest score, indicating that institutional responsibilities are now fairly well established. Countries scoring lower in this element usu-ally had a higher number of institutions in-volved with PA management. Background study revealed that, in some cases, institution-al tensions exist over PA system management.
• Staffing and staff incentives for PA finan-cial planning: Throughout the region, study of Element 9 laid bare this common finding: deficiencies in the number of staff with ad-equate capacity for financial planning and management. Financial expertise is often limited to a small group located in the cen-tral offices of a PA system. These centrally lo-cated experts are in charge of complying with the macro policies of public expenditure, in-cluding regular audits, among other proce-dures. Also, at site levels, typically, no incen-tives exist for PA managers to be proactive in seeking revenue-generating opportunities. This lack of incentive is due primarily to the condition that all — or most — revenues go to a central account and are not necessarily returned to the PAs that generated them.
Figure 4.6. Scorecard Results for Component 1 in all 20 Countries (Scores ex-pressed as percentage of maximum possible score)
Component 1. leGal, ReGulatoRy, anD institutional fRamewoRks
CuBa
100908070605040302010
0
aRG
enti
na
Cost
a R
iCa
Ho
nD
uRa
s
pan
am
a
5753 51 51 51
Colo
mBi
a
50
Boli
Via
44
mex
iCo
44
eCua
Do
R
43
peRu
38
Do
min
iCa
n R
epu
BliC
37
BRazi
l
36
Ven
ezu
ela
35
el sa
lVa
Do
R
35
Beliz
e
33
Gu
atem
ala
paRa
Gu
ayu
RuG
uay
23
CHil
e
17
niC
aRa
Gu
a
13
ReGio
n a
VeR
aGe
38
mes
oa
meR
iCa+
aV
eRaG
e
40
sou
tH a
meR
iCa a
VeR
aGe
37
BRazi
l’s s
tate
s aV
eRaG
e
30
ac
tua
l sco
re/
Ma
xiM
un
Po
ssib
le s
cor
e (%
)
26 26
©sc
ott W
arre
n/tn
c
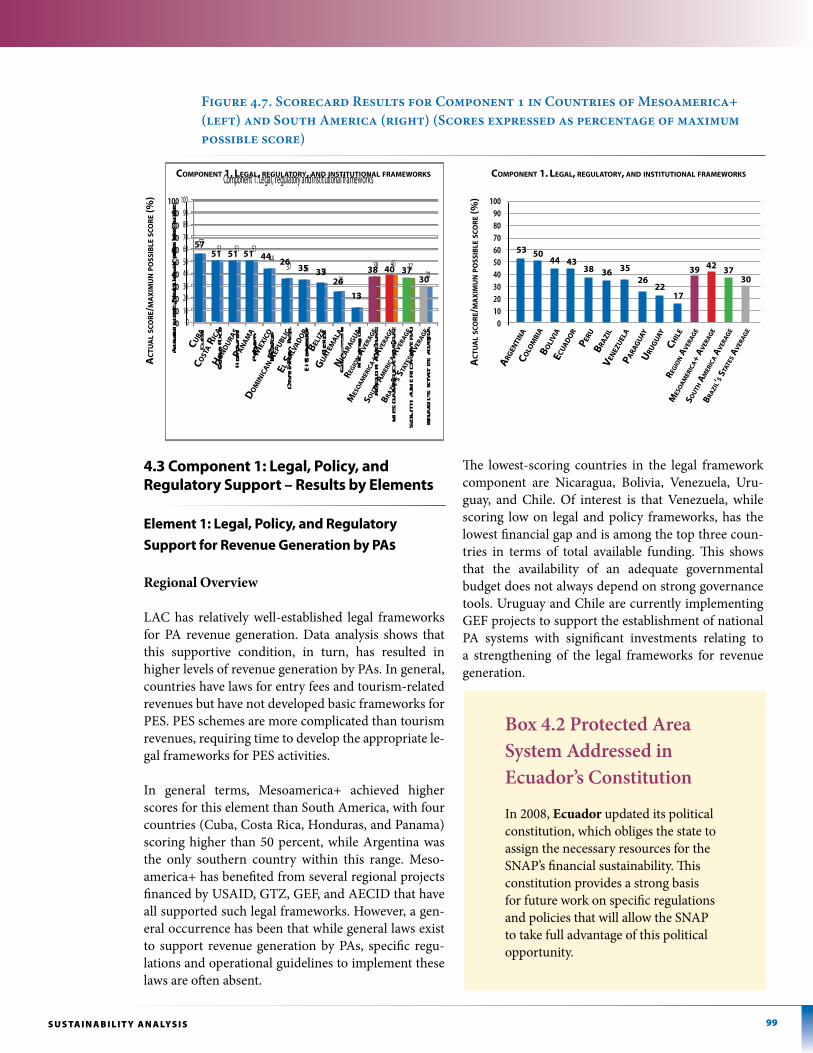
99s u s TA i n A b i l i T y A n A lys i s
4.3 Component 1: legal, policy, and regulatory support – results by elements
element 1: legal, policy, and regulatory support for revenue generation by pas
Regional Overview
LAC has relatively well-established legal frameworks for PA revenue generation. Data analysis shows that this supportive condition, in turn, has resulted in higher levels of revenue generation by PAs. In general, countries have laws for entry fees and tourism-related revenues but have not developed basic frameworks for PES. PES schemes are more complicated than tourism revenues, requiring time to develop the appropriate le-gal frameworks for PES activities.
In general terms, Mesoamerica+ achieved higher scores for this element than South America, with four countries (Cuba, Costa Rica, Honduras, and Panama) scoring higher than 50 percent, while Argentina was the only southern country within this range. Meso-america+ has benefited from several regional projects financed by USAID, GTZ, GEF, and AECID that have all supported such legal frameworks. However, a gen-eral occurrence has been that while general laws exist to support revenue generation by PAs, specific regu-lations and operational guidelines to implement these laws are often absent.
The lowest-scoring countries in the legal framework component are Nicaragua, Bolivia, Venezuela, Uru-guay, and Chile. Of interest is that Venezuela, while scoring low on legal and policy frameworks, has the lowest financial gap and is among the top three coun-tries in terms of total available funding. This shows that the availability of an adequate governmental budget does not always depend on strong governance tools. Uruguay and Chile are currently implementing GEF projects to support the establishment of national PA systems with significant investments relating to a strengthening of the legal frameworks for revenue generation.
Box 4.2 Protected Area System Addressed in Ecuador’s Constitution
In 2008, Ecuador updated its political constitution, which obliges the state to assign the necessary resources for the SNAP’s financial sustainability. This constitution provides a strong basis for future work on specific regulations and policies that will allow the SNAP to take full advantage of this political opportunity.
Figure 4.7. Scorecard Results for Component 1 in Countries of Mesoamerica+ (left) and South America (right) (Scores expressed as percentage of maximum possible score)
5751 51 51
4437 35 33
26
13
38 40 3730
0102030405060708090
100
Component 1. Legal, regulatory and institutional frameworksCu
Ba
57
Cost
a R
iCa
51
Ho
nD
uRa
spa
na
ma
mex
iCo
el sa
lVa
Do
RBel
ize
33
niC
aRa
Gu
a
13
ReGio
n a
VeR
aGe
38
mes
oa
meR
iCa+
aV
eRaG
e
40
sou
tH a
meR
iCa a
VeR
aGe
37
BRazi
l’s s
tate
s aV
eRaG
e
30
4435
1009080706050403020100
aC
tua
l sC
oR
e/m
ax
imu
n p
oss
iBle
sC
oR
e (%
)
Do
min
iCa
n R
epu
BliC
26
Gu
atem
ala
26
51 51
Component 1. leGal, ReGulatoRy, anD institutional fRamewoRks
aRG
enti
na
53
Colo
mBi
a
50
Boli
Via
eCua
Do
R
peRu
Ven
ezu
ela
paRa
Gu
ay
26
CHil
e
17
ReGio
n a
VeR
aGe
39
mes
oa
meR
iCa+
aV
eRaG
e
42
sou
tH a
meR
iCa a
VeR
aGe
37
BRazi
l’s s
tate
s aV
eRaG
e
3038 35
1009080706050403020100
aC
tua
l sC
oR
e/m
ax
imu
n p
oss
iBle
sC
oR
e (%
)
BRazi
l
36
uRu
Gu
ay
22
44 43
Component 1. leGal, ReGulatoRy, anD institutional fRamewoRks
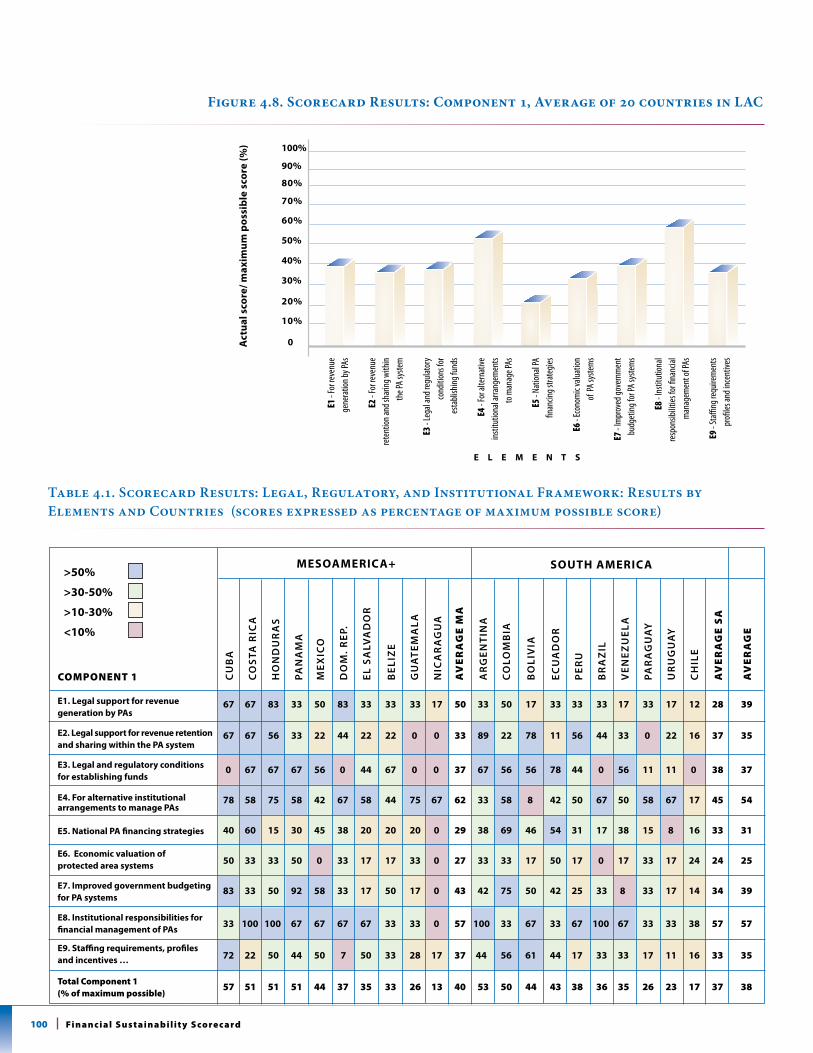
100 Fi n a n c i a l s u s t a i n a b i l i t y s co re c a rd
Table 4.1. Scorecard Results: Legal, Regulatory, and Institutional Framework: Results by Elements and Countries (scores expressed as percentage of maximum possible score)
Figure 4.8. Scorecard Results: Component 1, Average of 20 countries in LAC
100%
90%
E1 - F
or re
venu
ege
nera
tion b
y Pas
E2 -
For r
even
uere
tent
ion an
d sha
ring w
ithin
the P
a sys
tem
E3 -
lega
l and
regu
lator
y co
nditi
ons f
or
esta
blish
ing fu
nds
E4 -
For a
ltern
ative
ins
titut
ional
arra
ngem
ents
to m
anag
e Pas
E5 -
natio
nal P
a fin
ancin
g stra
tegie
s
E6 -
econ
omic
valua
tion
of P
a sys
tem
s
E7 -
Impr
oved
gove
rnm
ent
budg
eting
for P
a sys
tem
s
E8 -
Insti
tutio
nal
resp
onsib
ilities
for fi
nanc
ial
man
agem
ent o
f Pas
E9 -
staffi
ng re
quire
men
ts pr
ofiles
and i
ncen
tives
0
10%
40%
20%
50%
30%
60%
70%
80%
act
ual s
core
/ max
imum
pos
sibl
e sc
ore
(%)
e l e m e n t s
CU
BA
Co
STA
RiC
A
Ho
ND
UR
AS
PAN
AM
A
MEx
iCo
Do
M. R
EP.
El S
AlV
AD
oR
BEl
izE
GU
AT
EMA
lA
NiC
AR
AG
UA
Av
ER
Ag
E m
A
AR
GEN
TiN
A
Co
loM
BiA
Bo
liV
iA
ECU
AD
oR
PER
U
BR
Az
il
VEN
EzU
ElA
PAR
AG
UA
y
UR
UG
UA
y
CH
ilE
Av
ER
Ag
E s
A
Av
ER
Ag
E
67 67 83 33 50 83 33 33 33 17 50 33 50 17 33 33 33 17 33 17 12 28 39
67 67 56 33 22 44 22 22 0 0 33 89 22 78 11 56 44 33 0 22 16 37 35
0 67 67 67 56 0 44 67 0 0 37 67 56 56 78 44 0 56 11 11 0 38 37
78 58 75 58 42 67 58 44 75 67 62 33 58 8 42 50 67 50 58 67 17 45 54
40 60 15 30 45 38 20 20 20 0 29 38 69 46 54 31 17 38 15 8 16 33 31
50 33 33 50 0 33 17 17 33 0 27 33 33 17 50 17 0 17 33 17 24 24 25
83 33 50 92 58 33 17 50 17 0 43 42 75 50 42 25 33 8 33 17 14 34 39
33 100 100 67 67 67 67 33 33 0 57 100 33 67 33 67 100 67 33 33 38 57 57
72 22 50 44 50 7 50 33 28 17 37 44 56 61 44 17 33 33 17 11 16 33 35
57 51 51 51 44 37 35 33 26 13 40 53 50 44 43 38 36 35 26 23 17 37 38
ComPonEnT 1
e1. legal support for revenue generation by pas
e2. legal support for revenue retention and sharing within the pa system
e3. legal and regulatory conditions for establishing funds
e4. For alternative institutional arrangements to manage pas
e5. national pa financing strategies
e6. economic valuation of protected area systems
e7. improved government budgeting for pa systems
e8. institutional responsibilities for financial management of pas
e9. staffing requirements, profiles and incentives …
Total Component 1 (% of maximum possible)
mesoameriCa+ soUth ameriCa>50%
>30-50%
>10-30%
<10%
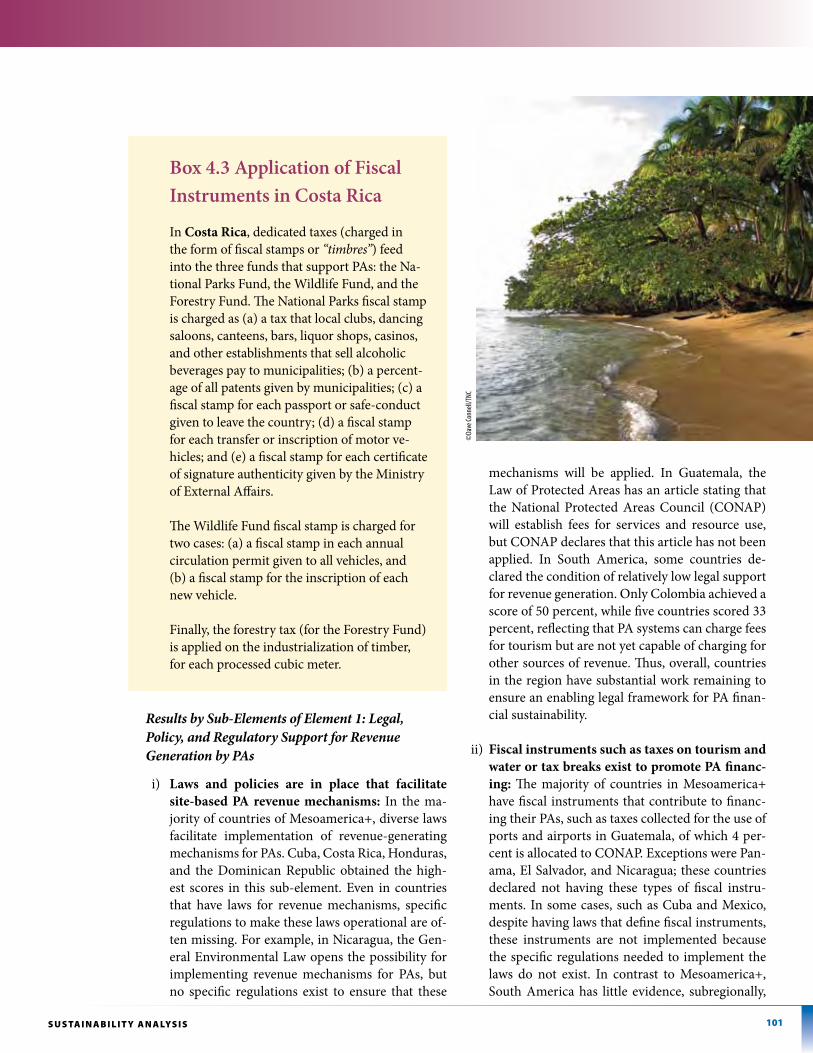
101s u s TA i n A b i l i T y A n A lys i s
Box 4.3 Application of Fiscal Instruments in Costa Rica
In Costa Rica, dedicated taxes (charged in the form of fiscal stamps or “timbres”) feed into the three funds that support PAs: the Na-tional Parks Fund, the Wildlife Fund, and the Forestry Fund. The National Parks fiscal stamp is charged as (a) a tax that local clubs, dancing saloons, canteens, bars, liquor shops, casinos, and other establishments that sell alcoholic beverages pay to municipalities; (b) a percent-age of all patents given by municipalities; (c) a fiscal stamp for each passport or safe-conduct given to leave the country; (d) a fiscal stamp for each transfer or inscription of motor ve-hicles; and (e) a fiscal stamp for each certificate of signature authenticity given by the Ministry of External Affairs.
The Wildlife Fund fiscal stamp is charged for two cases: (a) a fiscal stamp in each annual circulation permit given to all vehicles, and (b) a fiscal stamp for the inscription of each new vehicle.
Finally, the forestry tax (for the Forestry Fund) is applied on the industrialization of timber, for each processed cubic meter.
Results by Sub-Elements of Element 1: Legal, Policy, and Regulatory Support for Revenue Generation by PAs
i) Laws and policies are in place that facilitate site-based PA revenue mechanisms: In the ma-jority of countries of Mesoamerica+, diverse laws facilitate implementation of revenue-generating mechanisms for PAs. Cuba, Costa Rica, Honduras, and the Dominican Republic obtained the high-est scores in this sub-element. Even in countries that have laws for revenue mechanisms, specific regulations to make these laws operational are of-ten missing. For example, in Nicaragua, the Gen-eral Environmental Law opens the possibility for implementing revenue mechanisms for PAs, but no specific regulations exist to ensure that these
mechanisms will be applied. In Guatemala, the Law of Protected Areas has an article stating that the National Protected Areas Council (CONAP) will establish fees for services and resource use, but CONAP declares that this article has not been applied. In South America, some countries de-clared the condition of relatively low legal support for revenue generation. Only Colombia achieved a score of 50 percent, while five countries scored 33 percent, reflecting that PA systems can charge fees for tourism but are not yet capable of charging for other sources of revenue. Thus, overall, countries in the region have substantial work remaining to ensure an enabling legal framework for PA finan-cial sustainability.
ii) Fiscal instruments such as taxes on tourism and water or tax breaks exist to promote PA financ-ing: The majority of countries in Mesoamerica+ have fiscal instruments that contribute to financ-ing their PAs, such as taxes collected for the use of ports and airports in Guatemala, of which 4 per-cent is allocated to CONAP. Exceptions were Pan-ama, El Salvador, and Nicaragua; these countries declared not having these types of fiscal instru-ments. In some cases, such as Cuba and Mexico, despite having laws that define fiscal instruments, these instruments are not implemented because the specific regulations needed to implement the laws do not exist. In contrast to Mesoamerica+, South America has little evidence, subregionally,
©da
ve co
nnell
/tnc
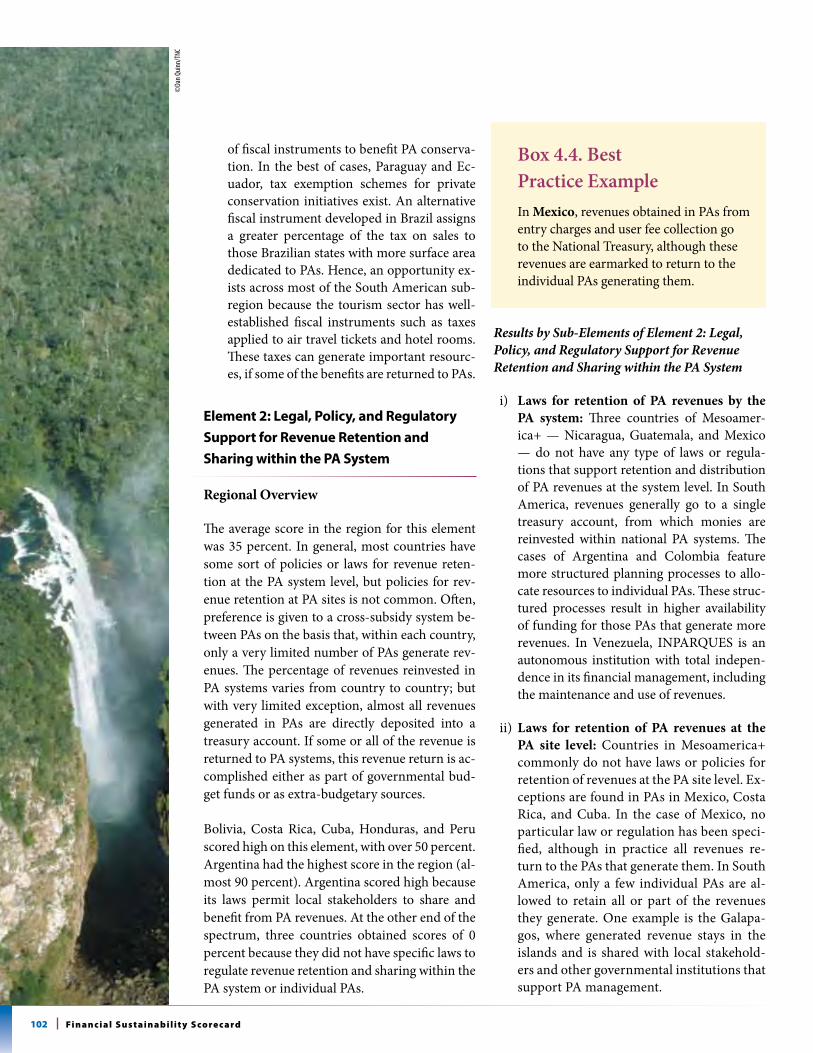
102 Fi n a n c i a l s u s t a i n a b i l i t y s co re c a rd
of fiscal instruments to benefit PA conserva-tion. In the best of cases, Paraguay and Ec-uador, tax exemption schemes for private conservation initiatives exist. An alternative fiscal instrument developed in Brazil assigns a greater percentage of the tax on sales to those Brazilian states with more surface area dedicated to PAs. Hence, an opportunity ex-ists across most of the South American sub-region because the tourism sector has well-established fiscal instruments such as taxes applied to air travel tickets and hotel rooms. These taxes can generate important resourc-es, if some of the benefits are returned to PAs.
element 2: legal, policy, and regulatory support for revenue retention and sharing within the pa system
Regional Overview
The average score in the region for this element was 35 percent. In general, most countries have some sort of policies or laws for revenue reten-tion at the PA system level, but policies for rev-enue retention at PA sites is not common. Often, preference is given to a cross-subsidy system be-tween PAs on the basis that, within each country, only a very limited number of PAs generate rev-enues. The percentage of revenues reinvested in PA systems varies from country to country; but with very limited exception, almost all revenues generated in PAs are directly deposited into a treasury account. If some or all of the revenue is returned to PA systems, this revenue return is ac-complished either as part of governmental bud-get funds or as extra-budgetary sources.
Bolivia, Costa Rica, Cuba, Honduras, and Peru scored high on this element, with over 50 percent. Argentina had the highest score in the region (al-most 90 percent). Argentina scored high because its laws permit local stakeholders to share and benefit from PA revenues. At the other end of the spectrum, three countries obtained scores of 0 percent because they did not have specific laws to regulate revenue retention and sharing within the PA system or individual PAs.
In Mexico, revenues obtained in PAs from entry charges and user fee collection go to the National Treasury, although these revenues are earmarked to return to the individual PAs generating them.
Results by Sub-Elements of Element 2: Legal, Policy, and Regulatory Support for Revenue Retention and Sharing within the PA System
i) Laws for retention of PA revenues by the PA system: Three countries of Mesoamer-ica+ — Nicaragua, Guatemala, and Mexico — do not have any type of laws or regula-tions that support retention and distribution of PA revenues at the system level. In South America, revenues generally go to a single treasury account, from which monies are reinvested within national PA systems. The cases of Argentina and Colombia feature more structured planning processes to allo-cate resources to individual PAs. These struc-tured processes result in higher availability of funding for those PAs that generate more revenues. In Venezuela, INPARQUES is an autonomous institution with total indepen-dence in its financial management, including the maintenance and use of revenues.
ii) Laws for retention of PA revenues at the PA site level: Countries in Mesoamerica+ commonly do not have laws or policies for retention of revenues at the PA site level. Ex-ceptions are found in PAs in Mexico, Costa Rica, and Cuba. In the case of Mexico, no particular law or regulation has been speci-fied, although in practice all revenues re-turn to the PAs that generate them. In South America, only a few individual PAs are al-lowed to retain all or part of the revenues they generate. One example is the Galapa-gos, where generated revenue stays in the islands and is shared with local stakehold-ers and other governmental institutions that support PA management.
Box 4.4. Best Practice Example
©da
n Quin
n/tn
c
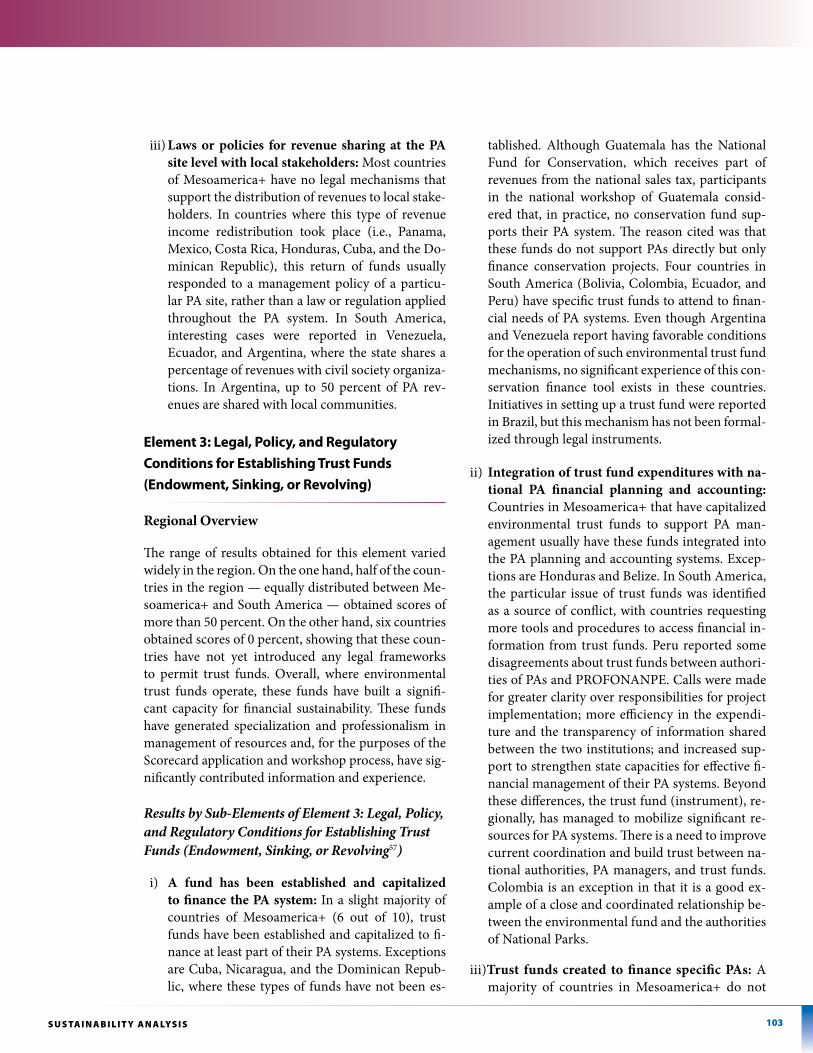
103s u s TA i n A b i l i T y A n A lys i s
iii) Laws or policies for revenue sharing at the PA site level with local stakeholders: Most countries of Mesoamerica+ have no legal mechanisms that support the distribution of revenues to local stake-holders. In countries where this type of revenue income redistribution took place (i.e., Panama, Mexico, Costa Rica, Honduras, Cuba, and the Do-minican Republic), this return of funds usually responded to a management policy of a particu-lar PA site, rather than a law or regulation applied throughout the PA system. In South America, interesting cases were reported in Venezuela, Ecuador, and Argentina, where the state shares a percentage of revenues with civil society organiza-tions. In Argentina, up to 50 percent of PA rev-enues are shared with local communities.
element 3: legal, policy, and regulatory Conditions for establishing trust Funds (endowment, sinking, or revolving)
Regional Overview
The range of results obtained for this element varied widely in the region. On the one hand, half of the coun-tries in the region — equally distributed between Me-soamerica+ and South America — obtained scores of more than 50 percent. On the other hand, six countries obtained scores of 0 percent, showing that these coun-tries have not yet introduced any legal frameworks to permit trust funds. Overall, where environmental trust funds operate, these funds have built a signifi-cant capacity for financial sustainability. These funds have generated specialization and professionalism in management of resources and, for the purposes of the Scorecard application and workshop process, have sig-nificantly contributed information and experience.
Results by Sub-Elements of Element 3: Legal, Policy, and Regulatory Conditions for Establishing Trust Funds (Endowment, Sinking, or Revolving57)
i) A fund has been established and capitalized to finance the PA system: In a slight majority of countries of Mesoamerica+ (6 out of 10), trust funds have been established and capitalized to fi-nance at least part of their PA systems. Exceptions are Cuba, Nicaragua, and the Dominican Repub-lic, where these types of funds have not been es-
tablished. Although Guatemala has the National Fund for Conservation, which receives part of revenues from the national sales tax, participants in the national workshop of Guatemala consid-ered that, in practice, no conservation fund sup-ports their PA system. The reason cited was that these funds do not support PAs directly but only finance conservation projects. Four countries in South America (Bolivia, Colombia, Ecuador, and Peru) have specific trust funds to attend to finan-cial needs of PA systems. Even though Argentina and Venezuela report having favorable conditions for the operation of such environmental trust fund mechanisms, no significant experience of this con-servation finance tool exists in these countries. Initiatives in setting up a trust fund were reported in Brazil, but this mechanism has not been formal-ized through legal instruments.
ii) Integration of trust fund expenditures with na-tional PA financial planning and accounting: Countries in Mesoamerica+ that have capitalized environmental trust funds to support PA man-agement usually have these funds integrated into the PA planning and accounting systems. Excep-tions are Honduras and Belize. In South America, the particular issue of trust funds was identified as a source of conflict, with countries requesting more tools and procedures to access financial in-formation from trust funds. Peru reported some disagreements about trust funds between authori-ties of PAs and PROFONANPE. Calls were made for greater clarity over responsibilities for project implementation; more efficiency in the expendi-ture and the transparency of information shared between the two institutions; and increased sup-port to strengthen state capacities for effective fi-nancial management of their PA systems. Beyond these differences, the trust fund (instrument), re-gionally, has managed to mobilize significant re-sources for PA systems. There is a need to improve current coordination and build trust between na-tional authorities, PA managers, and trust funds. Colombia is an exception in that it is a good ex-ample of a close and coordinated relationship be-tween the environmental fund and the authorities of National Parks.
iii)Trust funds created to finance specific PAs: A majority of countries in Mesoamerica+ do not
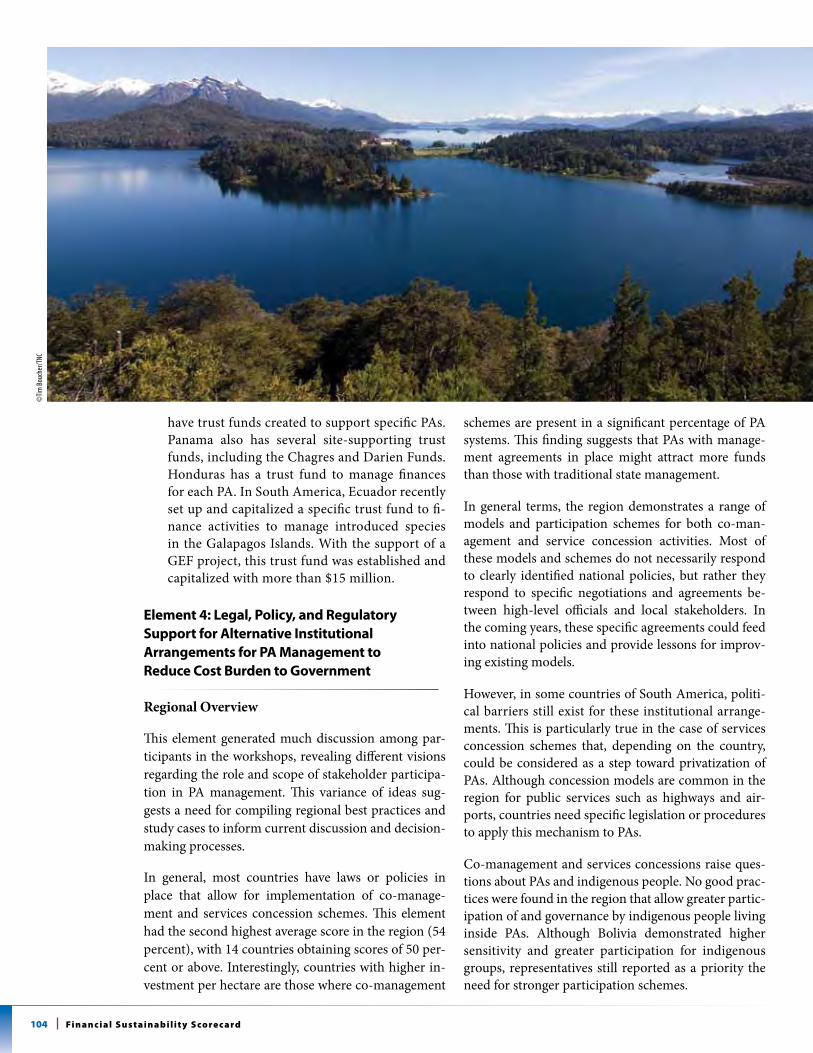
104 Fi n a n c i a l s u s t a i n a b i l i t y s co re c a rd
have trust funds created to support specific PAs. Panama also has several site-supporting trust funds, including the Chagres and Darien Funds. Honduras has a trust fund to manage finances for each PA. In South America, Ecuador recently set up and capitalized a specific trust fund to fi-nance activities to manage introduced species in the Galapagos Islands. With the support of a GEF project, this trust fund was established and capitalized with more than $15 million.
element 4: legal, policy, and regulatory support for alternative institutional arrangements for pa management to reduce Cost Burden to government
Regional Overview
This element generated much discussion among par-ticipants in the workshops, revealing different visions regarding the role and scope of stakeholder participa-tion in PA management. This variance of ideas sug-gests a need for compiling regional best practices and study cases to inform current discussion and decision-making processes.
In general, most countries have laws or policies in place that allow for implementation of co-manage-ment and services concession schemes. This element had the second highest average score in the region (54 percent), with 14 countries obtaining scores of 50 per-cent or above. Interestingly, countries with higher in-vestment per hectare are those where co-management
schemes are present in a significant percentage of PA systems. This finding suggests that PAs with manage-ment agreements in place might attract more funds than those with traditional state management.
In general terms, the region demonstrates a range of models and participation schemes for both co-man-agement and service concession activities. Most of these models and schemes do not necessarily respond to clearly identified national policies, but rather they respond to specific negotiations and agreements be-tween high-level officials and local stakeholders. In the coming years, these specific agreements could feed into national policies and provide lessons for improv-ing existing models.
However, in some countries of South America, politi-cal barriers still exist for these institutional arrange-ments. This is particularly true in the case of services concession schemes that, depending on the country, could be considered as a step toward privatization of PAs. Although concession models are common in the region for public services such as highways and air-ports, countries need specific legislation or procedures to apply this mechanism to PAs.
Co-management and services concessions raise ques-tions about PAs and indigenous people. No good prac-tices were found in the region that allow greater partic-ipation of and governance by indigenous people living inside PAs. Although Bolivia demonstrated higher sensitivity and greater participation for indigenous groups, representatives still reported as a priority the need for stronger participation schemes.
©tim
Bouc
her/t
nc
105s u s TA i n A b i l i T y A n A lys i s
Countries with bigger financial gaps tend to have pres-ent alternative institutional arrangements, possibly reflecting recognition that co-management can help governments reduce cost burdens.
Box 4.5 Best Practice Country Examples on Co-Management
Peru allows NGOs to manage specific PAs that are part of the national PA system. A successful case is found in the Cordillera Azul National Park, where the NGO CIMA is in charge of this 1.35-million-hectare PA over a 20-year period. This NGO has man-aged to generate sufficient funds to meet basic management costs for the park.
In Guatemala, nearly 1 million hectares of the PA system — or almost 30 percent of the total area — are under co-management. This co-management may be between CONAP and any other institution of the central government, as well as between CONAP and municipalities, NGOs, or a combination of more than one institution.
Results by Sub-Elements of Element 4: Legal, Policy, and Regulatory Support for Alternative Institu-tional Arrangements for PA Management to Reduce Cost Burden to Government
i) There are laws or policies which allow and regu-late concessions for PA services: In most countries of Mesoamerica+ — Panama, El Salvador, Nicara-gua, Guatemala, Costa Rica, Cuba, and the Do-minican Republic — a legal framework regulates concessions for services in PAs. However, these laws are frequently not applied, either because they are not options well known by PA site staff, as in the case of Cuba, or because no specific regulations make these laws operational, as in the case of El Salvador. This lack of application in both situations results in fewer revenue options and lower revenue levels for PAs. In South America, concessions for services are legally allowed in most countries. The most typical concessions are associated with tour-ism services, providing exclusive rights to manage
a certain infrastructure and operate within the lim-its of a PA. These concession schemes are applied on a regular basis in Argentina, Brazil, Chile, Co-lombia, and Peru. Concession application has been less common in Bolivia and Ecuador.
ii) There are laws or policies which allow and regu-late co-management of PAs: All countries analyzed in Mesoamerica+, without exception, have laws and regulations that permit and regulate co-management agreements. In some countries, these mechanisms are better known as ‘administration contracts’.
In South America, almost all countries have laws that permit and regulate co-management agreements. As a result, several co-management schemes operate in Ecuador, Bolivia, Venezuela, Peru, Argentina, and Brazil.
iii) There are laws or policies which allow and regu-late local government management of PAs: All countries in Mesoamerica+ have legal frameworks that allow local government to manage PAs. The only exception is Belize, where this type of insti-tutional arrangement does not exist. Cuba is a particular case, where PAs are technically man-aged not by local governments but by local state enterprises. In South America, 6 countries have legal frameworks that allow local government to manage PAs. However, policy gaps exist related to formal linkages between national PA systems and subnational ones, including municipal, commu-nal, and private PAs. In Ecuador, one of the best managed PA — the Cajas National Park — is man-aged by the municipality of Cuenca. The downside to this management by a locality is that this park has a weak sense of belonging to the national sys-tem of Ecuador.
iv) There are laws which allow, promote, and regu-late private reserves: In almost all countries of the region, with the exception of Bolivia, Argentina, Chile, Cuba, and Venezuela, private reserves are part of PA systems. However, generally for private reserves, the corresponding legal frameworks are not well developed. Guatemala has perhaps the most advanced legal framework for private re-serves, which is reflected in the large number of established private reserves. Other countries with well-defined legal frameworks for private reserves are Nicaragua, Mexico, and Honduras.
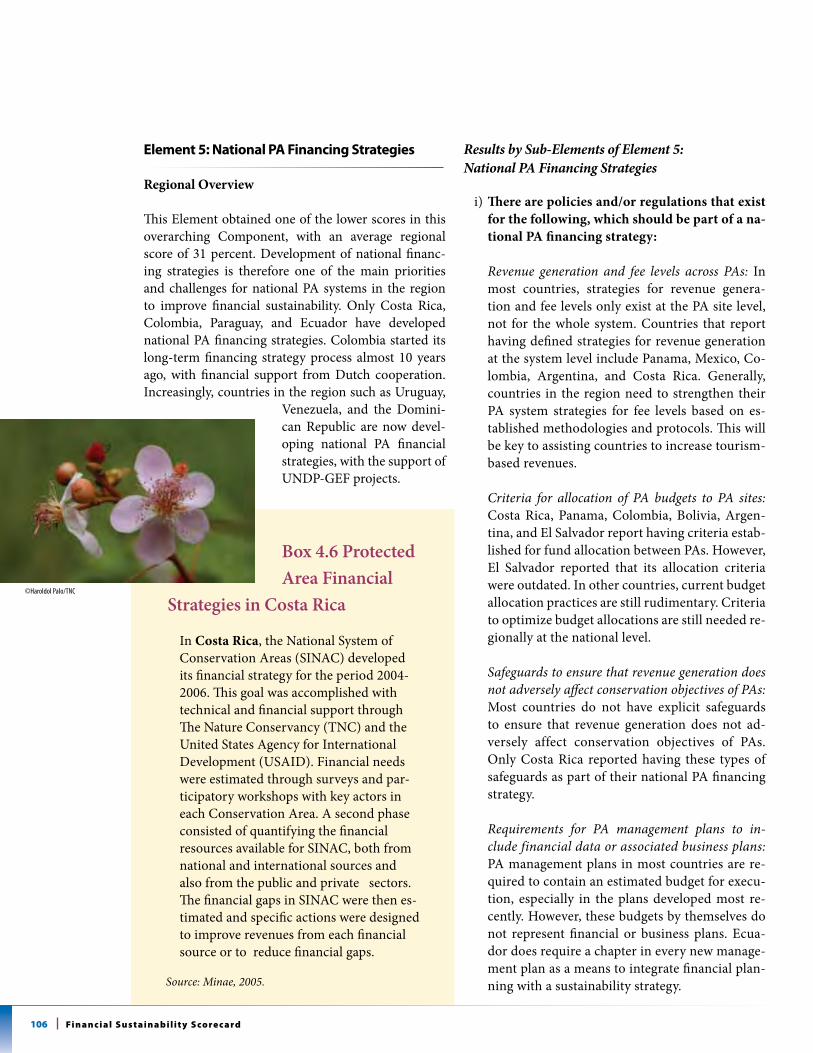
106 Fi n a n c i a l s u s t a i n a b i l i t y s co re c a rd
element 5: national pa Financing strategies
Regional Overview
This Element obtained one of the lower scores in this overarching Component, with an average regional score of 31 percent. Development of national financ-ing strategies is therefore one of the main priorities and challenges for national PA systems in the region to improve financial sustainability. Only Costa Rica, Colombia, Paraguay, and Ecuador have developed national PA financing strategies. Colombia started its long-term financing strategy process almost 10 years ago, with financial support from Dutch cooperation. Increasingly, countries in the region such as Uruguay,
Venezuela, and the Domini-can Republic are now devel-oping national PA financial strategies, with the support of UNDP-GEF projects.
Box 4.6 Protected Area Financial
Strategies in Costa Rica
In Costa Rica, the National System of Conservation Areas (SINAC) developed its financial strategy for the period 2004-2006. This goal was accomplished with technical and financial support through The Nature Conservancy (TNC) and the United States Agency for International Development (USAID). Financial needs were estimated through surveys and par-ticipatory workshops with key actors in each Conservation Area. A second phase consisted of quantifying the financial resources available for SINAC, both from national and international sources and also from the public and private sectors. The financial gaps in SINAC were then es-timated and specific actions were designed to improve revenues from each financial source or to reduce financial gaps.
Source: Minae, 2005.
Results by Sub-Elements of Element 5: National PA Financing Strategies
i) There are policies and/or regulations that exist for the following, which should be part of a na-tional PA financing strategy:
Revenue generation and fee levels across PAs: In most countries, strategies for revenue genera-tion and fee levels only exist at the PA site level, not for the whole system. Countries that report having defined strategies for revenue generation at the system level include Panama, Mexico, Co-lombia, Argentina, and Costa Rica. Generally, countries in the region need to strengthen their PA system strategies for fee levels based on es-tablished methodologies and protocols. This will be key to assisting countries to increase tourism-based revenues.
Criteria for allocation of PA budgets to PA sites:
Costa Rica, Panama, Colombia, Bolivia, Argen-tina, and El Salvador report having criteria estab-lished for fund allocation between PAs. However, El Salvador reported that its allocation criteria were outdated. In other countries, current budget allocation practices are still rudimentary. Criteria to optimize budget allocations are still needed re-gionally at the national level.
Safeguards to ensure that revenue generation does not adversely affect conservation objectives of PAs: Most countries do not have explicit safeguards to ensure that revenue generation does not ad-versely affect conservation objectives of PAs. Only Costa Rica reported having these types of safeguards as part of their national PA financing strategy.
Requirements for PA management plans to in-clude financial data or associated business plans: PA management plans in most countries are re-quired to contain an estimated budget for execu-tion, especially in the plans developed most re-cently. However, these budgets by themselves do not represent financial or business plans. Ecua-dor does require a chapter in every new manage-ment plan as a means to integrate financial plan-ning with a sustainability strategy.
©Haroldol Palo/tnc
107s u s TA i n A b i l i T y A n A lys i s
ii) Degree of formulation, adoption, and imple-mentation of a national financing strategy: Processes for developing national financing strat-egies are, in general, more advanced in South America than in Mesoamerica+. In Mesoamer-ica+, only Costa Rica has a national financing strategy for PAs. The rest of the countries in this subregion do not have financing strategies and, in the best of cases, are in the process of design-ing them. The Dominican Republic is due to design a strategy during 2010, with the support of a UNDP-GEF project. With respect to South American countries, Bolivia and Colombia have developed national PA financing strategies, which have already been under implementation for several years. Other countries working on PA financial sustainability for several years are Peru and Ecuador, where processes to complete na-tional PA financial strategies are underway. The lowest scores for financial strategy planning in the South America subregion were observed in Brazil, Chile, Paraguay, and Uruguay. However, the last three countries are currently developing financial sustainability plans and strategies for their PA systems, through GEF-UNDP projects. Venezuela is expected to complete a national fi-nancing strategy through a GEF project focused on building capacity of that national PA system.
element 6: economic valuation of pa systems (ecosystem services, tourism-Based employment, etc.)
Regional Overview
Element 6 obtained the lowest average regional score with in the governance framework component (25 percent). This condition is unfortunate because analy-sis shows that this particular Element has an effect in improving governmental budgeting for PAs, as well as improving capacity-building programmes for resource generation. Countries, too, have realized this need for economic valuation and supporting governance cli-mates. All across the region there is unanimous de-mand for this kind of information. Further, a lack of information about economic valuation has been iden-tified as one of the major bottlenecks for increasing po-litical visibility and awareness about PA contributions to national economies.
Box 4.7 Best Practice Country Example
Valuation of PAs Contribution to Poverty ReductionEcuador’s PA economic valuation study (2007) identified that 54,000 families living in PAs benefitted directly from the goods and services generated by PAs. These direct benefits have been estimated at $1,100 per family per year, representing 71 percent of the average rural income. This means that for each dollar that the government of Ecuador invests in PAs, approximately $54 are generated as direct benefits to the most vulnerable population.
Source: Salazar Cordova, 2007.
Results by Sub-Element of Element 6: Economic Valuation of PA Systems (Ecosystem Services, Tourism-Based Employment, Etc.)
i) Economic valuation studies on the contribution of PAs to local and national development are available: Most countries reported the existence of isolated valuation exercises at the PA site level, mainly developed by universities. Most coun-tries reported the need to strengthen capacities and methodological approaches for developing these exercises and data sets. In Mesoamerica+, no system-level economic valuation studies were found. In South America, three recent economic valuation exercises were found in Chile, Ecuador, and Peru. In Brazil, an economic valuation study is underway, developing a national methodol-ogy for the PA system and carrying out valuation work for six PAs.
ii) PA economic valuation influences government decision makers: The existing system-level eco-nomic valuation studies in the region developed for Chile, Ecuador, and Peru have all had varying degrees of influence on national decision-making and budgeting processes. Overall, measuring the contribution is difficult. However, stakeholders in these countries report this influence.
108 Fi n a n c i a l s u s t a i n a b i l i t y s co re c a rd
Box 4.8 Best Practice Country Example Valuation of PAs and Contribution to National Economy
In 2006, the National Institute of Natural Resources (INRENA) conducted a study to determine the contribution of the PAs in Peru to the national economy. This study showed that the economic benefits of investing in PAs far exceed the costs of management. The analy-sis considered, primarily, the value of economic activities that benefit from the environmental services and natural resources offered by PAs. This study estimated that PAs provide $1 billion annually to the national economy in terms of water, energy, resources, scenic beauty, tourism, hydro-biological resources, agricultural produc-tion, non-timber products, and erosion control, among other goods and services.
Source: Leon, 2007.
element 7: improved government Budgeting for pa systems of legal, policy, and regulatory support for improved government Budgeting for pa systems
Regional Overview
In most countries of the region, stakeholders report an increase in fund allocation to PAs, although these increases have been undertaken without a clear idea of the financial gaps faced by PAs and PA systems. The real risk is that these additional resources will not meet the real financial needs of PAs. This mismatch between resources and needs, despite the increases in funds, is because the region, generally, still carries out financial planning based on budgetary constraints and historic patterns, with limited use of financial and cost-effec-tiveness management data. The average regional score obtained for this Element was 39 percent, with Cuba, Panama, Mexico, and Colombia obtaining scores of 58 percent or more. The lowest scores were obtained by Nicaragua and Venezuela, even though Venezuela also presents the highest amount of government allocation by budget funds to the PA system.
Differences exist between the Mesoamerica+ and South America subregions in terms of including threat reduction strategies in buffer zones as part of PA budgeting processes. In general, inclusion of buf-fer strategies is less common in South America, with only Venezuela and Bolivia having clear commit-ments to include buffer zone activities in their bud-gets. This situation occurs despite the commitment because resources are limited, with PA systems usu-ally forced to prioritize salaries and focus on a few core activities inside of PA boundaries.
Results by Sub-Element of Element 7: Improved Government Budgeting for PA Systems
i) Government policy promotes budgeting for PAs based on financial needs as determined by PA management plans: Most countries in Mesoamerica+ declared that financial planning for their PA systems takes into account financial needs specified in PA management plans. How-ever, countries also commonly report that PA management plans need to be updated. South American countries also experience a problem of outdated management plans, which is an im-portant impediment to financial planning. Fur-thermore, PAs in South America are subject to traditional state planning, which imposes budget-ary ceilings, limiting the likelihood for PAs to do planning exercises based on real needs. Colombia is a notable exception; there, PAs use planning tools that allow budgetary planning processes that better reflect PA financial needs.
ii) PA budgets include funds to finance threat re-duction strategies in buffer zones (e.g., liveli-hoods of communities living around the PA): Budgets of PAs in most countries of Mesoamer-ica+ include actions to reduce threats originat-ing in buffer zones of PAs. This budget item is important to establish real costs, but countries also report that this practice sometimes results in spreading the available budget over too many activities. In contrast, in a large portion of South America — with the exception of Argentina, Bo-livia, Brazil, and Colombia — available budgets for PAs do not include funding for threat reduc-tion in buffer areas.
109s u s TA i n A b i l i T y A n A lys i s
iii) Administrative (e.g., procurement) procedures facilitate budget to be spent, reducing risk of future budget cuts due to low disbursement rates: In Mesoamerica+, most countries declare that their purchase systems have been improving, which has facilitated budget execution. However, a common complaint is that procedures for re-questing and receiving disbursements are still very complex and slow, which affects budget-ary execution. Countries also report insufficient capacity at the site level for effective and timely execution of funds. Practically all South Ameri-can countries reported that state administrative systems constrain budgetary execution. This constraint occurs mainly when existing financial systems apply to governmental bodies in general, with very few adjustments made for the nature of how PAs need to spend funds. To be clearer: currently, no financial systems are tailored to the specific needs of PA systems.
Box 4.9 Best Practice Country Example
Colombia’s Budget Execution Capacity
Over the past years, budget execution in Colombia has surpassed 92 percent, which is high for the public sector. This achievement came through rigorous control of spending through procedures and specific meetings throughout the year that allow timely identi-fication of problems. This gain has also been possible because the PA system has specific policies to tailor contractual procedures and vendor practices to the rural reality of Colombia. Over time, this superior perfor-mance has created a strong reputation for the PA system within the Ministry, allowing the system to receive more resources and take advantage of additional opportunities.
iv) Government plans to increase budget, over the long term, to reduce the PA financing gap: No countries in Mesoamerica+ have any specific plans to increase budgets based on knowledge of exist-
ing financial gaps. However, in Guatemala, a rapid estimation of financial needs for the PA system was done by CONAP, to justify before Congress a budgetary increase for fiscal year 2009. In South America, only Peru reports real plans to increase the PA system budget significantly, as part of com-mitments made under the Free Trade Agreement recently signed with the United States58.
element 8: Clearly defined institutional responsibilities for Financial management of pas
Regional Overview
In LAC, many PA systems have multiple ministries and institutions with management and financial responsi-bilities. This situation carries the risk of complication, with some institutions not receiving sufficient fund-ing to comply with their management responsibili-ties. However, the region has relatively well-defined institutional arrangements for PA financial manage-ment, with this element obtaining the highest region-al average score within the governance framework component (57 percent). Eleven countries obtained scores of 67 percent or above; four of those obtained a score of 100 percent. Countries that scored lower typically had many institutions involved in PA system management or had conflicts between institutions in charge of the PA system. Complicating the picture are external institutions such as the tourism ministries, which are mentioned often when referring to con-flicts of competencies.
Results by Sub-Element of Element 8: Clearly Defined Institutional Responsibilities for Financial Management of PAs
i) Mandates of public institutions regarding PA finances are clear and agreed: Countries in Mesoamerica+, where groups of PAs are man-aged by different institutions, faced problems. Particularly, Guatemala and Belize struggled with the definition of institutional responsibili-ties for financial management of PAs. Countries with more centralized systems — for example, with only one institution in charge — faced fewer complications. The majority of countries in this
©m
ark G
odfre
y/tn
c
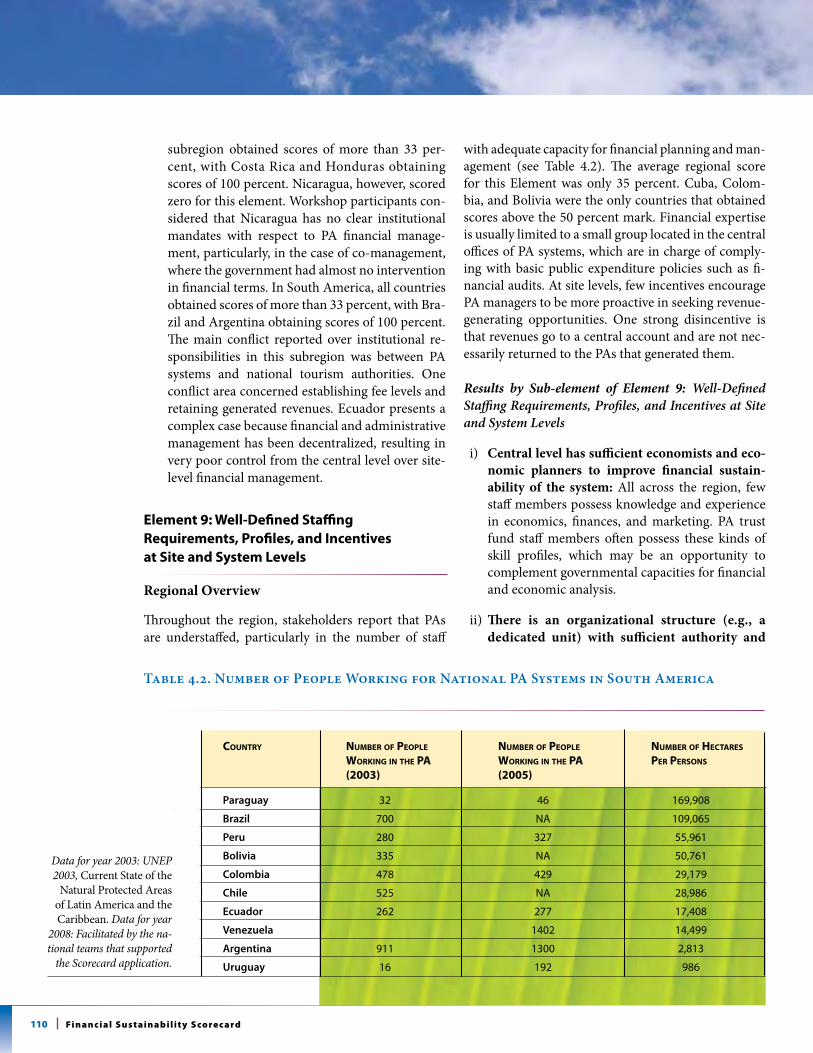
110 Fi n a n c i a l s u s t a i n a b i l i t y s co re c a rd
subregion obtained scores of more than 33 per-cent, with Costa Rica and Honduras obtaining scores of 100 percent. Nicaragua, however, scored zero for this element. Workshop participants con-sidered that Nicaragua has no clear institutional mandates with respect to PA financial manage-ment, particularly, in the case of co-management, where the government had almost no intervention in financial terms. In South America, all countries obtained scores of more than 33 percent, with Bra-zil and Argentina obtaining scores of 100 percent. The main conflict reported over institutional re-sponsibilities in this subregion was between PA systems and national tourism authorities. One conflict area concerned establishing fee levels and retaining generated revenues. Ecuador presents a complex case because financial and administrative management has been decentralized, resulting in very poor control from the central level over site-level financial management.
element 9: Well-defined staffing requirements, profiles, and incentivesat site and system levels
Regional Overview
Throughout the region, stakeholders report that PAs are understaffed, particularly in the number of staff
with adequate capacity for financial planning and man-agement (see Table 4.2). The average regional score for this Element was only 35 percent. Cuba, Colom-bia, and Bolivia were the only countries that obtained scores above the 50 percent mark. Financial expertise is usually limited to a small group located in the central offices of PA systems, which are in charge of comply-ing with basic public expenditure policies such as fi-nancial audits. At site levels, few incentives encourage PA managers to be more proactive in seeking revenue-generating opportunities. One strong disincentive is that revenues go to a central account and are not nec-essarily returned to the PAs that generated them.
Results by Sub-element of Element 9: Well-Defined Staffing Requirements, Profiles, and Incentives at Site and System Levels
i) Central level has sufficient economists and eco-nomic planners to improve financial sustain-ability of the system: All across the region, few staff members possess knowledge and experience in economics, finances, and marketing. PA trust fund staff members often possess these kinds of skill profiles, which may be an opportunity to complement governmental capacities for financial and economic analysis.
ii) There is an organizational structure (e.g., a dedicated unit) with sufficient authority and
Table 4.2. Number of People Working for National PA Systems in South America
Data for year 2003: UNEP 2003, Current State of the
Natural Protected Areas of Latin America and the Caribbean. Data for year
2008: Facilitated by the na-tional teams that supported
the Scorecard application.
Paraguay
Brazil
Peru
Bolivia
Colombia
Chile
Ecuador
Venezuela
Argentina
Uruguay
32
700
280
335
478
525
262
911
16
country nuMber oF PeoPle nuMber oF PeoPle nuMber oF hectares
Working in the Pa Working in the Pa Per Persons
(2003) (2005)
46
NA
327
NA
429
NA
277
1402
1300
192
169,908
109,065
55,961
50,761
29,179
28,986
17,408
14,499
2,813
986
111s u s TA i n A b i l i T y A n A lys i s
coordination to properly manage the finances of the PA system: A slight majority of countries in Me-soamerica+ (Panama, El Salvador, Mexico, Costa Rica, and Honduras) reported having adequate organiza-tional structures for financial management of their PA systems, usually consisting of a financial manage-ment and planning unit for the PA system. However, most countries also mention that these units typically do not have enough economists or personnel special-ized in financial planning. Therefore, these units may address day-to-day operational needs, but they do not have capacity for strategic planning. A similar situa-tion applies to PA systems in South America, where systems typically have financial management units but also report a shortage of economists or staff specialized in financial planning. Although the Ministries of Envi-ronment of Colombia, Argentina, and Peru have teams exclusively dedicated to environmental and natural re-source economics, these teams are not part of the PA system organizational structure.
iii) At the regional and PA site level there is sufficient professional capacity to promote financial sustain-ability at site level: PA systems of Mesoamerica+, in the terms of reference documentation, typically stipu-late that PA manager responsibilities address cost-ef-fective management practices and, in some cases, in-come generation. However, job descriptions may not be that clear or specific about duties and requirements for financial management practices, cost-effectiveness of programmes, and revenue generation activities. Some countries, such as Guatemala and Honduras, also indicate that site managers lack capacity to adequately perform these functions. With respect to South Amer-ica, in Brazil, Colombia, Venezuela, and Bolivia, PA managers have direct responsibility for obtaining and managing financial resources. In Argentina, responsi-bilities are split between those charged with obtaining funds and those responsible for managing fund expen-ditures. In Peru, PA site managers can obtain funds in practice, but this responsibility is not specified in their terms of reference.
iv) PA site manager responsibilities include financial management, cost-effectiveness, and revenue gen-eration: In Mesoamerica+ no established incentives motivate PA managers to promote the financial sus-tainability of their areas. To the contrary, revenues pro-duced by PAs go either to the PA system or to the public treasury; there is no guarantee that revenues will be re-
invested in the PAs that generated them. An exception to this practice is Mexico, where all PA revenues that go to the National Treasury are earmarked to return to the PAs that generated them. In South America, PAs that generate greater revenues are also considered pri-orities for resource allocation, although this practice is usually not guaranteed by written policy or procedure. Ecuador has recently approved a new policy that al-lows PAs to retain 50 percent of self-generated reve-nues, with the remaining portion to be shared with the rest of the PA system.
v) Performance assessment of PA site managers in-cludes assessment of sound financial planning, rev-enue generation, fee collection, and cost-effective management: Across the entire region, performance assessments of PA managers generally do not include criteria to evaluate performance in financial planning or income generation.
vi) There is auditing capacity for PA finances: Countries in general have sound financial auditing capacities for their PA systems, because these conditions are re-quired by basic public expenditure policy applicable to all public entities. However, auditing capacities are not found within PA system management structures, be-cause specialized bodies from the central government are in charge of these audits.
vii)PA managers have the possibility to budget and plan for the long term (e.g., over five years): PA manag-ers have the possibility of doing long-term plans. These plans are typically in the form of PA management plans (usually 5 years duration), which also include cost esti-mates (budgets) for their implementation.
4.4 Business planning and tools for Cost-effective management
introduction of the scorecard elements of Component 2
Financial planning, accounting, and business planning are important tools for cost-effective management of PAs, when undertaken on a regular and systematic basis. Effec-tive financial planning requires accurate knowledge not only of revenues but also of expenditure levels, patterns, and investment requirements to better reflect management
112 Fi n a n c i a l s u s t a i n a b i l i t y s co re c a rd
Box 4.10 Financial and Business Planning
Financial planning underpins the cost and revenue elements. Financial planning is the activity of comparing costs and expenditures to available funds over time. This planning balance is important to bridge the gap be-tween supply (revenues/budget) and demand (costs), providing predictability to site and system by smoothing funding fluctuations. Such planning should be done both at the system network level and at all sites. Finan-cial planning should be viewed as the basis of a business plan, which strategizes how the identified funds will be secured. Busi-ness plans can also be the source of financial reporting from sites feeding information into system-level reporting mechanisms. Report-ing on expenditures and results of invest-ments in PAs will be important to show the cost-effectiveness of PA management and the value in government budget allocations to improve PA management.
priorities and address major threats to biodiver-sity conservation. Options for balancing costs and revenues in PAs should include equal consider-ation of revenue increases for better PA manage-ment and cost control at PA sites. Good financial planning enables PA managers to make strategic financial decisions, such as allocating spending to match management priorities, identifying appro-priate cost reductions, and anticipating potential cash flow problems. Improved planning can also help PA stakeholders raise more funds. When PAs are managed according to strong programmes undergirded by sound fiscal practices, donors and governments feel confident that their funds will be invested effectively in the PA system.
Component 2 of the Scorecard takes the broad notion of financial planning — concern about the income/expenditure balance — down to the spe-cific practices and tasks of business planning. In most PAs, the business planning process proceeds in a two-step manner. First, business plans analyze and identify the financial gap in PA operations. Second, based on the gap information, business
©sim
on W
illiam
s/tnc
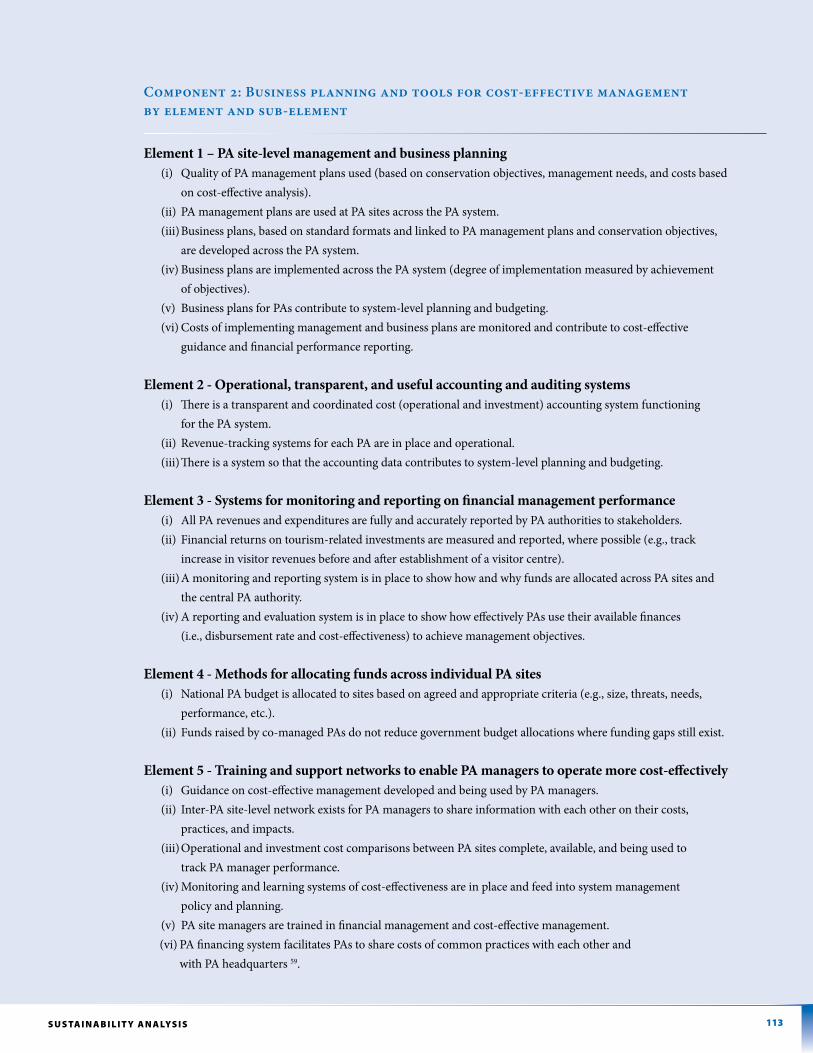
113s u s TA i n A b i l i T y A n A lys i s
Element 1 – PA site-level management and business planning (i) Quality of PA management plans used (based on conservation objectives, management needs, and costs based on cost-effective analysis). (ii) PA management plans are used at PA sites across the PA system. (iii) Business plans, based on standard formats and linked to PA management plans and conservation objectives, are developed across the PA system. (iv) Business plans are implemented across the PA system (degree of implementation measured by achievement of objectives). (v) Business plans for PAs contribute to system-level planning and budgeting. (vi) Costs of implementing management and business plans are monitored and contribute to cost-effective guidance and financial performance reporting.
Element 2 - Operational, transparent, and useful accounting and auditing systems (i) There is a transparent and coordinated cost (operational and investment) accounting system functioning for the PA system. (ii) Revenue-tracking systems for each PA are in place and operational. (iii) There is a system so that the accounting data contributes to system-level planning and budgeting.
Element 3 - Systems for monitoring and reporting on financial management performance (i) All PA revenues and expenditures are fully and accurately reported by PA authorities to stakeholders. (ii) Financial returns on tourism-related investments are measured and reported, where possible (e.g., track increase in visitor revenues before and after establishment of a visitor centre). (iii) A monitoring and reporting system is in place to show how and why funds are allocated across PA sites and the central PA authority. (iv) A reporting and evaluation system is in place to show how effectively PAs use their available finances (i.e., disbursement rate and cost-effectiveness) to achieve management objectives.
Element 4 - Methods for allocating funds across individual PA sites (i) National PA budget is allocated to sites based on agreed and appropriate criteria (e.g., size, threats, needs, performance, etc.). (ii) Funds raised by co-managed PAs do not reduce government budget allocations where funding gaps still exist.
Element 5 - Training and support networks to enable PA managers to operate more cost-effectively (i) Guidance on cost-effective management developed and being used by PA managers. (ii) Inter-PA site-level network exists for PA managers to share information with each other on their costs, practices, and impacts. (iii) Operational and investment cost comparisons between PA sites complete, available, and being used to track PA manager performance. (iv) Monitoring and learning systems of cost-effectiveness are in place and feed into system management policy and planning. (v) PA site managers are trained in financial management and cost-effective management. (vi) PA financing system facilitates PAs to share costs of common practices with each other and with PA headquarters 59.
Component 2: Business planning and tools for cost-effective managementby element and sub-element
114 Fi n a n c i a l s u s t a i n a b i l i t y s co re c a rd
plans present opportunities for PA authorities to close or mitigate that gap through operational cost efficiencies or revenue generation schemes. Some countries, however, have different operational definitions and methodologies for business plans. Some countries still may only carry out financial analysis procedures, without full business plan protocols at this time.
regional performance and Key Findings for Component 2: Business planning and tools for Cost-effective management
Overview
The average performance of the LAC region in the busi-ness planning component (Component 2) was 32 percent. The majority of countries performed poorly in this Score-card component, reflecting a generalized absence of busi-ness planning tools at site and system levels. Countries showing highest performance in this component (greater than 50 percent) were Cuba, Mexico, Colombia, Argen-tina, and Bolivia, with Colombia showing the greatest rela-tive strength.
Figure 4.9 shows the scores obtained when the five ele-ments under the business planning component are com-bined. These scores by Component 2 are from the 20 countries in Mesoamerica+ and South America that com-pleted Part II of the Scorecard. Figure 4.10 arranges this same information by sub-region, in two related graphics.The elements of business planning yield useful information for policy making: Addressing financial gaps is affordable
for governments in the region: Basic management costs could be met if the annual government allocation to PA budgets in the region increases by a factor of 3, to cover the existing annual financing gap of $314 million (excluding Venezuela). This is the average factor, derived from the 18 countries reporting their funding gaps. However, the range of factors by individual country is considerable. Country governments allocate only a small fraction of their finan-cial resources to PAs: first, only 1 percent of total national environmental budgets are allotted to PAs, and second, just 0.006 percent of GDP, on average, in the region. Closing these financing gaps, at even the basic level, seems entirely feasible and affordable for governments. Closing these fi-nancing gaps can help ensure sound PA management60.
See Figure 4.11 for a regional take on the five elements of business planning. The highest scores achieved concerned Element 4 of Component 2: methods for resource allocation, accounting, and auditing systems. Among the lowest-scoring elements is PA site-level management and business planning (Element 1). This result for Element 1 reflects the relatedness of management plans to business plans. Business planning simply cannot occur when a PA lacks a management plan. This finding is noteworthy: a majority of PAs in the region lack a management plan. Even when management/planning tools exist in a PA, these tools are usually not used, due to the limited resources to implement them and the generalized lack of a planning culture for PA management.
Furthermore, the particular challenge embodied in Element 1 presents a certain complexity since the Element calls for integrating traditional tools and practices from the con-servation sector, such as management plans, with new ap-proaches and tools borrowed from the private sector, such as business planning and cost-effective management practices.
The main findings for each of the five elements of Compo-nent 2 are described by country in Table 4.3. Additional de-tails on these five elements by sub-element are discussed in Key Findings.
Key Findings for the region by elements of Component 2: Business planning and tools for Cost-effective management
• PA site-level management and business planning: Most countries in the region do not have financial sustainabil-ity plans for their PAs. Furthermore, many PA authori-ties understand these plans to be limited only to budgets
What is a business plan?
A PA Business Plan is a plan that analyzes and identifies the financial gap in PA operations, and presents opportunities to mitigate that gap through operational cost efficiencies or revenue generation schemes. A business plan does not refer to specialized business plans for specific concession services within a PA. Each country may have its own definition and methodology for business plans or may only carry out finan-cial analysis and, hence, may need to adapt the questions accordingly.
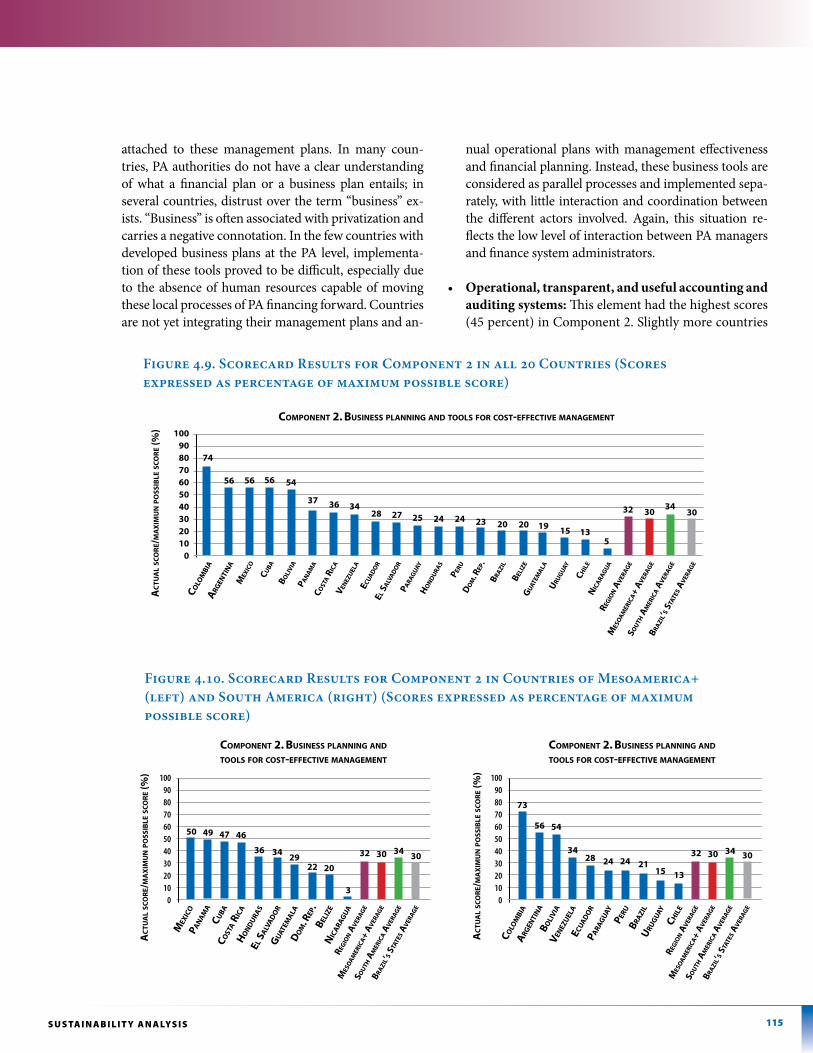
115s u s TA i n A b i l i T y A n A lys i s
attached to these management plans. In many coun-tries, PA authorities do not have a clear understanding of what a financial plan or a business plan entails; in several countries, distrust over the term “business” ex-ists. “Business” is often associated with privatization and carries a negative connotation. In the few countries with developed business plans at the PA level, implementa-tion of these tools proved to be difficult, especially due to the absence of human resources capable of moving these local processes of PA financing forward. Countries are not yet integrating their management plans and an-
nual operational plans with management effectiveness and financial planning. Instead, these business tools are considered as parallel processes and implemented sepa-rately, with little interaction and coordination between the different actors involved. Again, this situation re-flects the low level of interaction between PA managers and finance system administrators.
• Operational, transparent, and useful accounting and auditing systems: This element had the highest scores (45 percent) in Component 2. Slightly more countries
Figure 4.9. Scorecard Results for Component 2 in all 20 Countries (Scores expressed as percentage of maximum possible score)
Colo
mBi
a
100908070605040302010
0
aRG
enti
na
mex
iCo
CuBa
Boli
Via
74
56 56 56 54
pan
am
a
37
Cost
a R
iCa
36
Ven
ezu
ela
34
eCua
Do
R
28
el sa
lVa
Do
R
27
paRa
Gu
ay
25
Ho
nD
uRa
s
24
peRu
24
Do
m. R
ep.
23
BRazi
l
20Bel
ize
Gu
atem
ala
uRu
Gu
ay
15
CHil
e
13
niC
aRa
Gu
a
5
ReGio
n a
VeR
aGe
32
mes
oa
meR
iCa+
aV
eRaG
e
30
sou
tH a
meR
iCa a
VeR
aGe
34
BRazi
l’s s
tate
s aV
eRaG
e
30
act
ua
l sco
re/M
axi
Mu
n Po
ssib
le sc
ore
(%)
Component 2. Business planninG anD tools foR Cost-effeCtiVe manaGement
20 19
30
Figure 4.10. Scorecard Results for Component 2 in Countries of Mesoamerica+ (left) and South America (right) (Scores expressed as percentage of maximum possible score)
mex
iCo
50
pan
am
a
49
CuBa
Cost
a R
iCa
Ho
nD
uRa
s
Gu
atem
ala
Do
m. R
ep.
22
niC
aRa
Gu
a
3
ReGio
n a
VeR
aGe
32
mes
oa
meR
iCa+
aV
eRaG
e
30
sou
tH a
meR
iCa a
VeR
aGe
34
BRazi
l’s s
tate
s aV
eRaG
e
3036
29
1009080706050403020100
aC
tua
l sC
oR
e/m
ax
imu
n p
oss
iBle
sC
oR
e (%
)
el sa
lVa
Do
R
34
Beliz
e
20
47 46
Component 2. Business planninG anD tools foR Cost-effeCtiVe manaGement
Colo
mBi
a
73
aRG
enti
na
56
Boli
Via
Ven
ezu
ela
eCua
Do
R
peRu
BRazi
l
21
CHil
e
13
ReGio
n a
VeR
aGe
mes
oa
meR
iCa+
aV
eRaG
e
sou
tH a
meR
iCa a
VeR
aGe
BRazi
l’s s
tate
s aV
eRaG
e
28 24
1009080706050403020100
aC
tua
l sC
oR
e/m
ax
imu
n p
oss
iBle
sC
oR
e (%
)
paRa
Gu
ay
24
uRu
Gu
ay
15
54
34 32 30 34
Component 2. Business planninG anD tools foR Cost-effeCtiVe manaGement
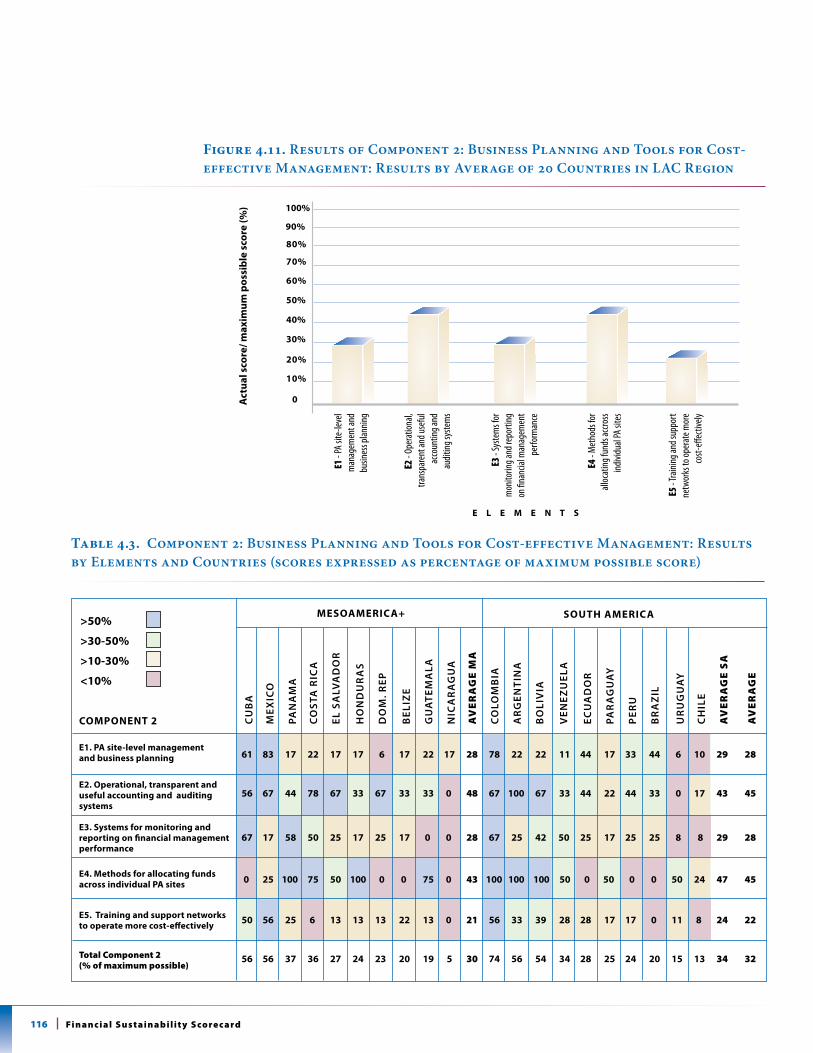
116 Fi n a n c i a l s u s t a i n a b i l i t y s co re c a rd
Figure 4.11. Results of Component 2: Business Planning and Tools for Cost-effective Management: Results by Average of 20 Countries in LAC Region
Table 4.3. Component 2: Business Planning and Tools for Cost-effective Management: Results by Elements and Countries (scores expressed as percentage of maximum possible score)
E1 - P
a site
-leve
lm
anag
emen
t and
bu
sines
s plan
ning
E2 -
oper
ation
al,
trans
pare
nt an
d use
ful
acco
untin
g and
au
diting
syste
ms
E3 -
syste
ms f
or
mon
itorin
g and
repo
rting
on
finan
cial m
anag
emen
t pe
rform
ance
E4 -
met
hods
for
alloc
ating
fund
s acc
ross
indivi
dual
Pa si
tes
E5 - t
raini
ng an
d sup
port
netw
orks
to op
erat
e mor
e co
st-eff
ectiv
ely
0
10%
40%
20%
50%
30%
60%
70%
80%a
ctua
l sco
re/ m
axim
um p
ossi
ble
scor
e (%
)
e l e m e n t s
100%
90%
CU
BA
MEx
iCo
PAN
AM
A
Co
STA
RiC
A
El S
AlV
AD
oR
Ho
ND
UR
AS
Do
M. R
EP
BEl
izE
GU
ATE
MA
lA
NiC
AR
AG
UA
Av
ER
Ag
E m
A
Co
loM
BiA
AR
GEN
TiN
A
Bo
liV
iA
VEN
EzU
ElA
ECU
AD
oR
PAR
AG
UA
y
PER
U
BR
Az
il
UR
UG
UA
y
CH
ilE
Av
ER
Ag
E s
A
Av
ER
Ag
E 61 83 17 22 17 17 6 17 22 17 28 78 22 22 11 44 17 33 44 6 10 29 28
56 67 44 78 67 33 67 33 33 0 48 67 100 67 33 44 22 44 33 0 17 43 45
67 17 58 50 25 17 25 17 0 0 28 67 25 42 50 25 17 25 25 8 8 29 28
0 25 100 75 50 100 0 0 75 0 43 100 100 100 50 0 50 0 0 50 24 47 45
50 56 25 6 13 13 13 22 13 0 21 56 33 39 28 28 17 17 0 11 8 24 22
56 56 37 36 27 24 23 20 19 5 30 74 56 54 34 28 25 24 20 15 13 34 32
Component 2
e1. pa site-level management and business planning
e2. operational, transparent and useful accounting and auditing systems
e3. systems for monitoring and reporting on financial management performance
e4. methods for allocating funds across individual pa sites
e5. training and support networks to operate more cost-effectively
Total Component 2(% of maximum possible)
mesoameriCa+ soUth ameriCa>50%
>30-50%
>10-30%
<10%
117s u s TA i n A b i l i T y A n A lys i s
in Mesoamerica+ than in South America are considered to have good accounting sys-tems in PAs. In general, PAs use the same ac-counting and auditing systems that operate in a country for the public sector as a whole, rather than accounting systems specially tai-lored for PA needs. Accounting and auditing systems are still not addressing adequately the specific needs of PA data collection and analysis required for proper PA financial planning. These current systems frequently do not include all financial sources, especial-ly those from international cooperation.
• Systems for monitoring and reporting on financial management performance: In general terms, monitoring systems can track expenditures, especially in non-decentral-ized PA systems, but countries are still far from using this data for management deci-sions. For example, when data exists from adequate tracking measures, the next steps may not occur, like analyzing cost-effective-ness and assessing the return on investments in PAs. Countries with a higher dependence on international cooperation present bet-ter reporting and monitoring systems. This finding suggests that countries depending largely on governmental budgets have fewer requirements for solid accountability and performance monitoring systems.
• Methods for allocating funds across indi-vidual PA sites: This element had the highest score (45 percent) in Component 2. How-ever, performance across countries in the region was quite varied, with five countries obtaining a score of 100 percent and seven countries with scores of 0 percent. In gen-eral, most countries in the region have not fully established specific criteria for fund al-location across individual sites, nor do these countries have systematic procedures for making this allocation. Within this element, the highest-scoring countries of Argentina, Colombia, and Bolivia reported a number of practices and procedures that facilitate the technical allocation of resources even though systematic methods are not yet in place. These highest-scoring countries often
have fund allocation criteria but lack a robust process for allocation characterized by stan-dard procedures.
• Training and support networks to enable PA managers to operate more cost-effec-tively: Training and support was the element with the lowest average score in the region (22 percent). A large majority of countries in the region obtained scores of less than 30 percent. In general, no PA-specific tools have been developed in the region to sup-port cost-effective management. Likewise, very few training opportunities exist in cost-effective operation for PA managers, since financial topics are usually not included in official training programmes for PA staff.
According to the scores achieved by these ele-ments, the countries most likely to provide support for this specific business planning component are Colombia, Argentina, Cuba, and Mexico. Countries more likely to need support and advice are Nicaragua, Chile, and Uruguay. These coun-tries demonstrated a need for business planning aspects that will require regional and international supportive processes.
4.5 Component 2: Business planning and tools for Cost-effective management — results by elements element 1: pa site-level management and Business planning
Regional Overview
Most countries in the region do not have business plans for their PAs. Planning is often limited to preparing a budget to be included in the PA man-agement plans. In many countries, PA authorities and staff often do not understand clearly what a financial plan or a business plan entails. The re-gional average for this element is 28 percent, with only three countries obtaining a score above 50 percent. Financial and business plans that exist in the region should be considered as first-gen-eration tools for PA management. Furthermore, these tools are new to most staff and decision makers in the conservation sector, because the
©Ha
rold
e. m
alde/
tnc
118 Fi n a n c i a l s u s t a i n a b i l i t y s co re c a rd
vast majority of PA professionals possess science back-grounds and are usually not prepared for or comfort-able with financial and business planning tools and pro-cedures. The results in Element 1 show that financial and business planning for PAs is at a very preliminary stage, with a clear need to improve significantly these practices across the region.
In countries that have developed these planning tools at the PA level — such as Panama, Peru, Nicaragua, and Ecuador — implementing such plans has proven to be difficult given barriers at the national system level and in the lack of capacity at site levels in these countries to implement the plans.
Results by Sub-Element in Element 1: PA Site-Level Management and Business Planning
i) PA management plans are used at PA sites across the PA system: The use of management plans is common practice at all PA systems of the region, although only a small percentage of PAs have updated management plans. Colombia has a high number of PAs with current management plans, all prepared with the in-house technical capacity of the National Parks Authority.
ii) Business plans, based on standard formats and linked to PA management plans and con-servation objectives, are developed across the PA system: PA business plans are still very un-common; however, a number of cases where PAs include business plans in their models can be found across the region. In most of these cases, business plans were developed as a component of donor projects. Brazil, Colombia, and Ecua-dor reported that their new management plans are already starting to incorporate financial analysis. Cuba reports that its PA management plans also include business plans. However, these Cuban PA business plans are not business plans as defined in the Scorecard; rather, they are financial plans, because they only include es-timations of the financial needs for the sites but exclude a funding strategy to close the financial gaps. Countries where pilot business plans were applied, such as Ecuador and Panama, still need better and more standardized methodologies to make the plans more useful. During the national workshops, some countries, such as Bolivia and
Venezuela, expressed apprehension at the con-cept of business planning because this tool was perceived to relate to privatization of resources within PAs.
iii) Business plans are implemented across the PA system: In some countries, individual PA sites maintain business plans, but these plans have rarely been implemented. Mexico is the only country that reports applying business plans in all PAs. In South America, few countries report the experiences of applying business plans to PA needs.
iv) Business plans for PAs contribute to system-level planning and budgeting: In Mesoamer-ica+, only Mexico and Cuba reported that PA business plans contribute to system-level plan-ning and budgeting. In South America, only Co-lombia reported that PA site-level business plans contribute to the system level.
v) Costs of implementing management and busi-ness plans are monitored and contribute to cost-effective guidance and financial performance reporting: In Mesoamerica+, the only countries that reported monitoring the implementation of their PA business plans were Mexico and Cuba. In South America, only Colombia reports moni-toring the cost of implementing management and business plans. Monitoring in Colombia is done on a monthly basis to verify if financial resources are being used efficiently; however, Colombia also acknowledges a lack of information to monitor adequately the cost-effectiveness of investments made in PAs.
element 2: operational, transparent, and Useful accounting and auditing systems
Regional Overview
Element 2, along with Element 4, obtained the high-est average score in the business planning component. Argentina obtained the best score in the region, with 100 percent, while Nicaragua and Uruguay obtained 0 percent. Slightly more countries in Mesoamerica+ than in South America reported good accounting systems. In general, PAs use the same accounting and auditing
119s u s TA i n A b i l i T y A n A lys i s
systems that operate for the public sector in a country as a whole, rather than tailoring accounting systems es-pecially for PA needs.
Although, in general terms, public sector accounting and auditing systems have improved in the region, these systems do not address the specific data and anal-ysis required for healthy PA financial planning. More-over, these accounting and auditing systems frequently do not include all financial sources, especially those from international cooperation (public and private). The complexity of conservation mechanisms also does not fit with these existing public sector systems. For ex-ample, the vast majority of countries could not present financial breakdowns for marine and terrestrial PAs, for private PAs that count as part of the system, or even for those under co-management agreements.
Results by Sub-Element of Element 2:Operational, Transparent, and Useful Accounting and Auditing Systems
i) There is a transparent and coordinated cost (operational and investment) accounting sys-tem functioning for the PA system: In Meso-america+, Costa Rica, Cuba, El Salvador, Mexico, and the Dominican Republic reported having strong cost accounting systems, although these countries also acknowledge that deficiencies ex-ist in availability of information from different financial resources. This means that these cost accounting systems have trouble tracking across the type of resource: government budgeted funds, funds by type from international cooperation, revenues from site-based activities, etc. The rest of the countries in the region manage the finances of their PA systems under standard governmen-tal accounting systems. In both South America and Mesoamerica+, high scores obtained for this sub-element might respond primarily to the ex-istence of national accounting and reporting sys-tems used by the public sector, rather than strate-gies or policies specifically targeted to supporting the financial sustainability of the PAs. In South America, the countries of Argentina, Bolivia, Colombia, and Peru have accounting systems that provide specific information at the PA site level. In Venezuela and Ecuador the accounting infor-mation is managed in a decentralized manner; no
national system centralizes and monitors specific allocations to each PA. In Colombia, initiatives exist to provide access to financial information at site and system levels, but users experience prob-lems with systematizing information.
A common problem reported in this sub-element is the inadequate or even total lack of access that individual PA sites have to financial information collected at central levels but not returned to the sites. This information block is due to a lack of ef-ficient communication channels. In some cases, financial management is centralized to such a de-gree that not even the administration offices of the PA systems — let alone the PA sites — manage fi-nancial resources. This information problem iden-tified by this sub-element suggests a strong need for accounting systems designed to address PA-specific needs both at site and system levels. Fur-thermore, these site- and system-level-responsive accounting systems should generate reports to dif-ferent users, such as PA managers, governmental officials, and donors.
ii) Revenue-tracking systems for each PA in place and operational: All countries in Mesoamerica+ declare having systems for monitoring PA rev-enues, with Nicaragua the only exception. How-ever, differences are noted in revenue monitoring between countries, with the quality and effective-ness of these systems being somewhat question-able. For example, although Honduras established mechanisms to monitor revenues at the system level, these mechanisms are not in place for indi-vidual sites. Belize reports having very good rev-enue tracking systems for its Marine Reserves, but these monitoring systems are less developed in the case of its National Parks. Similarly, in South America the systems of each country are differ-ent, with varying degrees of effectiveness. Peru reports tracking all revenues collected at sites by PA management, although some PAs do not re-port revenues collected by local communities. In Colombia, Ecuador, and Venezuela, revenue-tracking systems are not automated, thereby slow-ing the rendering of accounts. Argentina reports a tracking system but indicates that some improve-ments are needed. Only Uruguay does not have a revenue-tracking system.
120 Fi n a n c i a l s u s t a i n a b i l i t y s co re c a rd
iii) There is a system so that the accounting data contributes to system-level planning and bud-geting: In Mesoamerica+, accounting data in general contributes to planning and development of budgets at the site level, with the exception of Nicaragua, Guatemala, and Honduras, where ac-counting data does not contribute to planning. Argentina, Venezuela, and Colombia reported the application of interesting practices in which different technical offices are involved in budget development or in allocation of resources to PAs. These practices are often the result of personal initiatives from professionals and authorities, but they have not been incorporated into institutional procedures. Almost all countries in the region reported that existing accounting systems only include government budgets. This means that ac-counting systems are frequently uncoordinated and unaligned with resources from international cooperation or PAs trust funds.
element 3: systems for monitoring and report-ing on Financial management performance
Regional Overview
In general, monitoring systems track expenditures, es-pecially in non-decentralized PA systems, but countries are still far from using this financial data for manage-ment and decision-making purposes. Management based on accounting and financial information looks strategically ahead, analyzing the cost-effectiveness of programmes and assessing the return of investments in PAs. The average score for this element in the region was 28 percent, with Cuba, Panama, and Colombia ob-taining the highest scores. Two countries in Mesoamer-ica+ obtained scores of zero, while two in South Amer-ica obtained scores of less than 10 percent. No country yet reports on the financial return of investments in PAs. Another condition that needs attention concerns the lack of systematic monitoring of expenditure and programme effectiveness. Countries such as Colombia and Argentina have the information and capacities to perform these analyses, but these practices are not yet integrated into day-to-day PA activities.
Countries with more assistance from international co-operation have higher scores for this element. This find-ing suggests that these countries develop more accurate
reporting and monitoring systems that contribute to evidence-based management practices because of the need to be accountable to donors.
Results by Sub-Element for Element 3: Systems for Monitoring and Reporting on Financial Management Performance
i) All PA revenues and expenditures are fully and accurately reported by PA authorities to stake-holders: In Mesoamerica+, several countries have acknowledged deficiencies in monitoring and re-porting revenues and expenses in PA systems. For instance, in Guatemala, the accounting system of CONAP does not include information from PAs managed by other institutions. Similar cases are found in Nicaragua and Belize. The monitoring and reporting systems for PA revenues and expen-ditures in Cuba are reported to be quite satisfac-tory; however, the CNAP in charge of supervising the PA system in Cuba has access only to financial information of the PAs that it manages directly. In South America, countries identify government procedures for reporting and monitoring public expenditures in all of the countries, although only Bolivia has a specific procedure for reporting fi-nancial information to PA management commit-tees. Notably no other country in the subregion systematically shares financial information with different PA stakeholders. In the best cases, PA financial information is presented and discussed internally or with other authorities. Venezuela, Colombia, and Argentina mention that this in-formation is strictly given only upon request, al-though in Colombia financial data is published on a government website.
ii) Financial returns on tourism-related invest-ments are measured and reported, where pos-sible (e.g., track increase in visitor revenues before and after establishment of a visitor cen-tre): In the majority of countries of Mesoamer-ica+, financial returns from tourism-related in-vestments in PAs are not measured or reported, with the exception of Costa Rica, Panama, and Cuba. In South America, a few countries, name-ly Venezuela, Argentina, and Colombia, track the impact of particular investments in PAs, based primarily on the flow of visitors. Analy-
121s u s TA i n A b i l i T y A n A lys i s
sis is not undertaken on the financial return of these investments to improve decisions on how and where to place capital investments for Ven-ezuela, Argentina, and Colombia.
iii) A monitoring and reporting system is in place to show how funds are allocated across PA sites and the central PA authority: Monitoring of fund allocation to PAs is still in the earliest stages in most countries of Mesoamerica+, except in Costa Rica. This same finding applies to South America, with the exception of Colombia, which reports monitoring on a monthly basis to ensure the to-tal use of funds by the end of the year. Ecuador reports having allocation criteria such as giving priority to new PAs, but no system monitors the application of such criteria. Venezuela reports a similar situation, where funds are allocated based on priorities agreed upon during financial plan-ning, although a monitoring or reporting proce-dure is not in place. In Peru, monitoring of budget expenditures is undertaken quarterly, but no clear criteria were mentioned for how these funds are allocated among PAs; rather, allocation is based on historical expenditure.
iv) A reporting and evaluation system is in place to show how effectively PAs use their available finances (i.e., disbursement rate and cost-ef-fectiveness) to achieve management objectives: This particular sub-element was among the lowest component scores across both subregions. Most countries lack tools to monitor the effectiveness of expenditure across the PA systems and, indeed, to gauge what is cost-effective. Countries are not yet integrating their management plans and opera-tive annual plans with management effectiveness evaluation and financial planning.
element 4: methods for allocating Funds across individual pa sites
Regional Overview
Element 4, along with Element 2, obtained the highest score in the business planning component (45 percent). However, performance among the countries was quite
varied. Five countries obtained a score of 100 percent, and seven countries obtained scores of 0 percent. In general, most countries in the region have not estab-lished specific criteria for fund allocation across indi-vidual PA sites, nor do they have any systematic proce-dure for doing so.
Results by Sub-Elements in Element 4: Methods for Allocating Funds across Individual PA Sites
i) National PA budget is allocated to sites based on agreed and appropriate criteria (e.g., size, threats, needs, performance, etc.): Countries of Mesoamerica+, in general, lack well-defined cri-teria to allocate funds to individual sites. Excep-tions are Costa Rica, Guatemala, Honduras, and Panama, where established criteria exist based on ecological gap analysis and rationalization reports, among others. In South America, possi-bly the best-structured procedures and the most participatory processes are found in Argentina and Colombia. In both countries, resources are allocated with the participation of different insti-tutional levels and based on the implementation of management plans.
ii) Funds raised by co-managed PAs do not reduce government budget allocations where funding gaps still exist: Regarding the government funds allocated to PAs under co-management schemes, most countries in Mesoamerica+ reported that the size of this allocation was not affected by in-creases in revenue obtained by co-managers for PAs. In Nicaragua, this element was not applica-ble, since the state does not allocate any budget to co-managed areas, regardless of whether the area generates revenues or not.
In South America, governments generally tend to reduce allocations in PAs that are already at-tended to by other co-management partners. Co-managers usually indicate they do not have enough site-level tools or political support to generate revenues; in some cases, this situation results in these PAs competing with the govern-ment for funding.
122 Fi n a n c i a l s u s t a i n a b i l i t y s co re c a rd
element 5: training and support networks to enable pa managers to operate more Cost-effectively
Regional Overview
This element had the lowest average score across the re-gion in the business planning component. Only Mexico and Colombia obtained scores above 50 percent. The majority of countries in the region obtained scores of less than 30 percent. In general, no PA-specific tools to support cost-effective management were reported. Moreover, no technical coordination is commonplace between institutions and individuals specialized in management effectiveness and those working in finan-cial sustainability. Similarly, very few training oppor-tunities in cost-effective operation are available for PA managers, because financial topics are usually not in-cluded in official training programmes for central and site level staff.
Results by Sub-Element for Element 5: Training and Support Networks to Enable PA Managers to Operate More Cost-Effectively
i) Guidance on cost-effective management devel-oped and being used by PA managers: The ma-jority of PA systems of Mesoamerica+ do not ap-ply cost-effective management guidelines, except in the cases of Cuba and Mexico. Cuba, however, mentions that these directives are still not very ef-fective. Mexico enjoys a catalogue of goods and services at the federal government level, which helps keep acquisition and contracting proce-dures transparent. However, the downside is that these procedures also become less efficient and more expensive, because they are applied equally government-wide. Management activities in most PAs, including Mexico, have a specificity to which the catalogue of tools does not necessarily respond. In general, the main guidelines reported in South America to ensure cost-effective management are linked with the standard processes of government acquisition in each country; no PA-specific tools have been identified.
ii) Inter-PA site-level network exists for PA manag-ers to share information with each other on their costs, practices, and impacts: Learning networks
in PA systems of Mesoamerica+ are not very well developed, with comparisons of operations and costs between PAs seldom made. In South Ameri-ca, Venezuela and Colombia have training centres for PA system staff. The curricula of these train-ing centres include some principles of financial planning. In almost all countries of this subregion, these learning networks exist informally and are activated primarily during meetings and special events or, in some cases, using the radio (at the site level).
iii) Operational and investment cost comparisons between PA sites complete, available, and be-ing used to track PA manager performance: Op-portunities in the region to share information and good financial practices between administrators are informal and depend on the personal initiative of PA managers. However, in Colombia and Ar-gentina, stakeholders reported that issues related to financial resources normally generate attention, promoting an informal exchange of information between PA managers.
iv) Monitoring and learning systems of cost-effec-tiveness are in place and feed into system man-agement policy and planning: No countries in Mesoamerica+ have monitoring and learning systems on cost-effectiveness. In South America, Peru reported an initiative underway to incorpo-rate staff with management background into the PA teams. In Ecuador, ten of the PAs that receive funding from the National Environmental Fund have incorporated an accountant into their teams.
v) PA site managers are trained in financial man-agement and cost-effective management: In general, PA managers of Mesoamerica+ do not receive training in financial management and cost-effective management; in the best case, PA managers have attended courses sporadically, somewhat related to this professional area. Like-wise, in South America, very few initiatives build capacity for staff in sustainable finance. Park ranger schools in Venezuela and Argentina have not incorporated cost-effectiveness and business planning into the curriculum. An excellent rec-ommendation given during the workshops was to create a school of PA managers or administrators, in which management skills could be strengthened
123s u s TA i n A b i l i T y A n A lys i s
and where practical tools could be developed for cost-effective management.
vi) PA financing system facilitates PAs to share costs of common practices with each other and with PA headquarters: Countries in Mesoamerica+ and South America usually share costs for resources such as satellite images, training events, and other capaci-ty-building activities. Scale economies are often pur-sued and are applied particularly at the regional level if there is more than one PA within a region.
4.6 tools for revenue generation by protected areas
introduction of scorecard elements for tools for revenue generation by protected areas
PA systems should be able to attract and take advantage of all existing and potential revenue mechanisms within the context of their overall management priorities. PA systems should also diversify their revenue sources to reduce vulnerability to external shocks and to depen-dency on limited and varying government budgets.
Box 4.11 Revenue Options
Many sources of financing for PAs are possible, in addition to governmental budget allocations. These sources listed here are primarily site-based revenues but can also include earmarked national taxation-based revenue (e.g., national departure tax). Some of these revenue options at site and network levels include the following:
• Fees/charges/taxestobeappliedforavarietyoftourism-based activities based on the value of the resources being visited
• Concessionfeesfortherightstooperatebusi-nesses within PAs
• Concessionfeesfornon-forestgoods extraction within PAs• FinesandpenaltiesforillegalactivitieswithinPAs• Fees/charges/taxestobeappliedforavarietyof
industry-based activities (e.g., aquaculture) based on the value of resources being impacted
regional performance and Key Findings for COMpONeNt 3: tools for revenueGeneration by pas
The tools for revenue generation, analyzed by Com-ponent 3 of the Scorecard, obtained the lowest average regional score of the three components (30 percent). Although tourist entrance fees operate at site levels all across the region, these schemes have various degrees of sophistication and arrangement. Therefore, the low scores in this component indicate the need for contin-ued support of PA systems for revenue generation. The analysis suggests a specific need for (i) implementing a more strategic approach to fee setting across the sys-tem, (ii) applying widely many new revenue generation options, and (iii) strengthening the associated commu-nication and marketing strategies.
Across the region this component (Component 3) gen-erated considerable differences between country scores (Figure 4.12). Only Costa Rica and Colombia obtained a score above 50 percent. Out of the 20 countries as-sessed, 11 had scores below 30 percent, with Nicaragua, Paraguay, and Uruguay scoring 10 percent or less. Uru-guay is addressing this revenue component through a
• Fees/charges/taxes/royaltiesappliedto goods being extracted from a PA (e.g., NTFPs, hydrocarbons, etc.)• Dedicatedtaxesfrompetroleumextraction, gasoline consumption, restaurants, and hotel operations • Merchandisingofproducts(e.g.,organic
agriculture, souvenirs, etc.)• Newchargesleviedtorecoverthecost of providing support services• Environmentalservicepayments(PES),
particularly hydrological• Voluntarydonations• Internationalfunds–fundraising, debt-for-nature swaps, donor projects• Revenuesfromclimatechange– carbon sequestration, reducing natural disasters, etc.
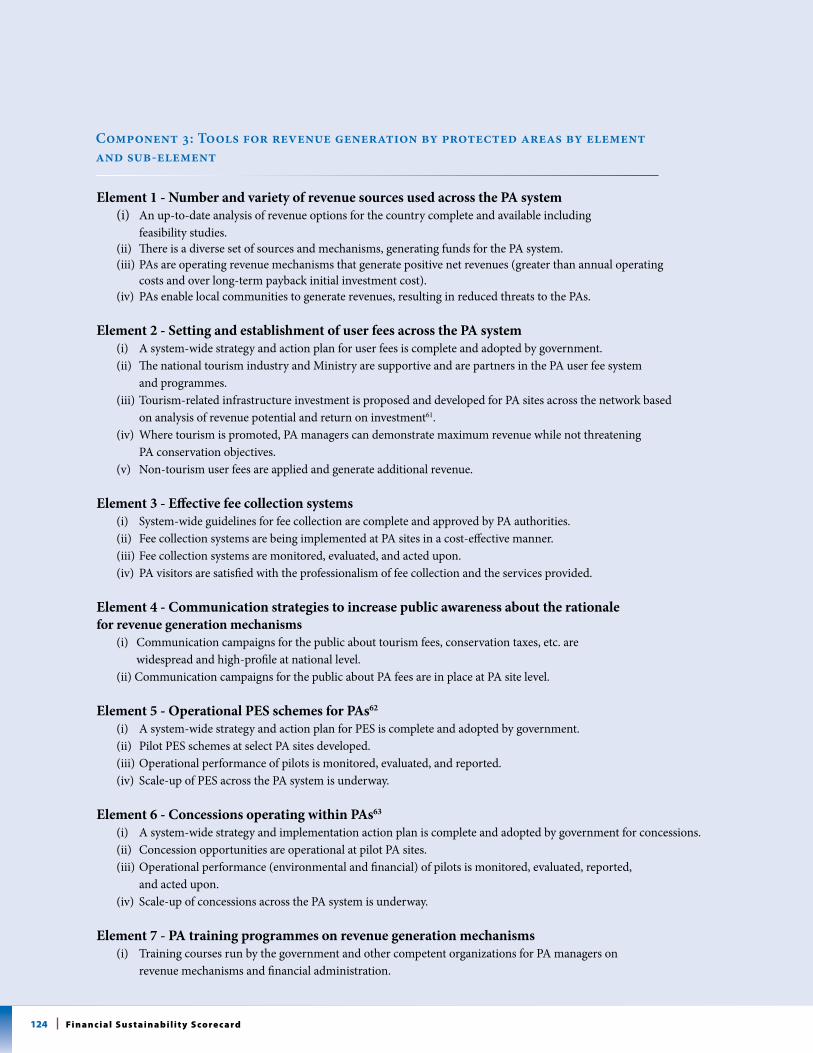
124 Fi n a n c i a l s u s t a i n a b i l i t y s co re c a rd
Element 1 - Number and variety of revenue sources used across the PA system (i) An up-to-date analysis of revenue options for the country complete and available including feasibility studies. (ii) There is a diverse set of sources and mechanisms, generating funds for the PA system. (iii) PAs are operating revenue mechanisms that generate positive net revenues (greater than annual operating costs and over long-term payback initial investment cost). (iv) PAs enable local communities to generate revenues, resulting in reduced threats to the PAs.
Element 2 - Setting and establishment of user fees across the PA system (i) A system-wide strategy and action plan for user fees is complete and adopted by government. (ii) The national tourism industry and Ministry are supportive and are partners in the PA user fee system and programmes. (iii) Tourism-related infrastructure investment is proposed and developed for PA sites across the network based on analysis of revenue potential and return on investment61. (iv) Where tourism is promoted, PA managers can demonstrate maximum revenue while not threatening PA conservation objectives. (v) Non-tourism user fees are applied and generate additional revenue.
Element 3 - Effective fee collection systems (i) System-wide guidelines for fee collection are complete and approved by PA authorities. (ii) Fee collection systems are being implemented at PA sites in a cost-effective manner. (iii) Fee collection systems are monitored, evaluated, and acted upon. (iv) PA visitors are satisfied with the professionalism of fee collection and the services provided.
Element 4 - Communication strategies to increase public awareness about the rationale for revenue generation mechanisms (i) Communication campaigns for the public about tourism fees, conservation taxes, etc. are widespread and high-profile at national level. (ii) Communication campaigns for the public about PA fees are in place at PA site level.
Element 5 - Operational PES schemes for PAs62
(i) A system-wide strategy and action plan for PES is complete and adopted by government. (ii) Pilot PES schemes at select PA sites developed. (iii) Operational performance of pilots is monitored, evaluated, and reported. (iv) Scale-up of PES across the PA system is underway.
Element 6 - Concessions operating within PAs63
(i) A system-wide strategy and implementation action plan is complete and adopted by government for concessions. (ii) Concession opportunities are operational at pilot PA sites. (iii) Operational performance (environmental and financial) of pilots is monitored, evaluated, reported, and acted upon. (iv) Scale-up of concessions across the PA system is underway.
Element 7 - PA training programmes on revenue generation mechanisms (i) Training courses run by the government and other competent organizations for PA managers on revenue mechanisms and financial administration.
Component 3: Tools for revenue generation by protected areas by element and sub-element
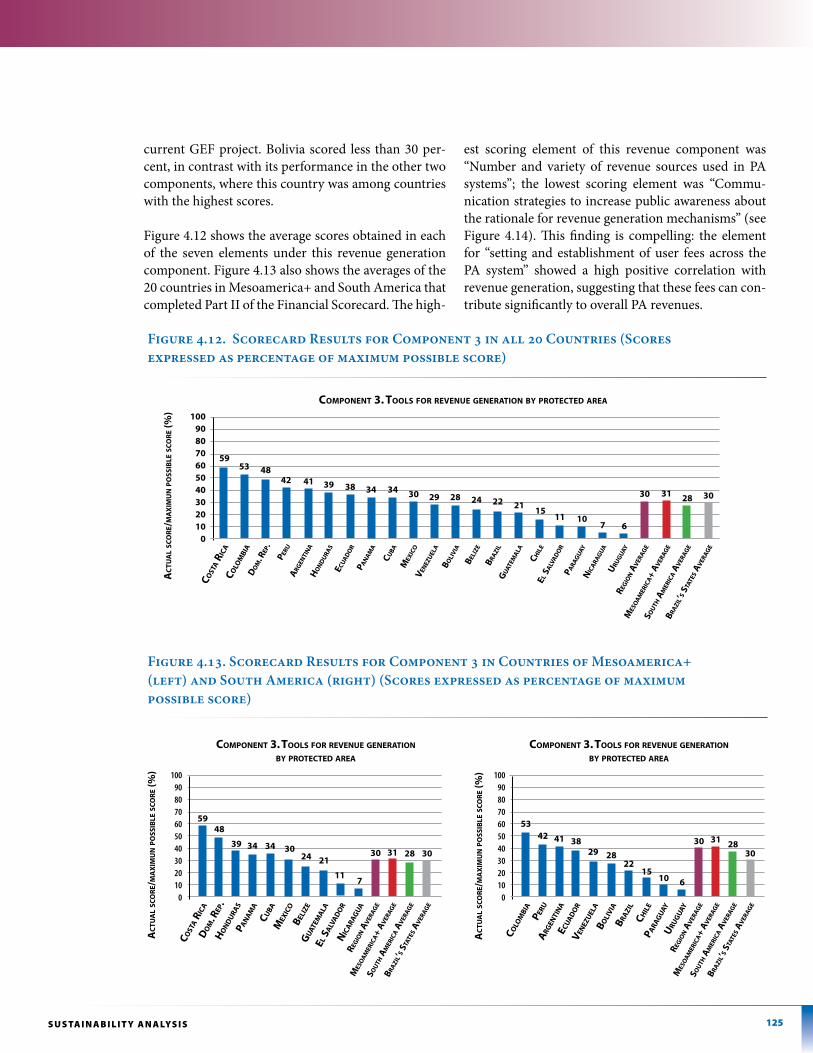
125s u s TA i n A b i l i T y A n A lys i s
current GEF project. Bolivia scored less than 30 per-cent, in contrast with its performance in the other two components, where this country was among countries with the highest scores.
Figure 4.12 shows the average scores obtained in each of the seven elements under this revenue generation component. Figure 4.13 also shows the averages of the 20 countries in Mesoamerica+ and South America that completed Part II of the Financial Scorecard. The high-
est scoring element of this revenue component was “Number and variety of revenue sources used in PA systems”; the lowest scoring element was “Commu-nication strategies to increase public awareness about the rationale for revenue generation mechanisms” (see Figure 4.14). This finding is compelling: the element for “setting and establishment of user fees across the PA system” showed a high positive correlation with revenue generation, suggesting that these fees can con-tribute significantly to overall PA revenues.
Figure 4.12. Scorecard Results for Component 3 in all 20 Countries (Scores expressed as percentage of maximum possible score)
Figure 4.13. Scorecard Results for Component 3 in Countries of Mesoamerica+ (left) and South America (right) (Scores expressed as percentage of maximum possible score)
Cost
a R
iCa
100908070605040302010
0
Colo
mBi
aD
om
. Rep
.peR
ua
RGen
tin
a
5953 48
42 41
Ho
nD
uRa
s
39
eCua
Do
R
38
pan
am
a
34
CuBa
34
mex
iCo
30
Ven
ezu
ela
29
Boli
Via
28
Beliz
e
24
BRazi
l22
Gu
atem
ala
21
CHil
eel s
alV
aD
oR
paRa
Gu
ay
10
niC
aRa
Gu
a
7
uRu
Gu
ay
6
ReGio
n a
VeR
aGe
30
mes
oa
meR
iCa+
aV
eRaG
e
31
sou
tH a
meR
iCa a
VeR
aGe
28
BRazi
l’s s
tate
s aV
eRaG
e
30
act
ua
l sco
re/M
axi
Mu
n Po
ssib
le sc
ore
(%)
Component 3. tools foR ReVenue GeneRation By pRoteCteD aRea
1511
Cost
a R
iCa
59
Do
m. R
ep.
48
Ho
nD
uRa
spa
na
ma
CuBa
Beliz
eG
uat
ema
la
21
niC
aRa
Gu
a
7
ReGio
n a
VeR
aGe
30
mes
oa
meR
iCa+
aV
eRaG
e
31
sou
tH a
meR
iCa a
VeR
aGe
28
BRazi
l’s s
tate
s aV
eRaG
e
3034
24
1009080706050403020100
aC
tua
l sC
oR
e/m
ax
imu
n p
oss
iBle
sC
oR
e (%
)
mex
iCo
30
el sa
lVa
Do
R
11
39 34
Component 3. tools foR ReVenue GeneRation By pRoteCteD aRea
Colo
mBi
a
53
peRu
42
aRG
enti
na
eCua
Do
RV
enez
uel
a
BRazi
lCH
ile
15
uRu
Gu
ay
6
ReGio
n a
VeR
aGe
30
mes
oa
meR
iCa+
aV
eRaG
e
31
sou
tH a
meR
iCa a
VeR
aGe
28
BRazi
l’s s
tate
s aV
eRaG
e
302922
1009080706050403020100
aC
tua
l sC
oR
e/m
ax
imu
n p
oss
iBle
sC
oR
e (%
)
Boli
Via
28
paRa
Gu
ay
10
41 38
Component 3. tools foR ReVenue GeneRation By pRoteCteD aRea
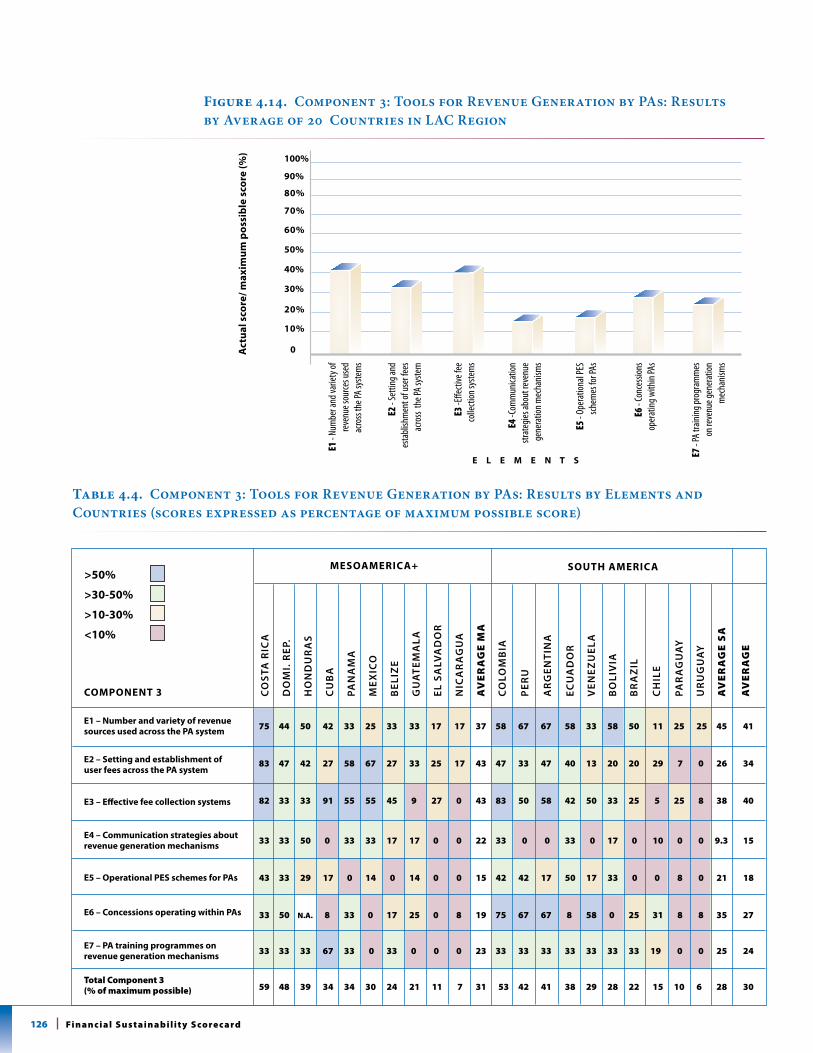
126 Fi n a n c i a l s u s t a i n a b i l i t y s co re c a rd
Figure 4.14. Component 3: Tools for Revenue Generation by PAs: Results by Average of 20 Countries in LAC Region
Table 4.4. Component 3: Tools for Revenue Generation by PAs: Results by Elements and Countries (scores expressed as percentage of maximum possible score)
100%
90%
E1 - n
umbe
r and
varie
ty of
re
venu
e sou
rces u
sed
acro
ss th
e Pa s
yste
ms
E2 -
setti
ng an
d es
tabli
shm
ent o
f use
r fee
s ac
ross
the P
a sys
tem
E3 -e
ffecti
ve fe
e co
llecti
on sy
stem
s
E4 -c
omm
unica
tion
strat
egies
abou
t rev
enue
ge
nera
tion m
echa
nism
s
E5 -
oper
ation
al Pe
s sch
emes
for P
as
E6 -
conc
essio
ns
oper
ating
with
in Pa
s
E7 -
Pa tr
aining
prog
ram
mes
on
reve
nue g
ener
ation
m
echa
nism
s
0
10%
40%
20%
50%
30%
60%
70%
80%
act
ual s
core
/ max
imum
pos
sibl
e sc
ore
(%)
e l e m e n t s
75 44 50 42 33 25 33 33 17 17 37 58 67 67 58 33 58 50 11 25 25 45 41
83 47 42 27 58 67 27 33 25 17 43 47 33 47 40 13 20 20 29 7 0 26 34
82 33 33 91 55 55 45 9 27 0 43 83 50 58 42 50 33 25 5 25 8 38 40
33 33 50 0 33 33 17 17 0 0 22 33 0 0 33 0 17 0 10 0 0 9.3 15
43 33 29 17 0 14 0 14 0 0 15 42 42 17 50 17 33 0 0 8 0 21 18
33 50 n.A. 8 33 0 17 25 0 8 19 75 67 67 8 58 0 25 31 8 8 35 27
33 33 33 67 33 0 33 0 0 0 23 33 33 33 33 33 33 33 19 0 0 25 24
59 48 39 34 34 30 24 21 11 7 31 53 42 41 38 29 28 22 15 10 6 28 30
Co
STA
RiC
A
Do
Mi.
REP
.
Ho
ND
UR
AS
CU
BA
PAN
AM
A
MEx
iCo
BEl
izE
GU
ATE
MA
lA
El S
AlV
AD
oR
NiC
AR
AG
UA
Av
ER
Ag
E m
A
Co
loM
BiA
PER
U
AR
GEN
TiN
A
ECU
AD
oR
VEN
EzU
ElA
Bo
liV
iA
BR
Az
il
CH
ilE
PAR
AG
UA
y
UR
UG
UA
y
Av
ER
Ag
E s
A
Av
ER
Ag
E
Component 3
e1 – number and variety of revenue sources used across the pa system
e2 – setting and establishment of user fees across the pa system
e3 – effective fee collection systems
e4 – Communication strategies about revenue generation mechanisms
e5 – operational pes schemes for pas
e6 – Concessions operating within pas
e7 – pa training programmes on revenue generation mechanisms
Total Component 3(% of maximum possible)
mesoameriCa+ soUth ameriCa>50%
>30-50%
>10-30%
<10%
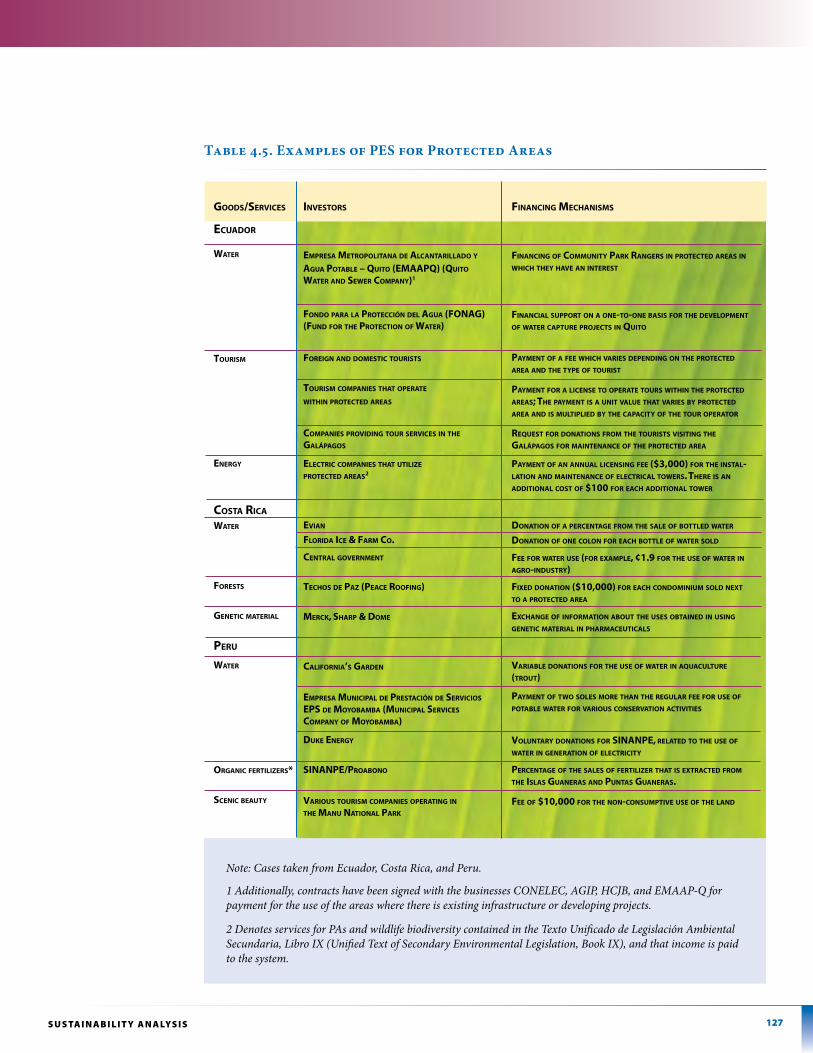
127s u s TA i n A b i l i T y A n A lys i s
Table 4.5. Examples of PES for Protected Areas
Note: Cases taken from Ecuador, Costa Rica, and Peru.
1 Additionally, contracts have been signed with the businesses CONELEC, AGIP, HCJB, and EMAAP-Q for payment for the use of the areas where there is existing infrastructure or developing projects.
2 Denotes services for PAs and wildlife biodiversity contained in the Texto Unificado de Legislación Ambiental Secundaria, Libro IX (Unified Text of Secondary Environmental Legislation, Book IX), and that income is paid to the system.
GooDs/seRViCes
eCuaDoR
wateR
touRism
eneRGy
Costa RiCa
wateR
foRests
GenetiC mateRial
peRu
wateR
oRGaniC feRtilizeRs*
sCeniC Beauty
inVestoRs
empResa metRopolitana De alCantaRillaDo y aGua potaBle – quito (emaapq) (quito wateR anD seweR Company)1
fonDo paRa la pRoteCCión Del aGua (fonaG) (funD foR tHe pRoteCtion of wateR)
foReiGn anD DomestiC touRists
touRism Companies tHat opeRate witHin pRoteCteD aReas
Companies pRoViDinG touR seRViCes in tHe GalápaGos
eleCtRiC Companies tHat utilize pRoteCteD aReas2
eVian
floRiDa iCe & faRm Co.
CentRal GoVeRnment
teCHos De paz (peaCe RoofinG)
meRCk, sHaRp & Dome
CalifoRnia’s GaRDen
empResa muniCipal De pRestaCión De seRViCios eps De moyoBamBa (muniCipal seRViCes Company of moyoBamBa)
Duke eneRGy
sinanpe/pRoaBono
VaRious touRism Companies opeRatinG intHe manu national paRk
finanCinG meCHanisms
finanCinG of Community paRk RanGeRs in pRoteCteD aReas in wHiCH tHey HaVe an inteRest
finanCial suppoRt on a one-to-one Basis foR tHe DeVelopment of wateR CaptuRe pRojeCts in quito
payment of a fee wHiCH VaRies DepenDinG on tHe pRoteCteD aRea anD tHe type of touRist
payment foR a liCense to opeRate touRs witHin tHe pRoteCteD aReas; tHe payment is a unit Value tHat VaRies By pRoteCteD aRea anD is multiplieD By tHe CapaCity of tHe touR opeRatoR
Request foR Donations fRom tHe touRists VisitinG tHe GalápaGos foR maintenanCe of tHe pRoteCteD aRea
payment of an annual liCensinG fee ($3,000) foR tHe instal-lation anD maintenanCe of eleCtRiCal toweRs. tHeRe is an aDDitional Cost of $100 foR eaCH aDDitional toweR
Donation of a peRCentaGe fRom tHe sale of BottleD wateR
Donation of one Colon foR eaCH Bottle of wateR solD
fee foR wateR use (foR example, ¢1.9 foR tHe use of wateR in aGRo-inDustRy)
fixeD Donation ($10,000) foR eaCH ConDominium solD next to a pRoteCteD aRea
exCHanGe of infoRmation aBout tHe uses oBtaineD in usinG GenetiC mateRial in pHaRmaCeutiCals
VaRiaBle Donations foR tHe use of wateR in aquaCultuRe (tRout)
payment of two soles moRe tHan tHe ReGulaR fee foR use of potaBle wateR foR VaRious ConseRVation aCtiVities
VoluntaRy Donations foR sinanpe, RelateD to tHe use of wateR in GeneRation of eleCtRiCity
peRCentaGe of tHe sales of feRtilizeR tHat is extRaCteD fRom tHe islas GuaneRas anD puntas GuaneRas.
fee of $10,000 foR tHe non-ConsumptiVe use of tHe lanD
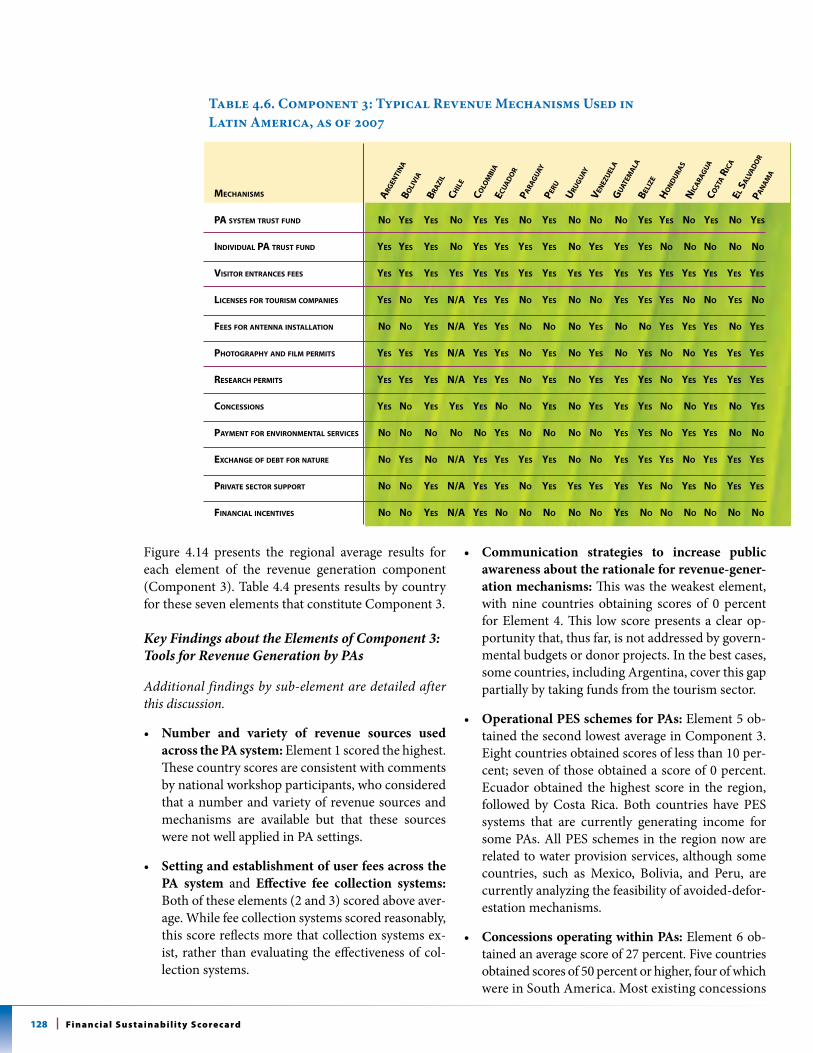
128 Fi n a n c i a l s u s t a i n a b i l i t y s co re c a rd
Figure 4.14 presents the regional average results for each element of the revenue generation component (Component 3). Table 4.4 presents results by country for these seven elements that constitute Component 3.
Key Findings about the Elements of Component 3: Tools for Revenue Generation by PAs
Additional findings by sub-element are detailed after this discussion.
• Number and variety of revenue sources used across the PA system: Element 1 scored the highest. These country scores are consistent with comments by national workshop participants, who considered that a number and variety of revenue sources and mechanisms are available but that these sources were not well applied in PA settings.
• Setting and establishment of user fees across the PA system and Effective fee collection systems: Both of these elements (2 and 3) scored above aver-age. While fee collection systems scored reasonably, this score reflects more that collection systems ex-ist, rather than evaluating the effectiveness of col-lection systems.
• Communication strategies to increase public awareness about the rationale for revenue-gener-ation mechanisms: This was the weakest element, with nine countries obtaining scores of 0 percent for Element 4. This low score presents a clear op-portunity that, thus far, is not addressed by govern-mental budgets or donor projects. In the best cases, some countries, including Argentina, cover this gap partially by taking funds from the tourism sector.
• Operational PES schemes for PAs: Element 5 ob-tained the second lowest average in Component 3. Eight countries obtained scores of less than 10 per-cent; seven of those obtained a score of 0 percent. Ecuador obtained the highest score in the region, followed by Costa Rica. Both countries have PES systems that are currently generating income for some PAs. All PES schemes in the region now are related to water provision services, although some countries, such as Mexico, Bolivia, and Peru, are currently analyzing the feasibility of avoided-defor-estation mechanisms.
• Concessions operating within PAs: Element 6 ob-tained an average score of 27 percent. Five countries obtained scores of 50 percent or higher, four of which were in South America. Most existing concessions
Table 4.6. Component 3: Typical Revenue Mechanisms Used in Latin America, as of 2007
aRG
enti
na
Boli
Via
BRazi
l
CHil
e
Colo
mBi
aeCu
aD
oR
peRu
uRu
Gu
ayV
enez
uel
aG
uat
ema
laBel
ize
Ho
nD
uRa
sn
iCa
RaG
ua
Cost
a R
iCa
el sa
lVa
Do
R
paRa
Gu
ay
meCHanisms
pa system tRust funD no yes yes no yes yes no yes no no no yes yes no yes no yes
inDiViDual pa tRust funD yes yes yes no yes yes yes yes no yes yes yes no no no no no
VisitoR entRanCes fees yes yes yes yes yes yes yes yes yes yes yes yes yes yes yes yes yes
liCenses foR touRism Companies yes no yes n/a yes yes no yes no no yes yes yes no no yes no
fees foR antenna installation no no yes n/a yes yes no no no yes no no yes yes yes no yes
pHotoGRapHy anD film peRmits yes yes yes n/a yes yes no yes no yes no yes no no yes yes yes
ReseaRCH peRmits yes yes yes n/a yes yes no yes no yes yes yes no yes yes yes yes
ConCessions yes no yes yes yes no no yes no yes yes yes no no yes no yes
payment foR enViRonmental seRViCes no no no no no yes no no no no yes yes no yes yes no no
exCHanGe of DeBt foR natuRe no yes no n/a yes yes yes yes no no yes yes yes no yes yes yes
pRiVate seCtoR suppoRt no no yes n/a yes yes no yes yes yes yes yes no yes no yes yes
finanCial inCentiVes no no yes n/a yes no no no no no yes no no no no no no
pan
am
a
129s u s TA i n A b i l i T y A n A lys i s
are related to tourism, representing the second most important source of self-generated income. In most countries of Mesoamerica+, the concession mecha-nism is still at an early stage, while in South America, implementation of this funding mechanism has a long history in Argentina and Chile.
• PA training programmes on revenue generation mechanisms: Element 7 scored low, demonstrat-ing that across the region initiatives for building capacity are absent or deficient. Almost none of the few training programmes for PA staff in the region include revenue generation mechanism in their curricula. For example, the two schools for rangers located in Argentina and Venezuela do not include sustainable finance as a topic.
4.7 Component 3: tools for revenue Generation by protected areas — results by elements
element 1: number and variety of revenue sources Used across the protected area system
Regional Overview
This element obtained the highest average score (41 percent) in the revenue generation component (Com-ponent 3). Considerably more countries in South America obtained scores above 50 percent than did countries in Mesoamerica+. However, Costa Rica had the highest score in the entire region, with 75 percent.
Tourism-related mechanisms account for the largest percentage of self-generated income by PAs, but the re-gion as a whole also has innovative mechanisms and non-traditional sources of funding. A number of ap-proaches and models are currently generating lessons that offer lessons and benchmark opportunities, both within and outside the region.
In general, most countries had identified a variety of financial mechanisms to generate revenues for their PAs. However, typically these mechanisms are not im-plemented to their full potential, showing the need to improve the quality of those mechanisms already estab-lished. See Table 4.5 for PES examples and locations. Table 4.6 shows a number of revenue mechanisms un-derway in the region.
Results by Sub-Element of Element 1: Number and Variety of Revenue Sources Used across the PA System
i) An up-to-date analysis of revenue options for the country complete and available: PA systems of most countries in Mesoamerica+ hold lists of revenue options, but most of these lists require up-dating and are not backed by specific studies that analyze the feasibility of each option or provide a roadmap for implementation. Similarly, in South America, Peru and Ecuador report that PA rev-enue options have been identified but still require further analysis to determine feasibility. Colombia reports undertaking feasibility studies primarily for tourism concessions.
ii) There is a diverse set of sources and mechanisms generating funds for the PA system: In Meso-america+, Costa Rica reports implementing all feasible funding sources and revenue mechanisms for PAs, while in the rest of the subregion, the number of mechanisms being implemented vary from a few to many. In South America, countries have a set of revenue mechanisms. Table 4.7 shows the types of mechanisms established in countries in South America and Mesoamerica+. Data for this sub-element shows that mechanisms exist; however, the extent of implementation was often limited, with these mechanisms only applied to a small percentage of PAs.
iii) PAs are operating revenue mechanisms that gen-erate positive net revenues (greater than annual operating costs and over long-term payback initial investment cost): In most of the region, investments in PAs do not result from economic analysis and do not assess returns, which means that these investments cannot show positive net economic benefits. Only a few countries, such as Colombia and Argentina, are starting to track re-turn on PA investments particularly for tourism concessions.
iv) PAs enable local communities to generate rev-enues, resulting in reduced threats to the PAs: In most PA systems in Mesoamerica+, local com-munities are allowed to generate income in certain PAs. In South America, Venezuela and Bolivia support community revenue generation in PAs to improve living conditions for local communities, with less focus on the impacts of these activities for
pan
am
a
130 Fi n a n c i a l s u s t a i n a b i l i t y s co re c a rd
PA financial sustainability. Colombia and Argen-tina have revenue mechanisms, primarily conces-sions, to benefit both local communities and PAs.
element 2: setting and establishment of User Fees across the pa system
Regional Overview
The regional average for this revenue-generating ele-ment in Component 3 was 34 percent. Countries in Mesoamerica+ in general performed better than coun-tries in South America. However, many countries in both subregions do not have systems in place to set and update entrance fees based upon technical crite-ria. Throughout the region, coordination between PA authorities and the private tourism sector is weak for the establishment and collection of entrance fees. Some countries, however, are starting to work on relations with ministries of tourism. Non-tourism fees exist in a few countries, but the revenues produced by these ac-tivities are usually not very significant when compared to entrance fees.
Current practice by countries in both subregions tends to establish similar fees for all PAs, as if consumers were indifferent to the quality of visitor attractions, acces-sibility, uniqueness, and other attributes. The current lack of structure, market assessments, and willingness-to-pay approaches have caused PAs to miss opportuni-ties for higher self-generated revenues. The Scorecard shows that countries scoring higher in this element about market sensitivity to fee structures indeed gener-ated more revenues.
Box 4.12 Best Practice Country Example
Fees based on market analysis
Panama’s Environmental Regulation C estab-lishes fees for the use of environmental services provided by PA areas of the National System of Protected Areas (SINAP), including entrance fees for different PAs based on each PA location and users, as well as fees for lodging, camping, anchorage, photography, and filming.
Results by Sub-Element of Element 2: Setting and Establishment of User Fees across the PA System
i) A system-wide strategy and action plan for user fees is complete and adopted by government: In Mesoamerica+, Panama, Mexico, Costa Rica, and the Dominican Republic have system-wide strate-gies for user fees. All other countries do not have unified user fee systems. For example, in Cuba and Guatemala, the individual institutions that manage PAs set different fees. A unified fee system has been created in El Salvador, but this practice is not yet applied to all PAs. In South America, only Colom-bia and Argentina present clear strategies for user fees, although their strategies only cover fees relat-ed to tourism, most particularly entrance fees. In most other countries of the subregion, entrance fees for tourists are not established using robust methods and procedures. However, an interest-ing policy was found in Argentina. This policy allows fee collections only once adequate infra-structure is in place, thus differing significantly with other PAs in the region, where fees are col-lected whether the area provides basic services for visitors or not.
ii) The national tourism industry and Ministry are supportive and are partners in the PA user fee sys-tems and programmes: In Mesoamerica+, only the PA system in Costa Rica has effective support from the tourism industry and Tourism Ministry for user fee systems and programmes. In South America, re-lationships with tourism sector authorities are con-sidered to be good, resulting in joint coordination for establishing and promoting fees. In Ecuador, the tourism sector participates in investments for visitor infrastructure. However, regionally, some countries experience difficult relations with the tourism indus-try. PAs across the region also still have limited man-agement tools for dealing with visitors.
iii) Tourism-related infrastructure investment is proposed and developed for PA sites across the network based on analysis of revenue potential and return on investment: In Mesoamerica+, investments in tourism infrastructure in PAs are not frequently made based on feasibility studies, except in the case of Honduras, where interna-tional cooperation organizations require these
131s u s TA i n A b i l i T y A n A lys i s
studies. In South America, only Colombia re-ported that its decisions regarding new tourism infrastructure and concessions were based upon technical feasibility studies. Venezuela and Ar-gentina mentioned having the information and capacities needed for this element but are not un-dertaking such analyses yet.
iv) Where tourism is promoted, PA managers can demonstrate maximum revenue while not threatening PA conservation objectives: In the majority of PA systems in the region, no system-atic use is made of tools to ensure that revenues from tourism do not affect PA conservation ob-jectives. This lack of attention to the tradeoff be-tween revenue generation and conservation risk is a management problem. This disconnect between revenue and conservation might be closely linked to the absence of up-to-date management plans, which can lead to activities being approved with-out proper zoning, without understanding ecolog-ical baselines, and without acknowledging limited PA capacity to perform monitoring. Countries reported that they already see signs of unsustain-able tourism and now call for better management of tourist activities within PAs, by both private op-erators and PA authorities.
v) Non-tourism user fees are applied and generate additional revenue: Mesoamerican+ PAs tend to have more fees not related to tourism than South American PAs. The most common non-tourism fees noted in this element are for research and photography permits. In South America, only Ecuador, Colombia, and Venezuela have fees for infrastructure installed in PAs. Only Ecuador has fees for other environmental services (PES activi-ties) such as water provision or protection.
element 3: effective Fee Collection systems
Regional Overview
This revenue element of Component 3 obtained an av-erage regional score of 40 percent. In both Mesoameri-ca+ and South America this element also obtained one of the highest scores among elements within the rev-enue generation component. These high scores, region-
ally and subregionally, reflect the existence of collection systems but not necessarily their effectiveness. Colom-bia has the highest score in South America, with 83 per-cent, while Cuba has the highest score in Mesoameri-ca+, with 91 percent. Nevertheless, in both subregions, most countries still lack guidelines or procedures for cost-effective fee collection. Furthermore, the perfor-mance of these systems is seldom monitored. Therefore, a significant portion of potential revenue might be lost due to inefficiencies in fee collection systems. Also, PA staff members often devote a large proportion of time to selling tickets instead of performing other duties that fulfill individual PA objectives and management pro-grammes. The workshop process identified emerging cases, like Argentina, where private sector and commu-nity entities play a role in fee collection, either through reservation procedures, direct concessions for fee col-lection, or agreements with local communities.
Box 4.13 Best Practice Country Examples
In Colombia, PAs with many visitors, agree-ments, and concessions delegate fee collection to third parties, while in PAs with few visitors, this task is usually performed by PA staff.
Some PAs in Argentina have established agreements with local NGOs to collect fees. A range of between 20 percent and 50 percent of the revenues generated by these mechanisms is shared with local partners.
Results by Sub-Element of Element 3: Effective Fee Collection Systems
i) System-wide guidelines for fee collection are complete and approved by PA authorities: In Mesoamerica+, Panama, Mexico, Costa Rica, and Cuba report having guidelines for fee collection in their PAs. In other countries, these guidelines are either being developed, as in Honduras and El Salvador, or being revised, which is the case for Guatemala. Belize maintains complete fee collection guidelines only for Marine Reserves. Nicaragua has no fee collection guidelines. In
132 Fi n a n c i a l s u s t a i n a b i l i t y s co re c a rd
South America, four countries — Argen-tina, Colombia, Peru, and Ecuador — have guidelines for fee collection that are cur-rently being implemented. Venezuela and Bolivia, also have fee collection guidelines, but these guidelines are applied only in few PAs that actually generate revenues. Bra-zil is developing fee collection guidelines. Paraguay and Uruguay do not yet have any guidelines. In general, countries in this sub-region had difficulties in defining practices or procedures that can be considered cost-effective. In Peru, for instance, fee levels are relatively low in relation to the amount in-vested in providing services to the visitors.
ii) Fee collection systems are being imple-mented at PA sites in a cost-effective man-ner: Clear strategies and specific action plans for fee collection were reported as being implemented only in Costa Rica, Cuba, Ar-gentina, and Belize. For Belize, these systems are implemented only for Forest Reserves. Although Panama scored relatively low in this sub-element, this country is currently applying a cost-effective fee collection system in some PAs. In this scheme, tour operators may purchase tickets in advance, thus reduc-ing time spent at entrance gates, lowering transaction costs, and improving cash man-agement at site levels.
iii) Fee collection systems are monitored, eval-uated, and acted upon: In Mesoamerica+, only Cuba reports effective monitoring of fee collection systems. In South America, both Argentina and Colombia monitor and evaluate fee collection systems satisfactorily. Argentina is currently implementing an au-tomated fee collection system. The rest of the countries in the region report that their fee collection systems are not adequately moni-tored, which means current practices are fail-ing to detect the loss of potential revenue due to inefficiencies in fee collection systems.
iv) PA visitors are satisfied with the profes-sionalism of fee collection and the servic-es provided: The majority of countries in the region declared that satisfaction of visi-
tors to PAs is monitored. However, this visi-tor feedback practice is not conducted in all PAs, nor is this practice performed system-atically. For example, sometimes this feed-back monitoring consists only of entrants commenting in a visitor book. Even in those few countries where visitor satisfaction sur-veys are applied, these instruments have not yet analyzed specific issues such as visitor satisfaction with staff professionalism and fee collection methods.
element 4: Communication strategies to increase public awareness about the rationale for revenue generation mechanisms
Regional Overview
This element obtained the lowest average regional score out of the entire Part II of the Scorecard ex-ercise. This low score clearly indicates urgent pri-ority. Ten countries obtained scores of less than 10 percent; nine of those obtained a score of 0 percent. Low scores reflect insufficient awareness of the importance of this communication element as a key complement to all other revenue genera-tion efforts; low scores in the element are also as-sociated with smaller government budget alloca-tions. Joint collaboration between PA authorities, tourism authorities, and private sector offers the potential to leverage resources needed for imple-menting activities and to raise public awareness about revenue generating mechanisms.
Results by Sub-Element of Element 4: Communication Strategies to Increase Public Awareness about the Rationale for Revenue Generation Mechanisms
i) Communication campaigns for the public about tourism fees, conservation taxes, etc. are widespread and high-profile at national level: Marketing and communication cam-paigns explaining tourism fees, conservation taxes, and other revenue mechanisms for PAs are rudimentary for most PA systems in Me-soamerica+. In South America, PAs have ma-terial and communication campaigns about
© a
nabe
la Ga
rcía/
tnc
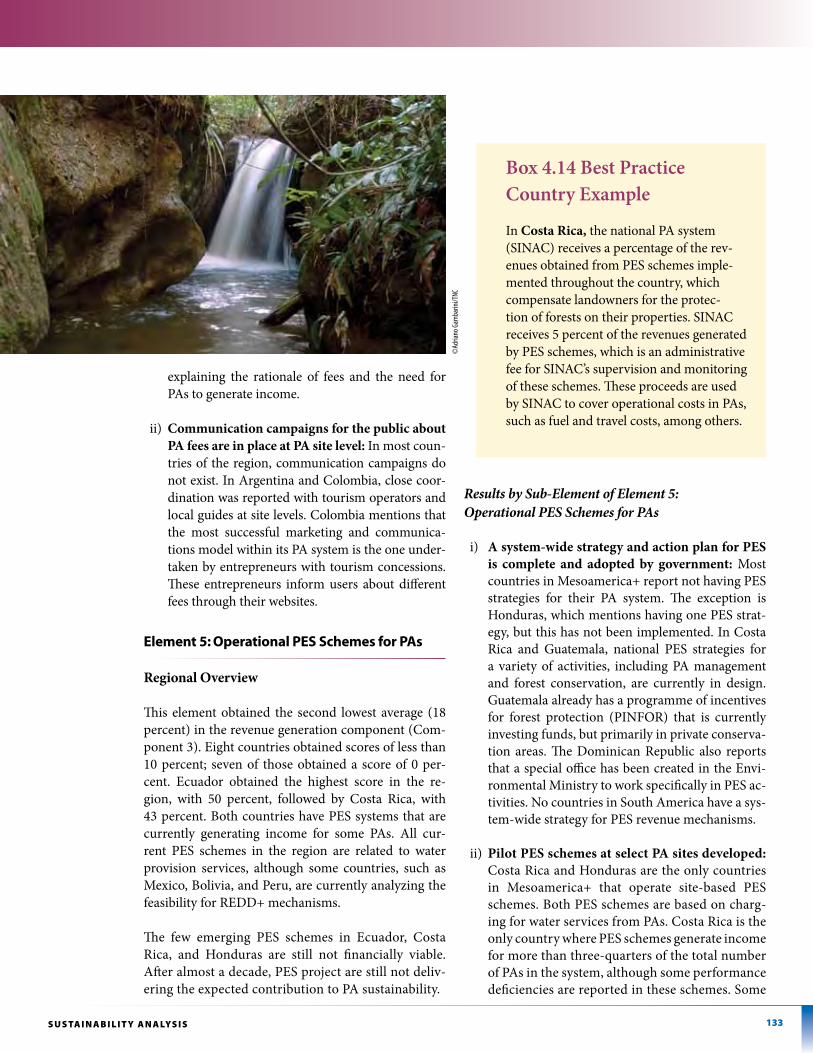
133s u s TA i n A b i l i T y A n A lys i s
PAs, but these actions are not oriented toward
explaining the rationale of fees and the need for PAs to generate income.
ii) Communication campaigns for the public about PA fees are in place at PA site level: In most coun-tries of the region, communication campaigns do not exist. In Argentina and Colombia, close coor-dination was reported with tourism operators and local guides at site levels. Colombia mentions that the most successful marketing and communica-tions model within its PA system is the one under-taken by entrepreneurs with tourism concessions. These entrepreneurs inform users about different fees through their websites.
element 5: Operational peS Schemes for pas
Regional Overview
This element obtained the second lowest average (18 percent) in the revenue generation component (Com-ponent 3). Eight countries obtained scores of less than 10 percent; seven of those obtained a score of 0 per-cent. Ecuador obtained the highest score in the re-gion, with 50 percent, followed by Costa Rica, with 43 percent. Both countries have PES systems that are currently generating income for some PAs. All cur-rent PES schemes in the region are related to water provision services, although some countries, such as Mexico, Bolivia, and Peru, are currently analyzing the feasibility for REDD+ mechanisms.
The few emerging PES schemes in Ecuador, Costa Rica, and Honduras are still not financially viable. After almost a decade, PES project are still not deliv-ering the expected contribution to PA sustainability.
Box 4.14 Best Practice Country Example
In Costa Rica, the national PA system (SINAC) receives a percentage of the rev-enues obtained from PES schemes imple-mented throughout the country, which compensate landowners for the protec-tion of forests on their properties. SINAC receives 5 percent of the revenues generated by PES schemes, which is an administrative fee for SINAC’s supervision and monitoring of these schemes. These proceeds are used by SINAC to cover operational costs in PAs, such as fuel and travel costs, among others.
Results by Sub-Element of Element 5: Operational PES Schemes for PAs
i) A system-wide strategy and action plan for PES is complete and adopted by government: Most countries in Mesoamerica+ report not having PES strategies for their PA system. The exception is Honduras, which mentions having one PES strat-egy, but this has not been implemented. In Costa Rica and Guatemala, national PES strategies for a variety of activities, including PA management and forest conservation, are currently in design. Guatemala already has a programme of incentives for forest protection (PINFOR) that is currently investing funds, but primarily in private conserva-tion areas. The Dominican Republic also reports that a special office has been created in the Envi-ronmental Ministry to work specifically in PES ac-tivities. No countries in South America have a sys-tem-wide strategy for PES revenue mechanisms.
ii) Pilot PES schemes at select PA sites developed: Costa Rica and Honduras are the only countries in Mesoamerica+ that operate site-based PES schemes. Both PES schemes are based on charg-ing for water services from PAs. Costa Rica is the only country where PES schemes generate income for more than three-quarters of the total number of PAs in the system, although some performance deficiencies are reported in these schemes. Some
©ad
riano
Gam
barin
i/tnc
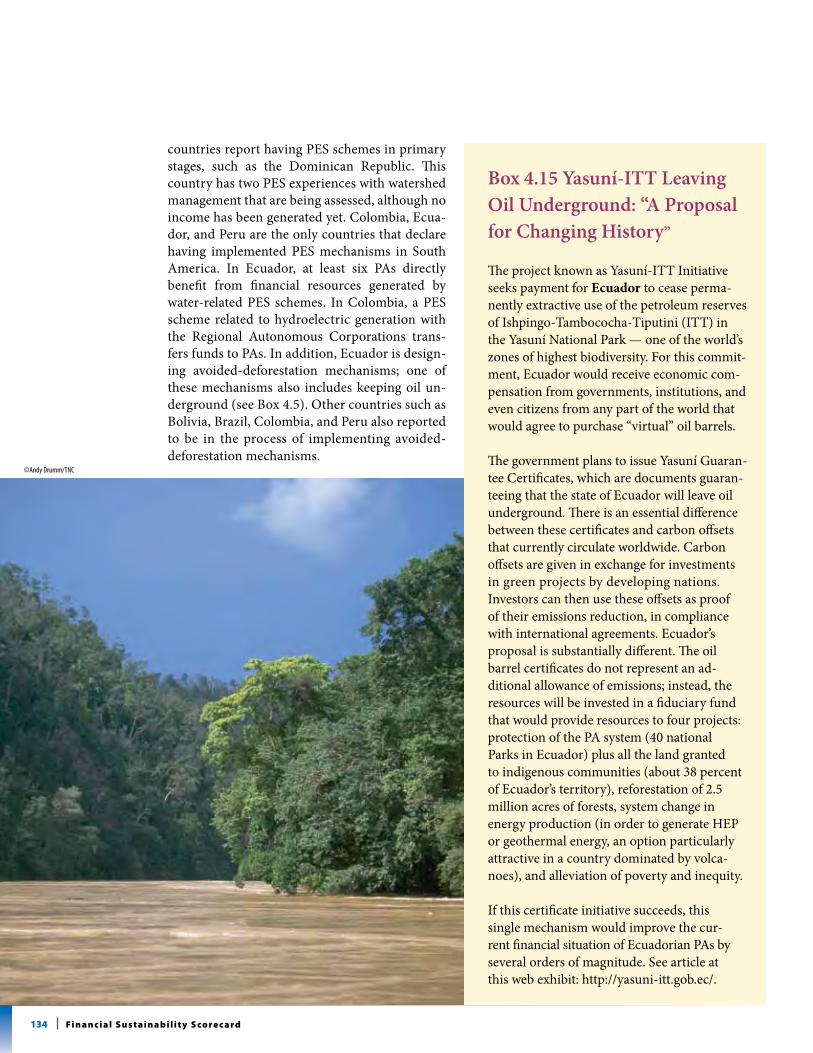
134 Fi n a n c i a l s u s t a i n a b i l i t y s co re c a rd
countries report having PES schemes in primary stages, such as the Dominican Republic. This country has two PES experiences with watershed management that are being assessed, although no income has been generated yet. Colombia, Ecua-dor, and Peru are the only countries that declare having implemented PES mechanisms in South America. In Ecuador, at least six PAs directly benefit from financial resources generated by water-related PES schemes. In Colombia, a PES scheme related to hydroelectric generation with the Regional Autonomous Corporations trans-fers funds to PAs. In addition, Ecuador is design-ing avoided-deforestation mechanisms; one of these mechanisms also includes keeping oil un-derground (see Box 4.5). Other countries such as Bolivia, Brazil, Colombia, and Peru also reported to be in the process of implementing avoided-deforestation mechanisms.
Box 4.15 Yasuní-ITT Leaving Oil Underground: “A Proposal for Changing History”
The project known as Yasuní-ITT Initiative seeks payment for Ecuador to cease perma-nently extractive use of the petroleum reserves of Ishpingo-Tambococha-Tiputini (ITT) in the Yasuní National Park — one of the world’s zones of highest biodiversity. For this commit-ment, Ecuador would receive economic com-pensation from governments, institutions, and even citizens from any part of the world that would agree to purchase “virtual” oil barrels.
The government plans to issue Yasuní Guaran-tee Certificates, which are documents guaran-teeing that the state of Ecuador will leave oil underground. There is an essential difference between these certificates and carbon offsets that currently circulate worldwide. Carbon offsets are given in exchange for investments in green projects by developing nations. Investors can then use these offsets as proof of their emissions reduction, in compliance with international agreements. Ecuador’s proposal is substantially different. The oil barrel certificates do not represent an ad-ditional allowance of emissions; instead, the resources will be invested in a fiduciary fund that would provide resources to four projects: protection of the PA system (40 national Parks in Ecuador) plus all the land granted to indigenous communities (about 38 percent of Ecuador’s territory), reforestation of 2.5 million acres of forests, system change in energy production (in order to generate HEP or geothermal energy, an option particularly attractive in a country dominated by volca-noes), and alleviation of poverty and inequity.
If this certificate initiative succeeds, this single mechanism would improve the cur-rent financial situation of Ecuadorian PAs by several orders of magnitude. See article at this web exhibit: http://yasuni-itt.gob.ec/.
©andy drumm/tnc
135s u s TA i n A b i l i T y A n A lys i s
iii) Operational performance of pilots is moni-tored, evaluated, and reported: To a certain extent, monitoring and evaluation of PES pi-lot schemes occurs at the site level. However, many of these results have not been widely reported to larger audiences.
iv) Scale up of PES across the PA system is un-derway: Not one country in the region has a process for scaling up these mechanisms across its national PA system.
element 6: Concessions Operating within pas
Regional Overview
This element of the revenue-generating compo-nent (Component 3) obtained an average score of 27 percent. Five countries obtained scores of 50 percent or higher, four of which are in South America. The vast majority of existing conces-sions in this subregion is related to tourism, rep-resenting the second most important source of self-generated income. In most countries of Me-soamerica+, the concession mechanism is still at an early stage. In South America, implementation of concession mechanisms has a long history in Argentina and Chile. In general terms, the entire region does not have legal barriers for implement-ing concessions. This mechanism is often recog-nized by legal frameworks but is not specifically regulated to operate in PAs. This finding indicates the need for developing specific regulations and capacities to make this concession revenue mech-anism operational in PAs across the region.
Even countries that do not have concessions rec-ognize the potential of this mechanism as a source of revenue or cost savings. However, setting up a concession scheme requires considerable techni-cal and negotiation capacity to identify the best conditions for generating mutual benefit oppor-tunities for PAs, the government, communities, and private entrepreneurs. Although the region has learned many lessons while implementing concessions, analysis on concessions is needed to maximize PA benefits. Studies can help establish benchmarks and replicate best practices.
Results by Sub-Element of Element 6: Concessions Operating within PAs
i) A system-wide strategy and implementa-tion action plan is complete and adopted by government for concessions: Concessions are relatively recent in Mesoamerica+; most countries in the subregion lack formal action plans to implement a concessions strategy. The exceptions are Panama, Costa Rica, and the Dominican Republic, which are develop-ing respective system-level strategies for con-cessions. South America has more experience with concessions, particularly Argentina and Chile. Only Bolivia declared that it maintains a constitutional mandate against concessions, making this strategy nonviable for the coun-try. Ecuador, Paraguay, and Uruguay, which present low scores on this sub-element, men-tion that opportunities exist within their sys-tems for concessions but that the conditions necessary to implement are not in place.
ii) Concession opportunities are operational at pilot PA sites: In Mesoamerica+, several types of concessions operate in Panama, Costa Rica, Guatemala, Belize, and the Dominican Re-public. Guatemala reported that opportuni-ties for concessions were constrained in some cases because of communal or municipal land tenure. Nicaragua reports concessions for energy production and shrimp farms within PAs, but these do not generate benefits to the PA system. Cuba does not have the option of concessions within PAs due to the lack of a le-gal instrument permitting this activity; how-ever, Cuba sees possibility in implementing concessions in the future. In South America, four countries — Argentina, Colombia, Peru, and Venezuela — declare that they operate concessions within their PA systems.
iii) Operational performance (environmental and financial) of pilots is monitored, evalu-ated, reported, and acted upon: For Meso-america+, Panama, Guatemala, Costa Rica, Belize, and the Dominican Republic report that at least part of their concessions are pe-riodically monitored for operational perfor-mance. This feedback is used as a basis for
136 Fi n a n c i a l s u s t a i n a b i l i t y s co re c a rd
improvement. In Chile, Argentina, and more recently Colombia, with years of concessions experience, have developed competency in the negotiation, qualification, and follow-up processes of concession systems. Systematiz-ing these experiences as best practices could support countries willing to improve existing concessions schemes or develop new ones.
iv) Scale-up of concessions across the PA system is underway: Plans to establish new conces-sions schemes were announced in Argentina and Colombia. After successful concession experiences with the private sector, Colom-bia will focus on new schemes that promote expanded community involvement. Conces-sions in Mesoamerica+ are still at an early stage, so these scaling-up plans were not dis-cussed in this subregional workshop.
element 7: pa training programmes on revenue generation mechanisms
Regional Overview
This element of Component 3 (revenue genera-tion) had an average score of 24 percent. All coun-tries except Cuba obtained scores of 33 percent or less. As with other elements related to human ca-pacity, the results from this element indicate the need to focus attention on human resources with financial, economic, and marketing backgrounds. This score reflects the fact that almost none of the few training programmes for PA staff in the re-gion include revenue generation mechanisms in their curricula.
Existing professional education efforts in PAs gen-erally address technical capacities for staff-moni-toring, patrolling, or promoting community devel-opment. However, the low scores across the region suggest significant deficiencies in terms of capacity building initiatives to strengthen revenue mecha-nisms. For example, the two schools for rangers lo-cated in Argentina and Venezuela do not include sustainable finance as part of their curricula.
Training and capacity building should, at an early stage, be directed towards the design and follow-
up of financial mechanisms at the system level. In a later, more mature stage, specific training on revenue generation practices should be directed at site level, as part of the broad implementation of financial mechanisms.
Results by Sub-Element of Element 7: PA Training Programmes on Revenue Generation Mechanisms
i) Training courses run by the government and other competent organizations for PA managers on revenue mechanisms and financial administration: Income generating mechanisms are not included in the training programmes for staff of PA systems in Meso-america+. Therefore, park managers have, in the best of cases, sporadic exposure to these topics through isolated courses. Cuba is the exception. There, PA managers receive train-ing in revenue generation within their normal training programme. However, even in Cuba, this type of training is limited to those PAs un-der administration of the National Enterprise for the Protection of Flora and Fauna. Manag-ers from other PAs of the Cuban system do not receive this training. In South America, this element obtained a low score, confirming the generalized absence of training and human capacity-building programmes for revenue generation. Colombia and Bolivia declared that their staff can benefit from training in fi-nancial topics offered by the state, but these topics do not form part of the standard train-ing programmes for PA staff. Brazil’s ICMBio prepared a training programme about finan-cial mechanisms for PA managers, but this programme has not yet been implemented. In Argentina, although the PA mandate includes the establishment of fees, concessions, and tourism activities amongst its competencies, the government does not formally pursue in-come generation. This is why no courses are offered on this topic.
Chapter Five continues this Report by developing summation conclusions about Scorecard findings from Parts I and II and presents recommenda-tions for the roadmap toward PA sustainability.
©m
ark G
odfre
y/tn
c
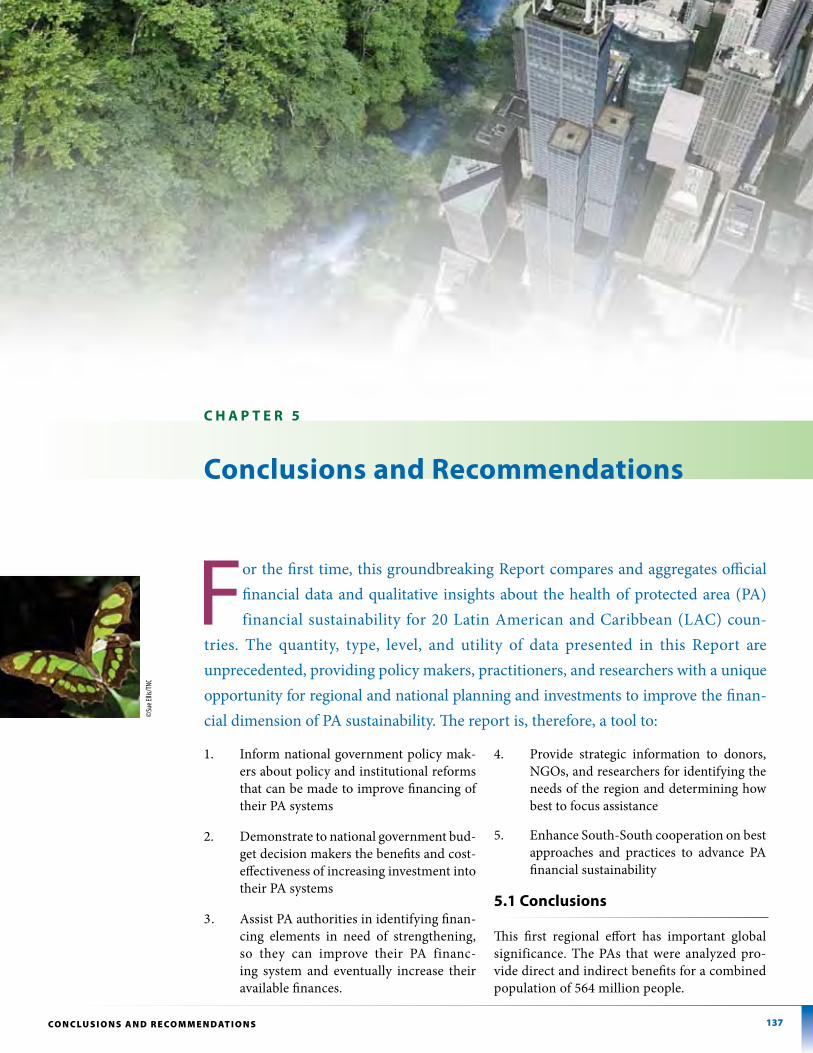
137Co n C lu s i o n s A n d R E Co m m E n d AT i o n s
1. Inform national government policy mak-ers about policy and institutional reforms that can be made to improve financing of their PA systems
2. Demonstrate to national government bud-get decision makers the benefits and cost-effectiveness of increasing investment into their PA systems
3. Assist PA authorities in identifying finan-cing elements in need of strengthening, so they can improve their PA financ-ing system and eventually increase their available finances.
4. Provide strategic information to donors, NGOs, and researchers for identifying the needs of the region and determining how best to focus assistance
5. Enhance South-South cooperation on best approaches and practices to advance PA financial sustainability
5.1 Conclusions
This first regional effort has important global significance. The PAs that were analyzed pro-vide direct and indirect benefits for a combined population of 564 million people.
For the first time, this groundbreaking Report compares and aggregates official financial data and qualitative insights about the health of protected area (PA) financial sustainability for 20 Latin American and Caribbean (LAC) coun-
tries. The quantity, type, level, and utility of data presented in this Report are unprecedented, providing policy makers, practitioners, and researchers with a unique opportunity for regional and national planning and investments to improve the finan-cial dimension of PA sustainability. The report is, therefore, a tool to:
C h a p t e r 5
Conclusions and recommendations
©su
e ellis
/tnc
138 Fi n a n c i a l s u s t a i n a b i l i t y s co re c a rd
The Financial Sustainability Scorecard for National Systems of Protected Areas (Scorecard) proved to be a very useful tool to generate information that allows reasonable comparisons between countries and subregions, as well as in-depth overview of the state of financial sustainability in LAC. This exercise provides a robust baseline that should be updated regularly in order to measure improve-ment and identify success of national strategies and actions to improve PA financial sustainability.
The results achieved pose a challenge in that, in the coming years, similar studies based on a fi-nancial sustainability scorecard process will be developed in different regions to generate global understanding of the trends, challenges, and op-portunities of PA financial sustainability.
Financial analysis (part i of scorecard)
Overall Conclusions
Protected area systems are underfunded, which gives rise to insufficient management: Available funding resources for PA systems in the region total nearly $403 million. Brazil and Mexico account for 53 percent of these resources. The total amount of available funding across all source types for the re-gion equals 0.01 percent of the regional GDP. By in-spection, the amount currently invested represents a sliver of regional GDP. This total available funds amount is only equivalent to a yearly per capita amount of approximately 70 cents — less than the cost of a can of soda. This relatively low level of available funds for conservation finance drives the funding gap between the costs of PA management needs and available funds for PA financing. The to-tal funding gap for the 1864 countries investigated is approximately $314 million (excluding Vene-zuela; see Table 3.16) under the basic management scenario and approximately $700 million under the optimal management scenario (see Table 3.17).
Compared to other regions where similar infor-mation is available, the average expenditure per hectare in the region of $1.95 is lower than avail-able funds per hectare per year in the protected areas of Middle East ($5.40), Eastern Europe ($11.20), and the European Union ($43.00)65. By LAC subregion, the average expenditure per hect-are comes out to be $4.62/ha/year in Mesoameri-ca+ and $0.38/ha/year in South America. This low regional expenditure by hectare in LAC countries, compared to other regions, is particularly con-cerning given that the region contains almost 40% of the Earth’s biodiversity.
Current levels of under-funding are at risk of in-creasing: This regional situation of a large financial gap between needs and resources is serious in the face of current conditions. The situation promises to worsen significantly because (i) funding needs are likely to increase in the future and (ii) current funding is both insecure and vulnerable to exter-nal factors. These two funding conditions place pressure on both sides of the financial sustainabil-ity scale: increased needs combined with reduced levels of available funds mean an increase in the funding gap. Under some reasonable scenarios, this funding gap could prove to be enormous.
Increased Needs: Financial needs for LAC PA systems are likely to increase in the near future due to (i) conservation pressures to expand PA systems by an estimated additional 80 million hectares to address current ecological gaps and (ii) anticipated increased costs of management for certain threats from climate change, such as increased incidence of fire and both increased frequency and intensity of storms.
Available Funds: Current financial sources in the region are unstable and at risk of de-creasing, in both sources of historical finding: budgeting within a country and international cooperation. These two sources together com-
©nestor Wndevoxhel/tnc
Key financial data
essential for financial
planning does not
exist. Very few coun-
tries have accurate
estimates of how
much their PA systems
cost to manage —
for either the basic or
optimal management
scenario.
139Co n C lu s i o n s A n d R E Co m m E n d AT i o n s
pose almost 75 percent of available funding in the aggregate for the region. The breakdown of this combined figure relies on governmental budgets at 61 percent and international cooperation at 14 per-cent. Both sources depend on a number of variables that are largely out of the control of PA systems and their managers. Furthermore, 75 percent of PA-generated income — the third source of PA funding — depends on tourism, which is sensitive to world economic conditions, the security context, or natu-ral disaster events. The only funding source that of-fers a measure of stability and long-term availability of funds comes from trust funds. Trust funds, or durable financial instruments, are now a small con-tributor to the total financial picture for PAs; trust funds now account for approximately 7 percent of the total available funding in the LAC region.
While the general condition is underfunding, coun-tries vary widely in their attention to PA financing: Investment per hectare in the LAC region varies con-siderably between countries and between the subre-gions of Mesoamerica+ and South America. Out of the five countries with the highest expenditure per hectare in the region, four are from Mesoamerica+. The aver-age investment in Mesoamerica+ is $4.19/ha, while in South America average investment is $1.38/ha. This difference in expenditure per hectare can be explained partly by average PA size in each subregion: PAs in the south tend to have larger extension, allowing for scale economies. This condition of larger land coverage and support of biological corridors also presents better con-ditions for ecological viability. Mesoamerica+, however, presents better conditions for alternative institutional arrangements (co-management, for example) to man-age PAs, suggesting that broader stakeholder participa-tion in PA finances might also be a possible factor that explains, in part, a higher expenditure per hectare in this subregion.
Addressing financial gaps is affordable for govern-ments in the region: Basic management scenario costs could be met if the annual government allocation by country to PA budgets in the region increases — in the aggregate — by a factor of 3: Doing so would cover the existing total financing gap for basic management of $314 million/year (excluding Venezuela; see Table 3.16). This amount is equivalent to about 40 cents per capita per year; a 3-fold increase would be just over $1 per person per year for the 18 countries whose financ-
ing gap is recorded (see Table 3.5). The specific increase in per capita amount, however, differs from country to country in the region. The five countries closest to funding their basic scenario PA management needs are Bolivia, Costa Rica, El Salvador, Argentina, and Colom-bia. All of these countries averaged available resources larger than 70 percent of their basic needs. On the other hand, Nicaragua, Uruguay, and Paraguay averaged less than 40 percent of their basic needs.
One of the most fundamental barriers to achieving PA financial sustainability is lack of data: Key finan-cial data essential for financial planning does not ex-ist. Very few countries have accurate estimates of how much their PA systems cost to manage — for either the basic or optimal management scenario. Some coun-tries do not have records of how much is spent in PAs. Countries do not centralize data and often do not know how much they receive from donors or for what these funds are used. Much of this lack of data results from insufficient financial reporting or from the absence of centralized accounting systems tailored to the finan-cial data needs of PA systems.
Closing the financial gap is ‘do-able’
GiventhesizeofthesefinancialgapsforLACcountriesandtheconditionthatLACgovern-mentsallocateonlyasmallfractionoffinancialresourcestoPAs,addressingthesegapsisnotinsurmountable.CountrygovernmentsallocateonlyasmallfractionoftheirfinancialresourcestoPAs:only1percentoftotalnationalenviron-mentalbudgetsareallottedtoPAs.Thisamountstojust0.006percentofGDP,onaverage,intheregion(seeTable3.5).ClosingthesegapsintheregionseemsentirelyfeasibleandaffordableforgovernmentstomakethenecessarybudgetaryincreasestoensuresoundPAmanagement.
Inotherwords,theadditionalgovernmentinvestmentrequiredtoclosethebasicmanage-mentfundinggapofthe18countriesreportingtheirfundinggaps,islessthanthecostofacanofsoda—at40cents—perperson.
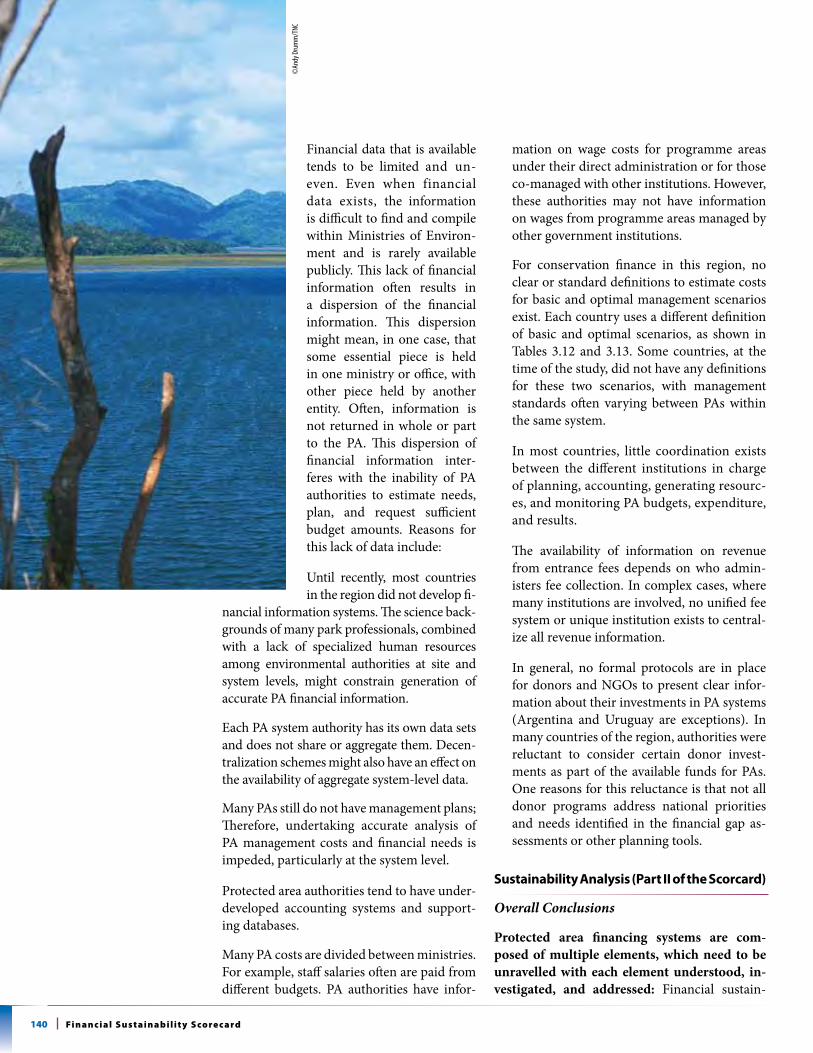
140 Fi n a n c i a l s u s t a i n a b i l i t y s co re c a rd
Financial data that is available tends to be limited and un-even. Even when financial data exists, the information is difficult to find and compile within Ministries of Environ-ment and is rarely available publicly. This lack of financial information often results in a dispersion of the financial information. This dispersion might mean, in one case, that some essential piece is held in one ministry or office, with other piece held by another entity. Often, information is not returned in whole or part to the PA. This dispersion of financial information inter-feres with the inability of PA authorities to estimate needs, plan, and request sufficient budget amounts. Reasons for this lack of data include:
Until recently, most countries in the region did not develop fi-
nancial information systems. The science back-grounds of many park professionals, combined with a lack of specialized human resources among environmental authorities at site and system levels, might constrain generation of accurate PA financial information.
Each PA system authority has its own data sets and does not share or aggregate them. Decen-tralization schemes might also have an effect on the availability of aggregate system-level data.
Many PAs still do not have management plans; Therefore, undertaking accurate analysis of PA management costs and financial needs is impeded, particularly at the system level.
Protected area authorities tend to have under-developed accounting systems and support-ing databases.
Many PA costs are divided between ministries. For example, staff salaries often are paid from different budgets. PA authorities have infor-
mation on wage costs for programme areas under their direct administration or for those co-managed with other institutions. However, these authorities may not have information on wages from programme areas managed by other government institutions.
For conservation finance in this region, no clear or standard definitions to estimate costs for basic and optimal management scenarios exist. Each country uses a different definition of basic and optimal scenarios, as shown in Tables 3.12 and 3.13. Some countries, at the time of the study, did not have any definitions for these two scenarios, with management standards often varying between PAs within the same system.
In most countries, little coordination exists between the different institutions in charge of planning, accounting, generating resourc-es, and monitoring PA budgets, expenditure, and results.
The availability of information on revenue from entrance fees depends on who admin-isters fee collection. In complex cases, where many institutions are involved, no unified fee system or unique institution exists to central-ize all revenue information.
In general, no formal protocols are in place for donors and NGOs to present clear infor-mation about their investments in PA systems (Argentina and Uruguay are exceptions). In many countries of the region, authorities were reluctant to consider certain donor invest-ments as part of the available funds for PAs. One reasons for this reluctance is that not all donor programs address national priorities and needs identified in the financial gap as-sessments or other planning tools.
sustainability analysis (part ii of the scorcard)
Overall Conclusions
Protected area financing systems are com-posed of multiple elements, which need to be unravelled with each element understood, in-vestigated, and addressed: Financial sustain-
©an
dy d
rum
m/t
nc
141Co n C lu s i o n s A n d R E Co m m E n d AT i o n s
ability requires an integrated approach that facilitates an enabling legal, institutional, and political environ-ment. The Scorecard’s elements promote standards and concrete goals for national-level decision making and for South-South cooperation. If these elements are all addressed, then the entire system will improve significantly. Indeed, a direct, positive, and strong cor-relation was found between the total score in Part II of the Scorecard and the size of the national PA sys-tem financial gap. Countries achieving higher scores on governance, planning, and revenue mechanisms tended to have smaller financial gaps. In other words, solid structural foundations of the situational context appear to be causally linked with achieving financial sustainability.
Protected area financing systems require substantial strengthening to be able to move toward financial sustainability: This strengthening relies on financial best practices; however, close attention must be paid to the enabling legal, institutional, and political environ-ment. The highest total score in the region for these qualitative elements of the Scorecard (Part II) was al-most 60 percent of the maximum possible score, while the lowest was 9 percent. The regional average score was 45 percent. Only two countries achieved scores equal to or higher than 50 percent. The top two scores were achieved in South America (Colombia, 59 per-cent; Argentina, 50 percent) closely followed by Costa Rica (49 percent) and Cuba (49 percent), while on the bottom of the list are Nicaragua (9 percent), Uruguay (14 percent), and Chile (15 percent). As these scores increase, these improvements in situational context for countries should lead to reduced financial gaps at na-tional levels.
Strengthening all elements of the financing system can lead to reduced financial gaps: Analysis shows a clear correlation between the total score for Part II of the UNDP Financial Sustainability Scorecard and national PA system financial gaps. Countries that achieved higher scores on governance, planning, and revenue mechanisms tend to have lower financial gaps, providing evidence of a cause-effect relationship be-tween having solid structural foundations and achiev-ing financial sustainability.
Within the region, certain country patterns and clusters can be used to prioritize international as-
sistance efforts: Country scores clustered into three groups, based on relative strength of financial plan-ning for PAs: (i) relatively strong, at 50 percent or above (Costa Rica, Cuba, Colombia, and Argentina), (ii) in need of strengthening, with scores between 30 percent and 50 percent (Mexico, Panama, Honduras, the Do-minican Republic, Ecuador, Bolivia, Peru, and Venezu-ela), and (iii) in need of substantial strengthening, with scores below 30 percent (Belize, El Salvador, Guatemala, Nicaragua, Brazil, Paraguay, Chile, and Uruguay).
Protected areas are a cost-effective investment for governments because they generate high econom-ic returns for public sector budgets: In a full cost analysis framework, the benefits of PAs outweigh the costs, particularly when ecosystem services are valued and counted in the cost-benefit process. The protec-tion and maintenance of water, carbon, biodiversity, and aesthetic services can generate high economic benefits for agriculture, hydropower, domestic and industrial water supplies, and tourism. Economic valuations for these sectors are not available for all countries. However, where economic valuation has been undertaken, the results indicate that returns on state investments in PAs are high. Weighted averages taken from studies in Mexico, Ecuador, Peru, and Chile show a high return on PA investment; the aver-age valuation of these benefits indicates that each dol-lar invested in the PA systems provides services with a value estimated at $66.0066.
Protected area systems have a low capacity to mo-bilize political interest and negotiate for budget in-creases: This is partly due to the lack of economic data on the economic contributions of PAs to local, sectoral, and national development. This weak capacity is also partly due to a lack of national financial strategies that show a blueprint for how funds will be managed, gen-erated, and invested.
Protected area systems have a low capacity to mo-bilize political interest and negotiate for budget in-creases: This is due partly to the lack of economic data on the contributions that PAs make to local, sectoral, and national development. The low capacity is also due partly to the lack of national financial strategies that show a blueprint for how funds will be managed, generated, and invested. This condition is reflected in the fact that both of these activities — economic
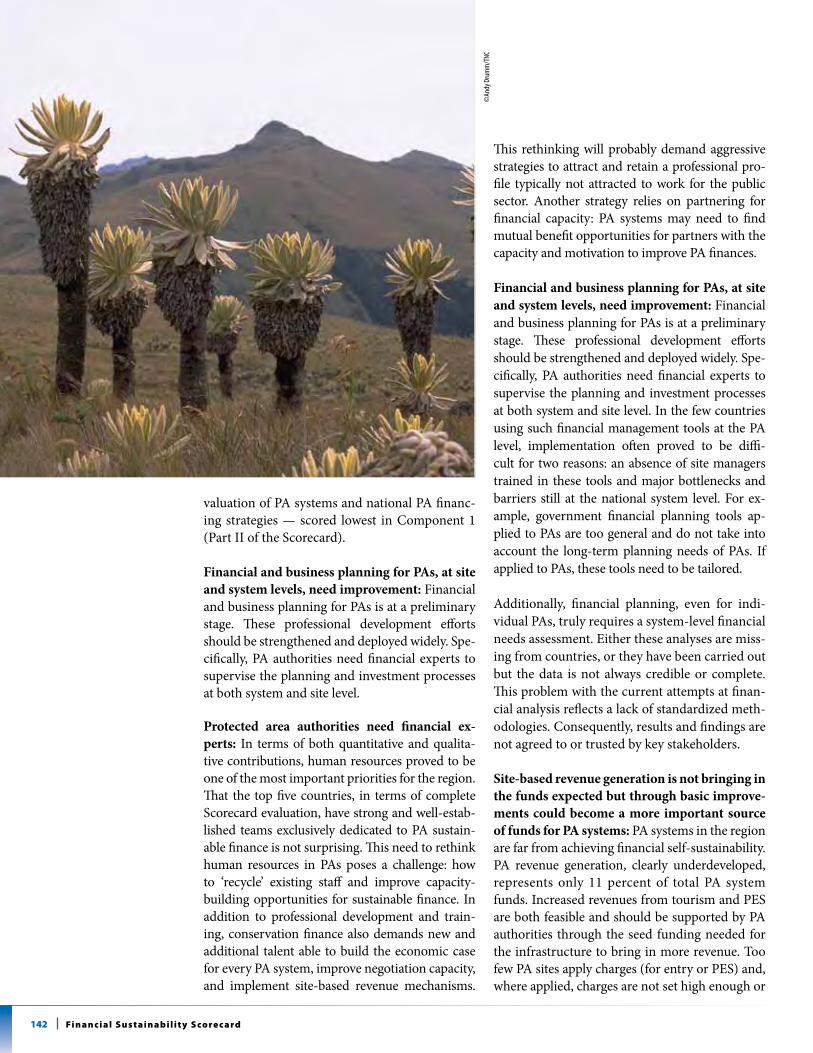
142 Fi n a n c i a l s u s t a i n a b i l i t y s co re c a rd
valuation of PA systems and national PA financ-ing strategies — scored lowest in Component 1 (Part II of the Scorecard).
Financial and business planning for PAs, at site and system levels, need improvement: Financial and business planning for PAs is at a preliminary stage. These professional development efforts should be strengthened and deployed widely. Spe-cifically, PA authorities need financial experts to supervise the planning and investment processes at both system and site level.
Protected area authorities need financial ex-perts: In terms of both quantitative and qualita-tive contributions, human resources proved to be one of the most important priorities for the region. That the top five countries, in terms of complete Scorecard evaluation, have strong and well-estab-lished teams exclusively dedicated to PA sustain-able finance is not surprising. This need to rethink human resources in PAs poses a challenge: how to ‘recycle’ existing staff and improve capacity-building opportunities for sustainable finance. In addition to professional development and train-ing, conservation finance also demands new and additional talent able to build the economic case for every PA system, improve negotiation capacity, and implement site-based revenue mechanisms.
This rethinking will probably demand aggressive strategies to attract and retain a professional pro-file typically not attracted to work for the public sector. Another strategy relies on partnering for financial capacity: PA systems may need to find mutual benefit opportunities for partners with the capacity and motivation to improve PA finances.
Financial and business planning for PAs, at site and system levels, need improvement: Financial and business planning for PAs is at a preliminary stage. These professional development efforts should be strengthened and deployed widely. Spe-cifically, PA authorities need financial experts to supervise the planning and investment processes at both system and site level. In the few countries using such financial management tools at the PA level, implementation often proved to be diffi-cult for two reasons: an absence of site managers trained in these tools and major bottlenecks and barriers still at the national system level. For ex-ample, government financial planning tools ap-plied to PAs are too general and do not take into account the long-term planning needs of PAs. If applied to PAs, these tools need to be tailored.
Additionally, financial planning, even for indi-vidual PAs, truly requires a system-level financial needs assessment. Either these analyses are miss-ing from countries, or they have been carried out but the data is not always credible or complete. This problem with the current attempts at finan-cial analysis reflects a lack of standardized meth-odologies. Consequently, results and findings are not agreed to or trusted by key stakeholders.
Site-based revenue generation is not bringing in the funds expected but through basic improve-ments could become a more important source of funds for PA systems: PA systems in the region are far from achieving financial self-sustainability. PA revenue generation, clearly underdeveloped, represents only 11 percent of total PA system funds. Increased revenues from tourism and PES are both feasible and should be supported by PA authorities through the seed funding needed for the infrastructure to bring in more revenue. Too few PA sites apply charges (for entry or PES) and, where applied, charges are not set high enough or
©an
dy d
rum
m/t
nc
143Co n C lu s i o n s A n d R E Co m m E n d AT i o n s
collected effectively. Regarding entrance fees: Al-though tourist entrance fees operate at the site lev-el all across the region, these schemes have varied degrees of sophistication and arrangement. Anal-ysis shows these specific needs concerning fees: (i) a more strategic approach to fee setting across the system, (ii) wider application of new revenue generation options, and (iii) the strengthening of associated activities such as communication and marketing strategies. For example, in Ecuador, 10 percent of PA systems account for 80 percent of national PA revenues. This imbalance presents a challenge in strengthening the PA portfolio in terms of revenue numbers, scope, and financial impact. The use of dedicated taxes, such as con-servation taxes, is also limited, representing an important lost opportunity. This underdeveloped revenue side to the financial portfolio has led to a low level of private sector investment in PAs.
The elements in Part II of the Scorecard explore the structural foundations needed to capture rev-enue for PA systems. One finding is that countries with low levels of revenues available to the PA systems (as reported through Part I of the score-card) also tend to have low scores for the revenue generation component of the Scorecard (Part II Component 3), reflecting weak foundations for generating revenues in these countries.
These findings from the Scorecard process of Parts I and II, and supporting consultations with country stakeholders, build a platform for specific policy recommendations.
5.2 recommendations: policy guidance
This Report brings PA stakeholders together in terms of both knowledge and informed po-licy making:
• National government policy makers can identify specific actions for policy and insti-tutional reforms that will improve the sup-portive context for PA system financing.
• National government budget decision mak-ers now have clear data on the needs, ben-efits, and cost-effectiveness of increasing PA system investment.
• PA authorities can identify financing elements for strengthening and improving PA finance practices that will increase confidence that gov-ernment budgets for PAs will be used cost-ef-fectively and contribute not only to biodiversity conservation but also national development.
• Donors and NGOs can determine where their support will have the great impact, by system and by elements in each system.
• Researchers have baseline data on which to undertake more elaborate and useful finan-cial analysis in PA systems.
The information also supports South-South co-operation in the hope that each country can find other countries to provide good examples of how to strengthen the weak elements of their system.
Recommendation 1: Set targets for available funds for National Systems of Protected Areas
Set financial targets for: (i) meeting the costs of basic management standards of PA systems and their constituent PAs, (ii) the costs of establish-ing optimal management costs, (iii) the costs of also addressing ecological gaps, and (iv) addi-tional costs for covering increased costs of man-agement due to climate change. To this end, each country should have a thorough financial needs assessment to permit sound financial planning and the setting of targets. A standard methodol-ogy should be developed so that data generated using the methodology will be widely accepted and can be collected in a cost-effective manner. This should include determining how many sites per system require costing and differentiating be-tween capital investment needs and on-going op-erational costs. Such a financial needs assessment should also include buffer zone management.
Recommendation 2: Increase available finances to meet targets
On average, the countries in the Report that have calculated their financial management needs and gaps should increase the total avail-able funds (government budgeted funds, extra-budgetary funds including international coop-eration, and PA-based revenues) for their PA
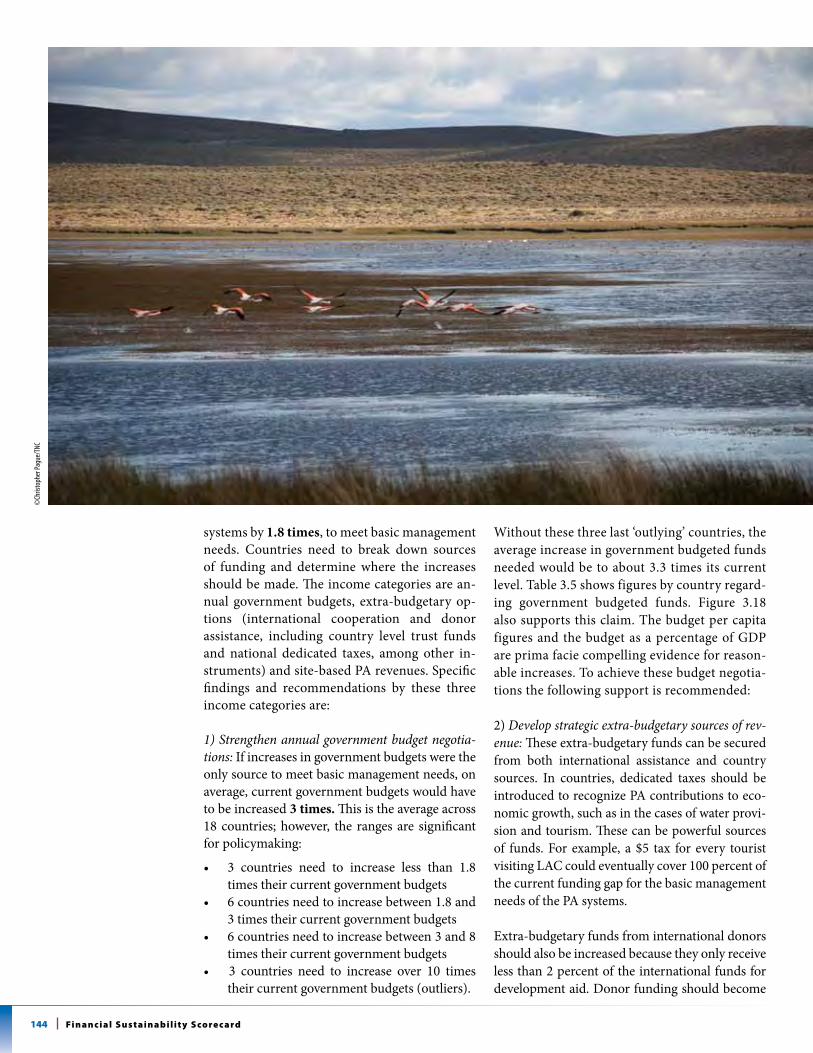
144 Fi n a n c i a l s u s t a i n a b i l i t y s co re c a rd
systems by 1.8 times, to meet basic management needs. Countries need to break down sources of funding and determine where the increases should be made. The income categories are an-nual government budgets, extra-budgetary op-tions (international cooperation and donor assistance, including country level trust funds and national dedicated taxes, among other in-struments) and site-based PA revenues. Specific findings and recommendations by these three income categories are:
1) Strengthen annual government budget negotia-tions: If increases in government budgets were the only source to meet basic management needs, on average, current government budgets would have to be increased 3 times. This is the average across 18 countries; however, the ranges are significant for policymaking:
• 3 countries need to increase less than 1.8 times their current government budgets
• 6 countries need to increase between 1.8 and 3 times their current government budgets
• 6 countries need to increase between 3 and 8 times their current government budgets
• 3 countries need to increase over 10 times their current government budgets (outliers).
Without these three last ‘outlying’ countries, the average increase in government budgeted funds needed would be to about 3.3 times its current level. Table 3.5 shows figures by country regard-ing government budgeted funds. Figure 3.18 also supports this claim. The budget per capita figures and the budget as a percentage of GDP are prima facie compelling evidence for reason-able increases. To achieve these budget negotia-tions the following support is recommended:
2) Develop strategic extra-budgetary sources of rev-enue: These extra-budgetary funds can be secured from both international assistance and country sources. In countries, dedicated taxes should be introduced to recognize PA contributions to eco-nomic growth, such as in the cases of water provi-sion and tourism. These can be powerful sources of funds. For example, a $5 tax for every tourist visiting LAC could eventually cover 100 percent of the current funding gap for the basic management needs of the PA systems.
Extra-budgetary funds from international donors should also be increased because they only receive less than 2 percent of the international funds for development aid. Donor funding should become
©ch
risto
pher
Pagu
e/tn
c
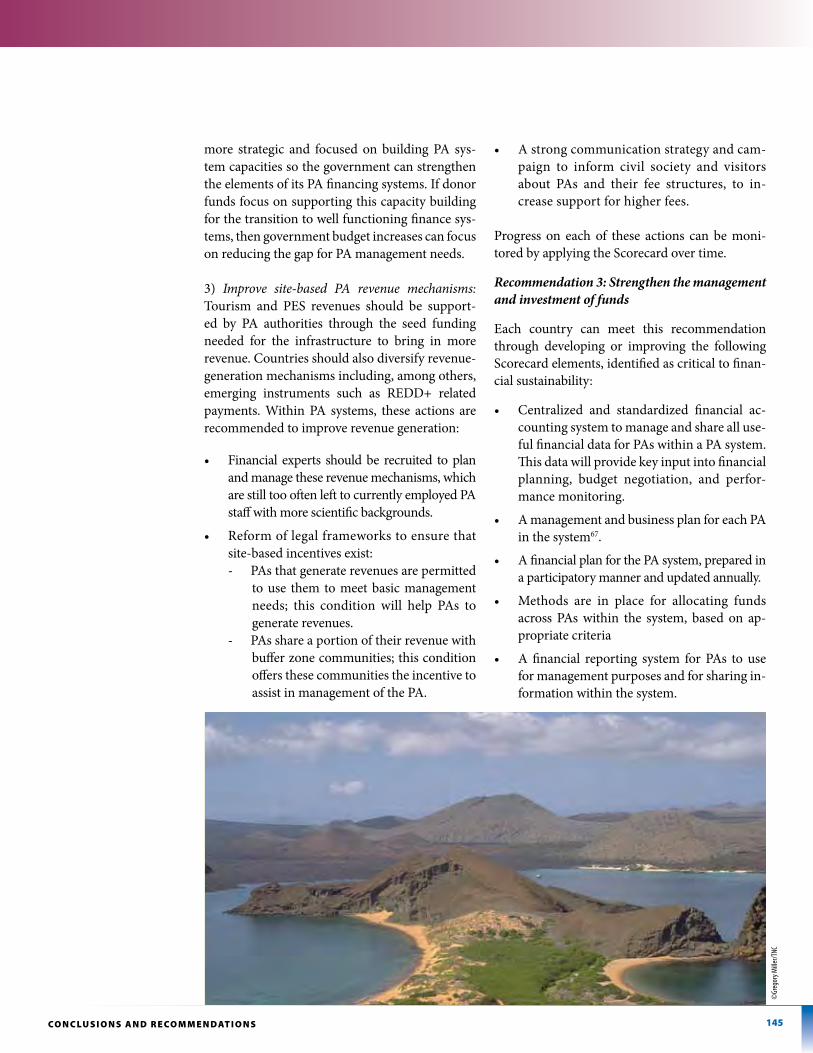
145Co n C lu s i o n s A n d R E Co m m E n d AT i o n s
more strategic and focused on building PA sys-tem capacities so the government can strengthen the elements of its PA financing systems. If donor funds focus on supporting this capacity building for the transition to well functioning finance sys-tems, then government budget increases can focus on reducing the gap for PA management needs.
3) Improve site-based PA revenue mechanisms: Tourism and PES revenues should be support-ed by PA authorities through the seed funding needed for the infrastructure to bring in more revenue. Countries should also diversify revenue-generation mechanisms including, among others, emerging instruments such as REDD+ related payments. Within PA systems, these actions are recommended to improve revenue generation:
• Financial experts shouldbe recruited toplanand manage these revenue mechanisms, which are still too often left to currently employed PA staff with more scientific backgrounds.
• Reform of legal frameworks to ensure that site-based incentives exist: - PAs that generate revenues are permitted
to use them to meet basic management needs; this condition will help PAs to generate revenues.
- PAs share a portion of their revenue with buffer zone communities; this condition offers these communities the incentive to assist in management of the PA.
• A strong communication strategy and cam-paign to inform civil society and visitors about PAs and their fee structures, to in-crease support for higher fees.
Progress on each of these actions can be moni-tored by applying the Scorecard over time.
Recommendation 3: Strengthen the management and investment of funds
Each country can meet this recommendation through developing or improving the following Scorecard elements, identified as critical to finan-cial sustainability:
• Centralized and standardized financial ac-counting system to manage and share all use-ful financial data for PAs within a PA system. This data will provide key input into financial planning, budget negotiation, and perfor-mance monitoring.
• A management and business plan for each PA in the system67.
• A financial plan for the PA system, prepared in a participatory manner and updated annually.
• Methods are in place for allocating funds across PAs within the system, based on ap-propriate criteria
• A financial reporting system for PAs to use for management purposes and for sharing in-formation within the system.
©Gr
egor
y mille
r/tnc
146 Fi n a n c i a l s u s t a i n a b i l i t y s co re c a rd
Recommendation 4: Develop Targeted Skills Capacity-Building Programmes
A major gap in PA management is in financial expertise. Capacity-building efforts should build financial knowledge and skills at PA site and system levels. All PA manager training courses should include financial skills modules and tools for cost-effective management. PA manager sup-port staff should also be trained in basic financial planning and negotiation skills.
However, the most important capacity-building action is for all PA systems to hire economists, financial planners, and tourism revenue experts at national and sub-national levels. Sub-national experts can then support several PA sites, making this action cost-effective.
Recommendation 5: Improve and standardize financial data generation and compilation at PA system level
Simple and standard data generation systems are the first step toward financial sustainability; all PA systems must develop such a system. The data to be collected needs to encompass PA manage-ment needs and costs, revenue generation, and budgets and expenditures (operational and capi-tal). Accounting software should be installed for this purpose. PA site managers should be trained on costing activities and using accounting soft-ware. Because financial data sharing is essential, co-managers should also record and share data on site revenues. Donor projects and trust funds should also provide data to PA authorities on site and system expenditures annually, by standard units and activities. Coordinated information sharing means that data can be incorporated and aggregated at the system level.
Protected area management plans should act as the foundation for all cost estimates, which then need to be aggregated up to the system lev-el. Where a system does not have management plans for all sites, extrapolation can be used: costs of typical PAs can estimate costs in PA sites lacking management plans. PA headquarters costs — both operational and capacity-building needs — should then be added to the site-level
cost data for full PA system cost data. Revenues should be tracked using reliable and transparent recording systems.
looking ahead
The Scorecard should serve as a frame of reference to geneate the necessary financial data fundamental to all financial planning and budget negotiations. The data in this Report should be considered as a baseline for future monitoring. The Scorecard should be applied in a partici- patory manner annually. For completeness, the Scorecard should also be filled in for PA sub-systems within countries.
UNDP and TNC will continue to provide support to all coun-tries that wish to advance toward financial sustainability for their PA systems and to undertake the recommendations provided.
PA stakeholders hope that this Report will also stimulate other practitioners to come together, providing coordinated and focused support, to help gov-ernments in the region gener-ate data and transition toward fully-functioning PA systems.
©m
ark G
odfre
y/tn
c

147A n n E x E s
annexes
©co
nnie
Gelb
/tnc
148 Fi n a n c i a l s u s t a i n a b i l i t y s co re c a rd
Annex 1. glossary
Available Finances: The total annual central government budget allocated to PA management, extra-budgetary funding (channeled through government, trust funds, NGOs and foundations) allocated to PA management and the percentage of PA-generated revenues retained in the PA system for re-investment.
Basic Management Scenario: Essential management programs to ensure protection of basic ecosystem functions.
Biodiversity is the number, variety, and variability of living organisms. Biodiversity includes diversity within species (genetic diversity), between species (species diversity), and between ecosystems (ecosystem diversity).
A Business Plan guides the financial development that will be required to fully implement the site’s management plan. The business plan is a decision-making tool, which gives a clear picture of the PA’s financial needs to conduct proposed activities under the management plan and identifies potential revenues sources to meet those needs. Hence, a business plan examines the likely revenue and costs streams, takes into account the customer’s needs and ability to pay, and the range of goods and services provided by the PA.
Co-managed Protected Area: Co-managements describes the sharing of management authority and responsibility among a plurality of (formally and informally) entitled governmental and non-governmental actors. In weak forms of co-management, decision-making authority and responsibility rest with one agency but the agency is required — by law or policy — to inform or consult other stakeholders. In stronger forms, multi-stakeholder bodies are in charge of developing technical proposals for PA regulation and management, to be ultimately submitted to a decision-making authority for approval. In “joint” management, various actors sit on a management body with decision-making authority and responsibility. The strength of co-management often depends on whether or not decisions require consensus.
Community Conserved Area: These refer to natural and modified ecosystems, including significant biodiversity, ecological services, and cultural values voluntarily conserved by indigenous, mobile, and local communities through customary laws or other effective means. Here, authority and responsibility rest with communities through a variety of forms of ethnic governance or locally-agreed organizations and rules. Land and/or some resources may be collectively owned and man-aged, while other resources may be individually managed or managed on a clan-basis. Different communities may be in charge of the same territory at different times, or of different resources within the same territory. Rules generally intertwine with cultural or religious values and practices. Most often, the customary rules and organizations in charge of managing natural resources possess no legal recognition or sanctioning by the government, although there are exceptions to this norm.
Concessions are businesses operated under a contract or license associated with a degree of exclusivity in business within a certain geographical area. In the case of PA, a private company, NGO, or other entity enters into an agreement with the government to have the exclusive right to manage, maintain, and/or carry out investment in a PA for a given number of years
Ecological Gap: While the species or ecosystem occurs in the PA system, occurrence is either of inadequate ecological condition, or the PA(s) fail to address specie “movements” or specific ecological conditions needed for long-term survival or ecosystem functioning.

149A n n E x 1
Ecosystem Services: Ecological or ecosystem processes or functions and products that have value to individuals or to society.
Ecotourism: Travel undertaken to witness sites or regions of unique natural or ecologic quality, or the provision of services to facilitate such travel. Ecotourism is also defined as environmentally-re-sponsible travel and visitation to relatively undisturbed natural areas, to enjoy, study, and appreciate nature (and any accompanying cultural features, both past and present), that promotes conservation, has lower visitor impact, and provides for beneficially-active, socio-economic involvement of local populations.
Extra-budgetary Funding: Additional funds available for use by the PA Authority, brought in by dedicated taxes, debt-swaps, international donor funds, trust funds, and other non government budgeted sources.
Financial Analysis: This is the systematic process of defining costs and identifying ways to meet those costs. Financial analysis consists of quantifying the financial needs and gaps of an individual PA or PA system, including the creation of new PAs.
Financial Gaps: This amount is the budget required to meet the needs for PA management under a given scenario, which are not covered under the actual PA budget.
Financial Needs: These are the estimated costs for PA management under a given scenario.
Financial Sustainability: This condition refers to the ability of a country to meet all costs associated with the management of a PA system.
Financial Sustainability Scorecard: A tool designed to assist governments, donors, and NGOs investigate and record significant aspects of a PA financing system — its accounts and its underlying structural foundations — to show both PA current health and status, and to indicate if the system is holistically moving over the long-term toward an improved financial situation. The Scorecard is designed for national systems of PAs but could be used by sub-national entities, e.g., state, regional, or municipal, or networks of Marine Protected Areas (MPAs).
Government Budget: These resources for PAS are the annual funds allocated by Ministry of Finance to the Ministry of Environment, which are then allocated to the PA authority.
Government Expenditure: This term refers to spending by national and local governments, and some government-backed institutions on the PA system of the country.
Gross Domestic Product: GDP is the total market value of goods and services produced within a nation during a given period (usually 1 year).
Management Category: This term refers to a global standard for the planning, establishment, and management of PAs.
Marine Protected Area (MPA): This PA is an area of sea (or coast) especially dedicated to the protection and maintenance of biological diversity, and of natural and associated cultural resources, and managed through legal or other effective means.
150 Fi n a n c i a l s u s t a i n a b i l i t y s co re c a rd
A Network is a set of PAs that have commonalities and coordination but no dedicated legal framework.
Optimal Management Scenario: This a set of management programs for optimal ecosystem functioning.
Protected Areas (PAs): 1) The natural settings are clearly-defined geographical spaces, recognized, dedicated and managed, through legal or other effective means, to achieve the long-term conservation of nature with associated ecosystem services and cultural values (IUCN); and 2) A geographically-defined area that is designated or regulated and managed to achieve specific conservation objectives (CBD).
While these two definitions differ slightly, they both express essentially the same message. Protected areas operate as regulatory instruments for land use, imposing restrictions according to specific conservation management functions and objectives. The different degrees of land-use restrictions range from no visitation, thus enabling strict preservation, to protected landscapes and seascapes where biodiversity protection takes place alongside regulated production activities and, often, resident human communities. Given this underlying function, national PA systems are one of the most effective management strategies to avoid excessive conversion to other land-uses and to protect ecosystems and the services provided to development and human well-being.
PA-generated Revenues are income that a PA receives from its activities; those activities could be related to tourism (e.g., entry fees, user fees, concession, and other tourism activities) or to the services provided by the PA (e.g., payment for environmental services).
Protected Area Governance: This is the form of management that is in place within a PA. The IUCN World Commission on Protected Areas recognizes four main types of governance, each with several subcategories: state, co-management, private, and community conserved areas.
Resilience: This condition refers to the amount of disturbance or stress that an ecosystem can absorb and still remain capable of returning to its pre-disturbance state.
Scenario: This term is a plausible and often simplified description of how the future may develop, based on a coherent and internally consistent set of assumptions about key driving forces and relationships.
Species: A species is a group of organisms that differ from all other groups of organisms and thatare capable of breeding and producing fertile offspring. This is the smallest unit of classification for plants and animals.
A Strategy is a long-term plan with a defined scope that identifies measurable objectives, key actors, and target groups for the achievement of outcomes aligned with the plan’s declared vision.
A Sub-System is a set of PAs whose operations are governed by a legal framework. In some countries, networks may have a legal framework and, hence, should be classified as a sub-system.
User Fees: This instrument is the payment of a fee for direct receipt of a public service by the benefiting party.
Value: This concept refers to the resources of a PA that could be exploited to produce a benefit. Values are, in this context, therefore, potential benefits.
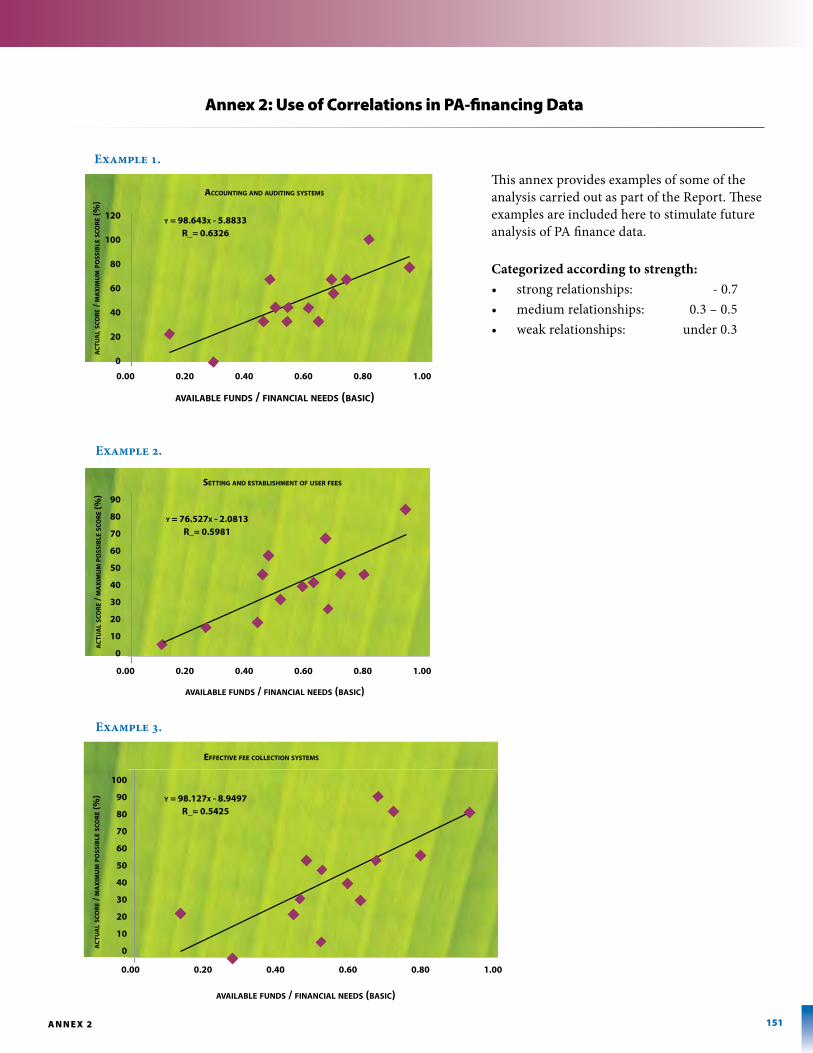
151A n n E x 2
Annex 2: use of Correlations in PA-financing data
100
90
80
70
60
50
40
30
20
10
0
Example 3.
0.00 0.20 0.40 0.60 0.80 1.00
aVailaBle funDs / finanCial neeDs (BasiC)
effeCtiVe fee ColleCtion systems
y = 98.127x - 8.9497R_= 0.5425
aC
tua
l sC
oR
e / m
ax
imu
m p
oss
iBle
sC
oR
e (%
)
90
80
70
60
50
40
30
20
10
0
Example 2.
0.00 0.20 0.40 0.60 0.80 1.00
aVailaBle funDs / finanCial neeDs (BasiC)
settinG anD estaBlisHment of useR fees
y = 76.527x - 2.0813R_= 0.5981
aC
tua
l sC
oR
e / m
ax
imu
m p
oss
iBle
sC
oR
e (%
)
120
100
80
60
40
20
0
Example 1.
0.00 0.20 0.40 0.60 0.80 1.00
aVailaBle funDs / finanCial neeDs (BasiC)
aCCountinG anD auDitinG systems
y = 98.643x - 5.8833R_= 0.6326
aC
tua
l sC
oR
e / m
ax
imu
m p
oss
iBle
sC
oR
e (%
)
This annex provides examples of some of the analysis carried out as part of the Report. These examples are included here to stimulate future analysis of PA finance data.
Categorized according to strength:• strongrelationships: -0.7• mediumrelationships: 0.3–0.5• weakrelationships: under0.3
152 Fi n a n c i a l s u s t a i n a b i l i t y s co re c a rd
annex 3. references
5th World Congress on Protected Areas. 2003. Durban, South Africa.
Bezaury Creel, J., and L. Pabon-Zamora. 2009. Valuation of Environmental Goods and Services Provided by Mexico’s Protected Areas. The Nature Conservancy-Mexico Program, Comisión Nacional de Áreas Naturales Protegidas, Mexico City. 32 pp.
Borrini-Feyerabend. 2004. Adapted from Heylings and Bravo. 2001. Consensus in a Co-management Board: A Key Incentive towards Effective and Equitable Management of the Galapagos Marine Reserve.
Bovarnick, A. 2010. Financial Sustainability Scorecard for National Systems of Protected Areas. New York: United Nations Development Programme. http://www.undp.org/gef/kmanagement/newpublication.html.
Campbell, A., et al. 2008. Carbon Emissions from Forest Loss in Protected Areas. UNEP World Conservation Monitoring Centre, Cambridge, U.K.
CBD Technical workshop. 2008. Salinas, Ecuador.
Chatwin, A. 2007. Priorities for Coastal and Marine Conservation in South America. Arlington, VA: The Nature Conservancy.
Collaborative Partnership on Forests (CPF). 2008. Strategic Framework for Forests and Climate Change: A Proposal by the Collaborative Partnership on Forests for a Coordinated Forest-sector Response to Climate Change. Rome: FAO.
Davis, S. D., V. H. Heywood, and A. C. Hamilton. 1994. Centres of Plant Diversity: A Guide and Strategy for Their Conservation, 3 volumes, IUCN, Cambridge, UK and WWF, Gland, Switzerland, Vol 3: 358.
Dudley, N., S. Mansourian, S. Stolton, and S. Suksuwan. 2008. “Safety Net: Protected areas and poverty reduction.” A research report by WWF and Equilibrium in the Arguments for Protection series.
Dudley, N., S. Stolton, A. Belokurov, L. Krueger, N. Lopoukhine, K. MacKinnon, T. Sandwith, and N. Sekhran (eds.). 2010. Natural Solutions: Protected Areas Helping People Cope with Climate Change. Gland, Switzerland, Washington, DC, and New York, USA: IUCN- WCPA, TNC, UNDP, WCS, The World Bank, and WWF.
ECLAC-UNDP. 2002. Financing for Sustainable Development in Latin America and the Caribbean: From Monterrey to Johannesburg. (LC/R.2098/I), Santiago, Chile, Economic Commission for Latin America and the Caribbean (ECLAC).
“Ecological Gap Assessment: An Overview”. 2008. Issued jointly by CI, WCS, TNC, CBD, Bird Life, WWF, and WCPA. Available at www.cbd.int/doc/training/pa/wgpa-02/pa-2008-02-10-gap-en.pdf.
Escobar, J., and L. Pabon, et al. 2009. El Aporte de las Áreas Protegidas a la Economía y la Sociedad Boliviana. Marzo.
Figueroa, E. 2008. “Economic Analysis and Feasibility Study of the System of Protected Areas of Chile”. Working Paper, University of Chile.
Flores, M., G. Rivero, F. León, G. Chan, et al. 2008. Financial Planning for National Systems of Protected Areas: Guidelines and Early Lessons. Arlington, VA: The Nature Conservancy
Lascano, M., G. Ordoñez, P. Suárez, C. Viteri Mejía. 2006. Protected Areas and Local Livelihoods in Ecuador: A Summary of Results. Quito, Ecuador: Mentefactura and The Nature Conservancy .
153A n n E x 3 . R E F E R E n C E s
Leon Morales, F. 2007. El Aporte de las Áreas Naturales Protegidas a la Economía Nacional. Lima: Instituto Nacional de Recursos Naturales.
Lopez Ornat, A., and S. Jimenez-Caballero. 2006. Sustainable Financing Sources for Protected Areas in the Mediterranean. Seville: IUCN Centre for Mediterranean Cooperation.
Maxted, N., B. V. Ford-Lloyd, and J. G. Hawkes (eds.). 1997. Plant Genetic Conservation: The in Situ Approach. London: Chapman & Hall.
Mentefactura. 2008. “Financial Sustainability Plan for the Protected Areas System of Jamaica”. Document produced for the Government of Jamaica by Mentefactura through a consultancy contract.
Mulongoy, K.J., and S.B. Gidda. 2008. “The Value of Nature: Ecological, Economic, Cultural and Social Benefits of Protected Areas”. Secretariat of the CBD, Montreal.
MINAET, SINAC, TNC. 2005. “National System of Conservation Areas. Financial Strategy for the System of Conservation Areas of Costa Rica”. Phase 1: Plan Financial Needs 2004-2006. Costa Rica.
Pabon-Zamora. 2008. “Protected Areas and Human Well-Being: Experineces from Indonesia, Mexico, Peru and Venezuela”. In Protected Areas in Today’s World: Their Values and Benefits for the Welfare of the Planet, edited by S. o. t. C. o. B. Diversity. Montreal: CBD.
PROMETA. 2007. Working Document.
Ricketts, T.H., G.C. Daily, P.R. Ehrlich, and C.D. Michener. 2004. “Economic Value of Tropical Forest to Coffee Production”. Proceedings of the National Academy of Sciences of the USA. 101 (34): 12 579-12 582.
Salazar Córdova, R.F. 2007. Valoración Económica de Bienes y Servicios Ambientales del Sistema Nacional de Áreas Protegidas (SNAP). Proyecto SNAP-GEF del Ministerio de Ambiente del Ecuador.
TEEB. 2009. The Economics of Ecosystems and Biodiversity (TEEB) for National and International Policy Makers. http://www.teebweb.org.
Tuxill, J., and G.P. Nabhan. 1998. Plants and Protected Areas: A Guide to In Situ Management. Cheltenham, UK: Stanley Thornes.
UNDP. 2008. Source for international aid. Human Development Report.
UNEP. 2003. “Current State of the Natural Protected Areas of Latin America and the Caribbean”. Programa de las Naciones Unidas para el Medio Ambiente, Oficina Regional para América Latina y el Caribe.
UNEP-WCMC. 2008. Database.
WWF. 2009. “Connecting Amazon Protected Areas and Indigenous Lands to REDD Frameworks Conference”. Papers available from www.worldwildlife.org/science/stanfordgroup.html
Yazuni-ITT Initiative. http://yasuni-itt.gob.ec/.
154 Fi n a n c i a l s u s t a i n a b i l i t y s co re c a rd
Notes
Executive Summary
1 Argentina, Belize (qualitative analysis of Scorecard Part II only), Brazil (federal and state – Rio de Janeiro, Rio Grande do Sul, Parana, Minas Gerais, and Espiritu Santo), Bolivia, Colombia, Costa Rica, Chile, Cuba, the Dominican Republic, Ecuador, El Salvador, Guatemala, Honduras, Mexico, Nicaragua, Panama, Paraguay, Peru, Uruguay, and Venezuela.
2 Unless noted, the amounts in this document are presented in US currency of dollars and cents; ‘billion’ means 1,000 million.
3 Mesoamerica+ refers to: Belize, Costa Rica, El Salvador, Guatemala, Honduras, Mexico, Nicaragua, and Panama, and these Spanish-speaking Caribbean countries: Cuba and the Dominican Republic.
4 Another way to look at this gap is to include funds other than government-budgeted funds. Total available resources includes government-budgeted funds and these two categories of extra-budgetary funds: (1) international cooperation and other donor sources and (2) PA-based revenues. To meet basic management needs across the countries that record funding needs and gaps, total available resources need to be increased, on average, 1.8 times. This is the average from 18 countries reporting their funding gaps.
5 See the UNDP-GEF joint programs publications page for the updated version of the Financial Sustainability Scorecard for National Systems of Protected Areas at http://www.undp.org/gef/kmanagement/newpublication.html.
6 In some data sets, the international cooperation contribution is sometimes combined with “Other” and included with extra-budgetary funds. This extra-budgetary designation identifies these funds as not coming from government-budget-ed sources for PAs.
7 Extra-budgetary sources are sometimes divided into international cooperation and “Other”. Detailed findings shed light on “Other” by country. International cooperation funds are often called donor funds or donor assistance.
8 Total available resources: To meet basic management needs in countries that record funding gaps, total available re-sources need to be increased, on average, 1.8 times. This is the average from 18 countries reporting their funding gaps. Total available resources include annual government budgets, extra-budgetary sources of international cooperation and other donor funds, and PA-based revenues.
Annual government budget: If increases in government budgets were the only source to meet basic management needs, on average, current government budgets would need to be increased by approximately 3 times. This is the average from 18 countries reporting their funding gaps.
9 Reducing Emissions from Deforestation and Forest Degradation (REDD) is an effort to create a financial value for the carbon stored in forests, offering incentives for developing countries to reduce emissions from forested lands and invest in low-carbon paths to sustainable development. REDD+ goes beyond deforestation and forest degradation, and includes the role of conservation, sustainable management of forests, and enhancement of forest carbon stocks. REDD and REDD+ are programs of the UN Framework Convention on Climate Change.
10 Smaller PAs with low revenue generation potential and a small number of threats may not need business plans.
Chapter 1
11 UNEP-WCMC database for PAs, 2008
12 This data excludes Turcos & Caicos Islands, British Virgin Islands, and United States Virgin Islands.
13 Argentina, Belize, Brazil, Bolivia, Colombia, Costa Rica, Chile, Cuba, Dominican Republic, Ecuador, El Salvador, Guatemala, Honduras, Mexico, Nicaragua, Panama, Paraguay, Peru, Uruguay, and Venezuela.
14 An internationally recognized typology (IUCN) is used as a global framework for categorizing the variety of PA manage-ment approaches, by recognizing six categories of management objective and four governance types. These categories and governance types can be used in any combination. See Dudley, 2008.
15 UNDP, Financial Sustainability Scorecard for National Systems of Protected Areas - Edition 2010. Current versions available at: www.undp.org/gef/kmanagement/newpublication.html.
16 Since then, PAs have come under the direct authority of the Ministry of the Environment.
17 Unless noted, the amounts in this document are presented in US currency of dollars and cents; ‘billion’ means 1,000 million.
18 See two reports: Leon, 2007, and Pabon-Zamora, 2008.
19 Leon, 2007, and Pabon-Zamora, 2008
20 Based on evaluating 1,100 studies ranging across different countries and different ecosystem services. See TEEB, 2009.
21 Campbell et al., 2008
22 Mesoamerica+ is composed of these countries: Belize, Costa Rica, El Salvador, Guatemala, Honduras, Mexico, Nicaragua, Panama, Cuba, and the Dominican Republic.
23 An in-depth discussion on the role of PAs in climate change mitigation and adaptation can be found in Natural Solutions (Dudley et al., 2010).
24 Key characteristics of PA systems that increase their potential role in climate change strategies include the condition that these PA systems have proven governance mechanisms and safeguards and provide a stable, long-term mechanism for managing land and water ecosystems; they are based around a commitment to permanence and long-term management of ecosystems and natural resources; they already have systems that enable monitoring, verification, and reporting, and are supported by government commitments under the CBD to establish ecologically representative PA systems that
have organized and populated data sources to set baselines and facilitate monitoring, such as the IUCN management categories, governance types, and Red List of Threatened Species, and the UNEP World Conservation Monitoring
Centre (UNEP-WCMC) World Database on Protected Areas (Dudley et al., 2010).
25 CONANP
26 CBD, 2008
27 Figueroa, 2007
155n o T E s
156 Fi n a n c i a l s u s t a i n a b i l i t y s co re c a rd
28 Escobar and Pabon, et al., 2009
29 Ricketts et al., 2004
30 Tuxill and Nabhan, 1998
31 Maxted, Ford-Lloyd, and Hawkes (eds.), 1997
32 Davis, 1994
33 PROMETA, 2007
34 This document should include policies on: revenue generation and fee levels across PAs, criteria for allocating central budget funds across PAs, guidelines for management and business plans, and safeguards to ensure that revenue genera-tion does not adversely affect conservation objectives of PAs.
Chapter 2
35 The first version of this Scorecard was developed by UNDP in 2007. In the UNDP/TNC San Jose, Costa Rica Workshop for preparation of this study, some adjustments were made to the Scorecard to improve clarity. This revised version was applied to 20 countries across the region. Based on feedback from participants in these national workshops, more adjust-ments were made to improve clarity of the Scorecard. The most recent version of the Scorecard is available as a UNDP publication. Financial Sustainability Scorecard for National Systems of Protected Areas - Edition 2010. Current versions available here: www.undp.org/gef/kmanagement/newpublication.html.
36 Based on information presented in the 5th World Congress on Protected Areas, in Durban 2003.
37 Brazil is an exception, since the PA systems managed by states represent 25 percent of the national system. The Scorecard was applied to the Federal PAs. The Scorecard was also applied to the PAs of five Brazilian states, the results of which are presented separately. Another exception is Argentina, where the province sub-system area is approximately six times big-ger than the national PA system. These sub national PAs (province-level) were not included in the study and represent 6.4 percent of Argentina’s territory, compared to the 1.3 percent that the PAs included in this study represent.
Chapter 3
38 Lopez et al., 2006
39 Note that in Cuba, a percentage of the government funds allocated to PAs might originate from international cooperation through such entities as UNDP, FAO, UNEP, GEF, and others. These entities may fund projects in support of PA systems. However, Cuba did not provide detailed information that specifies the amount of donor funds in these situations.
40 At the time of the Scorecard workshop, participants highlighted a governmental initiative to share a proportion of PAs revenues with local communities. Therefore, these participants have considered appropriate the practice of not includ-ing these PAs revenues to the PA system budget until the signature of agreement with local communities occurs and the exact proportion of revenues that will accrue to the PA System is determined.
41 ECLAC-UNDP, 2002

157n oT E s
42 Note, however, that data from Guatemala on donor funds is likely to be an underestimation.
43 Flores et al., 2008
44 The financial need study only covers PAs managed by the central government and not comanaged areas and private reserves, for which an estimation was made for Scorecard application.
45 Estimation of costs for the basic management scenario (basic financial needs) were made by CONAP and submitted to the Congress to justify the request for an increase in the PA system budget.
46 Projection developed in 2006 for the estimation of costs for optimal management scenario (optimal financial needs) for the Federal PA system.
47 In the case of Guatemala, the financial needs presented for the optimal management scenario is a projection based on the cost-estimate made by CONAP for the basic scenario. However, note that in 2007, TNC estimated costs for an optimal management scenario in Guatemala, at $100 million or more than $40/ha, which would make this figure one of the high-est estimated costs per hectare in the region.
48 The financial gap of Venezuela is not included in this Table as per the request of INPARQUEs, the PA authority of Ven-ezuela, as they wish to update their data.
49 The financial gap data from Bolivia may include some distortions, as noted earlier, concerning projects that may not fit PA system priorities.
50 As with the financing gap estimated based on basic management needs, Venezuela is omitted from this table and analysis because its data is being updated by the Venezuelan PA authority, INPARQUES.
51 For Costa Rica, Guatemala, Mexico, and the Dominican Republic, the country data is from 2007.
Chapter 4
52 The specific elements and sub-elements vary between the different versions of the Scorecard. Any missing elements/sub-elements between discussion in this document and available Scorecards reflect the ‘feedback’ process of the Scorecard. New versions of the Scorecard reflect knowledge gained from the consultative process and the country workshop process.
53 This element can be omitted in countries where a PA system does not require a trust fund due to robust financing within government.
54 A national PA financing strategy will include targets, policies, tools, and approaches.
55 This could include budgets for development agencies and local governments for local livelihoods.
56 These responsibilities should be found in the Terms of Reference for the positions.
57 This element can be omitted in countries where a PA system does not require a trust fund due to robust financing within government.
58 At the time of printing, several other countries expressed intent to increase budgets in part based upon country level Scorecard data. These countries include Colombia and Paraguay.
59 This might include aerial surveys, marine pollution monitoring, economic valuations, etc.
60 Another way to look at this gap is to include funds other than government-budgeted funds. Total available resources includes government-budgeted funds and these two categories of extra-budgetary funds: (1) international cooperation and other donor sources and (2) PA-based revenues. To meet basic management needs across the countries that record funding needs and gaps, total available resources need to be increased, on average, 1.8 times. This is the average from 18 countries reporting their funding gaps.
61 As tourism infrastructure grows within PAs and, in turn, increases visitor numbers and PA revenues, the score for this element should be revised in proportion to its importance to funding the PA system.
62 Where PES is not appropriate or feasible for a PA system, take 12 points off the total possible score for the PA system.
63 Concessions will be mainly for tourism-related services such as visitor centres, gift shops, restaurants, transportation, etc.
Chapter 5
65 Belize: no financial data was submitted by the country during Scorecard application; Venezuela: the data on available finances was not representative of a ‘normal’ year, due to a government one-off extraordinary budget for infrastructure investment approved during the year that this Scorecard was applied.
65 Lopez et al., 2006
66 Weighted average taking into account total protected area in hectares (Mexico, Ecuador, Peru, Chile). Sources include Bezaury, Creel, and Pabon-Zamora (2009).
67 Smaller PAs with low revenue generation potential and a small number of low threats may not need business plans.
158 Fi n a n c i a l s u s t a i n a b i l i t y s co re c a rd

© anabela García/ tnc
© ur
banh
earts
. Fot
olia.c
om
United Nations Development Programmeone United Nations PlazaNew york, Ny 10017www.undp.org
For further information please contact:
Andrew Bovarnick
lead Natural Resources Economist, UNDP
The Nature Conservancy4245 North Fairfax Dr.Ballston, VA 22203www.nature.org
For further information please contact:Lila GilDirector of External Affairs for Latin America, [email protected]


![Email: [email protected], [email protected] - Indian Institute of](https://img.pdfslide.net/doc/110x75/62407f276e6f00699b389ee5/email-emailprotected-emailprotected-indian-institute-of.jpg)
![r( [email protected] [email protected] [email protected]`L](https://img.pdfslide.net/doc/110x75/6207318949d709492c2edac3/r-emailprotected-emailprotected-emailprotectedl.jpg)

![CII Vision Document: [email protected] - [email protected]](https://img.pdfslide.net/doc/110x75/6203872eda24ad121e4a75f5/cii-vision-document-emailprotected-emailprotected.jpg)

![The Linear Logic Primer [email protected] [email protected]](https://img.pdfslide.net/doc/110x75/613d69f2736caf36b75d0b40/the-linear-logic-primer-emailprotected-emailprotected.jpg)