Embed Size (px)
Citation preview
8/3/2019 Financial Tables & Formulas
http://slidepdf.com/reader/full/financial-tables-formulas 1/8
TIme
period(e.g., year) 1% 2% 3% 4% 5% 6% 7% 6% 9% 100/0 12'10 14% 16% 20'%
1 1.000 1.000 1.000 1.000 1.000 1.000 1.000 1.000 1.000 1.000 1.000 1.000 1.000 1.000
2 2.010 2.020 2.030 2.040 2.050 2.060 2.070 2.080 2.090 2.100 2.120 2.140 2.160 2.200
3 3.030 3.060 3.091 3.122 3.152 3.184 3.215 3.246 3.278 3.310 a.374 3.440 3.506 3.640
4 4.060 4.122 4.184 4.246 4.310 4.375 4.440 4.506 4.573 4.641 4.770 4.921 5.067 5.368
5 5.101 5.204 5.309 5.416 5.526 5.637 5.751 5.867 5.985 6.105 6.353 6.610 6.877 7.442
6 6.152 6.308 6.468 6.633 6.802 6.975 7.153 7.336 7.523 7.716 8.115 8.536 8.978 9.930
7 7.214 7.434 7.662 7.898 8.142 8.394 8.654 8.923- 9.200 9.487 10.089 10.730 11.413 12.915
8 8.286 8.583 8.892 9.214 9.549 9.897 10.260 10.637 11.028 11.436 12.300 13.23-3 14.240 16.499
9 9.369 9.755 10.159 10.583 11.027 11.491 11.978 12.488 13.021 13.579 14.776 16.085 17.518 20.798
10 10.462 10.950 11.464 12.006 12.578 13.181 13.816 14.487 15.193 15.937 17.549 19.337 21.321 25.958
11 11.567 12.169 12.808 13.486 14.207 14.972 15.784 16.645 17.560 18.531 20.655 23.044 25.732 32.150
12 12.683 13.412 14.192 15.026 15.917 16.870 17.888 18.977 20.141 21.384 24.138 27.271 30.850 39.580
13 13.809 14.680 15.618 16.627 17.713 18.882 20.141 2 1.495 22.953 24.523 28.029 32.089 36.786 48.496
14 14.947 15.974 17.086 18.292 19.599 21.051 22.550 24.215 26.019 27.975 32.393 37.581 43.672 59.195
15 16.097 17.293 18.599 20.024 21.579 23.276 25.129 27.152 29.361 31.772 37.280 43.842 51.659 72.035
16 17.258 18.639 20.157 21.825 23.65 7 25.673 27.888 30.324 33.003 35.950 42.753 50.980 60.925 87.442
17 18.430 20.012 21.762 23.698 25.840 28.213 30.840 33.750 36 .974 40.545 48.884 59.118 71.673 105.93
18 19.615 21.412 23.414 25.645 28.132 30.906 33.999 37.450 41.301 45.599 55.750 68.934 84.140 128.11
19 20.811 22.841 25.117 27.671 30.539 33.760 37.379 41.446 46.018 51.159 63.440 78.969 98.603 154.74
2022.019 24.297 26.870 29.778 33.066 36.786 40.995 45.762 51.160 57.275 72.052 91.025 115.37 186.68
25 28.243 32.030 36.459 41.646 47.727 54.865 63.249 73.106 84.701 98.347 133.33 181.87 249.21 471.98
30 34.785 40.568 47.575 56.085 66.439 79.058 94.461 113.283 136.308 164.494 241 333 356 787 530.310 1181.8

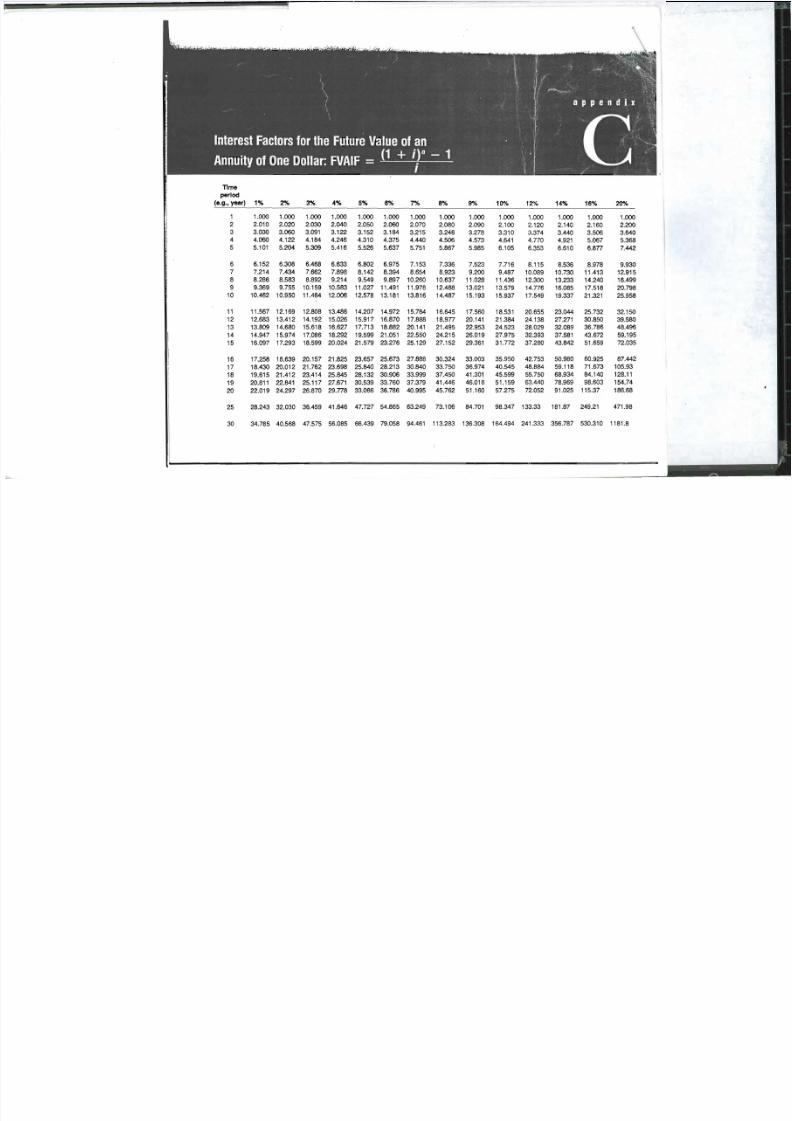
8/3/2019 Financial Tables & Formulas
http://slidepdf.com/reader/full/financial-tables-formulas 2/8
TIme
period
(e.g. year) 1% 2",4 3% 4% 5% 6% 7% , 6% 9% 10% 12% 14% 16% 18% 20% 24% 28% 32% 38%
1 0,990 0.980 0,971 0.962 0.952 0.943 0.935 0,926 0,917, 0.909 0.893 0.8n 0,862 0.847 0.833 0.806 0.781 0.758 0.735
2 1.970 1.942 1.913 1.886 1.859 1.833 1.808 1.783 1.759 1.736 1.690 1,647 1.605 1,566 1.528 1.457 1.392 1.332 1.276
3 2.941 2.884 2.829 2.n5 2,723 2.673 2.624 2,5 n 2.531 2.487 2.402 2.322 2.246 2.174 2.106 1,981 1.868 1.766 1.674
4 3,902 3,808 3.717 3.630 3,546 3.465 3.387 3.312 3.240 3,170 3.037 2.914 2.798 2.690 2.589 2.404 2.241 2.096 1.966
5 4,853 4,713 4.580 4.452 . 4.329 4.212 4.100 3.993 3.890 3,791 3.605 3.433 3.274 3,127 2.991 2,745 2.532 2.345 2.181
6 5.795 5,601 5.417 5.242 5.076 4.917 4.766 4.623 4.486 4,355 4,111 3.889 3.685 3.498 3.326 3.020 2.759 2.534 2.399
7 6,728 6.472 6,230 6.002 5.786 5.582 5,389 5.206 5,033 4,868 4,574 4.288 4.039 3.812 3 605 3,242 2.937 2678 2.455
8 7,652 7.325 7,020 6.733 6.463 6.210 5.971 5.747 5.535 5,335 4,968 4.639 4.344 4,078 3.837 3.421 3.076 2786 2.540
9 8,566 8,162 7.786 7,435 7.108 6.802 6.515 . 6,247 5.985 5,759 5.328 4.948 4.607 4.303 4.031 3.566 3.184 2.868 2.603
10 9.471 8.983 8,530 8,111 7.722 7,360 7.024 6.710 6.418 6.145 5.650 5,218 4.833 4.494 4.193 3,682 3.269 2 930 26 50
11 10.368 9.787 9.253 8.760 8,306 7.887 7.499 7.139 6.805 6.495 5,988 5.453 5.029 4.656 4.327 3.n 6 3.335 297 8 2683
12 11.255 10,575 9.954 9,385 8.863 8.384 7.943 7.536 7.161 6.814 6,194 5.660 5.197 4.793 4.439 3.851 3.367 3.013 2708
13 12.134 11.346 10,635 9.966 9.394 6.653 6.358 7.904 7.487 7.103 6.424 5.842 5.342 4,910 4.533 3.912 3.427 3.040 272 7
14 13.004 12.106 11.296 10.563 9.699 9.295 8.745 8.244 7.786 7.387 6.628 6.002 5.488 5.008 4.611 3,962 3.459 3.061 2.740
15 13.865 12.849 11.938 11.118 10.380 9.712 9.108 8.559 8.060 7,606 6,611 6.142 5.575 5.092 4,675 4.001 3.483 3.076 2.750
16 14.718 13.578 12.561 11.652 10.83810.106 9.447 6.851 > 6.312 7.624 6,974 6,265 5.669 5.162 4.7304 .003 3.503 3.088 2.758
17 ' . 15,56& 1.{292 13.166- 1 ~ 1 6 ~ .• 11.274 '10 477.. '9 ,.763" ,' 9.122 : 8.544 8.022 7,120 6,373 5,749 5,222 4,n5 4.059 3.516 3.097 2 763
18 16.39'8 14.992. 13.754 12.659 , t H . ~ 1 ; ~ 2 ~ 10.059 9.372 " 8.7?6", 8.201 7.250 6,467 5,818 5,273 4.812 4.080 3.529 3.104 27 67
19 17.226• . ' J"
15.678 14,324 13,134 12,085 lr1.l161l ;10.33 6 9.604 8.950 6.365 7.366 6.550 5.8 n 5.316 4.844 4.097 3,539 3.109 2.770
20 18,046 16,351 14,8 n 13.690 12.462 ' 11..470" 10,594 9,818 9.128 8 514 7.469 . 6.623 5.929 5.353 4.870 . 4.110 3.546 3 113 2.772
.: .. ..
... ;
,25" --' 22.023 19.523 17,413 15.622 14.094 f : 8 11,654 10.675 9:823 9.0n 7.843 6.873 6.097 5.467 4.948 4.147 3.564 3,122 2.776
-v-r
30 25.808 22.397 19.600 17.292 15.373 13.765 12.409 11,258 10.274 9.427 8.055 7 .003 6.1 n 5.517 4.979 4.160 3.569 3.124 2.778
-
8/3/2019 Financial Tables & Formulas
http://slidepdf.com/reader/full/financial-tables-formulas 3/8
" '" :. ' .. . ... ... . '.':, . ' ! .
TIme : - " \ .. ...
'r "• :7period
(e.g., year) 1% 2% "'3% . 6% 7% 8% 9% 10% 12% 14% 15% 16% 18% 20% 24% 28% 32% 36%. 40% 50% 60% 70% 80% 90%
1 .990 ,980 .971 .962 .952' ,943 .935 .926 .917 ,909 .893 ,877 ,870 :862 ,847 ,833 ,806 ,781 ,758 ,735 ,714 .667 ,625 .588 .555 .5262 .980 '.961 .943 .925 .907 .890 .873 .857 .842 :826 .797 .769 .756 .743 -71£ .694 · .650 ,610 .574 ,541 ,510 ,444 ,391 ,346 .309 ,277
3 ,971 .942 ,915 .889 .864 .840 .794 \772 .751 .712 .675 ,658 .641 .609 .579 .524 .477 .435" ,398 .364 .296 .244 .204 .171 ,146
4 ,961 ,924 .889 .855 ,823 .792.763 .735,.708 .683 .636 .592 .572 .552 .516 .482 .423.373 .329 :292 ,260 ,198 ,153 ,120 .095 ,077
5 .951 .906 .863 .822 .784 .747 .713 .681 .650 .621 .567 .519 ,497 ,476 .437 ;402 ,341 ,291 ,250 .215 .186 ,132 .095 ,070 .053 .040
'; . ''. ...:L
6 .942 .888 .838 .790 .746 .705 .666 .630 .596:564 .507 .456 ,432 .410 ,370 ,335 ,275 .227 ,189 ,158 .133 .088 .060 ,041 ,029 ,021
7 .933 .871 .813 ..760 .711 .665 .623 ,583 .547 .513 .452 .400 ,376 .354 .314 .279 .222 .178 .143 ,116 .095 .059 .037 ,024 ,016 ,011
8 .923 .853 .789 .731 .677 .627 .582 .540 .502 . ~ ~ 7 .404 .351 .327 .305 .266 .233 .179 .139 .108 .085 .068 .039 .023 .014 ,009 ,006
9 ,914 ,837\, .766 .703 .645 .592 ,544 ..500 .460 .424 .361 ,308 ,284 .263 ,226 ,194 ,144 ,108 ,082 .063 .046 .026 ,-01;; ,008 .005 .003
10 ,905 ,820 .744 ,676 ,614 ,558 ,508 .463 .422 .386 ,322 ,270 .247 ,227 ,191 ,162 .116 .085 .062 ,046 ,035 ,017 .009 ,005 .003 .002._
11 .896 ,804 .722 ,650 .585 ,527 .475 .429 .388 . 350 ;287 ,237 .215 .,195 .162 . 135 ',094 .066 .047 ,034 .025 ,012 ,006 ,003 .002 .001
12 .887 .788 .701 .625 .557 ,497 .444 .397 .356 .319 .257 .208 .187 ,168 .137 .112 .076 .052 .036 .025 .018 .008 ,004 .002 .001 .001
13 .879 . .773 .681 .601" '.530 .469 .415 . .368 .326 .290 ..229 . .182 .163 .145 .116 .003 .061 .040 .027 .018 .cn3 .005 .002 .001 ,001 .000
14 .870 ;758 .661 ,577 .505 .442 .388 '340 .299 · ,263 .205 .160 :141 .125 ·.099 ,078 .049 .032 .021 .014 .009 ,003 ,001 .001 .000 .000
15 .861 .743 .642 .555 ,481 ,417 .362 .315 ,275 .239 .183 .140 .123 ,108 .084 .065 .040 .025 .016 ,010 .006 ' .002 .001 .000 .000 ,000
'16 .853 .728 ,623 .534 .458 .394 .339 .292 .252 .218 ;163 ,123 .107 .093 .071 :054 ,032 .019 .012 ' ,007 .005 .002 .001 .000 000
17 .844 ,714 .605 ,513 .436 .371 .317 .270 ,231 .198.146 .108 .093 .080 .060.045 ,026 .015 .009 .005 .003 .001 ,000 .000
18 .836 .700 .587 .494 .416 .350 .296' .250 .212 .180 .130 ' .095' .081 .051 ,038 .021 .012 .007 ;004 ,002 ,001 ,000 .000
19 .828 ,686 .570 .475 · .396 .331 :276 .232 .194 .164 .116 .083 .070 ..060 '.043 .031 .017 .009 .005 .003 .002.000 .000
20 .820 .673 .554 .456 .377 ,312 ..2S8 .215 .178 .149 ; ' .104 .073 '.061 ,051 .037 .026 ,014 ,007 .004 .002 .001 .000 ,000, ~ . ' " 0 •
.. • -, ". ":'.'
25 .780 ,610 .478 .375 .295 .233 . 1 e : . 1 4 ~ \ 1 E 7 i092 '.059 .038 .030 .024 .018 .0tO .005 .002 ' .001 .000 .000' ", :
. . ~ . ."" }
30 ..742 .552 .412 .308 .231 .174 ..131 .099 .,075 .057 .033 .020 .015 .012 .007' 004 .002 .001 .000 ,000
,..
... .
." ."

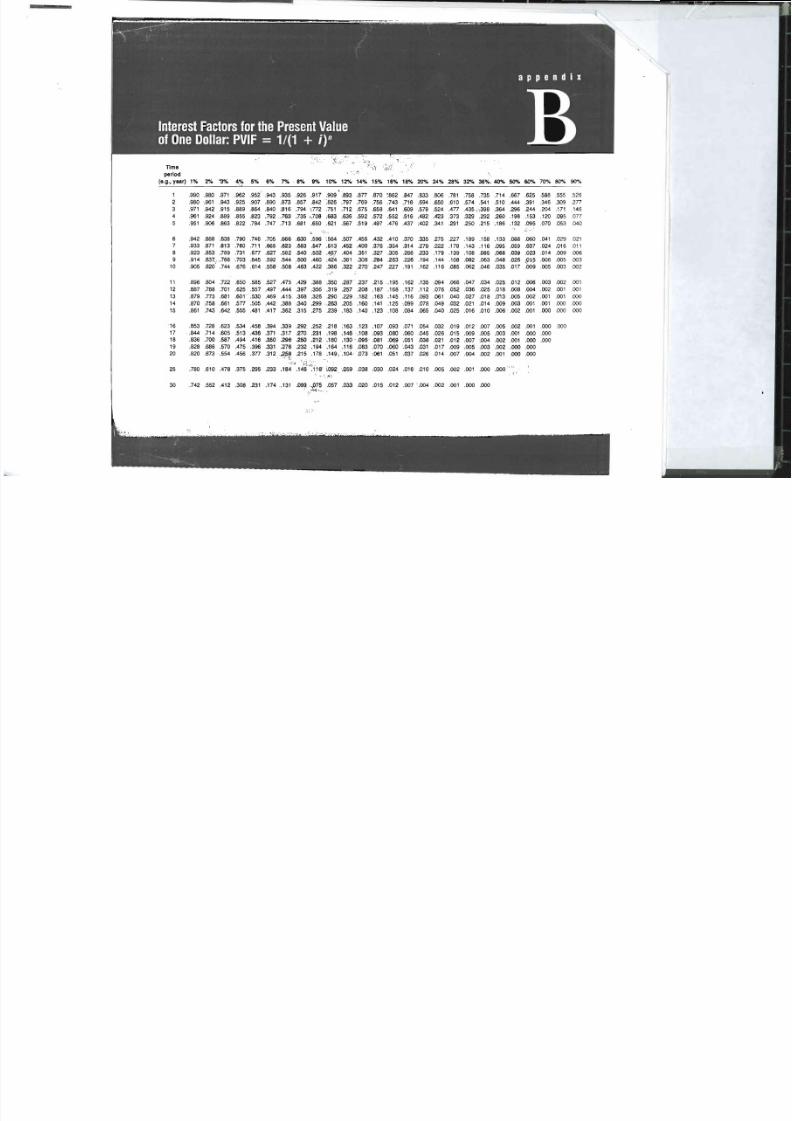
8/3/2019 Financial Tables & Formulas
http://slidepdf.com/reader/full/financial-tables-formulas 4/8
j } ' ,
TImeperiod
(e.g., year) 1% 2% .3% 4% 5% 6% 7% 8% 9% 10% 12% 14% 15% 16% 18% 20%
' \' f :
.. ..' , • 1,
I
I
1
2
3
4
5
6
7
8
9
10
1.010
1.020
1.030
1.041
1.051
1.062
1.072
1.083
1.094
1.105
1.020
1.040
1.061
1.082
1.104
1.126
1.149
1.172
1.195
1.219
1.030 1.040
1.061 1.082
1.093 1.125
1.126 1.170
1.159 1.217
1.194 1.265
1.230 1.3161.2671.369
1.305 1.423
1.344 .1.A 80
1.050
1.102
1.158
1.216
1.276
1.340
1.40('1.477
1.551
1 629
1.060
1.124
1.191
1.262
1.338
1.419
1.504
1.594
1.689
1.791
1.070
1.145
1.225
1.311
1.403
1.501
1.606
1.718
1.838
1.967
1.080
1.166
1.260
1.360
1.469
1.587
1.714
1.851
1.999
2.159
1.090
1.188
1.295
1.412
1.539
1.677
1.828
1.993
2.172
2.367
1.100
1.210
1.331
1.464
1.611
1.772
1.949
2.144
2.358
2.594
1.120
1.254
1.405
1.574
1.762
1.974
2.211
2.476
2.773
3.106
1.140
1.300
1.482
1.689
1.925
2.195
2.5022.853
3.252
3.707
1.150
1.322
1.521
1.749
2.011
2.313
2.6603.059
3.518
4.046
1.160
1.3461.561
1.811
2.100
2.436
2.8263.278
3.803
4.411
1.180
1.3921.643
1.939
2.288
2.697
3.1863.759
4.436
5.234
1.200
1.440
1.728
2.074
2.488
2.986
3.583
4.300
5.160
6.192
11
12
13
14
15
1.116
1.127
1.138
1.149
1.161
1.243
1.268
1.294
1.319
1.346
1.384
1.426
1.469
1.513
1.558
1.539
1.601
1.665
1.732
1.801
1.710
1.796
1.886
1.980
2.079
1.898
2.012
2.133
2.261
2.397
2.105
2.252
2.410
2.579
2.759
2.332
2.518
2.720
2.937
3.172
2.580
2.813
3.066
3.342
3.642
2.853 3.479
3.138 3.896
3.452 4.363
3.797: I , 4.887
4.177 5.474
4.226
4.818
5.492
6.261
7.138
4.652
5.350
6.153
7.076
8.137
5.117
5.936
6.886
7.988
9.266
6.176
7.287
8.599
10.147
11.973
7.430
8.916
10.699
12.839
15.407
16
17
18
19
20
1.173
1.184
1.196
1.208
1.220
1.373
1.400
1.428
1.457
1.486
1.605
1.653
1.702
1.754
1.806
1.873
1.948
2.026
2.107
2.191
2.183
2.292
2.407
2.527
2.653
2.540
2.693
2.854
3.026
3.207
2.952
3.159
3.380
3.617
3.870
3.426
3.700
3.996
4.316
4.661
3.970
4.328
4.717
5.142
5.604
4.595
5.054
5.560
6.116
6.728
6.130
6.866
7.690
8.613
9.646
8.137
9.276
10.575
12.056
13.743
9.358
10.761
12.375
14.232
16.367
10.748
12.468
14.463
16.777
19.461
14.129
16.672
19.673
23.214
27.393
18.488
22.186
26.623
31.948
38.337
25 1.282 1.641 2.094 2.666 3.386 4.292 5.427 6.848 8.623 10.835 17.000 26.462 32.919 40.874 62.688 95.396
30 1.348 1.811 2.427 3.243 4.322 5.743 7.612 10.063 13.268 17.449 29.960 50.950 66.212 85.850 143.370 237 370
L

8/3/2019 Financial Tables & Formulas
http://slidepdf.com/reader/full/financial-tables-formulas 5/8
~ E uat ions
:hapter 2
The balance sheet identity or equ ation :
Assets = Liabiliti es
+ Shareholders' equity
The income statement equation:
Reve nues - Expenses = Income
The cash flow identity:
Cash flow from asse ts= Cash flow to creditors
+ Cash flow to stoc kholders
whe re:
6. The total debt ratio:
Total debt ratio
. Total assets - Total equity[2,IJ
Total assets
7. The debt-equity ratio:
[2.2 ] Debt-equity ratio
= Total deb t/Total equity
8. The equity multiplier:
[2.3] Equ ity mult iplie r
= Total asse ts/Total equity
9. Th e long-term debt ratio:
a . Cash flow from assets = Operatin g cash flow (OCF) Long-term debt ratioNet capital spending - Change in net working capital
Long-term debt(NWC)
Long-term deb t + Total equity(l) Operating cash flow = Earn ings before interest and
taxes (EBIT) + Depreciation - Taxes 10. The times interes t earned (TIE) ratio:(2) Net capital spe nding = End ing net fixed assets EBIT
Beginning net fixed asse ts + Depreciation Times interest earned rat io = -1 - nterest
(3) Change i n net working capital = Ending
NWC - Beginnin g NWC 11. Th e cash coverage ratio:
b. Cas h flow to creditors = Interes t paid - Net new Cash coverage ratioborrowing
c. Cash -flow to stockho lders = Dividends paid
- Net new equity rais ed
ha pter 3
The cu rrent ratio :
Current assetsC urren t rat io =
Curren t liabilities
The quick or acid-test ratio:
. k . Current assets - InventoryQUIC ratio = - - - - - - - = " -
Current liabilities
·The cash ratio:
CashCash ra tio = ---- - -
Curr ent liabilities
The ratio of net working ca pital to total asse ts :
Net worki ng cap ital to total assets
= Net working capi tal
Total assets
The interval measure:
EBIT + DepreciationInterest
12. Th e inventory turnover ratio:
In ventory turnover
Cost of goods sold
Invent ory[3.1]
13. The average days' sales in inventory:
Days ' sales in in ventory
365 days[3.2J
Inventory turnover
14. The rece ivables turnover ratio:
Receiva bles turno ver[3.3]
Sal es
Accounts receivable
.15 . The days' sales in receivables:
Days' sales in receivables[3.4J
365 days
1
I!
[3.6J ,
[3.7Ji
s•.,
i,
i !3.8J"
fr
,I.
I3.9] Ir·
:
I:j !
[3.10J ii;t'
;; Iif([3.11J :
I: !
.1'I .
I'"I.
[3.12J ti,III 'i '
"fI
[3.13]: '
[3.14J
i '
[3.15J
B-1
[3.16J
Receivables turnover
16. The net working capital (NWC) turno ver ratio :
Sale sNWC turnover = NWC3.5J
Average daily operating cost s
Interval measure
Curr ent asse ts

8/3/2019 Financial Tables & Formulas
http://slidepdf.com/reader/full/financial-tables-formulas 6/8
B- 2 APPENDIX B Key Equat ions
17. The fixed asset turn over rat io: Chapte r 5
. Sales 1. The future value of $ [ invested for rperiods at rate of r perFixed asset turnover = - - ---
[3.17] period:Net fixed asse ts. Future value = $1 X ( I + 1')' [5.1]
18. The total asset turnover ratio :. 2. The present value of $ [ to be received r periods in the
SalesTotal asse t turnover = - - - futu re at a discount rate of r:[3.18 )
Total asse tsPV = $ [ X [1/(1 + r)'J = $[ / (1 + 1') [5.2)
19. Profit margin :3. The relati onship betwe en future value and present value
. Net income (the basic present value equation):Profit margIn = --- [3.19]
Sales PV X ( I + r)' = FV,[5.3]
20. Return on as sets (ROA): PV = FY,/ ( l + r)' = FV, x [ [/ (1 + 1') ')
Net incom eReturn on assets = - - - [3.20]
Total assets Chapter 6
21. Return on equ ity (ROE): 1. The present value of an annuity of C dollars per period for
r periods when the rate of return or interest rate is r:. Net incomeR eturn on equity = - [3.21] Annui ty present value
Total equi ty1 - Present value factor)
22. The price-earnings (PE) ratio: =C x (I'
' Price per sh are [6.1]PE ratio = - - [3.22 ] = CX (1 ..: [1/; 1 + r)'JIarnings per share.\
23. T he market -to -book ratio: 2. The future va lue factor for a n annuity:Marke t-to- boo k ratio }
Annuity FV factor_ Market value per share = (Future value factor - I)/ r [6.2]
"
[3.23]Book value per share = [(I + r)' - [J/r
24. T he Du Pon t ident ity: 3. Annuity due value = Ord inary annuity value[6.3]
X (I + 1')
ROE = Net inco me X _Sale s X Asse ts[3.24] 4. Presen t value for a perpetuity:
Sales Assets EquityPV for a perpet uity = C/ r = C X (I / r) [6.4]
Ret urn on assets5. Effective annual rate (EAR), where 111is the number of
ROE = Profi t m argintimes the interest is compounded du ring the year :
X Total ass et turnover
X Equi ty m ultiplie r EAR = [I + (Quo ted rate/m)] '" - I [6.5]
6. Effective annual rate (EAR), where q stands for theC hapter 4 continuously compounded quoted rate:
1. The dividen d payout ratio: EAR = eq- [ [6.6]
Dividend payout ratio[4.1J= Cash divide nds /N et income Chapte r 7
2. Th e internal growth rate :1. Bond value if bond has ( J) a face value of F paid
RO A X b at maturity, (2) a coupon of C paid per period. (3) (p eriodsInternal growth rate = - - - - [4.2J to maturity, and (4) a y ield of r per period:[ - ROA X b
Bon d value. The sustainable growth rate :
= C X [ I - 1/ (1 + r)'Jlr + F/ O -/- r)' [7.1JRO E X b
Su stainable growth rate = --- - _ [4.3] Bond valueI - ROE X b
= Present value + Present value4. T he ca pital intens i ty ra tio:
of the coupons of the face amount
. I ' . . Total assetsCapita mtensrty ratio = - --- - 2. The Fisher effec t:Sa les
l + R = (J + / ) X ( I + h) [7 .2]
R = I' +h+r Xh [7 .3]Total asset turnover r + [7.4]
I • ~ · ~ . r : · : : ~ : · __ ~ . ' ~ ' - ' r . 4 - : ? : : - ; : . ~ ..... - .. -:._ .; _ ~ .. '-. . . .: ; • _ :: _ ~ •• . •
. .
. . ..I . .

8/3/2019 Financial Tables & Formulas
http://slidepdf.com/reader/full/financial-tables-formulas 7/8
APPENDIX B Key Equations B-3
Chapter 8
1. The div ide nd gr owth model:
Po = Do x ( l + g ) R - g R - g
2. Requ ired ret urn:
R = D1 /Po + g
[8.3]
[8.5]
4.
5.
Financial break-even level:
Q = (FC + OCF"') /( P - v)
where
OCF * = Zero NPV ca sh flow
Degre e of operating leverage (DOL):
DO L = I + FC /O C F [11.4]
Chapter 12C hapte r 91. Variance of returns, Var(R) or u":1. Ne t prese nt va lue (NPV) :
I - ?NP V = Present value of future cas h flows YareR) = T _ I [(R, - R)- + .. .- Investmen t cos t [12.3]
+ (Rr - R)2]2. Payback per iod:
2. Standard dev iation of returns, SD(R) or <J:Payback period = Num ber of years that pass
before the sum of an in vestmen t 's cash flows SD(R) = VVar(R)
eq ual s the co st of the investme nt
3. D iscounted payback period : Chapte r 13
Disco un ted payback period = Number of yea rs tha t 1. Risk premium :
pass before the sum of an investment's discounted Risk premium = Expected return[13. 1J
ca sh flow s eq uals the cos t o f the inves tmen t - Risk-free rate
4, The average accounting return (AAR): 2. Expected return on a portfolio:E(Rp) = XI x E(R1) + X2 x E(R2 ) + . . .Average net income [13.2J
AAR = - --="---- - + X" X E(Ru )Average book value
3. Th e reward-to -risk ratio :5. Internal rate of return (IRR) :
Re ward-to-risk rat io = E[R;] - RfIRR = Disc ount rate of required return such that
f3ithe net present value of an inves tment is zero
4. The capi tal asse t pricing model (CAPM):6. Profitabil ity index:
E(R;) = Rf + [E(RM) - RtJ X f3i [13.7]PV of cas h flows
Profitabili ty index = ----- - Cos t of investment
C hap te r 14
1. Value o f a call option at maturi ty:Chapter 10 a. C 1 = 0 if (S, - E ) ::; 0 [14.1]
1.Bottom -up app roach to operating ca sh flow (OC F): b. C1 = S, - E if (SI - E ) > 0 [14 .2J
2. Bounds on the va lue of a call option :OC F = Ne t income + Depreciation [10.1]a. Uppe r bou nd :
2. Top-down app roach to operating ca sh flow (OCF) :Co::; So [14.3]
OCF = Sales - C os ts - Taxes [10.2] b. Lower bound :
Co 2: 0 if So - E < 03. Tax shield app roach to ope rating ca sh flow (OCF) : [14.4]Co 2: So- E if So - E 2: 0
OCF = (Sa les - Costs) X ( I - T )[10 .3] 3. So = Co + E /( l + Rf )+ Depreciation x T [14.5]
. Co = So - E /( l + Rf )
A. Value of a call that is certain to finish in-the-mon ey:Chap t e r I I
Ca ll option value1. Accounting break-even level:
= Stock valueQ = (FC + D)/ (P - v) [11.1] - Present value of the exercise price
2. Relationship between operat ing cas h flow (OC F) and sales Co =So - E/ (l + [14.6]
volume:
Q = (FC + OCF)/ (P - v) [11.3] C hapter 15
3. Cash break-even level: 1. Required return on equ ity, RE; (dividend growth model ):
Q = FC/ (P - i-) RE; = DJ/P o + g [15.1)

8/3/2019 Financial Tables & Formulas
http://slidepdf.com/reader/full/financial-tables-formulas 8/8
~ APPEND IX B Key Equations
" Required return on equity, RE (CAPM): Chapter 20 . . ' . ". ;
1. Float mea surement:Rt = Rf + ~ X (RM - Rf) [15.2]a. Average daily float:
t. Requ ired return on preferred s tock, R»:-r0tal float
Rp = DIPo [15.3] Average dai ly floa t = - 2 - : . ' : ' : : " : : " : : ' : [:ioj]\Total days
I. The weight ed average co st o f cap ital (WACC): b. Average dai ly float:
Average daily floatWACC = (EI V) x RE + (DI V) X RD[15.6] = Average daily receip tsX ( 1 - Tc)
. , I Weighted av erage delay '
."I . Weighted ave rage flotation cost,fA :
2. The Baumol-Allais-Tob in (BAT) model:". '..'; ;.E , D a. Opportunity cos ts:
JA= \ iX f£ + V X fD [15.8]Opportunity cos ts = (C/2 ) X R [20A.If "
b. Trading costs:
Trad ing costs = (Ti C) X F:hapte r 16
c. Total cost:I, Rights o fferings: Total cos t = Oppo rtuni ty cos ts
[20A .31 .• ." I •. Number of ne w sha res: + Trading cos ts
N umber of new shares d. Th e o ptima l initial cas h balance: . : : /.- . " , . "
Fun ds to be ra ised C* = V(2 T X F)IR [20l\AY'"[16.1)
Subsc ription pri ce 3. T he Miller-Orr mode l:
a. Th e opt imal cas h balance:b. Number of righ ts needed : . IC" = L + (3 /4 X F X a 2I R)I /3 [20K.si
Num be r (If rights needed to buy a s hare of stock b. T he upper limi t:
U* = 3 X C* - 2 X LOld shares[16.2)
New shares
c. Value of a right:Chap ter 21
Value of a right = R ights-on pr ice - Ex-rights :. ' ; - 'price 1. Th e s ize of receiv ables: .'Acc ounts rece ivable [2Ll]
:hapter 17 = Average dail y sa les X ACP. : r.
l . Modi gli ani -M iller Pro posi tions (no taxes): 2. NP V of switchin g credit terms:
a. Proposit ion I: a. Presen t value of swi tching:[21.4]VL = "u PV = [(P - v)(Q ' - Q)J/R
, "
b. Propo sition II : b. Cos t of switching:
R£ = RA + (RA - RD ) X (DI E) [17.1] Cos t of sw itch ing = PQ + v(Q' - Q) [2i4 r "c. NPV o f switch ing:~ Mod igliani-M il!er prop osition s (with taxes):
NPV of swi tching = - [PQ + v(Q' - Q)Ja. Value of the interes t tax sh ield:+ (P - v) [21.6.1:Val ue of the interest ta x shieldX (Q' - Q)I R
= ('!C X RDX D)I RD [17.2]
= '!C x D 3. NPV of gran ting credit:b . Proposition I :
a. With no repeat busi ness :VL = Vu + '!C X D [17.3] [21.81PV = - v + (1 - -rr)PI (1 + R)c. Proposition II: b. With repeat business :
R£ = Ru + (Ru - RD) X (DIE) N PV = - v + ( I - -rr)(P - v)I R [21.9j[17.4 J
X( I - 7C )4. The eco nomic orde r quantity (EOQ) model:
a. Total carry ing cos ts:Chapte r 19 Tot al carry ing cos ts
1. The operating cycle: = Average inve nto ry [21.101X Carrying co sts p er unitO perating cycle = Inventory pe riod
[19.4] = (QI2) X CC+ Acc ounts rece ivable peri odb. Total res tockin g cos ts:
2. Th e cas h cycle:Tota l restocking co sts
Ca sh cycle = Ope rating c ycle = Fixed cos t per order [21.111[19.5]
- Accounts payab le period X Nu mber o f orders = F X (TI Q)