Embed Size (px)
Citation preview
FINANCING
THE FUTURE OF THE GLOBAL
PHARMACEUTICAL INDUSTRY
Philipp Gutzwiller
November 2014
Is the Pharma Market moving
from Monopoly to Monopsony?
2
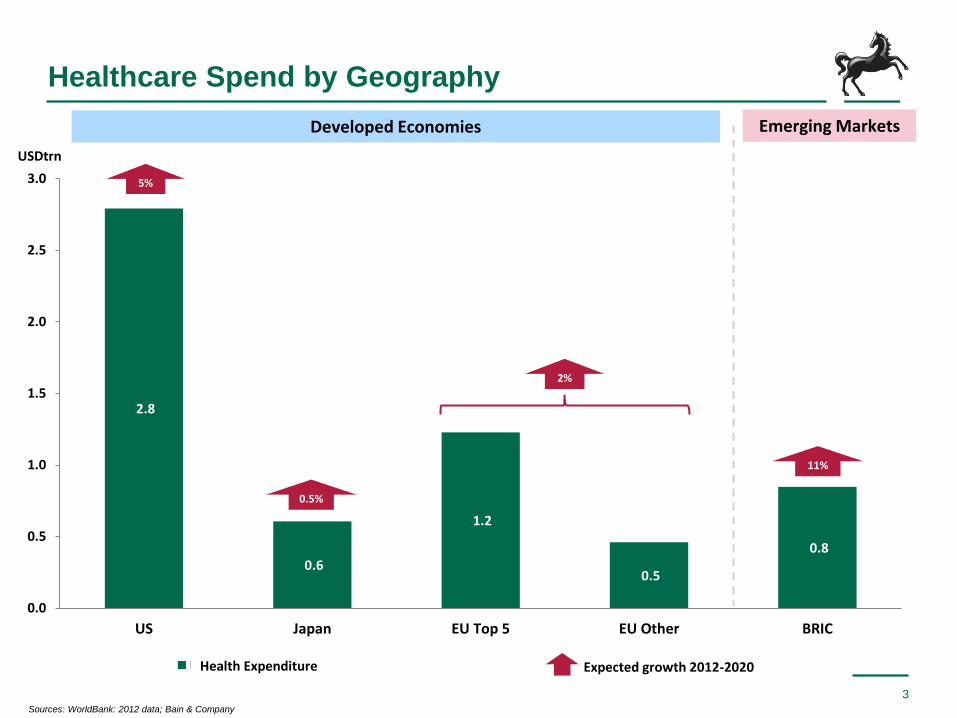
2.8
0.6
1.2
0.5
0.8
0.0
0.5
1.0
1.5
2.0
2.5
3.0
US Japan EU Top 5 EU Other BRIC
Health expenditure, total US$trn (absolute)
Healthcare Spend by Geography
3
Developed Economies Emerging Markets
2%
11%
5%
0.5%
USDtrn
Sources: WorldBank: 2012 data; Bain & Company
Expected growth 2012-2020 Health Expenditure
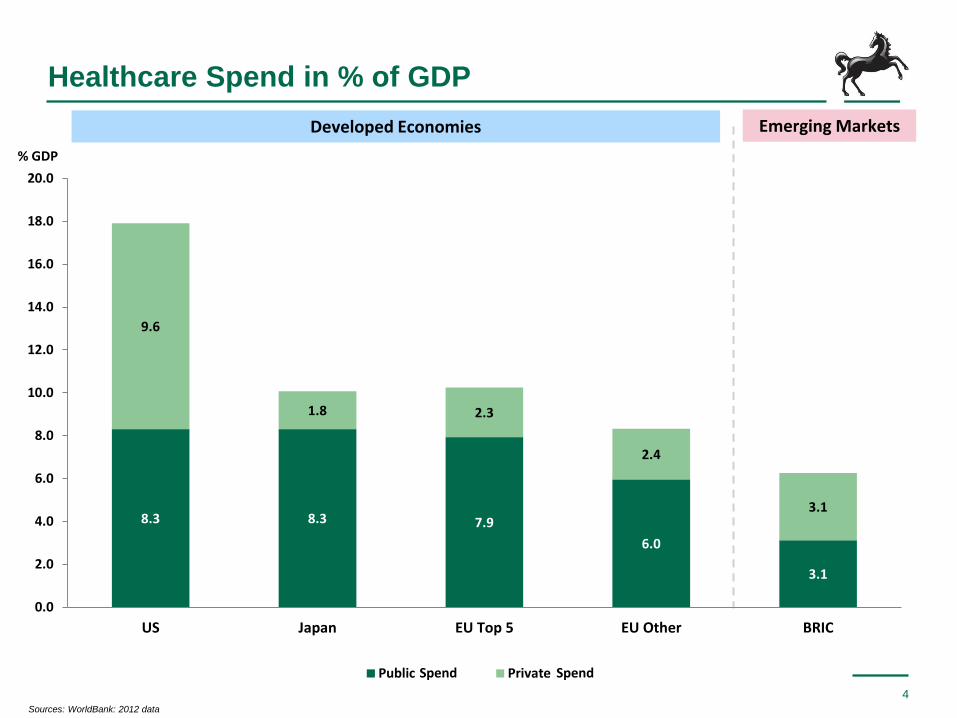
Healthcare Spend in % of GDP
4
Developed Economies Emerging Markets
8.3 8.3 7.9
6.0
3.1
9.6
1.8 2.3
2.4
3.1
0.0
2.0
4.0
6.0
8.0
10.0
12.0
14.0
16.0
18.0
20.0
US Japan EU Top 5 EU Other BRIC
Public Private
% GDP
Sources: WorldBank: 2012 data
Spend Spend
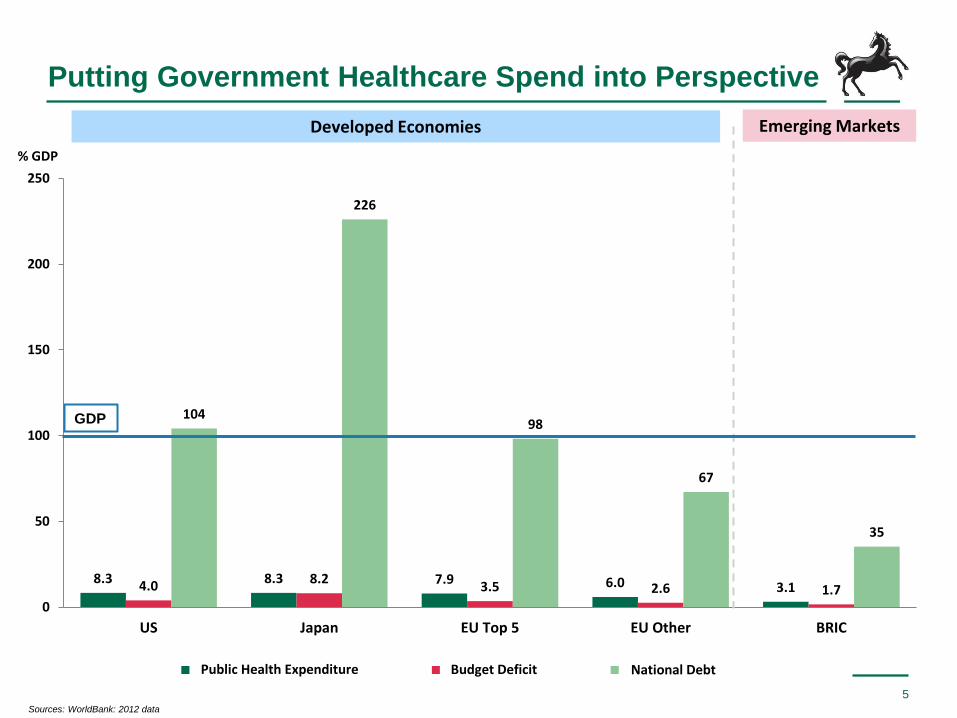
8.3 8.3 7.9 6.0 3.1 4.0 8.2 3.5 2.6 1.7
104
226
98
67
35
0
50
100
150
200
250
US Japan EU Top 5 EU Other BRIC
Public Health expenditure (%GDP) Budget Deficit (%GDP) National debt (% of GDP)
Putting Government Healthcare Spend into Perspective
5
Developed Economies Emerging Markets
GDP
% GDP
Sources: WorldBank: 2012 data
Public Health Expenditure Budget Deficit National Debt
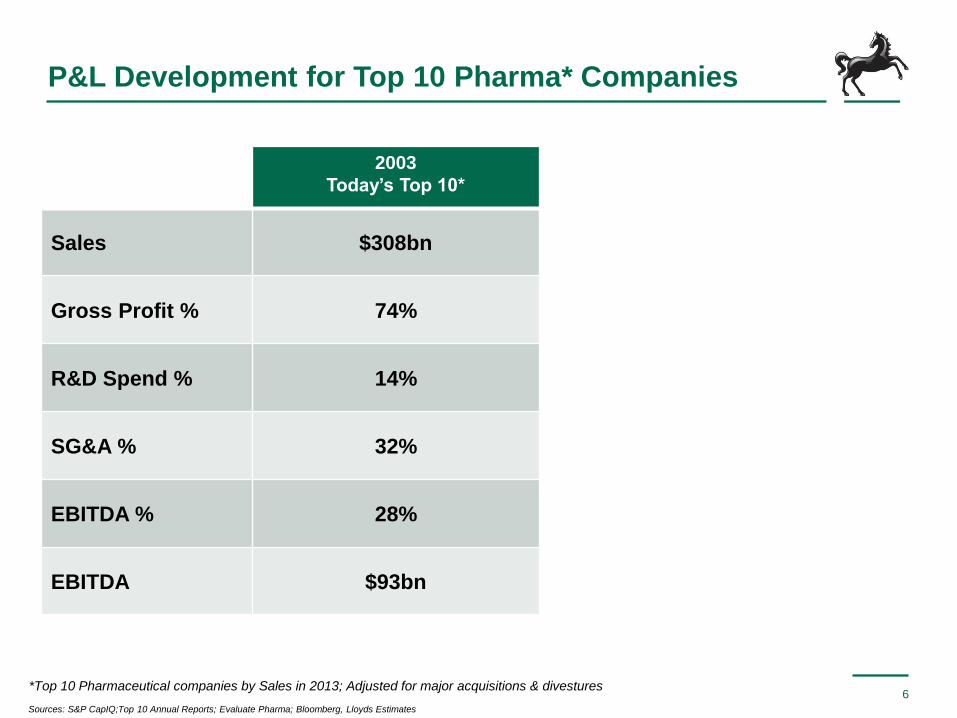
P&L Development for Top 10 Pharma* Companies
6
2003
Today’s Top 10*
Sales $308bn
Gross Profit % 74%
R&D Spend % 14%
SG&A % 32%
EBITDA % 28%
EBITDA $93bn
Sources: S&P CapIQ;Top 10 Annual Reports; Evaluate Pharma; Bloomberg, Lloyds Estimates
*Top 10 Pharmaceutical companies by Sales in 2013; Adjusted for major acquisitions & divestures
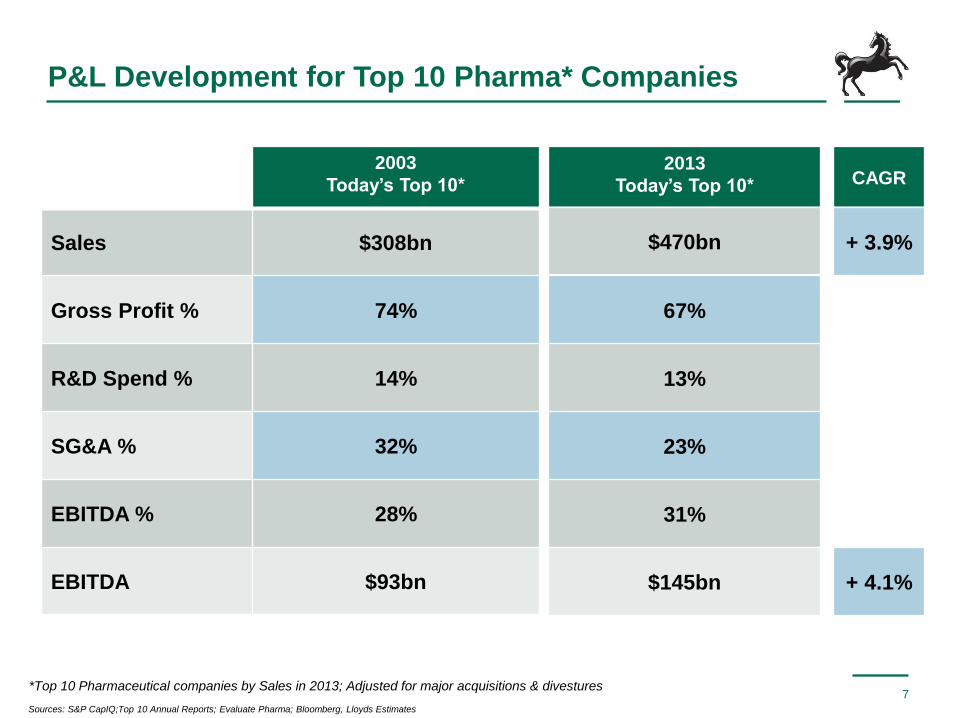
P&L Development for Top 10 Pharma* Companies
7
2003
Today’s Top 10*
Sales $308bn
Gross Profit % 74%
R&D Spend % 14%
SG&A % 32%
EBITDA % 28%
EBITDA $93bn
Sources: S&P CapIQ;Top 10 Annual Reports; Evaluate Pharma; Bloomberg, Lloyds Estimates
2013
Today’s Top 10* CAGR
$470bn
67%
13%
23%
31%
$145bn
+ 3.9%
+ 4.1%
*Top 10 Pharmaceutical companies by Sales in 2013; Adjusted for major acquisitions & divestures
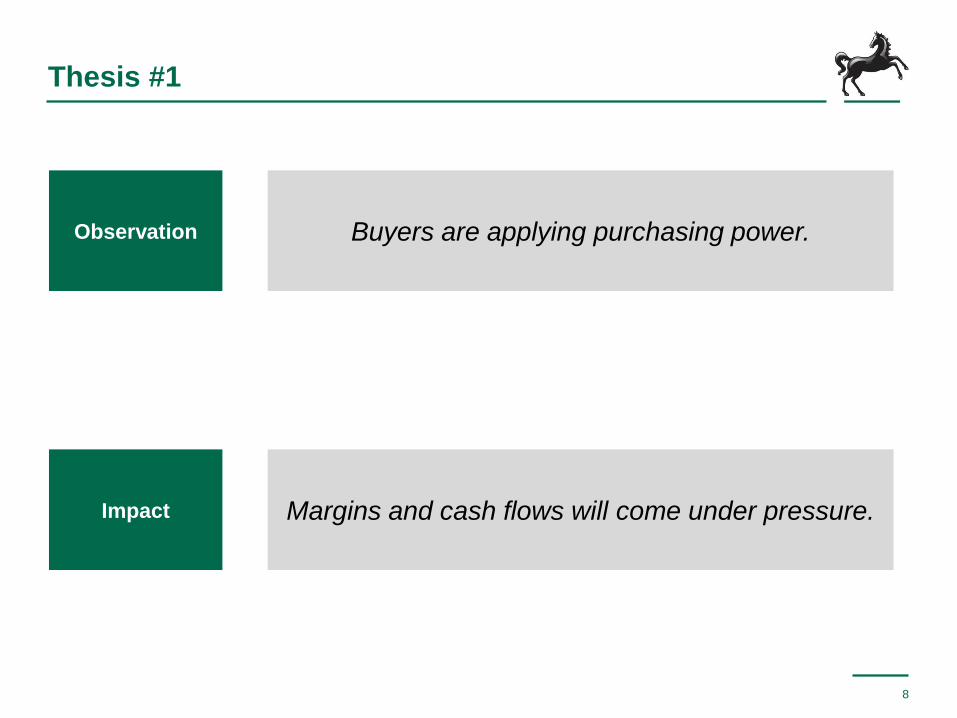
Thesis #1
8
Observation
Impact
Buyers are applying purchasing power.
Margins and cash flows will come under pressure.

More Volatility, Anyone?
9
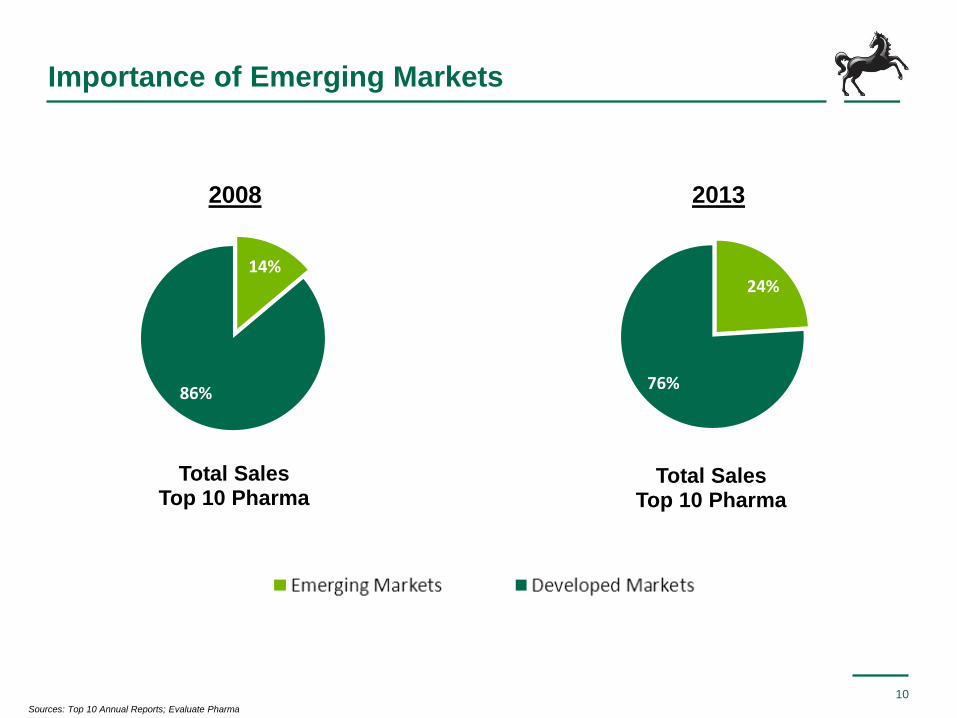
Importance of Emerging Markets
10
14%
86%
Total Sales Top 10 Pharma
Sources: Top 10 Annual Reports; Evaluate Pharma
24%
76%
Total Sales Top 10 Pharma
2008 2013
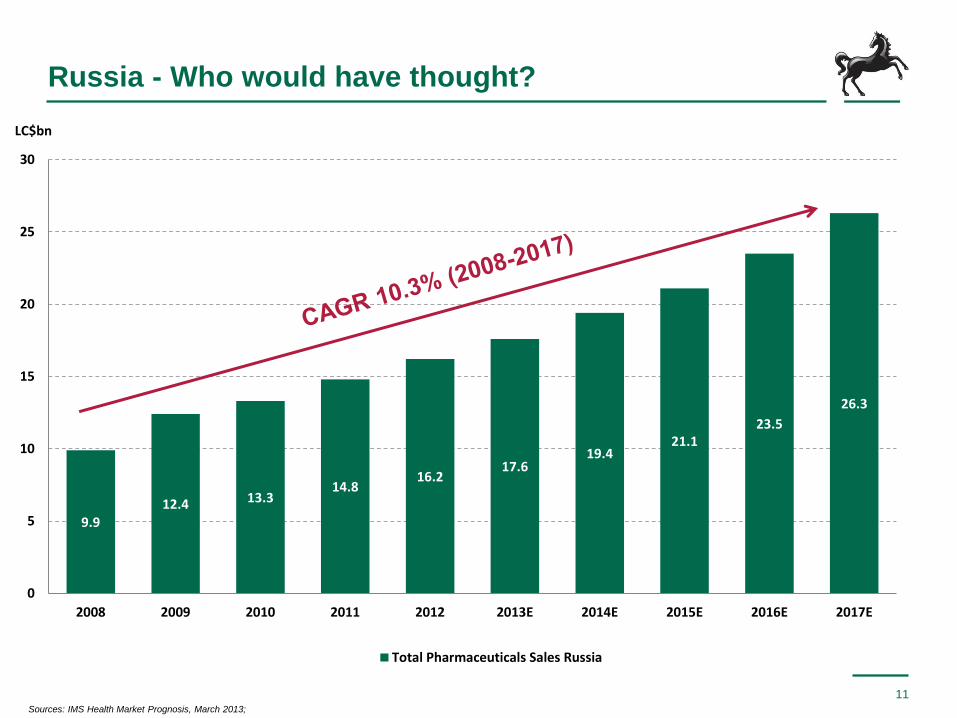
Russia - Who would have thought?
11
9.9 12.4 13.3
14.8 16.2
17.6 19.4
21.1 23.5
26.3
0
5
10
15
20
25
30
2008 2009 2010 2011 2012 2013E 2014E 2015E 2016E 2017E
Total Pharmaceuticals Sales Russia
Sources: IMS Health Market Prognosis, March 2013;
LC$bn
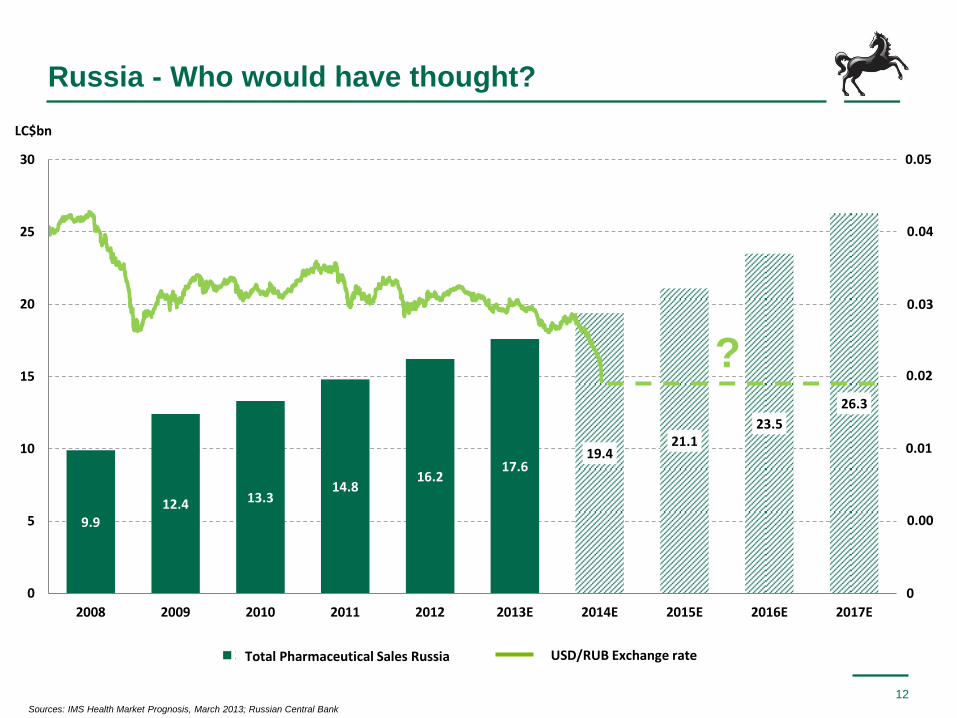
Russia - Who would have thought?
12
9.9 12.4 13.3
14.8 16.2
17.6 19.4
21.1 23.5
26.3
0
5
10
15
20
25
30
2008 2009 2010 2011 2012 2013E 2014E 2015E 2016E 2017E
2008 2016E USD/RUB Exchange rate
? 0.02
0.04
0.03
0.05
0.01
0.00
0
Sources: IMS Health Market Prognosis, March 2013; Russian Central Bank
LC$bn
Total Pharmaceutical Sales Russia

Thesis #2
13
Observation
Impact
Emerging Markets are here to stay.
Increased volatility will need to be managed.
Can Pharma afford the Cost of Growth?
14
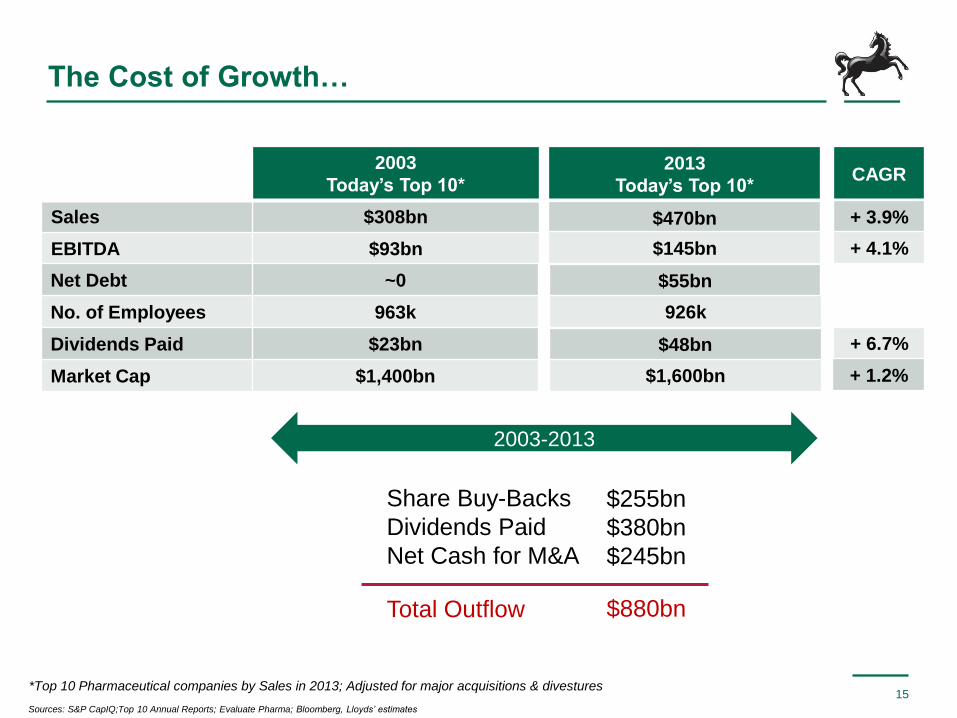
The Cost of Growth…
15
2003
Today’s Top 10*
Sales $308bn
EBITDA $93bn
2003-2013
Share Buy-Backs
Dividends Paid
Net Cash for M&A
$255bn
$380bn
$245bn
$880bn Total Outflow
Sources: S&P CapIQ;Top 10 Annual Reports; Evaluate Pharma; Bloomberg, Lloyds’ estimates
2013
Today’s Top 10* CAGR
$470bn
$145bn
$55bn
926k
$48bn
$1,600bn
+ 3.9%
+ 6.7%
+ 1.2%
+ 4.1%
*Top 10 Pharmaceutical companies by Sales in 2013; Adjusted for major acquisitions & divestures
Net Debt ~0
No. of Employees 963k
Dividends Paid $23bn
Market Cap $1,400bn
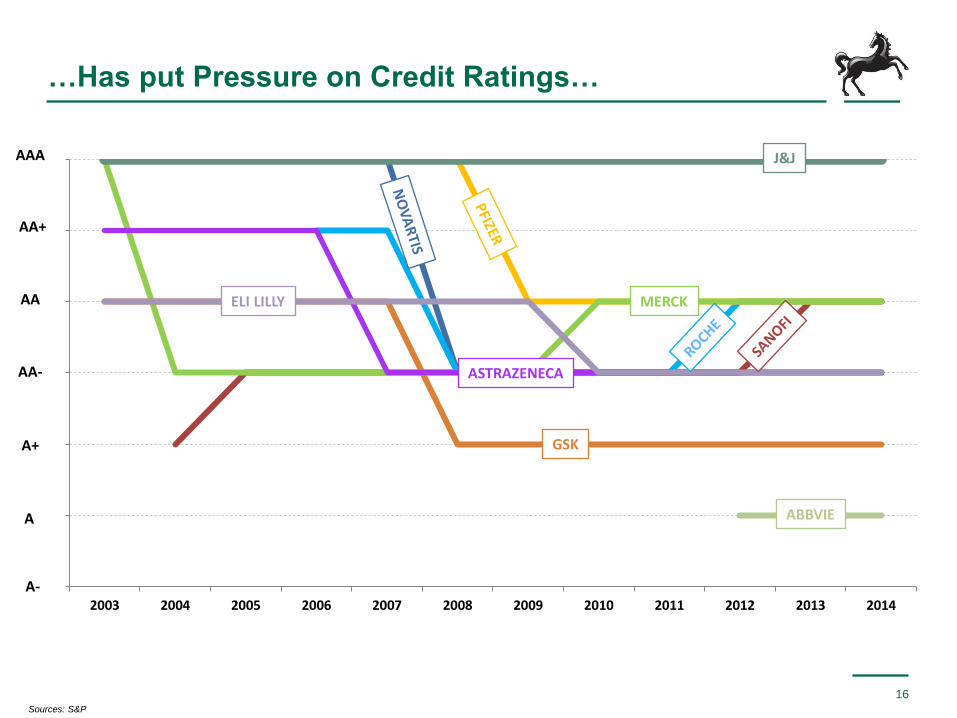
2003 2004 2005 2006 2007 2008 2009 2010 2011 2012 2013 2014
…Has put Pressure on Credit Ratings…
16
J&J
MERCK
ASTRAZENECA
GSK
ABBVIE
ELI LILLY
AAA
AA+
AA
AA-
A+
A
A-
Sources: S&P
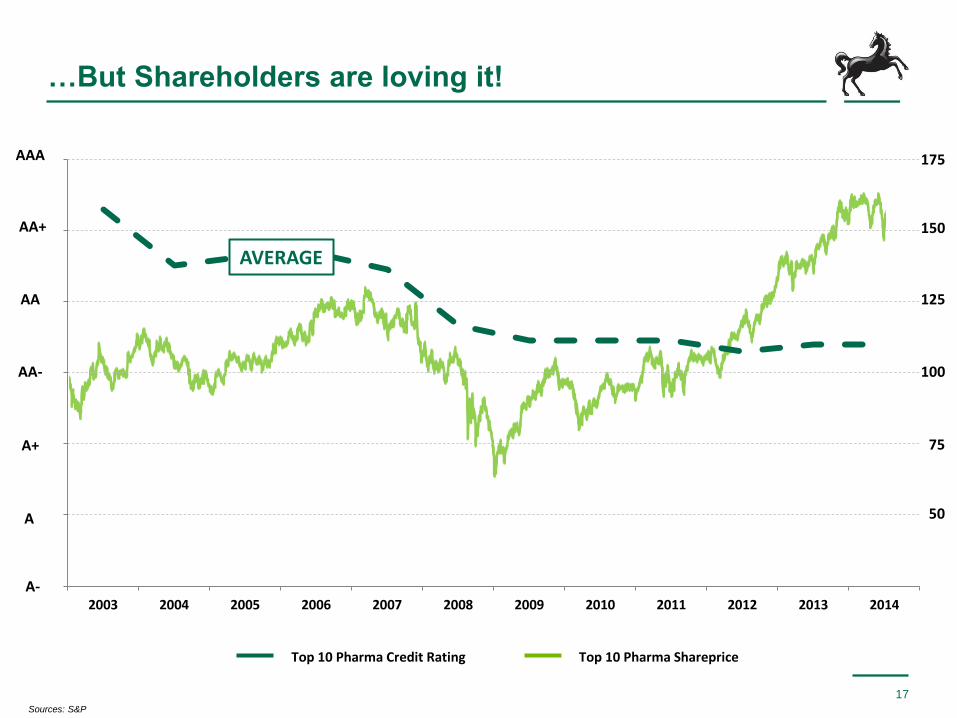
2003 2004 2005 2006 2007 2008 2009 2010 2011 2012 2013 2014
…But Shareholders are loving it!
17
AVERAGE
AAA
AA+
AA
AA-
A+
A
A-
Sources: S&P
Top 10 Pharma Shareprice Top 10 Pharma Credit Rating
100
150
125
175
75
50
Thesis #3
18
Observation
Impact
Shareholders expect growth AND return of cash.
How long is this sustainable for?
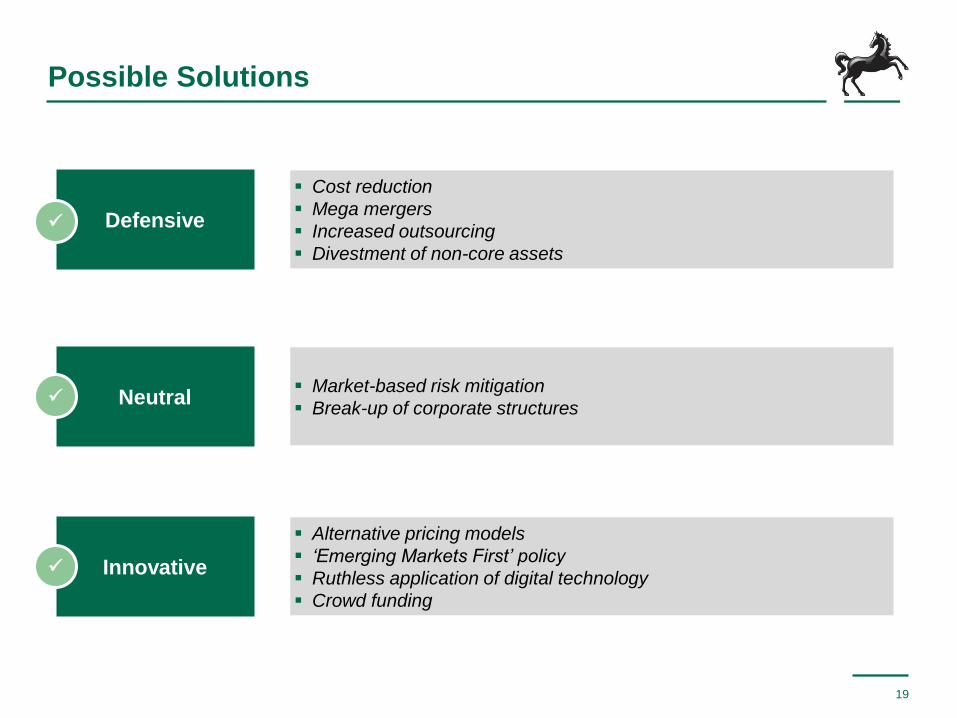
Possible Solutions
19
Defensive
Neutral
Innovative
Cost reduction
Mega mergers
Increased outsourcing
Divestment of non-core assets
Market-based risk mitigation
Break-up of corporate structures
Alternative pricing models
‘Emerging Markets First’ policy
Ruthless application of digital technology
Crowd funding
20