Embed Size (px)
Citation preview
Finding non-crystallographic symmetry in density mapsof macromolecular structures
Thomas C. Terwilliger
Received: 10 April 2013 / Accepted: 15 July 2013
� The Author(s) 2013. This article is published with open access at Springerlink.com
Abstract The internal symmetry of a macromolecule is
both an important aspect of its function and a useful feature
in obtaining a structure by X-ray crystallography and other
techniques. A method is presented for finding internal
symmetry and other non-crystallographic symmetry in a
structure based on patterns of density in a density map for
that structure. Regions in map that are similar are identified
by cutting out a sphere of density from a region that has
high local variation and using an FFT-based correlation
search to find other regions that match. The relationships
among correlated regions are then refined to maximize
their correlations and are found to accurately represent
non-crystallographic symmetry in the map.
Keywords Symmetry � Macromolecule � Crystal
structure � Density map � Automation �Macromolecular crystallography � Phenix
Introduction
Non-crystallographic symmetry (NCS) is common in
macromolecular crystals, occurring in about 1/3 or more of
structures in the Protein Data Bank [2, 3, 24]. Though non-
crystallographic symmetry increases the complexity of
structure determination, in most cases it yields a distinct
advantage in this process because it brings with it infor-
mation on relationships between density in different parts
of the crystal and between coordinates in different parts of
the structure [4, 12–14]. These relationships greatly
improve density modification and refinement, two key
steps in structure determination.
There are several commonly used approaches for finding
NCS. One is simple examination of a model that has more
than one copy of a chain. This approach of course requires
a model. It can be used after molecular replacement has
been carried out or after a model has been built.
Another approach is to find symmetry relationships
among subsets of atoms in a heavy-atom or anomalously
scattering atom substructure [11, 17]. These symmetry
relationships often reflect non-crystallographic symmetry,
and the presence of the NCS can be checked by comparison
of the density in the resulting electron density map at NCS-
related positions and orientations. This approach can be used
near the beginning of a SAD, MAD, or other structure
determination where a substructure is obtained prior to full
structure determination. Of course this approach also
requires that the NCS is present in the substructure. This
approach may be difficult to apply if there are only one or two
atoms per NCS copy in the substructure and the NCS does not
have point-group symmetry. This is because the relative
orientations of the NCS-related parts of the substructure are
not known in this case.
A third approach that can be applied in cases where
proper NCS (e.g., a two-fold axis) is present is to search for
locations in a map where nearby points related by proper
symmetry have similar density [22].
A fourth and very general approach to finding non-crys-
tallographic symmetry is to find patterns of density that are
present in more than one part of an electron density map. Pai
et al. [10] used a step-wise procedure of first finding possible
Ca locations with pattern-matching techniques, classifying
the locations with rotation-invariant classifiers, and then
finding pairs of these locations that have similar patterns of
density surrounding them. This method can be fast and
T. C. Terwilliger (&)
Los Alamos National Laboratory, Bioscience Division,
Los Alamos, NM 87545, USA
e-mail: [email protected]
123
J Struct Funct Genomics
DOI 10.1007/s10969-013-9157-7
effective, but has the potential limitations that the map has to
be of high enough quality to locate Ca positions and that for
maximal speed the patterns of density need to be initially
represented in a rotation-invariant fashion.
Here we present an approach to finding non-crystallo-
graphic symmetry by directly searching for patterns of density
that are present in more than one place in a map. This approach
uses superposition of a cut-out region of the map with the
remainder of the map, and therefore can make use of all the
local features in a map, not just rotation-invariant ones. In this
approach, an FFT-based convolution search [5, 16] is used to
find orientations and translations that relate parts of a map to
other parts of a map. We find that this is a rapid and accurate
way to identify NCS, even in a case where the map is poor and
the correlation of NCS-related density is low.
Methods
Locating a region that is part of the macromolecule
The approach used here to identify non-crystallographic
symmetry from an electron density map has three basic parts.
First, a location in the map is found that is likely to be inside
the molecule. This is important as it is the local symmetry of
the molecule or molecules in the crystal that are of interest, so
considering a region inside the molecule is essential for
success. The method used to identify such a location in the
map is similar to a method commonly used to distinguish
macromolecule from solvent in a map [23]. For each grid
point in the electron density map, the local rms variation in
electron density is calculated. This is done by simply cal-
culating the standard deviation of the density in the map
inside a sphere with radius R (typically 10 A), centered at the
grid point in question. Then the grid point in the map with the
highest local standard deviation of density is considered the
best candidate for a position inside the macromolecule.
Additional points likely to be inside the macromolecule can
optionally be found by choosing additional grid points with
high local variation in density that are well separated (typi-
cally at least 15 A) from previously chosen locations.
Searching for non-crystallographic symmetry
Next, a search for NCS relating the density near the can-
didate point inside the macromolecule with density else-
where in the asymmetric unit of the crystal is carried out.
To make the calculation rapid, the resolution of the map
used for this calculation may be chosen to be lower than the
resolution of the original map (typically a resolution of 4 A
is used). A sphere of density (typically with a radius of
10 A) is cut out of the map, centered at this position within
the molecule. This sphere of density is the object that is to
be compared with density everywhere in the map. Possible
rotations of this sphere of density are sampled (typically
each rotation differing by about 20 degrees from all oth-
ers). For each rotation, the density is transformed to the
new orientation, and an FFT-based convolution search [5,
16] is used to identify non-crystallographic translations that
yield a high correlation of density. These rotation/transla-
tion pairs that yield high correlation (typically all those at
or above 75 % of the highest value found) represent a
possible set of NCS operators relating the various copies of
the molecule in the asymmetric unit of the unit cell.
Additionally, the candidate point used to identify NCS and
the NCS-related points in the map may be considered
approximate centers of regions where NCS applies. They
are used below as the starting point for identification of the
region where NCS operators apply.
Evaluating the correlation of NCS-related density
Once a set of candidate NCS operators is obtained, the
correlation of NCS-related density is examined in the ori-
ginal map, and the NCS operators are refined. This is done
using the same approach as has been applied to NCS
operators obtained from heavy-atom positions [18]. First
the shape and position of the local region that is repeated
by NCS (the asymmetric unit of NCS) is found. Then the
NCS operators are refined to maximize the correlation of
density among these NCS-related regions. The region
where NCS applies is assumed to contain the point iden-
tified in the first step of our procedure that is within the
macromolecule. A region with arbitrary shape surrounding
this point is then chosen by sequential addition of new
boundary points such that the local correlation of NCS-
related density at each point in the region is above a
threshold (typically 1/4 of the maximum correlation in the
region). The local correlation of density [21] is calculated
using map grid points within a sphere (normally with the
radius used for identification of the solvent boundary,
Terwilliger 2000b), centered at the point in question.
If the final correlation of NCS-related density (averaged
over all pairs of NCS-related points) is above a threshold
(typically 0.4) then the NCS operators are considered to
represent actual NCS in the crystal and are used in later
stages of structure determination. In cases where the starting
map is very poor, this threshold may be decreased, increasing
the sensitivity of the procedure but also increasing the
probability of finding NCS where none is present.
Results and discussion
We applied our procedure to finding non-crystallographic
symmetry to a structure where an electron density map of
T. C. Terwilliger
123
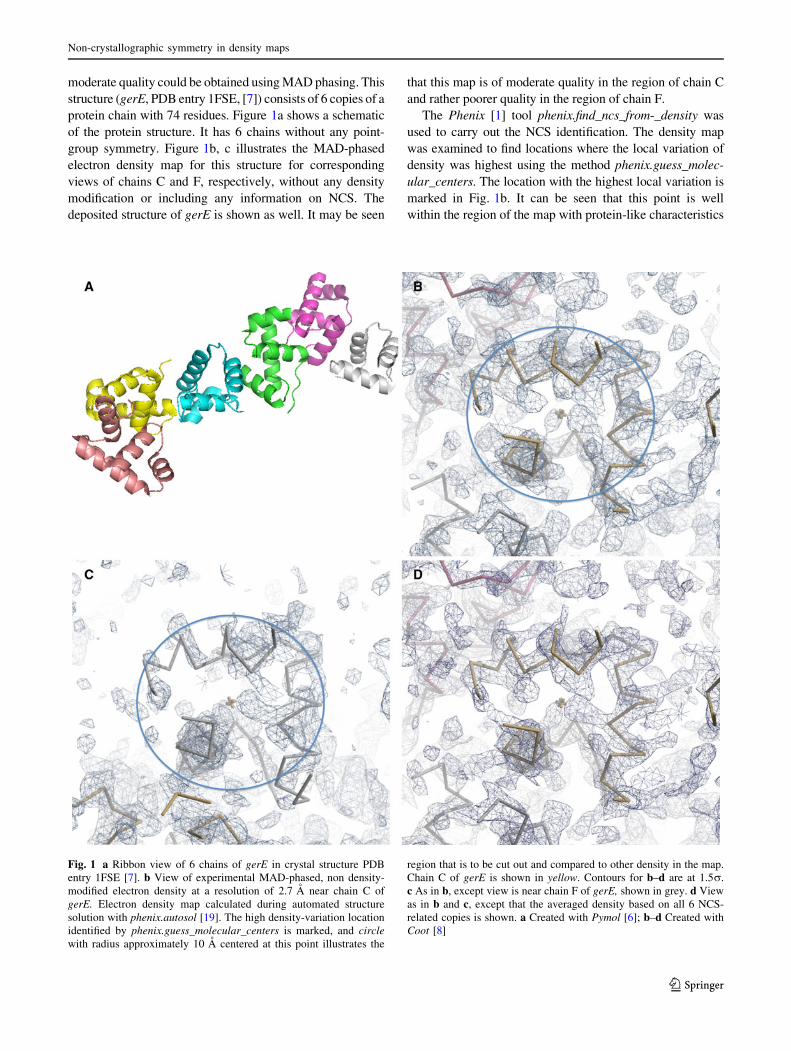
moderate quality could be obtained using MAD phasing. This
structure (gerE, PDB entry 1FSE, [7]) consists of 6 copies of a
protein chain with 74 residues. Figure 1a shows a schematic
of the protein structure. It has 6 chains without any point-
group symmetry. Figure 1b, c illustrates the MAD-phased
electron density map for this structure for corresponding
views of chains C and F, respectively, without any density
modification or including any information on NCS. The
deposited structure of gerE is shown as well. It may be seen
that this map is of moderate quality in the region of chain C
and rather poorer quality in the region of chain F.
The Phenix [1] tool phenix.find_ncs_from-_density was
used to carry out the NCS identification. The density map
was examined to find locations where the local variation of
density was highest using the method phenix.guess_molec-
ular_centers. The location with the highest local variation is
marked in Fig. 1b. It can be seen that this point is well
within the region of the map with protein-like characteristics
Fig. 1 a Ribbon view of 6 chains of gerE in crystal structure PDB
entry 1FSE [7]. b View of experimental MAD-phased, non density-
modified electron density at a resolution of 2.7 A near chain C of
gerE. Electron density map calculated during automated structure
solution with phenix.autosol [19]. The high density-variation location
identified by phenix.guess_molecular_centers is marked, and circle
with radius approximately 10 A centered at this point illustrates the
region that is to be cut out and compared to other density in the map.
Chain C of gerE is shown in yellow. Contours for b–d are at 1.5r.
c As in b, except view is near chain F of gerE, shown in grey. d View
as in b and c, except that the averaged density based on all 6 NCS-
related copies is shown. a Created with Pymol [6]; b–d Created with
Coot [8]
Non-crystallographic symmetry in density maps
123
(relatively connected and high density). This point is near
the center of chain C of gerE.
Next, after truncating the resolution of the map to 4 A,
test density corresponding to a sphere of radius 10 A of
density centered at the point marked in Fig. 1b was cut out
(the region inside the circle in Fig. 1b, except for the
change in resolution of the map). The density within all
10 A spherical regions in the 4 A map was then compared
to this test density using an FFT-based method, sampling
all possible rotations of the test density on a grid. This
density correlation procedure correctly identified all 5
regions that had high similarity to the test density. Fig-
ure 1c shows one of these related regions of density, the
one corresponding to chain F of gerE, in the same view as
Fig. 1b. It may be seen that within the 10 A sphere the
density in Fig. 1b, c are similar, though the density near
chain F (Fig. 1c) is considerably less clear. Outside this
region the shape of the density becomes less similar, as
expected because the protein chains surrounding the chain
located outside the sphere in Fig. 1b have a different
arrangement than those outside the sphere in Fig. 1c.
The rotation and translation operators used to superim-
pose the density in Fig. 1b with that in Fig. 1c and the
other 4 locations within the asymmetric unit of the density
in this crystal were then refined to identify the region over
which correlation of density existed and to optimize the
correlation of density among all copies of this repeated
density. This process yields as well the transformation
matrices describing the relationships among all the NCS-
related copies in the asymmetric unit of the crystal. The
final average pair-wise correlation of density among the 6
copies was 0.53. This varied considerably among the 6
copies. For chain C (Fig. 1b) the average correlation to
other NCS-related regions was 0.56, while for chain F
(Fig. 1c), it was only 0.42. Figure 1d shows the average
density for all the regions of density that were found to be
similar from the same viewpoint as shown in Fig. 1b. It can
be seen that this density has features even more like those
expected of a density map of a protein than the individual
regions of density (the tubes of density are better-
connected).
Conclusions
The approach described here for finding NCS in a map can be
used in a number of situations. In the Phenix crystallographic
software [1], the method phenix.find_ncs_from_density is
used during structure solution with phenix.autosol [19] if
NCS is expected but cannot be found from heavy-atom sites,
and it is used during iterative model-building with phe-
nix.autobuild [20] any time it is expected and has not been
identified by any other means. The NCS relationships
identified in this way can be used as a powerful addition to
the information available for density modification [4, 12–
14]. These relationships can also be used in model-building,
where an incompletely built chain can be built using a more
complete NCS-related copy of the same chain as a template
[9, 15, 20]. Further they could potentially be used to place
copies of entire chains in low-resolution maps.
The maps to be analyzed for NCS can be crystallographic
maps, maps from electron microscopy, or maps from other
sources. The approach described here could also be used to
find density that is similar in two different electron density
maps. This last application could be useful in automatically
finding relationships between molecules in different crystals
when carrying out cross-crystal averaging.
Acknowledgments The author would like to thank the NIH (Pro-
gram Project grant GM063210 to P. D. Adams) for generous support
and the Phenix development team for valuable discussions. The
phenix.find_ncs tool and instructions for its use are available as part of
Phenix (www.phenix-online.org).
Open Access This article is distributed under the terms of the
Creative Commons Attribution License which permits any use, dis-
tribution, and reproduction in any medium, provided the original
author(s) and the source are credited.
References
1. Adams PD, Afonine PV, Bunkoczi G, Chen VB, Davis IW, Ec-
hols N, Headd JJ, Hung LW, Kapral GJ, Grosse-Kunstleve RW,
McCoy AJ, Moriarty NW, Oeffner R, Read RJ, Richardson DC,
Richardson JS, Terwilliger TC, Zwart PH (2010) PHENIX: a
comprehensive Python-based system for macromolecular struc-
ture solution. Acta Cryst D66:213–221
2. Berman HM, Westbrook J, Feng Z, Gilliland G, Bhat TN,
Wiessig IN, Shindyalov IN, Bourne PE (2000) The Protein Data
Bank. Nucleic Acids Res 28:235–242
3. Bernstein FC, Koetzle TF, Williams GJB, Meyer EF Jr, Brice
MD, Rodgers JR, Kennard O, Shimanouchi T, Tasumi M (1977)
Protein data bank—computer-based archival file for macromo-
lecular structures. J Mol Biol 112:535–542
4. Bricogne G (1974) Geometric sources of redundancy in intensity
data and their use for phase determination. Acta Cryst
A30:395–405
5. Cowtan KD (1998) Modified phased translation functions and
their application to molecular-fragment location. Acta Cryst
D54:750–756
6. DeLano WL (2002) The PyMOL molecular graphics system.
http://www.pymol.org
7. Ducros VM, Lewis RJ, Verma CS, Dodson EJ, Leonard G,
Turkenburg JP, Murshudov GN, Wilkinson AJ, Brannigan JA
(2001) Crystal structure of GerE, the ultimate transcriptional
regulator of spore formation in Bacillus subtilis. J Mol Biol
306:759–771
8. Emsley P, Lohkamp B, Scott WG, Cowtan K (2010) Features and
development of Coot. Acat Cryst D66:486–501
9. Langer G, Cohen SX, Lamzin VS, Perrakis A (2008) Automated
macromolecular model building for X-ray crystallography using
ARP/wARP version 7. Nat Protoc 3:1171–1179
T. C. Terwilliger
123
10. Pai R, Sacchettini J, Ioerger T (2006) Identifying non-crystallo-
graphic symmetry in protein electron-density maps: a feature-
based approach. Acta Cryst D62:1012–1021
11. Lu G (1999) FINDNCS: a program to detect non-crystallographic
symmetries in protein crystals from heavy-atom sites. J Appl
Cryst 32:365–368
12. Read RJ, Kleywegt GJ (1997) Not your average density.
Structure 5:1557–1569
13. Rossmann MG, Blow DM (1963) Determination of phases by the
conditions of non-crystallographic symmetry. Acta Cryst
1963(16):39–45
14. Rossmann MG (1972) The molecular replacement method.
Gordon & Breach, New York
15. Sheldrick GM (2010) Experimental phasing with SHELXC/D/E:
combining chain tracing with density modification. Acta Cryst
D66:479–485
16. Terwilliger TC (2001) Maximum likelihood density modification
by pattern recognition of structural motifs. Acta Crystallogr
D57:1755–1762
17. Terwilliger TC (2002) Rapid automatic NCS identification using
heavy-atom substructures. Acta Cryst D58:2213–2215
18. Terwilliger TC (2002) Statistical density modification with non-
crystallographic symmetry. Acta Cryst D58:2082–2086
19. Terwilliger TC, Adams PD, Read RJ, McCoy AJ, Moriarty NW,
Grosse-Kunstleve RW, Afonine PV, Zwart P, Hung L-W (2009)
Decision-making in structure solution using bayesian estimates of
map quality: the PHENIX AutoSol wizard. Acta Cryst D65:582–601
20. Terwilliger TC, Grosse-Kunstleve RW, Afonine PV, Moriarty
NW, Zwart PH, Hung LW, Read RJ, Adams PD (2007) Iterative
model building, structure refinement and density modification
with the PHENIX AutoBuild wizard. Acta Cryst D 64:61–69
21. Vellieux FMDAP, Hunt JF, Roy S, Read RJ (1995) DEMON/
ANGEL: a suite of programs to carry out density modification.
J Appl Cryst 28:347–351
22. Vonrhein C, Shulz GE (1999) Locating proper non-crystallo-
graphic symmetry in low-resolution electron-density maps with
the program GETAX. Acta Cryst D55:225–229
23. Wang B-C (1985) Resolution of phase ambiguity in macromo-
lecular crystallography. Methods Enzymol 115:90–112
24. Wang X, Janin J (1993) Orientation of non-crystallographic
symmetry axes in protein crystals. Acta Cryst D49:505–512
Non-crystallographic symmetry in density maps
123


![Lattice Directions Individual directions: [uvw] Symmetry-related …nanowires.berkeley.edu/teaching/253a/2016/253A-2016-02.pdf · 2016-02-24 · Crystallographic Directions And Planes](https://img.pdfslide.net/doc/110x75/5f0570ab7e708231d412f95b/lattice-directions-individual-directions-uvw-symmetry-related-2016-02-24-crystallographic.jpg)