Embed Size (px)
Citation preview

FINGER MOVEMENT CLASSIFICATION USING FOREARM EMG
SIGNALS
by
ALEXANDER JAMES ANDREWS
A thesis submitted to the Department of Electrical and Computer Engineering
in conformity with the requirements for
the degree of Master of Science (Engineering)
Queen's University
Kingston, Ontario, Canada
October, 2008
Copyright © Alexander James Andrews, 2008
ii
Abstract
To a person with an upper limb amputation or congenital defect, a well-
functioning prosthesis can open the door to many work and life opportunities. A
fundamental component of many modern prostheses is the myoelectric control system,
which uses the myoelectric signals from an individual's muscles to control prosthetic
movements. Though much research has been done involving the myoelectric control of
arm and gross hand movements, more dexterous finger control has not received the
same attention. Consequently, the goal of this study was to determine an optimal
approach to the myoelectric signal classification of a set of typing motions. Two different
movement sets involving the fingers of the right hand were tested: one involving digits
two through five (4F - "four finger"), and the other involving digits one and two (FT -
"finger/thumb").
Myoelectric data were collected from the forearm muscles of twelve normally-
limbed subjects as they performed a set of typing tasks. These data were then used to
test a series of classification systems, each comprising a different combination of system
element choices. The best classification system over all subjects and the best
classification system for each subject were determined for both movement sets.
The optimal subject-specific classification systems yielded classification
accuracies of 92.8 ± 2.7% for the 4F movement set and 93.6 ± 6.1% for the FT
movement set, whereas the optimal overall classification systems yielded significantly
lower performance (p<0.05): 89.6 ± 3.4% for the 4F movement set and 89.8 ± 8.5% for
the FT movement set. No significant difference in classification accuracy was found
between movement sets (p=0.802). A two-way repeated measures ANOVA (α=0.05)
was used to determine both significance results.

iii
Acknowledgements
I would like to thank Dr. Evelyn Morin for her sincerity, thoughtful suggestions,
and encouragement; Dr. Linda McLean, for her thought-provoking comments, prompt
correspondence, and for the many opportunities to learn and develop my skills; and
Alicia Neufeld, for her consistent helpfulness, understanding, and support.
Also, thank you to Kris Calder, Ian Minz, Katie Mountjoy, and Sonya Chan for the
shared experiences and advice, my family for their support, Dr. Saeed Gazor for his
cheerful and inspiring assistance, Debie Fraser and Bernice Ison for their regular help
and guidance, and all subjects who participated in this study for their time, interest, and
patience.
iv
Table of contents
Abstract.................................................................................................................... ii
Acknowledgements.................................................................................................. iii
Table of contents..................................................................................................... iv
List of abbreviations................................................................................................. vi
List of tables............................................................................................................. vii
List of figures............................................................................................................ viii
Chapter 1: Introduction........................................................................................... 1
1.1 Introduction and motivation.................................................................... 1
Chapter 2: Literature review.................................................................................... 5
2.1 Background........................................................................................... 5
2.2 Movement set........................................................................................ 9
2.3 Movement detection.............................................................................. 10
2.4 Classification window characteristics.................................................... 11
2.5 Feature sets.......................................................................................... 12
2.5.1 Hudgins' time-domain features (TD)
2.5.2 Autocorrelation and cross-correlation coefficients (ACCC)
2.5.3 Spectral power magnitudes (SPMs)
2.5.4 Short-time Fourier transform (STFT)
2.5.5 Wavelet transform (WT)
2.5.6 Higher order statistics (HOS)
2.6 Dimensionality reduction (DR).............................................................. 21
2.7 Classification......................................................................................... 22
2.7.1 Multilayer perceptron (MLP)
2.7.2 Linear discriminant analysis (LDA)
Chapter 3: Methods................................................................................................ 25
3.1 Subjects................................................................................................ 25
3.2 Electrodes............................................................................................. 25
3.3 Signal acquisition.................................................................................. 27
3.4 Data collection....................................................................................... 27
3.5 Classification system training and testing............................................. 31
3.6 Classification system optimization........................................................ 31
3.7 Classification window characteristics.................................................... 35
v
3.8 Feature sets.......................................................................................... 37
3.9 Dimensionality reduction....................................................................... 41
3.10 Classification....................................................................................... 42
3.11 Statistical methods.............................................................................. 44
Chapter 4: Results.................................................................................................. 45
4.1 Introduction........................................................................................... 45
4.2 Myoelectric data.................................................................................... 45
4.3 Optimal performance............................................................................. 46
4.3.1 General optimization (GO)
4.3.2 Scenario optimization (SO)
4.3.3 Optimization and movement set results
4.4 Exercise results..................................................................................... 50
4.5 Element investigation............................................................................ 51
4.5.1 Classifier
4.5.1.1 Multilayer perceptron
4.5.2 Dimensionality reduction
4.5.3 Feature set
4.5.4 Window divisions
4.5.5 Window length
4.5.6 Window skew
4.6 Keystroke performance......................................................................... 61
Chapter 5: Discussion............................................................................................. 64
5.1 Discussion............................................................................................. 64
5.2 Limitations............................................................................................. 72
5.3 Recommendations................................................................................ 74
5.4 Contributions......................................................................................... 76
Chapter 6: Conclusion............................................................................................ 78
6.1 Summary and conclusions.................................................................... 78
References............................................................................................................... 80
Appendices.............................................................................................................. 83
Appendix A: Letter of information and consent........................................... 83
Appendix B: Classification accuracy results................................................ 86
Appendix C: Computational time results..................................................... 88
Appendix D: Terminology............................................................................ 90
vi
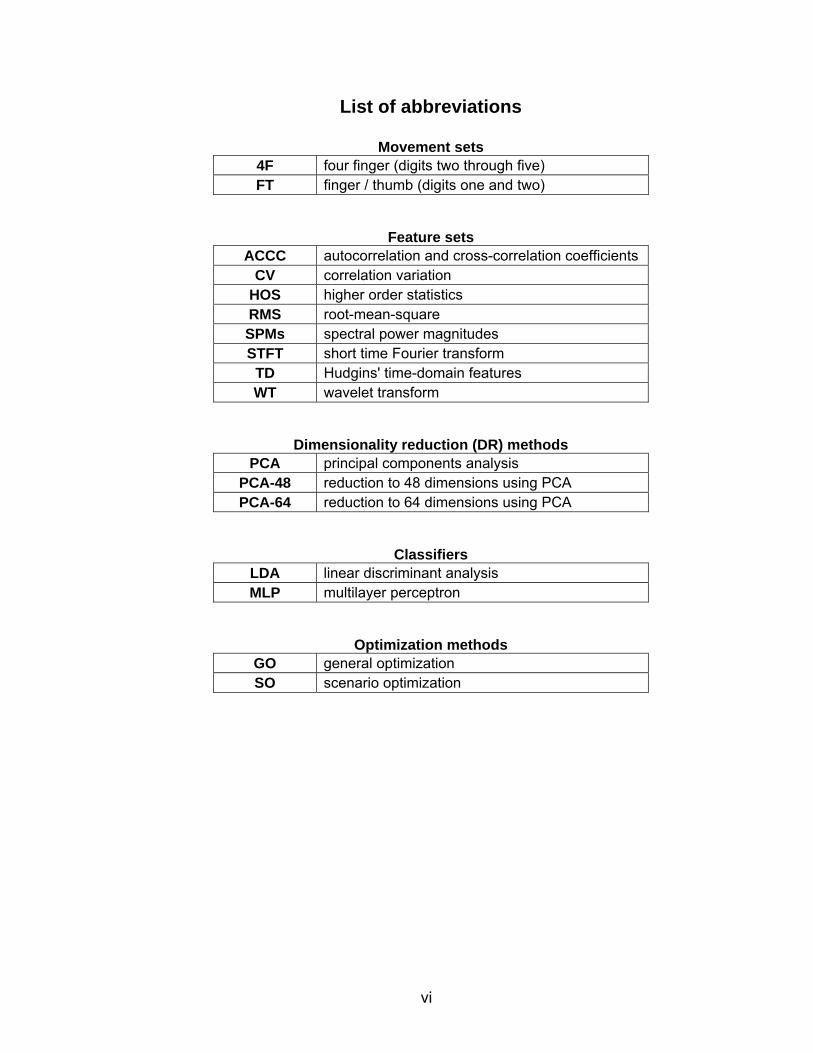
List of abbreviations
Movement sets 4F four finger (digits two through five) FT finger / thumb (digits one and two)
Feature sets ACCC autocorrelation and cross-correlation coefficients
CV correlation variation HOS higher order statistics RMS root-mean-square SPMs spectral power magnitudes STFT short time Fourier transform
TD Hudgins' time-domain features WT wavelet transform
Dimensionality reduction (DR) methods PCA principal components analysis
PCA-48 reduction to 48 dimensions using PCA PCA-64 reduction to 64 dimensions using PCA
Classifiers LDA linear discriminant analysis MLP multilayer perceptron
Optimization methods GO general optimization SO scenario optimization
vii
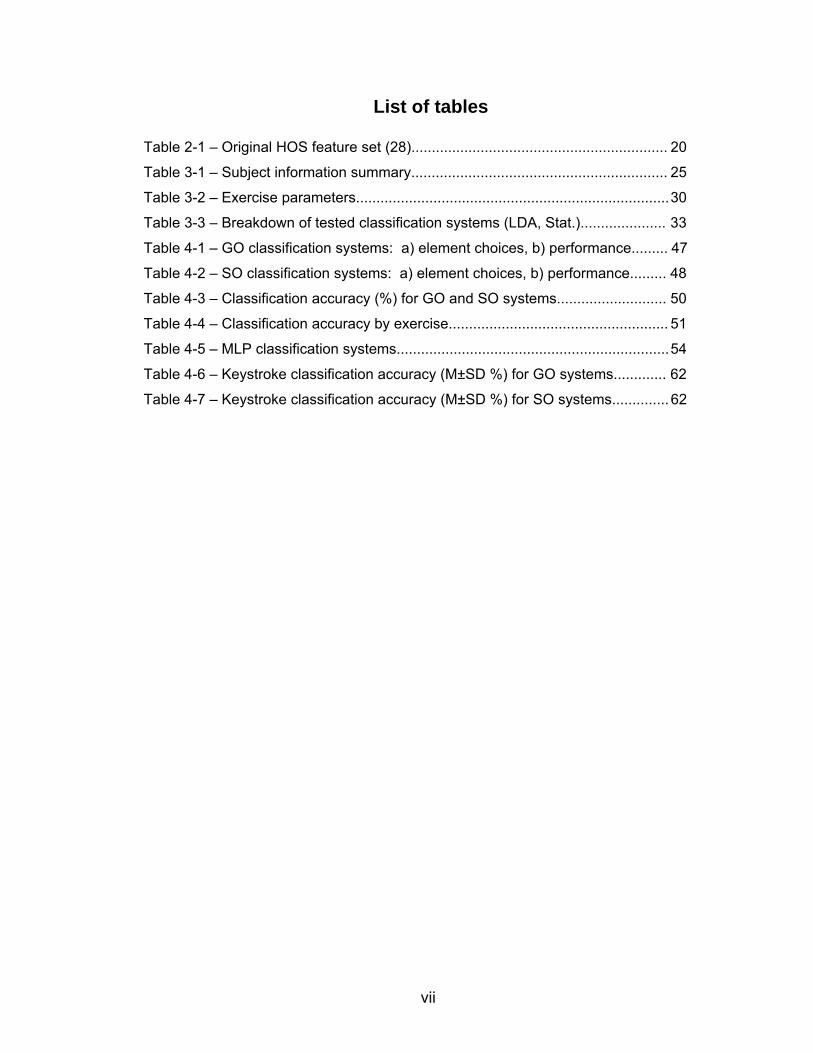
List of tables
Table 2-1 – Original HOS feature set (28)............................................................... 20
Table 3-1 – Subject information summary............................................................... 25
Table 3-2 – Exercise parameters............................................................................. 30
Table 3-3 – Breakdown of tested classification systems (LDA, Stat.)..................... 33
Table 4-1 – GO classification systems: a) element choices, b) performance......... 47
Table 4-2 – SO classification systems: a) element choices, b) performance......... 48
Table 4-3 – Classification accuracy (%) for GO and SO systems........................... 50
Table 4-4 – Classification accuracy by exercise...................................................... 51
Table 4-5 – MLP classification systems................................................................... 54
Table 4-6 – Keystroke classification accuracy (M±SD %) for GO systems............. 62
Table 4-7 – Keystroke classification accuracy (M±SD %) for SO systems.............. 62
viii
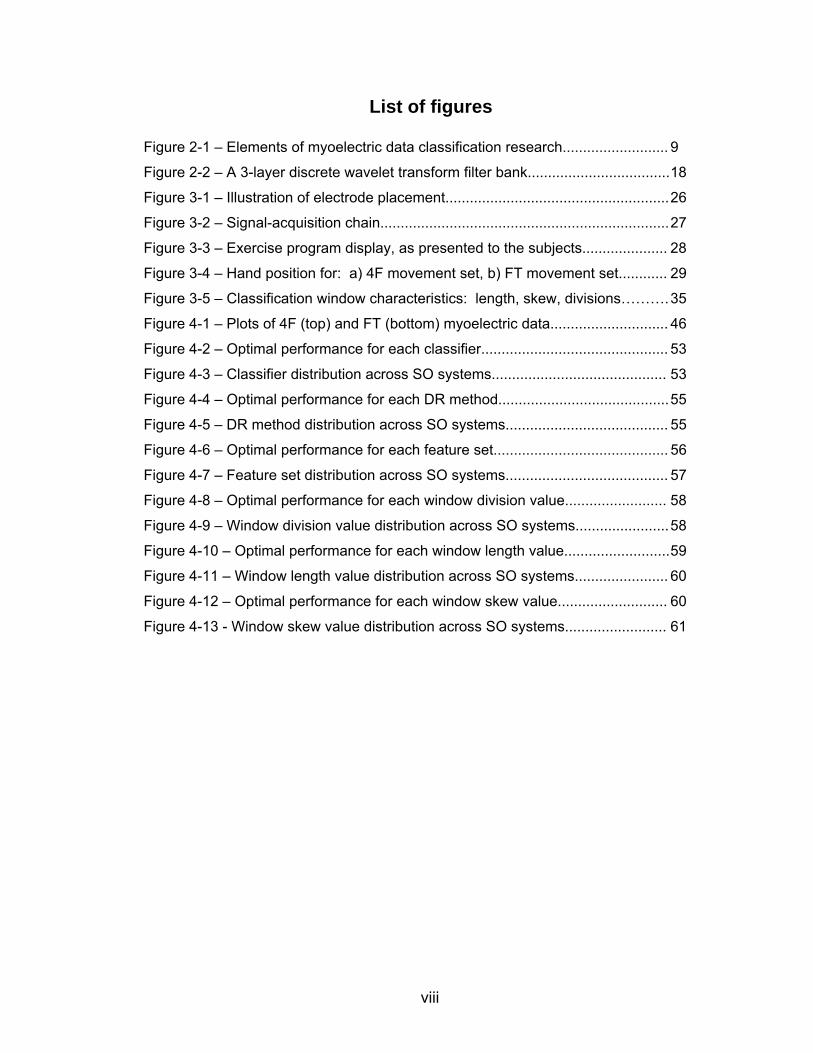
List of figures
Figure 2-1 – Elements of myoelectric data classification research.......................... 9
Figure 2-2 – A 3-layer discrete wavelet transform filter bank................................... 18
Figure 3-1 – Illustration of electrode placement....................................................... 26
Figure 3-2 – Signal-acquisition chain....................................................................... 27
Figure 3-3 – Exercise program display, as presented to the subjects..................... 28
Figure 3-4 – Hand position for: a) 4F movement set, b) FT movement set............ 29
Figure 3-5 – Classification window characteristics: length, skew, divisions………. 35
Figure 4-1 – Plots of 4F (top) and FT (bottom) myoelectric data............................. 46
Figure 4-2 – Optimal performance for each classifier.............................................. 53
Figure 4-3 – Classifier distribution across SO systems........................................... 53
Figure 4-4 – Optimal performance for each DR method.......................................... 55
Figure 4-5 – DR method distribution across SO systems........................................ 55
Figure 4-6 – Optimal performance for each feature set........................................... 56
Figure 4-7 – Feature set distribution across SO systems........................................ 57
Figure 4-8 – Optimal performance for each window division value......................... 58
Figure 4-9 – Window division value distribution across SO systems....................... 58
Figure 4-10 – Optimal performance for each window length value.......................... 59
Figure 4-11 – Window length value distribution across SO systems....................... 60
Figure 4-12 – Optimal performance for each window skew value........................... 60
Figure 4-13 - Window skew value distribution across SO systems......................... 61

1
Chapter 1
Introduction
1.1 Introduction and motivation
Loss of hand and finger function presents a major obstacle to the rehabilitation of
a person with an upper limb amputation or congenital defect. This loss may give rise to
serious negative consequences on the individual's quality of life and specifically on his or
her ability to fully participate in many work environments, such as those that involve
typing. The development of an intuitive and accurate myoelectric control system for
multiple finger movement in an upper limb prosthesis would open the door to work and
life opportunities previously unavailable to the upper limb amputee. In addition to
application in prostheses, a myoelectric control system for multiple finger movements
has potential commercial applications, such as in advanced human-computer interfaces.
Though there has been much research done involving the myoelectric control of gross
arm movements at the elbow and wrist (1,4,6,7,9-12,18,19,21,25,26,28,34), relatively
few investigations using multiple finger movements have been found in the literature
(17,31,32). Therefore, the purpose of this work was to develop an optimal approach to
finger movement classification for a set of typing tasks, which in future could be
incorporated in an intuitive myoelectric control system.
Of fundamental importance to myoelectric control is the myoelectric signal, or
electromyogram (EMG), which is a measure of neuromuscular activity detected directly
from within the muscle or from the skin surface. A myoelectric control system maps a
set of features drawn from the myoelectric signal to a particular function, such as flexion
of a prosthetic wrist. This type of control system has been frequently used in the field of
powered prostheses, as it provides a user with the potential for naturally-evoked
2
movement control. A well-performing myoelectric control system maps muscle activity to
a specific prosthesis function with high accuracy and an acceptable response time.
A successful myoelectric control system is one in which three key issues are
sufficiently addressed: accuracy, intuitive control, and acceptable response time; the
probability of rejection of a prosthesis by the user is strongly influenced by these factors.
The control system must obviously aim to function such that the prosthesis performs the
task desired by the user with nearly 100% accuracy. A measure of intuitive control has
not yet been successfully quantified, though more natural control has been achieved
with user-specific training of control systems (1-7,9-13,17-21,23,25,26,28,30-32,34).
The response time of a myoelectric control system should not be perceptible by the user
and it is generally accepted that it must be 300 ms or less (12).
Initial research into myoelectric control was performed in the 1940s (29), but due
to limited technology at the time, it was not until several decades later that further
progress was made. During the late 1960s to mid-1970s (14,22,24) the first pattern
recognition systems were developed using myoelectric inputs, however once again
technology proved to be a significant limiting factor. The next major step forward
occurred when Hudgins et al. (19) introduced a multifunctional myoelectric control
system in 1993, which achieved good performance in classifying multiple movements
using multiple signal features and an artificial neural network classifier. Subsequent
myoelectric classification research followed this lead by using a similar system structure
for multifunctional classification. With the intent of maximizing classification accuracy for
a given set of movements, the research often involves testing a variety of methods for
the different control system elements (e.g. feature set, classifier).
Research into multifunctional, pattern recognition based myoelectric control
systems often involves a common set of key steps (1-7,9-13,17-21,23,25,26,28,30-
32,34). Though exceptions do occur, the general research structure is as follows. First,

3
a set of limb movements is defined to be the system's possible set of functions.
Subjects, often normally-limbed, are then asked to perform these movements as multiple
channels of myoelectric data are collected from muscle sites assumed to be relevant to
the movement. When a movement is detected, a corresponding window of data
referenced to the initiation of movement is selected from each channel. A set of features
is drawn from the windowed data, sometimes reduced in dimensionality (2-4,7,9-
11,20,26,28), and then sent to a classifier for decision-making.
The structure outlined above necessitates selection of the following six elements,
which form the basis of myoelectric control research:
limb movement set (e.g. flexion/extension at elbow)
movement detection
classification window characteristics (e.g. length, number of divisions)
feature set
dimensionality reduction (DR) procedure
classifier
where the latter five elements largely define the pattern recognition component of a
myoelectric control system and the first element represents the system's function set.
The work presented here involves the investigation of an optimal approach to
multiple finger movement classification for application in typing tasks, based on the six-
element structure described above. Surface myoelectric data and corresponding
keystroke data were collected from twelve healthy-limbed subjects and these data were
used to test a set of myoelectric classification approaches. Different optimization
methods, classifiers, DR methods, feature sets, classification window characteristics,
and movement sets were tested in order to seek out the most effective approach to
classification. One optimization method involved determining a single optimal

4
classification system for each movement set, and the other involved also tailoring the
system to each subject. Additionally, the classification accuracy characteristics of each
system element, typing exercise, and keystroke were investigated.

5
Chapter 2
Literature review
2.1 Background
The myoelectric signal
A skeletal muscle is comprised of individual cells, or fibres, that are grouped into
functional units called motor units. The muscle fibres of a motor unit are innervated by a
single motor nerve and contract together upon receiving an electrical stimulus, called an
action potential, which is sent from the motor cortex of the brain to the muscle fibres via
the motor nerve. Upon excitation by the motor nerve, the motor unit fibres themselves
generate action potentials, which are transient electrical signals that are conducted
along the muscle fibre membranes. The summation of the action potentials in the single
fibres of the motor unit is called the motor unit action potential. A single action potential
sent to a motor unit will elicit a single motor unit action potential and cause a transient
contraction, or twitch, of the associated muscle fibres. A sustained contraction requires
a continuous stream of action potentials. As higher levels of muscular force are
required, the average action potential firing rate increases and more motor units are
recruited throughout the contracting muscle. The myoelectric signal, or electromyogram
(EMG), represents the temporal and spatial summation of motor unit action potentials
within the pickup region of the recording electrode.
Signal detection
The myoelectric signal is commonly detected in one of two ways: at the skin
surface using a non-invasive surface electrode, or more invasively from within the
muscle belly using a needle, fine wire, or implanted electrode. Invasive detection yields
a signal heavily weighted towards motor units in close proximity to the electrode,

6
whereas surface detection provides a more general picture of activity in the underlying
motor units. Due to its non-invasive nature, information content, and equivalent
effectiveness as a classification system input (16), the surface myoelectric signal is
commonly used in myoelectric control system applications (1-7,9-13,17-21,25,26,28,
31,32,34).
History of myoelectric control
The first reported use of the myoelectric signal as input to a control system was
in the 1940s (29), though technological barriers discouraged further progress until the
late 1960s to mid-1970s (14,22,24) when pattern recognition systems were first
integrated with myoelectric inputs. Multifunctional myoelectric control was the next
major stage in prosthetic control research and achieved high performance in 1993 with
the work of Hudgins et al. (19).
Current state of research
Research into myoelectric control using pattern recognition has involved many
different methods for the feature extraction and classification of myoelectric data.
Feature sets have included spectral power magnitude values (13,17,25,32), Hudgins'
feature set (2,6,9-13,18,19) and other time-domain statistics (3-5,18,30,31,33,34),
autoregressive coefficients (1,3,4,18,21,33,34), autocorrelation and cross-correlation
values (10,23), features drawn from the short time Fourier transform (2,9-12,20,31) or
wavelet transform (1-3,7,9-12,20), and higher order cumulants (28). Classifiers have
included various artificial neural networks (4,6,7,9,11,13,17-21,25,26,30-32), linear
discriminant analysis (3,9-12,18), fuzzy systems (6,21,23), hidden Markov models (3-5)
and Gaussian mixture models (18). In addition to the feature sets and classifiers,
complementary methods such as DR of the feature set (2-4,7,9-11,20,26,28) and

7
majority vote post-processing for steady-state contractions (10,11) have been tested.
Classification accuracies above 90% have become commonplace in recent literature for
upper arm, wrist and gross hand movements (1,4,7,9-13,18,21,28).
Finger movement classification
Classification of finger movements using a myoelectric pattern recognition
system has not received the same level of attention given to less dexterous arm
movements, such as gross hand movements, grasping, and movement at the elbow, nor
have corresponding classification accuracy results reached the same level of
performance (17,31,32), as described below. To this author's knowledge, a thorough set
of classification systems has not been previously tested for finger movement
classification using a common set of data.
Uchida et al. (32) reported classification accuracy of 86% for a finger movement
set consisting of flexion of digits one through three, flexion of all fingers, and relaxation
of the hand for a single subject when using two channels of myoelectric data and training
and test data set sizes of 30 movements each. Surface electrode units were placed
over the subject's flexor digitorum superficialis muscle. For a similar movement set of
flexion of digits one through three and hand closure, Tsenov et al. (31) achieved
classification accuracy of 93% using two data channels and 98% using four data
channels. The training and test set sizes were 100 movements each (25 movements
per class) and again were collected from a single subject. For the two channel case,
electrode units were placed over the subject's palmaris longus and extensor digitorum
muscles; electrode positioning for the four channel case was not described.
Neither Uchida et al. (32) nor Tsenov et al. (31) stated whether or not the
movements involved in their studies were of short duration. Given the dependency of
optimal classification method on movement duration (11), the suitability of these systems

8
for transient typing movements is unknown. Also, the conclusions reached by these two
studies are limited by two characteristics of the training and testing data sets. Firstly, the
data sets for each subject were small compared to many used in the classification of
transient upper arm, wrist, and grip movements (1-4,7,10-12,18,20,23,28,30,34).
Secondly, the data were collected from only one subject for each of the experiments.
Both of these factors affect the generalization of the performance results, and therefore
further testing on larger and more diverse data sets is justified.
Speech recognition
As the duration of arm and hand movements reported in the literature is often
much longer than the duration of a typical typing movement (i.e. a keystroke), which is
approximately 141 ms (see Section 3.7), classification methods designed for the shorter
myoelectric bursts in speech recognition research (2,3,5,20) were also considered in this
work. This allowed for the consideration of a larger variety of methods that have been
used to classify transient tasks with good performance; accuracies as high as 92% for a
six word set (20) and above 93% for a ten word set (2,3) were reported. These methods
are discussed together with those used for arm and hand movements in the subsequent
sections.
Elements of myoelectric data classification research
As described in Section 1.1, myoelectric data classification research involves six
fundamental elements which together form the function set and classification system.
The function set consists of the potential system outputs, i.e. limb movements that can
be classified, and the classification system is largely defined by the movement detection
method, set of classification window characteristics, feature set extracted from the

9
myoelectric data, feature set DR method, and specific classifier used. The six different
elements are shown in Figure 2-1 and discussed in Sections 2.2 to 2.7 below.
Figure 2-1 – Elements of myoelectric data classification research
2.2 Movement set
The majority of myoelectric classification literature investigated for this thesis
involves data collected during hand or arm movements. In general, myoelectric data
from these movements have been gathered from healthy-limbed individuals (1,4,6,7,9-
13,17-19,21,25,26,28,31,32) with only a few exceptions where data were collected from
amputees (19,30,33,34).
The movements that comprise function sets in the literature often fall into one of
the following categories:
movement at the elbow (1,6,7,9,11,21,25,26): flexion/extension at the elbow,
forearm pronation/supination
movement at the wrist (4,7,10-12,18,19,25,26): flexion/extension at the wrist,
ulnar/radial deviation
gross hand movement (4,7,10,11,13,17,18,21,31,32): hand open/close, chuck
grasp and key grasp
individual finger movement (13,17,31,32): index finger flexion, middle finger
flexion, thumb flexion, thumb abduction, thumb extension
10
other: simulated upper-arm myoelectric data (23), finger joint angle analysis
(32), amputee residual muscle contraction (19,30,33,34), isometric biceps
contraction (28)
Speech-recognition using myoelectric data generally involves the classification of
a particular set of words, such as the ten words ‘zero’ to ‘nine’ (2,3,5) or the six words
‘stop’, ‘go’, ‘left’, ‘right’, ‘alpha’, and ‘omega’ (20).
Movements are often defined as steady-state (4,7,10-12,18,28,34) or transient
(1-3,5,6,9-11,19,20,28). A steady-state movement can be defined as one that is held in
a constant position for some duration of time, such as a sustained grasp. Conversely, a
transient movement involves a brief deviation from rest, such as a keystroke or the
speaking of a short word. However, it is not always clearly stated in the literature
whether the movements tested were steady-state or transient (13,17,21,23,25,26,30-33).
2.3 Movement detection
After the data have been collected, the first step in off-line classification is to
determine which points in the myoelectric signal correspond to physical movements, and
therefore what windows of data to use for movement classification. Though movement
detection methods are not always reported in the literature (17,23,25,26,31-33),
documented methods fall into three categories: automated detection (1-3,6,9,13,19,
30,31), continuous classification (4,7,10-12,18,28,32,34) and manual detection (20).
Automated detection requires a trigger to be activated in order for a window of
data to be used for movement classification. The trigger often takes the form of a
mathematical test on the myoelectric data. Examples of this from the literature involve
the energy difference between adjacent windows (13), amplitude characteristics of a
sliding window relative to baseline values (6,9,19,30,31), or Al-Assaf's dynamic
cumulative sum method (1).

11
A continuous classification process is one in which a series of adjacent or
overlapping windows is used to classify movements at regular intervals, and therefore no
trigger is required.
Manual detection depends on visual recognition of the myoelectric signal bursts
that correspond to the physical movements performed by the research subjects (20).
Consequently, this method is not usable for on-line classification and is therefore
restricted to research applications.
Movement detection is not always required, however, as movements are
sometimes collected one at a time - though often in the literature the distinction between
this scenario and manual detection is not made clear (5,10,11,21).
2.4 Classification window characteristics
After a movement is detected, a corresponding window of myoelectric data must
be selected. A feature set is then extracted from the windowed data, sometimes
reduced in dimensionality (2-4,7,9-11,20,26,28), and then used as input to a classifier.
The effects of window length, window skew relative to the point of movement detection,
and number of window divisions on classification accuracy have received attention in the
literature (2,3,10,19).
Given the likely rejection of a prosthesis by the user if there is perceivable delay
between movement intent and actuation, the combined window length and subsequent
computational time is generally limited to 300 ms (12). Consequently, window lengths
reported in the literature are most commonly between 200 and 256 ms (1,4,7,10-
12,18,19,28).
The classification window can be divided into multiple segments (6,13,19,21) in
order to capture time varying characteristics of the data. Features are then calculated
for each segment and combined into a single feature set. Segment numbers up to

12
twelve have been tested (21) with particular success reported using five segments (19).
However, due to the classification window segmentation inherent in certain feature sets,
such as the wavelet transform (WT), this window characteristic is not always relevant.
The classification window placement relative to the point of movement detection
is not always described in the literature (1,4-7,9-12,17,18,20,21,23,25,26,28,31-34),
though some authors have reported intentional skewing of the classification window
relative to the detection point (2,3,13,19,30). Though the choice is not always justified,
the skewing of the classification window has been chosen to compensate for the delay
associated with an automated movement detection method (30) or in order to include
low amplitude anticipatory information in the classification window (13).
For speech detection, a comparison of skew values showed optimal results when
using a 1024 ms window beginning 500 ms before the detection point (2,3). Due to the
corresponding classification delay in excess of 300 ms, these results are not directly
applicable to this thesis work; nonetheless, they show that shifting the classification
window with respect to the point of movement detection can assist in myoelectric
classification.
2.5 Feature sets
Out of the different classification system elements (see Figure 2-1), the feature
set has been the most thoroughly researched. It has been shown to have a greater
effect on classification accuracy than the type of classifier selected (9), and it can be
determined using a wider variety of methods than the other major system elements,
such as the classification window characteristics. The feature sets included in this thesis
work are listed below and discussed in the following sections.

13
Hudgins’ time-domain features (TD)
Spectral power magnitudes (SPMs)
Autocorrelation and cross-correlation coefficients (ACCC)
Short-time Fourier transform (STFT)
Wavelet transform (WT)
Higher order statistics (HOS)
2.5.1 Hudgins' time-domain features (TD)
A group of time-domain features referred to collectively as Hudgins' time-domain
feature set (TD) was introduced in 1993 (19) and subsequently has been used in several
published studies (2,6,9-13,18). The TD feature set originally comprised five different
features that were calculated for a given classification window and for each of five
equally-divided segments within this classification window, forming a total of 30 features
per channel. These features are described below under their original labels, using the
variable i to represent classification window index, xk to represent the myoelectric data
point at time k, and L to represent classification window length.
Mean absolute value (MAV). The estimate of mean absolute value is given by:
L
kki x
LX
1
1 (2-1)
Difference MAV, or Mean absolute value slope (MAVS). This quantity represents
the difference in mean absolute value between the subsequent segment and the
segment of interest, as shown below:
iii XXX 1 (2-2)
Zero crossings (ZC). This feature is a simple frequency measure representing
the number of times a waveform changes polarity. However, due to the

14
possibility for noise induced zero crossings, a threshold must be defined.
Therefore, a pair of consecutive samples constitutes a zero crossing only if their
absolute difference exceeds both a noise threshold and their absolute sum (i.e.
they have different polarity). Given two consecutive samples xk and xk+1, this
condition is described by:
),max( 11 Txxxx kkkk , (2-3)
where T represents the noise threshold. Hudgins assumed a system noise value
of 4 µV peak-to-peak and used this value, together with a system gain of 5000, to
calculate T as 10 mV (19) when measured at the input to the A/D converter.
The ZC feature is therefore calculated as the number of times that the
above condition is met in a given window.
Slope sign changes (SSC). The number of times that a waveform changes slope
polarity may provide additional frequency information about the signal. Using the
same noise threshold T as above and three consecutive samples xk-1, xk and xk+1,
the conditions for a slope sign change at sample k can be expressed as:
),min(),max( 1111 kkkkkk xxxorxxx
and (2-4)
Txxxx kkkk ),max( 11
The SSC feature is therefore calculated as the number of times that the above
conditions are met in a given window.
Waveform length (WL). The total length of the signal over the data window
represents a combined measure of amplitude, frequency, and duration. This
feature is calculated as the sum of absolute voltage differences between each
pair of adjacent samples within the classification window, or:

15
L
kkk xxWL
21 (2-5)
where xk and xk-1 are consecutive signal samples.
Some of the features above have been omitted from the TD feature set when it
has been used in other studies. Chan et al. (6) found that the inclusion of SSCs in the
feature set contributed either a negative effect or no significant effect on classification
performance. This feature is also not included in Farry et al.'s (13) implementation of the
TD feature set (13), though no reason is given. The MAVS is another feature that is not
always included in the set (11,12,18), presumably with reasoning similar to that of Chan
et al. (6), though no clear justification for this omission is stated.
Though outperformed by several other feature sets in the classification of
transient movements (2,9-11), the TD feature set has been shown to be very effective
for the classification of steady-state arm movements, achieving classification accuracies
of up to approximately 99.5% for a four movement, four channel problem (10). In
addition to its good performance, a significant advantage of the TD feature set remains
its simplicity. The implementation of these features into a classification structure was a
defining moment in the field of myoelectric data classification, as it allowed for multiple
movements to be classified with high accuracy (19). Its common use, good
performance, and simplicity justified the inclusion of the TD feature set in this thesis
work.
2.5.2 Autocorrelation and cross-correlation coefficients (ACCC)
The use of autocorrelation and cross-correlation coefficients (ACCC) as a feature
set for multifunctional myoelectric classification was proposed by Leowinata et al. in
1998 (23), who suggested that useful information may reside in the crosstalk between
electrodes in an array. Consequently, Leowinata et al. tested a feature set consisting of
16
autocorrelation coefficients for each channel of myoelectric data and all unique cross-
correlation coefficients between channels. High classification rates were achieved using
this feature set, however testing was done on simulated data and therefore the results
may not be meaningful to this thesis work. Englehart et al. (10) tested the ACCC feature
set on real myoelectric data and found classification accuracies as high as 97% for a
four class, four channel, transient arm movement problem; nonetheless, it was still
outperformed by the TD, STFT, WT, and wavelet packet transform (WPT) feature sets.
In this thesis work, myoelectric data were collected from eight sites around the
forearm, resulting in a high possibility of cross-talk between electrodes. Therefore, a
variation of the ACCC feature set was tested in order to investigate its potential
suitability to this application.
2.5.3 Spectral power magnitudes (SPMs)
The average spectral power magnitudes (SPMs) across disjoint bandwidths are a
simple measure of frequency content within a signal and have been tested as a feature
set in several studies (13,17,32). The power spectrum from which the SPMs are derived
is calculated using an FFT of the classification window data and therefore the set
includes no time-dependent information - unlike the more complex STFT and WT time-
frequency feature sets tested in this study.
Hiraiwa et al. (17) and Uchida et al. (32) both tested feature sets comprised of
average SPMs calculated across ten disjoint bandwidths between 63 and 500 Hz for the
classification of finger movements. Though the specific bandwidths used were not
documented in the former study, the latter specified central frequencies of 63, 80, 100,
125, 160, 200, 250, 315, 400, and 500 Hz (32). Maximum classification performance
was found to be 67% using a single channel of myoelectric data (17) and 86% when
using two channels of data (32). Farry et al. (13) used a Hamming window to calculate
17
average SPMs for four bandwidths between 75 and 250 Hz and achieved classification
accuracy of 93% for the classification of two grasp movements, though only 75% for the
classification of three thumb movements. Two channels of data were used in each case.
Given the simplicity of the SPM feature set, it was included in the thesis work in order to
compare against more complex frequency-based methods.
2.5.4 Short-time Fourier transform (STFT)
The short-time Fourier transform (STFT) feature set is different from the SPM
feature set in two ways. Firstly, whereas the SPM set involves a single calculation of the
frequency spectrum over the entire data window, the STFT calculates the spectrum for a
series of adjacent or overlapping segments within the classification window. Therefore,
the STFT feature set contains time-dependent information while the SPM feature set
does not. Secondly, the SPM feature set is comprised of average power magnitudes
each calculated over a particular bandwidth; the STFT feature set involves no such
averaging and retains all power magnitude values. Consequently, this feature set is very
large and therefore depends heavily on feature set DR.
The segment length used in the division of the classification window determines
the balance between time and frequency resolution. A shorter window will allow for
greater time resolution at the expense of frequency resolution, whereas a longer window
will provide greater frequency resolution at the expense of time resolution.
The STFT feature set has been implemented in several myoelectric signal
classification studies (2,9-12,20,31), including many cases of transient data classification
(2,9-11,20). Its performance has been good when used in combination with principal
components analysis (PCA) DR, achieving classification accuracies of 98% for a four
class (10) and 94% for a six class (10,11) arm movement prediction task using four
channels of data. However, for each case of transient data classification using the STFT
18
feature set, a wavelet-based feature set was reported to have achieved higher
performance (2,9-11,20). The STFT feature set has nonetheless been included in this
study because of its record of good performance and to examine the effects of feature
set complexity on classification accuracy.
2.5.5 Wavelet transform (WT)
Feature extraction using the wavelet transform (WT) has been reported often in
the literature (1-3,9-12,20). Though not optimal for steady state data (11), its
performance has been good for speech and transient arm movement data (1-3,9-11,20).
The WT builds upon the STFT by partitioning the time-frequency plane in a
variable manner. Whereas in the STFT frequency and time resolution are fixed, the WT
offers increased time resolution at high frequencies and increased frequency resolution
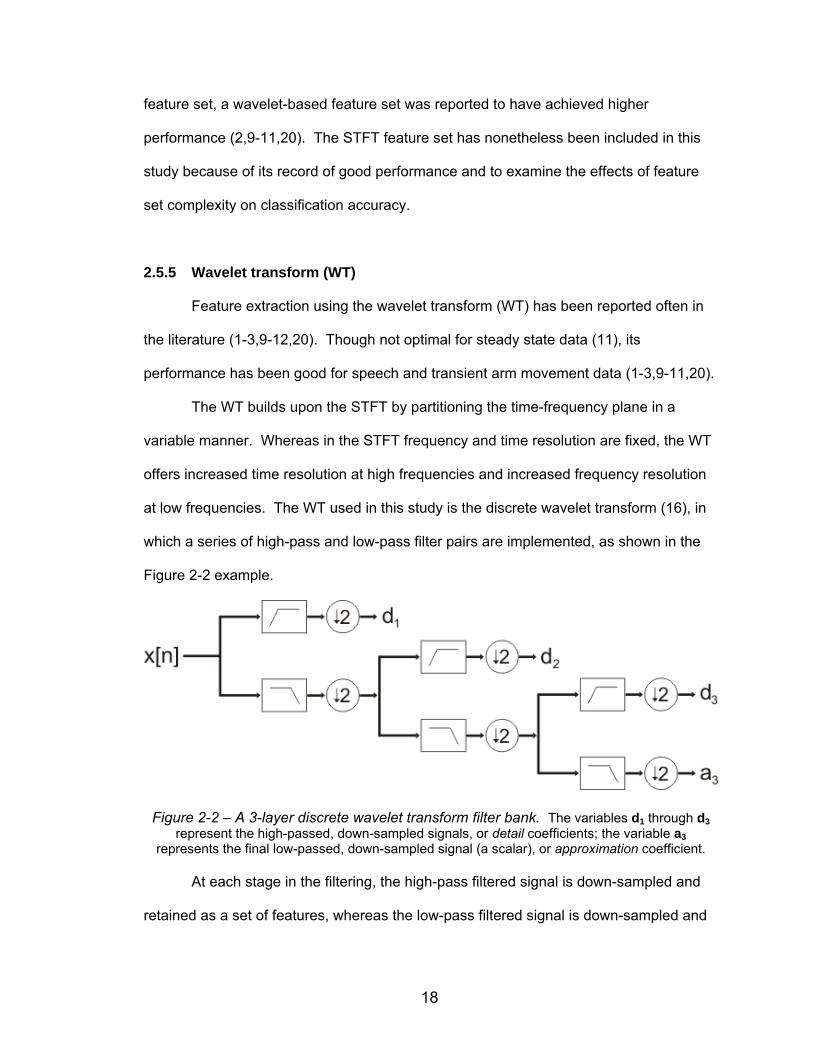
at low frequencies. The WT used in this study is the discrete wavelet transform (16), in
which a series of high-pass and low-pass filter pairs are implemented, as shown in the
Figure 2-2 example.
Figure 2-2 – A 3-layer discrete wavelet transform filter bank. The variables d1 through d3 represent the high-passed, down-sampled signals, or detail coefficients; the variable a3
represents the final low-passed, down-sampled signal (a scalar), or approximation coefficient.
At each stage in the filtering, the high-pass filtered signal is down-sampled and
retained as a set of features, whereas the low-pass filtered signal is down-sampled and
19
passed to the next filter bank. The process continues until the down-sampled, low-pass
filtered signal is a scalar, at which point it too is retained as a feature.
The dimensionality of the WT feature set is approximately equal to the number of
samples in the classification window; therefore, like the STFT, it is dependent on DR in
order to meet classification delay time limits.
In the literature, classification accuracy above 97% has been achieved with the
WT feature set for a four class, four channel, transient arm movement data set, using
PCA DR and the linear discriminant analysis (LDA) classifier (10). Despite its good
performance on transient arm and gross hand tasks, the WT feature set has nonetheless
been outperformed by the WPT (10,11) and stationary wavelet transform (11) feature
sets.
In comparison to the TD, STFT, and WPT feature sets for a speech recognition
task, the WT feature set performed best (2). Furthermore, Jorgenson et al. (20) reported
classification accuracy of 92% using the WT with matrix tessellation DR for sub auditory
speech recognition – a level of performance exceeding that of the STFT, Hartley
transform, and moving average feature sets.
The WT feature set is one of the top performing sets for transient movement
classification and was therefore included in this thesis study.
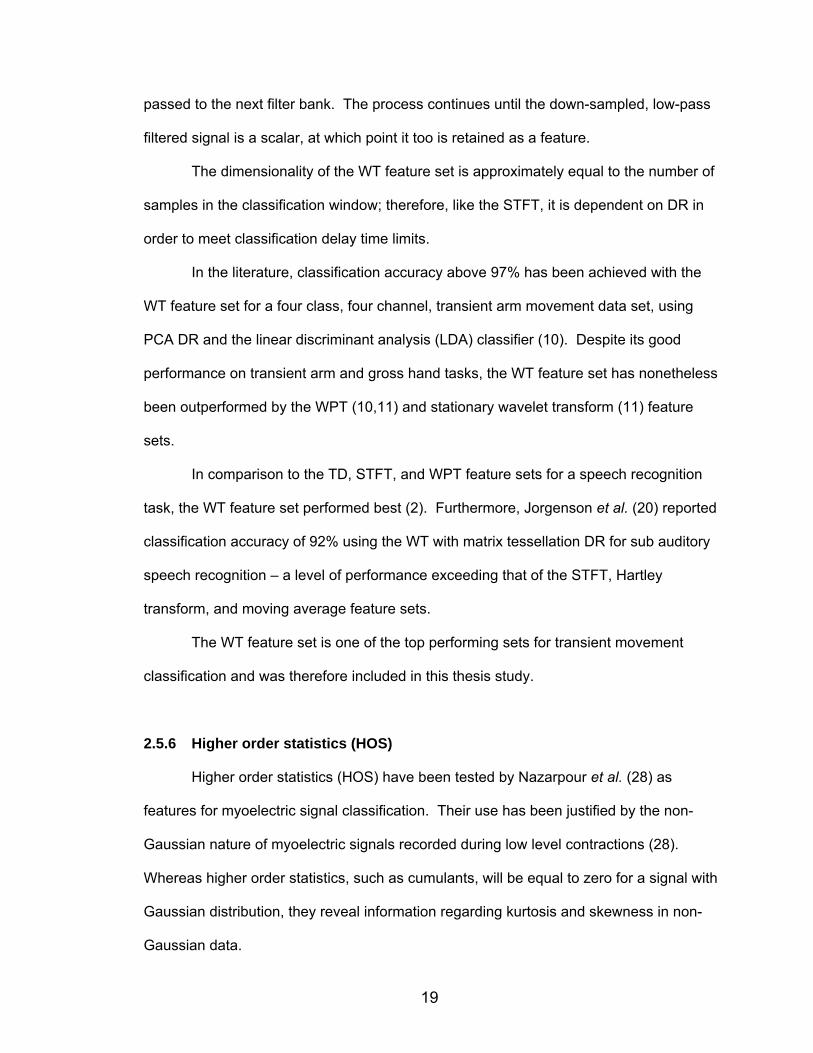
2.5.6 Higher order statistics (HOS)
Higher order statistics (HOS) have been tested by Nazarpour et al. (28) as
features for myoelectric signal classification. Their use has been justified by the non-
Gaussian nature of myoelectric signals recorded during low level contractions (28).
Whereas higher order statistics, such as cumulants, will be equal to zero for a signal with
Gaussian distribution, they reveal information regarding kurtosis and skewness in non-
Gaussian data.

20
Specifically, Nazarpour et al. (28) tested a feature set comprised of 19 features
per channel, containing second, third, and fourth order cumulants. The second order
cumulant is more familiarly known as variance, and the third and fourth order cumulants
represent measures of skewness and kurtosis, respectively. Input data were first
normalized (see Equation 2-6) and then unique cumulants were calculated with time lags
of 0, 1 and 2 samples, as shown in Equation 2-7.
Xtx
tx
)(
)(' (2-6)
where x'(t) is the normalized value of sample x(t), and X and σ are the mean and
standard deviation of the data, respectively.
)()(
)()(
)()(
)(')(')(')('),,(
)(')(')('),(
)(')(')(
21232
13222
32212
3213214
21213
112
CC
CC
CC
txtxtxtxEC
txtxtxEC
txtxEC
(2-7)
where Cn is the nth order cumulant and 1 , 2 , and 3 are time lags. The feature set
consisted of three second order cumulants, six third order cumulants, and ten fourth
order cumulants, as shown in Table 2-1.
Table 2-1 – Original HOS feature set (28)
Second order Third Order Fourth Order
C2(0), C2(1), C2(2) C3(0,0), C3(0,1), C3(0,2), C3(1,1), C3(1,2), C3(2,2)
C4(0,0,0), C4(0,0,1), C4(0,0,2), C4(0,1,1), C4(0,1,2), C4(0,2,2), C4(1,1,1), C4(1,1,2), C4(1,2,2),
C4(2,2,2)
Using sequential forward selection for DR, Nazarpour et al. (28) found that a well
performing feature set could be constructed from only 2 or 3 of the 19 features.
Specifically, the feature sets [C2(0), C4(0,0,0)] and [C2(0), C2(1), C4(0,0,0)] yielded the best
21
performance across subjects in comparison to other two- and three-feature sets,
respectively, for a two channel, four class, transient arm movement application. Using
the three-feature set and a K-nearest neighbour classifier, classification accuracy of
93.2% was achieved over a 16 subject database, in comparison to 94.1% using the
entire 19 element set. Using the same data set, Englehart et al. (9) achieved a
maximum classification accuracy of 93.8% using a WPT feature set, PCA DR, and an
LDA classifier. All other classification systems tested by Englehart et al. produced
accuracies lower than 93.2%. It should be noted, however, that these differences may
not be statistically significant.
Though this feature set has received less attention in the literature than many of
the other sets, its performance and low dimensionality warranted its inclusion in this
thesis work.
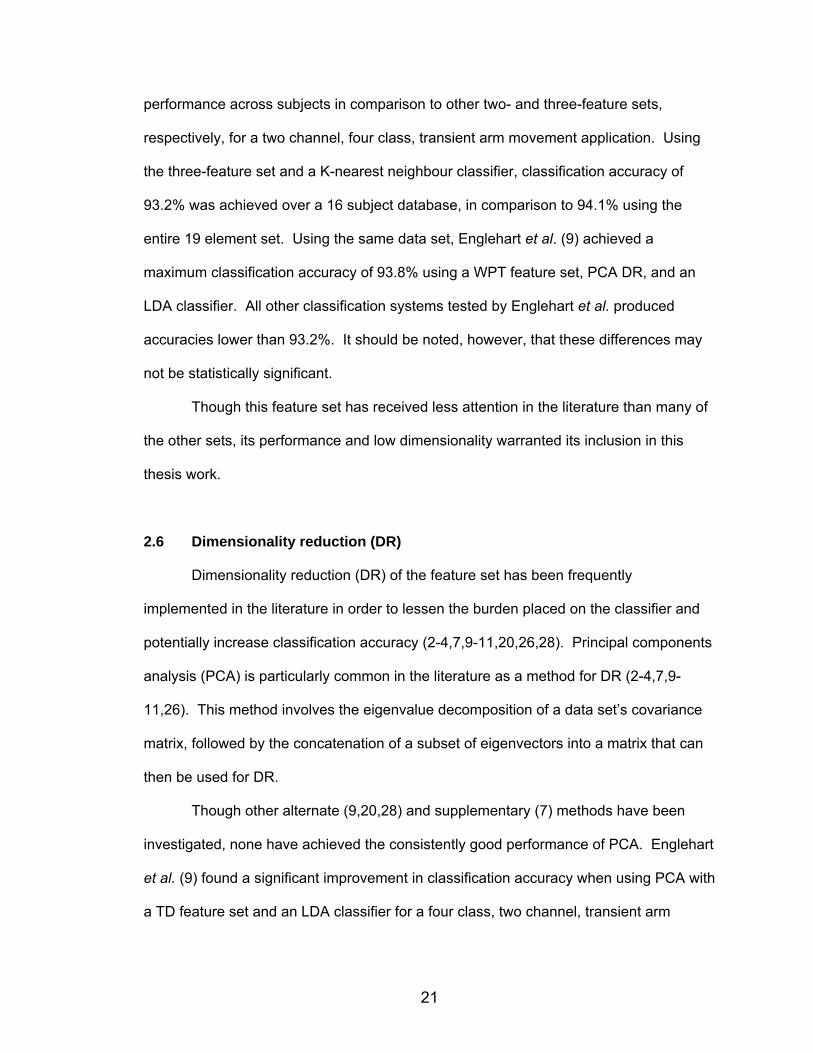
2.6 Dimensionality reduction (DR)
Dimensionality reduction (DR) of the feature set has been frequently
implemented in the literature in order to lessen the burden placed on the classifier and
potentially increase classification accuracy (2-4,7,9-11,20,26,28). Principal components
analysis (PCA) is particularly common in the literature as a method for DR (2-4,7,9-
11,26). This method involves the eigenvalue decomposition of a data set’s covariance
matrix, followed by the concatenation of a subset of eigenvectors into a matrix that can
then be used for DR.
Though other alternate (9,20,28) and supplementary (7) methods have been
investigated, none have achieved the consistently good performance of PCA. Englehart
et al. (9) found a significant improvement in classification accuracy when using PCA with
a TD feature set and an LDA classifier for a four class, two channel, transient arm
22
movement problem. Its record of good performance warranted the testing of PCA in the
thesis work for the purpose of feature set DR.
2.7 Classification
Common classifiers implemented in the literature included artificial neural
networks (4,6,7,9,11-13,17-21,25,26,30-32), LDA classifiers (2,3,10-12,18), fuzzy
systems (6,21,23), and Hidden Markov Models (4,5). The most common artificial neural
network successfully employed in the literature is the multilayer perceptron (MLP)
(4,7,9,11,18,21,31). The two classifiers drawn from the literature that were implemented
in this study were the MLP and the LDA classifiers, which are discussed in more detail
below.
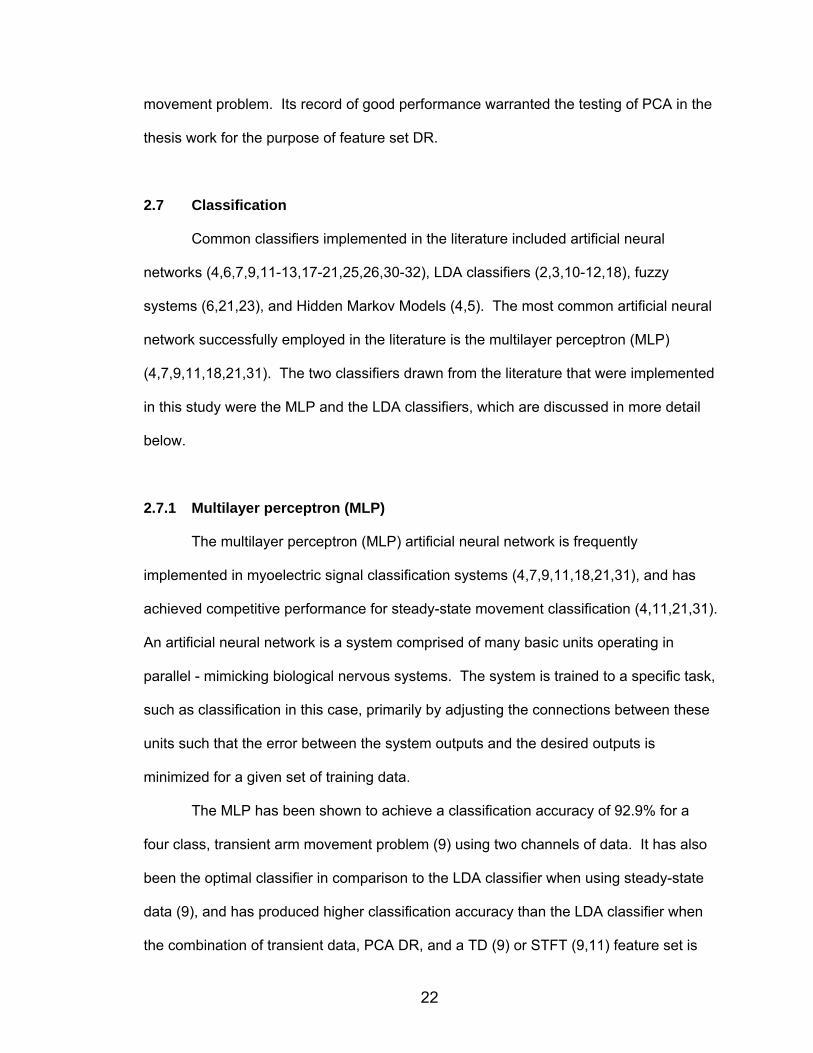
2.7.1 Multilayer perceptron (MLP)
The multilayer perceptron (MLP) artificial neural network is frequently
implemented in myoelectric signal classification systems (4,7,9,11,18,21,31), and has
achieved competitive performance for steady-state movement classification (4,11,21,31).
An artificial neural network is a system comprised of many basic units operating in
parallel - mimicking biological nervous systems. The system is trained to a specific task,
such as classification in this case, primarily by adjusting the connections between these
units such that the error between the system outputs and the desired outputs is
minimized for a given set of training data.
The MLP has been shown to achieve a classification accuracy of 92.9% for a
four class, transient arm movement problem (9) using two channels of data. It has also
been the optimal classifier in comparison to the LDA classifier when using steady-state
data (9), and has produced higher classification accuracy than the LDA classifier when
the combination of transient data, PCA DR, and a TD (9) or STFT (9,11) feature set is
23
used. However, in the latter case the LDA was able to achieve slightly better
performance using other, wavelet-based, feature sets than any instance of the MLP.
Though the classification accuracy of the MLP has often been matched or
outperformed (4,9,11,18,21) and the training is computationally complex (4), the MLP
classifier has still been commonly implemented with consistently good performance,
warranting its inclusion in this study. A clear, detailed description of MLP structure and
function is given by Karlik (21).
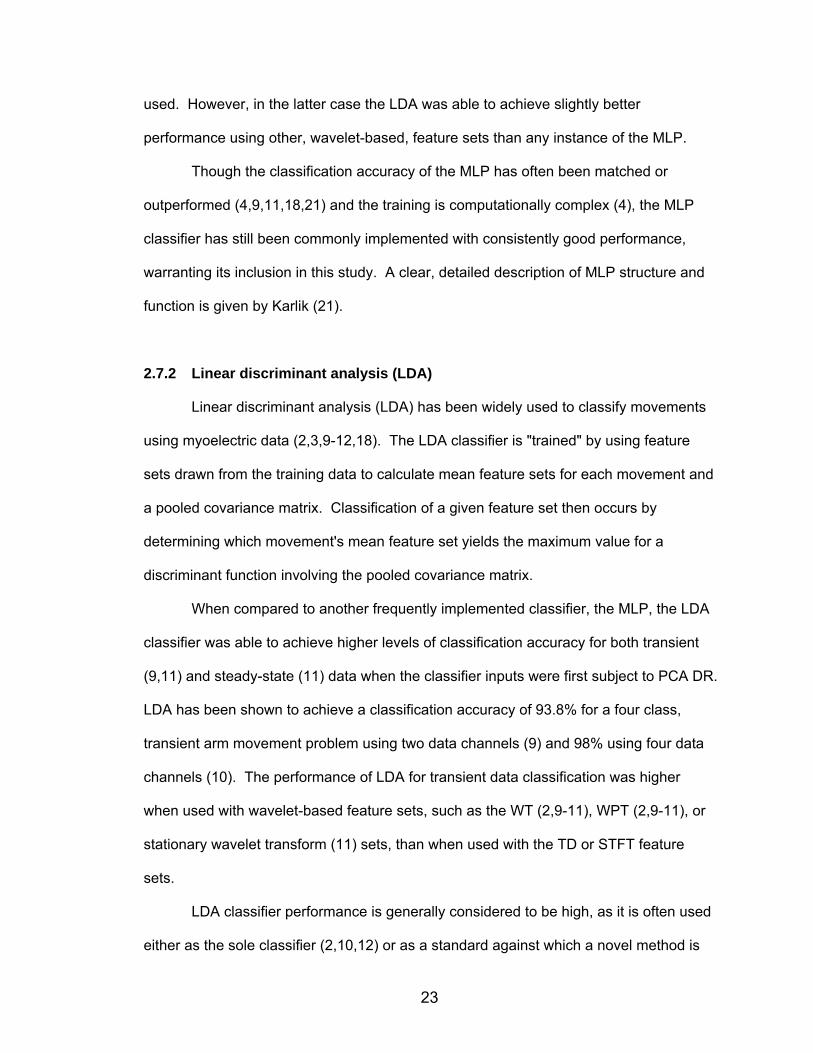
2.7.2 Linear discriminant analysis (LDA)
Linear discriminant analysis (LDA) has been widely used to classify movements
using myoelectric data (2,3,9-12,18). The LDA classifier is "trained" by using feature
sets drawn from the training data to calculate mean feature sets for each movement and
a pooled covariance matrix. Classification of a given feature set then occurs by
determining which movement's mean feature set yields the maximum value for a
discriminant function involving the pooled covariance matrix.
When compared to another frequently implemented classifier, the MLP, the LDA
classifier was able to achieve higher levels of classification accuracy for both transient
(9,11) and steady-state (11) data when the classifier inputs were first subject to PCA DR.
LDA has been shown to achieve a classification accuracy of 93.8% for a four class,
transient arm movement problem using two data channels (9) and 98% using four data
channels (10). The performance of LDA for transient data classification was higher
when used with wavelet-based feature sets, such as the WT (2,9-11), WPT (2,9-11), or
stationary wavelet transform (11) sets, than when used with the TD or STFT feature
sets.
LDA classifier performance is generally considered to be high, as it is often used
either as the sole classifier (2,10,12) or as a standard against which a novel method is

24
compared (3,18). Consequently, it was tested as a classifier in this thesis work. A
thorough description of the LDA classifier can be found in Fukunaga (15).
* * *
For many elements of the typical myoelectric signal classification system (e.g.
feature set, window length), there are a number of methods and values that have
performed well in the literature. In order to find the optimal set of element choices,
multiple combinations of these methods and values were tested on the myoelectric data
collected from twelve subjects performing a set of typing tasks.
The purpose of this thesis work was to find an optimal classification approach for
a set of typing motions. Two methods of optimization were tested and compared - one
involved finding the best overall system (i.e. set of element choices) for each movement
set, and the other involved determining the best system for each subject and movement
set combination. Additionally, classification accuracy values were investigated and
compared for different exercise characteristics, system element choices, and finger
movements.

25
Chapter 3
Methods
3.1 Subjects
Twelve healthy subjects (six males and six females) volunteered for this study.
Each subject was provided with a Letter of Information and Consent form approved by
the Queen's University Research Ethics board (see Appendix A) outlining the
experimental procedure and details regarding his or her participation. All subjects
provided informed consent prior to their participation in the study. The subject's full
name, gender, birth date, handedness, height, weight, right forearm length (between the
head of the radius and the ulnar styloid process), and circumference (at approximately
one third of the forearm length from the head of the radius) were recorded1. This
information is summarized in Table 3-1. No subject presented health issues that would
likely affect or be affected by this study. Subject information was stored in a secure
location, where access was limited to the primary investigator and thesis supervisors.
Table 3-1 – Subject information summary
Characteristic Mean ± SD Age (years) 24.7 ± 2.5 Height (cm) 175 ± 9 Weight (kg) 73 ± 11 Forearm length (cm) 24.8 ± 1.7 Forearm circumference (cm) 25.4 ± 2.7 2 subjects were left-handed 10 subjects were right handed
3.2 Electrodes
At the point of forearm circumference measurement a 4-5 cm band was shaved
around the subject's right forearm, unless there was very little hair present. The skin
1 Weight for subjects 1 to 3, height for subject 2, and forearm circumference for subject 6 were not initially recorded. However, height and weight values were later collected and are included in the Table 3-1 statistics.
26
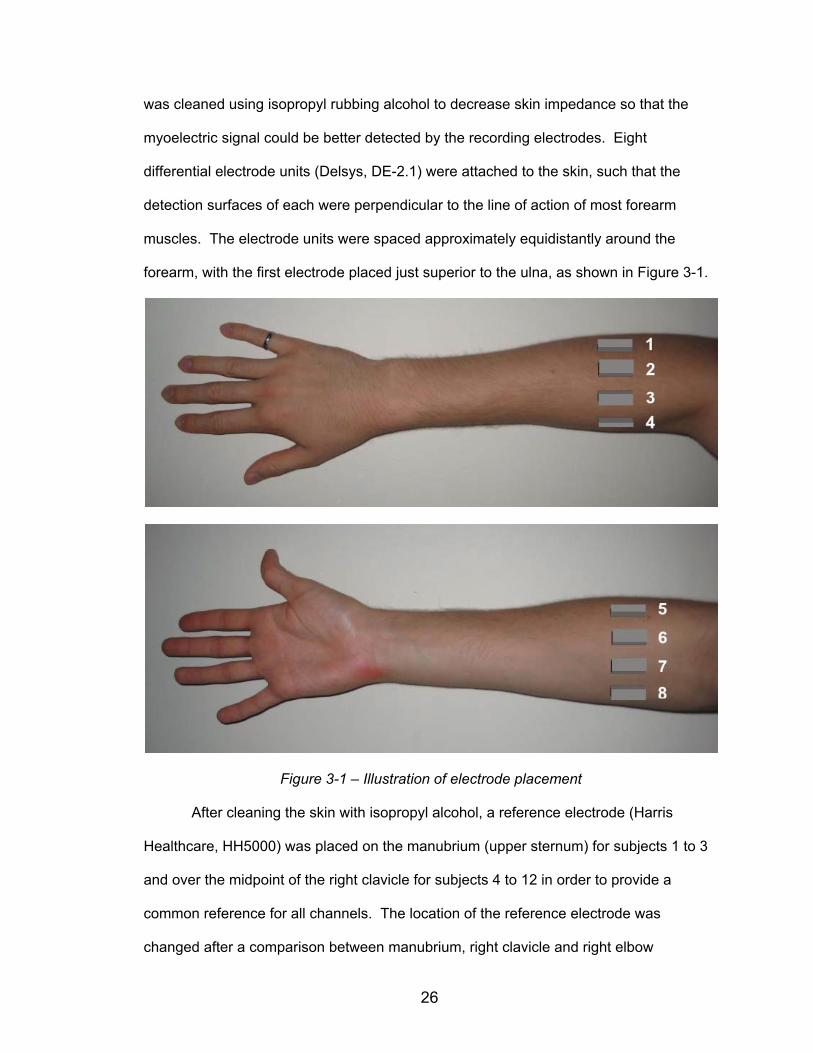
was cleaned using isopropyl rubbing alcohol to decrease skin impedance so that the
myoelectric signal could be better detected by the recording electrodes. Eight
differential electrode units (Delsys, DE-2.1) were attached to the skin, such that the
detection surfaces of each were perpendicular to the line of action of most forearm
muscles. The electrode units were spaced approximately equidistantly around the
forearm, with the first electrode placed just superior to the ulna, as shown in Figure 3-1.
Figure 3-1 – Illustration of electrode placement
After cleaning the skin with isopropyl alcohol, a reference electrode (Harris
Healthcare, HH5000) was placed on the manubrium (upper sternum) for subjects 1 to 3
and over the midpoint of the right clavicle for subjects 4 to 12 in order to provide a
common reference for all channels. The location of the reference electrode was
changed after a comparison between manubrium, right clavicle and right elbow
27
reference locations, which revealed that the noise level was lowest with right clavicle
placement.
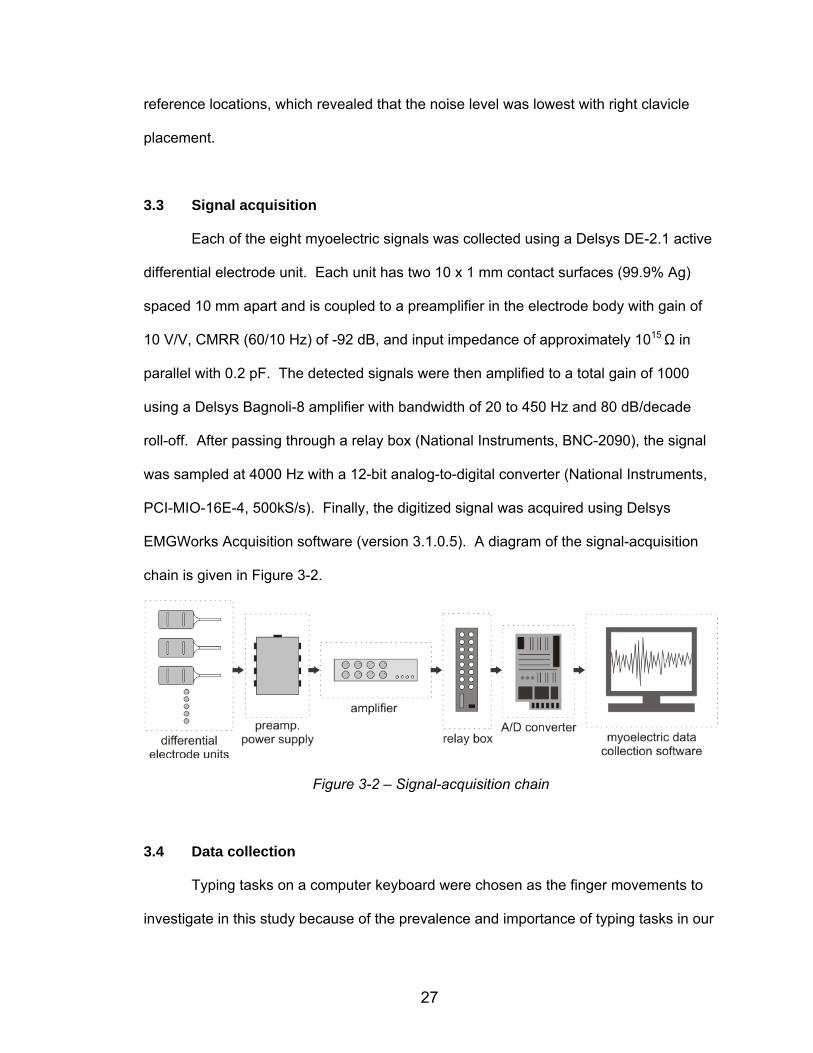
3.3 Signal acquisition
Each of the eight myoelectric signals was collected using a Delsys DE-2.1 active
differential electrode unit. Each unit has two 10 x 1 mm contact surfaces (99.9% Ag)
spaced 10 mm apart and is coupled to a preamplifier in the electrode body with gain of
10 V/V, CMRR (60/10 Hz) of -92 dB, and input impedance of approximately 1015 Ω in
parallel with 0.2 pF. The detected signals were then amplified to a total gain of 1000
using a Delsys Bagnoli-8 amplifier with bandwidth of 20 to 450 Hz and 80 dB/decade
roll-off. After passing through a relay box (National Instruments, BNC-2090), the signal
was sampled at 4000 Hz with a 12-bit analog-to-digital converter (National Instruments,
PCI-MIO-16E-4, 500kS/s). Finally, the digitized signal was acquired using Delsys
EMGWorks Acquisition software (version 3.1.0.5). A diagram of the signal-acquisition
chain is given in Figure 3-2.
Figure 3-2 – Signal-acquisition chain
3.4 Data collection
Typing tasks on a computer keyboard were chosen as the finger movements to
investigate in this study because of the prevalence and importance of typing tasks in our

28
day-to-day activities. By testing both a four finger movement set (digits two through five)
and a finger/thumb movement set (digits one and two), myoelectric signal classification
across two levels of task complexity was investigated. The subjects performed two trials
of each of eight different exercises. The first four exercises involved keystrokes using
the four fingers of the right hand and last four exercises involved keystrokes using the
index finger and thumb of the right hand. Data collected from the first trial of every
exercise were later used to train the classification systems and the data from the second
trial were used for system testing.
Before the typing exercises began, resting myoelectric data were collected for
ten seconds while the subject was instructed to maintain a relaxed posture with his or
her hand resting comfortably on the adjacent desk or in his or her lap.
The exercises were then carried out using a computer program, written in
MATLAB 7, which presented each exercise to the subject while recording the characters
typed and the corresponding keystroke times, as shown in Figure 3-3. The program also
passed a pulse to the myoelectric data collection system at every keystroke instance
that, together with the recorded keystroke time indices, was used for movement
detection in off-line processing (i.e. determining when, in the myoelectric signal record,
typing movements occurred).
Figure 3-3 – Exercise program display, as presented to the subjects
29
Each experiment was defined by three parameters: the set of finger movements
(i.e. keys typed), the typing pace and the keystroke order. These parameters are
described below.
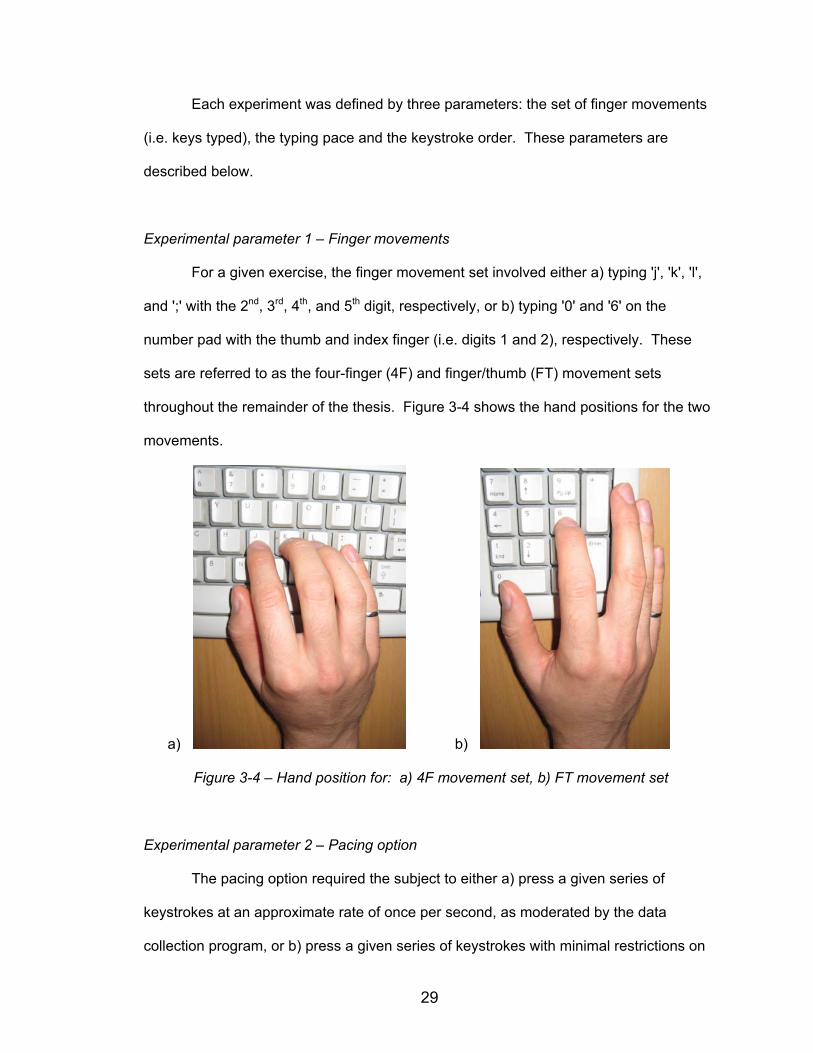
Experimental parameter 1 – Finger movements
For a given exercise, the finger movement set involved either a) typing 'j', 'k', 'l',
and ';' with the 2nd, 3rd, 4th, and 5th digit, respectively, or b) typing '0' and '6' on the
number pad with the thumb and index finger (i.e. digits 1 and 2), respectively. These
sets are referred to as the four-finger (4F) and finger/thumb (FT) movement sets
throughout the remainder of the thesis. Figure 3-4 shows the hand positions for the two
movements.
a) b)
Figure 3-4 – Hand position for: a) 4F movement set, b) FT movement set
Experimental parameter 2 – Pacing option
The pacing option required the subject to either a) press a given series of
keystrokes at an approximate rate of once per second, as moderated by the data
collection program, or b) press a given series of keystrokes with minimal restrictions on

30
pacing. For the latter case, the subject was simply instructed to relax his or her hand
and arm briefly between keystrokes so that consecutive muscle bursts would not
overlap.
Experimental parameter 3 – Keystroke order
The keystrokes could also be typed in either an a) ordered, or b) non-ordered
fashion. For ordered keystroke exercises, the computer program presented each
possible character to the subject in groups of twenty repetitions, for example:
0 0 0 0 0 0 0 0 0 0 0 0 0 0 0 0 0 0 0 0 6 6 6 6 6 6 6 6 6 6 6 6 6 6 6 6 6 6 6 6
The non-ordered option required the subject to type each keystroke 20 times in a
given non-ordered sequence as presented by the computer program. For example:
6 0 0 6 0 0 6 0 6 0 6 6 0 6 0 6 6 0 0 6 0 0 0 6 0 0 6 0 0 6 0 0 6 6 0 6 6 6 6 6
Eight exercises were formed using each combination of the aforementioned three
exercise parameters, as detailed in Table 3-2. Each finger movement was repeated 20
times per exercise, resulting in a total of 80 keystrokes per 4F exercise and 40
keystrokes per FT exercise.
Table 3-2 – Exercise parameters
Exercise Movement Set Order Pacing 1 4F ordered paced 2 4F ordered un-paced 3 4F non-ordered paced 4 4F non-ordered un-paced 5 FT ordered paced 6 FT ordered un-paced 7 FT non-ordered paced 8 FT non-ordered un-paced
The term scenario will be used throughout the remainder of the thesis to refer to
a particular combination of subject and movement set; for example, the scenario [S03,
4F] comprises eight data files: both trials of exercises 1 to 4 recorded from subject 3.

31
There were a total of 24 scenarios of data collected (2 scenarios per subject x 12
subjects), where each scenario comprised eight data sets: two trials for each of four
exercises. Consequently, the number of keystrokes per scenario was 640 for the 4F
exercises and 320 for the FT exercises. The division of each scenario's data into
training and testing sets is explained in the following section.
3.5 Classification system training and testing
Once data collection for all subjects was complete, the optimal movement
classification systems were determined through off-line testing of the data. In order to
approach each classification system’s ideal performance, an optimal classifier training
process was determined through empirical analysis.
The second trial of each exercise was used in classification system testing. In
order to determine the best data sets to use for classifier training, a variety of exercise
and trial subsets were used as training data for a randomly selected subject. From this
investigation, it was concluded that classifiers would be trained with the first trials of all
exercises in the same scenario as the testing data. For example, in order to test the
second trial of exercise 6 for a particular subject, the classifier was first trained using the
first trials of exercises 5 through 8 from that subject. Thus, for each 4F exercise there
were 320 keystrokes used for training and 80 keystrokes used for testing, and for each
FT exercise there were 160 keystrokes used for training and 40 keystrokes used for
testing.
3.6 Classification system optimization
In pursuit of an optimal classification system, several choices were tested for four
of the control system's key elements. These elements are listed below with the number
of choices tested for each given in parentheses.

32
Classification window characteristics:
o window length (3)
o number of window subdivisions (3)
o window skew relative to the keystroke trigger (3)
Feature set (7)
DR method (3)
Classifier (3)
For the classification window characteristics, a particular parameter value was tested,
such as a window length of 256 ms. For the latter three elements a particular method
was tested, e.g. using an MLP as the classifier.
A total of 666 systems were tested using the LDA and statistical classifiers, and
two systems were tested using the MLP classifier (see Section 3.10). For the former
case, one might expect 3x3x3x7x3x2=1134 systems instead of 666 systems, however
not all element choice combinations were tested:
multiple window divisions were not tested for the wavelet transform (see Section
3.8);
DR was always used with the STFT and WT feature sets (see Section 3.8), i.e.
the "no DR" element choice was excluded;
PCA-48 and PCA-64 DR were not used in systems where the feature set
dimension was already less than or equal to the intended reduced dimension.
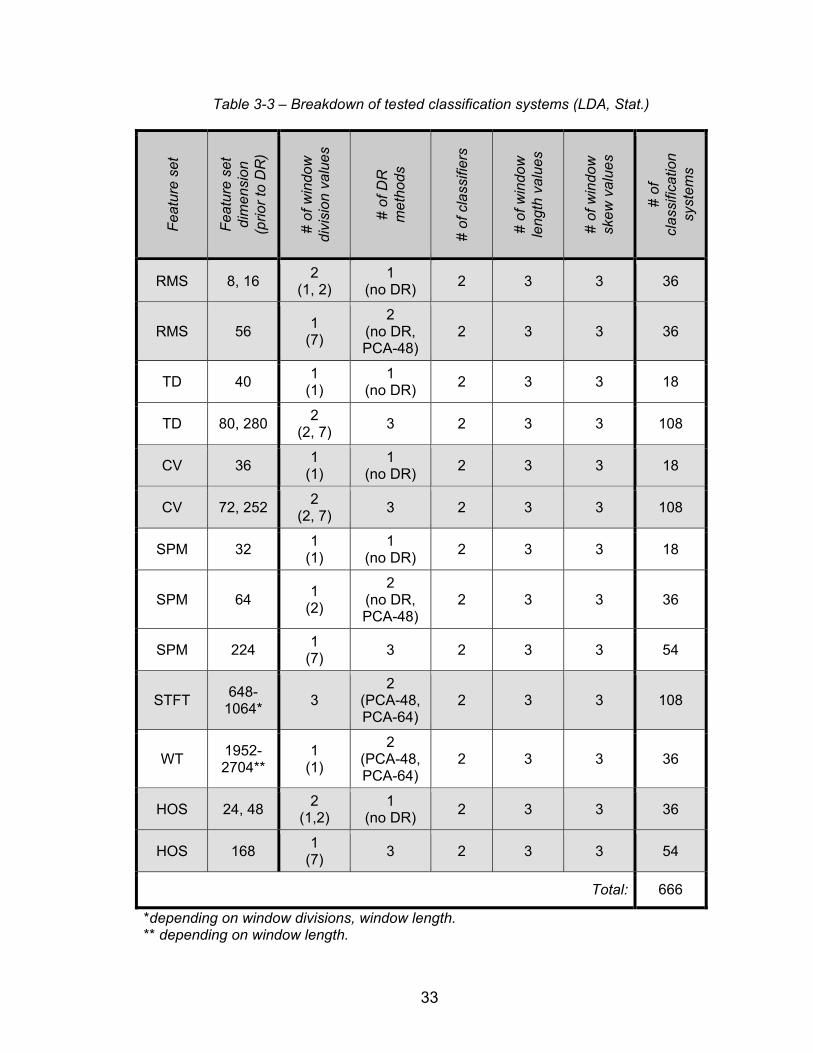
A breakdown of the LDA and statistical classifier systems is given by feature set in Table
3-3. For cases where only a subset of possible element choices was used, this subset is
given in parentheses.
33
Table 3-3 – Breakdown of tested classification systems (LDA, Stat.)
Fea
ture
set
Fea
ture
set
di
men
sion
(p
rior
to D
R)
# of
win
dow
di
visi
on v
alue
s
# of
DR
m
etho
ds
# of
cla
ssifi
ers
# of
win
dow
le
ngth
val
ues
# of
win
dow
sk
ew v
alue
s
# of
cl
assi
ficat
ion
syst
ems
RMS 8, 16 2
(1, 2) 1
(no DR) 2 3 3 36
RMS 56 1
(7)
2 (no DR, PCA-48)
2 3 3 36
TD 40 1
(1) 1
(no DR) 2 3 3 18
TD 80, 280 2
(2, 7) 3 2 3 3 108
CV 36 1
(1) 1
(no DR) 2 3 3 18
CV 72, 252 2
(2, 7) 3 2 3 3 108
SPM 32 1
(1) 1
(no DR) 2 3 3 18
SPM 64 1
(2)
2 (no DR, PCA-48)
2 3 3 36
SPM 224 1
(7) 3 2 3 3 54
STFT 648-
1064* 3
2 (PCA-48, PCA-64)
2 3 3 108
WT 1952-2704**
1 (1)
2 (PCA-48, PCA-64)
2 3 3 36
HOS 24, 48 2
(1,2) 1
(no DR) 2 3 3 36
HOS 168 1
(7) 3 2 3 3 54
Total: 666
*depending on window divisions, window length. ** depending on window length.
34
The measure used to judge classification system performance was classification
accuracy, which was defined as the percentage of correctly classified keystrokes.
Software was designed using MATLAB 7 to train and test all classification systems in
Table 3-3. Specifically, for each scenario the first trials of the corresponding four
exercises were used to train a given classification system (see Section 3.5), and then
the system was tested using the second trial of each exercise. Accuracy values for the
test data were reported by the software. For each exercise, two additional pieces of
information were determined: i) the list of classifier decisions (e.g. "006000006000..."),
so that keystroke accuracies could later be determined, and ii) the average
computational time for each keystroke classification, so that classification delays could
later be calculated. The MATLAB Neural Network Toolbox 5.1 was used to implement
the MLP classifier, as detailed in Section 3.10.
Optimization of the classification system was approached in two ways: general
optimization and scenario optimization. In general optimization (GO), the single
classification system that performed best over all 12 subjects and four exercises was
determined for each movement set (i.e. 4F, FT). In scenario optimization (SO), the best-
performing system was determined for each scenario (e.g. exercises 1-4 for S12). This
latter method is specifically suited for prosthetic applications, where it could be a feasible
and sensible approach to optimize performance for each subject and finger movement
set.
The values/methods tested for each system element are described and justified
in the following sections.
35
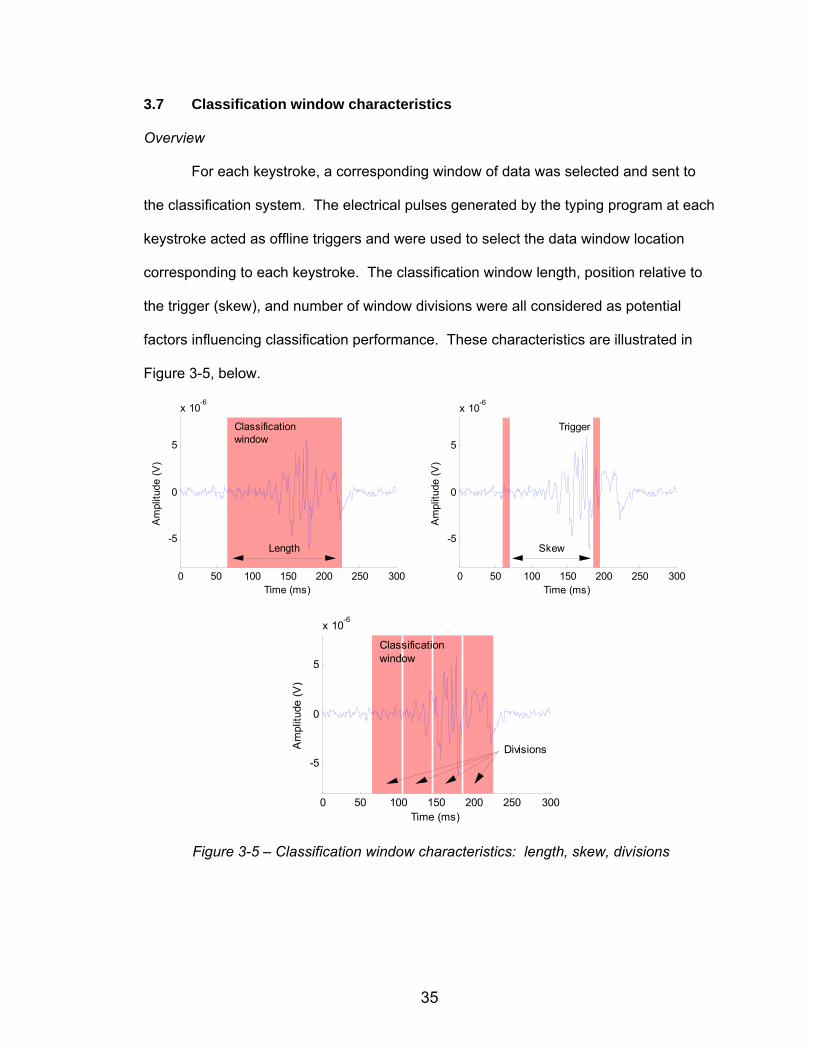
3.7 Classification window characteristics
Overview
For each keystroke, a corresponding window of data was selected and sent to
the classification system. The electrical pulses generated by the typing program at each
keystroke acted as offline triggers and were used to select the data window location
corresponding to each keystroke. The classification window length, position relative to
the trigger (skew), and number of window divisions were all considered as potential
factors influencing classification performance. These characteristics are illustrated in
Figure 3-5, below.
0 50 100 150 200 250 300
-5
0
5
x 10-6
Time (ms)
Am
plitu
de (
V)
Classificationwindow
Length
0 50 100 150 200 250 300
-5
0
5
x 10-6
Time (ms)
Am
plitu
de (
V)
Trigger
Skew
0 50 100 150 200 250 300
-5
0
5
x 10-6
Time (ms)
Am
plitu
de (
V)
Classificationwindow
Divisions
Figure 3-5 – Classification window characteristics: length, skew, divisions
36
Window length
A maximum window length of 256 ms was used in classification system testing
for two reasons. Firstly, this window length was below the accepted classification delay
limit of 300 ms for a prosthetic application (12) while still allowing time for computation.
Secondly, it has been linked to repeated good performance on transient data in the
literature (1,9-11,19).
Visual inspection of a set of 33 myoelectric bursts, randomly selected to include
bursts from each subject and keystroke, indicated an average burst width of 141 ± 61
ms, with bursts as short as 61 ms and long as 274 ms. Therefore, smaller window
lengths may still capture much relevant information from the bursts while allowing more
time for computation. Consequently, the testing of window lengths shorter than 256 ms
was warranted. Preliminary testing on data selected from a random subject using
window lengths of 128 ms to 256 ms, in steps of 32 ms, showed the three most optimal
lengths to be: 160 ms, 224 ms and 256 ms. These window lengths were selected for
testing in this study in order to optimize the classification system, reveal classification
accuracy trends based on classification window length, and perhaps allow for improved
classification speed.
Window skew
The position of the classification window with respect to the trigger, or the
classification window skew, was then considered. Given that the average time
difference between visually detected myoelectric signal onsets and corresponding trigger
pulses was 106 ± 37 ms for a subset of two subjects (S01,S03), skew values of -105 ms,
-125 ms, -145 ms, and -165 ms were tested on a randomly selected subject; negative
skew values correspond to windows shifted to precede the trigger. Due to their
performance, the values of -105 ms, -125 ms and -145 ms were retained for testing.

37
Window divisions
The classification window was subdivided into a number of segments in order to
integrate time-varying information into the feature set. Despite the particular success of
dividing the window into 5 segments in the literature (34), it was found in preliminary
analysis for this study that using 1, 2, and 7 segments produced optimal results. These
values were subsequently used for testing in this thesis work.
3.8 Feature sets
A feature set was formed by extracting and combining features from each of the
window divisions for all eight channels. For example, a data window segmented in two
would result in a total of 16 windows used for feature set extraction: two window
segments for each of 8 channels.
Seven feature sets were included in this thesis work based on their reported
performance in relevant literature as discussed in Chapter 2, or on their particular
suitability for this application. The feature sets tested are listed in approximate order of
complexity below. As the effect of feature set choice on classification accuracy is
considerable (9), the number of feature sets tested was consequently greater than the
number of values or methods tested for other classification system elements.
Hudgins' (TD) and root-mean-square (RMS) feature sets
The TD feature set consists of mean absolute value (MAV), mean absolute value
slope (MAVS), slope sign changes (SSC), zero crossings (ZC), and waveform length
(WL), as described in Section 2.5.1. The threshold T used in calculations for zero
crossings (ZC) and slope sign changes (SSC) was set to 230 nV, which was the average
root-mean-square resting noise level across all subjects. In addition to the TD feature
set, a very simple feature set containing only a root-mean-square (RMS) value was
38
tested; the RMS set was included in this thesis work primarily to provide further
information on the relationship between classification accuracy and feature set simplicity.
Correlation variation (CV)
Despite lower performance of the ACCC feature set in a comparison to other
methods tested by Englehart et al. (10), the classification accuracy was still very high –
approximately 97% for a four class, four channel, transient arm movement problem.
Given the high number of data channels in this thesis work and consequently the large
amount of cross-talk information available, the ACCC feature set was considered to
have potential for good performance.
The high computational time associated with correlation calculations motivated a
simplification of these features. In place of the autocorrelation values determined for a
given classification window, the dot product of each channel's data vector with itself -
equivalent to the squared norm - was determined, as shown in Equation 3-1. In place of
cross-correlation values, the dot product was calculated for every different pair of
channels' data vectors, weighted by their norms, as shown in Equation 3-2.
8...1,)()()(1
iiXiXiA k
L
kk (3-1)
jijijAiA
jXiX
jiBk
L
kk
,8...1,,
)()(
)()(
),( 1 (3-2)
In Equations 3-1 and 3-2 above, A and B represent variations of the autocorrelation and
cross-correlation values, respectively, L represents the window length, and X(i)k is
sample k from the ith channel of data set X. Comparison of the correlation variation (CV)
feature set to the original ACCC set for a randomly selected subject yielded not only
39
significantly lower computational time, but also approximately 10% higher classification
accuracy.
Spectral power magnitudes (SPMs)
Given that the movement sets studied in this work more closely resemble that of
Hiraiwa et al. and Uchida et al. (17,32) than that of Farry et al. (13), the former method
for deriving SPMs was used (see Section 2.5.3). The feature set specifically consisted
of the average SPMs from disjoint bandwidths of equal width for each window and
channel. Prior to its implementation in this thesis work, the optimal bandwidth number
and frequency range were first empirically determined to be four and 75 - 400 Hz,
respectively, for a randomly selected subject.
Short-time Fourier transform (STFT)
The very large feature set created by the STFT required several modifications to
the testing structure. Firstly, DR by PCA was required for all testing. Secondly, signals
were down-sampled to 1000 Hz prior to the STFT calculations in order to prevent
subsequent computer memory overloads during PCA calculations.
The STFT feature set required selection of three parameter values before it could be
implemented. These are listed below, together with values used for each in empirical
optimization.
Window type: Rectangular, Hamming, Hann
Window length: 32 ms, 64 ms, 128 ms
Window overlap: 75%, 50%, 25%, 0%
The classification system used in testing involved a window length of 256 ms,
PCA DR to 40 features, window skew of -125 ms, and an LDA classifier – a combination
that had been found to give good performance. Optimal results were found for a

40
randomly selected subject using a rectangular window of half the total classification
window length and 0% overlap. Consequently, the rectangular window with 0% overlap
was used throughout the testing. Due to the optimal overlap value of 0%, the STFT
window length parameter can be expressed as a function of the window divisions
element (see Section 3.7) and therefore did not need to be fixed.
Wavelet transform (WT)
The WT involves two parameters: the number of decomposition levels and the
mother wavelet type; the latter is used to determine the high pass and low pass filters
discussed in Section 2.5.5. Full decomposition has shown optimal performance in the
literature (16) and was carried out in this thesis study. A variety of mother wavelets have
been chosen for transient data applications in the literature, such as the Coiflet-2 (20),
Coiflet-4 (9,10,16), Coiflet-5 (11), and Daubechies-5 (20). Empirical optimization
showed the Coiflet-2 mother wavelet to have superior performance when Coiflet (orders
1 to 5), Daubechies (orders 1 to 10), and Symmlet (orders 1 to 8) mother wavelets were
tested on a randomly selected subject in combination with PCA DR and the LDA
classifier. Consequently, the Coiflet-2 mother wavelet was used throughout the testing.
As explained above for the STFT feature set, the high dimensional feature set yielded by
the WT necessitated both down-sampling of myoelectric data to 1000 Hz prior to wavelet
calculations and PCA DR in every case. Additionally, window divisions greater than 1
were not tested due to the inherent windowing of the WT.
Higher order statistics (HOS)
The HOS feature set was initially tested on a random subject's normalized data in
the three sizes tested by Nazarpour et al. (28):
41
19 features per channel, see Table 2-1.
Three features per channel ([C2(0), C2(1), C4(0,0,0)]), as determined by Nazarpour
et al to be the best performing three-feature set (28).
Two features per channel ([C2(0), C4(0,0,0)]), as determined by Nazarpour et al to
be the best performing two-feature set (28).
The features and normalization process are described in detail in Section 2.5.6. In initial
testing of these three feature set sizes on a randomly selected subject's data, the best
results were obtained for the three-feature set, and thus this set was used in this
research work.
3.9 Dimensionality reduction
In order to test the merits of DR for this application, classification systems using
three different DR options were tested:
none: no DR
PCA-48: DR to 48 dimensions using PCA
PCA-64: DR to 64 dimensions using PCA
Initial testing of 48, 64 and 80 dimensions for a randomly selected subject's data showed
that the two smaller values performed best; thus, they were used for subsequent testing.
Dimensionality was reduced equally across all channels for each feature set (e.g.
to reduce dimensionality to 48, each channel's feature set was independently reduced in
size to 6) except for the CV set, where the features were not grouped by channel. The
same data used to train the classifier were used to create the PCA DR matrix.
42
3.10 Classification
After DR, the feature set was sent to a classifier either for training during the
training phase or for classification during the testing phase. Three classifiers were
tested, each of which represented a different classification approach: artificial neural
networks, linear discrimination, and statistical classification. These three classifiers are
explained below.
Multilayer perceptron (MLP)
The MLP was chosen to be the neural network classifier tested due to its
prevalence in the literature and consistent good performance (4,7,9,11,18,21,31). The
network was developed with the MATLAB Neural Network Toolbox 5.1 using a single
hidden layer of eight nodes and tan-sigmoid and linear transfer functions for the hidden
and output nodes, respectively, as commonly found in the literature (4,6,9,11,19). The
network underwent training with the Levenberg-Marquardt backpropagation algorithm
(20) until one of three conditions occured: 200 training iterations were completed, 0
misclassification results for the training data were found, or a performance gradient of
1x10⁻¹⁰ or below was found for the classifier's mean-square-error performance function.
Due to the lengthy training time for this classifier, it received limited testing.
Whereas the LDA and statistical classifiers were tested with many combinations of other
element choices, the MLP was tested in only one system for each movement set. This
system contained the best performing combination of element choices determined using
the LDA and statistical classifiers.
Linear discriminant analysis (LDA)
The literature has shown the LDA classifier to be a trusted (2,10,12) and
relatively well performing (3,9,11,18) classifier; consequently, this classifier was included

43
in this work. The method, as described in Section 2.7.2, was programmed in MATLAB
7.
Statistical classifier
A simple statistical classifier was tested which judged a feature set's compatibility
with a particular classifier decision, or class (e.g. '0' or '6' for the FT set), using the z-
value of each feature relative to the corresponding training data set distribution.
During the training phase, the mean and standard deviation of each feature were
calculated across the training data for each class. The testing phase began by using
these values to calculate the z-value of each feature from the test data, as shown in
Equation 3-3.
C
CC r
rXrXrZ
)(
)()()(
(3-3)
where Z(r)C represents the z-value corresponding to class C for feature r of the testing
data, X(r) represents the feature r value from the testing data, and CrX )( and Cr)(
represent the mean and standard deviation of feature r values, respectively, for the class
C training set data.
The class to which the test data was mapped was that which yielded the lowest
sum of squared z-values across all features, as shown in Equations 3-4 and 3-5 below.
RN
rCC rZZ
1
22 )( (3-4)
)min(arg 2CZClass (3-5)
where Z2C is the sum of squared z-values for class C, NR represents the total number of
features, and Class represents the classifier choice.
44
3.11 Statistical methods
The effect of optimization method and movement set on classification accuracy
was tested using a two-way repeated measures analysis of variance, or ANOVA, with
significance level of α=0.05. The effect of pace and order options on classification
accuracy was tested in the same manner.
The performances of different element choices were compared using paired t-
tests (α=0.05), as described in Section 4.5. First, the system that performed best, on
average, over all subjects was determined for each value of a given system element
(e.g. 160, 224, 256 ms in the case of window length). The accuracy values of the best
performing system (the GO system) were then compared to those of each of the other
systems using paired t-tests. The paired t-test (α=0.05) was also used to compare the
performances of MLP and GO systems.
The average classification accuracy for each different movement was determined
for all GO and SO systems. A one-way repeated measures ANOVA (α=0.05) was used
to compare movement performances; post-hoc testing was performed using Tukey's
method for multiple comparisons.
Statistical analyses were carried out using Minitab 15 and MATLAB 7.

45
Chapter 4
Results
4.1 Introduction
Classification system performance results are presented in the following
sections. An overview of the collected myoelectric data is first provided; then,
classification performances are given for the two different optimization approaches: GO
and SO, as described in Section 3.6. For each optimization approach, classification
accuracies corresponding to different exercise characteristics, element choices, and
finger movements are given and compared.
4.2 Myoelectric data
Twelve subjects performed two trials each of eight typing tasks as eight channels
of myoelectric data were recorded – resulting in 12x2x8x8=1536 myoelectric data sets.
The data were all visually inspected and no unusable data sets were apparent.
However, in six different data sets (i.e. trials), one keystroke was mistyped by the subject
and therefore 19 (not 20) occurrences of that keystroke were collected. Furthermore, in
the first trial of exercise 3, subject 6 performed a fifth finger keystroke in place of a fourth
finger keystroke three times, resulting in 17 'l' keystrokes and 23 ';' keystrokes. The
minor changes to data set sizes resulting from these typing errors were assumed not to
significantly affect results and thus all data sets were included in the study.
Examples of myoelectric data collected during a 4F and an FT exercise are given
in Figure 4-1. Both plots show an ordered, paced exercise so that the myoelectric
characteristics of certain keystrokes can be more easily distinguished by the reader. For
example, in the 4F exercise, the muscle bursts corresponding to fifth finger keystrokes
are clearly visible between approximately 63 and 82 seconds; in the FT example, the
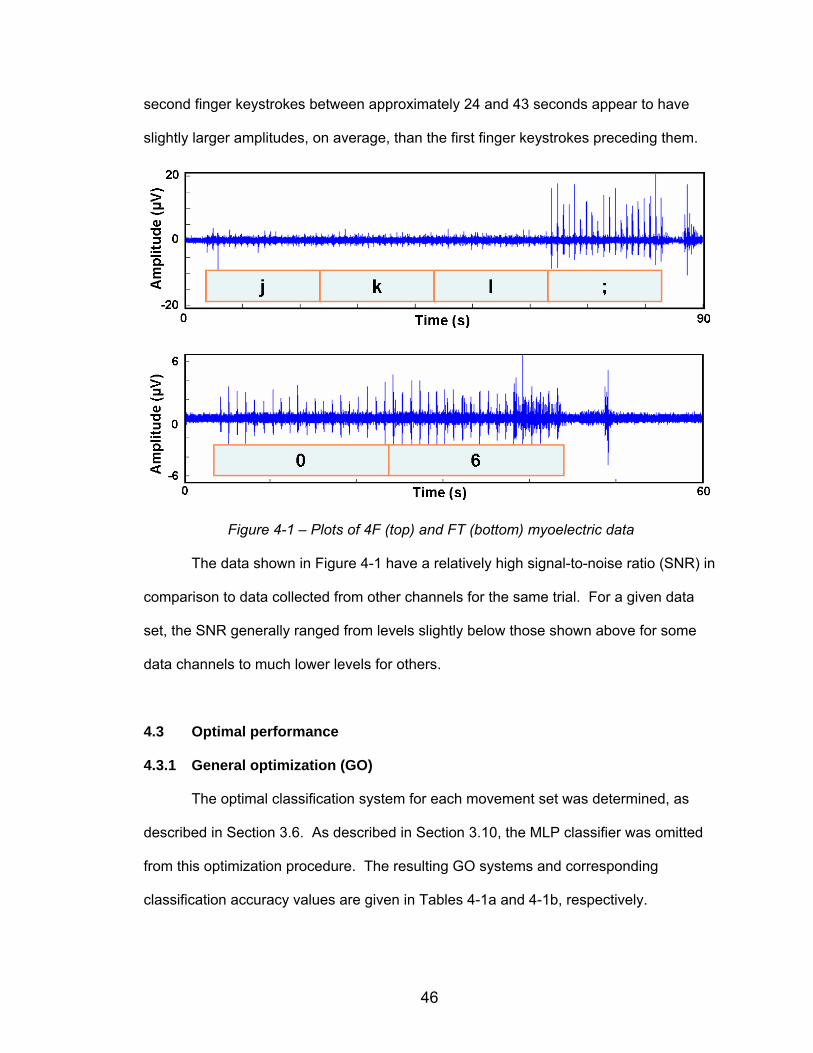
46
second finger keystrokes between approximately 24 and 43 seconds appear to have
slightly larger amplitudes, on average, than the first finger keystrokes preceding them.
Figure 4-1 – Plots of 4F (top) and FT (bottom) myoelectric data
The data shown in Figure 4-1 have a relatively high signal-to-noise ratio (SNR) in
comparison to data collected from other channels for the same trial. For a given data
set, the SNR generally ranged from levels slightly below those shown above for some
data channels to much lower levels for others.
4.3 Optimal performance
4.3.1 General optimization (GO)
The optimal classification system for each movement set was determined, as
described in Section 3.6. As described in Section 3.10, the MLP classifier was omitted
from this optimization procedure. The resulting GO systems and corresponding
classification accuracy values are given in Tables 4-1a and 4-1b, respectively.
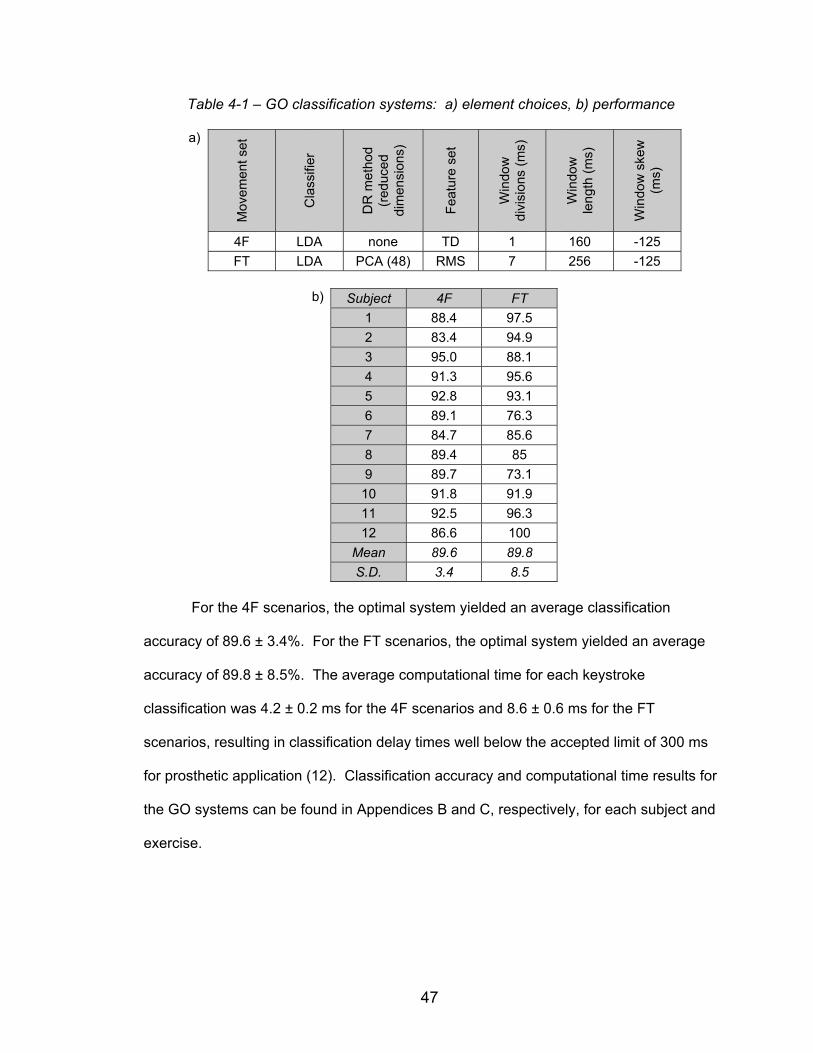
47
Table 4-1 – GO classification systems: a) element choices, b) performance
a)
Mov
emen
t set
Cla
ssifi
er
DR
met
hod
(red
uced
di
men
sion
s)
Fea
ture
set
Win
dow
di
visi
ons
(ms)
Win
dow
le
ngth
(m
s)
Win
dow
ske
w
(ms)
4F LDA none TD 1 160 -125 FT LDA PCA (48) RMS 7 256 -125
For the 4F scenarios, the optimal system yielded an average classification
accuracy of 89.6 ± 3.4%. For the FT scenarios, the optimal system yielded an average
accuracy of 89.8 ± 8.5%. The average computational time for each keystroke
classification was 4.2 ± 0.2 ms for the 4F scenarios and 8.6 ± 0.6 ms for the FT
scenarios, resulting in classification delay times well below the accepted limit of 300 ms
for prosthetic application (12). Classification accuracy and computational time results for
the GO systems can be found in Appendices B and C, respectively, for each subject and
exercise.
b) Subject 4F FT 1 88.4 97.5 2 83.4 94.9 3 95.0 88.1 4 91.3 95.6 5 92.8 93.1 6 89.1 76.3 7 84.7 85.6 8 89.4 85 9 89.7 73.1 10 91.8 91.9 11 92.5 96.3 12 86.6 100 Mean 89.6 89.8 S.D. 3.4 8.5
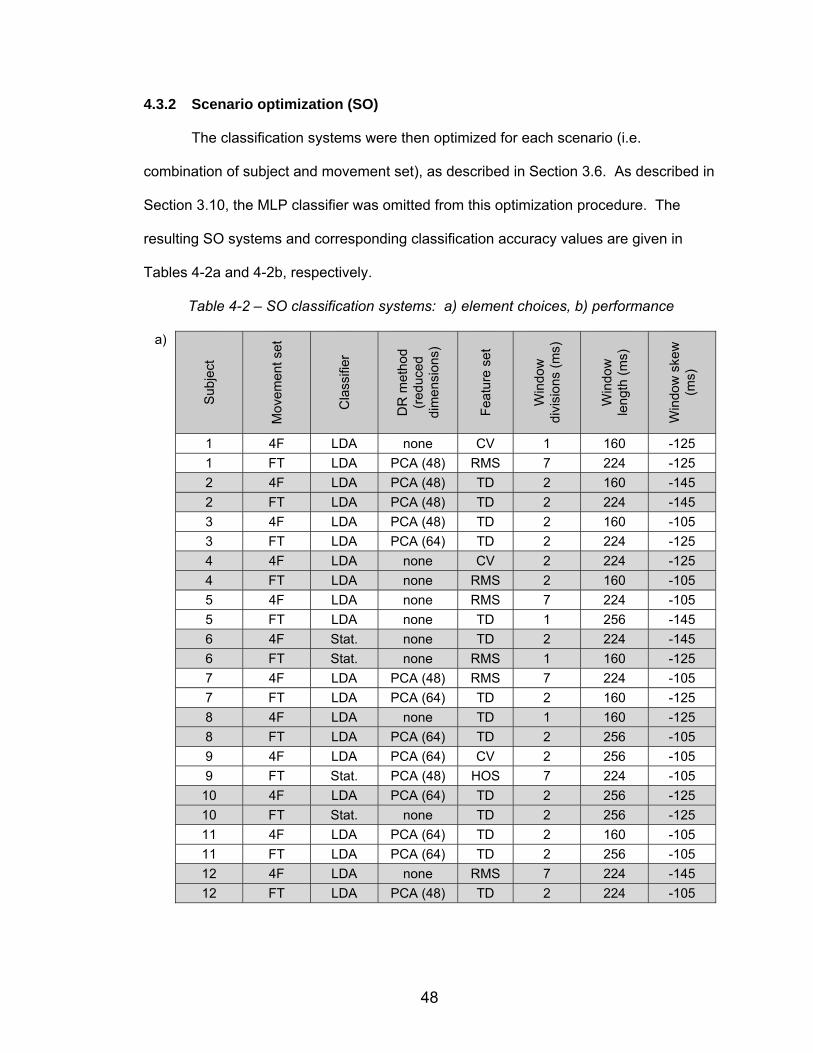
48
4.3.2 Scenario optimization (SO)
The classification systems were then optimized for each scenario (i.e.
combination of subject and movement set), as described in Section 3.6. As described in
Section 3.10, the MLP classifier was omitted from this optimization procedure. The
resulting SO systems and corresponding classification accuracy values are given in
Tables 4-2a and 4-2b, respectively.
Table 4-2 – SO classification systems: a) element choices, b) performance
a)
Sub
ject
Mov
emen
t set
Cla
ssifi
er
DR
met
hod
(red
uced
di
men
sion
s)
Fea
ture
set
Win
dow
di
visi
ons
(ms)
Win
dow
le
ngth
(m
s)
Win
dow
ske
w
(ms)
1 4F LDA none CV 1 160 -125 1 FT LDA PCA (48) RMS 7 224 -125 2 4F LDA PCA (48) TD 2 160 -145 2 FT LDA PCA (48) TD 2 224 -145 3 4F LDA PCA (48) TD 2 160 -105 3 FT LDA PCA (64) TD 2 224 -125 4 4F LDA none CV 2 224 -125 4 FT LDA none RMS 2 160 -105 5 4F LDA none RMS 7 224 -105 5 FT LDA none TD 1 256 -145 6 4F Stat. none TD 2 224 -145 6 FT Stat. none RMS 1 160 -125 7 4F LDA PCA (48) RMS 7 224 -105 7 FT LDA PCA (64) TD 2 160 -125 8 4F LDA none TD 1 160 -125 8 FT LDA PCA (64) TD 2 256 -105 9 4F LDA PCA (64) CV 2 256 -105 9 FT Stat. PCA (48) HOS 7 224 -105 10 4F LDA PCA (64) TD 2 256 -125 10 FT Stat. none TD 2 256 -125 11 4F LDA PCA (64) TD 2 160 -105 11 FT LDA PCA (64) TD 2 256 -105 12 4F LDA none RMS 7 224 -145 12 FT LDA PCA (48) TD 2 224 -105
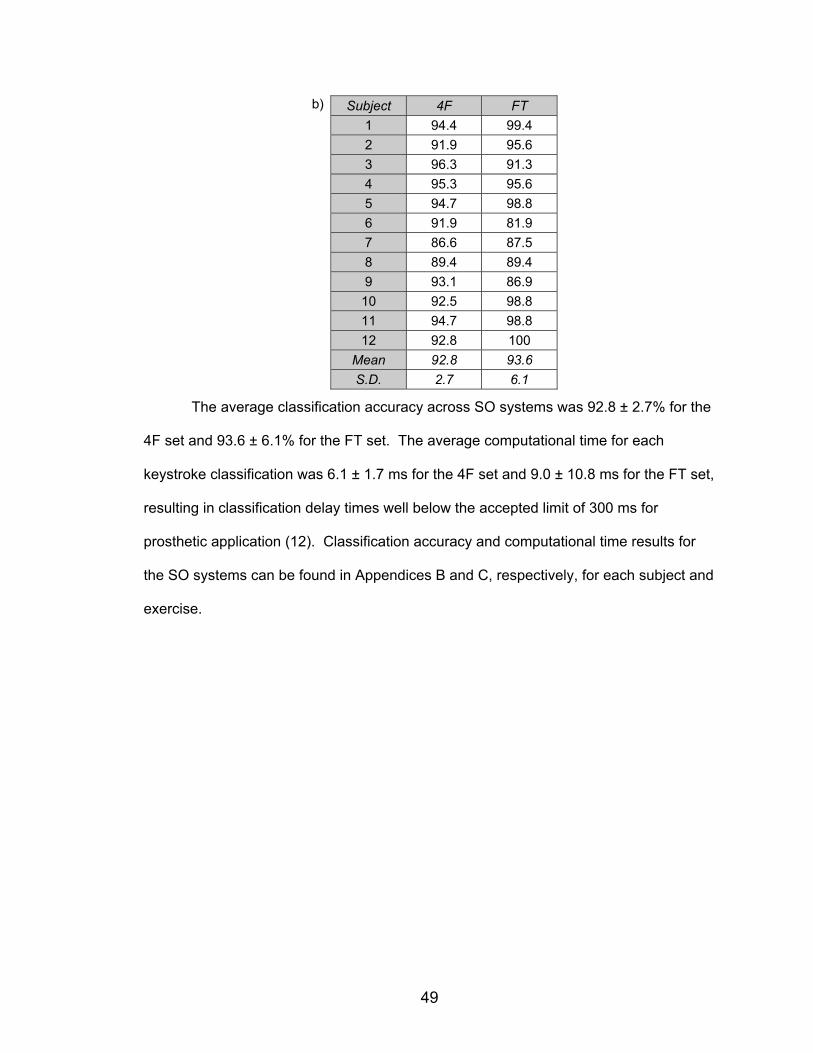
49
The average classification accuracy across SO systems was 92.8 ± 2.7% for the
4F set and 93.6 ± 6.1% for the FT set. The average computational time for each
keystroke classification was 6.1 ± 1.7 ms for the 4F set and 9.0 ± 10.8 ms for the FT set,
resulting in classification delay times well below the accepted limit of 300 ms for
prosthetic application (12). Classification accuracy and computational time results for
the SO systems can be found in Appendices B and C, respectively, for each subject and
exercise.
b) Subject 4F FT 1 94.4 99.4 2 91.9 95.6 3 96.3 91.3 4 95.3 95.6 5 94.7 98.8 6 91.9 81.9 7 86.6 87.5 8 89.4 89.4 9 93.1 86.9 10 92.5 98.8 11 94.7 98.8 12 92.8 100 Mean 92.8 93.6 S.D. 2.7 6.1
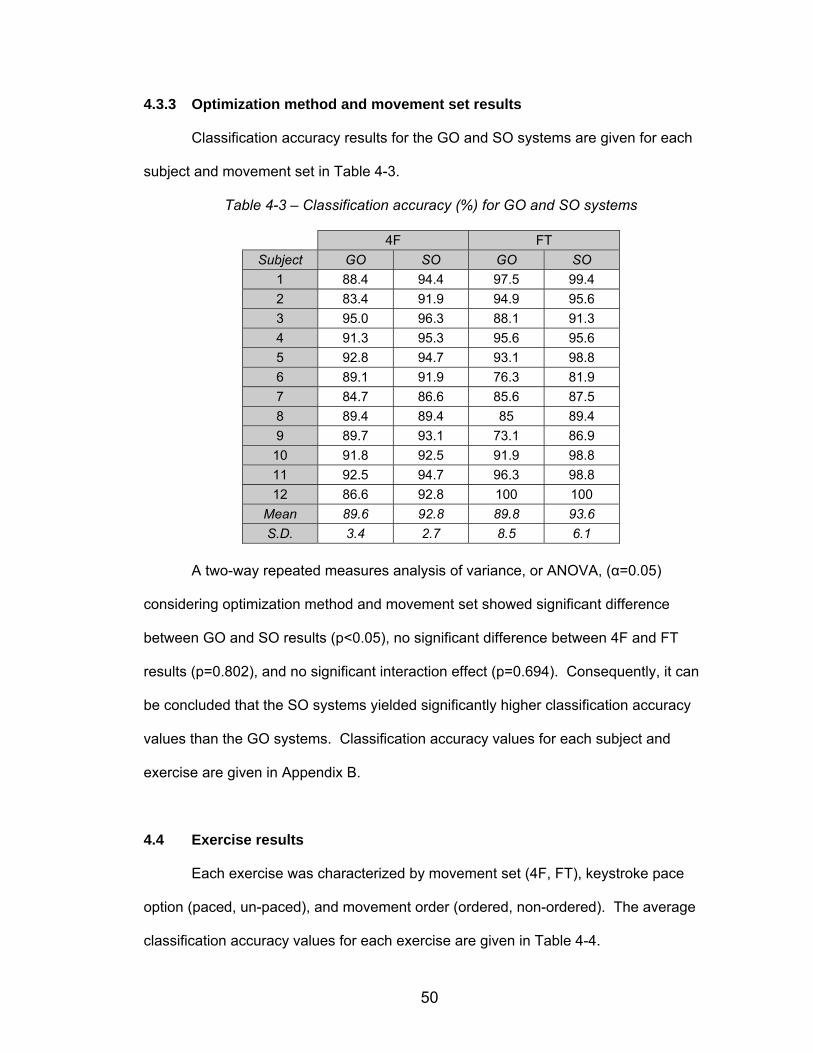
50
4.3.3 Optimization method and movement set results
Classification accuracy results for the GO and SO systems are given for each
subject and movement set in Table 4-3.
Table 4-3 – Classification accuracy (%) for GO and SO systems
4F FT
Subject GO SO GO SO
1 88.4 94.4 97.5 99.4
2 83.4 91.9 94.9 95.6
3 95.0 96.3 88.1 91.3
4 91.3 95.3 95.6 95.6
5 92.8 94.7 93.1 98.8
6 89.1 91.9 76.3 81.9
7 84.7 86.6 85.6 87.5
8 89.4 89.4 85 89.4
9 89.7 93.1 73.1 86.9
10 91.8 92.5 91.9 98.8
11 92.5 94.7 96.3 98.8
12 86.6 92.8 100 100
Mean 89.6 92.8 89.8 93.6
S.D. 3.4 2.7 8.5 6.1
A two-way repeated measures analysis of variance, or ANOVA, (α=0.05)
considering optimization method and movement set showed significant difference
between GO and SO results (p<0.05), no significant difference between 4F and FT
results (p=0.802), and no significant interaction effect (p=0.694). Consequently, it can
be concluded that the SO systems yielded significantly higher classification accuracy
values than the GO systems. Classification accuracy values for each subject and
exercise are given in Appendix B.
4.4 Exercise results
Each exercise was characterized by movement set (4F, FT), keystroke pace
option (paced, un-paced), and movement order (ordered, non-ordered). The average
classification accuracy values for each exercise are given in Table 4-4.
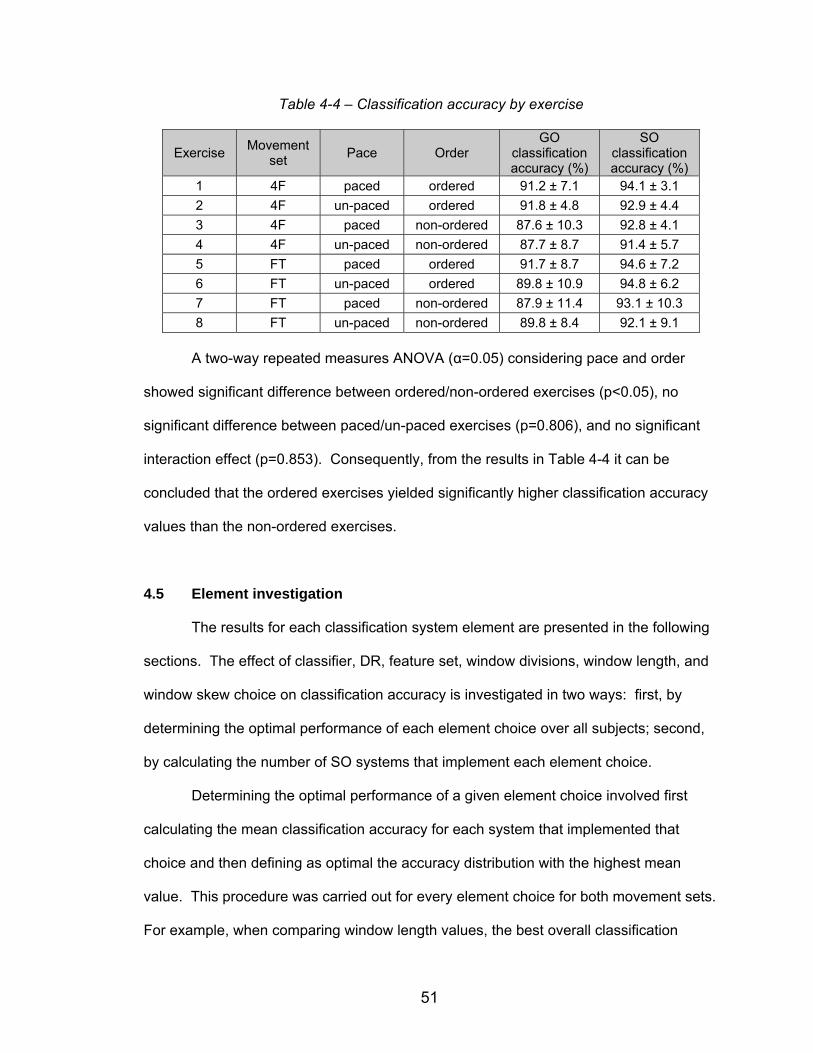
51
Table 4-4 – Classification accuracy by exercise
Exercise Movement
set Pace Order
GO classification accuracy (%)
SO classification accuracy (%)
1 4F paced ordered 91.2 ± 7.1 94.1 ± 3.1
2 4F un-paced ordered 91.8 ± 4.8 92.9 ± 4.4
3 4F paced non-ordered 87.6 ± 10.3 92.8 ± 4.1
4 4F un-paced non-ordered 87.7 ± 8.7 91.4 ± 5.7
5 FT paced ordered 91.7 ± 8.7 94.6 ± 7.2
6 FT un-paced ordered 89.8 ± 10.9 94.8 ± 6.2
7 FT paced non-ordered 87.9 ± 11.4 93.1 ± 10.3
8 FT un-paced non-ordered 89.8 ± 8.4 92.1 ± 9.1
A two-way repeated measures ANOVA (α=0.05) considering pace and order
showed significant difference between ordered/non-ordered exercises (p<0.05), no
significant difference between paced/un-paced exercises (p=0.806), and no significant
interaction effect (p=0.853). Consequently, from the results in Table 4-4 it can be
concluded that the ordered exercises yielded significantly higher classification accuracy
values than the non-ordered exercises.
4.5 Element investigation
The results for each classification system element are presented in the following
sections. The effect of classifier, DR, feature set, window divisions, window length, and
window skew choice on classification accuracy is investigated in two ways: first, by
determining the optimal performance of each element choice over all subjects; second,
by calculating the number of SO systems that implement each element choice.
Determining the optimal performance of a given element choice involved first
calculating the mean classification accuracy for each system that implemented that
choice and then defining as optimal the accuracy distribution with the highest mean
value. This procedure was carried out for every element choice for both movement sets.
For example, when comparing window length values, the best overall classification
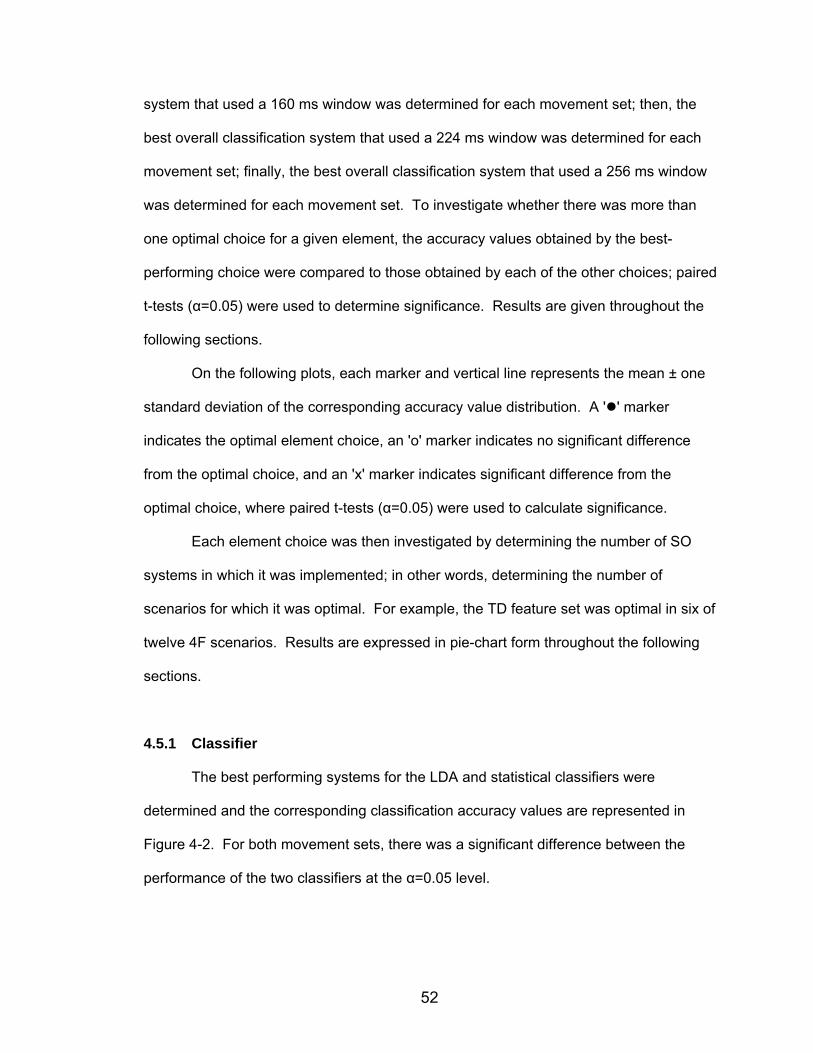
52
system that used a 160 ms window was determined for each movement set; then, the
best overall classification system that used a 224 ms window was determined for each
movement set; finally, the best overall classification system that used a 256 ms window
was determined for each movement set. To investigate whether there was more than
one optimal choice for a given element, the accuracy values obtained by the best-
performing choice were compared to those obtained by each of the other choices; paired
t-tests (α=0.05) were used to determine significance. Results are given throughout the
following sections.
On the following plots, each marker and vertical line represents the mean ± one
standard deviation of the corresponding accuracy value distribution. A '' marker
indicates the optimal element choice, an 'o' marker indicates no significant difference
from the optimal choice, and an 'x' marker indicates significant difference from the
optimal choice, where paired t-tests (α=0.05) were used to calculate significance.
Each element choice was then investigated by determining the number of SO
systems in which it was implemented; in other words, determining the number of
scenarios for which it was optimal. For example, the TD feature set was optimal in six of
twelve 4F scenarios. Results are expressed in pie-chart form throughout the following
sections.
4.5.1 Classifier
The best performing systems for the LDA and statistical classifiers were
determined and the corresponding classification accuracy values are represented in
Figure 4-2. For both movement sets, there was a significant difference between the
performance of the two classifiers at the α=0.05 level.
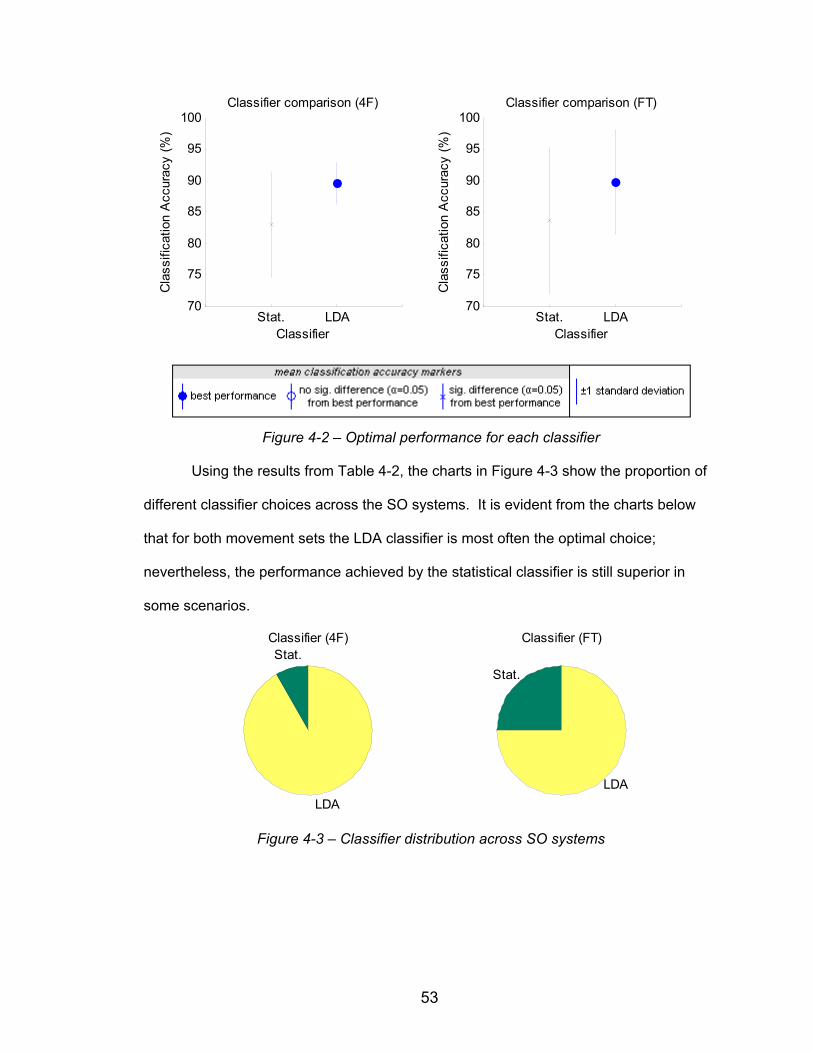
53
Stat. LDA70
75
80
85
90
95
100Classifier comparison (4F)
Classifier
Cla
ssifi
catio
n A
ccur
acy
(%)
Stat. LDA70
75
80
85
90
95
100Classifier comparison (FT)
Classifier
Cla
ssifi
catio
n A
ccur
acy
(%)
Figure 4-2 – Optimal performance for each classifier
Using the results from Table 4-2, the charts in Figure 4-3 show the proportion of
different classifier choices across the SO systems. It is evident from the charts below
that for both movement sets the LDA classifier is most often the optimal choice;
nevertheless, the performance achieved by the statistical classifier is still superior in
some scenarios.
Stat.
LDA
Classifier (4F)
Stat.
LDA
Classifier (FT)
Figure 4-3 – Classifier distribution across SO systems

54
4.5.1.1 Multilayer perceptron
Due to much longer training times, the MLP classifier could not feasibly be tested
as thoroughly as the LDA and the statistical classifiers. Consequently, the MLP
classifier was tested in one classification system per movement set, using element
choices determined for the GO systems (see Section 4.3.1) as shown in Table 4-5.
Table 4-5 – MLP classification systems
Mov
emen
t set
Cla
ssifi
er
DR
met
hod
(red
uced
di
men
sion
s)
Fea
ture
set
Win
dow
di
visi
ons
(ms)
Win
dow
le
ngth
(m
s)
Win
dow
ske
w
(ms)
4F MLP none TD 1 160 -125
FT MLP PCA (48) RMS 7 256 -125
The average classification accuracy was 86.3 ± 7.9 % for the 4F set and 84.1 ±
12.0 % for the FT set. The average computational time for each keystroke classification
was 18.1 ± 0.3 ms for the 4F set and 22.1 ± 0.0 ms for the FT set, resulting in
classification delay times below the accepted limit of 300 ms for prosthetic application
(12). A paired t-test (α=0.05) showed that the MLP systems yielded significantly lower
classification accuracy than the original GO systems for both the 4F (p<0.05) and the FT
(p<0.05) movement sets. Classification accuracy and computational time results for the
MLP systems can be found in Appendices B and C, respectively, for each subject and
exercise.
4.5.2 Dimensionality reduction
The best performing system for each of the three DR methods was determined
and the corresponding classification accuracy values are represented in Figure 4-4. For
the 4F set, the PCA-48 system yielded classification accuracy values significantly
different (p<0.05) from those of the optimal system; however, this was the only case for
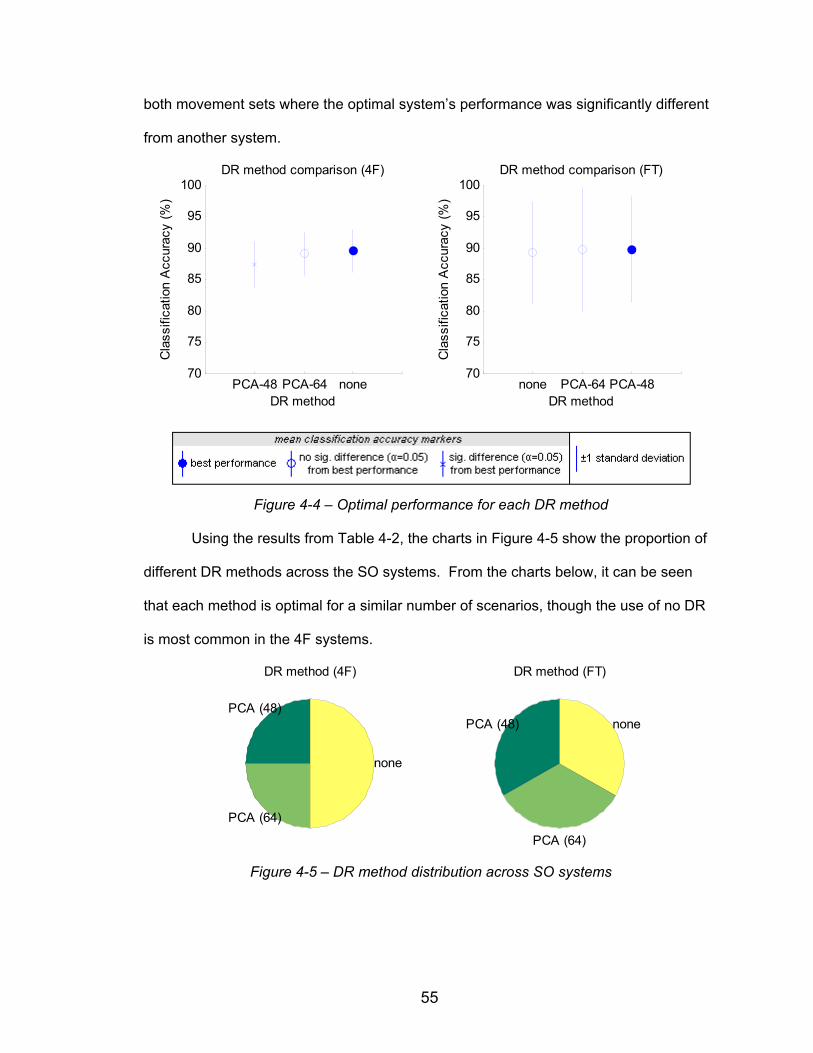
55
both movement sets where the optimal system’s performance was significantly different
from another system.
PCA-48 PCA-64 none70
75
80
85
90
95
100DR method comparison (4F)
DR method
Cla
ssifi
catio
n A
ccur
acy
(%)
none PCA-64 PCA-4870
75
80
85
90
95
100DR method comparison (FT)
DR method
Cla
ssifi
catio
n A
ccur
acy
(%)
Figure 4-4 – Optimal performance for each DR method
Using the results from Table 4-2, the charts in Figure 4-5 show the proportion of
different DR methods across the SO systems. From the charts below, it can be seen
that each method is optimal for a similar number of scenarios, though the use of no DR
is most common in the 4F systems.
PCA (48)
PCA (64)
none
DR method (4F)
PCA (48)
PCA (64)
none
DR method (FT)
Figure 4-5 – DR method distribution across SO systems
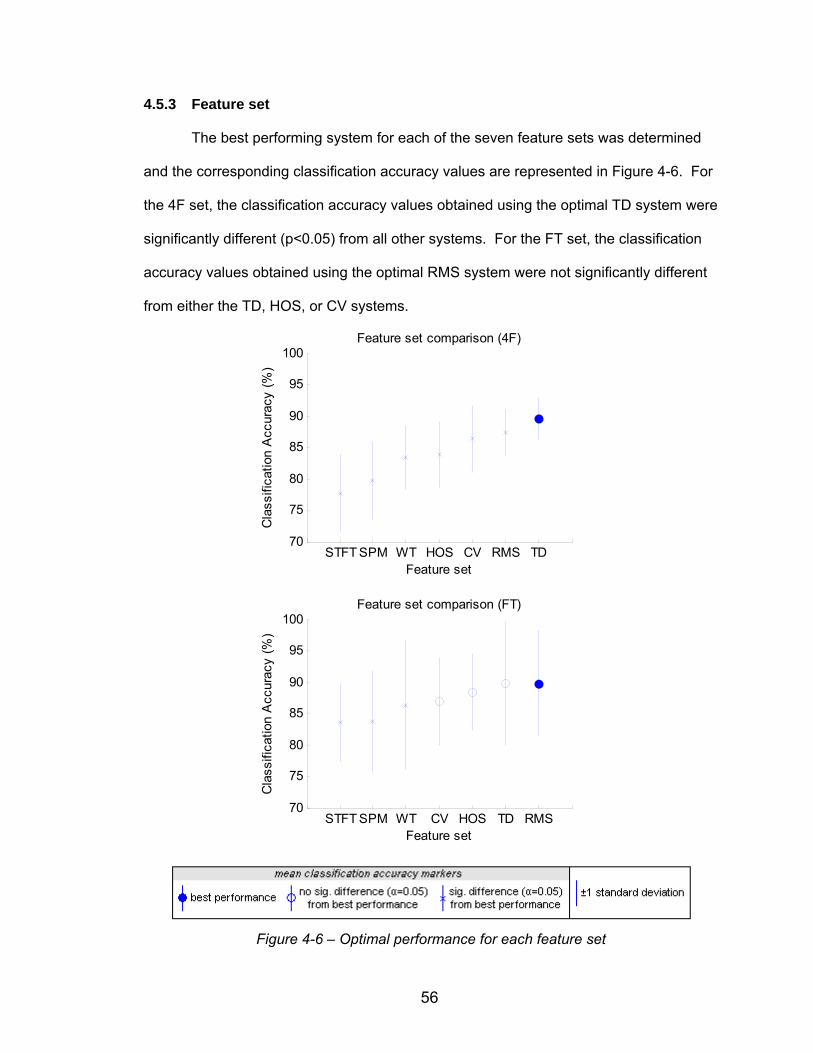
56
4.5.3 Feature set
The best performing system for each of the seven feature sets was determined
and the corresponding classification accuracy values are represented in Figure 4-6. For
the 4F set, the classification accuracy values obtained using the optimal TD system were
significantly different (p<0.05) from all other systems. For the FT set, the classification
accuracy values obtained using the optimal RMS system were not significantly different
from either the TD, HOS, or CV systems.
STFT SPM WT HOS CV RMS TD70
75
80
85
90
95
100Feature set comparison (4F)
Feature set
Cla
ssifi
catio
n A
ccur
acy
(%)
STFT SPM WT CV HOS TD RMS70
75
80
85
90
95
100Feature set comparison (FT)
Feature set
Cla
ssifi
catio
n A
ccur
acy
(%)
Figure 4-6 – Optimal performance for each feature set
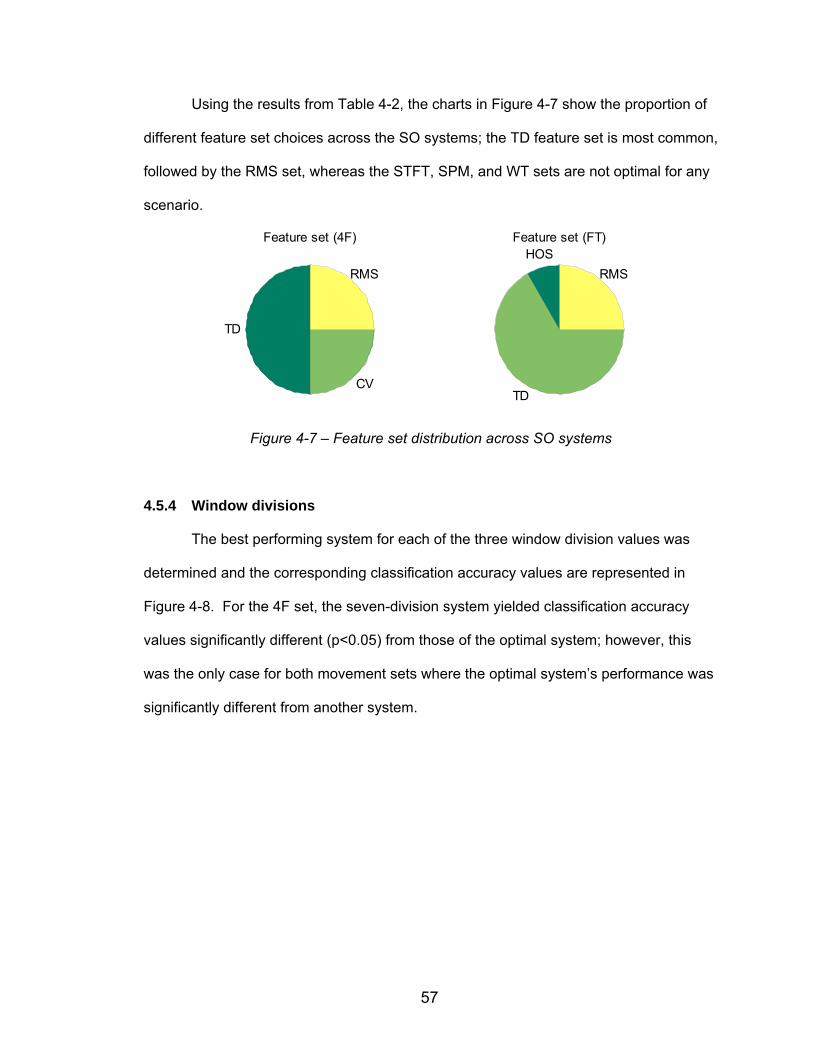
57
Using the results from Table 4-2, the charts in Figure 4-7 show the proportion of
different feature set choices across the SO systems; the TD feature set is most common,
followed by the RMS set, whereas the STFT, SPM, and WT sets are not optimal for any
scenario.
TD
CV
RMS
Feature set (4F)HOS
TD
RMS
Feature set (FT)
Figure 4-7 – Feature set distribution across SO systems
4.5.4 Window divisions
The best performing system for each of the three window division values was
determined and the corresponding classification accuracy values are represented in
Figure 4-8. For the 4F set, the seven-division system yielded classification accuracy
values significantly different (p<0.05) from those of the optimal system; however, this
was the only case for both movement sets where the optimal system’s performance was
significantly different from another system.
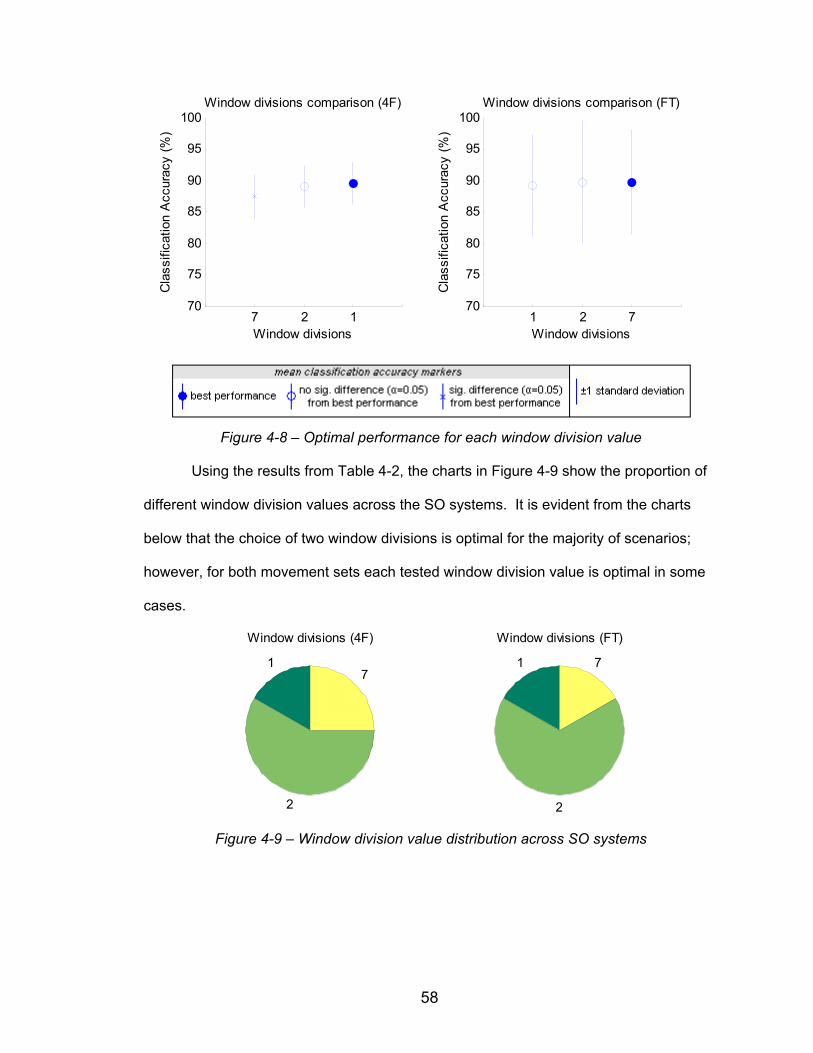
58
7 2 170
75
80
85
90
95
100Window divisions comparison (4F)
Window divisions
Cla
ssifi
catio
n A
ccur
acy
(%)
1 2 770
75
80
85
90
95
100Window divisions comparison (FT)
Window divisions
Cla
ssifi
catio
n A
ccur
acy
(%)
Figure 4-8 – Optimal performance for each window division value
Using the results from Table 4-2, the charts in Figure 4-9 show the proportion of
different window division values across the SO systems. It is evident from the charts
below that the choice of two window divisions is optimal for the majority of scenarios;
however, for both movement sets each tested window division value is optimal in some
cases.
1
2
7
Window divisions (4F)
1
2
7
Window divisions (FT)
Figure 4-9 – Window division value distribution across SO systems
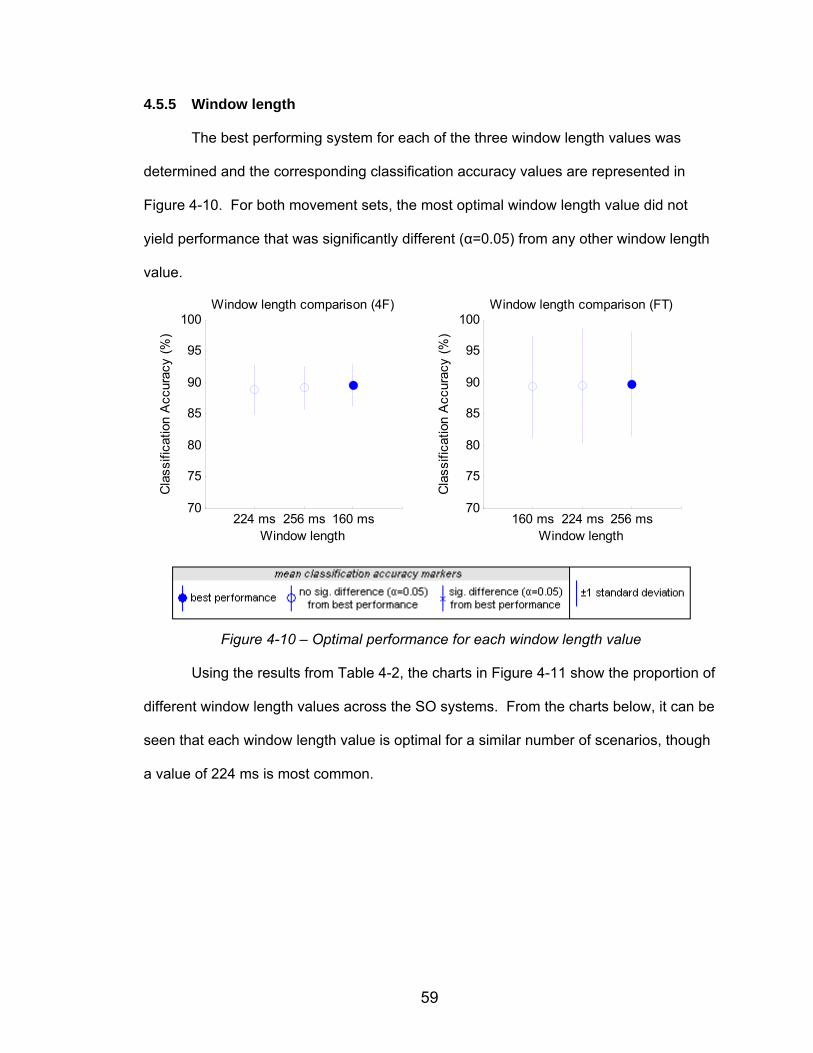
59
4.5.5 Window length
The best performing system for each of the three window length values was
determined and the corresponding classification accuracy values are represented in
Figure 4-10. For both movement sets, the most optimal window length value did not
yield performance that was significantly different (α=0.05) from any other window length
value.
224 ms 256 ms 160 ms70
75
80
85
90
95
100Window length comparison (4F)
Window length
Cla
ssifi
catio
n A
ccur
acy
(%)
160 ms 224 ms 256 ms70
75
80
85
90
95
100Window length comparison (FT)
Window length
Cla
ssifi
catio
n A
ccur
acy
(%)
Figure 4-10 – Optimal performance for each window length value
Using the results from Table 4-2, the charts in Figure 4-11 show the proportion of
different window length values across the SO systems. From the charts below, it can be
seen that each window length value is optimal for a similar number of scenarios, though
a value of 224 ms is most common.
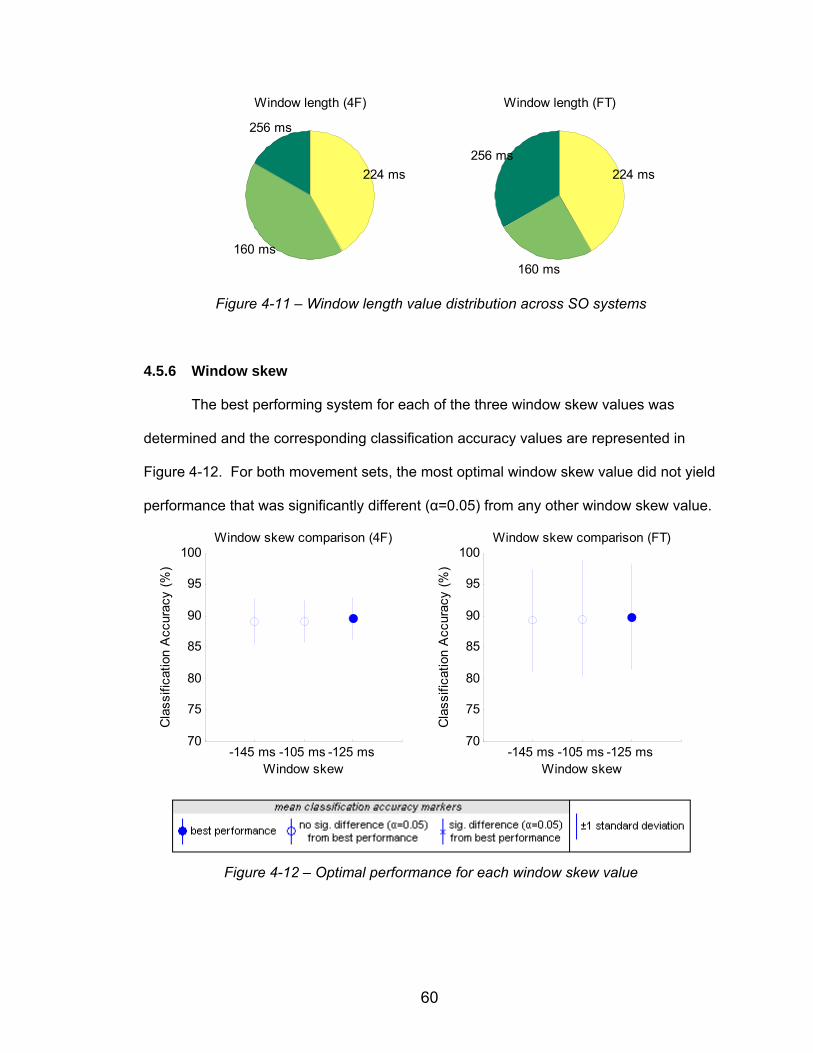
60
256 ms
160 ms
224 ms
Window length (4F)
256 ms
160 ms
224 ms
Window length (FT)
Figure 4-11 – Window length value distribution across SO systems
4.5.6 Window skew
The best performing system for each of the three window skew values was
determined and the corresponding classification accuracy values are represented in
Figure 4-12. For both movement sets, the most optimal window skew value did not yield
performance that was significantly different (α=0.05) from any other window skew value.
-145 ms -105 ms -125 ms70
75
80
85
90
95
100Window skew comparison (4F)
Window skew
Cla
ssifi
catio
n A
ccur
acy
(%)
-145 ms -105 ms -125 ms70
75
80
85
90
95
100Window skew comparison (FT)
Window skew
Cla
ssifi
catio
n A
ccur
acy
(%)
Figure 4-12 – Optimal performance for each window skew value
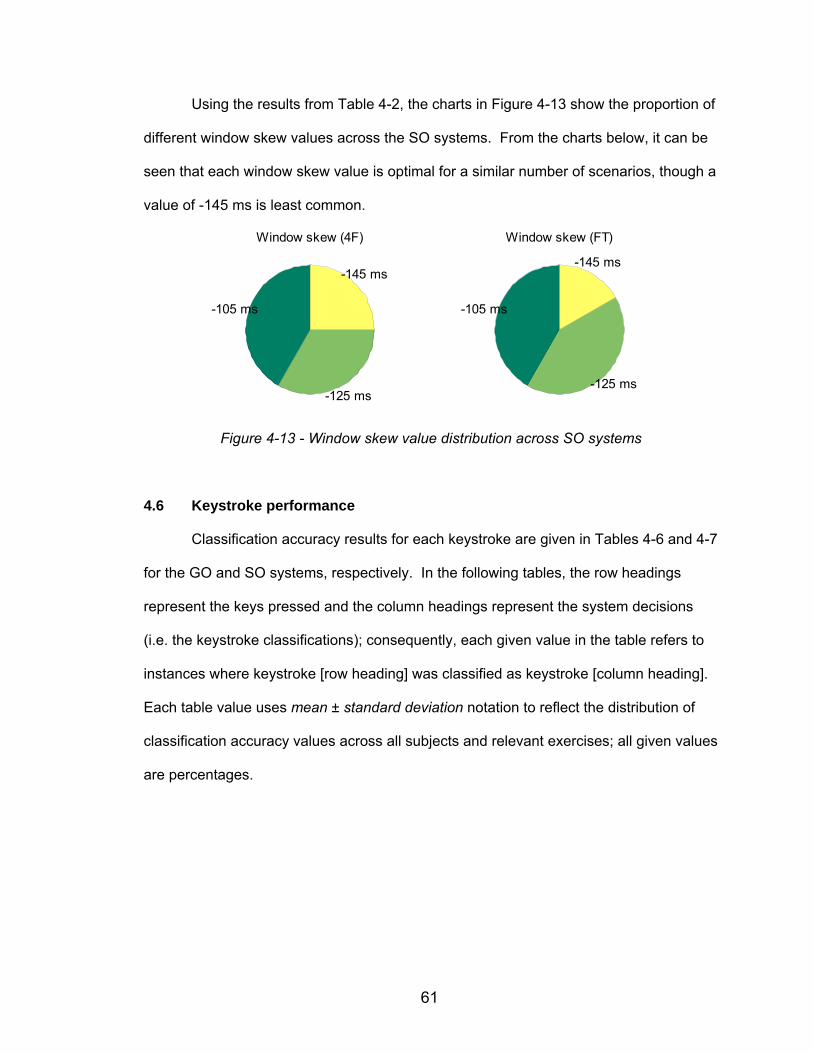
61
Using the results from Table 4-2, the charts in Figure 4-13 show the proportion of
different window skew values across the SO systems. From the charts below, it can be
seen that each window skew value is optimal for a similar number of scenarios, though a
value of -145 ms is least common.
-105 ms
-125 ms
-145 ms
Window skew (4F)
-105 ms
-125 ms
-145 ms
Window skew (FT)
Figure 4-13 - Window skew value distribution across SO systems
4.6 Keystroke performance
Classification accuracy results for each keystroke are given in Tables 4-6 and 4-7
for the GO and SO systems, respectively. In the following tables, the row headings
represent the keys pressed and the column headings represent the system decisions
(i.e. the keystroke classifications); consequently, each given value in the table refers to
instances where keystroke [row heading] was classified as keystroke [column heading].
Each table value uses mean ± standard deviation notation to reflect the distribution of
classification accuracy values across all subjects and relevant exercises; all given values
are percentages.
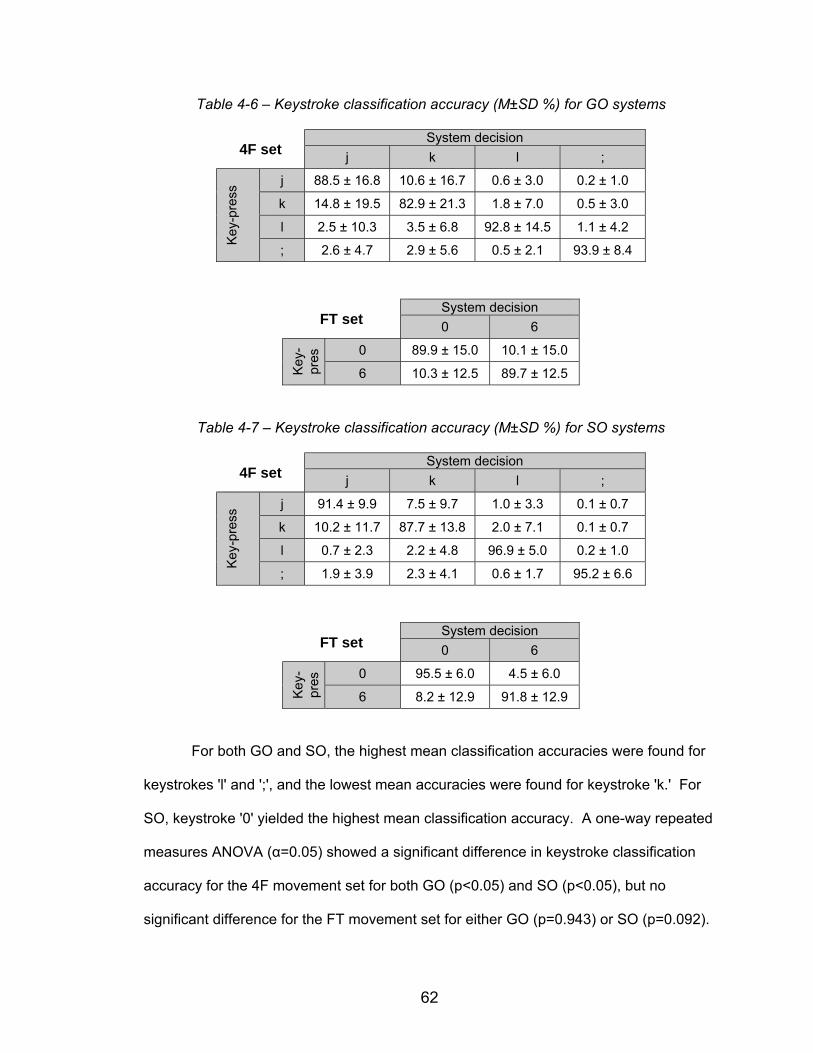
62
Table 4-6 – Keystroke classification accuracy (M±SD %) for GO systems
4F set System decision
j k l ;
Key
-pre
ss j 88.5 ± 16.8 10.6 ± 16.7 0.6 ± 3.0 0.2 ± 1.0
k 14.8 ± 19.5 82.9 ± 21.3 1.8 ± 7.0 0.5 ± 3.0
l 2.5 ± 10.3 3.5 ± 6.8 92.8 ± 14.5 1.1 ± 4.2
; 2.6 ± 4.7 2.9 ± 5.6 0.5 ± 2.1 93.9 ± 8.4
FT set System decision
0 6
Key
-pr
es
0 89.9 ± 15.0 10.1 ± 15.0
6 10.3 ± 12.5 89.7 ± 12.5
Table 4-7 – Keystroke classification accuracy (M±SD %) for SO systems
4F set System decision
j k l ;
Key
-pre
ss j 91.4 ± 9.9 7.5 ± 9.7 1.0 ± 3.3 0.1 ± 0.7
k 10.2 ± 11.7 87.7 ± 13.8 2.0 ± 7.1 0.1 ± 0.7
l 0.7 ± 2.3 2.2 ± 4.8 96.9 ± 5.0 0.2 ± 1.0
; 1.9 ± 3.9 2.3 ± 4.1 0.6 ± 1.7 95.2 ± 6.6
FT set System decision
0 6
Key
-pr
es
0 95.5 ± 6.0 4.5 ± 6.0
6 8.2 ± 12.9 91.8 ± 12.9
For both GO and SO, the highest mean classification accuracies were found for
keystrokes 'l' and ';', and the lowest mean accuracies were found for keystroke 'k.' For
SO, keystroke '0' yielded the highest mean classification accuracy. A one-way repeated
measures ANOVA (α=0.05) showed a significant difference in keystroke classification
accuracy for the 4F movement set for both GO (p<0.05) and SO (p<0.05), but no
significant difference for the FT movement set for either GO (p=0.943) or SO (p=0.092).

63
Post-hoc testing on the 4F results using Tukey's method for multiple comparisons
showed a significant difference between keystrokes [k ;] for GO and between keystrokes
[k l] and [k ;] for SO.

64
Chapter 5
Discussion
5.1 Discussion Optimization approach
In this work, average classification accuracies of 92.8 ± 2.7% for a typing task
involving four fingers, and 93.6 ± 6.1% for a typing task involving the thumb and index
finger, were obtained using a classification system that was optimized for each
subject/task combination. These accuracies are significantly higher (p<0.05) than those
achieved by using a generally optimized classification system, i.e. a system that was
optimized for each task only. Consequently, future prosthetic control applications,
particularly those involving movement of individual digits, could benefit by tailoring the
classification system to each specific user and movement set in the manner
demonstrated in this work.
The subject-specific optimization of classification systems presented in this work
is the first of its kind; the myoelectric classification literature has given focus to
determining GO systems that were tested in the same form across multiple subjects (1-
7,9-12,18-20,26,28). Though these systems did incorporate classifier training for each
subject, element choices were not subject-dependent.
The SO approach used in this study resulted in increased classification accuracy
without significantly affecting the response time or the intuitive nature of the task. Thus,
incorporating individualized classification systems would potentially result in a better
myoelectric control system. However, there are several potential costs to consider,
including increased training time and the need to produce personalized prosthesis
control systems. If a large number of prostheses are to be produced, it may be more
cost-effective to program all control systems with the same classification system than it

65
would be to use a different system for each device. This problem could be alleviated
with the implementation of a microcontroller-based prosthesis control system that allows
for easy programming of the control algorithm.
To train a classification system, examples of myoelectric data corresponding to
each movement (or class) must first be collected from a subject or potential user. Then,
the system's classifier attempts to learn the relationships between the myoelectric data
and the corresponding movements. The SO approach adds one level of complexity to
this general training process: instead of training a single system, this approach involves
training a large number of systems and selecting the system that performs best on a set
of test data. Although overall training time will increase with the number of systems
tested, this increase may not be problematic for several reasons: SO need not occur
more than once per subject; mean classifier training times for all GO and SO systems
presented in this work were in the order of seconds; and the training and testing of
multiple systems can be fully automated, as they were in the current study (see Section
3.6).
Performance relative to the literature
In the finger movement classification studies of Hiraiwa et al. (17), Uchida et al.
(32), and Tsenov et al. (31), classification accuracies of 66.7%, 86%, and 98%,
respectively, were achieved using five movements and one data channel for the former
two studies, and four movements and four data channels for the latter study. For several
reasons, these results are not directly comparable to those obtained in this thesis work:
the systems used by Hiraiwa et al. (17), Uchida et al. (32), and Tsenov et al. (31) were
tested on a single subject only, relatively small data sets were used, and the movements
reported were neither typing nor transient movements. Additionally, each movement set
included at least one gross hand movement (e.g., flexion of all fingers, hand closure,
66
relaxation of hand) and several finger flexion movements (17,31,32); these movements
were less subtle than the typing movements used in this thesis work, and therefore
possibly easier to classify.
Classification accuracies obtained in this thesis work for transient typing
movements were similar to those obtained in the literature for transient arm and gross
hand movements (6,9,10,13,19,28). The similarity of these results indicates an
impressive performance by the proposed SO approach and the element choices
involved, particularly considering the low SNR observed in the collected myoelectric
data. Whereas the average accuracy obtained for the four-movement 4F set in this
study was 92.8 ± 2.7%, optimal values reported in the literature for the classification of
four transient arm movements are 91.2% (19), 93.8% (9), 89.7% (6), 98.0% (10), and
93.2% (28). In each case, multiple subjects and between one and four data channels
were used. For classification of two grip movements, Farry et al. (13) achieved an
accuracy value of 93% using two data channels, however only a single subject was
tested. This is similar to the value of 93.6 ± 6.1% achieved in this thesis work for the
two-movement FT set. Given that fewer than eight data channels were used in the
previous studies (6,9,10,13,19,28), it is possible that the classification accuracy values
achieved in this thesis work may not be compromised by using fewer data channels. In
doing so, classification delay and training times would be reduced.
Element performance
For many classification system elements, several values or methods proved to
be optimal for at least one subject; therefore, for these elements there is no overall clear
best method or value that could be used for every potential user of such a classification
system. Specifically, for DR and for each window characteristic there was no dominant
67
choice implemented in the SO systems. As well, the DR method, the window length,
and the number of window divisions were different between the two GO systems.
The similar performance across most DR methods and window characteristic
values may imply that these particular system elements have the potential to yield high
performance over a wide range of choices. This would suggest that the apparent
differences between these element choices are due to statistical fluctuations, e.g.
substituting PCA-48 for PCA-64 in a SO system does not result in a significant difference
in accuracy. If this can be proven, then the optimization of a classification system for a
specific subject and task could involve fewer element choices and therefore less training
time. The results for the remaining system elements – classifier and feature set –
yielded more significant differences among the different methods tested.
The LDA classifier emerged as the preferred choice in comparison to the
statistical classifier, and in a more limited context, to the MLP classifier. The LDA
classifier was used in both GO systems and 20 of 24 SO systems, however the
statistical classifier did outperform it in 4 of 24 scenarios (see Figures 4-2, 4-3). It
remains to be seen whether the accuracies obtained by these four SO systems are
significantly greater than those obtained using the best possible LDA classification
systems for each of the four scenarios. If no significant differences are present, then
there is no clear advantage to the statistical classifier's use.
The MLP performance in this thesis work was reflective of its performance in the
literature – it performs generally well, but is secondary to the LDA classifier for transient
data classification (9,11). Further testing may be warranted as the MLP did not receive
the same extensive optimization as the other classifiers, due to its very long training
time. Whereas the LDA and statistical classifiers were each tested in 333 different
classification systems, the MLP was tested in only a single system for each movement
set. However, given the lack of promise shown for the MLP classifier in this work, its
68
secondary performance for transient data classification tasks in the literature (9,11), and
the greater effect of feature set choice on classification accuracy (9), further MLP testing
is likely not an optimal route to improving system performance.
The TD, RMS, CV, and HOS feature sets were each selected for at least one SO
system, whereas the SPM, STFT, and WT feature sets were not selected for any SO
systems. The TD set was implemented in the 4F GO system; all other feature sets
produced significantly different results from this optimal system at the α=0.05 level.
Though the RMS set was implemented in the FT GO system, results obtained using the
TD, HOS, and CV feature sets were not significantly different at the α=0.05 level.
Therefore, both GO and SO results indicate that the TD, RMS, CV, and HOS feature
sets perform better than the time-frequency sets (STFT, SPM and WT), and that the TD
feature set performed best overall: it was selected for the 4F GO classification system
and for 14 of 24 SO systems. No advantage to using the frequency and time-frequency
feature sets for this application is evident.
Exclusion of certain features from the TD set has been found in the literature to
have a beneficial effect on classification accuracy (6,11-13,18). Especially given the
good performance of the simple RMS feature set in this study, it is possible that
classification accuracy may improve in some cases when a set comprising fewer time-
domain features is used. To determine if this is the case, future testing of various
subsets of the TD feature set may be useful.
The performance of feature sets found in this thesis work contrasts the trend in
the literature that transient movements are best classified using time-frequency
methods, such as the STFT and various wavelet transforms (2,9,10,20). This
discrepancy may be due to the eight data channels used in the current study as opposed
to the one to four channels commonly used in the literature (1,4,6,7,9-13,17-
21,23,25,26,28,30-34). It may be that more useful information can be drawn from a
69
single data channel using the generally larger time-frequency feature sets (see Table 3-
3), but that more useful information regarding between-channel relationships can be
derived using the smaller TD, RMS, CV, and HOS feature sets. This could explain the
performance achieved in this thesis work since many data channels were used relative
to the literature, and therefore the amount of between-channel information was higher. It
would be advantageous, however, if similar performance could be achieved using fewer
data channels, as lower production costs of prostheses and their control systems may
result. Further testing using subsets of data channels from this thesis work could
address this issue.
Movement set performance
The FT set was not classified significantly better (p<0.05) than the 4F set, as one
might have expected. Two factors that may have contributed to this outcome involve the
particular movements in each set and the manner in which they were executed. Firstly,
the fourth and fifth finger movements unique to the 4F set yielded particularly high
classification accuracy values, consequently raising the average 4F set performance.
Secondly, the FT movements may have yielded lower amplitude muscle bursts because
the subjects adopted a more relaxed hand position, such that they were less inclined to
lift their fingers between keystrokes than for the 4F exercises; this lower movement
intensity may have caused an overall reduction in classification accuracy. Furthermore,
it should be noted that the single movement common to both sets – the second finger
movement – yielded slightly higher classification accuracy for the FT set, as one might
expect for the smaller set; the small size of that difference may be attributed to the lower
intensity of FT movements, as discussed above.

70
Pace, order, and keystroke performance
The classification accuracy values of paced and un-paced exercises were not
significantly different (p=0.806). This result may appear counter-intuitive: it would seem
that the generally faster typing in un-paced exercises would result in more misclassified
movements due to i) the presence of muscle bursts from multiple movements in a single
classification window, and ii) overlapping muscle bursts complicating movement
detection and corresponding classification window placement. However, the results may
be explained by the nature of the exercises and the movement detection method. In un-
paced trials, subjects were instructed to type comfortably but avoid excessive speeds;
consequently, muscle activity bursts likely remained disjoint regardless of pace option
and therefore classification was not compromised. Additionally, the movement detection
method did not determine muscle burst onsets using the myoelectric data, but
referenced classification windows directly to an electrical pulse sent to the data
collection system at each keystroke instance (see Sections 3.4, 3.7); therefore,
classification was also not compromised by movement detection complications.
The significantly different results between ordered and non-ordered exercises
(p<0.05) are likely due to i) differing myoelectric activity levels between exercise types
(i.e. ordered/non-ordered), and ii) more consistent myoelectric burst shapes in ordered
exercises. As subjects used the same finger for 20 repetitions at a time in ordered trials,
they were inclined to keep their other fingers - and consequently their forearm muscles -
more relaxed, resulting in less myoelectric data that was irrelevant to the present
keystroke. Moreover, subjects may have gotten into a rhythm when typing the same key
repetitively, which likely resulted in fewer burst irregularities and thus fewer
misclassifications.
From Tables 4-6 and 4-7 it can be seen that for the 4F set the fourth and fifth
finger movements yielded the highest mean classification accuracy for both optimization
71
schemes, while the third finger yielded the lowest. For the FT set, the mean
classification accuracy of the thumb movement was 3.7% higher than the second finger
movement for SO. Furthermore, there were significant differences in classification
accuracy at the α=0.05 level between keystrokes [k l] and [k ;] under SO and between
keystrokes [k ;] under GO.
Forearm anatomy may help to explain the high classification accuracy values of
the first, fourth, and fifth finger movements relative to the second and third finger
movements. The extensor digiti minimi is a muscle responsible solely for fifth finger
movement that is located superficially in the forearm (27); the consequent proximity of
this muscle to the electrode array may have contributed to the high classification
accuracy values of the ';' keystroke. The abductor pollicis longus and flexor pollicis
longus are muscles responsible for thumb movement and originate at the approximate
position of the electrode array (27); the location of these muscles relative to the
electrode array may have contributed to the high classification accuracy values of the '0'
keystroke. Finally, the flexor digitorum superficialis, which contributes to the movement
of fingers two through five (27), may not always fully lie under the electrode array; the
portions of this muscle responsible for second and third finger movement lie more
distally in the forearm than the portions responsible for fourth and fifth finger movement
(27), possibly contributing to the higher classification accuracy of the 'l' and ';' keystrokes
relative to the 'j' and 'k' keystrokes.
Classification delay
The classification delay for a single movement consisted of the time required for
both data collection (i.e. the window length) and data classification. For all GO and SO
systems, the mean classification delay for each exercise did not exceed the generally
accepted limit of 300 ms (12). Specifically, the maximum window length used was 256

72
ms (see Section 3.7) and the mean computational times for each exercise were all under
11 ms for both GO systems and 23 of 24 SO systems (see Appendix C); the [S09, FT]
SO system involved mean computational times of 44 ms for each exercise, likely due to
the use of the HOS feature set that is implemented in this system only. Regardless,
given the associated window length of 224 ms for this system, the resulting classification
delay was still below the 300 ms limit.
5.2 Limitations Subject considerations
The myoelectric data used to test the classification systems were collected from
normally-limbed subjects. Though this is far more common in the literature (1,4,6,7,9-
13,17-19,21,25,26,28,31,32) than collection from amputee subjects (19,30,33,34), it is
nevertheless a limitation. The target population for the proposed classification approach
is the below-elbow amputee population; therefore, further testing of classification
systems within this population would be an integral step towards useful application in a
prosthesis control system. It is evident that the results achieved in this work are
applicable only to below-elbow prostheses due to the electrode positioning used.
Movement detection
The trigger pulse and window skew used in this work represent the movement
detection element of the classification system; together, these are a form of manual
detection (see Section 2.3). This detection approach was used in order to allow for a
more clear investigation of the effects of window characteristics, feature set, DR method,
and classifier on classification accuracy - without added interference from detection-
based classification error. However, due to the off-line nature of the detection method
used, the classification approach proposed in this study is not immediately applicable to

73
a typical on-line application. Consequently, the determination of an effective on-line
movement detection method, such as automated detection or continuous classification
(see Section 2.3), and its substitution into the proposed approach would allow for testing
in the intended on-line application.
Statistical methods
The statistical methods in this thesis work were used to determine whether
classification accuracy values were significantly different between two or more cases,
though admittedly a more thorough statistical analysis is possible. Further analyses
could be done to determine the main effects and interactions of the different optimization
methods, element choices, movement sets, movements, and exercise characteristics.
The investigation of interaction effects may highlight relationships useful to system
development; for example, determining which feature set works best with the shortest
data window would be beneficial in minimizing classification delay while optimizing
system performance.
Computational time
All computational time values reported in this work could possibly be reduced by
using a computer system dedicated and optimized to the classification task. However,
this potential reduction may hold little value for the proposed approach as all
classification delay values reported were significantly lower than the 300 ms limit (see
Section 5.1).
74
5.3 Recommendations
An alternate approach
The study presented in this thesis involved the thorough optimization of a typing
movement classification system using a variety of classifiers, DR methods, feature sets,
window lengths, window divisions, and window skew values. The aim of this approach
was to cast a wide net; many methods - often drawn from the literature - were tested in
order to optimize a classification system for simple typing tasks. Following this study, a
more tightly-focused approach could further assist in the development of classification
techniques: in particular, investigating the characteristics of myoelectric signals
associated with each keystroke and misclassification. Specifically, where the keystrokes
'j' and 'k' were not classified correctly, they were most often misclassified as one
another; therefore, research into further differentiation of these two movements could
greatly increase overall classification performance.
Further study of element choices
The results of this study showed that there is no clear optimal choice for many
system elements; some elements may be dependent on subject or movement set,
others may perform well over a variety of values. For elements where the latter case is
true, there may be no significant loss to classification accuracy in discarding certain
values from the testing set; in fact, this would drastically reduce the number of systems
tested and consequently the training time. For example, if it can be shown that the
optimal results obtained for each scenario using only a 256 ms classification window are
not significantly worse than those obtained using all three window lengths, the other
window lengths could be discarded; the total number of tested classification systems
would then be cut down by two thirds. Though it would not directly increase
classification accuracy, investigation into elements that yield good performance over a

75
variety of values would both assist in the understanding of optimal element choices and
possibly reduce system training time.
Though many different element choices were implemented in this work, the
investigation of more element choices, such as the hidden Markov model (HMM) (3,4),
Gaussian mixture model (GMM) (18), and fuzzy logic-based (6,21,23) classifiers, may
lead to increased system performance.
Data channels
As discussed in Section 5.1, if fewer data channels can be used without
compromising classification accuracy, then the resulting prosthesis production cost may
be decreased. Furthermore, reducing the number of data channels may actually
improve system performance if data from some channels are unrelated to the physical
movement classified; however, the improvement may not be significant as the classifier
and DR method likely emphasize these channels least already. Discerning the best
electrode positions from the eight-channel array used in this thesis work could also
indicate which muscles yield the most useful myoelectric data for the classification of
typing movements; though this will not directly lead to higher performance, it may assist
in the future design of prostheses and their control systems – and the understanding of
control system function.
Electrode unit placement
Classification accuracy may be increased through the investigation of optimal
electrode unit positions. Several muscles responsible for finger movement lie more
distally in the forearm than the electrode array position used in this thesis work, such as:
the extensor pollicis brevis and extensor pollicis longus, which contribute to thumb
movement (27), the portions of the flexor digitorum superficialis that contribute to second
76
and third finger movement (27), and the extensor indicis which contributes to second
finger movement (27). Therefore, a change in electrode unit placement may yield more
information from these muscles that in turn could increase overall classification
performance. However, the electrode array position implemented in this work was
chosen with the prosthesis user in mind: the muscles listed above may not be present
or functional in these users as a result of amputation or congenital defect, and thus more
distal electrode unit placement may in fact reduce classification accuracy.
Classification delay
The often-referenced 300 ms classification delay limit (12) should not be
considered as a threshold below which all delays are equally acceptable. Lower values
can help compensate for delays contributed by the mechanical action of a prosthesis
and also allow for more rapid movements, such as those involved in typing. Future
investigation into the effects of smaller window lengths on classification accuracy may
help to minimize classification delay without compromising system performance.
5.4 Contributions
This thesis work offers several unique contributions to the field of myoelectric
classification. Perhaps most significant is the large-scale approach to classification
system testing: not only were multiple choices tested for four main system elements, but
the testing involved all possible combinations of these choices. This was done in order
to determine the optimal element choice combinations for the classification of subtle
typing movements.
Large-scale testing allowed for the second main contribution of this work: the
thorough optimization of system element choices for each scenario, allowing systems to
be tailored to individual subjects. The resulting SO systems achieved significantly higher

77
classification accuracies for both movement sets than the corresponding GO systems,
which were optimized for movement set only. Consequently, the implementation of an
SO approach should be considered in future myoelectric classification research and
development.

78
Chapter 6
Conclusion
6.1 Summary and conclusions Motivation and goal
The number of work and life opportunities for a person with an upper limb
amputation or congenital defect is greatly reduced due to the loss of hand and finger
function; therefore, research into myoelectric control for a dexterous prosthesis is of
great value. Consequently, the goal of this thesis work was to determine an effective
approach to finger movement classification in typing tasks using myoelectric data
collected from the forearm.
Results summary
Classification accuracies of 92.8 ± 2.7% for the 4F movement set and 93.6 ±
6.1% for the FT movement set were obtained with acceptable delay using SO, which
were significantly higher values than those obtained using GO (p<0.05). The SO
accuracy values for the 4F and FT sets were comparable to those found in the literature
for transient arm movement classification using four and two movements, respectively.
No significant difference in performance was found between movement sets or paced
and un-paced exercises; however, a significant difference in performance was found
between ordered and non-ordered exercises (p<0.05). Under SO, the classification
accuracies of both fourth and fifth finger keystrokes were significantly higher at the
α=0.05 level than those of third finger keystrokes.
The accuracy values obtained using SO are comparable to those found in the
literature for arm and gross hand movements, where muscle activity is of higher
intensity. Therefore, given the comparatively subtle nature of the finger movements in
79
this thesis work and the resulting low SNR, the level of classification performance
attained is impressive.
Optimal approach
The best-performing classification approach involved element choices optimized
for each subject and movement set. It was clear for both movement sets that a single
overall classification system could not achieve the same level of performance.
Every tested window characteristic value and DR method was optimal for at least
one subject for each movement set. The SPM, STFT and WT feature sets were not
present in any scenario's optimal system, whereas the TD, RMS, CV and HOS feature
sets were each present in at least one. The TD feature set performed best: it was
optimal for the largest number of scenarios and it was implemented in the 4F GO
system. The RMS feature set was optimal for the second largest number of scenarios
and it was implemented in the FT GO system. The MLP classifier showed no advantage
in its limited testing.
Future steps
Several future paths of research have been suggested in this work, most
importantly: integrating an on-line movement detection method into the proposed
classification systems; determining characteristics of the myoelectric signal associated
with different finger movements and misclassifications; and further developing the
proposed classification systems using data collected from the amputee population, for
which the systems are primarily designed.
80
References 1. Al-Assaf, Y., "Surface myoelectric signal analysis: dynamic approaches for
change detection and classification," IEEE Transactions on Biomedical Engineering, vol. 53, no. 11, pp. 2248-2256, Nov. 2006.
2. Chan, A.D.C., Englehart, K., Hudgins, B., Lovely, D.F., "Myo-electric signals to
augment speech recognition," Medical & Biological Engineering & Computing 2001, vol. 39, pp. 500-504, 2001.
3. Chan, A.D.C., Englehart, K., Hudgins, B., Lovely, D.F., "Hidden Markov model
classification of myoelectric signals in speech," IEEE Engineering in Medicine and Biology, vol. 21, no. 5, pp. 143-146, Sep./Oct. 2002.
4. Chan, A.D.C., Englehart, K.B., "Continuous myoelectric control for powered
prostheses using hidden Markov models," IEEE Transactions on Biomedical Engineering, vol. 52, no. 1, pp. 121-124, Jan. 2005.
5. Chan, A.D.C., Englehart, K.B., Hudgins, B., Lovely, D.F., "Multiexpert automatic
speech recognition using acoustic and myoelectric signals," IEEE Transactions on Biomedical Engineering, vol. 53, no. 4, pp. 676-685, Apr. 2006.
6. Chan, F.H.Y., Yang, Y.-S., Lam, F.K., Zhang, Y.-T., Parker, P.A., "Fuzzy EMG
classification for prosthesis control," IEEE Transactions on Rehabilitation Engineering, vol. 8, no. 3, pp. 305-311, Sep. 2000.
7. Chu, J.-U., Moon, I., Mun, M.-S., "A real-time EMG pattern recognition system
based on linear-nonlinear feature projection for a multifunction myoelectric hand," IEEE Transactions on Biomedical Engineering, vol. 53, no. 11, pp. 2232-2239, Nov. 2006.
8. Englehart, K., “Signal representation for classification of the transient myoelectric
signal,” Ph.D. dissertation, Univ. New Brunswick, Fredericton, NB, Canada, 1998.
9. Englehart, K., Hudgins, B., Parker, P.A., Stevenson, M., “Classification of the
myoelectric signal using time-frequency based representations,” Medical Engineering & Physics, vol. 21, no. 6-7, pp. 431-438, Jul. 1999.
10. Englehart, K., Hudgins, B., Parker, P.A., “A wavelet-based continuous
classification scheme for multifunction myoelectric control,” IEEE Transactions on Biomedical Engineering, vol. 48, pp. 302-311, Mar. 2001.
11. Englehart, K., Hudgins, B., Chan, A.D.C., “Continuous multifunction myoelectric
control using pattern recognition,” Technology and Disability, vol. 15, no. 2, pp. 95-103, 2003.
12. Englehart, K., Hudgins, B., “A robust, real-time control scheme for multifunction
myoelectric control,” IEEE Transactions on Biomedical Engineering, vol. 50, no. 7, pp. 848-854, Jul. 2003.
81
13. Farry, K.A., Walker, I.D., Baraniuk, R.G., "Myoelectric teleoperation of a complex robotic hand," IEEE Transactions on Robotics and Automation, vol. 12, no. 5, pp. 775-788, Oct. 1996.
14. Finley, R.R., Wirta, R.W., "Myocoder studies of multiple myocoder response,"
Archives of Physical Medicine and Rehabilitation, vol. 48, pp. 598, 1967. 15. Fukunaga, K., Introduction to statistical pattern recognition. 2nd ed., Academic
Press: San Diego, CA, 1990. 16. Hargrove, L., Englehart, K., Hudgins, B., "A comparison of surface and
intramuscular myoelectric signal classification," IEEE Transactions on Biomedical Engineering, vol. 54, no. 5, pp. 847-853, May 2007.
17. Hiraiwa, A., Shimohara, K., Tokunaga, Y., "EMG pattern analysis and
classification by neural network," Proc. Int. Conf. IEEE Systems, Man and Cybernetics, vol. 3, pp. 1113-1115, 1989.
18. Huang, Y., Englehart, K.B., Hudgins, B., Chan, A.D.C., "A Gaussian mixture
model based classification scheme for myoelectric control of powered upper limb prostheses," IEEE Transactions on Biomedical Engineering, vol. 52, no. 11, pp. 1801-1811, Nov. 2005.
19. Hudgins, B., Parker, P.A., Scott, R., “A new strategy for multifunction myoelectric
control,” IEEE Transactions on Biomedical Engineering, vol. 40, no. 1, pp. 82-94, Jan. 1993.
20. Jorgensen, C., Lee, D.D., Agabon, S., "Sub auditory speech recognition based
on EMG signals," Proceedings of the International Joint Conference on Neural Networks, vol. 4, pp. 3128-3133, Jul. 2003.
21. Karlik, B., Osman Tokhi, M., Alci, M., "A fuzzy clustering neural network
architecture for multifunction upper-limb prosthesis," IEEE Transactions on Biomedical Engineering, vol. 50, no. 11, pp. 1255-1261, Nov. 2003.
22. Lawrence, P., Herberts, P., Kadefors, R., "Experiences with a multifunctional
hand prosthesis controlled by myoelectric patterns," Advances in External Control of Human Extremities, Gavrilovic and Wilson (eds), Etan, Belgrade, pp. 47-65, 1973.
23. Leowinata, S., Hudgins, B., Parker, P.A., “A multi function myoelectric control
strategy using an array of electrodes,” 16th Annual Congress of the International Society Electrophysiology and Kinesiology, Montreal, PQ, Canada, 1998.
24. Lyman, J.H., Freedy, A., and Prior, R., "Fundamental and applied research
related to the design and development of upper-limb externally powered prostheses," Bulletin of Prosthetics Research, pp. 184-195, Spring 1976.
82
25. Matsumura, Y., Mitsukura, Y., Fukumi, M., Akamatsu, N., Yamamoto, Y., Nakaura, K., "Recognition of EMG signal patterns by neural networks," Proceedings of the 9th International Conference on Neural Information Processing (ICONIP '02), vol. 2, pp. 750-754, Nov. 2002.
26. Matsumura, Y., Fukumi, M., Akamatsu, N., Takeda, F., "Wrist EMG pattern
recognition system by neural networks and multiple principal component analysis," Knowledge-Based Intelligent Information and Engineering Systems, LNAI 3213, pp. 891-897, 2004.
27. Moore, K.L., Dalley, A.F., Clinically oriented anatomy. 4th ed., Lippincott,
Williams, and Wilkins: Philadelphia, PA, 1999. 28. Nazarpour, K., Sharafat, A.R., Firoozabadi, S.M.P., "Application of higher order
statistics to surface electromyogram signal classification," IEEE Transactions on Biomedical Engineering, vol. 54, no. 10, pp. 1762-1769, Oct. 2007.
29. Reiter, R., "Eine neu elecktrokunstand," Grenzgebiete der Medicin, vol. 1, no. 4,
pp. 133-135, 1948. 30. Santa-Cruz, M.C., Riso, R.R., Sepulveda, F., "Evaluation of neural network
parameters towards enhanced recognition of naturally evoked EMG for prosthetic hand grasp control," IFESS 2000, Aalborg, Denmark, pp. 436-439, 2000.
31. Tsenov, G., Zeghbib, A.H., Palis, F., Shoylev, N., Mladenov, V., "Neural networks
for online classification of hand and finger movements using surface EMG signals," 8th Seminar on Neural Network Applications in Electrical Engineering (NEUREL 2006), pp. 167-171, Sep. 2006.
32. Uchida, N., Hiraiwa, A., Sonehara, N., Shimohara, K., "EMG pattern recognition
by neural networks for multi fingers control," Proc. Ann. Int. Conf. IEEE Eng. Med. Biol. Soc., vol. 3, pp. 1016-1018, 1992.
33. Zardoshti, M., Wheeler, B.C., Badie, K., Hashemi, R., "Evaluation of EMG
features for movement control of prostheses," Proc. 15th Annu. Int. Conf. IEEE EMBS, vol. 15, no. 3, pp. 1141-1142, 1993.
34. Zardoshti-Kermani, M., Wheeler, B.C., Badie, K., Hashemi, R.M., "EMG feature
evaluation for movement control of upper extremity prostheses," IEEE Transactions on Rehabilitation Engineering, vol. 3, no. 4, pp. 324-333, Dec. 1995.

83
Appendix A
Letter of information and consent
FINGER MOVEMENT PREDICTION USING FOREARM EMG
SIGNALS
Dear _________________ You are being invited to participate in a research study being done at Queen’s University. Please read through this information and consent form to learn more about the study and details of your participation. Feel free to ask questions at any time and note that we will review experimental procedure together as necessary throughout the study. Purpose and Aims of the Study:
The purpose of this study is to develop a system that can predict different finger movements given forearm muscle signals. A well performing system could have direct application in the field of prosthetics, allowing people with amputations or congenital hand control problems to attain dexterous finger control with the use of a prosthesis.
You will be performing several different typing tasks with your right hand. The computer on which you will be typing will record your keystrokes; the muscle activity in your forearm muscles will be recorded on a second computer. This muscle activity, commonly referred to as an electromyogram (EMG) signal, will be detected by small sensors placed around the circumference of your forearm. The recorded EMG and keystroke data will be used to develop a finger movement prediction system, which could be a significant step towards dexterous finger control in prosthetics. Study Preparation:
First, your height, weight, forearm length and circumference will be measured and recorded. You may then be asked to shave a small 1-2" section around your forearm several inches from your elbow so that your muscle signals can be read without interference. Your skin will then be cleaned with rubbing alcohol to improve contact of the sensors. Finally, small sensors will be attached to the skin on your forearm and taped in place.
Procedure:
Sitting at a computer station, you will first be asked to remain relaxed while rest data is collected. Next, you will begin a series of typing exercises. There are two sets of eight exercises in total, and each exercise involves a specific character set, character order and typing pace. During each exercise you will type a series of characters as they appear on the screen. After completing the exercises, you will be asked to perform a set of high force contractions with your hand and individual fingers. Finally, more rest data will be collected and then the electrodes will be removed.

84
Risks of Participation: The risks of participating in this study include skin irritation due to sensitivity
under the EMG sensors and muscle discomfort following the high force contractions. If you experience any unpleasant effects, please report this to the principal investigator immediately. Benefits of Participation:
The results obtained from your data will be used in the development of a dexterous prosthetic control system, which has the potential to benefit those people suffering from upper limb amputation or congenital hand control defects. If you are interested in hearing about the project's final results, enter your e-mail address below and you will be sent a summary.
e-mail: ________________________________
Exclusion Criteria:
You will not be considered for this study if you: have restricted finger mobility or a history of severe finger or hand control
problems; have a history of dizziness, fainting, irregular heartbeat, or severe
headaches; have been diagnosed with carotid or coronary artery disease; have been diagnosed with high blood pressure; have breathing problems; are overweight, such that the forearm muscle signals are of poor quality.
Confidentiality:
Your identity is strictly confidential and will be protected at all times. You will be identified by a subject number, not your name. Recorded information (gender, height, weight, and forearm measurements) will be kept on file under your subject number only. This signed consent form will be available only to the principle researcher. Voluntary Nature of the Study:
Your participation in this study is completely voluntary. You may withdraw from this study at any time without penalty, by indicating to the investigator that you do not wish to continue. Withdrawal of subject by principal investigator:
You may be withdrawn from this study if the investigator feels that you are becoming overly fatigued or uncomfortable because of the tasks required or if you experience arm pain or discomfort during the procedure. Liability:
By signing the consent form, you do NOT waive your legal rights nor release the investigator and sponsors from their legal and professional responsibilities.

85
Subject Statement and Signature: I have read and understand the consent form for this study. The purposes,
procedures and technical language have been explained to me. I have been given sufficient time to consider the above information and to seek advice if I choose to do so. I have had the opportunity to ask questions which have been answered to my satisfaction. I am voluntarily signing this form. If desired, I can receive a copy of this consent form for future reference.
If at any time I have further questions, problems or adverse effects, I can contact the principal investigator, Alex Andrews at 613-453-7747 ([email protected]). If I have any questions regarding my rights as a research subject I can contact Dr. Albert Clark, Chair, Research Ethics Board at 533-6081. ([email protected]). By signing this consent form, I am indicating that I agree to participate in this study. Signature of Subject Date I understand that I may be photographed during the study. By signing below, I give my consent for use of my photograph in publication and presentation of this work, and I understand my identity will be masked in any such publications and presentations. I understand that if I do not sign below, I will not be photographed during the study. Signature of Subject Date By signing this consent form, I confirm that I have carefully explained to the subject the nature of the above research study. I certify that, to the best of my knowledge, the subject understands clearly the nature of the study and the demands, benefits, and risks involved to participants in this study. Signature of Witness Date

86
Appendix B
Classification accuracy results
GO optimization
Exercise: 1 2 3 4 5 6 7 8
Movement set 4F 4F 4F 4F FT FT FT FT
Ordered (O) / Non-ordered (N)
O O N N O O N N
Paced (P) / Un-paced (U) P U P U P U P U
Su
bje
ct
1 85.0 91.3 86.3 91.3 100.0 100.0 95.0 95.0 2 93.8 92.5 57.5 90.0 92.3 90.0 97.4 100.0 3 91.3 97.5 95.0 96.3 87.5 95.0 90.0 80.0 4 93.8 87.5 92.5 91.3 95.0 95.0 97.5 95.0 5 96.2 86.3 96.3 92.5 100.0 87.5 90.0 95.0 6 72.5 96.3 93.8 93.8 75.0 85.0 65.0 80.0 7 86.3 90.0 87.5 75.0 90.0 82.5 87.5 82.5 8 93.8 92.5 90.0 81.3 80.0 97.5 77.5 85.0 9 96.3 82.5 92.4 87.5 82.5 62.5 70.0 77.5
10 91.3 95.0 88.6 92.5 100.0 82.5 87.5 97.5 11 96.3 91.3 88.8 93.8 97.5 100.0 97.5 90.0 12 97.5 98.8 82.5 67.5 100.0 100.0 100.0 100.0
All values are percentages
SO optimization
Exercise: 1 2 3 4 5 6 7 8
Movement set 4F 4F 4F 4F FT FT FT FT
Ordered (O) / Non-ordered (N)
O O N N O O N N
Paced (P) / Un-paced (U) P U P U P U P U
Su
bje
ct
1 88.8 95.0 95.0 98.8 100.0 100.0 100.0 97.5 2 91.3 92.5 93.8 90.0 97.4 90.0 97.4 97.5 3 96.3 98.8 93.8 96.3 92.5 97.5 97.5 77.5 4 96.3 95.0 95.0 95.0 95.0 95.0 97.5 95.0 5 98.7 93.8 95.0 91.3 100.0 100.0 100.0 95.0 6 88.8 85.0 98.8 95.0 85.0 87.5 67.5 87.5 7 93.8 88.8 82.5 81.3 90.0 95.0 90.0 75.0 8 93.8 92.5 90.0 81.3 77.5 100.0 80.0 100.0 9 96.3 90.0 96.2 90.0 97.5 80.0 87.5 82.5
10 96.3 87.5 91.1 95.0 100.0 95.0 100.0 100.0 11 95.0 98.8 90.0 95.0 100.0 97.5 100.0 97.5 12 93.8 97.5 92.5 87.5 100.0 100.0 100.0 100.0
All values are percentages

87
MLP classification
Exercise: 1 2 3 4 5 6 7 8
Movement set 4F 4F 4F 4F FT FT FT FT
Ordered (O) / Non-ordered (N)
O O N N O O N N
Paced (P) / Un-paced (U) P U P U P U P U
Su
bje
ct
1 80.0 91.3 78.8 86.3 100.0 95.0 92.5 92.5 2 91.3 92.5 63.8 93.8 84.6 92.5 84.6 100.0 3 98.8 97.5 88.8 97.5 70.0 82.5 77.5 75.0 4 87.5 86.3 91.3 86.3 95.0 95.0 92.5 90.0 5 87.3 87.5 88.8 96.3 90.0 95.0 82.5 85.0 6 82.5 88.8 95.0 88.8 67.5 62.5 55.0 85.0 7 76.3 86.3 80.0 60.0 80.0 85.0 65.0 77.5 8 88.8 87.5 88.8 75.0 75.0 95.0 65.0 70.0 9 88.8 88.8 78.5 78.8 72.5 57.5 67.5 80.0
10 86.3 83.8 84.8 83.8 97.5 82.5 90.0 92.5 11 98.8 97.5 86.3 90.0 97.5 92.5 87.5 80.0 12 76.3 82.5 87.5 81.3 92.5 97.5 100.0 95.0
All values are percentages
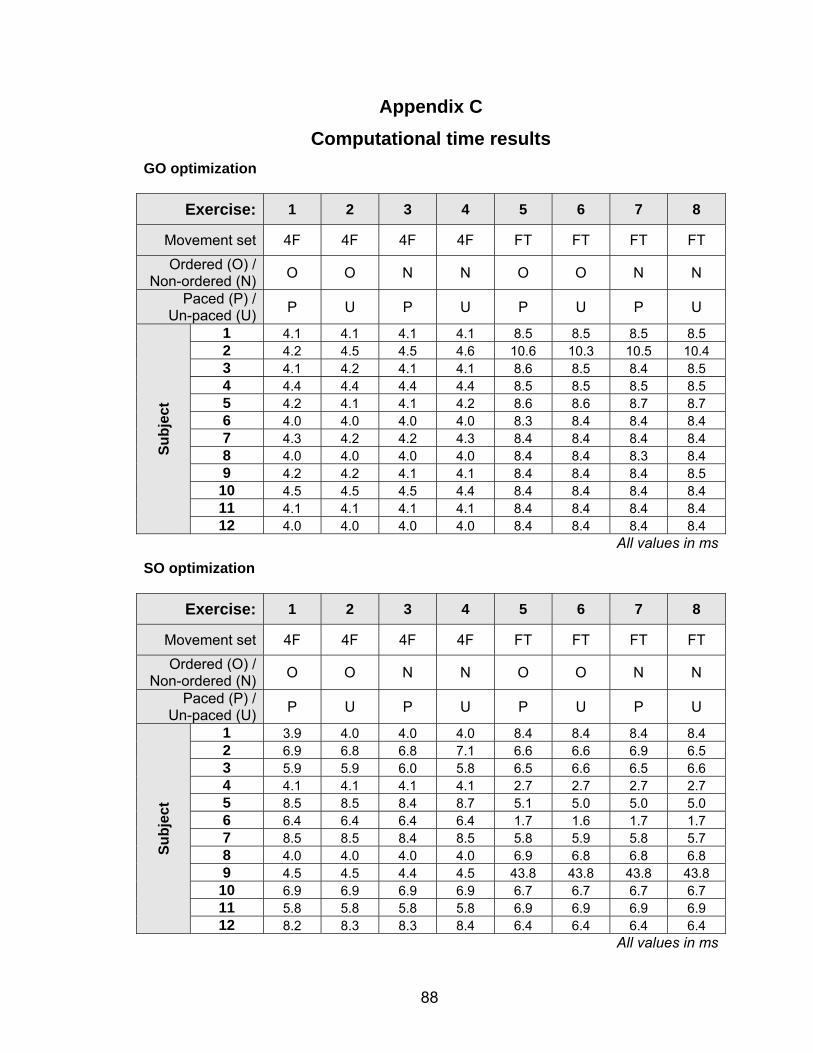
88
Appendix C
Computational time results
GO optimization
Exercise: 1 2 3 4 5 6 7 8
Movement set 4F 4F 4F 4F FT FT FT FT
Ordered (O) / Non-ordered (N)
O O N N O O N N
Paced (P) / Un-paced (U) P U P U P U P U
Su
bje
ct
1 4.1 4.1 4.1 4.1 8.5 8.5 8.5 8.5 2 4.2 4.5 4.5 4.6 10.6 10.3 10.5 10.4 3 4.1 4.2 4.1 4.1 8.6 8.5 8.4 8.5 4 4.4 4.4 4.4 4.4 8.5 8.5 8.5 8.5 5 4.2 4.1 4.1 4.2 8.6 8.6 8.7 8.7 6 4.0 4.0 4.0 4.0 8.3 8.4 8.4 8.4 7 4.3 4.2 4.2 4.3 8.4 8.4 8.4 8.4 8 4.0 4.0 4.0 4.0 8.4 8.4 8.3 8.4 9 4.2 4.2 4.1 4.1 8.4 8.4 8.4 8.5
10 4.5 4.5 4.5 4.4 8.4 8.4 8.4 8.4 11 4.1 4.1 4.1 4.1 8.4 8.4 8.4 8.4 12 4.0 4.0 4.0 4.0 8.4 8.4 8.4 8.4
All values in ms
SO optimization
Exercise: 1 2 3 4 5 6 7 8
Movement set 4F 4F 4F 4F FT FT FT FT
Ordered (O) / Non-ordered (N)
O O N N O O N N
Paced (P) / Un-paced (U) P U P U P U P U
Su
bje
ct
1 3.9 4.0 4.0 4.0 8.4 8.4 8.4 8.4 2 6.9 6.8 6.8 7.1 6.6 6.6 6.9 6.5 3 5.9 5.9 6.0 5.8 6.5 6.6 6.5 6.6 4 4.1 4.1 4.1 4.1 2.7 2.7 2.7 2.7 5 8.5 8.5 8.4 8.7 5.1 5.0 5.0 5.0 6 6.4 6.4 6.4 6.4 1.7 1.6 1.7 1.7 7 8.5 8.5 8.4 8.5 5.8 5.9 5.8 5.7 8 4.0 4.0 4.0 4.0 6.9 6.8 6.8 6.8 9 4.5 4.5 4.4 4.5 43.8 43.8 43.8 43.8
10 6.9 6.9 6.9 6.9 6.7 6.7 6.7 6.7 11 5.8 5.8 5.8 5.8 6.9 6.9 6.9 6.9 12 8.2 8.3 8.3 8.4 6.4 6.4 6.4 6.4
All values in ms
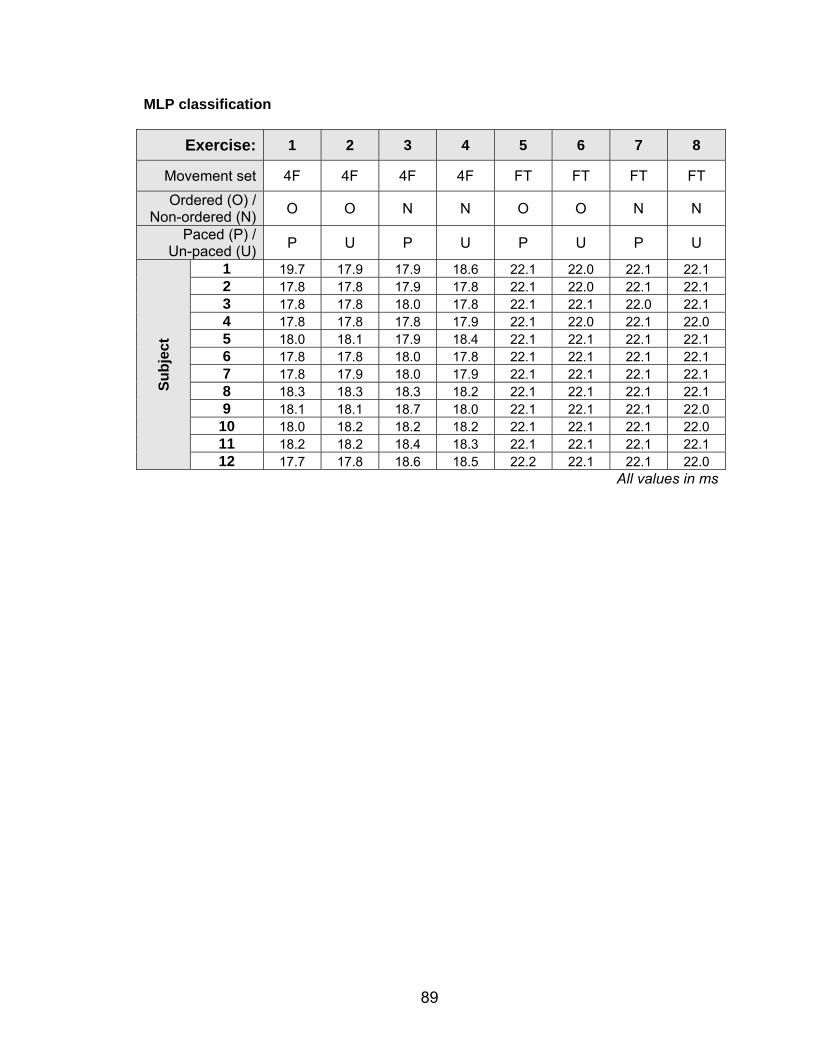
89
MLP classification
Exercise: 1 2 3 4 5 6 7 8
Movement set 4F 4F 4F 4F FT FT FT FT
Ordered (O) / Non-ordered (N)
O O N N O O N N
Paced (P) / Un-paced (U) P U P U P U P U
Su
bje
ct
1 19.7 17.9 17.9 18.6 22.1 22.0 22.1 22.1 2 17.8 17.8 17.9 17.8 22.1 22.0 22.1 22.1 3 17.8 17.8 18.0 17.8 22.1 22.1 22.0 22.1 4 17.8 17.8 17.8 17.9 22.1 22.0 22.1 22.0 5 18.0 18.1 17.9 18.4 22.1 22.1 22.1 22.1 6 17.8 17.8 18.0 17.8 22.1 22.1 22.1 22.1 7 17.8 17.9 18.0 17.9 22.1 22.1 22.1 22.1 8 18.3 18.3 18.3 18.2 22.1 22.1 22.1 22.1 9 18.1 18.1 18.7 18.0 22.1 22.1 22.1 22.0
10 18.0 18.2 18.2 18.2 22.1 22.1 22.1 22.0 11 18.2 18.2 18.4 18.3 22.1 22.1 22.1 22.1 12 17.7 17.8 18.6 18.5 22.2 22.1 22.1 22.0
All values in ms

90
Appendix D
Terminology
Classification system: The classification system, as it is referred to in this work,
comprises a set of methods and values that together function to detect and classify
physical movements using a myoelectric signal. Though the classification system
normally comprises five different elements (see Figure 2-1), this study focuses on the
following four:
classifier
dimensionality reduction (DR) method
feature set
window characteristics (number of divisions, window length, window skew)
Below is an example of a classification system tested in this thesis work.
LDA, PCA-48, RMS, 7, 256 ms, -125 ms
classifier DR method feature set # of window window divisions length skew
---------- window characteristics ---------
Element: An element refers to one of the defining components of the classification
system, such as the classifier type or window length (see Figure 2-1).
Scenario: A specific combination of subject and movement set, such as [S02, 4F] or
[S11, FT], is referred to as a scenario. As twelve subjects and two movement sets were
involved in this study, there were a total of 24 scenarios.

![INDEX [microdentsystem.com] · 2015-11-24 · INDEX PRESENTATION. INTRODUCTION MULTIPLE PROSTHESIS. REMOVABLE AND IMMEDIATE PROSTHESIS. SINGLE PROSTHESIS CEMENTED PROSTHESIS. Microdent](https://img.pdfslide.net/doc/110x75/5facd9ee77a5ed547a36b19c/index-2015-11-24-index-presentation-introduction-multiple-prosthesis-removable.jpg)