Embed Size (px)
Citation preview
Lehigh UniversityLehigh Preserve
Theses and Dissertations
2015
Finite Element Modeling of Impact-GeneratedStress Wave Propagation in Concrete Plates forNon-Destructive EvaluationTripti PradhanLehigh University
Follow this and additional works at: http://preserve.lehigh.edu/etd
Part of the Civil and Environmental Engineering Commons
This Thesis is brought to you for free and open access by Lehigh Preserve. It has been accepted for inclusion in Theses and Dissertations by anauthorized administrator of Lehigh Preserve. For more information, please contact [email protected].
Recommended CitationPradhan, Tripti, "Finite Element Modeling of Impact-Generated Stress Wave Propagation in Concrete Plates for Non-DestructiveEvaluation" (2015). Theses and Dissertations. Paper 1597.
FINITE ELEMENT MODELING OF IMPACT-GENERATED STRESS WAVE
PROPAGATION IN CONCRETE PLATES FOR NON-DESTRUCTIVE
EVALUATION
By
Tripti Pradhan
A Thesis
Presented to the Graduate and Research Committee
of Lehigh University
in Candidacy for the Degree of
Master of Science
in
Civil and Environmental Engineering
Lehigh University
November 2014
ii
This thesis is accepted and approved in partial fulfillment of the requirements for the
Master of Science in Structural Engineering.
_______________________
Date
Professor Stephen Pessiki
Dr. Wesley Keller
Professor Panos Diplas

iii
ACKNOWLEDGMENTS
The author gratefully acknowledges the encouragement, guidance and support provided
by her research advisors Dr. Stephen Pessiki and Dr. Wesley Keller throughout the
duration of this research.
The author would also like to thank Mr. Peter Bryan for providing his technical support
for performing the finite element analyses. Above all, the author would like to thank her
family and friends for their unwavering faith and continuous support which made this
work possible.
The opinions, findings, and conclusions expressed in this thesis report are those of the
author and do not necessarily reflect the views of the Department of Civil and
Environmental Engineering at Lehigh University or of the individuals acknowledged
above.
iv
TABLE OF CONTENTS
ABSTRACT .........................................................................................................................1
1. INTRODUCTION ........................................................................................................3
1.1 Introduction .......................................................................................................... 3
1.2 Research Objectives ............................................................................................. 5
1.3 Scope of the Project .............................................................................................. 6
1.4 Summary of Findings ........................................................................................... 7
2. BACKGROUND ........................................................................................................13
2.1 Elastic Stress Waves in Solids ............................................................................ 13
2.1.1 Energy and Velocity of Stress Waves ....................................................... 15
2.1.2 Behavior of Stress waves in Layers and Interfaces .................................. 16
2.1.3 Scattering, Divergence and Attenuation ................................................... 17
2.2 Impact-echo Method ........................................................................................... 18
2.2.1 Impact ....................................................................................................... 19
2.2.2 Waveforms ................................................................................................ 21
2.2.3 Frequency Domain Analysis ..................................................................... 22
3. FINITE ELEMENT MODELING OF IMPACT-ECHO TESTING ..........................28
3.1 Introduction ........................................................................................................ 28
3.2 Impact Load ........................................................................................................ 29
3.3 Element Type ...................................................................................................... 30
3.4 Spatial and Temporal Discretization .................................................................. 30
3.5 Numerical Time-Stepping Methods for Simulating Dynamic Response ........... 31
v
3.5.1 Implicit vs. Explicit Algorithm ................................................................. 32
3.5.2 Stability Analysis ...................................................................................... 33
3.6 Non-reflecting and Absorbing Boundary Conditions ......................................... 34
3.6.1 Absorbing Layer with Increased Damping ............................................... 35
3.7 Wave Propagation in Bounded Solids ................................................................ 36
3.7.1 Foundation Layer Approach for Bounded Solids ..................................... 36
3.7.2 Modes of Vibration ................................................................................... 37
3.7.2.1 Single Degree of Freedom Approximation .......................................... 37
3.7.2.2 Eigenvalue Analysis ............................................................................. 38
4. PARAMETRIC STUDY OF IMPACT ECHO MODELING PARAMETERS FOR
CONCRETE SLAB EVALUATION .........................................................................44
4.1 Introduction ........................................................................................................ 44
4.2 Analysis Matrix .................................................................................................. 45
4.2.1 Impact Force-Time Function .................................................................... 45
4.2.2 Impact Force Distribution ......................................................................... 46
4.2.3 Impact Location ........................................................................................ 47
4.2.4 Mechanical Boundary Condition .............................................................. 47
4.2.4.1 Clamped Section .................................................................................. 48
4.2.4.2 Absorbing Layer with Increased Damping .......................................... 48
4.2.4.3 Foundation Layer ................................................................................ 49
4.2.5 Foundation Layer Properties ..................................................................... 49
4.2.5.1 Stiffness ................................................................................................ 49
4.2.5.2 Acoustic Impedance ............................................................................. 50
vi
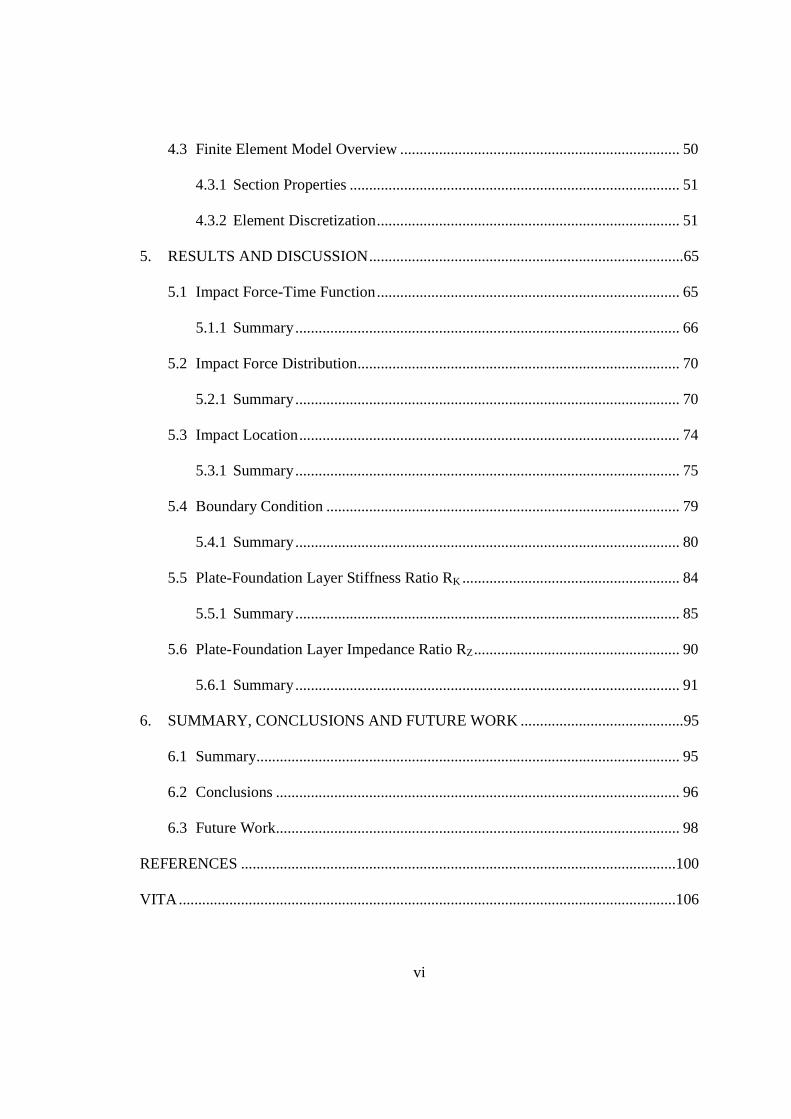
4.3 Finite Element Model Overview ........................................................................ 50
4.3.1 Section Properties ..................................................................................... 51
4.3.2 Element Discretization .............................................................................. 51
5. RESULTS AND DISCUSSION .................................................................................65
5.1 Impact Force-Time Function .............................................................................. 65
5.1.1 Summary ................................................................................................... 66
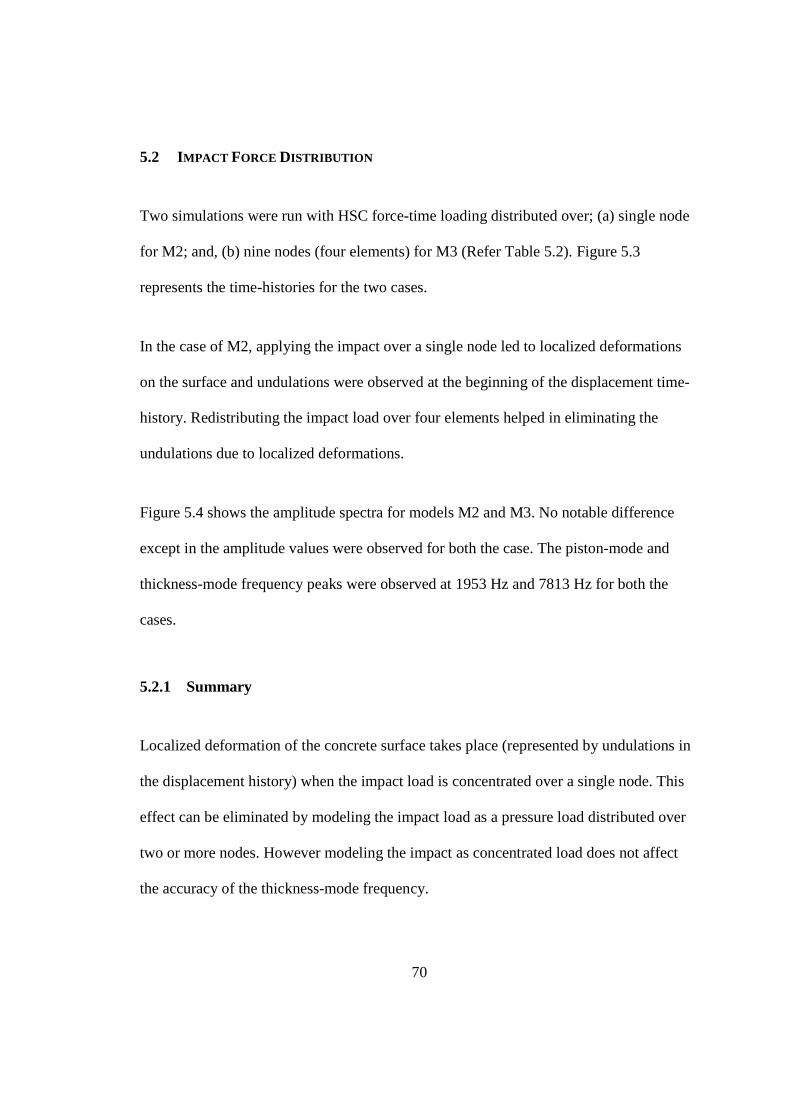
5.2 Impact Force Distribution ................................................................................... 70
5.2.1 Summary ................................................................................................... 70
5.3 Impact Location .................................................................................................. 74
5.3.1 Summary ................................................................................................... 75
5.4 Boundary Condition ........................................................................................... 79
5.4.1 Summary ................................................................................................... 80
5.5 Plate-Foundation Layer Stiffness Ratio RK ........................................................ 84
5.5.1 Summary ................................................................................................... 85
5.6 Plate-Foundation Layer Impedance Ratio RZ ..................................................... 90
5.6.1 Summary ................................................................................................... 91
6. SUMMARY, CONCLUSIONS AND FUTURE WORK ..........................................95
6.1 Summary ............................................................................................................. 95
6.2 Conclusions ........................................................................................................ 96
6.3 Future Work ........................................................................................................ 98
REFERENCES ................................................................................................................100
VITA ................................................................................................................................106
vii
LIST OF TABLES
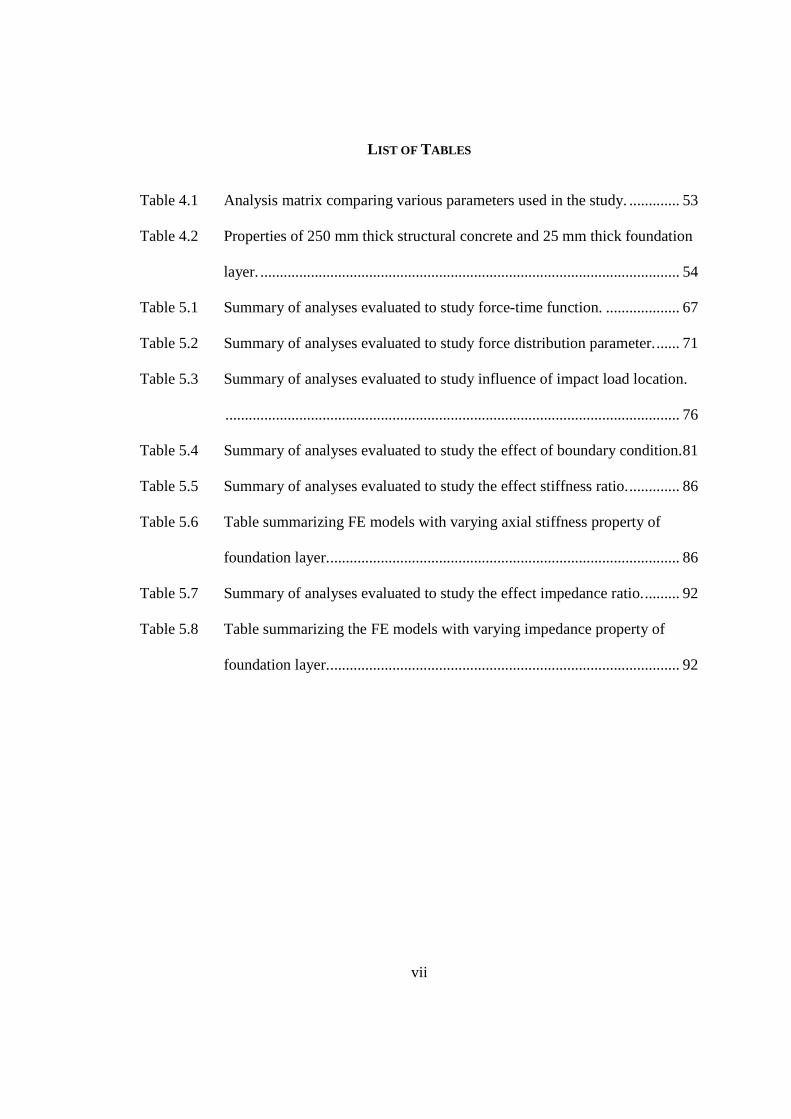
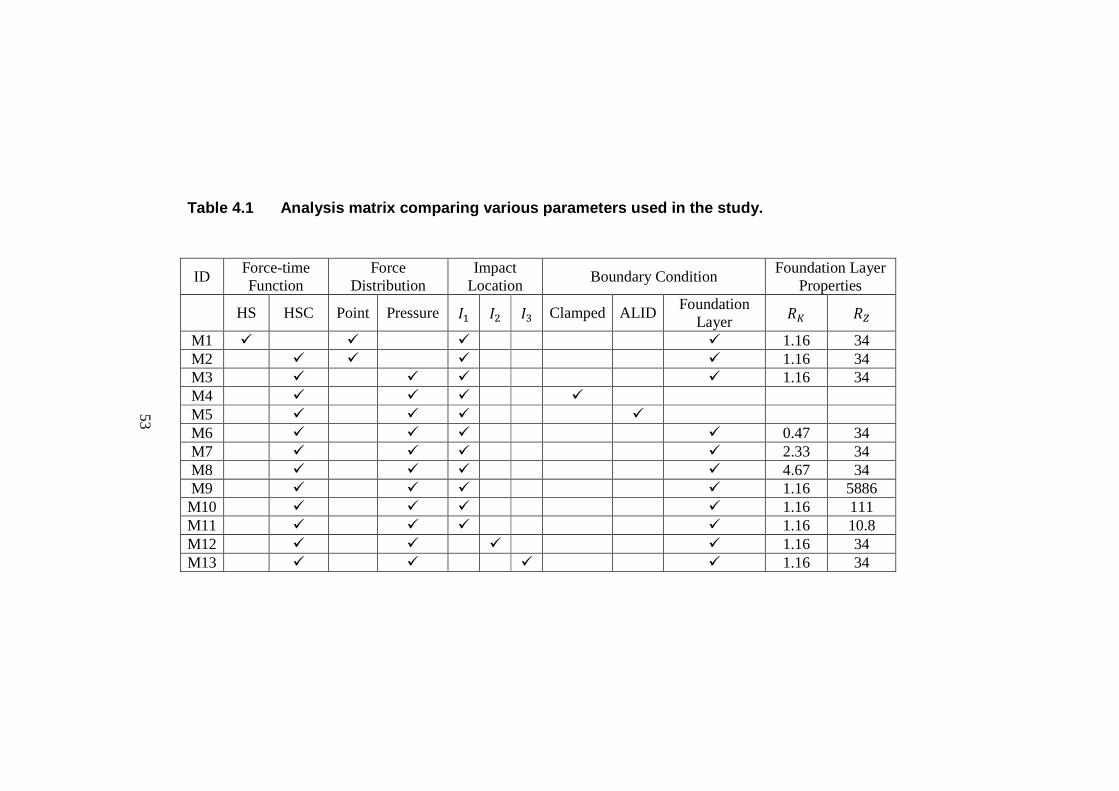
Table 4.1 Analysis matrix comparing various parameters used in the study. ............. 53
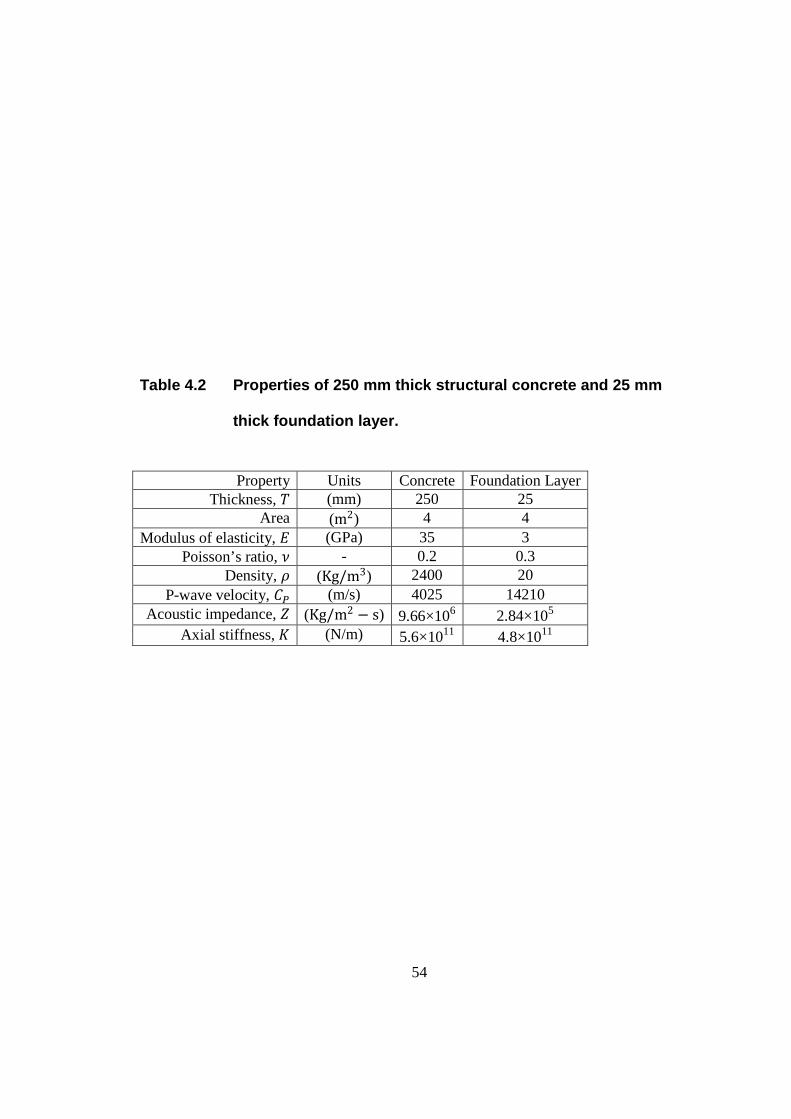
Table 4.2 Properties of 250 mm thick structural concrete and 25 mm thick foundation
layer. ............................................................................................................ 54
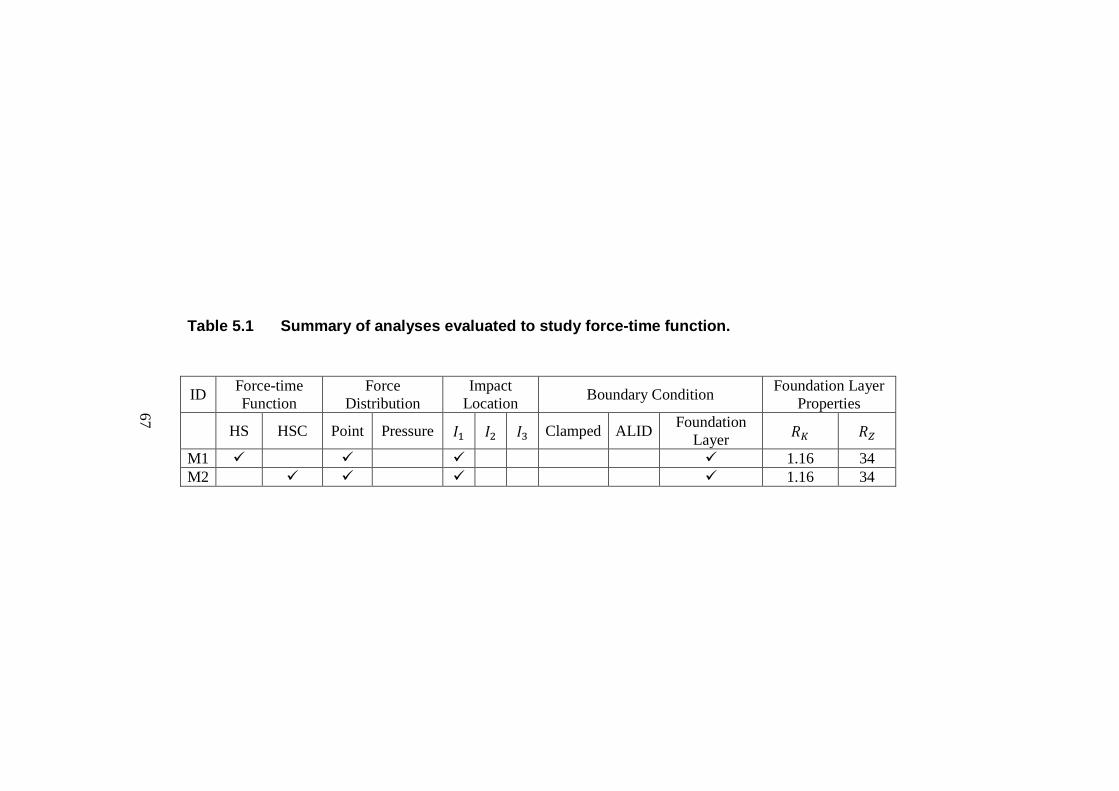
Table 5.1 Summary of analyses evaluated to study force-time function. ................... 67
Table 5.2 Summary of analyses evaluated to study force distribution parameter. ...... 71
Table 5.3 Summary of analyses evaluated to study influence of impact load location.
..................................................................................................................... 76
Table 5.4 Summary of analyses evaluated to study the effect of boundary condition. 81
Table 5.5 Summary of analyses evaluated to study the effect stiffness ratio. ............. 86
Table 5.6 Table summarizing FE models with varying axial stiffness property of
foundation layer. .......................................................................................... 86
Table 5.7 Summary of analyses evaluated to study the effect impedance ratio. ......... 92
Table 5.8 Table summarizing the FE models with varying impedance property of
foundation layer. .......................................................................................... 92
viii
LIST OF FIGURES
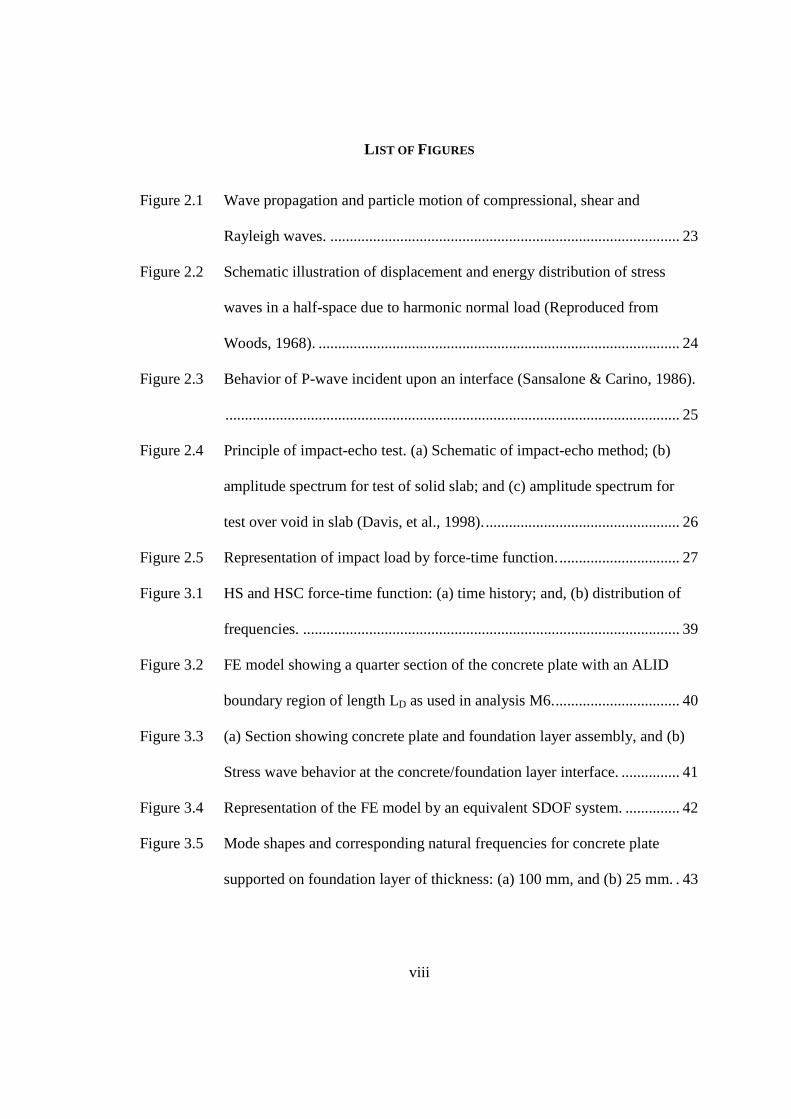
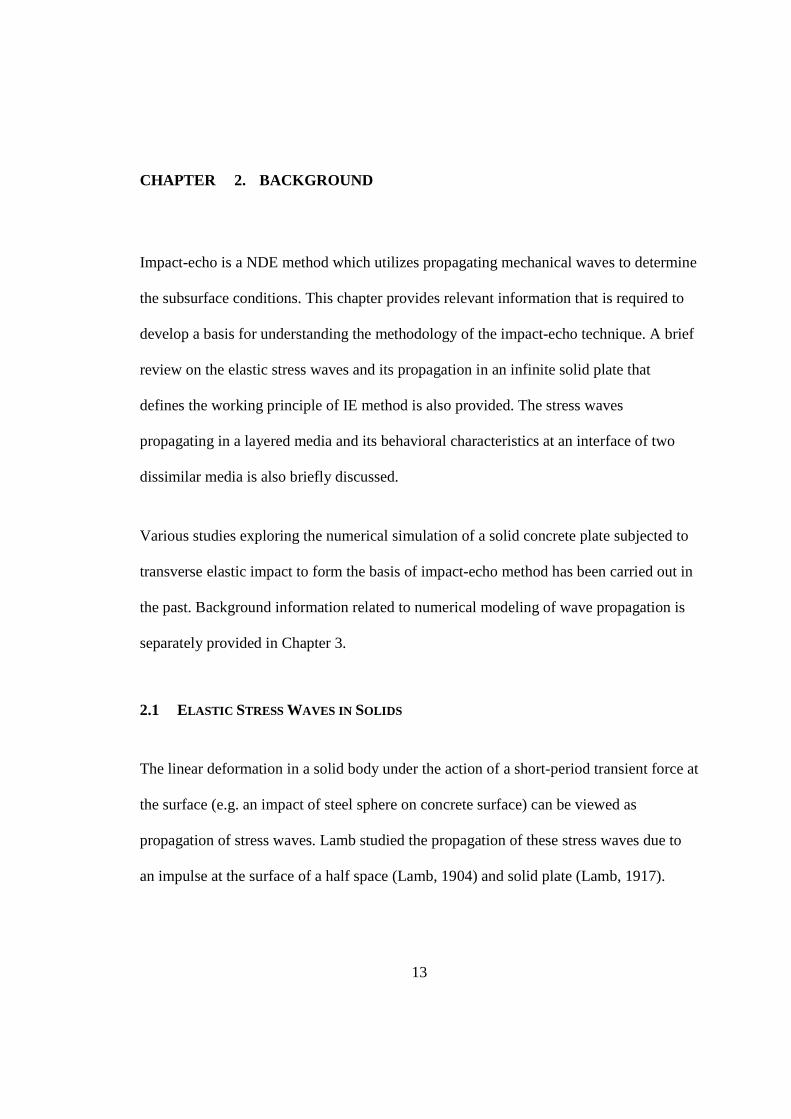
Figure 2.1 Wave propagation and particle motion of compressional, shear and
Rayleigh waves. .......................................................................................... 23
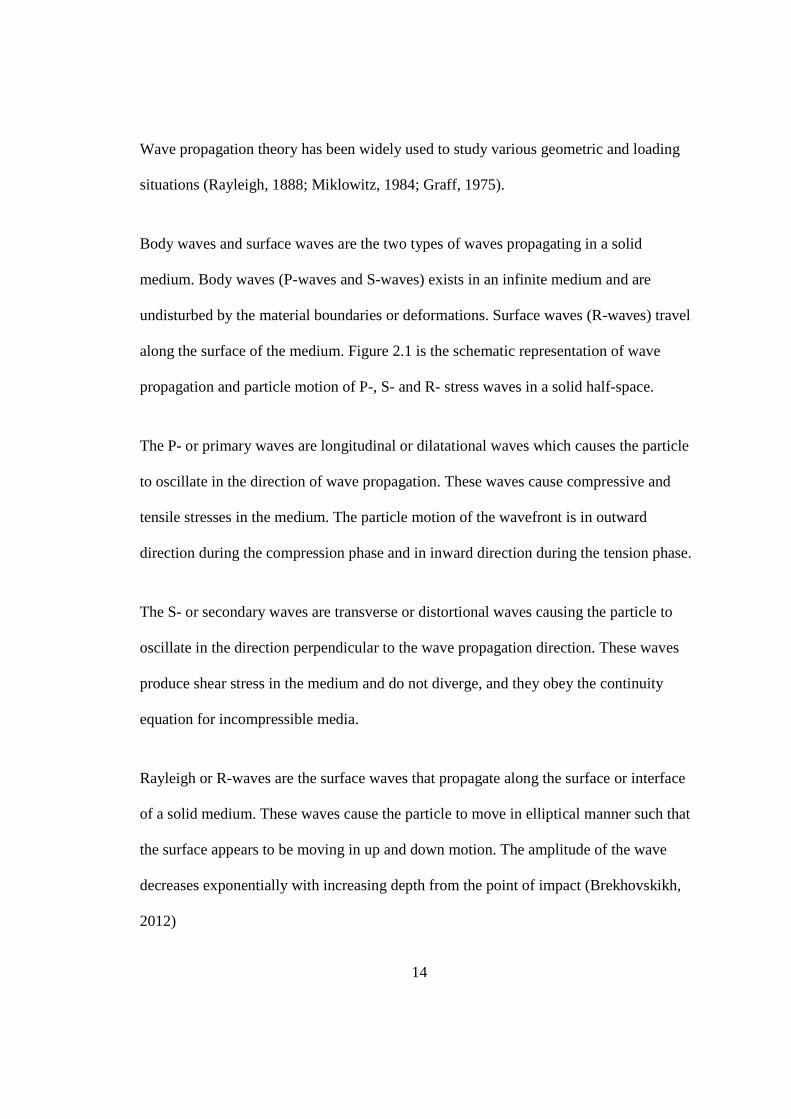
Figure 2.2 Schematic illustration of displacement and energy distribution of stress
waves in a half-space due to harmonic normal load (Reproduced from
Woods, 1968). ............................................................................................. 24
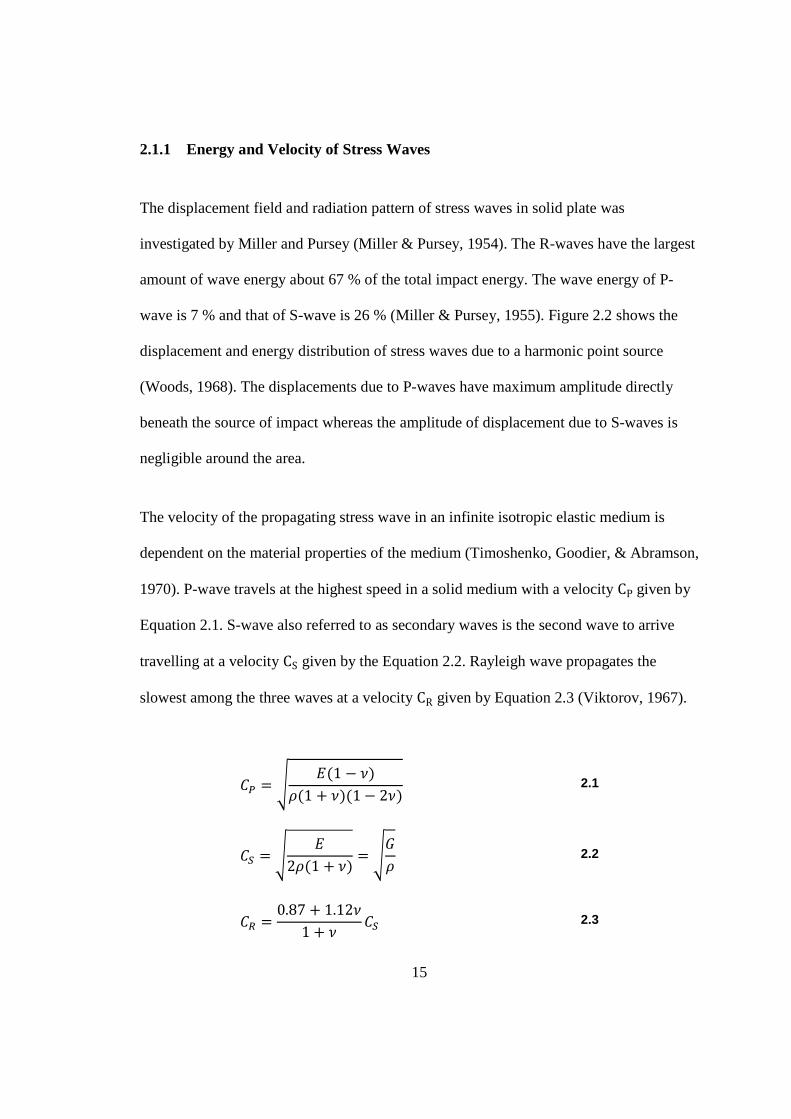
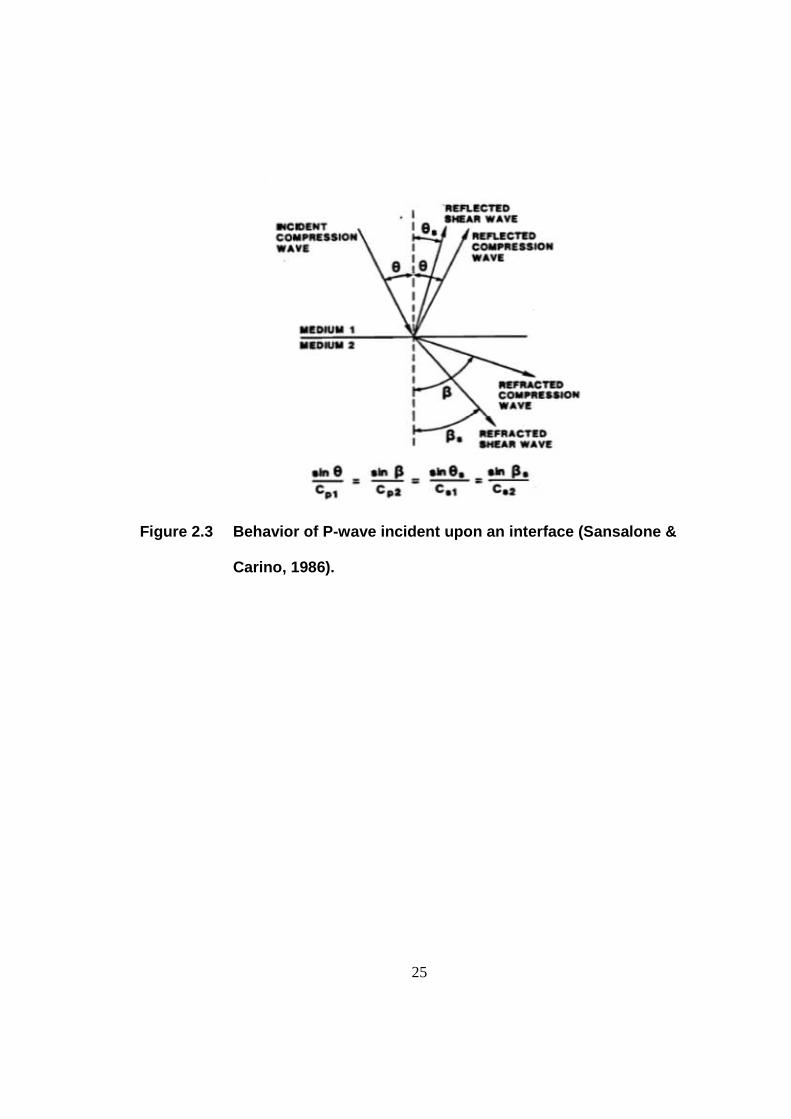
Figure 2.3 Behavior of P-wave incident upon an interface (Sansalone & Carino, 1986).
..................................................................................................................... 25
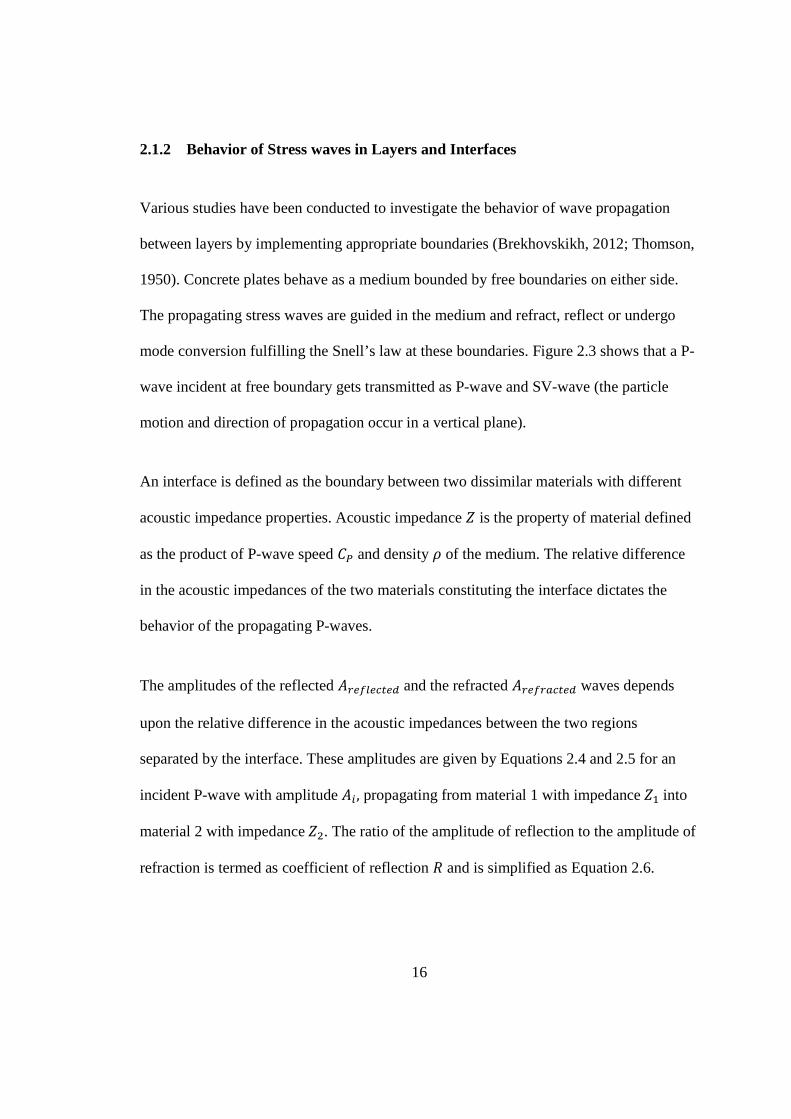
Figure 2.4 Principle of impact-echo test. (a) Schematic of impact-echo method; (b)
amplitude spectrum for test of solid slab; and (c) amplitude spectrum for
test over void in slab (Davis, et al., 1998). .................................................. 26
Figure 2.5 Representation of impact load by force-time function. ............................... 27
Figure 3.1 HS and HSC force-time function: (a) time history; and, (b) distribution of
frequencies. ................................................................................................. 39
Figure 3.2 FE model showing a quarter section of the concrete plate with an ALID
boundary region of length LD as used in analysis M6. ................................ 40
Figure 3.3 (a) Section showing concrete plate and foundation layer assembly, and (b)
Stress wave behavior at the concrete/foundation layer interface. ............... 41
Figure 3.4 Representation of the FE model by an equivalent SDOF system. .............. 42
Figure 3.5 Mode shapes and corresponding natural frequencies for concrete plate
supported on foundation layer of thickness: (a) 100 mm, and (b) 25 mm. . 43
ix
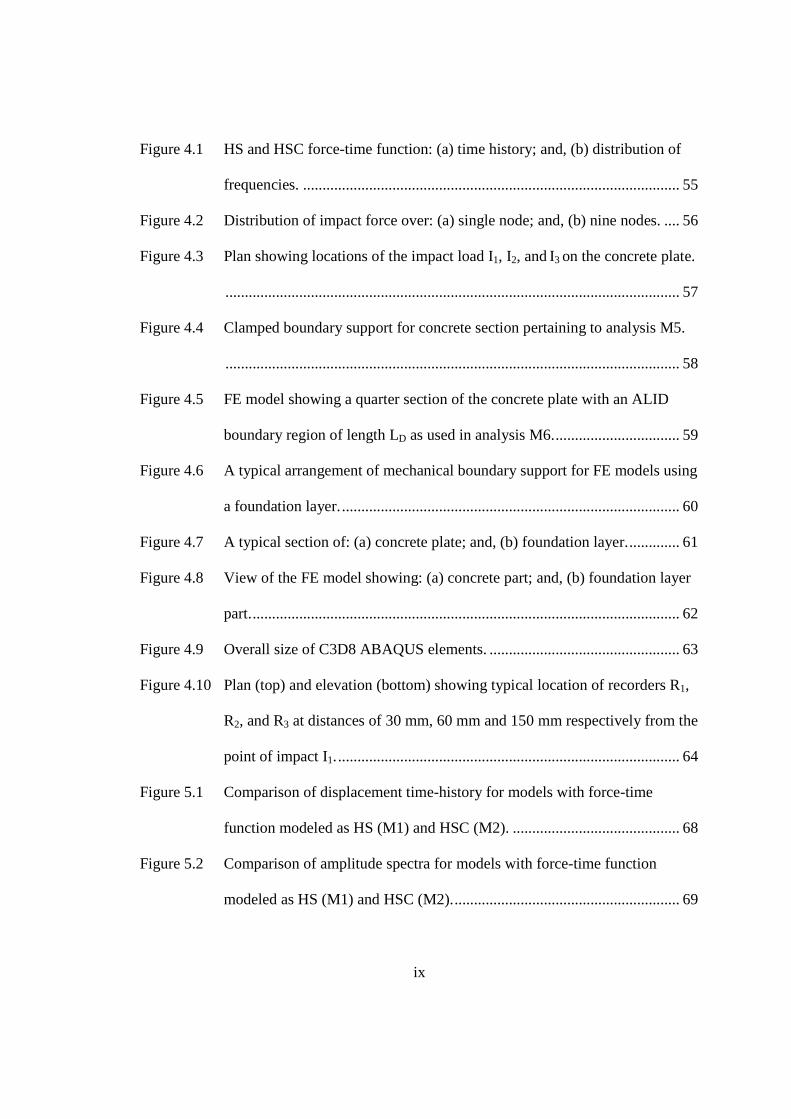
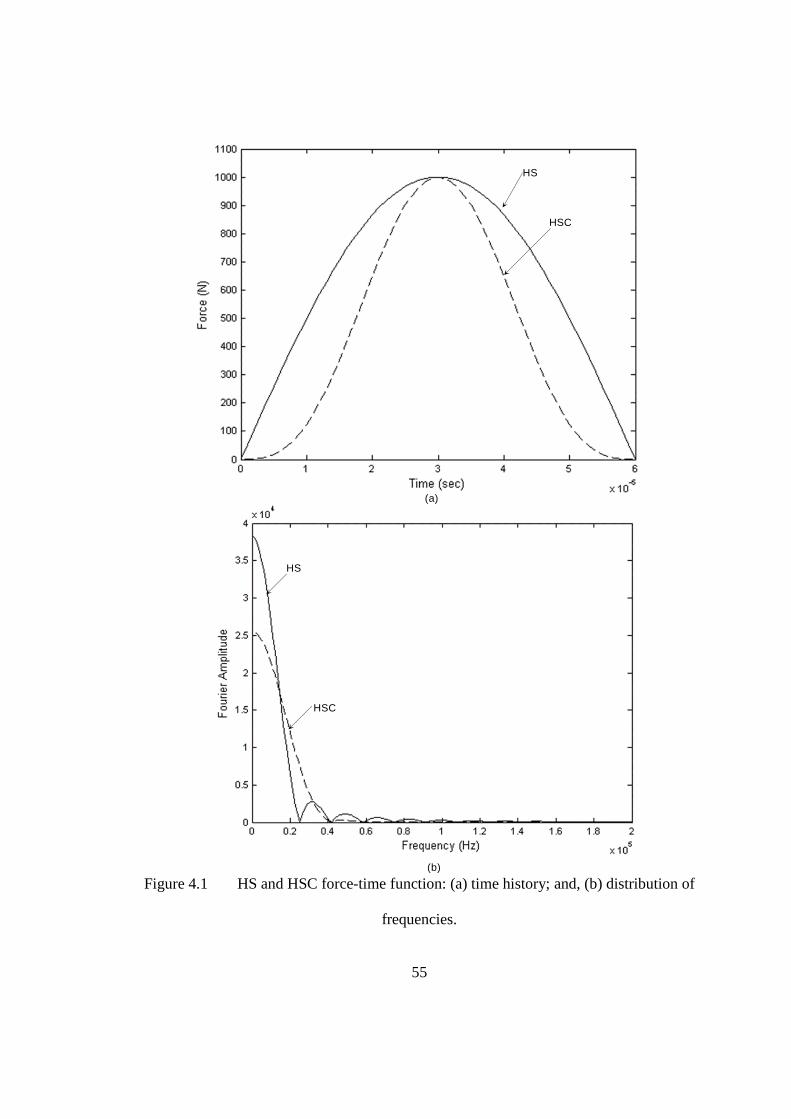
Figure 4.1 HS and HSC force-time function: (a) time history; and, (b) distribution of
frequencies. ................................................................................................. 55
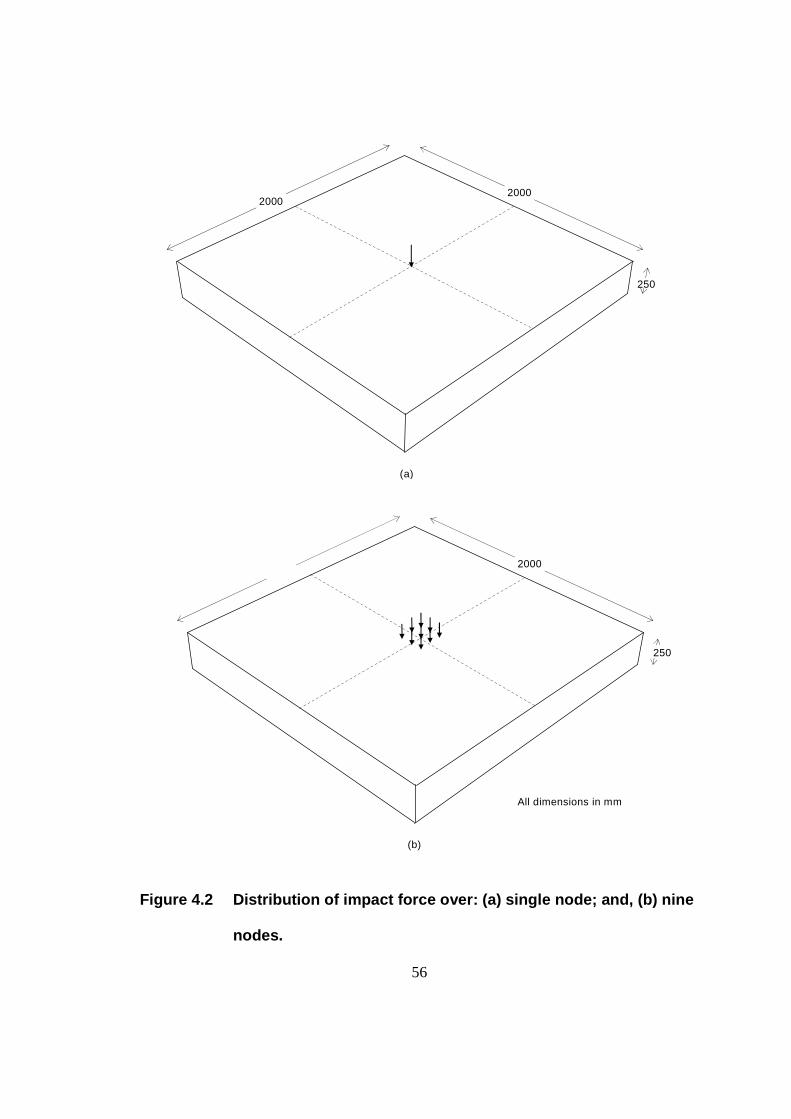
Figure 4.2 Distribution of impact force over: (a) single node; and, (b) nine nodes. .... 56
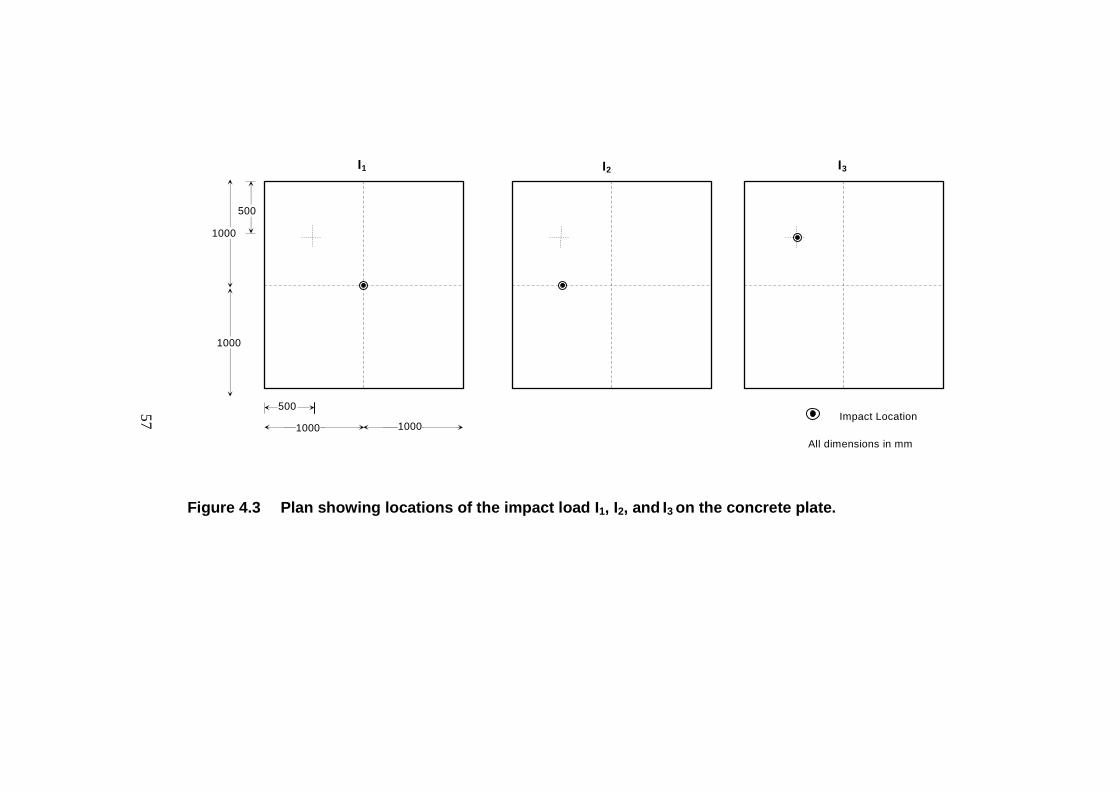
Figure 4.3 Plan showing locations of the impact load I1, I2, and I3 on the concrete plate.
..................................................................................................................... 57
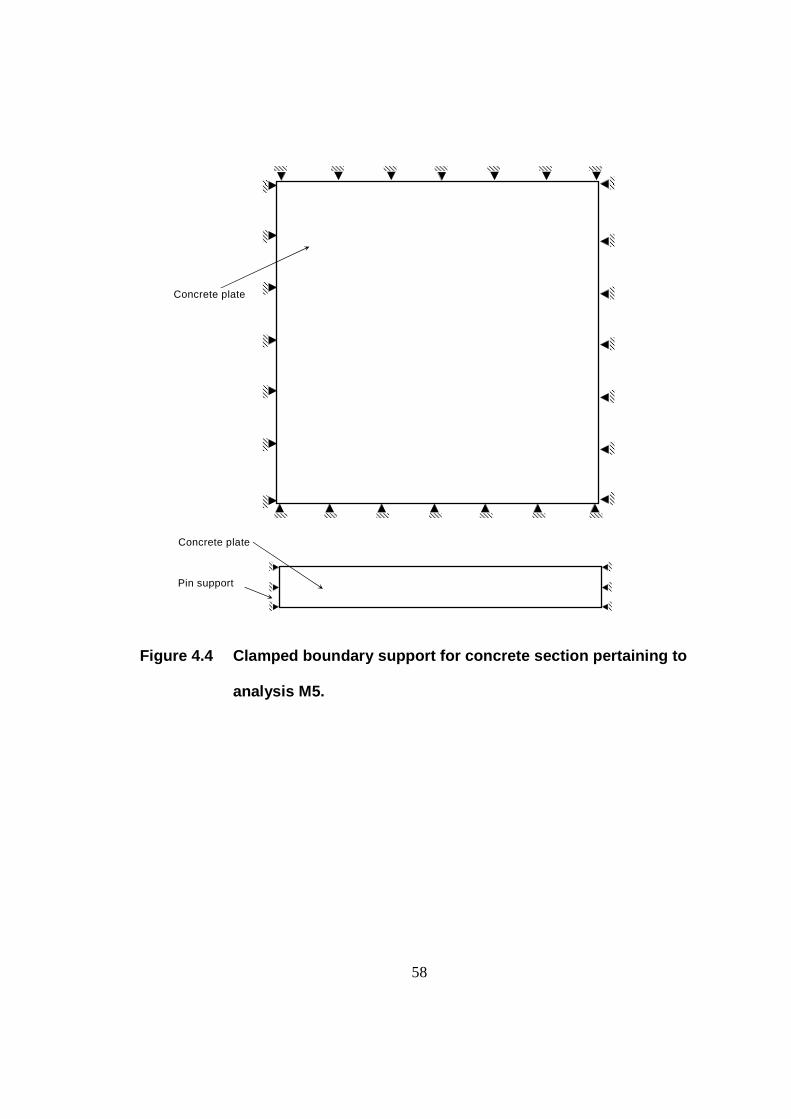
Figure 4.4 Clamped boundary support for concrete section pertaining to analysis M5.
..................................................................................................................... 58
Figure 4.5 FE model showing a quarter section of the concrete plate with an ALID
boundary region of length LD as used in analysis M6. ................................ 59
Figure 4.6 A typical arrangement of mechanical boundary support for FE models using
a foundation layer. ....................................................................................... 60
Figure 4.7 A typical section of: (a) concrete plate; and, (b) foundation layer. ............. 61
Figure 4.8 View of the FE model showing: (a) concrete part; and, (b) foundation layer
part. .............................................................................................................. 62
Figure 4.9 Overall size of C3D8 ABAQUS elements. ................................................. 63
Figure 4.10 Plan (top) and elevation (bottom) showing typical location of recorders R1,
R2, and R3 at distances of 30 mm, 60 mm and 150 mm respectively from the
point of impact I1. ........................................................................................ 64
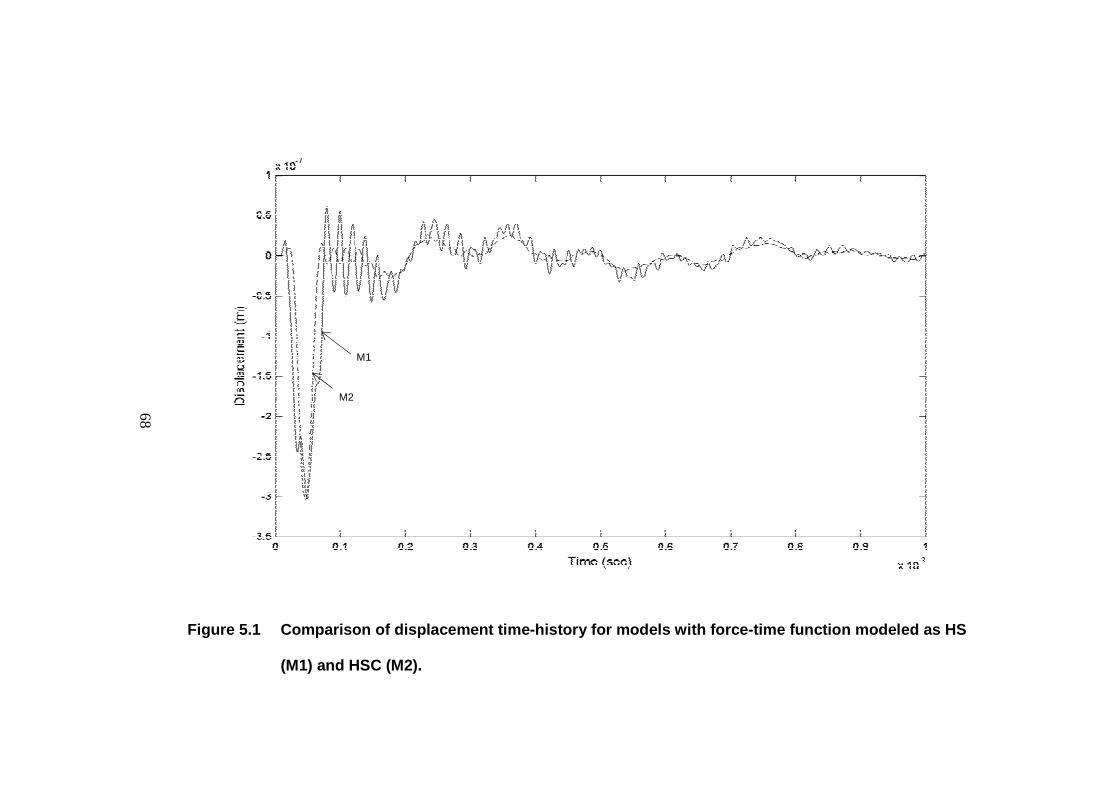
Figure 5.1 Comparison of displacement time-history for models with force-time
function modeled as HS (M1) and HSC (M2). ........................................... 68
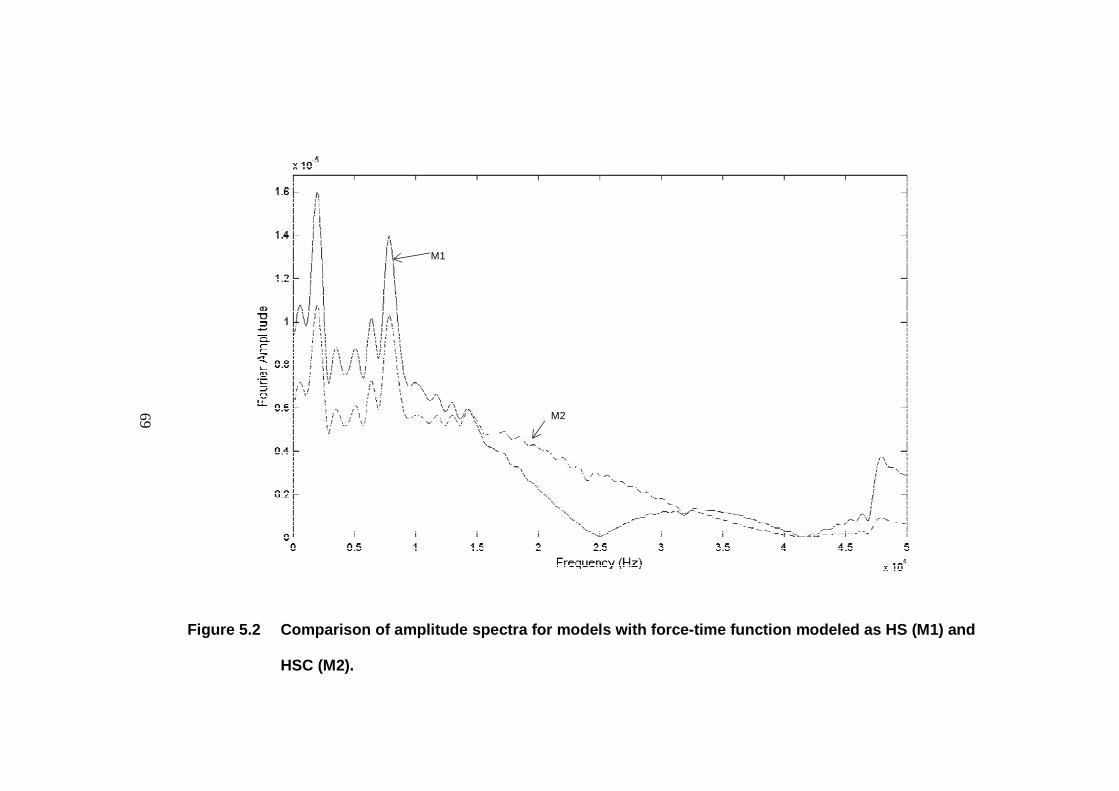
Figure 5.2 Comparison of amplitude spectra for models with force-time function
modeled as HS (M1) and HSC (M2). .......................................................... 69
x
Figure 5.3 Comparison of displacement time-history for models with impact load
distributed over single node (M2) and multiple node (M3). ....................... 72
Figure 5.4 Comparison of amplitude spectra for models with impact load distributed
over single node (M2) and multiple node (M3). ......................................... 73
Figure 5.5 Comparison of displacement time-histories for different impact locations on
a concrete plate. ........................................................................................... 77
Figure 5.6 Comparison of amplitude spectra for different impact locations on a
concrete plate. .............................................................................................. 78
Figure 5.7 Comparison of displacement time-histories for models with clamped
boundary (M4) and ALID (M5). ................................................................. 82
Figure 5.8 Comparison of amplitude spectra for models with clamped boundary (M4)
and ALID (M5). .......................................................................................... 83
Figure 5.9 Comparison of displacement time-histories for the models with varying
thickness of foundation layer. ..................................................................... 87
Figure 5.10 Comparison of amplitude spectra for the models with varying thickness of
foundation layer. .......................................................................................... 88
Figure 5.11 Results of Eigen-value analysis to determined the vibration mode excited by
the impact load for model: (a) M8, and (b) M3........................................... 89
Figure 5.12 Comparison of displacement time-history for models with varying acoustic
impedances of foundation layer. ................................................................. 93
Figure 5.13 Comparison of amplitude spectra for models with varying impedances of
foundation layer. .......................................................................................... 94
1
ABSTRACT
Impact-echo (IE) is a widely accepted and applied non-destructive evaluation technique
for quality control and defect characterization in concrete structures. IE is an acoustic
method based on the propagation of impact-generated stress waves that are reflected by
material defects or interfaces. Numerical simulations using finite element method (FEM)
have been used to study the impact-echo response of structural component with complex
geometry and boundary conditions.
The present study focuses on developing a modeling methodology to simulate stress
wave propagation in concrete plates. The significant modeling parameters that influenced
the wave propagation and behavior were identified based on the literature review. A set
of thirteen simulations were run to study the effect of each parameter. Time histories
were recorded at four different locations to represent the waveform in an IE test. Fast
Fourier transform (FFT) using Matlab was performed to transform the time-domain
displacement histories to frequency-domain amplitude spectra.
The impact of steel ball on concrete plate was modeled using a force-time function with
amplitude ����for a given duration��. A gradually increasing force-function such as a
half-cycle sine cubed was used to reduce the high-frequency ringing observed due to an
abruptly increasing force. Similarly, distributing the force over two or more nodes
eliminated the localized deformation of the concrete plate surface.
2
The unwanted wave reflections from the mechanical boundaries of a semi-infinite
deteriorated the displacement waveform and had an adverse effect on thickness-mode
frequency�. Absorbing layer with increased damping (ALID) boundaries were used to
effectively absorb these wave reflection and give a more accurate amplitude spectrum.
By implementing these absorbing boundaries, a significant reduction in model and
computation cost was achieved.
Wave reflections from the free edges are important when modeling stress wave
propagation in bounded sections. The foundation layer approach, where the concrete
plate is supported by a flexible foundation layer, was used for modeling bounded
concrete plates.
The relative difference in the stiffness of concrete and foundation layer �dictated the
dynamic response of the system which primarily vibrated in piston-mode. A higher value
of � was useful in separating the piston-mode from the thickness-mode frequencies to
obtain a more accurate spectrum. The relative difference in the plate and foundation layer
impedances �influenced the behavior of propagating wave at the interface. A high
value of �was used to increase the coefficient of reflection Rof the interface such that
most of the incident compression wave reflected back as tension wave in the concrete
plate.
3
CHAPTER 1. INTRODUCTION
1.1 INTRODUCTION
Impact-echo (IE) is a method for non-destructive evaluation (NDE) of concrete structures
based on the propagation and interaction of mechanical impact induced stress wave in the
concrete medium. It has a wide range of application ranging from quality control
(thickness measurement, grouting in tendon ducts, epoxy injected in surface opening
cracks, etc.) to defect characterization (location, shape and size of voids, surface opening
cracks, delaminations etc.) (Sansalone & Street, 1997). It has also been used to measure
the early age mechanical properties (set time and strength gain) of concrete (Pessiki &
Carino, 1988; Pessiki & Johnson, 1996; Pessiki & Rowe, 1997).
New technologies such as stack imaging of spectral amplitude based on impact-echo
(SIBIE) (Ohtsu & Watanabe, 2002) and rapid data acquisition through multisensor
(Zhang, et al., 2012) and contactless sensing (Oh, 2012) have been used to improve the
process and quality of defect characterization using the IE method.
Various numerical techniques like finite difference time domain (FDTD) and finite
element method (FEM) have been employed to simulate the impact-echo response of
various concrete, reinforced, and composite structural components. These techniques are
based on the fundamental theory of elastic stress-wave propagation in an infinite solid
4
and have been successfully applied over a wide range of sections with complex geometric
and boundary constraints.
FE models built using ABAQUS were analyzed to study the stress wave propagation in
semi-infinite and bounded concrete plates due to a short-duration transient load. The
formulation of impact load, its distribution and location, and mechanical boundary
conditions were identified as significant modeling parameters. A total of thirteen
simulations were run to investigate the effect of each parameter on the wave propagation
characteristics.
Half-cycle sine and half-cycle sine cubed formulations were used to represent the impact
of a steel ball on concrete surface. This impact load was distributed firstly over a single
node as a concentrated load and then over nine elements as pressure load. The impact was
applied at three different sites�� (doubly symmetric), ��(singly asymmetric) and
��(doubly asymmetric).
To study the transient response of semi-infinite sections, absorbing layer with increased
damping (ALID) was used to absorb the unwanted wave reflections from the mechanical
clamped boundaries. This absorbing layer was implemented in the FE model by
introducing a mass proportional Rayleigh damping coefficient��.
A foundation layer approach was used to model wave propagation in bounded concrete
plates. Relative stiffness � and relative impedance �of the concrete and foundation
5
layer were found to have significant influence on the dynamic property of the structure
and the behavior of stress wave at the interface.
1.2 RESEARCH OBJECTIVES
This research is primarily aimed at developing a methodology for finite element (FE)
modeling of impact-generated stress wave propagation in concrete. In order to achieve
this research objective the following approach was used.
1. Perform an in-depth literature review of previous studies conducted on impact-
echo tests on concrete plates and numerical modeling of stress wave propagation
using finite element analysis.
2. Develop an efficient and accurate dynamic finite element (FE) simulation of
mechanical wave based impact-echo method for semi-infinite and bounded
concrete plates.
3. Identify influential modeling parameters that affect the wave propagation
characteristics in the concrete medium and conduct parametric studies of the
identified parameters.
4. Study different methods to eliminate transient wave reflection from the
numerical boundary and apply one of the methods in the FE model.
5. Develop a Matlab code to transform the displacement time-histories recorded at
various nodes to amplitude spectra in frequency domain.
6. Compare the results for different parametric studies and draw conclusions based
on the waveforms and amplitude spectra.
6
1.3 SCOPE OF THE PROJECT
The report is organized into five different chapters (Chapters 2-6) that discusses the
following topics.
1. Chapter 2 provides the necessary background knowledge on the theory of elastic
stress wave propagation in a solid medium. The general methodology behind the
impact-echo method is also briefly discussed.
2. Chapter 3 provides the background for the numerical simulation of the stress
wave propagation in concrete plate. The modeling of impact load, constraints on
time step and element size, and the stability criteria of the time-stepping
integration technique are covered. Modeling techniques for semi-infinite and
bounded sections are discussed in detail.
3. Chapter 4 describes the finite element model used in this research. It also
discusses the modeling parameters that were identified to significantly influence
the wave propagation characteristics in the concrete plate.
4. Chapter 5 discusses the influence of the modeling parameters identified in
Chapter 4. Time histories and amplitude spectra for each simulation case is
discussed in detail.
5. Chapter 6 presents the summary and conclusions of the research work and
proposes the future work that may be carried out to support the present findings.
7
1.4 SUMMARY OF FINDINGS
A set of thirteen simulations were run to study the effect of different parameters on the
behavior of the propagating stress waves. The following findings were observed.
1. A high energy sudden impact (represented by half-cycle sine) yields a high
frequency ringing in the waveform. This ringing effect can be eliminated by using
a gradually increasing impact load (half-sine cubed).
2. Distributing the impact load over two or more nodes eliminates the undulations
observed due to localized surface deformations due to a concentrated load.
3. Eccentric loading does not excite higher flexural modes in the assemblage other
than the piston-mode frequency. However, the resulting waveform varies from
that of symmetric loading case due to the early arrival of side reflections.
4. Non-reflecting and absorbing boundaries such as the absorbing layer with
increased damping (ALID) can effectively absorb the boundary reflections in a
semi-infinite sections. This greatly reduces the model size and the computational
cost.
5. Modeling of bounded sections with complex boundaries, where side reflections
are equally important, can be achieved by supporting the concrete on a foundation
layer composed of different material properties (acoustic impedance). These
properties dictate the behavior of propagating stress waves at the interface.
6. The foundation layer supporting the concrete slab behaves as a spring that
vibrates in the piston-mode. This frequency can be easily identified in the
respective amplitude spectrum.
8
The following notations were used in this report.
� Cross-sectional area of plate/foundation layer
�� Amplitude of incident wave
���������� Amplitude of reflected wave
Arefracted Amplitude of refracted wave
CK Stiffness proportional Rayleigh damping coefficients
CM Mass proportional Rayleigh damping coefficients
CP Velocity of P-wave
CR Velocity of R-wave
CS Velocity of S-wave
)�* Damping matrix
E Young’s modulus of elasticity
Ep Elastic modulus of plate
Es Elastic modulus of steel ball
Fmax Amplitude of impact load
9
HS Half-period sine
HSC Half-period sine cubed
G Shear modulus
Kf Axial stiffness of the foundation layer
)3* Stiffness matrix
LD Length of amplitude layer with increased damping (ALID)
)6* Mass matrix
N Mesh density per wavelength
R Coefficient of reflection
RK Ratio of plate stiffness to foundation layer stiffness
RZ Ratio of plate impedance to foundation layer impedance
9: Vector of externally applied loads
T Distance of the reflecting interface from the point of impact/thickness of
concrete plate
Tf Thickness of foundation layer
9<: Displacement vector
10
=<> ? Velocity vector
=<@ ? Acceleration vector
Z Acoustic impedance
A� Acoustic impedance of material 1 from which the wave is propagating
A� Acoustic impedance of material 2 into which the wave is propagating
mc Mass of concrete
BC Mass of steel ball
�(�) Force-time function
� Thickness mode frequency of plate of thickness T
�FGHI Fundamental frequency of SDOF approximation of plate-foundation
layer assembly
fP Piston-mode frequency
��J Peak frequency corresponding to thickness-mode in the amplitude
spectrum
K Acceleration due to gravity
ℎ Drop height in (m)
11
M Number of samples
N Radius of steel ball (m)
�� Contact time of impact load
OP Velocity of the steel ball (m/s)
Q� Frequency resolution
Q� Sampling time / time increment
Q��� Critical time increment
QR Element size
S Correction factor
T��U Minimum wavelength
V Poisson’s ratio
VW Poisson’s ratio of plate
VC Poisson’s ratio of steel ball
X Material density
Y��� Fraction of critical damping in the mode with highest damping defined

12
Z��� Maximum cyclic frequency of impact load
ZFGHI Cyclic frequency of SDOF system
13
CHAPTER 2. BACKGROUND
Impact-echo is a NDE method which utilizes propagating mechanical waves to determine
the subsurface conditions. This chapter provides relevant information that is required to
develop a basis for understanding the methodology of the impact-echo technique. A brief
review on the elastic stress waves and its propagation in an infinite solid plate that
defines the working principle of IE method is also provided. The stress waves
propagating in a layered media and its behavioral characteristics at an interface of two
dissimilar media is also briefly discussed.
Various studies exploring the numerical simulation of a solid concrete plate subjected to
transverse elastic impact to form the basis of impact-echo method has been carried out in
the past. Background information related to numerical modeling of wave propagation is
separately provided in Chapter 3.
2.1 ELASTIC STRESS WAVES IN SOLIDS
The linear deformation in a solid body under the action of a short-period transient force at
the surface (e.g. an impact of steel sphere on concrete surface) can be viewed as
propagation of stress waves. Lamb studied the propagation of these stress waves due to
an impulse at the surface of a half space (Lamb, 1904) and solid plate (Lamb, 1917).
14
Wave propagation theory has been widely used to study various geometric and loading
situations (Rayleigh, 1888; Miklowitz, 1984; Graff, 1975).
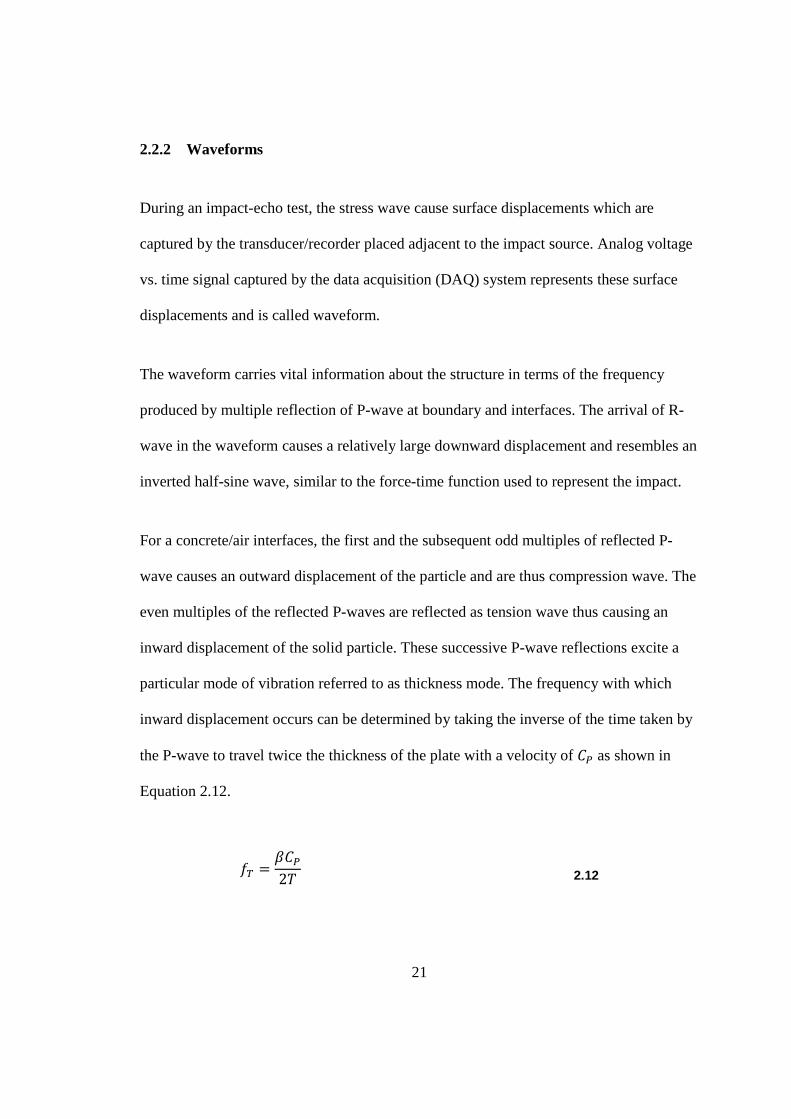
Body waves and surface waves are the two types of waves propagating in a solid
medium. Body waves (P-waves and S-waves) exists in an infinite medium and are
undisturbed by the material boundaries or deformations. Surface waves (R-waves) travel
along the surface of the medium. Figure 2.1 is the schematic representation of wave
propagation and particle motion of P-, S- and R- stress waves in a solid half-space.
The P- or primary waves are longitudinal or dilatational waves which causes the particle
to oscillate in the direction of wave propagation. These waves cause compressive and
tensile stresses in the medium. The particle motion of the wavefront is in outward
direction during the compression phase and in inward direction during the tension phase.
The S- or secondary waves are transverse or distortional waves causing the particle to
oscillate in the direction perpendicular to the wave propagation direction. These waves
produce shear stress in the medium and do not diverge, and they obey the continuity
equation for incompressible media.
Rayleigh or R-waves are the surface waves that propagate along the surface or interface
of a solid medium. These waves cause the particle to move in elliptical manner such that
the surface appears to be moving in up and down motion. The amplitude of the wave
decreases exponentially with increasing depth from the point of impact (Brekhovskikh,
2012)
15
2.1.1 Energy and Velocity of Stress Waves
The displacement field and radiation pattern of stress waves in solid plate was
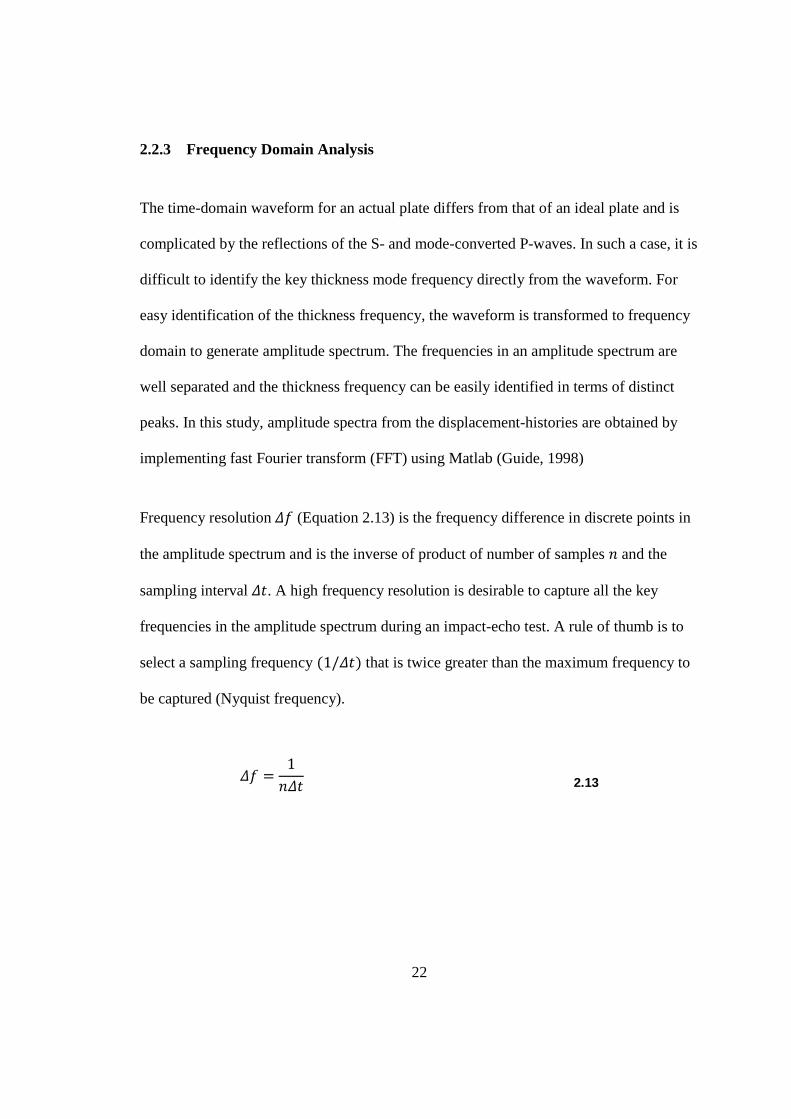
investigated by Miller and Pursey (Miller & Pursey, 1954). The R-waves have the largest
amount of wave energy about 67 % of the total impact energy. The wave energy of P-
wave is 7 % and that of S-wave is 26 % (Miller & Pursey, 1955). Figure 2.2 shows the
displacement and energy distribution of stress waves due to a harmonic point source
(Woods, 1968). The displacements due to P-waves have maximum amplitude directly
beneath the source of impact whereas the amplitude of displacement due to S-waves is
negligible around the area.
The velocity of the propagating stress wave in an infinite isotropic elastic medium is
dependent on the material properties of the medium (Timoshenko, Goodier, & Abramson,
1970). P-wave travels at the highest speed in a solid medium with a velocity CPgiven by
Equation 2.1. S-wave also referred to as secondary waves is the second wave to arrive
travelling at a velocity CS given by the Equation 2.2. Rayleigh wave propagates the
slowest among the three waves at a velocity CR given by Equation 2.3 (Viktorov, 1967).
�[ = ] ^(1 − V)X(1 + V)(1 − 2V) 2.1
�F = ] ^2X(1 + V) = ]cX 2.2
�d = 0.87 + 1.12V1 + V �F 2.3
16
2.1.2 Behavior of Stress waves in Layers and Interfaces
Various studies have been conducted to investigate the behavior of wave propagation
between layers by implementing appropriate boundaries (Brekhovskikh, 2012; Thomson,
1950). Concrete plates behave as a medium bounded by free boundaries on either side.
The propagating stress waves are guided in the medium and refract, reflect or undergo
mode conversion fulfilling the Snell’s law at these boundaries. Figure 2.3 shows that a P-
wave incident at free boundary gets transmitted as P-wave and SV-wave (the particle
motion and direction of propagation occur in a vertical plane).
An interface is defined as the boundary between two dissimilar materials with different
acoustic impedance properties. Acoustic impedance A is the property of material defined
as the product of P-wave speed �[ and density X of the medium. The relative difference
in the acoustic impedances of the two materials constituting the interface dictates the
behavior of the propagating P-waves.
The amplitudes of the reflected ���������� and the refracted ���������� waves depends
upon the relative difference in the acoustic impedances between the two regions
separated by the interface. These amplitudes are given by Equations 2.4 and 2.5 for an
incident P-wave with amplitude ��, propagating from material 1 with impedanceA�into
material 2 with impedanceA�. The ratio of the amplitude of reflection to the amplitude of
refraction is termed as coefficient of reflection and is simplified as Equation 2.6.
17
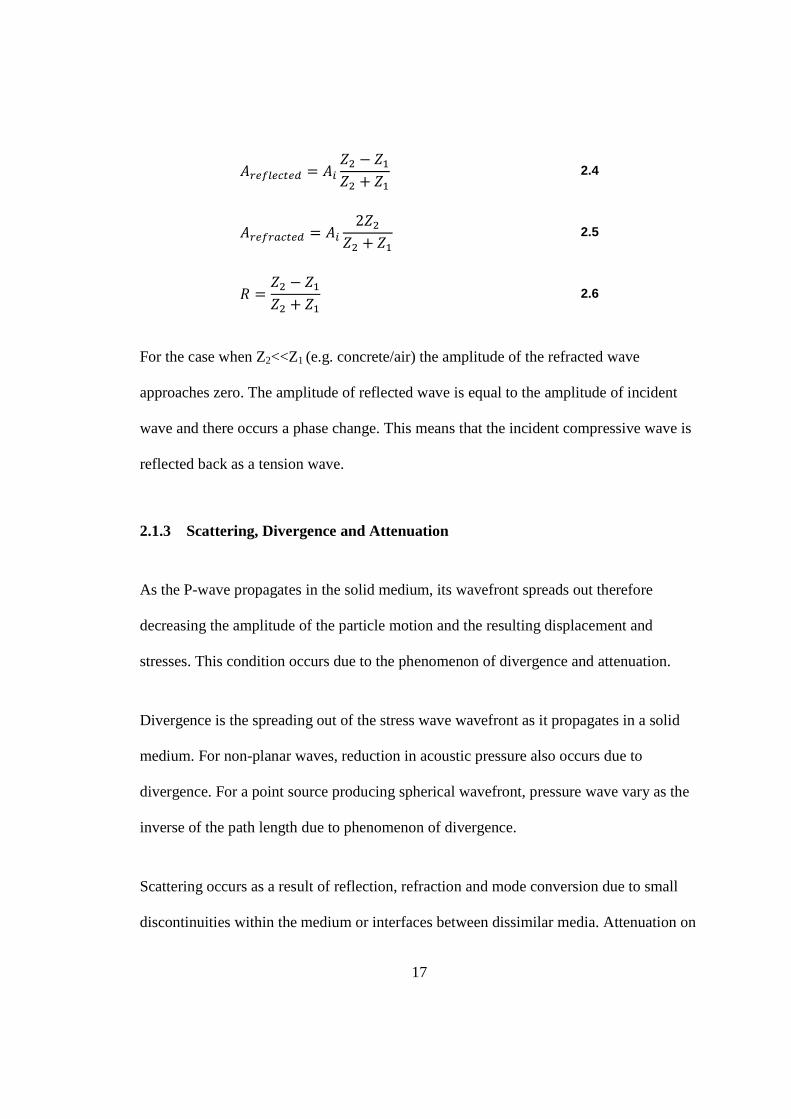
���������� = �� A� − A�A� + A� 2.4
���������� = �� 2A�A� + A� 2.5
= A� − A�A� + A� 2.6
For the case when Z2<<Z1 (e.g. concrete/air) the amplitude of the refracted wave
approaches zero. The amplitude of reflected wave is equal to the amplitude of incident
wave and there occurs a phase change. This means that the incident compressive wave is
reflected back as a tension wave.
2.1.3 Scattering, Divergence and Attenuation
As the P-wave propagates in the solid medium, its wavefront spreads out therefore
decreasing the amplitude of the particle motion and the resulting displacement and
stresses. This condition occurs due to the phenomenon of divergence and attenuation.
Divergence is the spreading out of the stress wave wavefront as it propagates in a solid
medium. For non-planar waves, reduction in acoustic pressure also occurs due to
divergence. For a point source producing spherical wavefront, pressure wave vary as the
inverse of the path length due to phenomenon of divergence.
Scattering occurs as a result of reflection, refraction and mode conversion due to small
discontinuities within the medium or interfaces between dissimilar media. Attenuation on
18
the other hand takes place due to absorption and scattering of the wave. Internal friction
and heat production leads to absorption of wave. In a heterogeneous medium like
concrete, it affects the frequency content of the propagating pulse. The higher frequency
components are attenuated with path lengths and the frequency spectrum of the pulse is
continuously shifted to lower frequencies. Thus the sensitivity and the acoustic pressure
decrease with path length.
2.2 IMPACT-ECHO METHOD
The impact-echo (IE) method was first developed by the joint efforts N. J. Carino and M.
Sansalone (Sansalone & Carino, 1986; Carino, 2001) at the National Institute of
Standards and Technology (NIST). Since then this method has been tested and applied
for quality control and defect characterization of various plain, reinforced and post-
tensioned concrete structures (Schubert, Wiggenhauser, & Lausch, 2004; Schubert &
Köhler, 2008).
Figure 2.4 illustrates the principle and working of the IE method. The impact of steel
sphere on the concrete surface generates elastic stress waves which propagate in the
medium. The propagating waves are reflected by internal discrepancies or external
boundaries. The surface displacements are measured by receiving transducer and
analyzed in the frequency domain. The distance of the reflecting interface from the point
of impact j is given by the Equation 2.7.
19
j = S�[2��J 2.7
Where ��J is the peak frequency identified from the frequency spectrum and β is a factor
related to shape of the section. For plates, a β factor of 0.96 was established (Sansalone,
Streett, 1997). More recent study shows that S is related to the zero group velocity
frequency of mode Lamb waves in a plate structure (Gibson & Popovics, 2005). A
Svalue of 0.953 for poisson’s ratio Vof 0.2 was adopted for present study.
2.2.1 Impact
During an impact (collision of steel sphere in the concrete surface) a portion of the
potential energy in the sphere is transferred to the elastic wave energy in the plate which
causes particle displacements. In the case of concrete, a mechanical impact source is
normally used to generate a stress pulse with sufficient acoustic energy to overcome the
effects of attenuation and divergence.
The impact theory proposed by Hertz has been studied to arrive at various mathematical
formulations to accurately represent the force pulse (Hunter, 1957; McLaskey & Glaser,
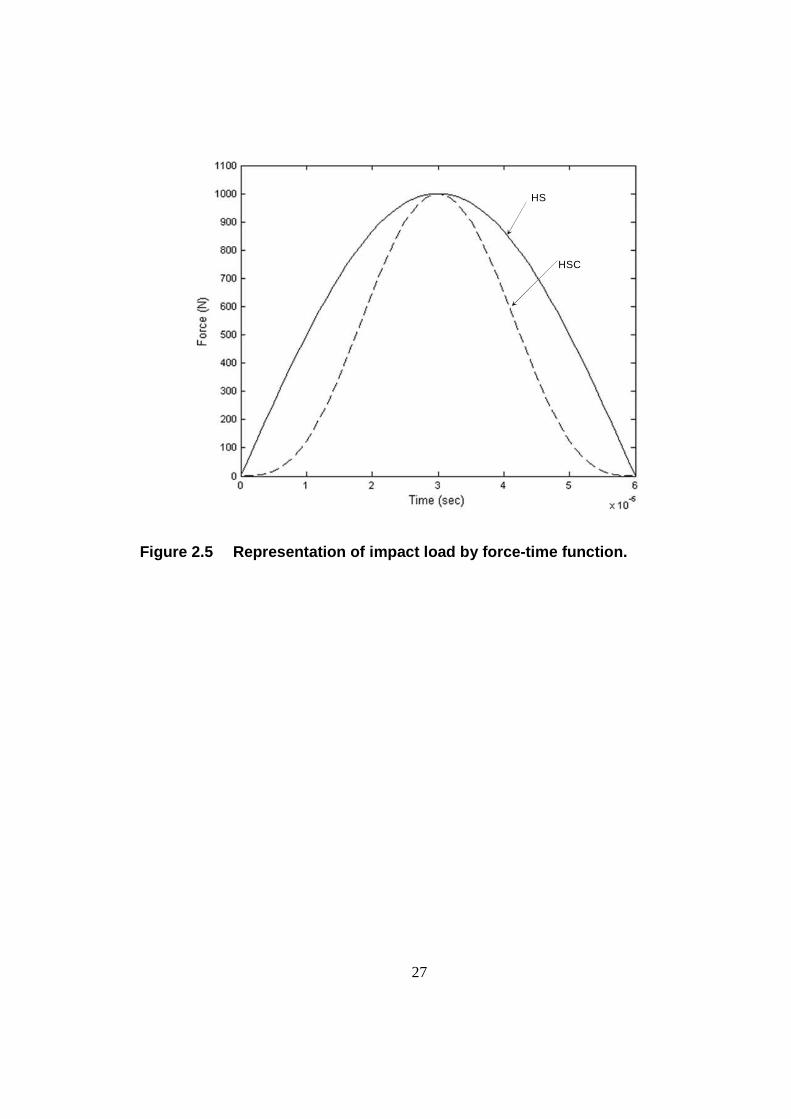
2010). This pulse can be simplified as a force-time function consisting of a half-period
sinusoidal force with maximum amplitude ����for a duration of �� (contact time).
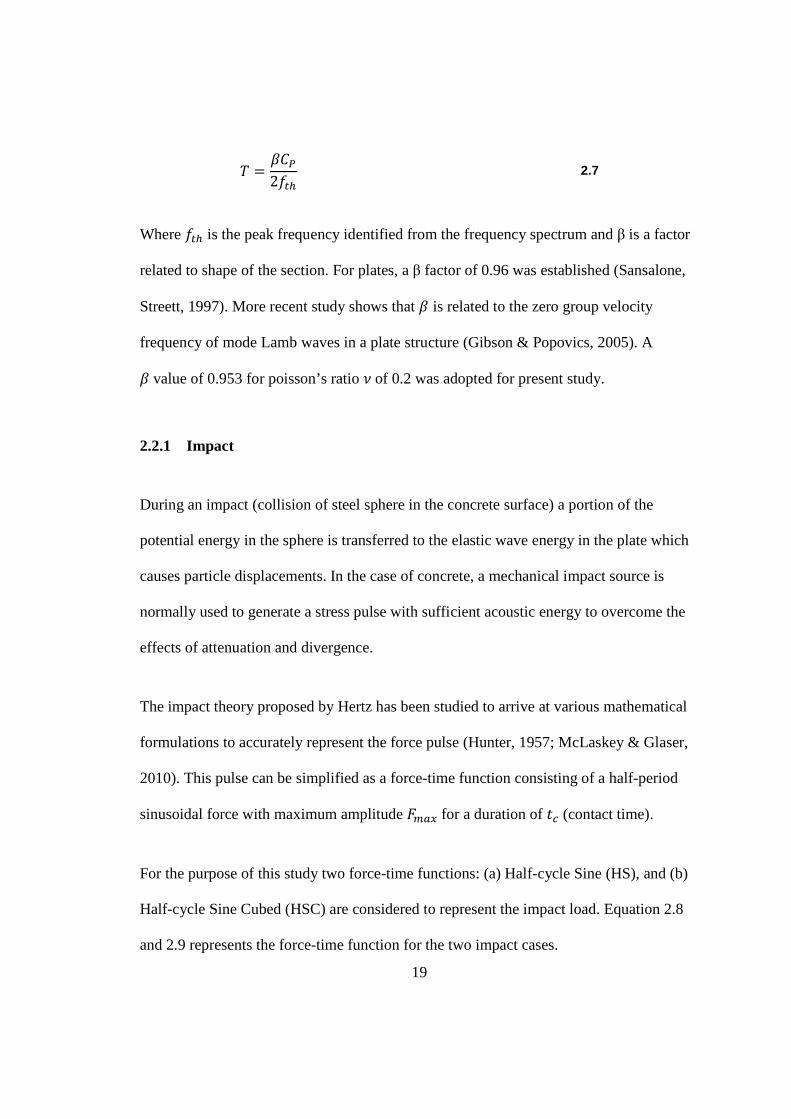
For the purpose of this study two force-time functions: (a) Half-cycle Sine (HS), and (b)
Half-cycle Sine Cubed (HSC) are considered to represent the impact load. Equation 2.8
and 2.9 represents the force-time function for the two impact cases.
20
HS �(�) = ����klM mn��� o 2.8
HSC �(�) = ���� klM� mn��� o 2.9
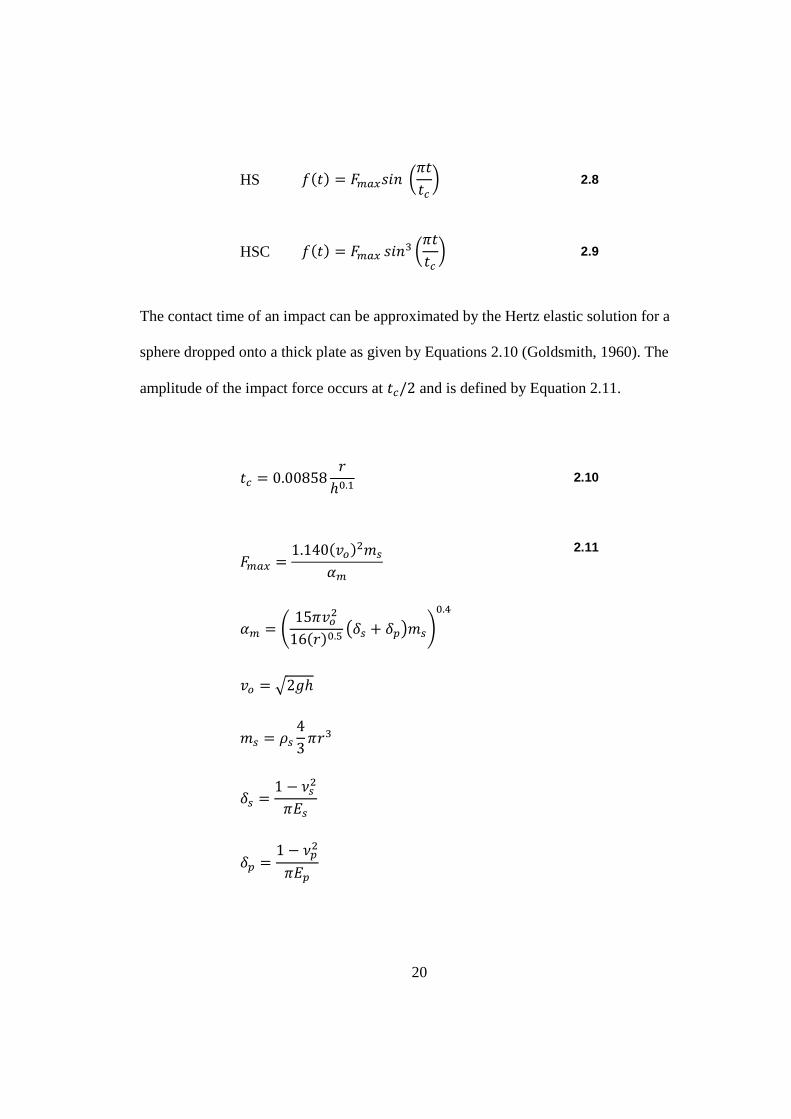
The contact time of an impact can be approximated by the Hertz elastic solution for a
sphere dropped onto a thick plate as given by Equations 2.10 (Goldsmith, 1960). The
amplitude of the impact force occurs at ��/2 and is defined by Equation 2.11.
�� = 0.00858 Nℎr.� 2.10
���� = 1.140(OP)�BCt�
t� = u 15nOP�16(N)r.w xyC + yWzBC{r.| OP = }2Kℎ
BC = XC 43nN� yC = 1 − VC�n^C
yW = 1 − VW�n^W
2.11
21
2.2.2 Waveforms
During an impact-echo test, the stress wave cause surface displacements which are
captured by the transducer/recorder placed adjacent to the impact source. Analog voltage
vs. time signal captured by the data acquisition (DAQ) system represents these surface
displacements and is called waveform.
The waveform carries vital information about the structure in terms of the frequency
produced by multiple reflection of P-wave at boundary and interfaces. The arrival of R-
wave in the waveform causes a relatively large downward displacement and resembles an
inverted half-sine wave, similar to the force-time function used to represent the impact.
For a concrete/air interfaces, the first and the subsequent odd multiples of reflected P-
wave causes an outward displacement of the particle and are thus compression wave. The
even multiples of the reflected P-waves are reflected as tension wave thus causing an
inward displacement of the solid particle. These successive P-wave reflections excite a
particular mode of vibration referred to as thickness mode. The frequency with which
inward displacement occurs can be determined by taking the inverse of the time taken by
the P-wave to travel twice the thickness of the plate with a velocity of �[ as shown in
Equation 2.12.
� = S�[2j 2.12
22
2.2.3 Frequency Domain Analysis
The time-domain waveform for an actual plate differs from that of an ideal plate and is
complicated by the reflections of the S- and mode-converted P-waves. In such a case, it is
difficult to identify the key thickness mode frequency directly from the waveform. For
easy identification of the thickness frequency, the waveform is transformed to frequency
domain to generate amplitude spectrum. The frequencies in an amplitude spectrum are
well separated and the thickness frequency can be easily identified in terms of distinct
peaks. In this study, amplitude spectra from the displacement-histories are obtained by
implementing fast Fourier transform (FFT) using Matlab (Guide, 1998)
Frequency resolutionQ� (Equation 2.13) is the frequency difference in discrete points in
the amplitude spectrum and is the inverse of product of number of samples M and the
sampling intervalQ�. A high frequency resolution is desirable to capture all the key
frequencies in the amplitude spectrum during an impact-echo test. A rule of thumb is to
select a sampling frequency (1/Q�) that is twice greater than the maximum frequency to
be captured (Nyquist frequency).
Q� = 1MQ� 2.13
23
Figure 2.1 Wave propagation and particle motion of compressional, shear
and Rayleigh waves.
24
Figure 2.2 Schematic illustration of displacement and energy distribution
of stress waves in a half-space due to harmonic normal load
(Reproduced from Woods, 1968).
25
Figure 2.3 Behavior of P-wave incident upon an interface (Sansalone &
Carino, 1986).

26
Figure 2.4 Principle of impact-echo test. (a) Schematic of impact-echo
method; (b) amplitude spectrum for test of solid slab; and (c)
amplitude spectrum for test over void in slab (Davis, et al.,
1998).
27
Figure 2.5 Representation of impact load by force-time function.
HSC
HS
28
CHAPTER 3. FINITE ELEMENT MODELING OF IMPACT-ECHO
TESTING
3.1 INTRODUCTION
Numerical methods such as finite-difference time-domain (FDTD) and finite element
method (FEM) have been explicitly used to simulate stress wave propagation in solid
medium (Chang & Randall, 1988; Ham & Bathe, 2012). These methods have been
successfully applied to study the impact-echo response of concrete plates (Sansalone,
Carino, & Hsu, 1987; Abramo, 2011).
This chapter provides relevant background on finite element (FE) modeling of stress
wave propagation is concrete medium. The topics covered in this section forms the basis
of the FE simulation and observed results discussed later in Chapter 4. The FEM
consideration for impact load, element and time discretization, numerical integration
algorithm and stability criteria are reviewed. Reflecting and absorbing boundary
conditions for stress wave propagation in semi-infinite plate are discussed. To simulate
the wave propagation in bounded solid, a new approach is proposed which makes used of
a flexible foundation layer. Some of the techniques discussed in the subsequent sections
are specific to the finite element analysis (FEA) software ABAQUS and may vary for a
different FEA platform.
29
3.2 IMPACT LOAD
The impact of a steel ball on concrete surface can be numerically represented by the
force-time function as discussed in Section 2.2.1. The amplitude of this force-time
function ���� affects the magnitude of stresses and displacements that occur due to the
stress waves generated by the impact. The value of ����should be chosen such that
induced deformations are under the linear elastic limit. The contact time ��affects the
cutoff frequency of the pulse and significantly influences the analytical result.
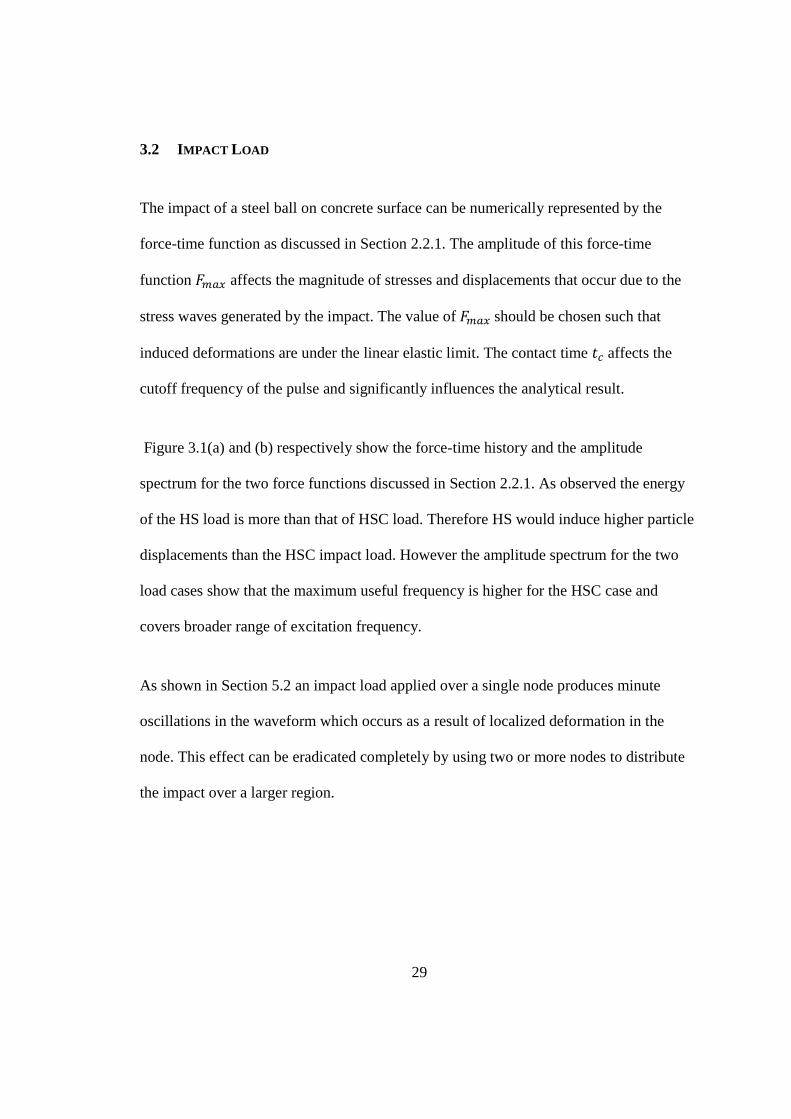
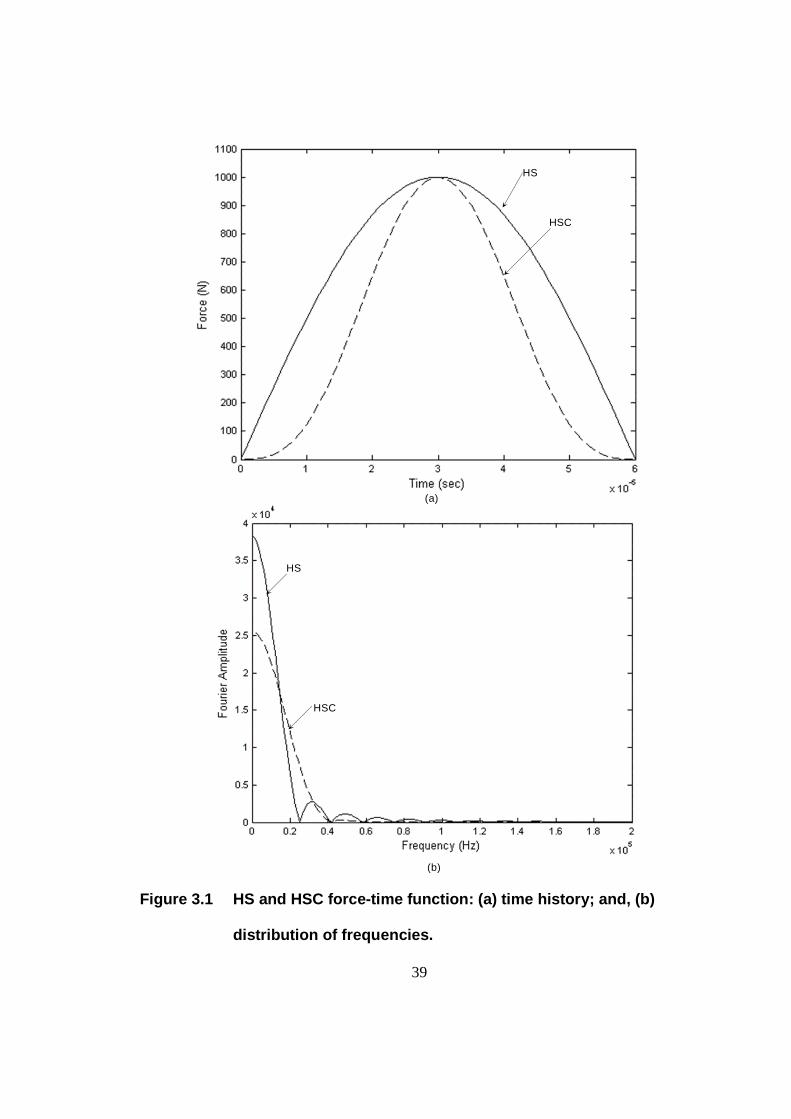
Figure 3.1(a) and (b) respectively show the force-time history and the amplitude
spectrum for the two force functions discussed in Section 2.2.1. As observed the energy
of the HS load is more than that of HSC load. Therefore HS would induce higher particle
displacements than the HSC impact load. However the amplitude spectrum for the two
load cases show that the maximum useful frequency is higher for the HSC case and
covers broader range of excitation frequency.
As shown in Section 5.2 an impact load applied over a single node produces minute
oscillations in the waveform which occurs as a result of localized deformation in the
node. This effect can be eradicated completely by using two or more nodes to distribute
the impact over a larger region.
30
3.3 ELEMENT TYPE
In the present study, three-dimensional models were built using ABAQUS/standard.
First-order linear solid continuum elements (C3D8) were used to represent the concrete
plate. The C3D8 element is an 8-node brick element with nodes only at the corners. The
stresses/displacement at any intermediate location is obtained by linear interpolation
between the corresponding corner nodes (ABAQUS, 2011).
Linear elements were used as the stresses/displacement caused by the propagating wave
is very small and within the elastic range. For accurately representing the wave
propagation problem, a very fine mesh is required to capture the wave traveling with
wavelength�U. Full integration was chosen as opposed to reduced integration to avoid
the excitation of any zero-energy mode or spurious-modes in the model.
3.4 SPATIAL AND TEMPORAL DISCRETIZATION
To avoid the errors associated with the numerical modeling of elastic wave propagation
in a continuous medium, the discretization in time and space must be carefully chosen.
The effective element length and the corresponding time step should be able to represent
the complete wave travel accurately.
The element size QRdepends entirely upon the wavelength of the wave propagating
through the element. It should be small enough to capture the wave with minimum
wavelength T��Uand should not be so small that the wave crosses the element in one
31
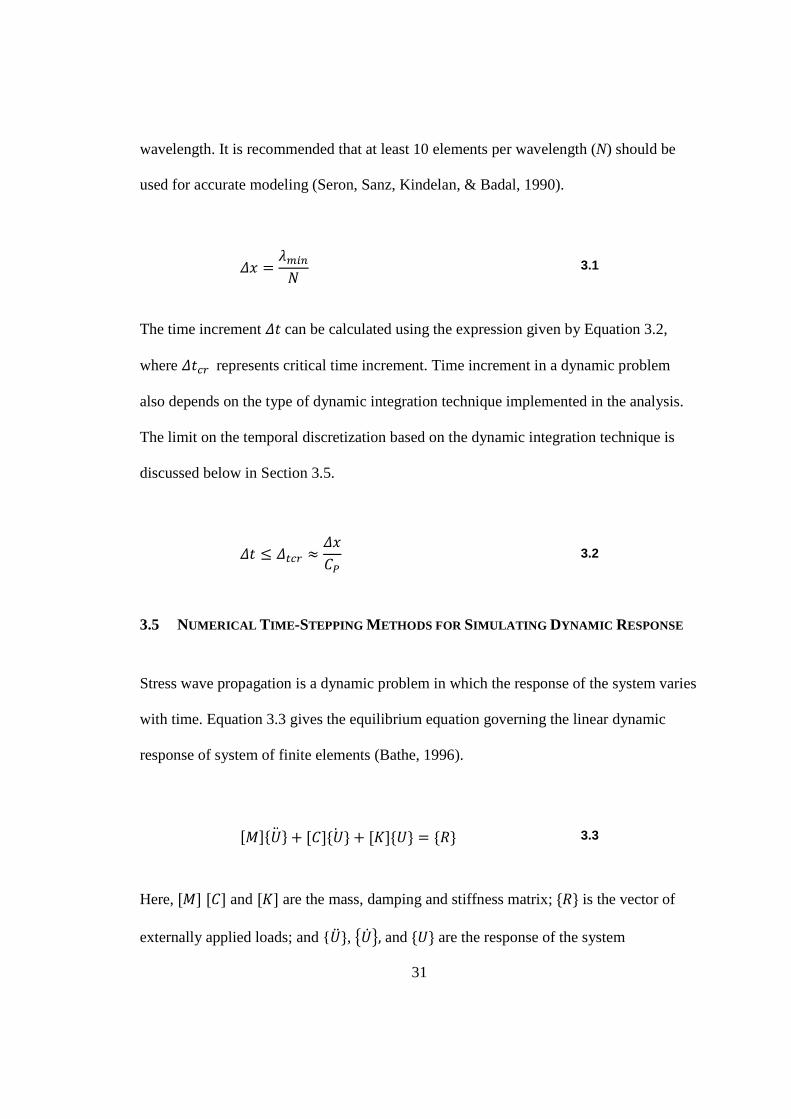
wavelength. It is recommended that at least 10 elements per wavelength (N) should be
used for accurate modeling (Seron, Sanz, Kindelan, & Badal, 1990).
QR = T��U� 3.1
The time increment Q�can be calculated using the expression given by Equation 3.2,
where Q��� represents critical time increment. Time increment in a dynamic problem
also depends on the type of dynamic integration technique implemented in the analysis.
The limit on the temporal discretization based on the dynamic integration technique is
discussed below in Section 3.5.
Q� ≤ Q��� ≈ QR�[ 3.2
3.5 NUMERICAL TIME-STEPPING METHODS FOR SIMULATING DYNAMIC RESPONSE
Stress wave propagation is a dynamic problem in which the response of the system varies
with time. Equation 3.3 gives the equilibrium equation governing the linear dynamic
response of system of finite elements (Bathe, 1996).
)6*9<:@ + )�*9<:> + )3*9<: = 9: 3.3
Here,)6* )�* and )3* are the mass, damping and stiffness matrix; 9: is the vector of
externally applied loads; and {<@ :, =<> ?, and 9<: are the response of the system
32
(acceleration, velocity and displacement respectively. Direct integration refers to the
calculation of the response history step-by-step during which the integration satisfies the
equilibrium equation at discrete time intervalQ�. 3.5.1 Implicit vs. Explicit Algorithm
The type of dynamic integration scheme (implicit or explicit) used in FE procedures
determines the size of element and the time increment used in the analysis. The criteria
on which the integration schemes are compared are computational cost and numerical
stability in arriving at an accurate solution of the problem.
In implicit schemes, the difference equations are combined with the equation of motion
and the displacements are calculated directly by solving the governing equations. In the
case of an implicit analysis, the mass )6*and stiffness )3*matrices are built for each
time step. For a large number of elements and degrees of freedom, these matrices become
quite large drastically increasing the computational time. An Implicit algorithm is
unconditionally stable meaning that result is stable irrespective of Q�used however; the
accuracy may be largely affected. Implicit analysis is more suitable for structural
dynamics problem where the response is dominated by lower modes.
In an explicit formulation, the response quantities are expressed in terms of previously
determined values of displacement, velocity and acceleration. Such methods do not
require factorization of the stiffness and mass matrix in the step-by-step solution thus
making it computationally more economical. However, an explicit algorithm is
33
conditionally stable meaning that the time increment Q�should not exceed the critical
time step Q��� for the solution to converge. Explicit schemes are often more useful for
wave propagation problems such as the one investigated in this project, where the high
frequency modes are important.
3.5.2 Stability Analysis
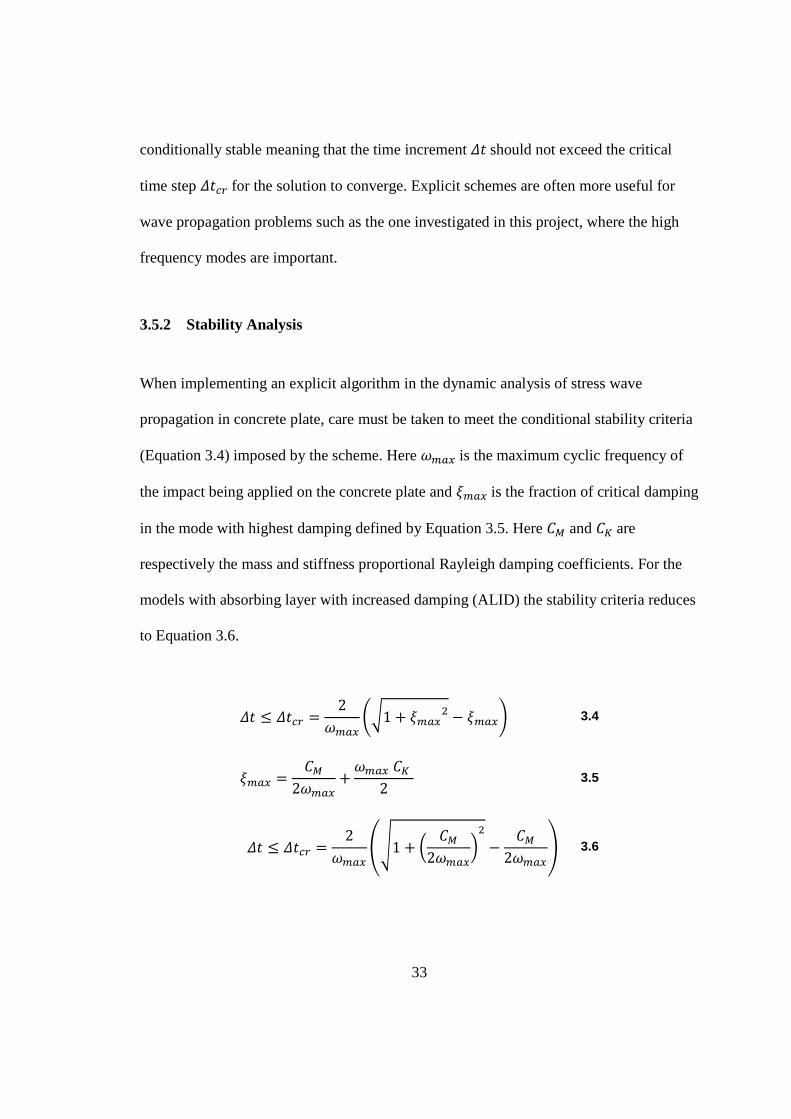
When implementing an explicit algorithm in the dynamic analysis of stress wave
propagation in concrete plate, care must be taken to meet the conditional stability criteria
(Equation 3.4) imposed by the scheme. Here Z���is the maximum cyclic frequency of
the impact being applied on the concrete plate and Y���is the fraction of critical damping
in the mode with highest damping defined by Equation 3.5. Here �� and ��are
respectively the mass and stiffness proportional Rayleigh damping coefficients. For the
models with absorbing layer with increased damping (ALID) the stability criteria reduces
to Equation 3.6.
Q� ≤ Q��� = 2Z��� u�1 + Y���� − Y���{ 3.4
Y��� = �� 2Z��� +Z�����2 3.5
Q� ≤ Q��� = 2Z��� �]1 + m ��2Z���o� − ��2Z���� 3.6
34
3.6 NON-REFLECTING AND ABSORBING BOUNDARY CONDITIONS
The formulation of the IE method is based on the propagation of stress waves in an
infinite solid medium (ideal plate). An ideal plate is a structure composed of two parallel
surfaces, extending infinitely in the lateral direction. However, due to computational
limitation of FEM only a finite length plate can be simulated in practice.
The Dirichlet and Neumann boundary conditions of the FE formulation possess the main
challenge in the wave propagation simulation in a finite plate. The propagating waves are
reflected by these boundary conditions which contaminates the recorded displacement
histories. An easy way around is to build a model that is sufficiently large such that the
boundary reflections do not reach the recorder location for the given analysis time. This
however, makes the FE model extremely large and adds to the computational cost.
Various non-reflecting and absorbing boundaries have been proposed and applied to
diminish the effect of boundary reflections. The Lysmer-Kuhlemeyer (LK) boundary is a
non-reflecting boundary that uses a viscous damper with appropriate damping constant to
absorb wave energy (Lysmer & Kuhlemeyer, 1969). The LK boundary is readily
available in FEA software ABAQUS element library as “infinite elements” and can be
easily implement in the model. However, it has been noted that these elements are only
effective for normally incident and the value of damping cannot be adjusted (Oh, 2012).
The energy absorbing layer is another approach that suppresses the wave reflection by
attenuating the outgoing waves. A perfectly matched layer (PML) is an absorbing
35
boundary in which the layer matches the impedance of the core area and absorbs the
waves at all tangential angle of incidence (Berenger, 1994). Absorbing layer with
increased damping (ALID) is an absorbing layer that uses Rayleigh damping to attenuate
the amplitude of the propagating wave. Analytical models implementing PML and ALID
absorbing boundaries significantly reduces the geometric and computational size of the
numerical model (Drozdz, 2008). ALID is preferred in this study as it is easier to
implement it in the FE package by using Rayleigh damping.
3.6.1 Absorbing Layer with Increased Damping
The absorbing layer with increasing damping (ALID) has the same basis as the LK
boundaries. These layers are attached to the plate boundaries and the energy absorption is
achieved by the means of viscous damping defined by mass proportional Rayleigh
damping��in the model. In the damped region, the mechanical energy of the stress
wave is viscously dissipated as energy in the material. It has been observed that high
damping in the system results in increased resistance in the propagation of the stress
wave in the damped layer and yield inaccurate readings.
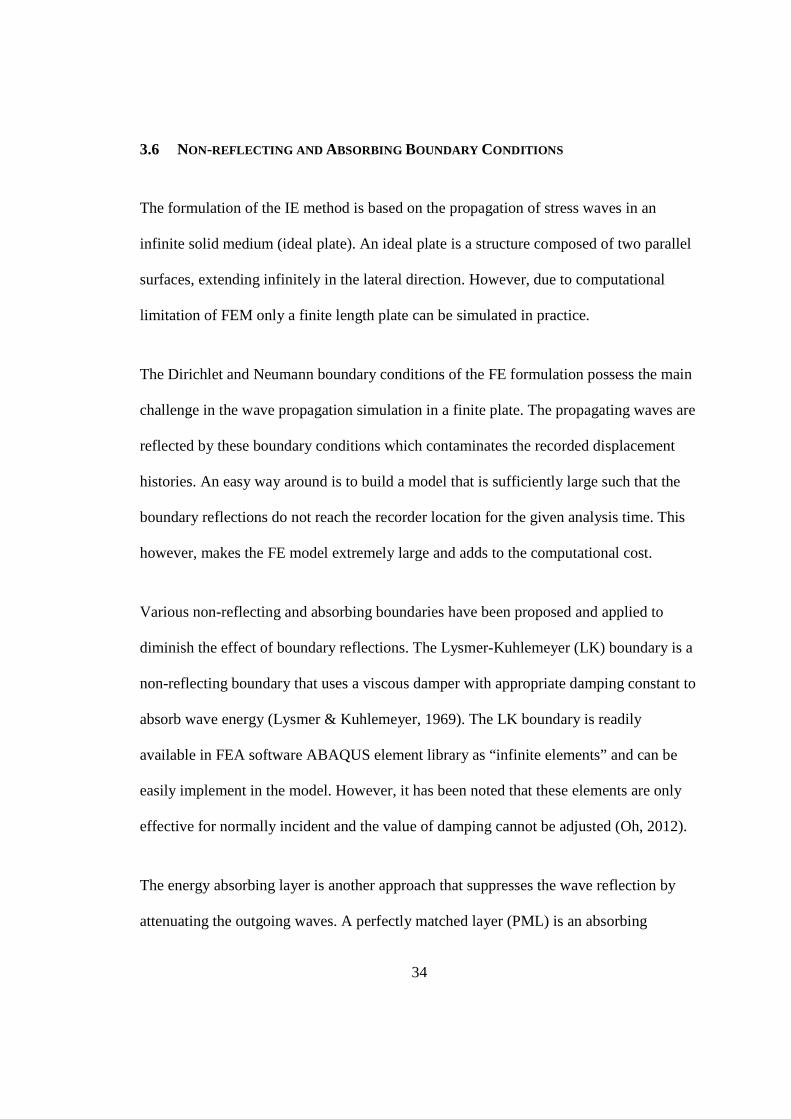
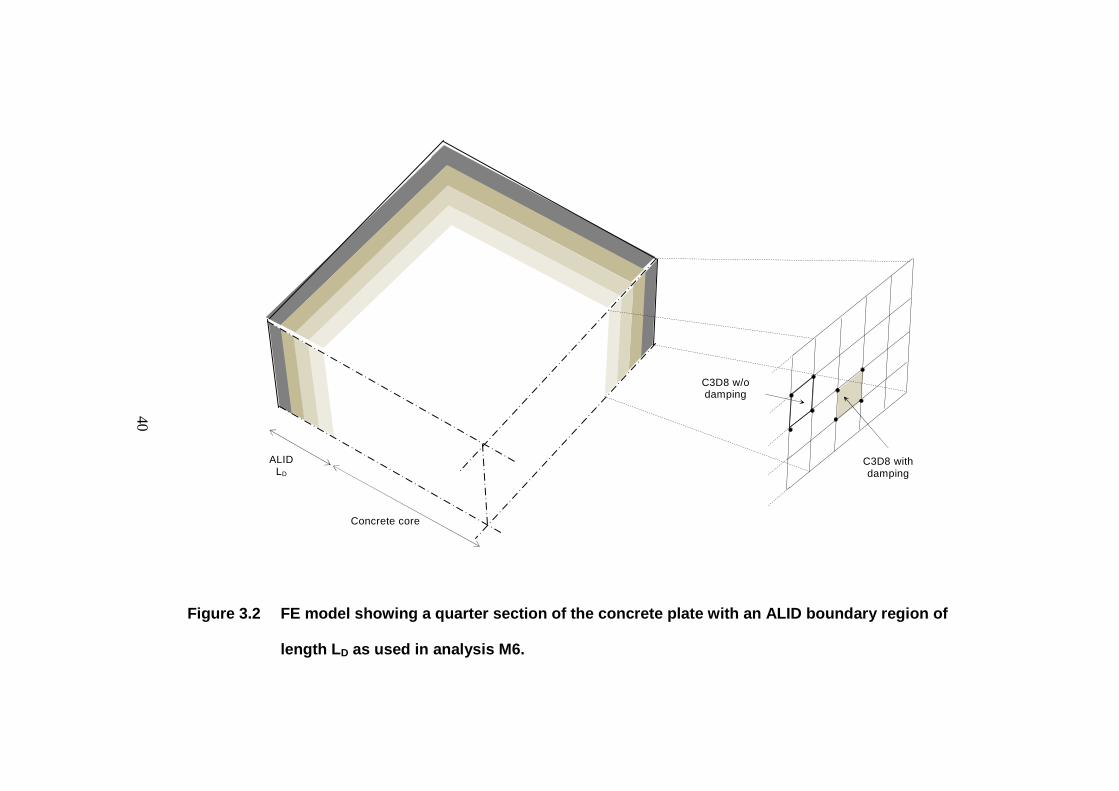
Figure 3.2 represents the FE model showing a quarter section of the concrete plate with
an ALID boundary region of length LD. The length�G is an important factor to consider
while modeling ALID, as it affects the relative difference between the impedances of the
elements in the wave absorbing region. A large difference in the impedance between the
adjacent elements leads to internal reflections of the wave (Olsson, 2012).
36
3.7 WAVE PROPAGATION IN BOUNDED SOLIDS
The wave reflections from the side boundaries are important when studying stress wave
propagation in bounded solids. Therefore to capture the boundary reflections, limitations
are imposed on the locations where mechanical boundary conditions can be applied to
support the model.
3.7.1 Foundation Layer Approach for Bounded Solids
A new approach for modeling wave propagation in bounded concrete sections is
discussed. A flexible foundation layer having the same area as that of concrete plate of
thickness j� is used to support the concrete plate. The relative motion between the two
parts is entirely eliminated by applying tie constraints.
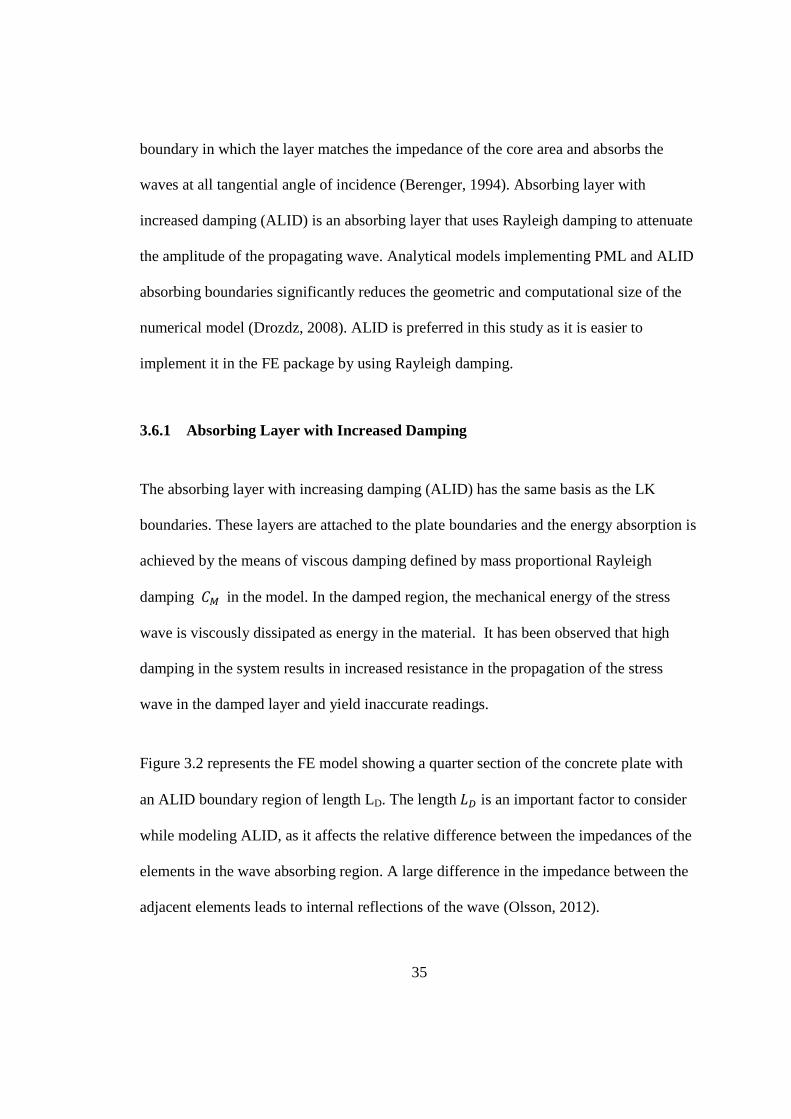
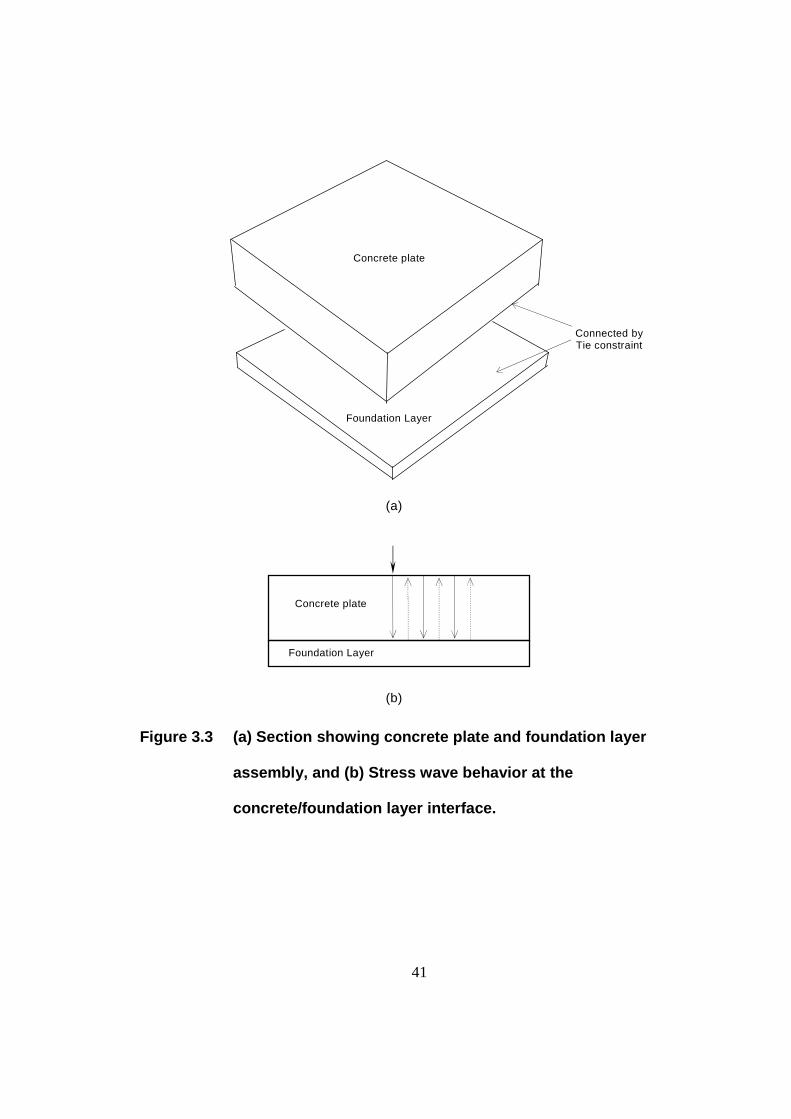
The main concept behind the foundation layer approach is to create a reflecting interface
at the base of the concrete plate such that the incident compression P-waves gets reflected
back as tension waves (Refer Figure 3.3). This is made possible by defining a relatively
low acoustic impedance for the foundation layer such that the coefficient of reflection
approaches -1. For the concrete/foundation layer interface of numerical model M3
(Refer Table 4.1) the value of is calculated as -0.94. This indicates that most of the
incident wave is reflected at the interface and there is phase change.
37
3.7.2 Modes of Vibration
Lin and Sansalone studied the transient response of rectangular (Lin & Sansalone, 1992)
and circular bars (Lin & Sansalone, 1992) using IE method and identified resonant
frequencies due to cross-sectional modes in the waveform. When the concrete foundation
layer assembly is impacted by a load, various modes of vibrations including the
thickness-mode are excited in the system.
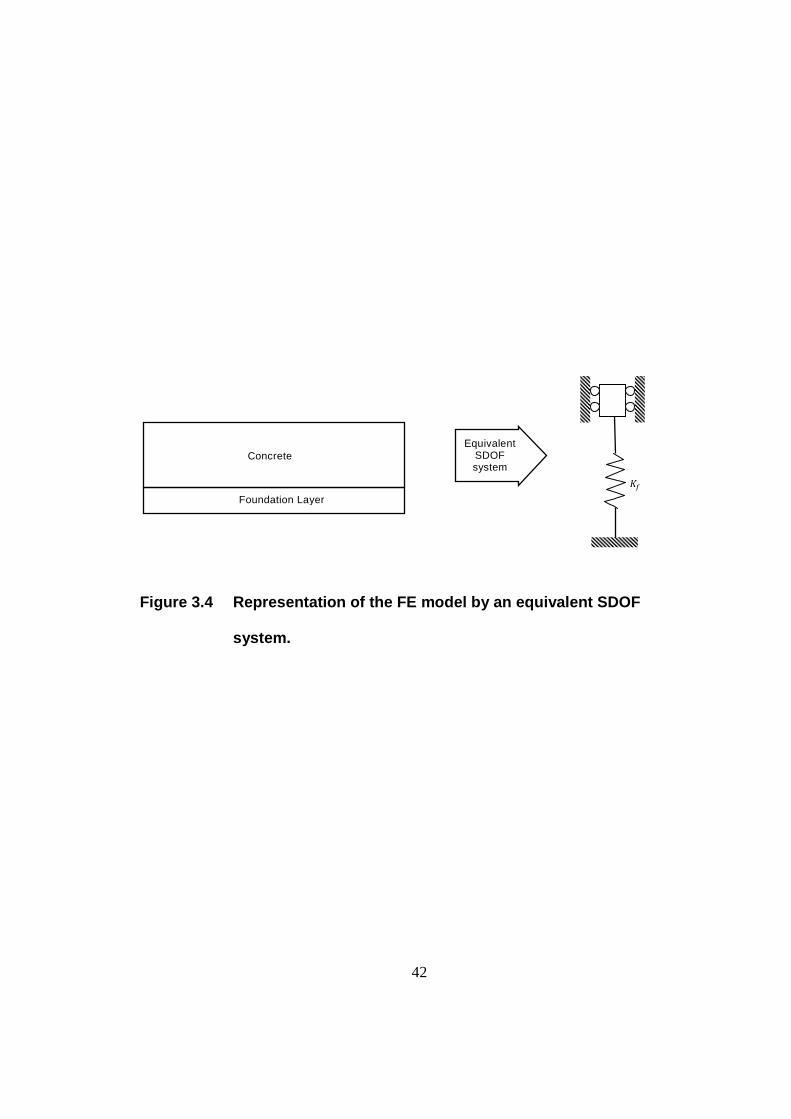
The concrete plate supported by the foundation layer behaves as a rigid body supported
on a soft spring with stiffness equal to the axial stiffness of the foundation layer. When
this system is excited by an impact, the whole assembly vibrates in a piston-mode
�[ similar to the compression and tension of a spring, and the frequency of this piston-
mode can be detected in the amplitude spectrum.
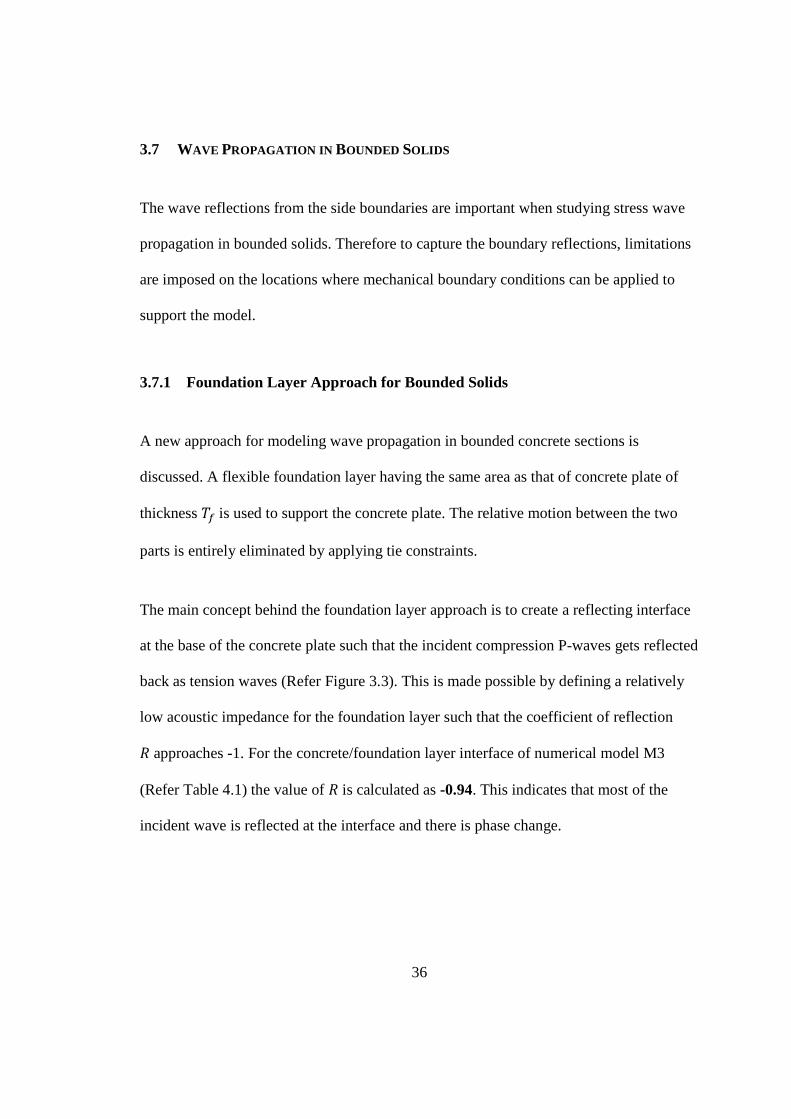
3.7.2.1 Single Degree of Freedom Approximation
The dynamic characteristic of such systems can be approximated by using a single degree
of freedom (SDOF) system represented Figure 3.4 (Chopra, 1995). In this study, the
SDOF model comprised of a massB�, equal to that of a concrete slab, supported on a
spring with stiffness equal to the axial stiffness of the foundation layer 3�given by
Equation 3.7. Here, �is the area, is the elastic modulus and j� is the thickness of the
foundation layer. The circular frequency ZFGHI of the SDOF system is given by Equation
3.8 and the frequency in Hz is calculated by using Equation 3.9.
38
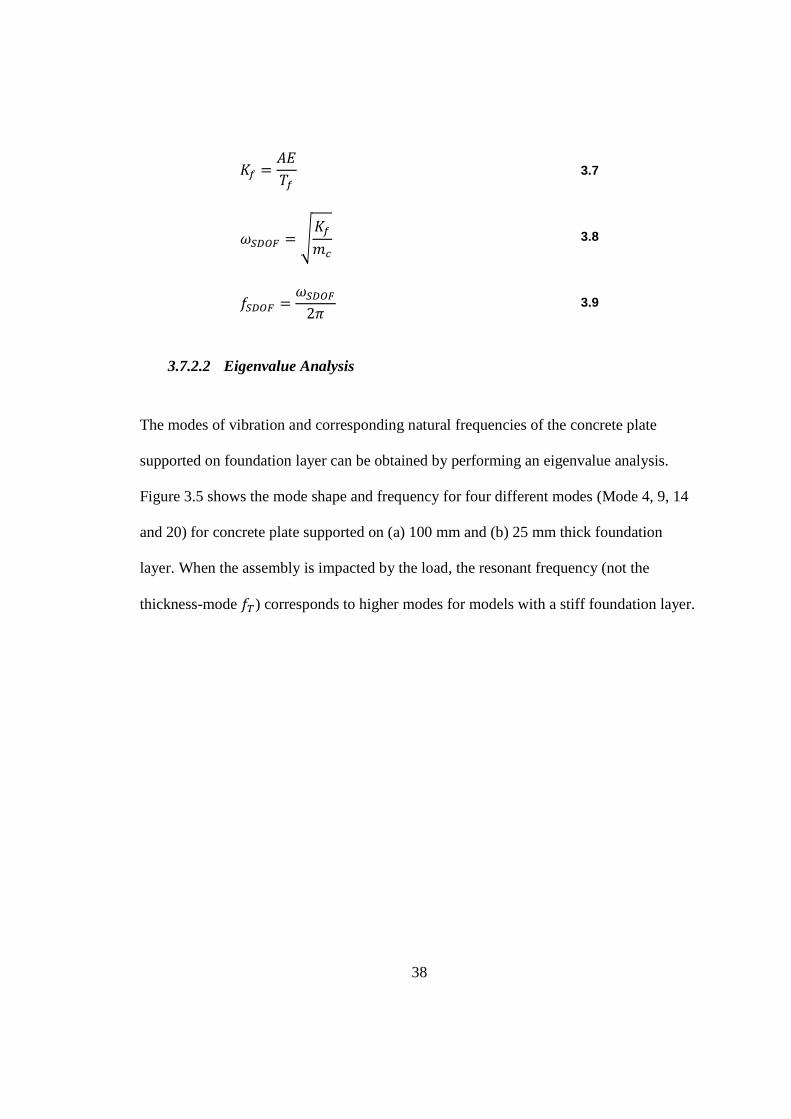
3� = �j� 3.7
ZFGHI = ]3�B� 3.8
�FGHI = ZFGHI2n 3.9
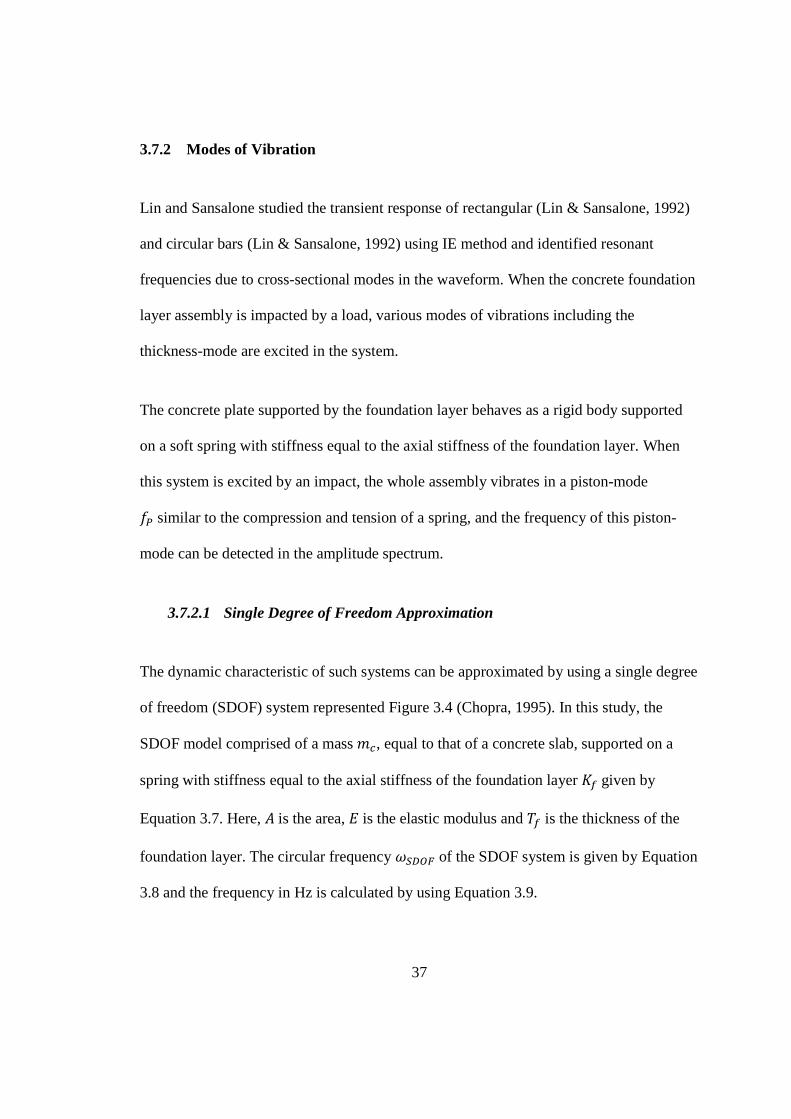
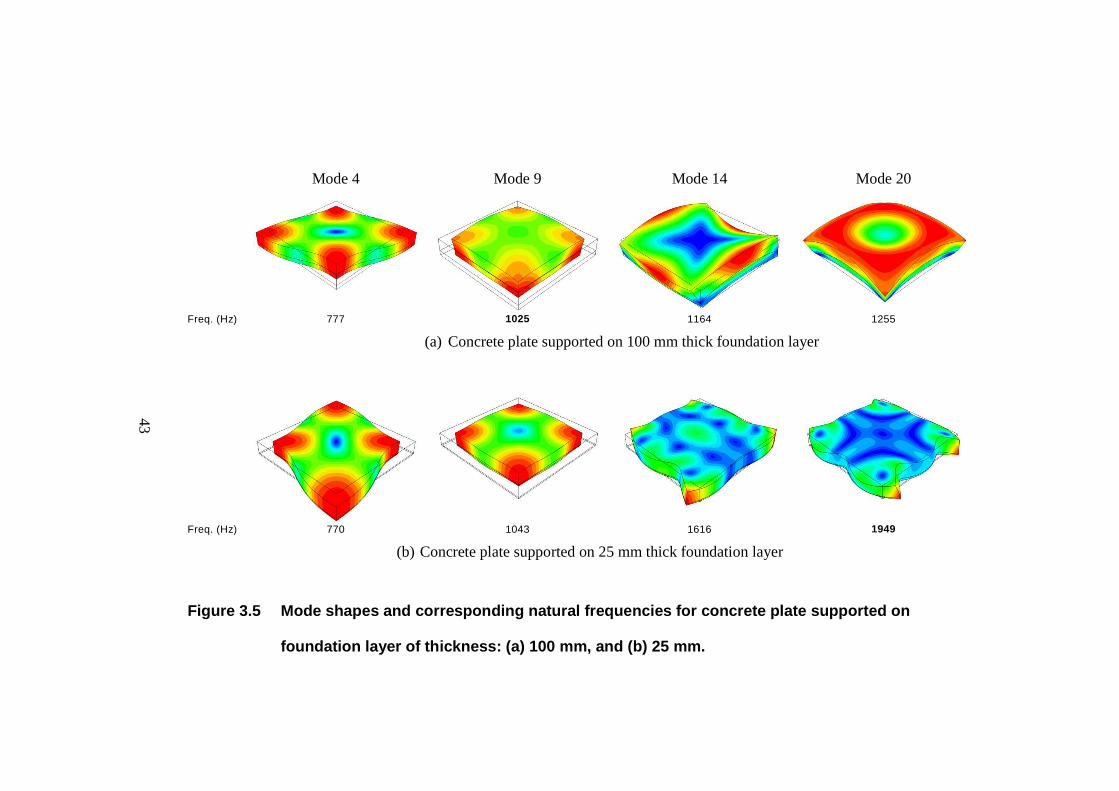
3.7.2.2 Eigenvalue Analysis
The modes of vibration and corresponding natural frequencies of the concrete plate
supported on foundation layer can be obtained by performing an eigenvalue analysis.
Figure 3.5 shows the mode shape and frequency for four different modes (Mode 4, 9, 14
and 20) for concrete plate supported on (a) 100 mm and (b) 25 mm thick foundation
layer. When the assembly is impacted by the load, the resonant frequency (not the
thickness-mode�) corresponds to higher modes for models with a stiff foundation layer.
39
Figure 3.1 HS and HSC force-time function: (a) time history; and, (b)
distribution of frequencies.
(b)
HSC
HSC
HS
HS
(a)
40
Figure 3.2 FE model showing a quarter section of the concrete plate with an ALID boundary region of
length LD as used in analysis M6.
C3D8 with damping
C3D8 w/o damping
Concrete core
ALID LD
41
Figure 3.3 (a) Section showing concrete plate and foundation layer
assembly, and (b) Stress wave behavior at the
concrete/foundation layer interface.
Foundation Layer
Concrete plate
Connected by Tie constraint
Concrete plate
Foundation Layer
(a)
(b)
42
Figure 3.4 Representation of the FE model by an equivalent SDOF
system.
Concrete
Foundation Layer
Equivalent SDOF system 3�
B�
43
Mode 4 Mode 9 Mode 14 Mode 20
Freq. (Hz) 777 1025 1164 1255
(a) Concrete plate supported on 100 mm thick foundation layer
Freq. (Hz) 770 1043 1616 1949
(b) Concrete plate supported on 25 mm thick foundation layer
Figure 3.5 Mode shapes and corresponding natural frequencies for concrete plate supported on
foundation layer of thickness: (a) 100 mm, and (b) 25 mm.
44
CHAPTER 4. PARAMETRIC STUDY OF IMPACT ECHO MODELING
PARAMETERS FOR CONCRETE SLAB EVALUATION
4.1 INTRODUCTION
This chapter describes the modeling approach for impact generated stress wave
propagation in concrete plates. The numerical simulation of a concrete plate impacted by
a steel sphere represented by force-time function was performed using FE software
ABAQUS. Dynamic analyses for all the given cases were performed and time histories
were recorded for a given time period. These waveforms in the time domain were then
converted into frequency domain by the means of fast Fourier transform (FFT) to
generate amplitude spectra for each case.
A list of parameters that influence the wave propagation characteristics was identified. A
total of thirteen computer simulations for the propagation of impact generated stress
waves were run by varying a particular parameter while keeping all the other constraints
constant. The waveforms and the amplitude spectra thus obtained were examined to
quantify the influence of each parameter in the wave propagation characteristics and
thickness frequency detection accuracy. These parameters and their influence on the
behavior of the propagated wave have been discussed in detail in the subsequent sections.
The observations and result for each of the simulations are also discussed.
45
4.2 ANALYSIS MATRIX
Table 4.1 showcases an analyses matrix which tabulates the different parametric set
analyzed in each simulation. These parameters were identified based on the in-depth
literature review of the impact echo method and wave propagation theory in concrete and
other medium. In the following subsections, each significant parameter is discussed in
detail.
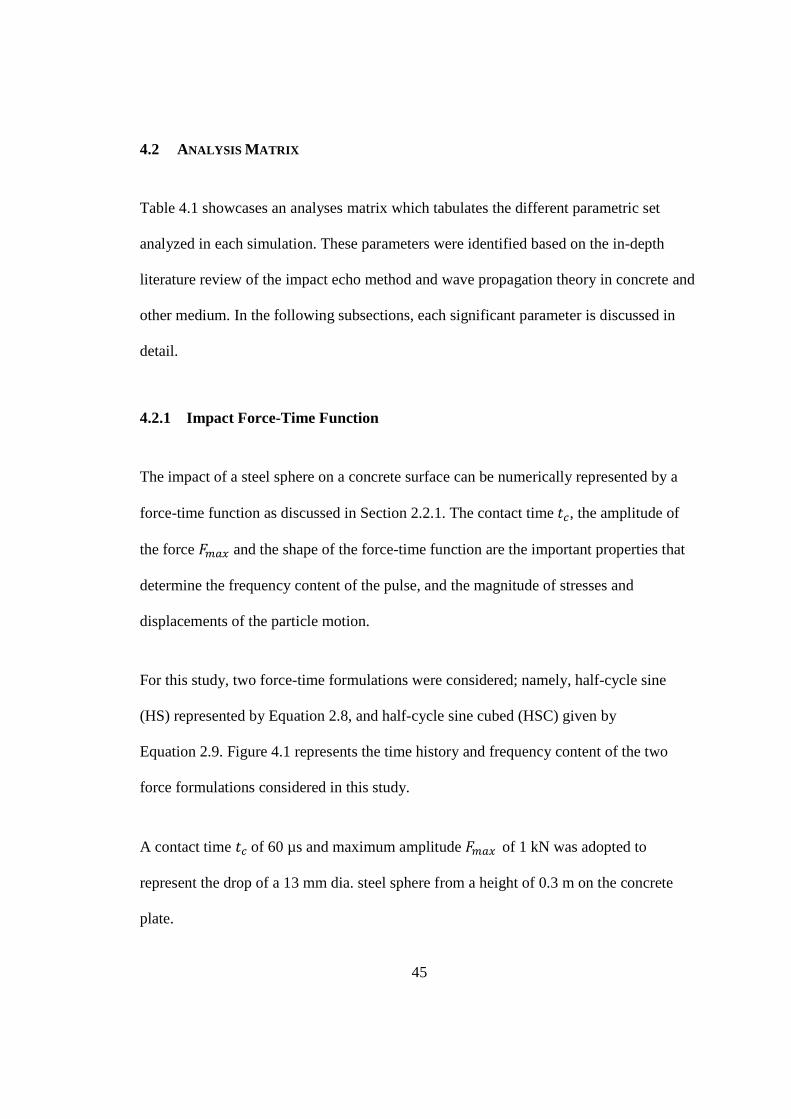
4.2.1 Impact Force-Time Function
The impact of a steel sphere on a concrete surface can be numerically represented by a
force-time function as discussed in Section 2.2.1. The contact time��, the amplitude of
the force ���� and the shape of the force-time function are the important properties that
determine the frequency content of the pulse, and the magnitude of stresses and
displacements of the particle motion.
For this study, two force-time formulations were considered; namely, half-cycle sine
(HS) represented by Equation 2.8, and half-cycle sine cubed (HSC) given by
Equation 2.9. Figure 4.1 represents the time history and frequency content of the two
force formulations considered in this study.
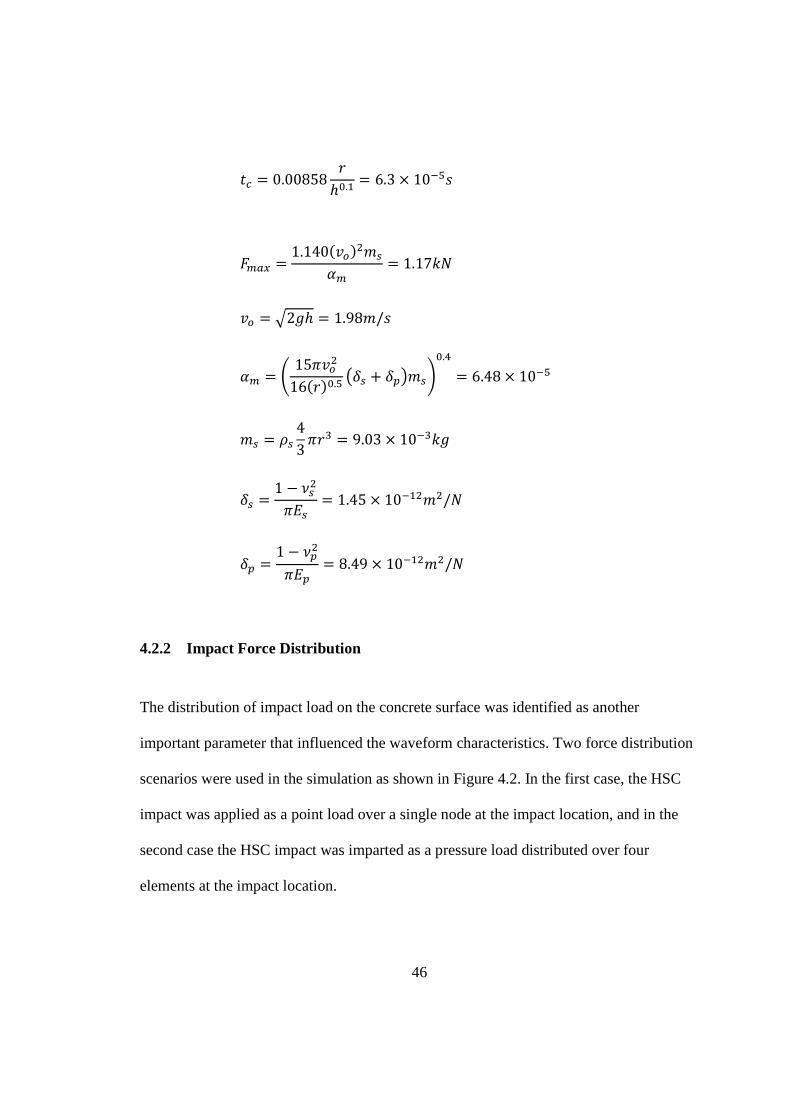
A contact time ��of 60 µs and maximum amplitude ����of 1 kN was adopted to
represent the drop of a 13 mm dia. steel sphere from a height of 0.3 m on the concrete
plate.
46
�� = 0.00858 Nℎr.� = 6.3 × 10�wk
���� = 1.140(OP)�BCt� = 1.17��
OP = }2Kℎ = 1.98B/k t� = u 15nOP�16(N)r.w xyC + yWzBC{r.| = 6.48 × 10�w BC = XC 43nN� = 9.03 × 10���K
yC = 1 − VC�n C = 1.45 × 10���B�/�
yW = 1 − VW�n^W = 8.49 × 10���B�/�
4.2.2 Impact Force Distribution
The distribution of impact load on the concrete surface was identified as another
important parameter that influenced the waveform characteristics. Two force distribution
scenarios were used in the simulation as shown in Figure 4.2. In the first case, the HSC
impact was applied as a point load over a single node at the impact location, and in the
second case the HSC impact was imparted as a pressure load distributed over four
elements at the impact location.
47
4.2.3 Impact Location
Three scenarios with locations��, ��, and �� were studied to understand the effect of
location of the impact load on the resultant waveform and spectrum. The position of these
impacts on the concrete plate is shown in detail in Figure 4.3. Location �� represents the
symmetric case in which the impact is imparted at the center of the plate and is thus
farthest from the side boundary. This case was simulated to minimize the reflections from
the sides and limit the excitation of higher flexural modes due to eccentricity in loading.
Locations �� and �� are asymmetric loading cases, where the influence of the boundary
reflections will distort the resulting waveform. The locations were chosen in a way that
this influence would be higher for�� than��.
4.2.4 Mechanical Boundary Condition
In order to prevent rigid body motion, mechanical boundary conditions are required in FE
software ABAQUS to perform transient dynamic analysis. Three different mechanical
support/boundary conditions were investigated in this study which are discussed in the
following subsections. These boundaries had dissimilar effects on the propagation of
stress waves and the displacements waveforms which are subsequently discussed in detail
in Section 5.3, 5.5 and 5.6.
48
4.2.4.1 Clamped Section
Clamped boundary condition utilizing pin supports were applied on the side of concrete
section of size 2 m×2 m×0.25 m as shown in Figure 4.4. Applying pin supports at all
boundary nodes restricts the translation and rotation of the plate in all directions.
4.2.4.2 Absorbing Layer with Increased Damping
An absorbing layer with increased damping (ALID) was studied to examine its
effectiveness in absorbing the unwanted side reflections due to clamped boundary
conditions. The energy absorbing ALID region of length �Gequal to 250 mm with
specific values of mass proportional Rayleigh damping coefficient��, was built around
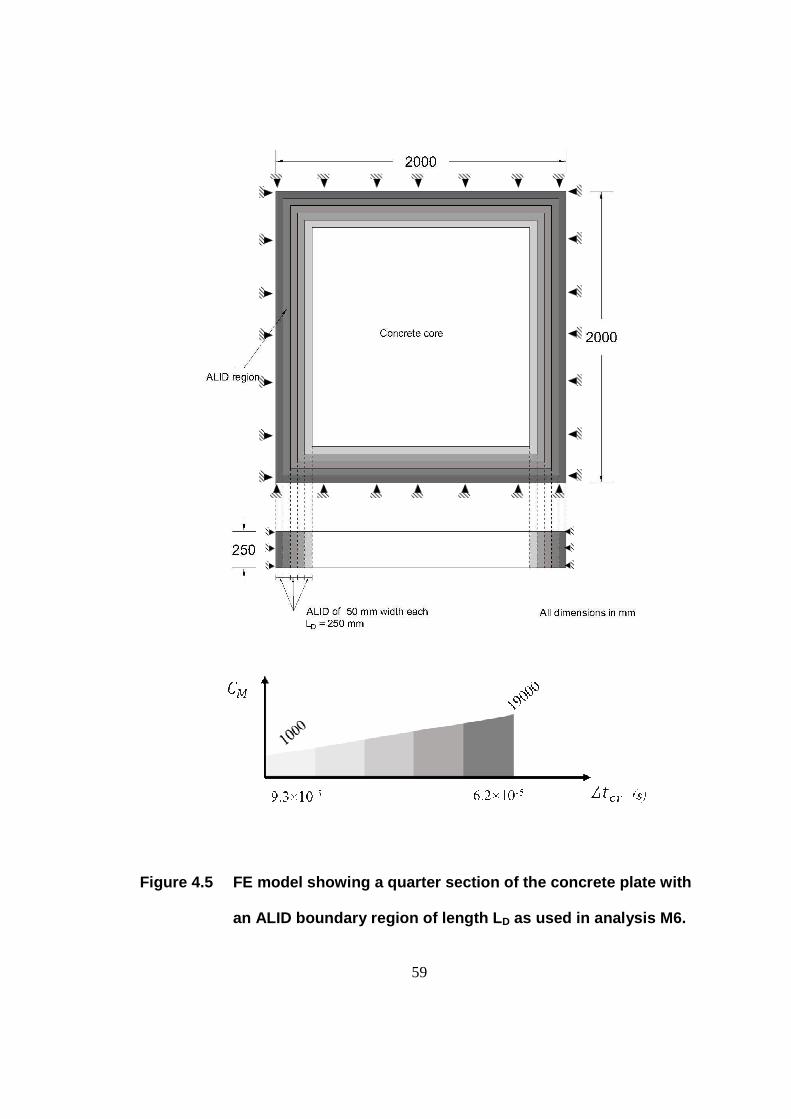
an elastic concrete core as shown in Figure 4.5.
The energy absorbing region ALID, consisting of five different layers each measuring
50 mm in width (total length LD of 250 mm), was built around the sides of the elastic
concrete core. Each layer was assigned the same material properties as that of the
concrete core with an additional mass proportional Rayleigh damping coefficient��.
This coefficient introduces damping forces corresponding to the absolute velocities of the
model and simulates a viscous damper that absorbs the boundary reflections. The value of
�� was chosen to increase in linear steps from 1000 to 19000 for each progressive layer.
49
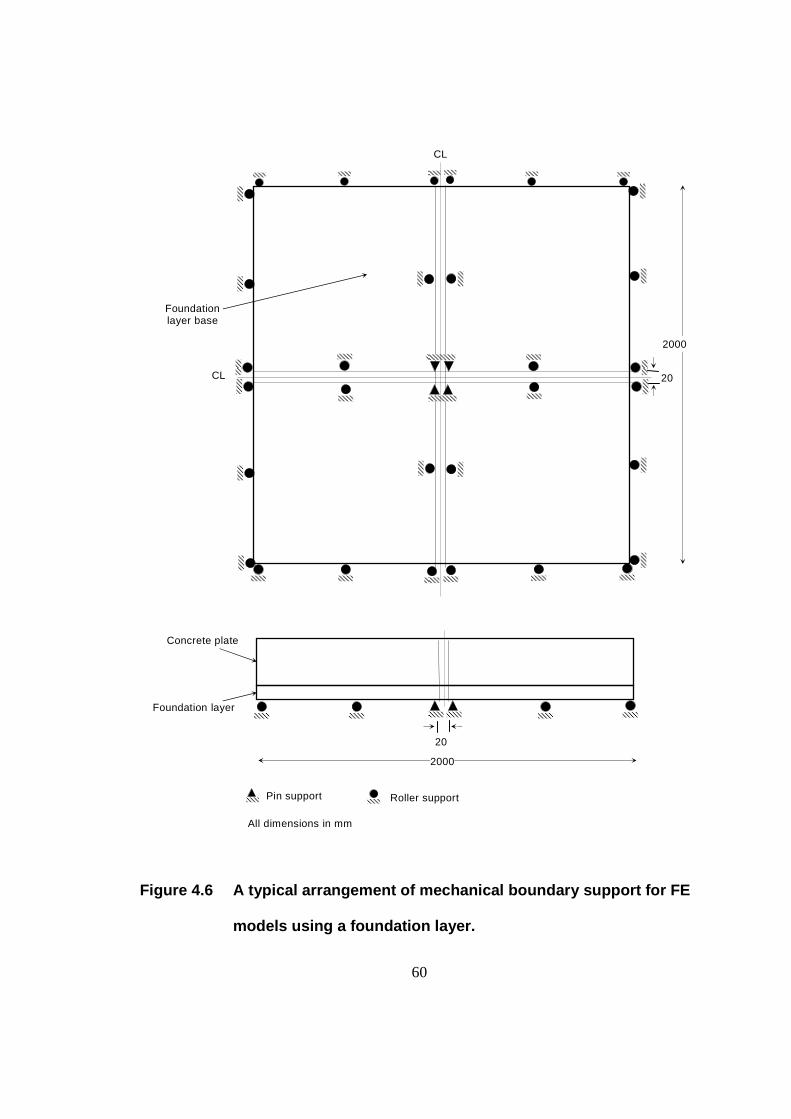
4.2.4.3 Foundation Layer
The boundary condition for FE model of bounded section consisted of a flexible
foundation layer on which the concrete plate was supported. The concrete and FL part
were perfectly tied together to avoid relative deformation between them. Mechanical
supports consisting of pin and roller supports as shown in Figure 4.6 were then applied at
the bottom of the foundation layer to support the concrete-plate assembly. This restricted
the vertical and horizontal translations, and rotations about the vertical axis of the
concrete slab.
4.2.5 Foundation Layer Properties
The stiffness and the acoustic impedance of the foundation layer were identified as the
major parameters that influence the waveform characteristics and effectiveness of the
boundary condition in identifying the thickness frequency.
4.2.5.1 Stiffness
To evaluate the influence of foundation layer stiffness on the dynamic and wave
propagation characteristics, a parameter �defined as ratio of plate stiffness to
foundation layer stiffness was investigated. Four simulations with constant concrete plate
stiffness and varying foundation layer stiffness were run. These values of the foundation
layer stiffness were achieved by adopting a different foundation layer thickness while
keeping the elastic modulus same.
50
4.2.5.2 Acoustic Impedance
To study the effect of acoustic impedance on the wave propagation and dynamic
characteristics, a parameter �defined as the ratio of acoustic impedance of plate to that
of foundation layer was explored. As shown in Table 4.1, four simulations, each with a
constant acoustic impedance of concrete plate and a different value of acoustic
impedance of foundation layer were run. The specific value of impedance for foundation
layer was achieved by varying the elastic modulus and density of the layer.
4.3 FINITE ELEMENT MODEL OVERVIEW
The finite element analysis of the propagation of impact generated stress wave in a
concrete plate was carried out using FE software ABAQUS. Dynamic time history
analysis was performed initially using the implicit solver in ABAQUS due to its
unconditional stability. Simulations were also run using dynamic/explicit solver, which
meet the conditional stability criteria discussed in Section 3.5.2. The use of an explicit
solver yielded the same displacement histories as the implicit solver, but it significantly
reduced overall computational time.
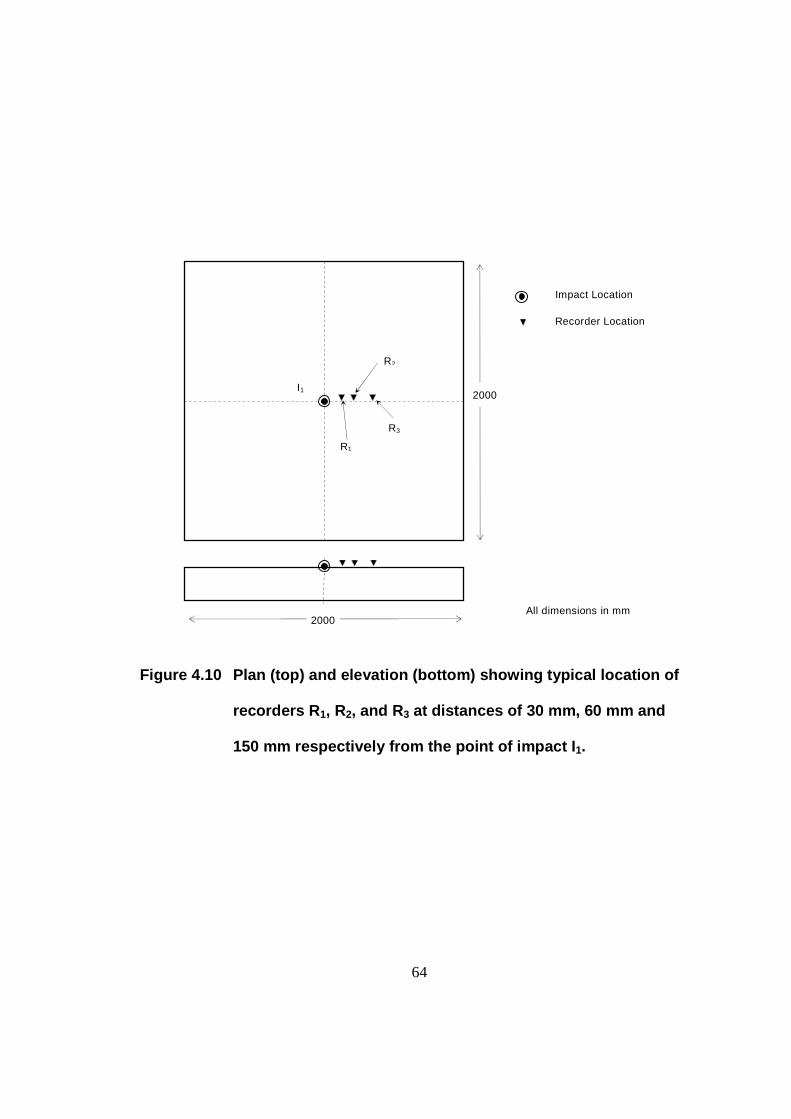
The force-time function was applied as an amplitude load at the impact location for each
simulation. Displacement time-histories were recorded at nodes R1, R2, and R3 at distance
of 30 mm, 60 mm and 150 mm from the location of impact as shown in Figure 4.10. Each
simulation was run for a total time of 1 ms and the displacements at the nodes were
recorded at an interval of 1 µs. These time-histories were then processed using fast
51
Fourier transform (FFT) using Matlab to obtain the amplitude spectra in the frequency
domain.
4.3.1 Section Properties
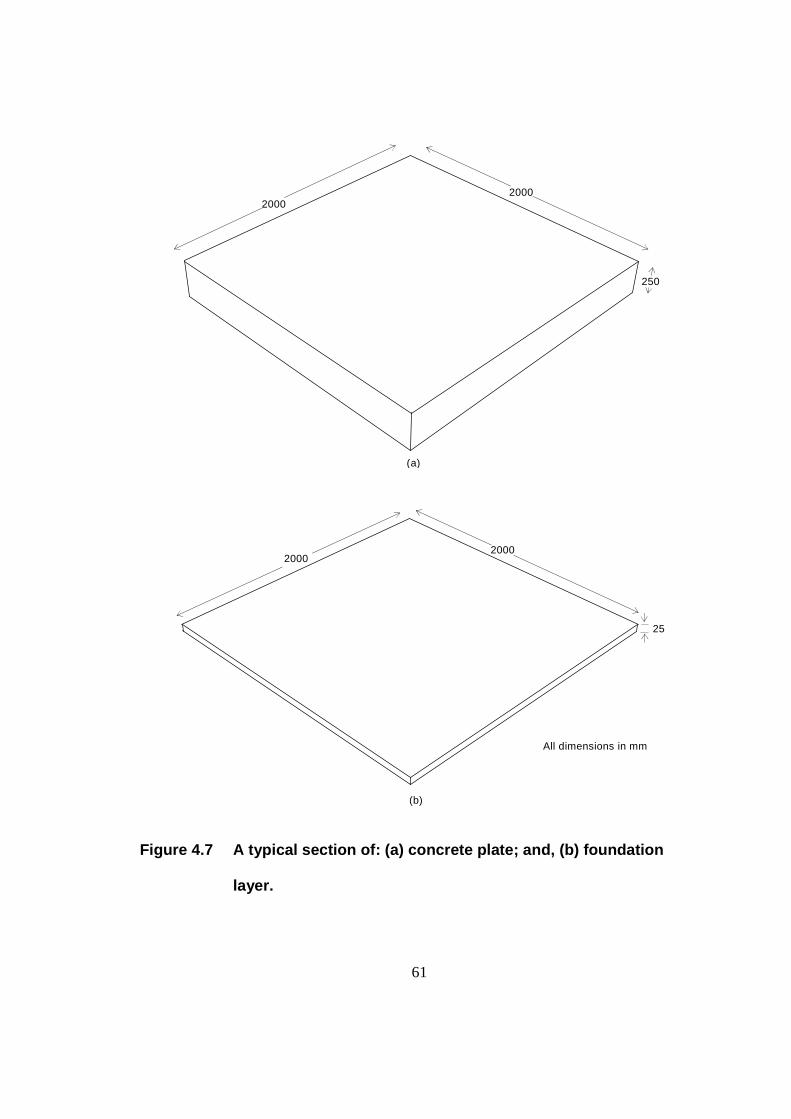
The concrete plate was modeled as a 3D deformable solid with dimensions measuring
2 m×2 m×0.25 m as shown in Figure 4.7 (a). An isotropic, homogenous and linear elastic
material with properties listed in Table 4.2 was used to define the concrete medium. The
P-, S- and R-wave velocities of the propagating stress wave in the concrete were
calculated to be 4025 m/s, 2465 m/s and 2239 m/s respectively.
Similarly, the foundation layer with dimensions 2 m×2 m and variable thickness was
modeled using an isotropic, homogenous and linear elastic material. The thickness of the
layer was varied for different simulation cases as discussed in Section 5.5. The isometric
view of a 25 mm thick foundation layer and its properties are given in Figure 4.7 (b) and
Table 4.2 respectively.
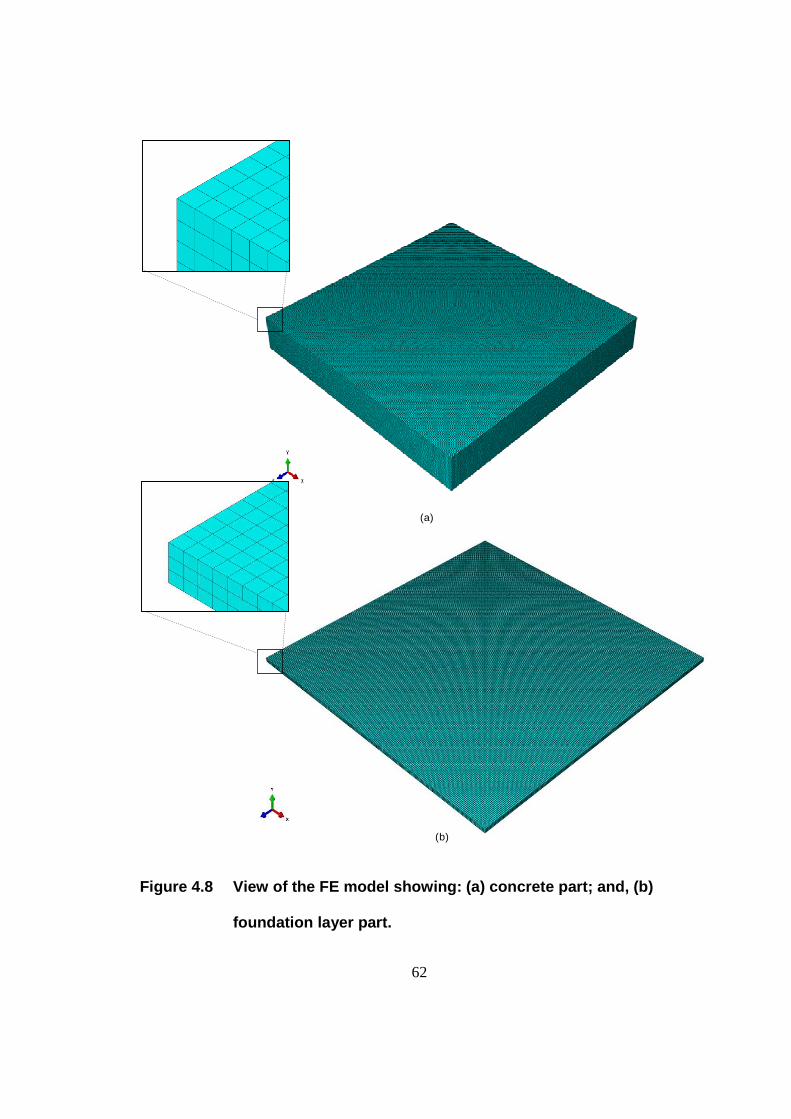
4.3.2 Element Discretization
8-node linear brick continuum elements (C3D8) were used to discretize the concrete and
the foundation layer in all the simulations. Figure 4.8 represents the FE model of the
concrete and foundation layer sections. Elements of size of 10 mm×10 mm×10 mm were
used as shown in Figure 4.9. A total of 1×10⁶ elements were used to represent the
concrete plate (2 m×2 m×0.25 m) and 12,000 elements were used to represent the

52
foundation layer (2 m×2 m×0.025 m).The ALID boundary was also discretized in the
same manner as the concrete core with C3D8 linear elements of size
10 mm×10 mm×10 mm..
53
Table 4.1 Analysis matrix comparing various parameters used in the study.
ID Force-time Function
Force Distribution
Impact Location
Boundary Condition Foundation Layer
Properties
HS HSC Point Pressure �� �� �� Clamped ALID Foundation
Layer � �
M1 � � � � 1.16 34 M2 � � � � 1.16 34 M3 � � � � 1.16 34 M4 � � � � M5 � � � � M6 � � � � 0.47 34 M7 � � � � 2.33 34 M8 � � � � 4.67 34 M9 � � � � 1.16 5886 M10 � � � � 1.16 111 M11 � � � � 1.16 10.8 M12 � � � � 1.16 34 M13 � � � � 1.16 34
54
Table 4.2 Properties of 250 mm thick structural concrete and 25 mm
thick foundation layer.
Property Units Concrete Foundation Layer Thickness, j (mm) 250 25
Area (m2) 4 4 Modulus of elasticity, (GPa) 35 3
Poisson’s ratio, V - 0.2 0.3 Density, X (Kg/m3) 2400 20
P-wave velocity, �[ (m/s) 4025 14210 Acoustic impedance, A (Kg/m2 − s) 9.66×10⁶ 2.84×10⁵
Axial stiffness, 3 (N/m) 5.6×10¹¹ 4.8×10¹¹
55
Figure 4.1 HS and HSC force-time function: (a) time history; and, (b) distribution of
frequencies.
(b)
HSC
HSC
HS
HS
(a)
56
Figure 4.2 Distribution of impact force over: (a) single node; and, (b) nine
nodes.
All dimensions in mm
250
2000
2000
250
2000
(b)
(a)
57
Figure 4.3 Plan showing locations of the impact load I1, I2, and I3 on the concrete plate.
1000
1000
1000
500
500 1000
All dimensions in mm
I3
Impact Location
I2 I1
58
Figure 4.4 Clamped boundary support for concrete section pertaining to
analysis M5.
Concrete plate
Concrete plate
Pin support
59
Figure 4.5 FE model showing a quarter section of the concrete plate with
an ALID boundary region of length LD as used in analysis M6.
60
Figure 4.6 A typical arrangement of mechanical boundary support for FE
models using a foundation layer.
Foundation layer base
Concrete plate
Foundation layer
20
2000
2000
20
CL
CL
Roller support Pin support
All dimensions in mm
61
Figure 4.7 A typical section of: (a) concrete plate; and, (b) foundation
layer.
2000
250
2000
All dimensions in mm
2000
25
2000
(a)
(b)
62
Figure 4.8 View of the FE model showing: (a) concrete part; and, (b)
foundation layer part.
(a)
(b)
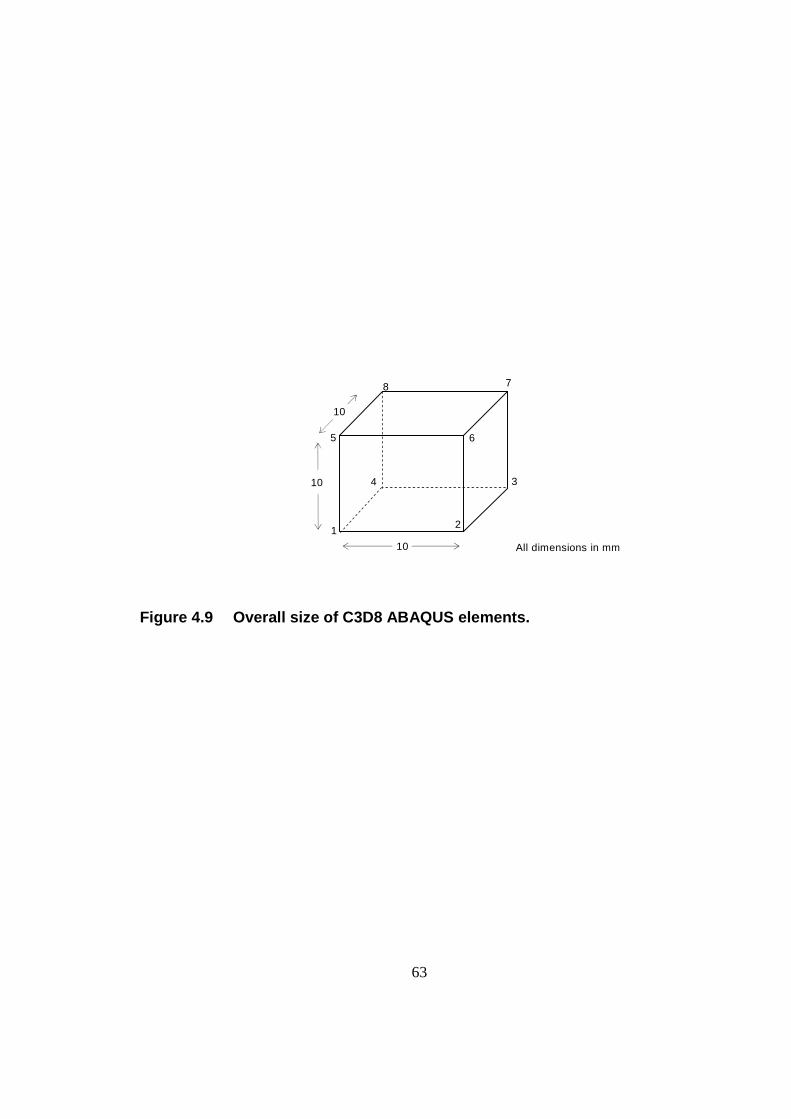
63
Figure 4.9 Overall size of C3D8 ABAQUS elements.
5
8 7
3
21
4
6
10
10
10 All dimensions in mm
64
Figure 4.10 Plan (top) and elevation (bottom) showing typical location of
recorders R1, R2, and R3 at distances of 30 mm, 60 mm and
150 mm respectively from the point of impact I1.
R1
R2
R3
2000
2000
Impact Location
Recorder Location
All dimensions in mm
I1
65
CHAPTER 5. RESULTS AND DISCUSSION
A total of thirteen FE simulations were run to study the influence of parameters identified
in Chapter 4. In this chapter, the results and observations for the analysis cases are
compared to signify the influence each parameter on wave propagation characteristics.
Displacement time-histories recorded at node R1 (at a distance 30 mm from impact
location) was considered for comparing the waveforms for all the simulation. A
frequency resolution of 122 Hz, achieved by zero-padding, was used to resolve the
amplitude spectra in the frequency domain. The thickness-mode frequency � for the
0.25 m thick concrete plate was determined as 7671 Hz according to Equation 2.12.
5.1 IMPACT FORCE-TIME FUNCTION
Two simulations M1 with HS and M2 with HSC force-time functions (listed in Table 5.1)
were run to study the effect of force-time function on the waveform characteristics. These
force-time function parameters are introduced in Section 4.2.1.
Figure 5.1 compares the displacement time-histories for the two simulation cases. A high
frequency artificial ringing was observed for M1, and this is attributed to the steeper
initial slope of the HS force function. A gradual slope at the start of the applied force as
in the case of HSC reduced the artificial ringing.
66
Figure 5.2 compares the amplitude spectra for the two cases. The artificial ringing
observed for M1 in the displacement-time-history was also translated to the amplitude
spectrum represented by the peak at 48 kHz. This ringing however does not hinder the
accuracy of the amplitude spectrum in measuring the thickness-mode frequency. For both
M1 and M2, the peak corresponding to the thickness-mode ��J was observed at 7813 Hz
which is comparable to � of 7671 Hz. Another peak was observed at 1953 Hz which
corresponds to the piston-mode frequency �[ of the system that is discussed in Section
3.7.2.
5.1.1 Summary
The formulation of force-time function is important in determining the maximum
frequency of useful energy. For the same contact time ��and amplitude ����half-cycle
sine cubed (HSC) yields a higher maximum useful frequency than the half-cycle sine
(HS). Modeling the impact load by HS force-time function induces high frequency
oscillations or “ringing” in the waveform. This can be eliminated by using HSC
formulation which has a softer initial slope.
67
Table 5.1 Summary of analyses evaluated to study force-time function.
ID Force-time Function
Force Distribution
Impact Location
Boundary Condition Foundation Layer
Properties
HS HSC Point Pressure �� �� �� Clamped ALID Foundation
Layer � �
M1 � � � � 1.16 34 M2 � � � � 1.16 34
68
Figure 5.1 Comparison of displacement time-history for models with force-time function modeled as HS
(M1) and HSC (M2).
M1
M2
69
Figure 5.2 Comparison of amplitude spectra for models with force-time function modeled as HS (M1) and
HSC (M2).
M1
M2
70
5.2 IMPACT FORCE DISTRIBUTION
Two simulations were run with HSC force-time loading distributed over; (a) single node
for M2; and, (b) nine nodes (four elements) for M3 (Refer Table 5.2). Figure 5.3
represents the time-histories for the two cases.
In the case of M2, applying the impact over a single node led to localized deformations
on the surface and undulations were observed at the beginning of the displacement time-
history. Redistributing the impact load over four elements helped in eliminating the
undulations due to localized deformations.
Figure 5.4 shows the amplitude spectra for models M2 and M3. No notable difference
except in the amplitude values were observed for both the case. The piston-mode and
thickness-mode frequency peaks were observed at 1953 Hz and 7813 Hz for both the
cases.
5.2.1 Summary
Localized deformation of the concrete surface takes place (represented by undulations in
the displacement history) when the impact load is concentrated over a single node. This
effect can be eliminated by modeling the impact load as a pressure load distributed over
two or more nodes. However modeling the impact as concentrated load does not affect
the accuracy of the thickness-mode frequency.
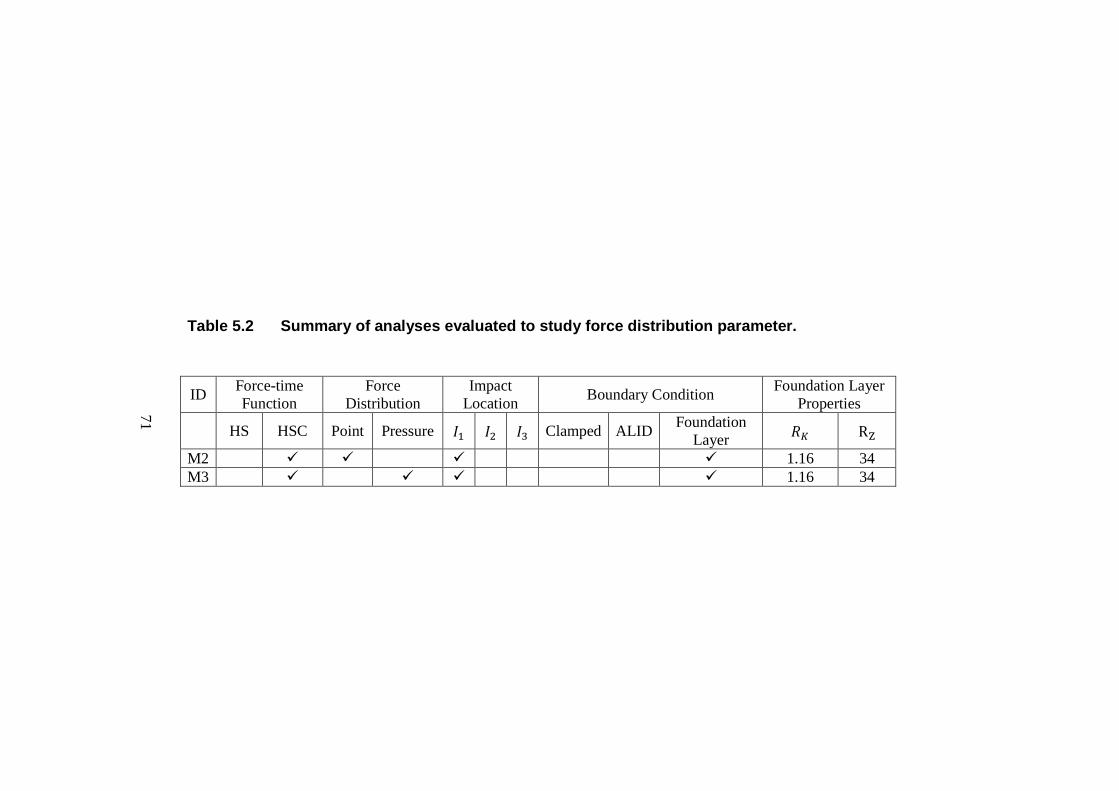
71
Table 5.2 Summary of analyses evaluated to study force distribution parameter.
ID Force-time Function
Force Distribution
Impact Location
Boundary Condition Foundation Layer
Properties
HS HSC Point Pressure �� �� �� Clamped ALID Foundation
Layer � R�
M2 � � � � 1.16 34 M3 � � � � 1.16 34
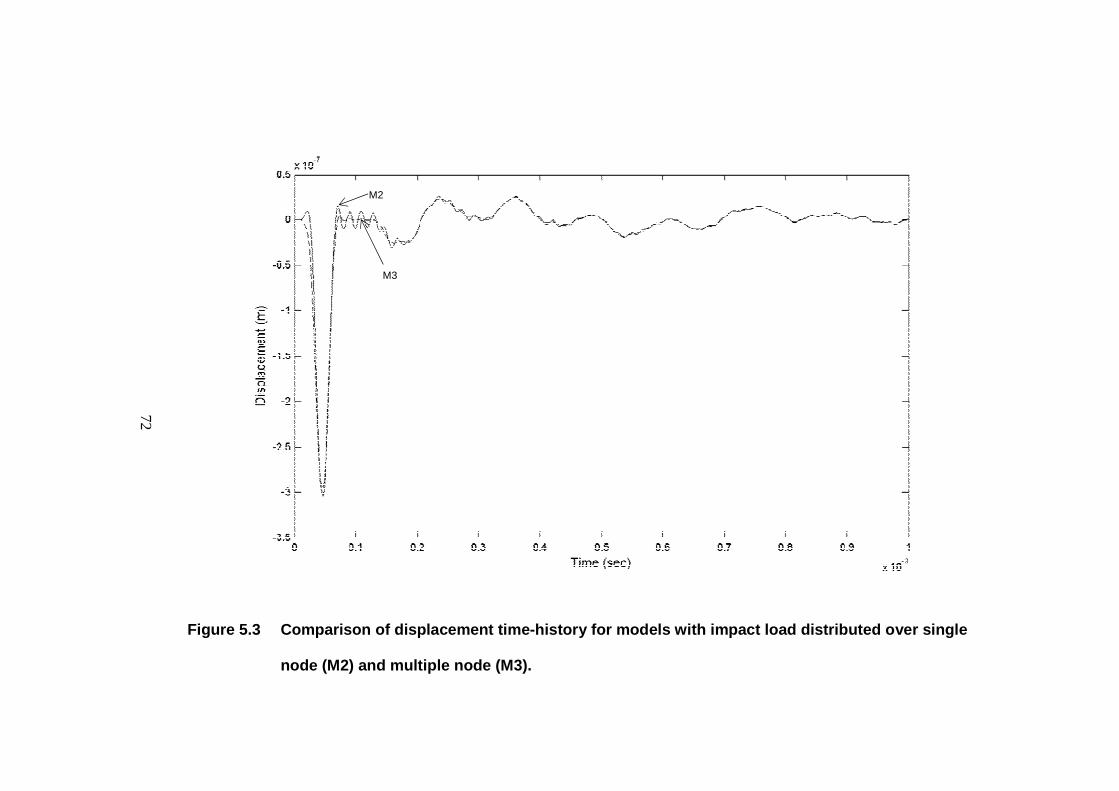
72
Figure 5.3 Comparison of displacement time-history for models with impact load distributed over single
node (M2) and multiple node (M3).
M2
M3
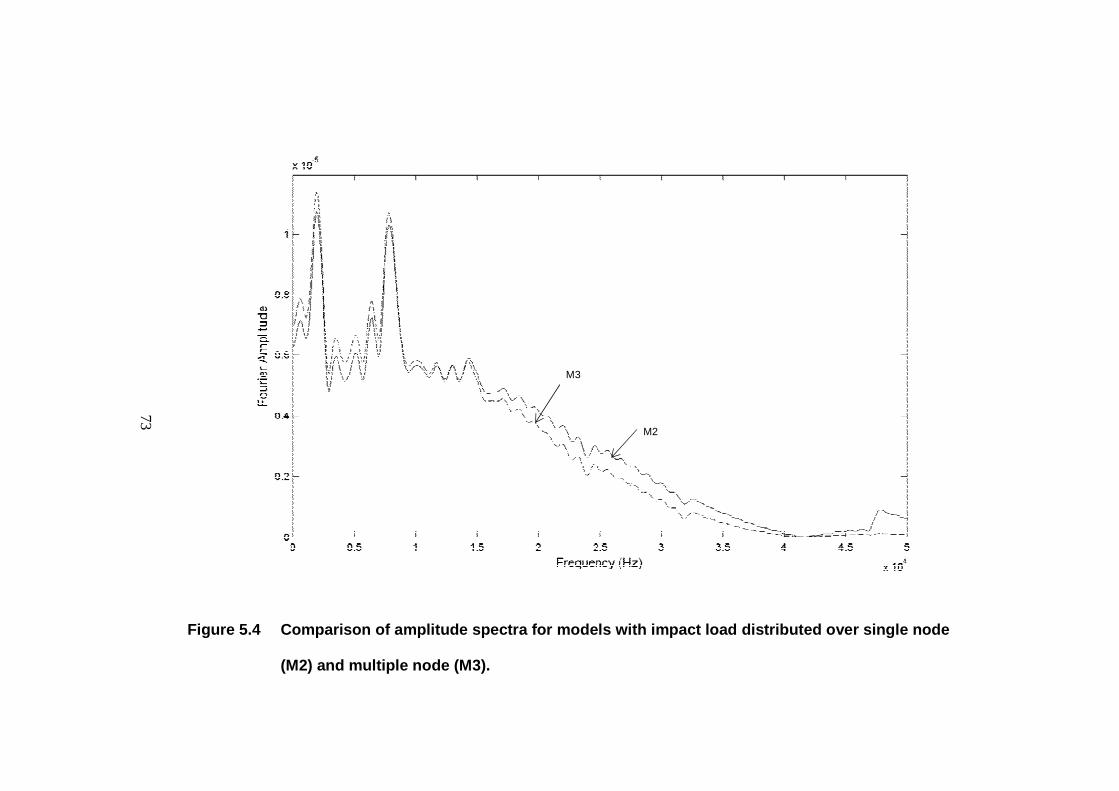
73
Figure 5.4 Comparison of amplitude spectra for models with impact load distributed over single node
(M2) and multiple node (M3).
M2
M3
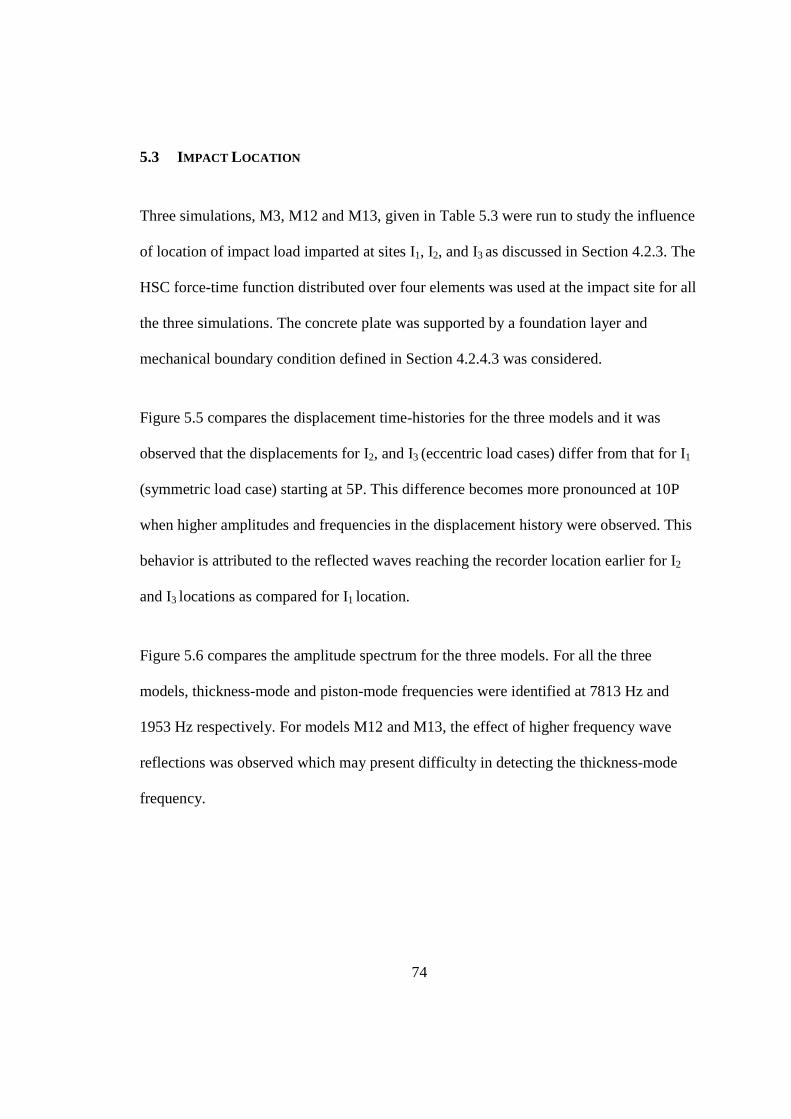
74
5.3 IMPACT LOCATION
Three simulations, M3, M12 and M13, given in Table 5.3 were run to study the influence
of location of impact load imparted at sites I1, I2, and I3 as discussed in Section 4.2.3. The
HSC force-time function distributed over four elements was used at the impact site for all
the three simulations. The concrete plate was supported by a foundation layer and
mechanical boundary condition defined in Section 4.2.4.3 was considered.
Figure 5.5 compares the displacement time-histories for the three models and it was
observed that the displacements for I2, and I3 (eccentric load cases) differ from that for I1
(symmetric load case) starting at 5P. This difference becomes more pronounced at 10P
when higher amplitudes and frequencies in the displacement history were observed. This
behavior is attributed to the reflected waves reaching the recorder location earlier for I2
and I3 locations as compared for I1 location.
Figure 5.6 compares the amplitude spectrum for the three models. For all the three
models, thickness-mode and piston-mode frequencies were identified at 7813 Hz and
1953 Hz respectively. For models M12 and M13, the effect of higher frequency wave
reflections was observed which may present difficulty in detecting the thickness-mode
frequency.
75
5.3.1 Summary
For the concrete plate with foundation layer boundary condition, eccentric impact loading
does not excite any higher flexural mode other than the piston-mode of the foundation
layer. However, the displacement histories for eccentric deviates from that of symmetric
loading at around 5P owing to the early arrival of the P-waves reflected from the free
boundary of the concrete plate. This deviation becomes profound at around 10P during
which the side wave reflections increases.
76
Table 5.3 Summary of analyses evaluated to study influence of impact load location.
ID Force-time Function
Force Distribution
Impact Location
Boundary Condition Foundation Layer
Properties
HS HSC Point Pressure I� I� I� Clamped ALID Foundation
Layer R� R�
M3 � � � � 1.16 34 M12 � � � � 1.16 34 M13 � � � � 1.16 34
77
Figure 5.5 Comparison of displacement time-histories for different impact locations on a concrete plate.
5 P 10 P
M12 M13
M3
78
Figure 5.6 Comparison of amplitude spectra for different impact locations on a concrete plate.
M13
M12 M3
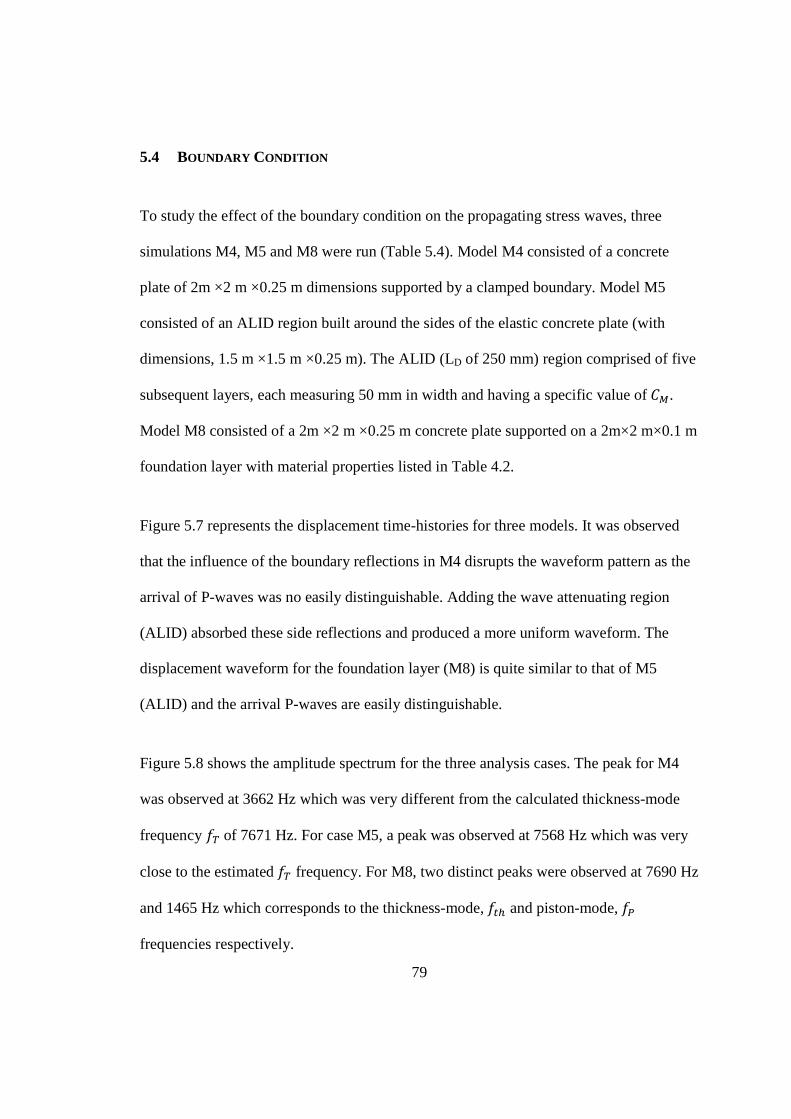
79
5.4 BOUNDARY CONDITION
To study the effect of the boundary condition on the propagating stress waves, three
simulations M4, M5 and M8 were run (Table 5.4). Model M4 consisted of a concrete
plate of 2m ×2 m ×0.25 m dimensions supported by a clamped boundary. Model M5
consisted of an ALID region built around the sides of the elastic concrete plate (with
dimensions, 1.5 m ×1.5 m ×0.25 m). The ALID (LD of 250 mm) region comprised of five
subsequent layers, each measuring 50 mm in width and having a specific value of��.
Model M8 consisted of a 2m ×2 m ×0.25 m concrete plate supported on a 2m×2 m×0.1 m
foundation layer with material properties listed in Table 4.2.
Figure 5.7 represents the displacement time-histories for three models. It was observed
that the influence of the boundary reflections in M4 disrupts the waveform pattern as the
arrival of P-waves was no easily distinguishable. Adding the wave attenuating region
(ALID) absorbed these side reflections and produced a more uniform waveform. The
displacement waveform for the foundation layer (M8) is quite similar to that of M5
(ALID) and the arrival P-waves are easily distinguishable.
Figure 5.8 shows the amplitude spectrum for the three analysis cases. The peak for M4
was observed at 3662 Hz which was very different from the calculated thickness-mode
frequency �of 7671 Hz. For case M5, a peak was observed at 7568 Hz which was very
close to the estimated� frequency. For M8, two distinct peaks were observed at 7690 Hz
and 1465 Hz which corresponds to the thickness-mode,��J and piston-mode,�[
frequencies respectively.
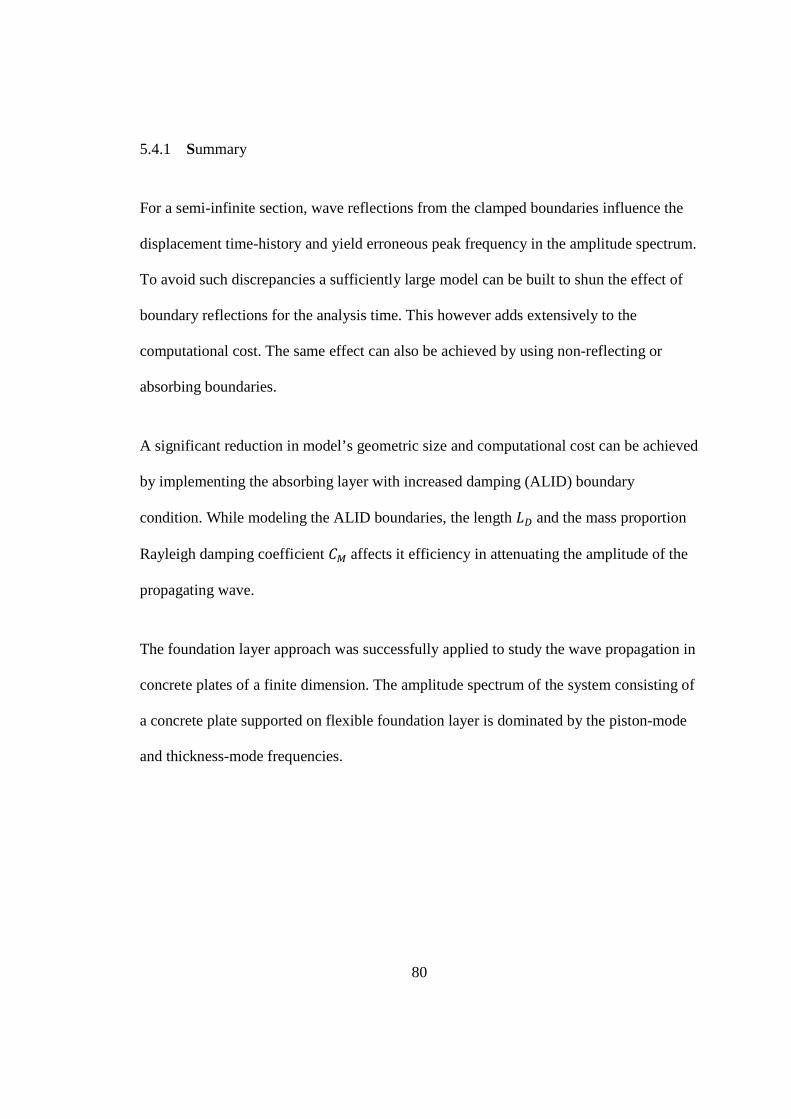
80
5.4.1 Summary
For a semi-infinite section, wave reflections from the clamped boundaries influence the
displacement time-history and yield erroneous peak frequency in the amplitude spectrum.
To avoid such discrepancies a sufficiently large model can be built to shun the effect of
boundary reflections for the analysis time. This however adds extensively to the
computational cost. The same effect can also be achieved by using non-reflecting or
absorbing boundaries.
A significant reduction in model’s geometric size and computational cost can be achieved
by implementing the absorbing layer with increased damping (ALID) boundary
condition. While modeling the ALID boundaries, the length �Gand the mass proportion
Rayleigh damping coefficient ��affects it efficiency in attenuating the amplitude of the
propagating wave.
The foundation layer approach was successfully applied to study the wave propagation in
concrete plates of a finite dimension. The amplitude spectrum of the system consisting of
a concrete plate supported on flexible foundation layer is dominated by the piston-mode
and thickness-mode frequencies.
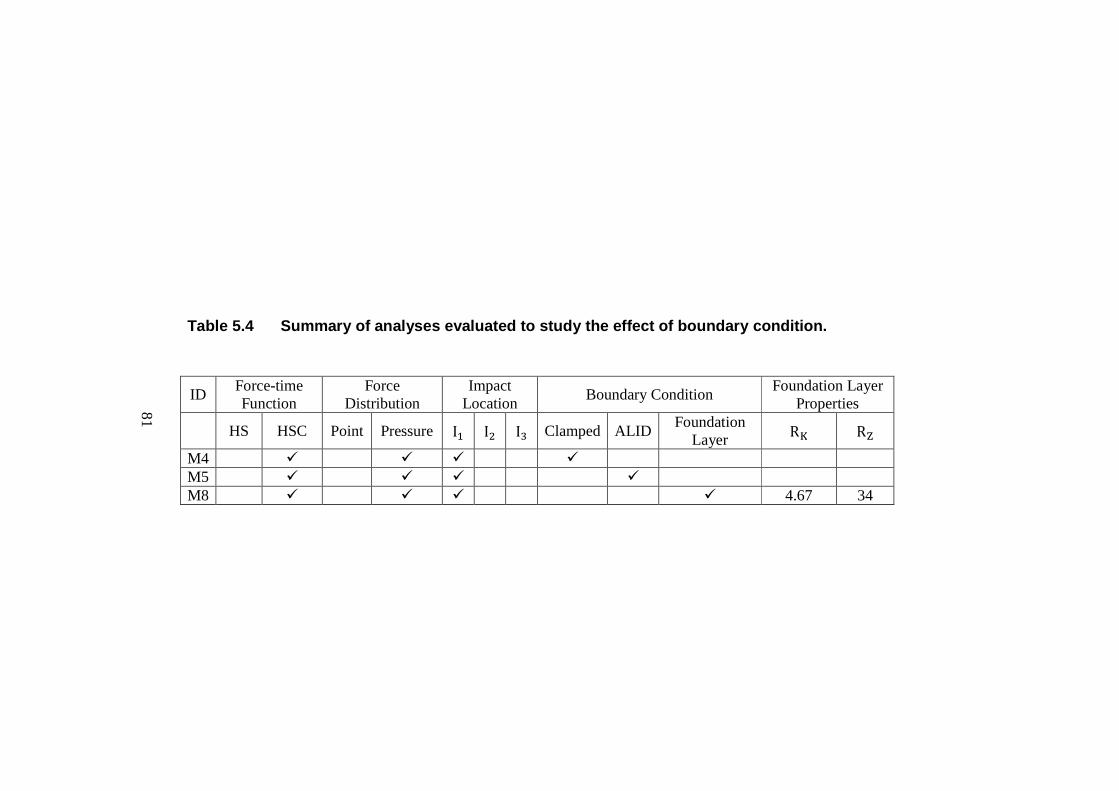
81
Table 5.4 Summary of analyses evaluated to study the effect of boundary condition.
ID Force-time Function
Force Distribution
Impact Location
Boundary Condition Foundation Layer
Properties
HS HSC Point Pressure I� I� I� Clamped ALID Foundation
Layer R� R�
M4 � � � � M5 � � � � M8 � � � � 4.67 34
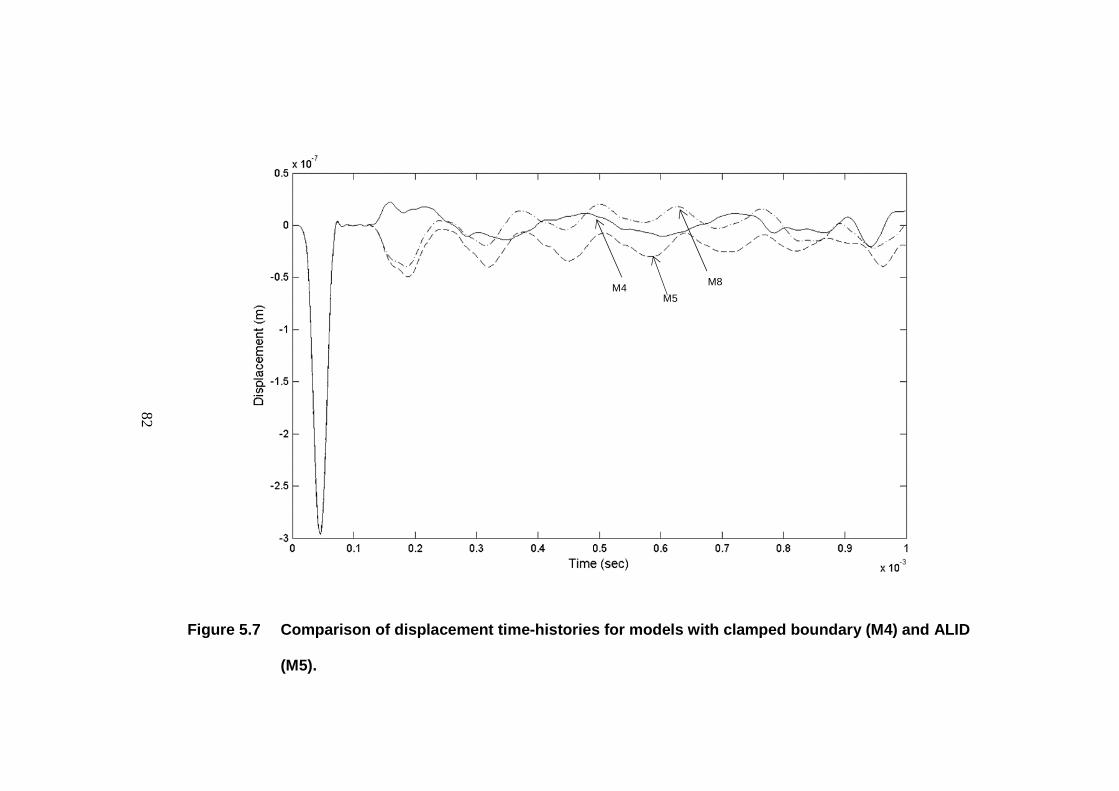
82
Figure 5.7 Comparison of displacement time-histories for models with clamped boundary (M4) and ALID
(M5).
M5 M4
M8
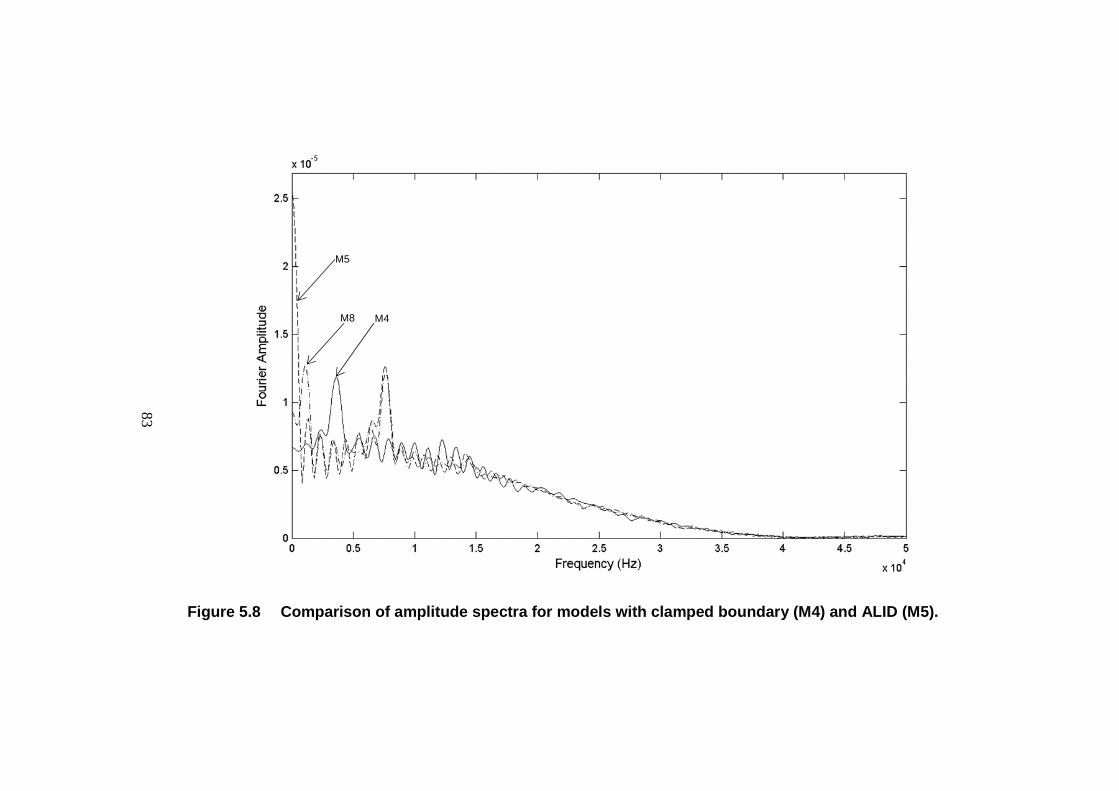
83
Figure 5.8 Comparison of amplitude spectra for models with clamped boundary (M4) and ALID (M5).
M4 M8
M5
84
5.5 PLATE-FOUNDATION LAYER STIFFNESS RATIO RK
Four simulations M3, M6, M7 and M8 with concrete plate-foundation stiffness ratio RK
of 1.16, 0.47, 2.33 and 4.67 were analyzed as summarized in Table 5.5. These values of
stiffness ratio were obtained by varying the thickness of the foundation layer for each
model (as given in Table 5.5) while keeping all other properties of the foundation layer
constant. No change to the section or material properties of the concrete plate was made.
Figure 5.9 represents the displacement time-histories for the set of simulations used in
this parametric study. The amplitude and period of the displacements varied for the
different simulations. The amplitude spectra for the respective models are shown in
Figure 5.10. The piston-mode frequencies were also detected in the FFT plot, and their
values are listed in Table 5.6 along with thickness-mode frequencies. The fundamental
frequencies of the equivalent SDOF system are also presented in this table.
The FFT plot for analysis case M6 with RK value of 0.47 showed some ambiguity in the
detection of thickness-mode frequency represented by two closely spaced peaks at 7935
and 8789 Hz. For all other analysis cases, distinct peaks were identified as the thickness-
mode frequency.
Figure 5.11 shows the vibration mode excited for model M3 and M8. For model M8
(flexible foundation layer) Mode 9 was excited. For model M3 (stiff foundation layer) a
higher mode, i.e. Mode 20, was excited by the impact load.
85
5.5.1 Summary
The ratio of the plate stiffness to the foundation layer stiffness � determines the piston-
mode frequency of concrete-foundation layer assembly. A higher value of �,that
represents a more flexible foundation layer, improves the accuracy of the amplitude
spectrum in distinguishing the thickness-mode and piston-mode frequency. A stiffer
foundation layer possess ambiguity in distinguishing the thickness-mode frequency from
the amplitude spectrum.
Concrete plate supported on flexible foundation layer behaves as a rigid mass supported
on soft spring and vibrates in piston-mode that is easily detected in the amplitude
spectrum as a distinct peak. This mode of vibration can also be estimated by calculating
the fundamental frequency of a SDOF model comprising rigid mass (equal to mass of
concrete plate) supported on a spring of stiffness 3�(axial stiffness of foundation layer).
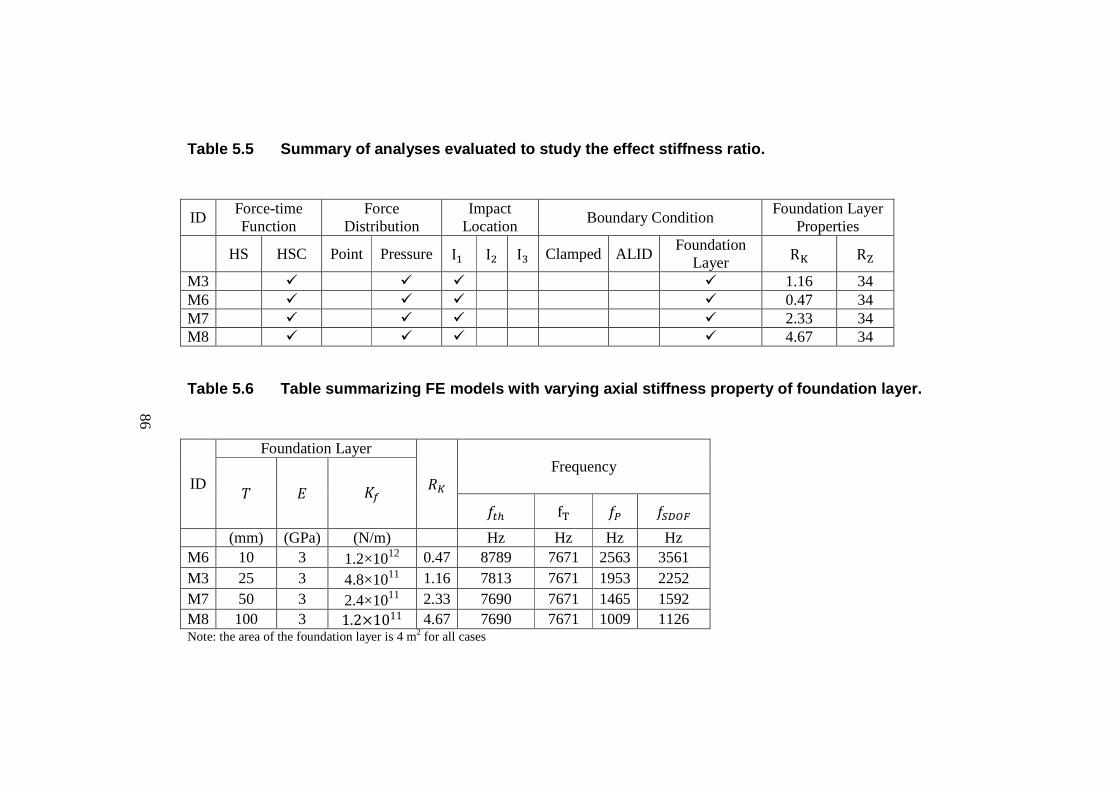
86
Table 5.5 Summary of analyses evaluated to study the effect stiffness ratio.
ID Force-time Function
Force Distribution
Impact Location
Boundary Condition Foundation Layer
Properties
HS HSC Point Pressure I� I� I� Clamped ALID Foundation
Layer R� R�
M3 � � � � 1.16 34 M6 � � � � 0.47 34 M7 � � � � 2.33 34 M8 � � � � 4.67 34
Table 5.6 Table summarizing FE models with varying axial stiffness property of foundation layer.
ID
Foundation Layer
� Frequency j ^ 3� ��J f� �[ �FGHI
(mm) (GPa) (N/m) Hz Hz Hz Hz M6 10 3 1.2×10¹² 0.47 8789 7671 2563 3561 M3 25 3 4.8×10¹¹ 1.16 7813 7671 1953 2252 M7 50 3 2.4×10¹¹ 2.33 7690 7671 1465 1592 M8 100 3 1.2×10¹¹ 4.67 7690 7671 1009 1126 Note: the area of the foundation layer is 4 m2 for all cases
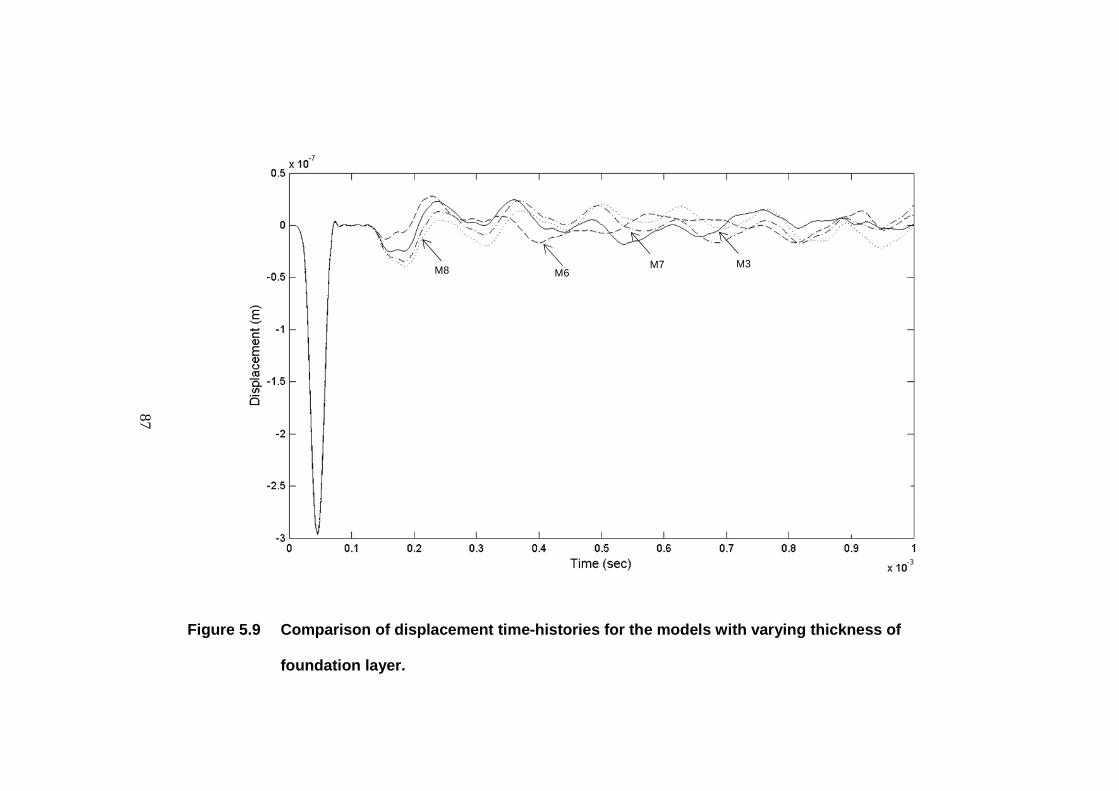
87
Figure 5.9 Comparison of displacement time-histories for the models with varying thickness of
foundation layer.
M8 M6 M7 M3
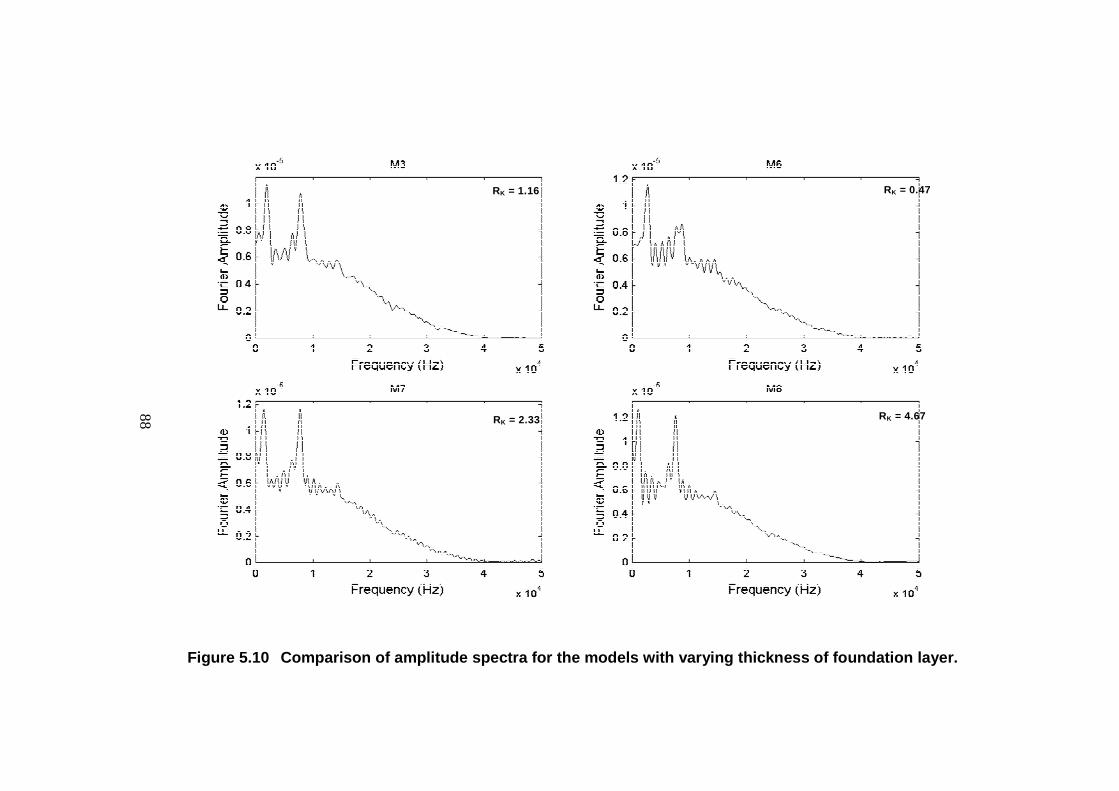
88
Figure 5.10 Comparison of amplitude spectra for the models with varying thickness of foundation layer.
RK = 1.16 RK = 0.47
RK = 4.67 RK = 2.33
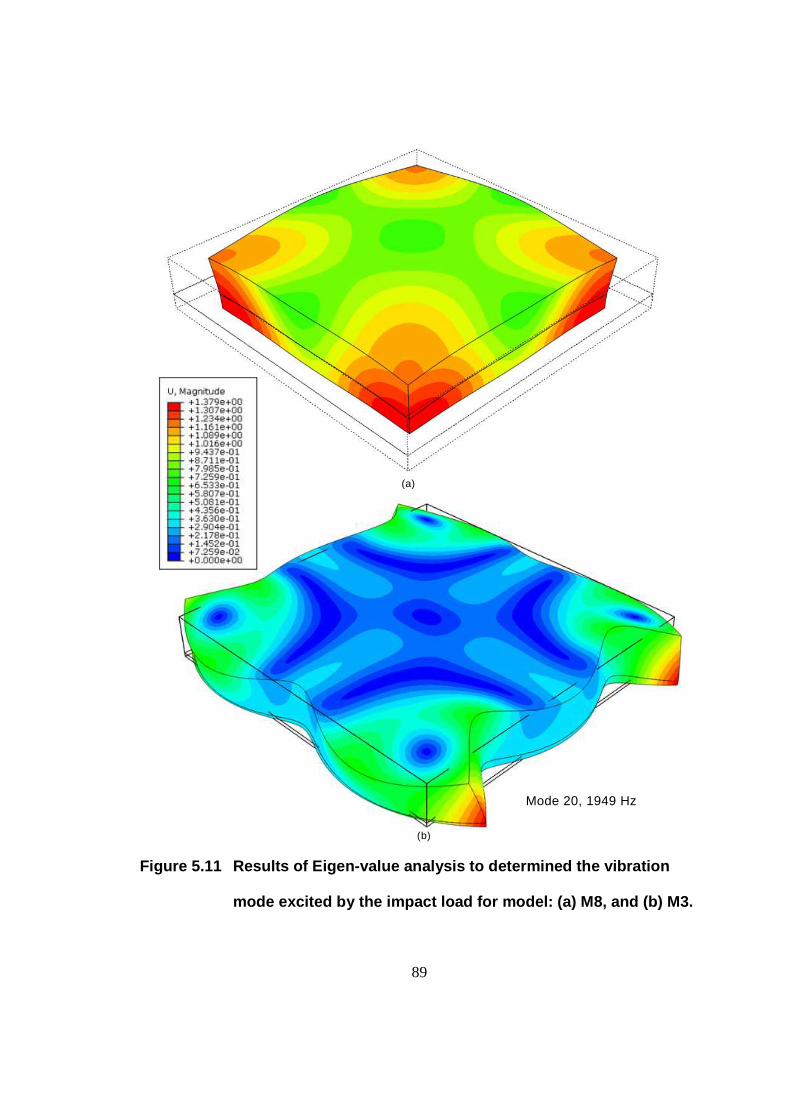
89
Figure 5.11 Results of Eigen-value analysis to determined the vibration
mode excited by the impact load for model: (a) M8, and (b) M3.
Mode 9, 1025 Hz
(a)
Mode 20, 1949 Hz
(b)
90
5.6 PLATE-FOUNDATION LAYER IMPEDANCE RATIO RZ
Four simulations, namely M3, M9, M10 and M11 as listed in Table 5.7 were run to
understand the effect of concrete-foundation impedance ratio on the propagating stress
waves. The impedance ratios R� were taken as 34, 5886, 111 and 10.8 for M3, M9, M10
and M11 respectively as discussed in Section 4.2.5.2.
Table 5.8 summarizes the foundation layer material properties used in the models to
attain the respective�.
Figure 5.12 represents the displacement time-histories for these different cases. For
models M3, M9, and M10, the compression incident wave was reflected back as tension
wave at 2P while for M11, there was no phase change at the interface and the
compression incident wave was reflected back as a compression wave at 2P (P represents
the arrival of the first reflected P-wave at the impact surface, equal to 62 µs). Figure 5.13
compares the amplitude spectra for the different simulation cases. For models M3, M9
and M10, distinct peaks representing the thickness-mode frequency were identified
whereas no such peak was observed for M11.
The varying elastic modulus of the foundation layer also affects the axial stiffness and
hence the piston-mode frequency of the system. For M9, this frequency (approx. 13 Hz)
was undetectable in the FFT plot at the standard frequency resolution. For M11, only one
peak was observed at 3296 Hz which can be attributed to the concrete-plate assembly
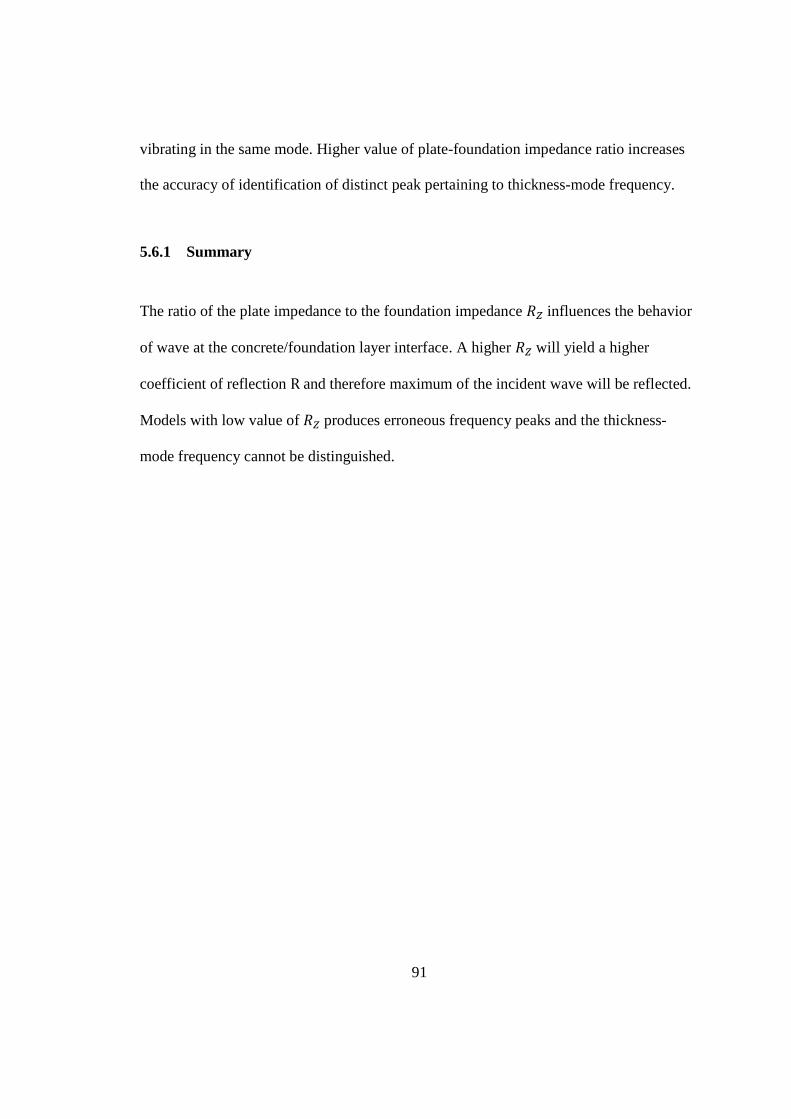
91
vibrating in the same mode. Higher value of plate-foundation impedance ratio increases
the accuracy of identification of distinct peak pertaining to thickness-mode frequency.
5.6.1 Summary
The ratio of the plate impedance to the foundation impedance �influences the behavior
of wave at the concrete/foundation layer interface. A higher �will yield a higher
coefficient of reflection Rand therefore maximum of the incident wave will be reflected.
Models with low value of �produces erroneous frequency peaks and the thickness-
mode frequency cannot be distinguished.
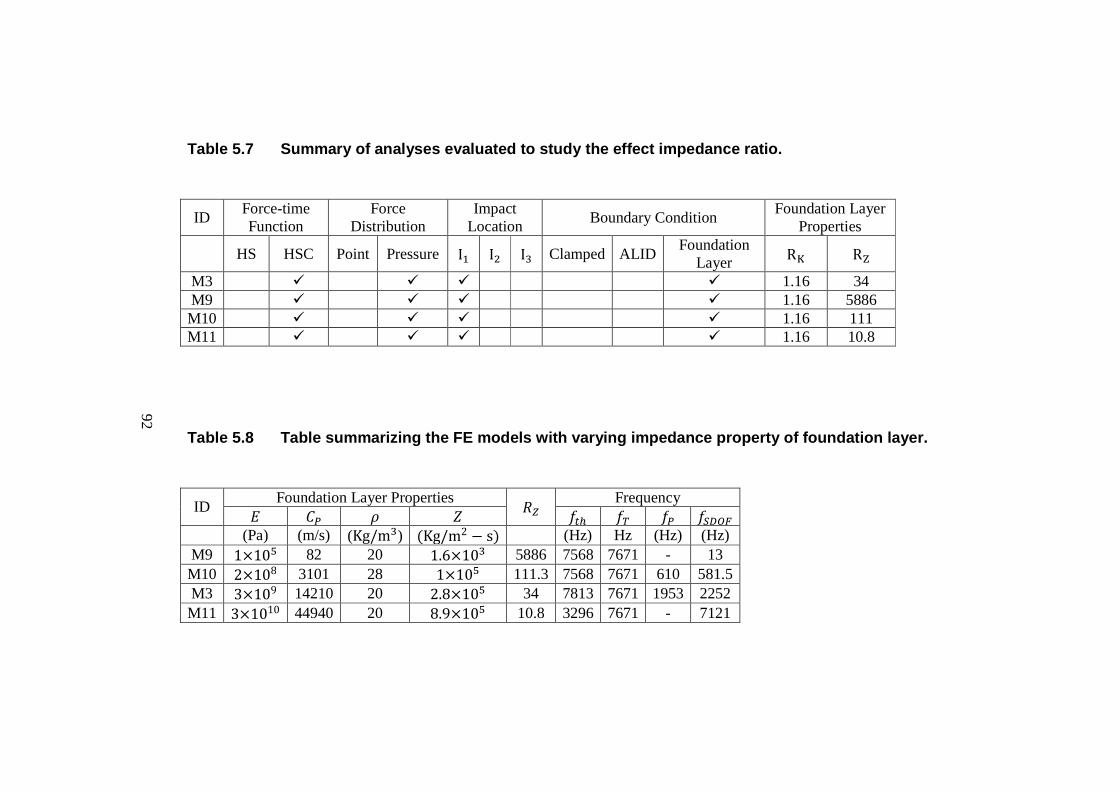
92
Table 5.7 Summary of analyses evaluated to study the effect impedance ratio.
ID Force-time Function
Force Distribution
Impact Location
Boundary Condition Foundation Layer
Properties
HS HSC Point Pressure I� I� I� Clamped ALID Foundation
Layer R� R�
M3 � � � � 1.16 34 M9 � � � � 1.16 5886 M10 � � � � 1.16 111 M11 � � � � 1.16 10.8
Table 5.8 Table summarizing the FE models with varying impedance property of foundation layer.
ID Foundation Layer Properties �
Frequency ^ �[ X A ��J � �[ �FGHI (Pa) (m/s) (Kg/m�) (Kg/m2 − s) (Hz) Hz (Hz) (Hz)
M9 1×10w 82 20 1.6×10� 5886 7568 7671 - 13 M10 2×10⁸ 3101 28 1×10w 111.3 7568 7671 610 581.5 M3 3×10⁹ 14210 20 2.8×10w 34 7813 7671 1953 2252 M11 3×10¹⁰ 44940 20 8.9×10w 10.8 3296 7671 - 7121
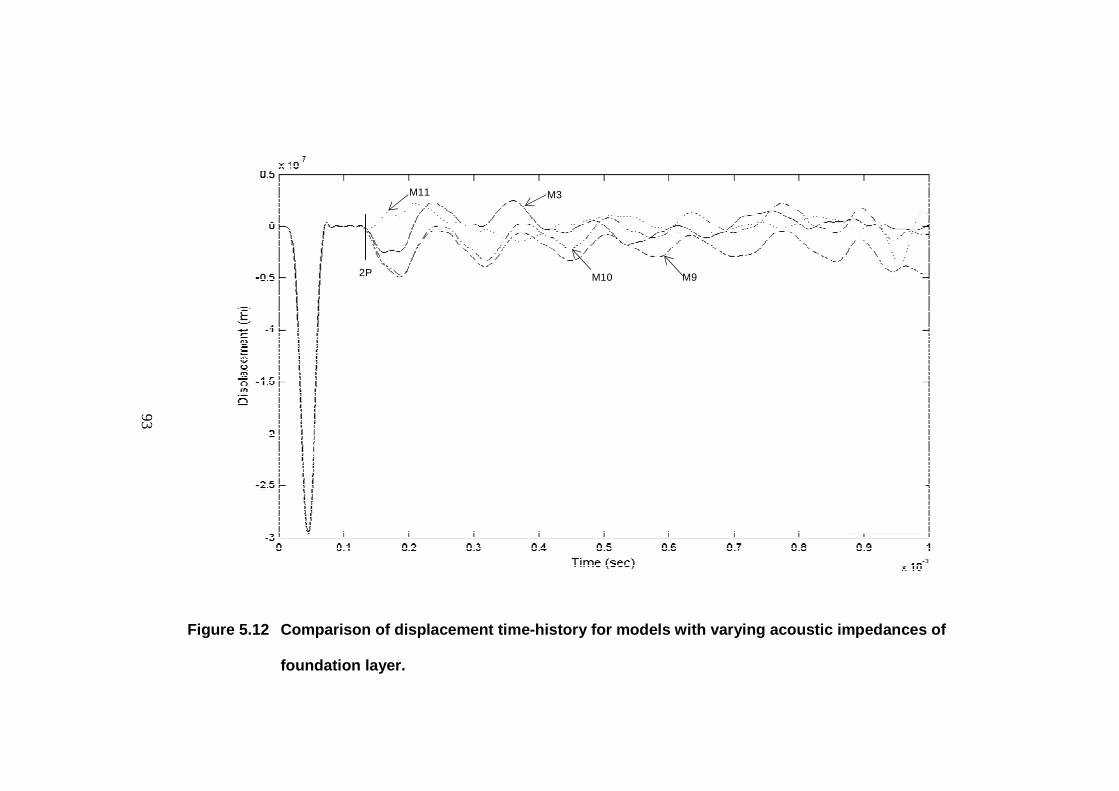
93
Figure 5.12 Comparison of displacement time-history for models with varying acoustic impedances of
foundation layer.
2P M10
M11 M3
M9
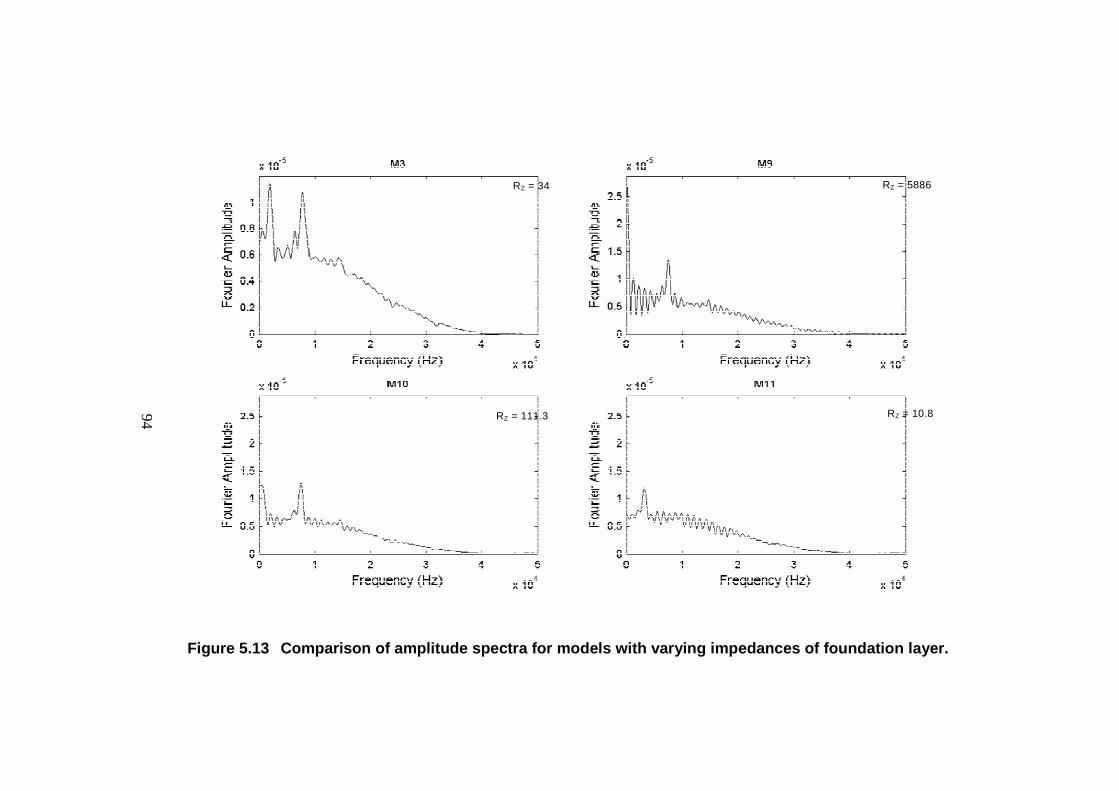
94
Figure 5.13 Comparison of amplitude spectra for models with varying impedances of foundation layer.
RZ = 111.3 RZ = 10.8
RZ = 34 RZ = 5886
95
CHAPTER 6. SUMMARY, CONCLUSIONS AND FUTURE WORK
This chapter summarizes the current research investigation and draws significant
conclusions based on the numerical simulation carried out to study wave propagation in
concrete plates. At the end of this chapter potential future research topics are proposed
that can be explored to extend the present study to evaluate more complex problems.
6.1 SUMMARY
This research investigates the numerical modeling of stress wave propagation in the
concrete plates when impacted by a steel sphere. Various FE models were developed to
study the wave propagation characteristics in bounded and semi-infinite plate sections.
Dynamic analysis of the models was carried out using ABAQUS FE software.
The research was focused on developing a modeling methodology for the propagation of
elastic stress wave in concrete for which different cases were analyzed. The impact of the
force-time function defined by a half cycle sine and half cycle sine cubed function on the
waveform was studied. The effect of the impact load applied on a single node vs
distributed over several nodes was examined.
The efficacy of energy absorbing layer in attenuating the unwanted side reflections was
examined by providing ALIDs at the boundaries of the area of interest. The damping was
achieved by introducing mass proportional Rayleigh damping in the layer.
96
A new modeling technique for the bounded concrete section was established by modeling
a foundation layer to support the concrete slab. Parametric studies of individual material
properties of the foundation layer were conducted to understand the importance of each
property in determining the characteristics of the wave propagation.
6.2 CONCLUSIONS
Based on the results of the set of FE models that were investigated in the present study,
the following conclusions and inferences were drawn:
1. The formulation of force-time function is important in determining the maximum
frequency of useful energy. For the same contact time ��and amplitude ����half-
cycle sine cubed (HSC) yields a higher maximum useful frequency than the half-
cycle sine (HS).
2. Modeling the impact load by HS force-time function induces high frequency
oscillations or “ringing” in the waveform. Using a more gradual slope to represent
the force-time function can be used to eliminate the artificial ringing.
3. Localized deformation of the concrete surface takes place (represented by
undulations in the displacement history) when the impact load is concentrated
over a single node. This effect can be eliminated by modeling the impact load as a
pressure load distributed over two or more nodes. However modeling the impact
as concentrated load does not affect the accuracy of the thickness-mode
frequency.
97
4. For a semi-infinite section, wave reflections from the clamped boundaries
influence the displacement time-history and yield erroneous peak frequency in the
amplitude spectrum. To avoid such discrepancies a sufficiently large model can
be built to shun the effect of boundary reflections for the analysis time. This
however adds extensively to the computational cost. The same effect can also be
achieved by using non-reflecting or absorbing boundaries.
5. A significant reduction in model’s geometric size and computational cost can be
achieved by implementing the absorbing layer with increased damping (ALID)
boundary condition. While modeling the ALID boundaries, the length �G and the
mass proportion Rayleigh damping coefficient ��affects it efficiency in
attenuating the amplitude of the propagating wave.
6. The foundation layer approach was successfully applied to study the wave
propagation in concrete plates of a finite dimension. The amplitude spectrum of
the system consisting of a concrete plate supported on flexible foundation layer is
dominated by the piston-mode and thickness-mode frequencies.
7. Concrete plate supported on flexible foundation layer behaves as a rigid mass
supported on soft spring and vibrates in piston-mode that is easily detected in the
amplitude spectrum as a distinct peak. This mode of vibration can also be
estimated by calculating the fundamental frequency of a SDOF model comprising
rigid mass (equal to mass of concrete plate) supported on a spring of stiffness
3�(axial stiffness of foundation layer).
8. The ratio of the plate stiffness to the foundation layer stiffness � determines the
piston-mode frequency of concrete-foundation layer assembly. A higher value of
98
� ,that represents a more flexible foundation layer, improves the accuracy of the
amplitude spectrum in distinguishing the thickness-mode and piston-mode
frequency. A stiffer foundation layer possesses ambiguity in distinguishing the
thickness-mode frequency from the amplitude spectrum.
9. The ratio of the plate impedance to the foundation impedance �influences the
behavior of wave at the concrete/foundation layer interface. A higher �will
yield a higher coefficient of reflection Rand therefore maximum of the incident
wave will be reflected. Models with low value of �produces erroneous
frequency peaks and the thickness-mode frequency cannot be distinguished.
10. For the concrete plate with foundation layer boundary condition, eccentric impact
loading does not excite any higher flexural mode other than the piston-mode of
the foundation layer. However, the displacement histories for eccentric deviates
from that of symmetric loading at around 5P owing to the early arrival of the P-
waves reflected from the free boundary of the concrete plate. This deviation
becomes profound at around 10P during which the side wave reflections
increases.
6.3 FUTURE WORK
The scope of the current research is limited to simple square plate geometry that is free
from any internal defects. Moreover, all the simulations and observations are specific to
plates of thickness of 0.25 m. The present research can be extended to provide modeling
basis for thin and deeper generalized sections. Following future research topics are
proposed to support the current project:
99
1. Study the wave propagation characteristics in presence of complex defects such as
surface opening cracks, voids, delamination, partially grouted cracks, etc.
2. Study the transient response of concrete plate in contact with steel plate, soil, rock
etc. and analyze the influence of the underlying material on the identification of
thickness-mode frequency.
3. Study the accuracy of the foundation layer approach in isolating the piston-mode
and thickness-mode frequencies for a reduced area of concrete plate.
4. Conduct a comparative analysis to study the effectiveness of the foundation layer
in comparison to other absorbing boundaries such perfectly matched layer (PML),
Lysmer-Kuhlemeyer (LK) boundaries, etc.
100
REFERENCES
ABAQUS. (2011). ABAQUS Documentation. Providence, RI, USA: Dassault Systèmes.
Abramo, D. (2011). Impact-Echo Modeling and Imaging Techniques. Doctoral
dissertation, Northeastern University.
Bathe, K. J. (1996). Finite element procedures. Prentice Hall.
Berenger, J. P. (1994). A perfectly matched layer for the absorption of electromagnetic
waves. Journal of Computational Physics, 114(2), 185-200.
Brekhovskikh, L. (2012). Waves in Layered Media 2e (Vol. 16). Elsevier.
Carino, N. J. (2001). The impact-echo method: an overview. In Proceedings of the 2001
Structures Congress & Exposition (pp. 21-23). Washington, DC: American
Society of Civil Engineers.
Chang, H. W., & Randall, C. J. (1988). Finite-difference time-domain modeling of elastic
wave propagation in the cylindrical coordinate system. In Ultrasonics Symposium,
1988. Proceedings (pp. 397-402). IEEE.
Chopra, A. K. (1995). Dynamics of structures (Vol. 3). New Jersey: Prentice Hall.
101
Davis, A. G., Gaynor, R. D., Lozen, K. M., Rowe, T. J., Caratin, H., ..., & Sansalone, M.
J. (1998). Nondestructive Test Methods for Evaluation of Concrete in Structures.
American Concrete Institute, ACI, 228.
Drozdz, M. B. (2008). Efficient Finite Element modelling of ultrasound waves in elastic
media . Doctoral dissertation, Imperial College London.
Gibson, A., & Popovics, J. S. (2005). Lamb wave basis for impact-echo method analysis.
Journal of Engineering Mechanics, 4(131), 438-443.
Goldsmith, W. (1960). Impact: the theory and physical behaviour of colliding solids.
London: Edward Arnold .
Graff, K. F. (1975). Wave motion in elastic solids. Courier Dover Publications.
Guide, M. U. (1998). The mathworks (Vol. 5). Natick, MA: Inc.
Ham, S., & Bathe, K. J. (2012). A finite element method enriched for wave propagation
problems. Computers & Structures, 94, 1-12.
Hunter, S. C. (1957). Energy absorbed by elastic waves during impact . Journal of the
Mechanics and Physics of Solids, 5(3), 162-171.
Lamb, H. (1904). On the propagation of tremors over the surface of an elastic solid .
Philosophical Transactions of the Royal Society of London. Series A, Containing
Papers of a Mathematical or Physical Character, 1-42.
102
Lamb, H. (1917). On waves in an elastic plate. Proceedings of the Royal Society of
London. Series A, Containing papers of a mathematical and physical character,
(pp. 114-128).
Lin, Y., & Sansalone, M. (1992). Transient response of thick circular and square bars
subjected to transverse elastic impact. The Journal of the Acoustical Society of
America, 91(2), 885-893.
Lin, Y., & Sansalone, M. (1992). Transient response of thick rectangular bars subjected
to transverse elastic impact. The Journal of the Acoustical Society of America,
91(5), 2674-2685.
Lysmer, J., & Kuhlemeyer, R. (1969). Finite dynamic model for infinite media. Journal
of the Engineering Mechnanics Division, Proc. ASCE, 95, pp. 859 – 876.
McLaskey, G. C., & Glaser, S. D. (2010). Hertzian impact: experimental study of the
force pulse and resulting stress waves. The Journal of the Acoustical Society of
America, 128(3), 1087-1096.
Miklowitz, J. (1984). The theory of elastic waves and waveguides. Elsevier.
Miller, G. F., & Pursey, H. (1954). The field and radiation impedance of mechanical
radiators on the free surface of a semi-infinite isotropic solid. Proceedings of the
Royal Society of London. Series A. Mathematical and Physical Sciences,
223(1155), 521-541.
103
Miller, G. F., & Pursey, H. (1955). On the partition of energy between elastic waves in a
semi-infinite solid. Proceedings of the Royal Society of London. Series A.
Mathematical and Physical Sciences, 233(1192), 55-69.
Oh, T. K. (2012). Defect characterization in concrete elements using vibration analysis
and imaging. Doctoral dissertation, University of Illinois at Urbana-Champaign.
Ohtsu, M., & Watanabe, T. (2002). Stack imaging of spectral amplitudes based on
impact-echo for flaw detection. NDT & E International, 35(3), 189-196.
Olsson, D. (2012). Numerical simulations of energy absorbing boundaries for elastic
wave propagation in thick concrete structures subjected to impact loading.
Thesis, Umeå University.
Pessiki, S. P., & Carino, N. J. (1988). Setting time and strength of concrete using the
impact-echo method. ACI Materials Journal, 85(5), 389-399.
Pessiki, S., & Johnson, M. R. (1996). Nondestructive evaluation of early-age concrete
strength in plate structures by the impact-echo method. , 93(3). ACI Materials
Journal, 93(3), 260-271.
Pessiki, S., & Rowe, M. H. (1997). Influence of steel reinforcing bars on the evaluation
of early-age concrete strength using the impact-echo method. ACI structural
journal, 94(4), 378-388.
104
Rayleigh, L. (1888). On the free vibrations of an infinite plate of homogeneous isotropic
elastic matter. Proceedings of the London Mathematical Society, 1(1), 225-237.
Sansalone, M., & Carino, N. J. (1986). Impact-echo: a method for flaw detection in
concrete using transient stress waves. US Department of Commerce, National
Bureau of Standards, Center for Building Technology, Structures Division.
Sansalone, M., & Street, W. (1997). Impact-echo: nondestructive evaluation of concrete
and masonry. Bullbrier Press.
Sansalone, M., Carino, N. J., & Hsu, N. N. (1987). A finite element study of transient
wave propagation in plates. NBS Journal of Research, 92(4).
Schubert, F., & Köhler, B. (2008). Ten lectures on impact-echo. Journal of
Nondestructive Evaluation, 27(1-3), 5-21.
Schubert, F., Wiggenhauser, H., & Lausch, R. (2004). On the accuracy of thickness
measurements in impact-echo testing of finite concrete specimens––numerical
and experimental results. Ultrasonics, 42(1), 897-901.
Seron, F. J., Sanz, F. J., Kindelan, M., & Badal, J. I. (1990). Finite‐element method for
elastic wave propagation. 6(5), 359-368.
Thomson, W. T. (1950). Transmission of elastic waves through a stratified solid medium.
Journal of applied Physics, 21(2), 89-93.
105
Timoshenko, S. P., Goodier, J. N., & Abramson, H. N. (1970). Theory of elasticity.
Journal of Applied Mechanics, 37, 888.
Viktorov, I. A. (1967). Rayleigh and Lamb waves: physical theory and applications (Vol.
147). New York: Plenum press.
Woods, R. D. (1968). Screening of surface waves in soil. University of Michigan.
Zhang, Y., Wei, X., Tsai, Y. T., Zhu, J., Fetrat, F. A., & Gucunski, N. (2012).
Multisensor data fusion for impact-echo testing of concrete structures. Smart
Materials and Structures, 21(7), 075021.
106
VITA
Tripti Pradhan was born on 19th June 1988 in the Himalayan state of Sikkim in India.
She is the youngest child of Mr. Tara K. Pradhan and Ms. Bishnu Pradhan. She
completed her high school education from Holy Cross School, Tadong in the year 2006.
She received her Bachelors of Technology degree in Civil Engineering in June 2010 from
G. B. Pant University of Agriculture and Technology. She then worked as a Research
Project Associate at Indian Institute of Technology Kanpur for approximately two years
and pursued research under the guidance of Dr. Durgesh C. Rai. She started her graduate
studies with the Department of Civil and Environmental Engineering at Lehigh
University in August 2012 and expects to complete M.S. in Structural Engineering in
December 2014.
List of Publications
Rai, D. C., Annam, P. K., & Pradhan, T. (2013). Seismic testing of steel braced frames
with aluminum shear yielding dampers. Engineering Structures, 46, 737-747.
Rai, D. C., Mondal, G., Singhal, V., Parool, N., Pradhan, T., & Mitra, K. (2012).
Reconnaissance report of the M6. 9 Sikkim (India–Nepal border) earthquake of
18 September 2011. Geomatics, Natural Hazards and Risk, 3(2), 99-111.
Rai, D. C., Komaraneni, S., & Pradhan, T. (2011). Strengthening of Slab Action in
Transverse Direction of Damaged Deck of Prestressed Box Girder Bridge.
Journal of Bridge Engineering, 18(1), 65-75.