Embed Size (px)
Citation preview
Working together for a safer Scotland
FIRE AND RESCUE INCIDENT STATISTICSSCOTLAND 2015-16
18 October 2016

Contents
1. Introduction 1
2. Main Points 2
3. Background 3
3.1 Purpose of the Statistics 3
4. Commentary 4 4.1 All Incident Statistics 4
4.2 Fire Statistics 4 4.2.1 Total number of fires 5 4.2.2 Primary fires by type 5 4.2.3 Fires by geography 6 4.2.4 Secondary fires 7
4.3 Fires by motive - deliberate and accidental 7 4.3.1 Primary fires by motive 7 4.3.2 Secondary fires by motive 9
4.4 Casualties in fires 9 4.4.1 Fatal casualties from fires 10 4.4.2 Non-fatal casualties in fires 11 4.4.3 Non-fatal casualties by location 11 4.4.4 Non-fatal casualty rates 11 4.4.5 Fire casualties by motive and location 11
4.5 Fires and fire casualties by country 12 4.5.1 Comparisons by country 12 4.5.2 Fire rates by country 12 4.5.3 Fire fatality rates by country 14 4.5.4 Non-fatal casualty rates by country 14
4.6 False alarms 14 4.6.1 Background 14 4.6.2 False Alarm Statistics 15
4.7 Non-fire incidents and casualties 15 4.7.1 Out of Hospital Cardiac Arrest (OHCA) Trial 16 4.7.2 Non-fire incident statistics 16 4.7.3 Non-fire incident casualties and fatalities 18 4.7.4 Related statistics 18
5. Glossary of terms 23
6. Local Authority maps 25
7. Accompanying Tables 26 7.1 Data tables in the bulletin 26
7.2 Tables in the full data set 28 8. Correspondence and enquiries 56
Figures
Figure 1: All incidents, 2006-07 to 2015-16, Scotland 1
Figure 2: Incidents by type, 2015-16, Scotland 4
Figure 3: Primary fires by type, 2015-16, Scotland 5
Figure 4: Rate of all fires per 100,000 population, 2015-16, local authority 6
Figure 5: Accidental dwelling fires per 100,000 dwellings, 2015-16, local authority 6
Figure 6 : Primary fires by motive, 2006-07 to 2015-16, Scotland 7
Figure 7a: Accidental primary fires by type, 2006-07 to 2015-16, Scotland 8
Figure 7b: Deliberate dwelling fire by type, 2006-07 to 2015-16, Scotland 8
Figure 8: Secondary fires by motive, 2009-10 to 2015-16, Scotland 9
Figure 9: Annual long-term trend of fire fatalities, 1994-95 to 2015-16, Scotland 10
Figure 10: All fires per million population, 2006-07 to 2015-16, Great Britain 13
Figure 11: Primary fires per million population, 2006-07 to 2015-16, Great Britain 13
Figure 12: Fire fatalities per million population, 2006-07 to 2015-16, Great Britain 13
Figure 13: Non-fatal fire casualties per million population, 2006-07 to 2015-16, Great Britain 13
Figure 14 : Fire false alarms by type, 2006-07 to 2015-16, Scotland 15
Figure 15: Non-fire incident rates by local authority, 2015-16 17
Figure 16: Non-fire incident fatalities (main categories), 2009-10 to 2015-16, Scotland 18
Scottish Fire and Rescue Service
FIRE AND RESCUE INCIDENT STATISTICS SCOTLAND, 2015-16 18 October 2016
1. Introduction
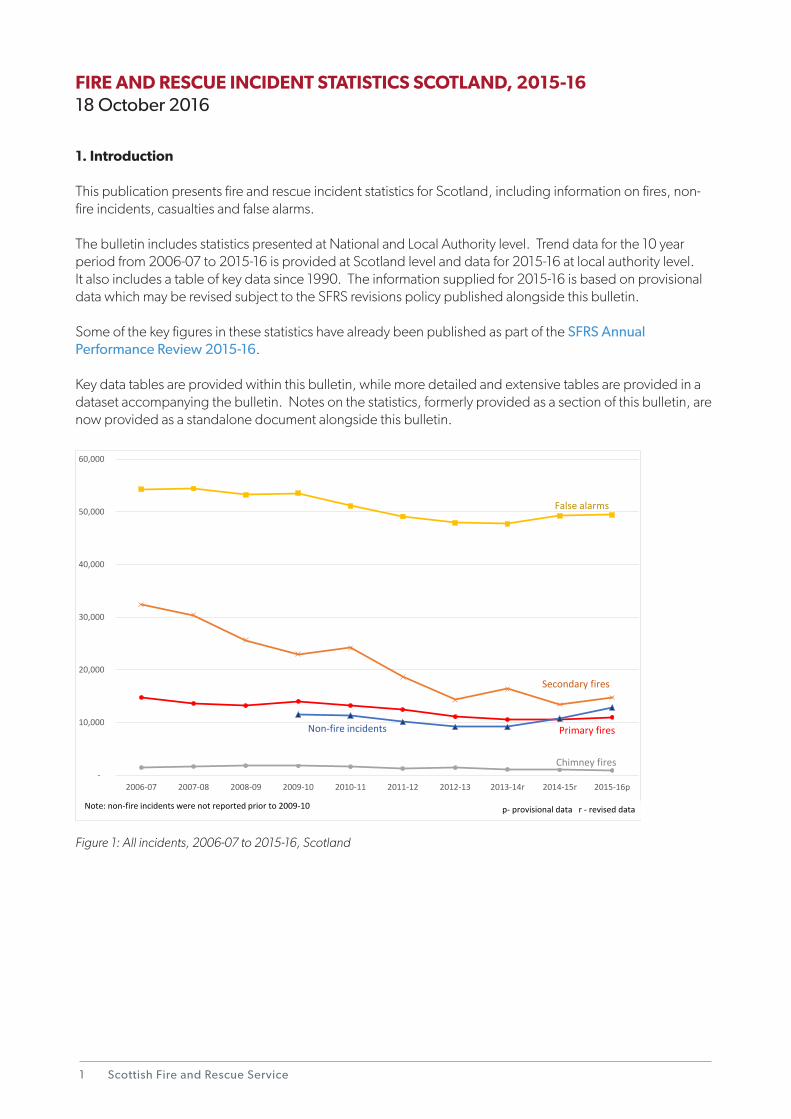
This publication presents fire and rescue incident statistics for Scotland, including information on fires, non-fire incidents, casualties and false alarms.
The bulletin includes statistics presented at National and Local Authority level. Trend data for the 10 year period from 2006-07 to 2015-16 is provided at Scotland level and data for 2015-16 at local authority level. It also includes a table of key data since 1990. The information supplied for 2015-16 is based on provisional data which may be revised subject to the SFRS revisions policy published alongside this bulletin.
Some of the key figures in these statistics have already been published as part of the SFRS Annual Performance Review 2015-16.
Key data tables are provided within this bulletin, while more detailed and extensive tables are provided in a dataset accompanying the bulletin. Notes on the statistics, formerly provided as a section of this bulletin, are now provided as a standalone document alongside this bulletin.
Figure 1: All incidents, 2006-07 to 2015-16, Scotland
1
-
10,000
20,000
30,000
40,000
50,000
60,000
2006-07 2007-08 2008-09 2009-10 2010-11 2011-12 2012-13 2013-14r 2014-15r 2015-16p
False alarms
Secondary fires
Non-fire incidents Primary fires
Chimney fires
Note: non-fire incidents were not reported prior to 2009-10 p- provisional data r - revised data
Fire and Rescue Incident Statistics Scotland 2015-16
2. Main Points
All incidents
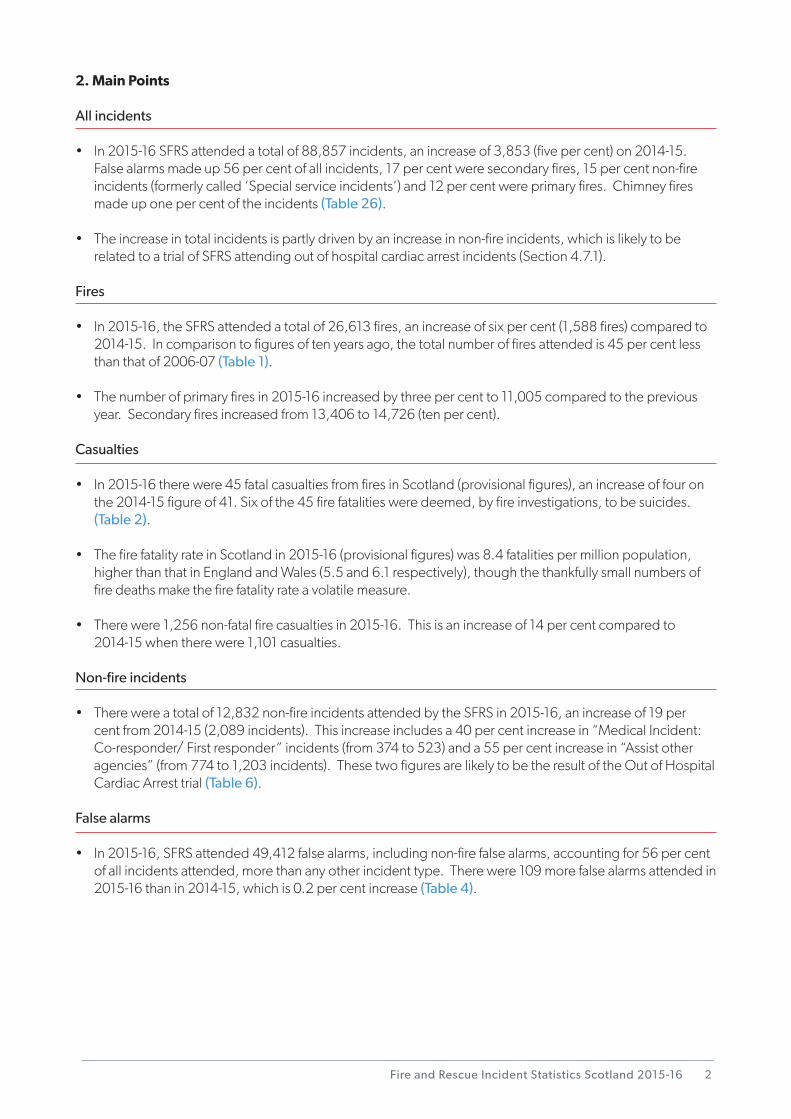
• In2015-16SFRSattendedatotalof88,857incidents,anincreaseof3,853(fivepercent)on2014-15. False alarms made up 56 per cent of all incidents, 17 per cent were secondary fires, 15 per cent non-fire incidents (formerly called ‘Special service incidents’) and 12 per cent were primary fires. Chimney fires made up one per cent of the incidents (Table 26).
• Theincreaseintotalincidentsispartlydrivenbyanincreaseinnon-fireincidents,whichislikelytobe related to a trial of SFRS attending out of hospital cardiac arrest incidents (Section 4.7.1).
Fires
• In2015-16,theSFRSattendedatotalof26,613fires,anincreaseofsixpercent(1,588fires)comparedto 2014-15. In comparison to figures of ten years ago, the total number of fires attended is 45 per cent less than that of 2006-07 (Table 1).
• Thenumberofprimaryfiresin2015-16increasedbythreepercentto11,005comparedtotheprevious year. Secondary fires increased from 13,406 to 14,726 (ten per cent).
Casualties
• In2015-16therewere45fatalcasualtiesfromfiresinScotland(provisionalfigures),anincreaseoffouron the 2014-15 figure of 41. Six of the 45 fire fatalities were deemed, by fire investigations, to be suicides. (Table 2).
• ThefirefatalityrateinScotlandin2015-16(provisionalfigures)was8.4fatalitiespermillionpopulation, higher than that in England and Wales (5.5 and 6.1 respectively), though the thankfully small numbers of fire deaths make the fire fatality rate a volatile measure.
• Therewere1,256non-fatalfirecasualtiesin2015-16.Thisisanincreaseof14percentcomparedto 2014-15 when there were 1,101 casualties.
Non-fire incidents
• Therewereatotalof12,832non-fireincidentsattendedbytheSFRSin2015-16,anincreaseof19per cent from 2014-15 (2,089 incidents). This increase includes a 40 per cent increase in “Medical Incident: Co-responder/ First responder” incidents (from 374 to 523) and a 55 per cent increase in “Assist other agencies” (from 774 to 1,203 incidents). These two figures are likely to be the result of the Out of Hospital Cardiac Arrest trial (Table 6).
False alarms
• In2015-16,SFRSattended49,412falsealarms,includingnon-firefalsealarms,accountingfor56percent of all incidents attended, more than any other incident type. There were 109 more false alarms attended in 2015-16 than in 2014-15, which is 0.2 per cent increase (Table 4).
2
Scottish Fire and Rescue Service
3. Background
In 2013, the Scottish Fire and Rescue Service (SFRS) replaced the 8 former Fire and Rescue Services (FRSs) of Scotland. This is therefore the third year that the statistics cover the single SFRS.
These statistics are compiled from reports submitted by SFRS officers using the Home Office Incident Recording System (IRS) to report on incidents they have attended. IRS was introduced across Britain in April 2009.
Further information on the statistics in this bulletin are provided in Section 5 and in the Notes to the Statistics document that accompanies this bulletin. Definitions for IRS terms are contained as part of the IRS guidance1.
The 2015-16 figures in this publication are provisional and are subject to revision in line with the SFRS revisions policy. The policy is published alongside the bulletin and is summarised in the Notes to the Statistics. Casualty figures are particularly vulnerable to revision as a result of pending investigations into fires.
Revised figures for 2013-14 and 2014-15 are provided here and supersede those in previous editions of this publication. Further details on revisions made in this publication are available in the Notes to the Statistics.
This publication is accompanied by data tables, published as a downloadable workbook on the SFRS website. For tables at Scotland level, the figures provided cover the past ten years. There are exceptions to this, including non-fire incidents, that were first fully recorded using the electronic IRS from 2009-10. Local authority level tables are provided for 2015-16 only.
3.1 Purpose of the statistics
This bulletin contains information on fires, fire related casualties and fatalities, non-fire incidents and associated casualties and fatalities and on false alarms attended by the SFRS.
These statistics provide evidence on the activities and the performance of the SFRS. However, some of the activity is reactive and does not necessarily demonstrate the performance of the service. In particular for 2015-16 the number of non-fire incidents (formerly known as ‘special service incidents’) has increased. This increase is linked to integrated multi-agency work to create safer communities, specifically a national trial involving SFRS and the Scottish Ambulance Service (SAS).
The trial was launched on 29th October 2015 with the aim of increasing survival rate of patients who suffer out of hospital cardiac arrest. The impact of the initiative on the number of incidents and casualties attended by SFRS and on the outcomes for Scotland, is introduced within Section 4.7 on non-fire incidents.
Where potential reasons for changes or trends have been fully analysed they are included in the commentary. Where reasons are, as yet, unproven, they may be mentioned but should be considered only as a possible explanation.
3
1 IRS guidance and definitions - https://www.gov.uk/government/publications/incident-recording-system-for-fire-and-rescue-authorities
Fire and Rescue Incident Statistics Scotland 2015-16 4
4. Commentary
4.1 All incident statistics
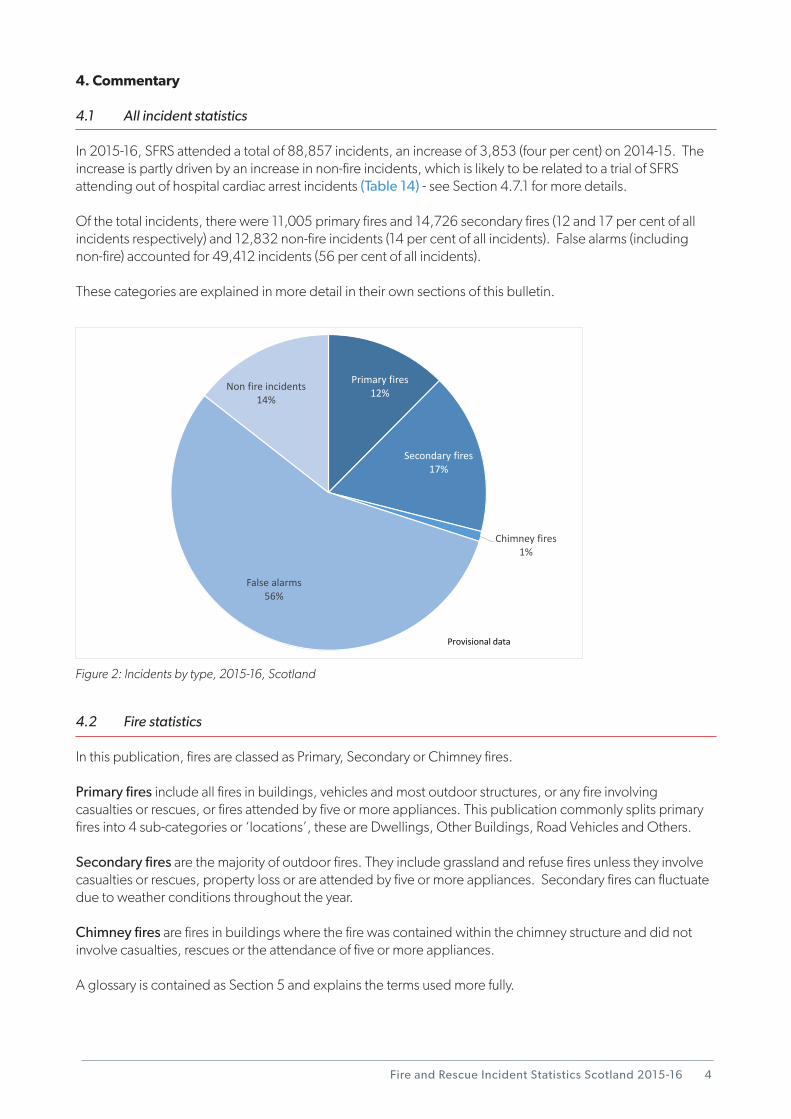
In 2015-16, SFRS attended a total of 88,857 incidents, an increase of 3,853 (four per cent) on 2014-15. The increase is partly driven by an increase in non-fire incidents, which is likely to be related to a trial of SFRS attending out of hospital cardiac arrest incidents (Table 14) - see Section 4.7.1 for more details.
Of the total incidents, there were 11,005 primary fires and 14,726 secondary fires (12 and 17 per cent of all incidents respectively) and 12,832 non-fire incidents (14 per cent of all incidents). False alarms (including non-fire) accounted for 49,412 incidents (56 per cent of all incidents).
These categories are explained in more detail in their own sections of this bulletin.
Primary fires12%
Secondary fires17%
Chimney fires1%
False alarms56%
Non fire incidents14%
Provisional data
Figure 2: Incidents by type, 2015-16, Scotland
4.2 Fire statistics
In this publication, fires are classed as Primary, Secondary or Chimney fires.
Primary fires include all fires in buildings, vehicles and most outdoor structures, or any fire involving casualties or rescues, or fires attended by five or more appliances. This publication commonly splits primary fires into 4 sub-categories or ‘locations’, these are Dwellings, Other Buildings, Road Vehicles and Others.
Secondary fires are the majority of outdoor fires. They include grassland and refuse fires unless they involve casualties or rescues, property loss or are attended by five or more appliances. Secondary fires can fluctuate due to weather conditions throughout the year.
Chimney fires are fires in buildings where the fire was contained within the chimney structure and did not involve casualties, rescues or the attendance of five or more appliances.
A glossary is contained as Section 5 and explains the terms used more fully.
Scottish Fire and Rescue Service5
4.2.1 Total number of fires
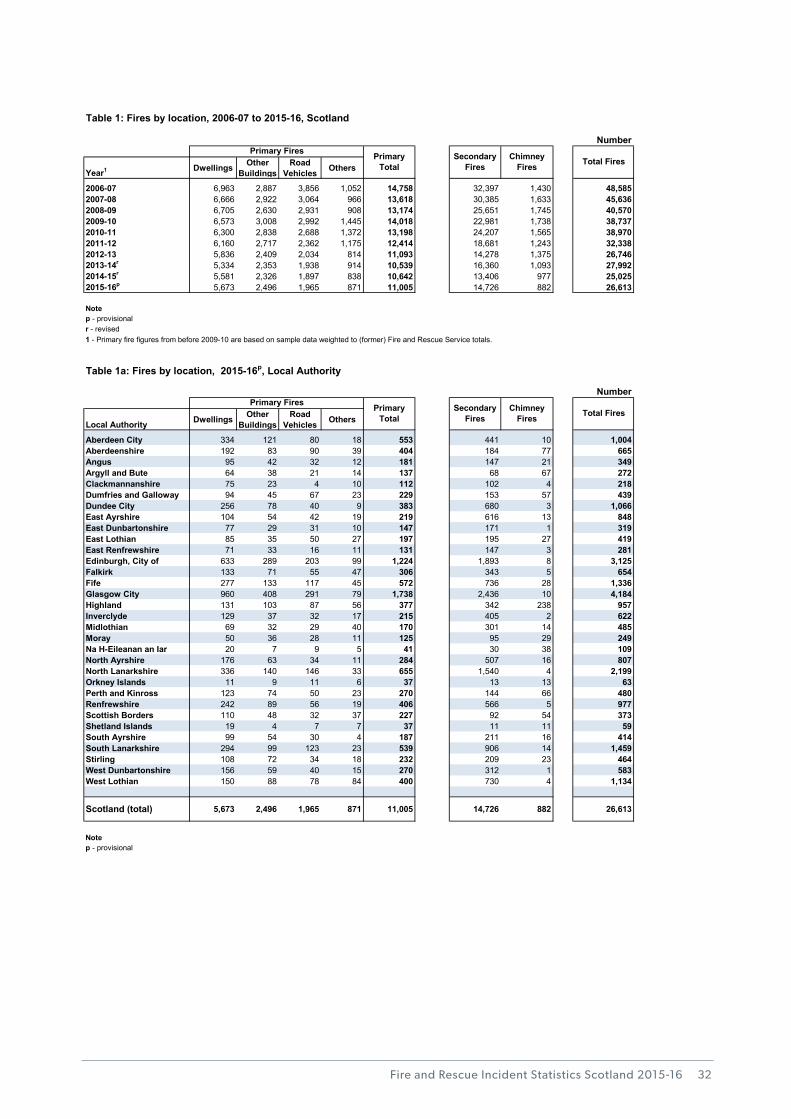
In 2015-16, the SFRS attended a total of 26,613 fires in Scotland, an increase of six per cent compared to the previous year (25,025). However, in comparison to figures of ten years ago, the total number of fires attended is 45 per cent less than that of 2006-07. (Table 1)
Of those total fires, the majority (55 per cent) were secondary fires, 41 per cent were primary fires, and three per cent were chimney fires. Note: percentage figures may not sum to 100 per cent due to rounding.
The number of primary fires in 2015-16 increased by three per cent to 11,005 between 2014-15 and 2015-16. Secondary fires increased by ten per cent between 2014-15 and 2015-16, from 13,406 to 14,726.
These increases should be seen in the context of a long term decrease in fires of all types. There were 25 per cent fewer primary fires in 2015-16 than a decade earlier in 2006-07 and the current total number of secondary fires is less than half the number attended in 2006-07.
Attending fires of any type accounted for under one third (30 per cent) of all incidents attended by the SFRS in 2015-16.
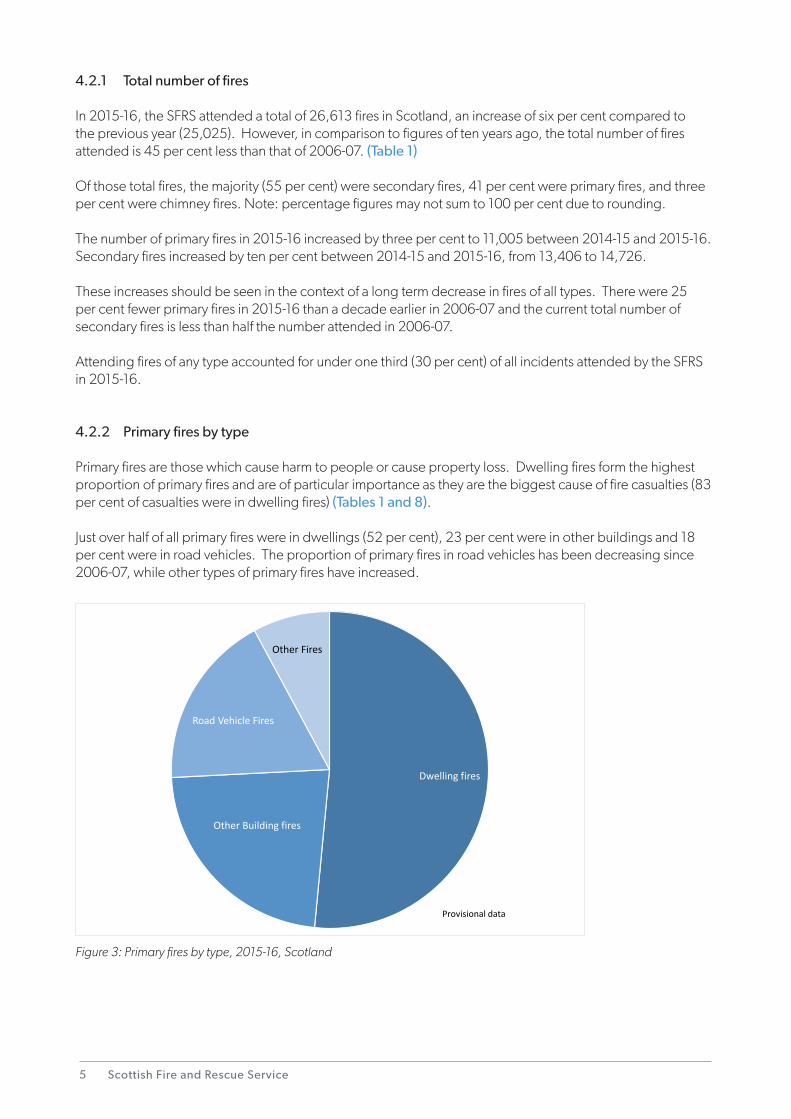
4.2.2 Primary fires by type
Primary fires are those which cause harm to people or cause property loss. Dwelling fires form the highest proportion of primary fires and are of particular importance as they are the biggest cause of fire casualties (83 per cent of casualties were in dwelling fires) (Tables 1 and 8).
Just over half of all primary fires were in dwellings (52 per cent), 23 per cent were in other buildings and 18 per cent were in road vehicles. The proportion of primary fires in road vehicles has been decreasing since 2006-07, while other types of primary fires have increased.
Dwelling fires
Other Building fires
Road Vehicle Fires
Other Fires
Provisional data
Figure 3: Primary fires by type, 2015-16, Scotland
Fire and Rescue Incident Statistics Scotland 2015-16
2 Local authority population estimates produced by National Records Scotland. Taken from: http://www.nrscotland.gov.uk/statis-tics-and-data/statistics/statistics-by-theme/population/population-estimates/mid-year-population-estimates/mid-2015-and-correct-ed-mid-2012-to-mid-20143 Dwellings data from ‘Housing Statistics for Scotland - Key Information and Summary Tables’ http://www.scotland.gov.uk/Topics/Statistics/Browse/Housing-Regeneration/HSfS/KeyInfoTables
6
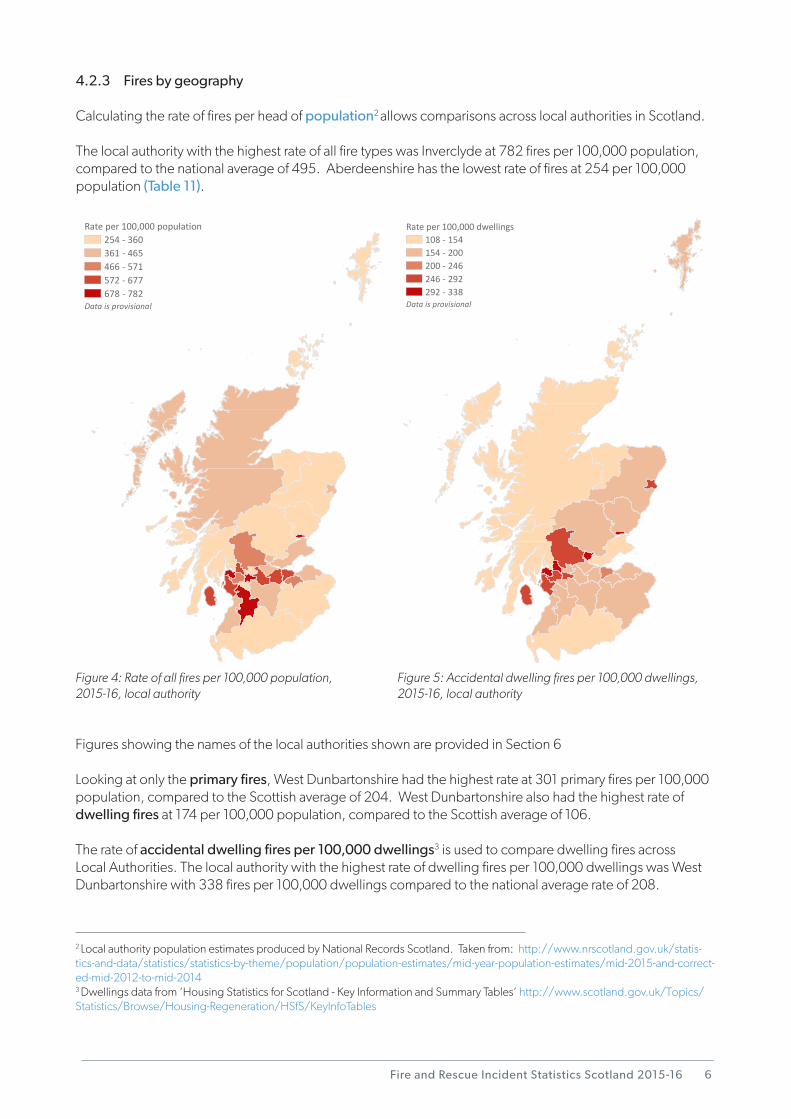
4.2.3 Fires by geography
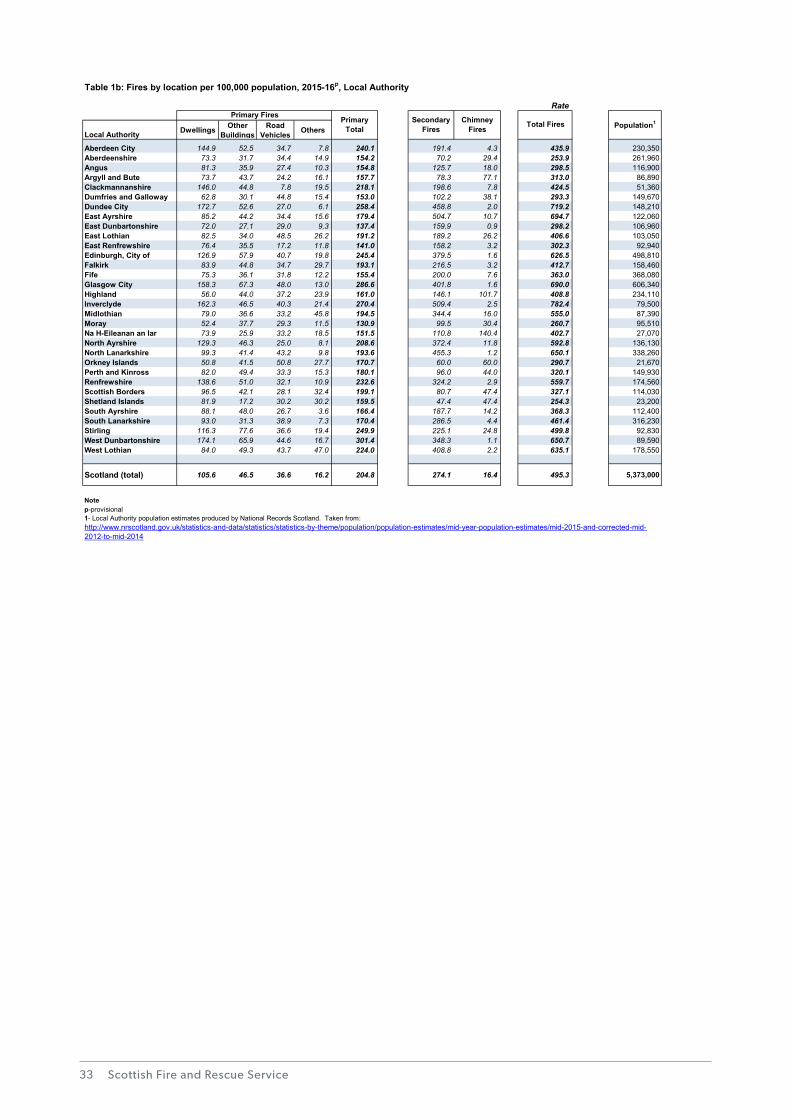
Calculating the rate of fires per head of population2 allows comparisons across local authorities in Scotland.
The local authority with the highest rate of all fire types was Inverclyde at 782 fires per 100,000 population, compared to the national average of 495. Aberdeenshire has the lowest rate of fires at 254 per 100,000 population (Table 11).
254 - 360361 - 465466 - 571572 - 677678 - 782
Rate per 100,000 population
Data is provisional
Figure 4: Rate of all fires per 100,000 population, 2015-16, local authority
108 - 154154 - 200200 - 246246 - 292292 - 338
Rate per 100,000 dwellings
Data is provisional
Figure 5: Accidental dwelling fires per 100,000 dwellings, 2015-16, local authority
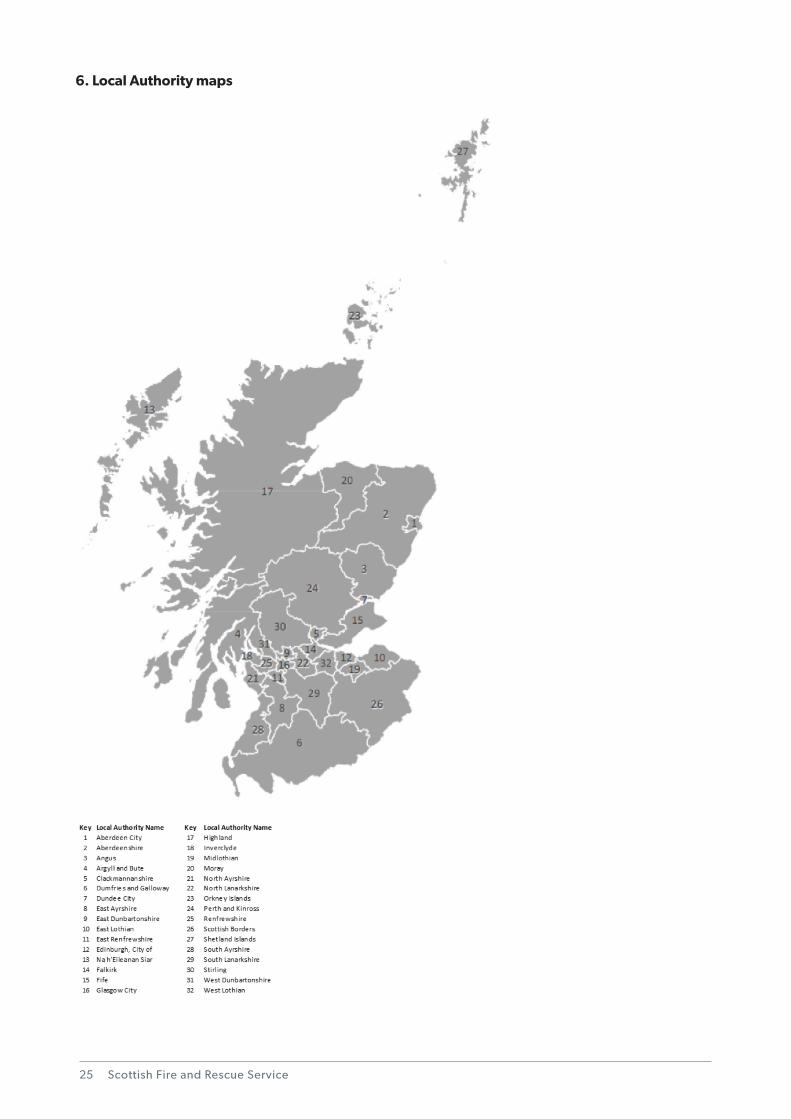
Figures showing the names of the local authorities shown are provided in Section 6
Looking at only the primary fires, West Dunbartonshire had the highest rate at 301 primary fires per 100,000 population, compared to the Scottish average of 204. West Dunbartonshire also had the highest rate of dwelling fires at 174 per 100,000 population, compared to the Scottish average of 106.
The rate of accidental dwelling fires per 100,000 dwellings3 is used to compare dwelling fires across Local Authorities. The local authority with the highest rate of dwelling fires per 100,000 dwellings was West Dunbartonshire with 338 fires per 100,000 dwellings compared to the national average rate of 208.
Scottish Fire and Rescue Service7
4.2.4 Secondary fires
Secondary fires are mostly smaller outdoor fires, not involving people or property. They can be influenced by weather conditions resulting in fluctuations from year to year.
The SFRS attended 14,726 secondary fires in 2015-16, an increase of 10 per cent from a ten-year low in 2014-15. Secondary fires represented 55 per cent of all fires attended in 2015-16. Half of all secondary fires were rubbish fires (Table 9).
4.3 Fires by motive - deliberate and accidental
This section looks at the ‘motive’ of fires, in particular whether they were recorded as caused accidentally or deliberately. Accidental fires are defined as fires which were ignited by accident, or where the cause of the fire was not known. Deliberate fires are defined as fires which were ignited deliberately or the Fire and Rescue Service suspect they were started deliberately (Tables 11 and 12).
The motive of secondary fires was not recorded until the introduction of IRS in 2009-10, so Table 13 does not present statistics from before then.
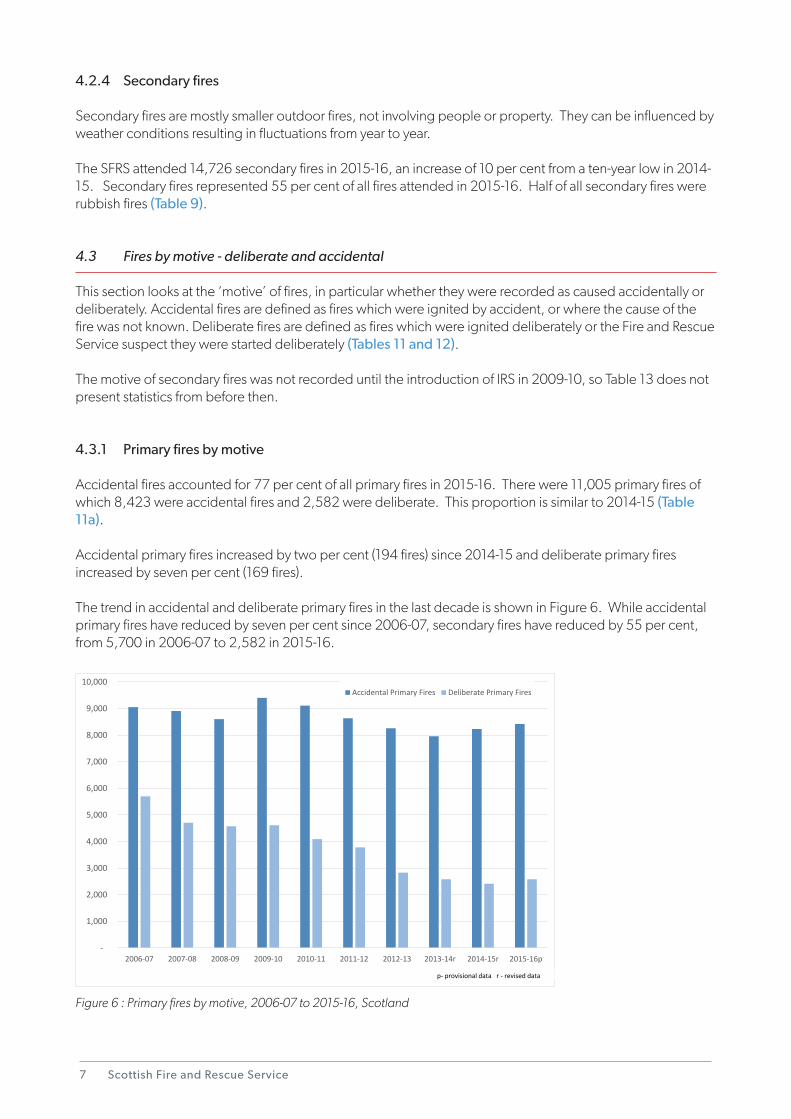
4.3.1 Primary fires by motive
Accidental fires accounted for 77 per cent of all primary fires in 2015-16. There were 11,005 primary fires of which 8,423 were accidental fires and 2,582 were deliberate. This proportion is similar to 2014-15 (Table 11a).
Accidental primary fires increased by two per cent (194 fires) since 2014-15 and deliberate primary fires increased by seven per cent (169 fires).
The trend in accidental and deliberate primary fires in the last decade is shown in Figure 6. While accidental primary fires have reduced by seven per cent since 2006-07, secondary fires have reduced by 55 per cent, from 5,700 in 2006-07 to 2,582 in 2015-16.
-
1,000
2,000
3,000
4,000
5,000
6,000
7,000
8,000
9,000
10,000
2006-07 2007-08 2008-09 2009-10 2010-11 2011-12 2012-13 2013-14r 2014-15r 2015-16p
Accidental Primary Fires Deliberate Primary Fires
p- provisional data r - revised data
Figure 6 : Primary fires by motive, 2006-07 to 2015-16, Scotland
Fire and Rescue Incident Statistics Scotland 2015-16
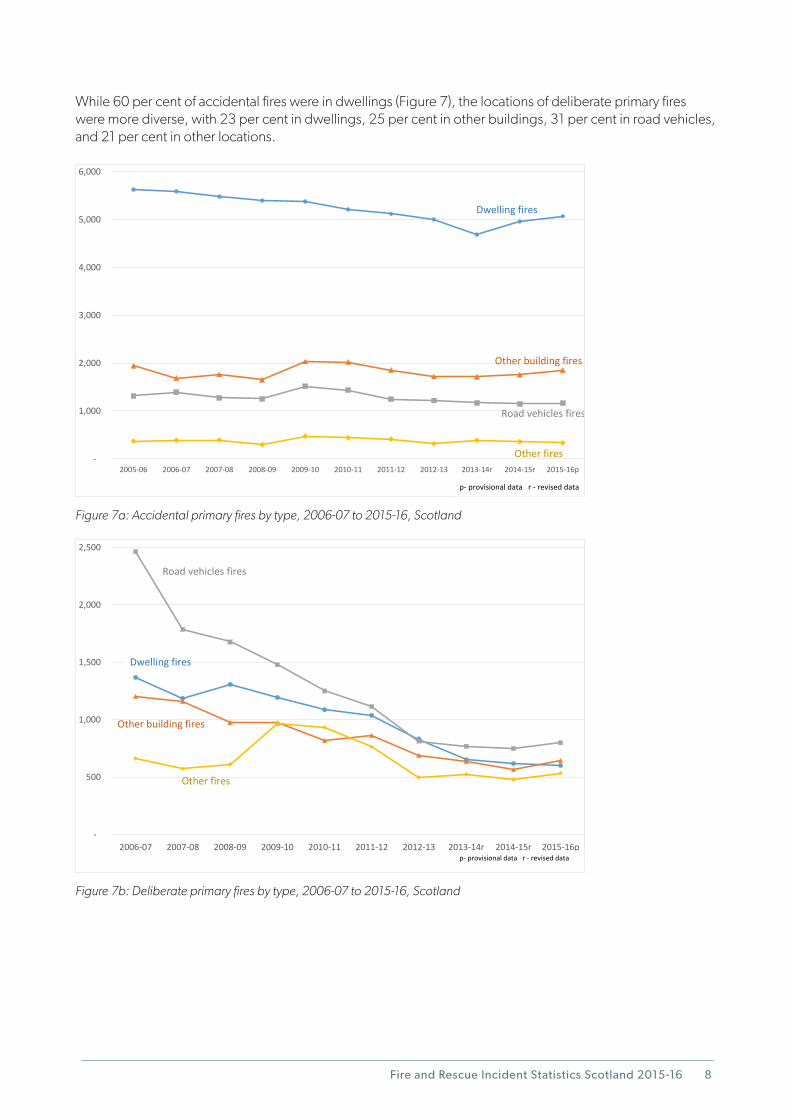
While 60 per cent of accidental fires were in dwellings (Figure 7), the locations of deliberate primary fires were more diverse, with 23 per cent in dwellings, 25 per cent in other buildings, 31 per cent in road vehicles, and 21 per cent in other locations.
8
-
1,000
2,000
3,000
4,000
5,000
6,000
2005-06 2006-07 2007-08 2008-09 2009-10 2010-11 2011-12 2012-13 2013-14r 2014-15r 2015-16p
Dwelling fires
Other fires
Road vehicles fires
Other building fires
p- provisional data r - revised data
Figure 7a: Accidental primary fires by type, 2006-07 to 2015-16, Scotland
-
500
1,000
1,500
2,000
2,500
2006-07 2007-08 2008-09 2009-10 2010-11 2011-12 2012-13 2013-14r 2014-15r 2015-16p
Dwelling fires
Other fires
Road vehicles fires
Other building fires
p- provisional data r - revised data
Figure 7b: Deliberate primary fires by type, 2006-07 to 2015-16, Scotland
Scottish Fire and Rescue Service
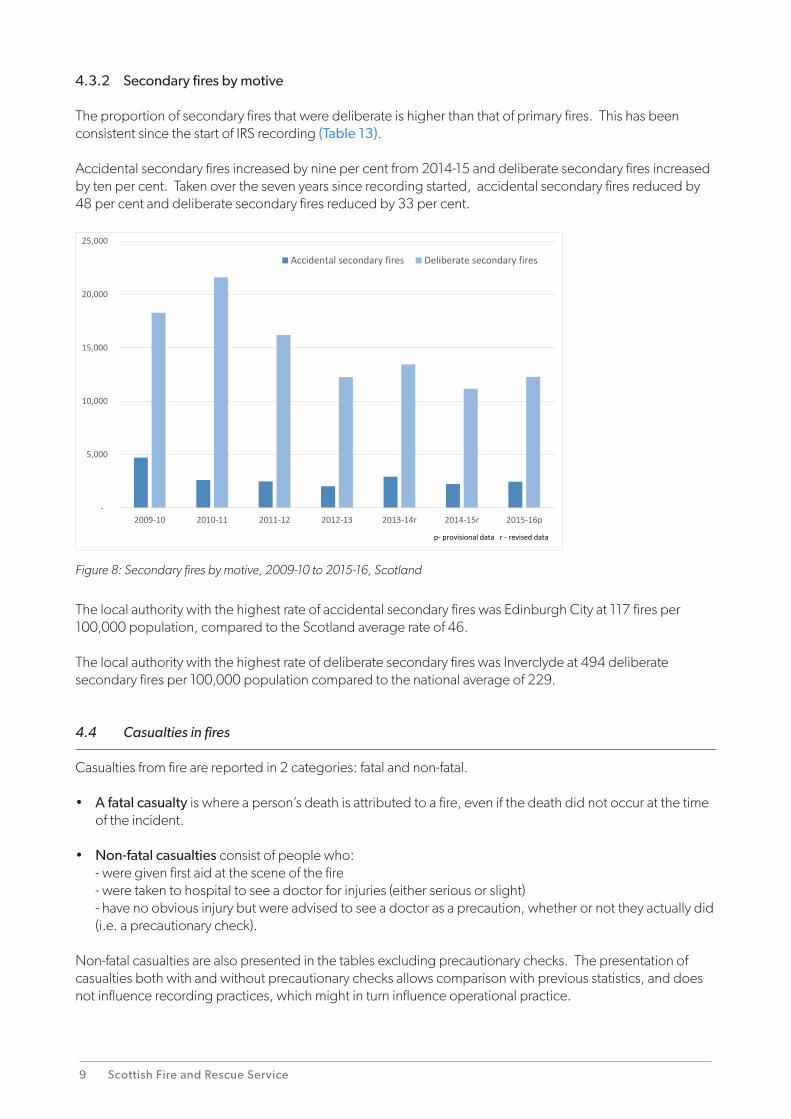
4.3.2 Secondary fires by motive
The proportion of secondary fires that were deliberate is higher than that of primary fires. This has been consistent since the start of IRS recording (Table 13).
Accidental secondary fires increased by nine per cent from 2014-15 and deliberate secondary fires increased by ten per cent. Taken over the seven years since recording started, accidental secondary fires reduced by 48 per cent and deliberate secondary fires reduced by 33 per cent.
9
-
5,000
10,000
15,000
20,000
25,000
2009-10 2010-11 2011-12 2012-13 2013-14r 2014-15r 2015-16p
Accidental secondary fires Deliberate secondary fires
p- provisional data r - revised data
Figure 8: Secondary fires by motive, 2009-10 to 2015-16, Scotland
The local authority with the highest rate of accidental secondary fires was Edinburgh City at 117 fires per 100,000 population, compared to the Scotland average rate of 46.
The local authority with the highest rate of deliberate secondary fires was Inverclyde at 494 deliberate secondary fires per 100,000 population compared to the national average of 229.
4.4 Casualties in fires
Casualties from fire are reported in 2 categories: fatal and non-fatal.
• A fatal casualty is where a person’s death is attributed to a fire, even if the death did not occur at the time of the incident.
• Non-fatal casualties consist of people who: - were given first aid at the scene of the fire - were taken to hospital to see a doctor for injuries (either serious or slight) - have no obvious injury but were advised to see a doctor as a precaution, whether or not they actually did (i.e. a precautionary check).
Non-fatal casualties are also presented in the tables excluding precautionary checks. The presentation of casualties both with and without precautionary checks allows comparison with previous statistics, and does not influence recording practices, which might in turn influence operational practice.
Fire and Rescue Incident Statistics Scotland 2015-16 10
The revision policy, which means that all data is provisional and subject to revision, is particularly relevant for casualty data, which may change following fire investigations or medical reports.
Any fire which results in a fatal or non-fatal casualty is a primary fire.
The datasets published alongside this bulletin provide more data on casualty rates by gender, age, nature of injury and nature of treatment.
4.4.1 Fatal casualties from fires
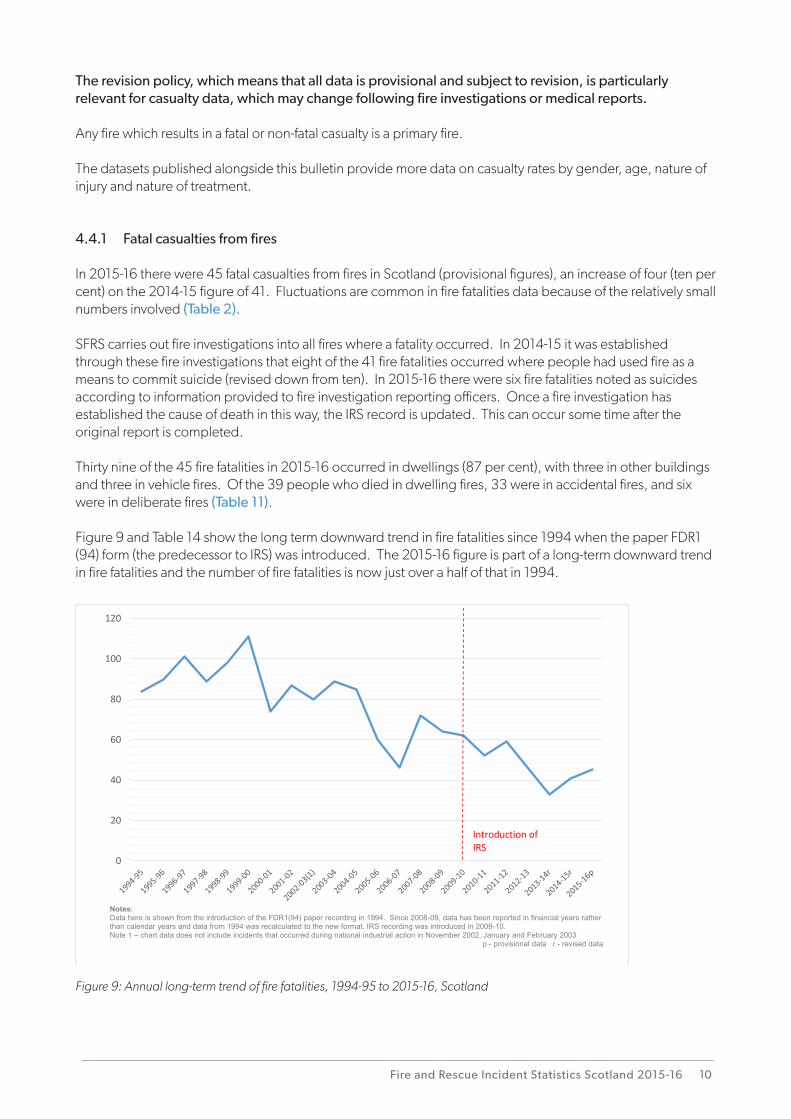
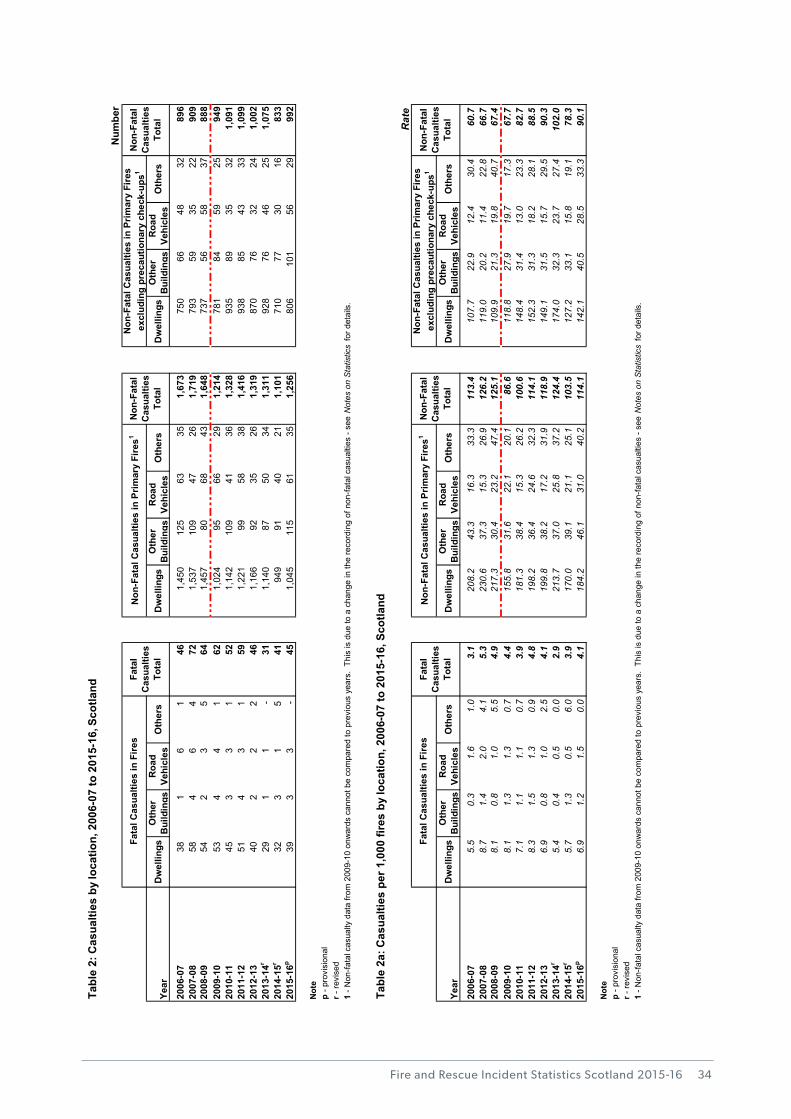
In 2015-16 there were 45 fatal casualties from fires in Scotland (provisional figures), an increase of four (ten per cent) on the 2014-15 figure of 41. Fluctuations are common in fire fatalities data because of the relatively small numbers involved (Table 2).
SFRS carries out fire investigations into all fires where a fatality occurred. In 2014-15 it was established through these fire investigations that eight of the 41 fire fatalities occurred where people had used fire as a means to commit suicide (revised down from ten). In 2015-16 there were six fire fatalities noted as suicides according to information provided to fire investigation reporting officers. Once a fire investigation has established the cause of death in this way, the IRS record is updated. This can occur some time after the original report is completed.
Thirty nine of the 45 fire fatalities in 2015-16 occurred in dwellings (87 per cent), with three in other buildings and three in vehicle fires. Of the 39 people who died in dwelling fires, 33 were in accidental fires, and six were in deliberate fires (Table 11).
Figure 9 and Table 14 show the long term downward trend in fire fatalities since 1994 when the paper FDR1 (94) form (the predecessor to IRS) was introduced. The 2015-16 figure is part of a long-term downward trend in fire fatalities and the number of fire fatalities is now just over a half of that in 1994.
0
20
40
60
80
100
120
Introduction of IRS
Notes: Data here is shown from the introduction of the FDR1(94) paper recording in 1994. Since 2008-09, data has been reported in financial years rather than calendar years and data from 1994 was recalculated to the new format. IRS recording was introduced in 2009-10. Note 1 – chart data does not include incidents that occurred during national industrial action in November 2002, January and February 2003
p - provisional data r - revised data
Figure 9: Annual long-term trend of fire fatalities, 1994-95 to 2015-16, Scotland
Scottish Fire and Rescue Service11
4.4.2 Non-fatal casualties in fires
Data on non-fatal casualties is considered from 2009-10 onwards because the transition to IRS caused some inconsistencies in data recording in this field. Details of this change are explained in Section 1.5.3 of the Notes to the Statistics document that accompanies this bulletin.
Data quoted here is provisional and subject to amendment.
There were 1,256 non-fatal fire casualties in 2015-16. This is an increase of 14 per cent compared to the ten-year low of 2014-15 when there were 1,101 casualties (Table 2).
4.4.3 Non-fatal casualties by location
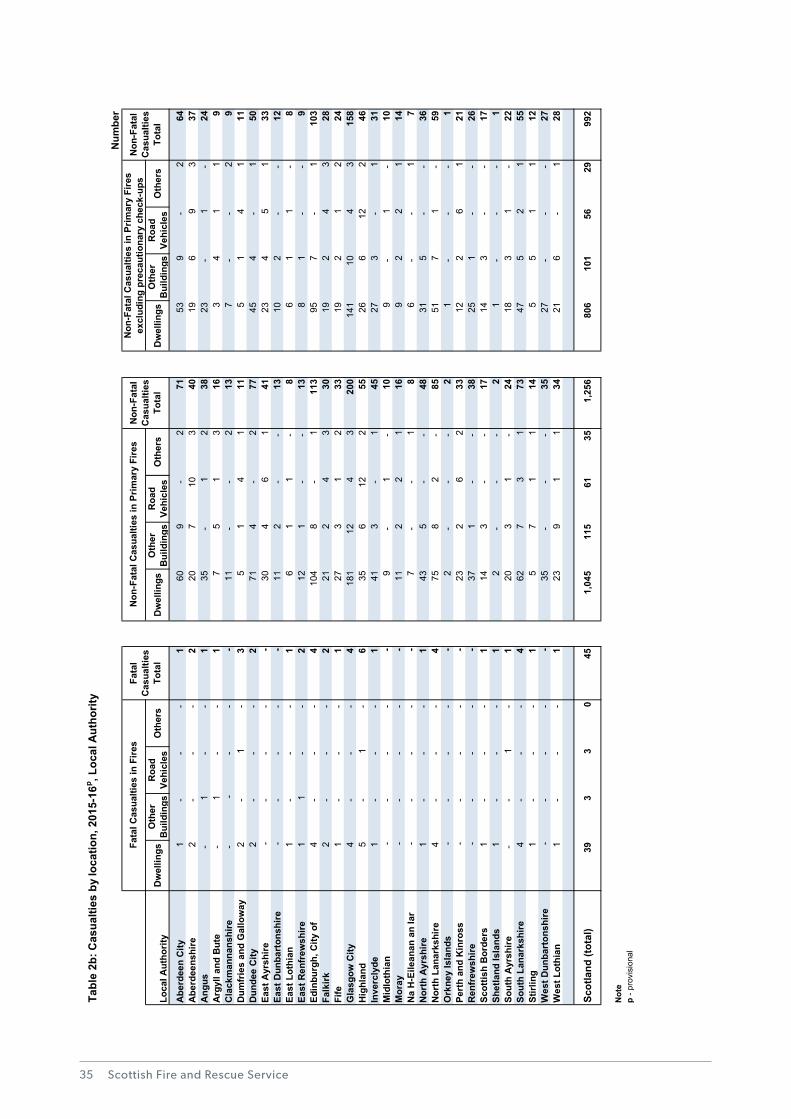
83 per cent of non-fatal fire casualties in 2015-16 occurred in dwelling fires (1,045 casualties). Nine per cent of casualties were in ‘Other building fires’, five per cent in road vehicle fires and three per cent in ‘Other’ fires (Table 2b).
4.4.4 Non-fatal casualty rates
The rate of non-fatal casualties (including precautionary checks) per 1,000 primary fires increased from 103 in 2014-15 to 114 in 2015-16. The rate of casualties per 1,000 primary fires provides an indication of the likelihood of being injured in a fire and can be influenced by both the number of primary fires occurring and the number of injuries in them (Table 2a).
The rate of non-fatal casualties (including precautionary checks) per 1,000 primary fires is higher in dwellings than in other fire locations.
Although there were only seven non-fatal casualties in Na h-Eileanan Siar in 2015-16, it is the local authority with the highest rate at 350 non-fatal casualties per 1,000 primary fires, with Stirling having the lowest rate at 47 per 1,000 fires. The rate for Scotland as a whole was 179 casualties per 1,000 fires.
The rate of non-fatal fire casualties per million population is shown in Section 4.5.4 where comparisons with England and Wales are made.
4.4.5 Fire casualties by motive and location
Accidental fires account for 77 per cent of all fires, 82 per cent of fire fatalities and 86 per cent of non-fatal fire casualties (Table 11).
Provisionally there were 37 fire fatalities in accidental fires in 2015-16, 33 occurred in accidental dwelling fires, 2 in other buildings and 2 were in road vehicle fires.
Of the 8 fatalities which resulted from deliberate fires in 2015-16, 6 occurred in dwellings, there was one fatality in a road vehicle fire and one in an ‘Other building’ fire. Six fire fatalities were identified as suicides (see also Section 4.4.1).
There were provisionally 1,074 non-fatal casualties in accidental fires (86 per cent of all non-fatal casualties) and 182 (14 per cent) in deliberate fires in 2015-16.
The local authority with the highest rate of accidental fires was West Dunbartonshire at 232 accidental primary fires per 100,000 population, and the lowest rate of was in East Dunbartonshire at 95 accidental primary fires per 100,000 population.
Fire and Rescue Incident Statistics Scotland 2015-16 12
For deliberate fires, the local authority with the highest rate was West Lothian at 86 deliberate primary fires per 100,000 population, and the lowest rate was in the Orkney Islands where there were no deliberate primary fires.
4.5 Fires and fire casualties by country
4.5.1 Comparisons by country
Scotland, England and Wales all use the same Home Office managed IRS to report on incidents attended by Fire and Rescue Services. By presenting the rate by population, simple and correct comparisons of fire and casualty rates across Great Britain can be made. Figures for 2015-16 are provisional.
English IRS statistics were published by the Home Office in the Fire Statistics Monitor: April 2015 to March 2016 on 17th August and the Welsh Government published their Fire Statistics on 27th July 2016. Data from these publications is used for the comparisons in this section. In their publications, England and Wales have already included the GB comparisons up to 2014-15, but have not yet included the Scottish 2015-16 statistics.
Rates for other statistics in this publication are quoted per 100,000 population to make the values easily readable. The Home Office published these figures by “per million population” which is used here for consistency and comparability. The difference in presentation moves the decimal place.
4.5.2 Fire rates by country
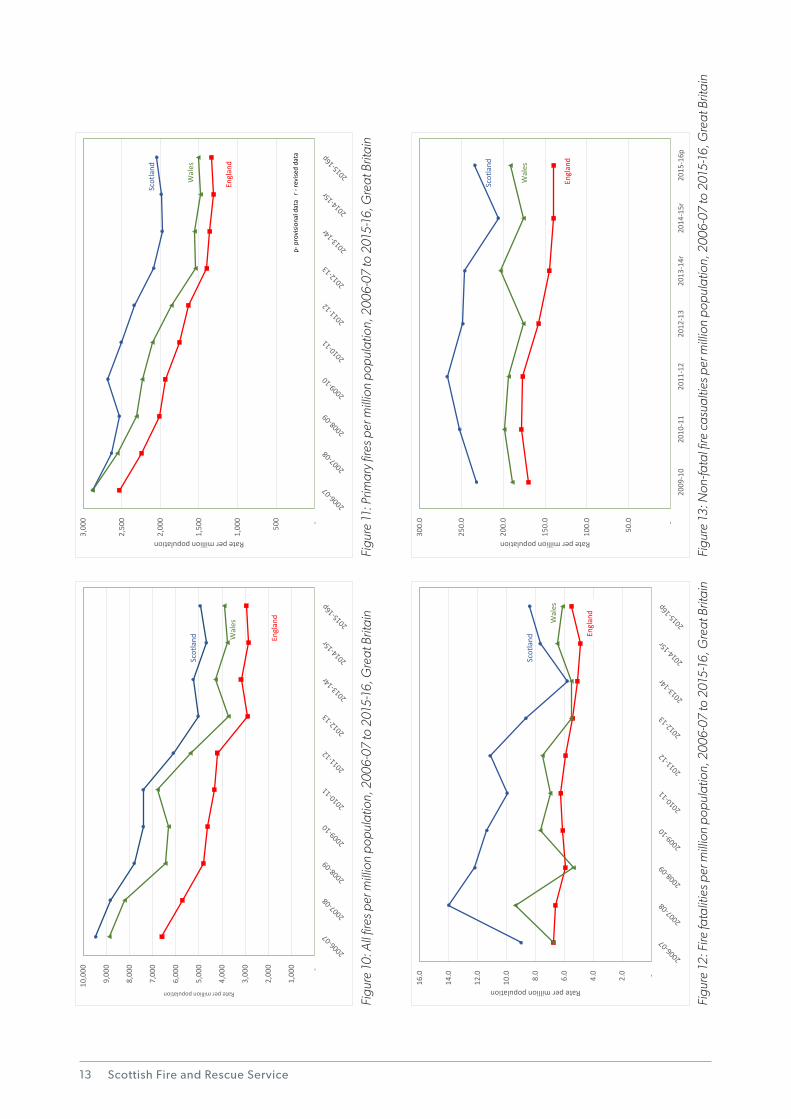
In the last decade, Scotland has had a higher rate per million population than England and Wales for fires, primary fires, fatalities and casualties. Similar changes in trends can be identified in the countries over that time, with all fires and primary fires in all countries falling until around 2013-14 when they started to level off. Fire fatality rates, which are more volatile due to the lower figures, have been dropping over the decade, although rates in Scotland and England have increased since 2014-15.
The 2015-16 rate of all fires per million population was 4,953 fires per million population in Scotland, 3,908 in Wales and 2,958 in England.
Looking at primary fires only, the rates in 2015-16 were 2,048 primary fires per million population in Scotland, 1,510 in Wales and 1,339 in England. The trend over the last ten years is shown in Figure 11.
Scottish Fire and Rescue Service13
-
500
1,0
00
1,5
00
2,0
00
2,5
00
3,0
00
Rate per million population
Scot
land
Wal
es
Engl
and
p-pr
ovisi
onal
dat
a r
-re
vise
d da
ta
Figu
re 1
1: P
rimar
y fir
es p
er m
illio
n po
pula
tion,
200
6-07
to 2
015-
16, G
reat
Brit
ain
- 2.0
4.0
6.0
8.0
10.
0
12.
0
14.
0
16.
0
Rate per million population
Scot
land
Wal
es
Engl
and
Figu
re 1
2: F
ire fa
talit
ies p
er m
illio
n po
pula
tion,
200
6-07
to 2
015-
16, G
reat
Brit
ain
-
50.
0
100
.0
150
.0
200
.0
250
.0
300
.0
2009
-10
2010
-11
2011
-12
2012
-13
2013
-14r
2014
-15r
2015
-16p
Rate per million population
Scot
land
Wal
es
Engl
and
Figu
re 1
3: N
on-fa
tal fi
re c
asua
lties
per
mill
ion
popu
latio
n, 2
006-
07 to
201
5-16
, Gre
at B
ritai
n
-
1,0
00
2,0
00
3,0
00
4,0
00
5,0
00
6,0
00
7,0
00
8,0
00
9,0
00
10,
000
Rate per million population
Scot
land W
ales
Engl
and
Figu
re 1
0: A
ll fir
es p
er m
illio
n po
pula
tion,
200
6-07
to 2
015-
16, G
reat
Brit
ain
Fire and Rescue Incident Statistics Scotland 2015-16
4.5.3 Fire fatality rates by country
The fire fatality rate in Scotland was 8.4 fatalities per million population in 2015-16 (provisional figures) (Table 10).
The rate of fatal casualties from fires per million population in Scotland was again higher than that in England and Wales (5.5 and 6.1 respectively). Over the last ten years, Scotland has had a higher fire fatality rate than the rest of Great Britain (Figure 12), though the small numbers make the fire fatality rate a volatile measure.
4.5.4 Non-fatal casualty rates by country
The non-fatal casualty rate used in this section is defined as the number of non-fatal casualties from fires per million population. Precautionary checks are included in this value.
In 2015-16, there were 234 non-fatal casualties per million population in Scotland, whereas in England and Wales there were 140 and 191 respectively. Over the last ten years Scotland has consistently had a higher rate than England and Wales, even taking into account the change in reporting of non-fatal casualties from 2009-10, which affected statistics in Scotland more than in England and Wales (see Section 1.5.3 of the Notes to the Statistics document that accompanies this bulletin for more details) (Table 10).
Figure 13 shows the trend since the introduction of IRS in 2009-10. This avoids the inconsistency introduced into the non-fatal casualty data at changeover to IRS.
4.6 False alarms
4.6.1 Background
A false alarm is an event in which the SFRS believe they have been called to a reportable incident and then find there is no incident.
False alarms are categorised in IRS as follows:
• Malicious: calls made with the intention of getting the SFRS to attend a non-existent incident, including deliberate and suspected malicious intent;
• Good intent: calls made in good faith in the belief that the SFRS really would be attending a fire or a special service; or
• Due to apparatus: calls initiated by fire alarm and/or fire-fighting equipment (including accidental initiation of alarm apparatus by persons).
As part of the Strategic Plan for 2013-2016 SFRS introduced an “Unwanted Fire Alarm Signals (UFAS) Incident Policy” to consider how best to manage UFAS. The aim of the policy is to reduce risk and create better outcomes by working with the business community and professional associations. The policy was intended to impact on the number of false alarms attended in Scotland, in particular those due to apparatus (though not alarms from single private dwellings). In this bulletin the statistics are reported while longer term analysis of the impact of the UFAS policy is being carried out in the Service.
14
Scottish Fire and Rescue Service15
4.6.2 False alarm statistics
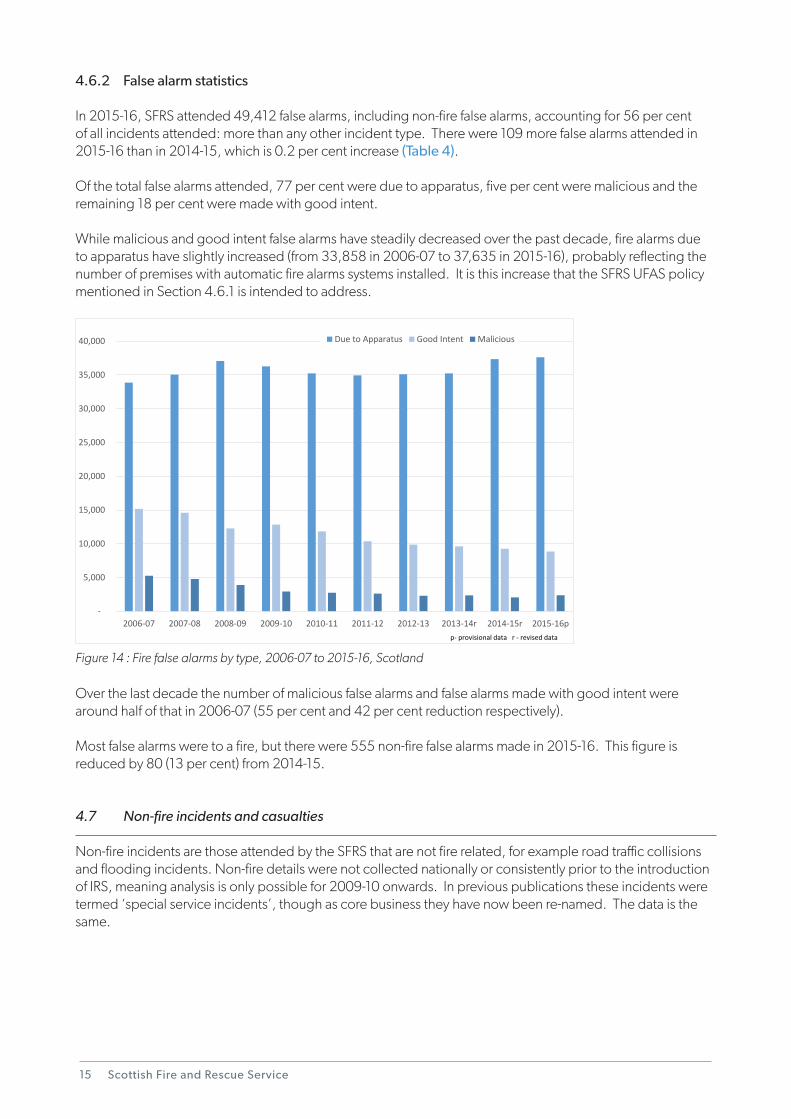
In 2015-16, SFRS attended 49,412 false alarms, including non-fire false alarms, accounting for 56 per cent of all incidents attended: more than any other incident type. There were 109 more false alarms attended in 2015-16 than in 2014-15, which is 0.2 per cent increase (Table 4).
Of the total false alarms attended, 77 per cent were due to apparatus, five per cent were malicious and the remaining 18 per cent were made with good intent.
While malicious and good intent false alarms have steadily decreased over the past decade, fire alarms due to apparatus have slightly increased (from 33,858 in 2006-07 to 37,635 in 2015-16), probably reflecting the number of premises with automatic fire alarms systems installed. It is this increase that the SFRS UFAS policy mentioned in Section 4.6.1 is intended to address.
-
5,000
10,000
15,000
20,000
25,000
30,000
35,000
40,000
2006-07 2007-08 2008-09 2009-10 2010-11 2011-12 2012-13 2013-14r 2014-15r 2015-16p
Due to Apparatus Good Intent Malicious
p- provisional data r - revised data
Figure 14 : Fire false alarms by type, 2006-07 to 2015-16, Scotland
Over the last decade the number of malicious false alarms and false alarms made with good intent were around half of that in 2006-07 (55 per cent and 42 per cent reduction respectively).
Most false alarms were to a fire, but there were 555 non-fire false alarms made in 2015-16. This figure is reduced by 80 (13 per cent) from 2014-15.
4.7 Non-fire incidents and casualties
Non-fire incidents are those attended by the SFRS that are not fire related, for example road traffic collisions and flooding incidents. Non-fire details were not collected nationally or consistently prior to the introduction of IRS, meaning analysis is only possible for 2009-10 onwards. In previous publications these incidents were termed ‘special service incidents’, though as core business they have now been re-named. The data is the same.
Fire and Rescue Incident Statistics Scotland 2015-16
4.7.1 Out of Hospital Cardiac Arrest (OHCA) Trial
On 1st November 2015 SFRS and Scottish Ambulance Service (SAS) launched a series of national co-responding trials to increase the survival rate of patients who suffer out of hospital cardiac arrest in selected areas of Scotland. In this trial, firefighters received enhanced training in life-support, and attend incidents with the SAS through a joint partnership approach. The trial had been running for 6 months during the period of the statistics and so a change in the relevant incident statistics is likely to be discernible. The number of attendances recorded as either “Medical Incident: Co-responder/ First responder” or as “Assist other agencies” would be expected to increase, particularly in the local authorities that are participating. While selected stations in four local authorities were formally involved in the trial, there may also have been other similar incidents that were not in the trial area.
It is important to note that while the SFRS attends these incidents, an increase in incident numbers, or indeed fatalities, is not indicative of poor performance by the fire service.
The following SFRS community fire and rescue stations are included within the scope of the national co-response trials: West Lothian (Bathgate, Livingston and Linlithgow), East Lothian (Musselburgh), Aberdeenshire (Turriff and Maud), Scottish Borders (Hawick, Lauder and Coldstream) and Falkirk (Falkirk).
The commentary here reports on the statistics from IRS and provides a degree of context. The SFRS OHCA trial team are evaluating the trials, which will be reported separately to the statistics.
4.7.2 Non-fire incident statistics
Non-fire incidents accounted for 14 per cent of incidents attended by the SFRS in 2015-16 (Tables 6 and 14).
There were a total of 12,832 non-fire incidents attended by the SFRS in 2015-16, an increase of 19 per cent from 2014-15 (2,089 incidents). This increase includes a 40 per cent increase in “Medical Incident: Co-responder/ First responder” incidents (from 374 to 523) and a 55 per cent increase in “assist other agencies” (from 774 to 1,203 incidents). These two figures are likely to be the result of the OHCA trial.
Other categories of non-fire incident also increased. The largest percentage increases were in “Rescue or evacuation from water” (50 per cent increase from 116 to 174) and a 40 per cent increase in “Effecting entry or exit” (from 1,782 to 2,487). Examples of ‘effecting entry or exit’ include where a person is locked out and a child is left in the house unattended (forced entry) or a person is locked in a room due to a defective lock (forced exit), however, it may also be recorded where the Service attended an incident with the ambulance service and needed to gain access to a casualty. Therefore this increase in effecting entry or exit may also be related to the OHCA trial where crews may have been mobilised to aid other agencies in accessing medical emergencies.
Road Traffic Collisions (RTCs) where a fire did not occur and Effecting entry or exit were the most common types of non-fire incident in 2015-16, each accounting for 19 per cent of all non-fire incidents.
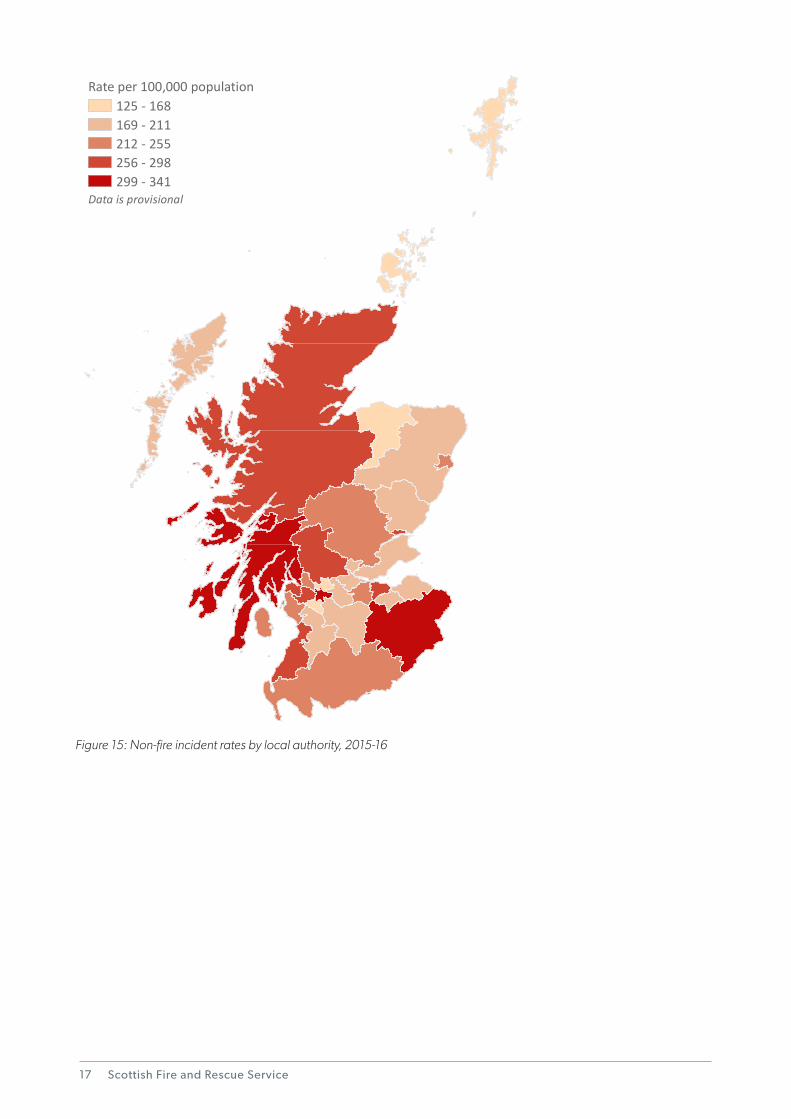
Looking at the non-fire incidents by local authority does not immediately provide a clear picture of the locations where the OHCA trials would be expected to have an effect, though the Scottish Borders is the local authority with the highest rate of non-fire incidents per 100,000 population. It should also be remembered that the stations involved in the trial only form a part of the local authority level reporting and it is possible that other areas may have followed similar processes.
16
Scottish Fire and Rescue Service17
125 - 168169 - 211212 - 255256 - 298299 - 341
Rate per 100,000 population
Data is provisional
Figure 15: Non-fire incident rates by local authority, 2015-16
Fire and Rescue Incident Statistics Scotland 2015-16
4.7.3 Non-fire incident casualties and fatalities
More casualties are associated with non-fire incidents than with fire incidents. The number of casualties and fatalities is expected to be affected by the OHCA trials.
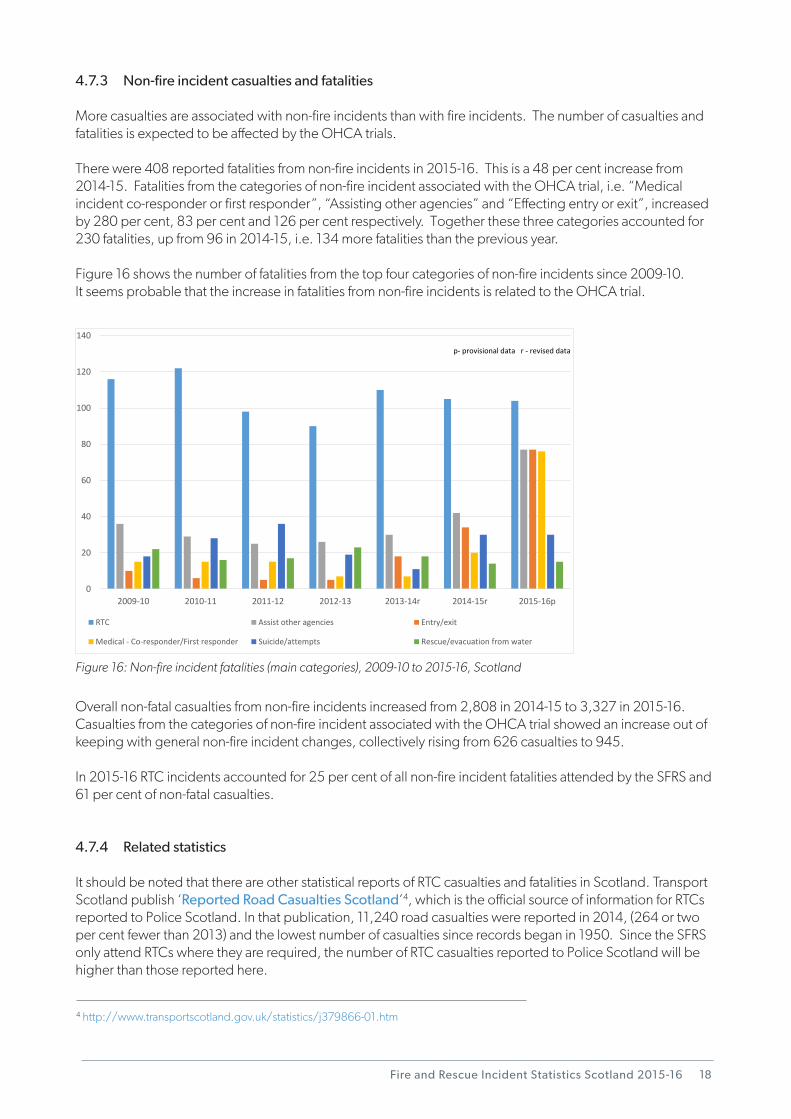
There were 408 reported fatalities from non-fire incidents in 2015-16. This is a 48 per cent increase from 2014-15. Fatalities from the categories of non-fire incident associated with the OHCA trial, i.e. “Medical incident co-responder or first responder”, “Assisting other agencies” and “Effecting entry or exit”, increased by 280 per cent, 83 per cent and 126 per cent respectively. Together these three categories accounted for 230 fatalities, up from 96 in 2014-15, i.e. 134 more fatalities than the previous year.
Figure 16 shows the number of fatalities from the top four categories of non-fire incidents since 2009-10. It seems probable that the increase in fatalities from non-fire incidents is related to the OHCA trial.
18
0
20
40
60
80
100
120
140
2009-10 2010-11 2011-12 2012-13 2013-14r 2014-15r 2015-16p
RTC Assist other agencies Entry/exit
Medical - Co-responder/First responder Suicide/attempts Rescue/evacuation from water
p- provisional data r - revised data
Figure 16: Non-fire incident fatalities (main categories), 2009-10 to 2015-16, Scotland
Overall non-fatal casualties from non-fire incidents increased from 2,808 in 2014-15 to 3,327 in 2015-16. Casualties from the categories of non-fire incident associated with the OHCA trial showed an increase out of keeping with general non-fire incident changes, collectively rising from 626 casualties to 945.
In 2015-16 RTC incidents accounted for 25 per cent of all non-fire incident fatalities attended by the SFRS and 61 per cent of non-fatal casualties.
4.7.4 Related statistics
It should be noted that there are other statistical reports of RTC casualties and fatalities in Scotland. Transport Scotland publish ‘Reported Road Casualties Scotland’4, which is the official source of information for RTCs reported to Police Scotland. In that publication, 11,240 road casualties were reported in 2014, (264 or two per cent fewer than 2013) and the lowest number of casualties since records began in 1950. Since the SFRS only attend RTCs where they are required, the number of RTC casualties reported to Police Scotland will be higher than those reported here.
4 http://www.transportscotland.gov.uk/statistics/j379866-01.htm
Scottish Fire and Rescue Service
5. Glossary of terms
Details of the questions and categories used in the recording of incidents under the new IRS are available in the document IRS Questions and Lists.
Accidental: Includes fires where the fire was ignited by accident, or where the cause was not known or unspecified.
Buildings: All buildings, including those under construction, but excluding derelict buildings or those under demolition. Prior to 1994 ‘buildings’ were referred to as ‘occupied buildings’.
Dwellings: Buildings occupied by households, excluding hotels, hostels and residential institutions. Mobile homes are specifically included in the dwelling count. In 2000, the definition of a dwelling (for the purpose of reporting fires) was widened to include any non-permanent structures used solely as a dwelling, such as caravans, houseboats etc. (amounts to 0.3 per cent of the total number of UK dwelling fires). All analyses prior to 1998 relating to dwellings were retrospectively revised to include the new categories of dwelling. Caravans, boats etc. not used as a permanent dwelling are shown according to the type of property (caravan, vehicle etc.).
Chimney fires: Reported fires in occupied buildings: - where the fire was confined within the chimney structure; - that did not involve casualties or rescues; and - attended by less than five appliances.
Deliberate: Includes fires where deliberate ignition is merely suspected, and recorded by the SFRS as “doubtful”.
False Alarm: An event in which the SFRS believe they have been called to a reportable fire or special service incident and then there is no such incident. False alarms are categorised as:
Malicious – the call was made with the intention of getting the SFRS to attend a non-existent incident. This includes ‘deliberate’ and ‘suspected malicious’ intentions;
Good intent – the call was made in good faith in the belief that the SFRS really would attend an incident;
Due to apparatus (fire incidents only) – the call was initiated by fire alarm and fire fighting equipment operating (including accidental initiation of alarm apparatus by a person).
Fatal casualty (fires): Any fatal casualty which is the direct or indirect result of injuries caused by a fire incident. Even if the fatal casualty dies subsequently, any fatality whose cause is attributed to a fire is included. There are also occasional cases where it transpires subsequently that fire was not the cause of death. For all of these reasons, fatalities data may therefore be subject to revision.
23
Fire and Rescue Incident Statistics Scotland 2015-16
Fire Damage Reports The method of data collection via paper forms prior to the Incident Recording (FDR1, FDR2 and FDR3): System (April 2009). FDR1 was used to record primary fires, FDR2 was used to amend FDR1 records that needed updating and FDR3 reported aggregate data for secondary fires, chimney fires and false alarms.
Location: The type of premises, property or countryside in which the fire started. This is not necessarily the type of premises in which most casualties or damage occurred as a result of the fire.
Non-fatal casualty (fires): Persons in fires who were: - given first aid at the scene; - referred to hospital to see a doctor for injuries (either serious or slight); or - advised to see a doctor for a precautionary check, whether or not they actually did.
Non-fire incident: formerly “Special service incident”. These cover incidents requiring the attendance of an appliance or officer. The Fire (Scotland) Act 2005 placed a statutory duty on former FRSs (and now SFRS) to make provision for firefighting and road traffic accidents. It also included an additional function order that covers non-fire incidents such as rescues from collapsed buildings and serious flooding (Table 6 shows the Non-fire incidents categories included in the publication).
Outdoor fires: The term ‘outdoor fires’ used in this publication refers to primary and secondary fires in road vehicles, other outdoor property, derelict buildings, derelict vehicles and refuse, grassland and intentional straw/stubble fires.
Precautionary check: A precautionary check is when an individual is sent to hospital or advised to see a doctor as a precaution, having no obvious injury or distress (see definition for ‘non-fatal casualty’ above).
Primary fires: Include all fires in non-derelict buildings and most outdoor structures, or any fires involving casualties or rescues, or any fires attended by five or more appliances.
Secondary fires: The majority of outdoor fires including grassland and refuse fires unless they involve casualties or rescues, property loss, or if five or more appliances attend. They include fires in derelict buildings but not chimney fires.
Special services: Special service incidents are now reported as “Non-fire incidents”.
24
Scottish Fire and Rescue Service
6. Local Authority maps
25
Fire and Rescue Incident Statistics Scotland 2015-16 26
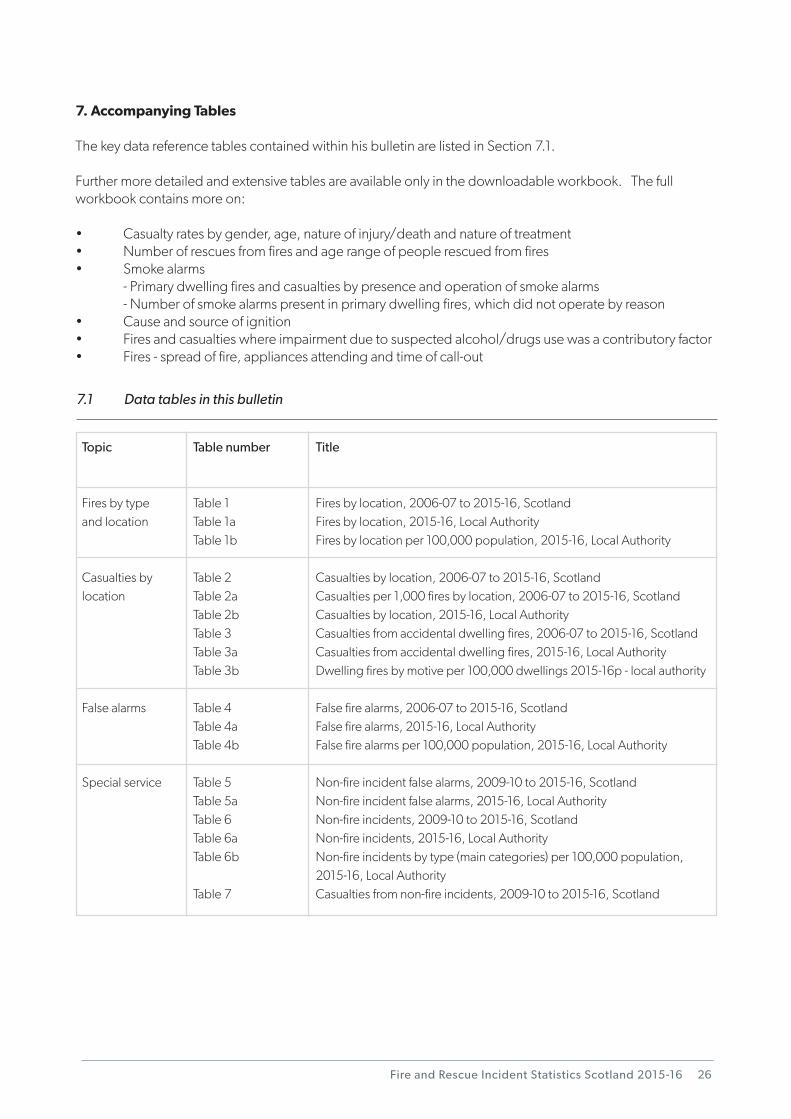
7. Accompanying Tables
The key data reference tables contained within his bulletin are listed in Section 7.1.
Further more detailed and extensive tables are available only in the downloadable workbook. The full workbook contains more on:
• Casualtyratesbygender,age,natureofinjury/deathandnatureoftreatment• Numberofrescuesfromfiresandagerangeofpeoplerescuedfromfires• Smokealarms - Primary dwelling fires and casualties by presence and operation of smoke alarms - Number of smoke alarms present in primary dwelling fires, which did not operate by reason• Causeandsourceofignition• Firesandcasualtieswhereimpairmentduetosuspectedalcohol/drugsusewasacontributoryfactor• Fires-spreadoffire,appliancesattendingandtimeofcall-out
Topic
Fires by type and location
Casualties by location
False alarms
Special service
Table number
Table 1Table 1aTable 1b
Table 2Table 2aTable 2bTable 3Table 3aTable 3b
Table 4Table 4aTable 4b
Table 5Table 5aTable 6Table 6aTable 6b
Table 7
Title
Fires by location, 2006-07 to 2015-16, ScotlandFires by location, 2015-16, Local AuthorityFires by location per 100,000 population, 2015-16, Local Authority
Casualties by location, 2006-07 to 2015-16, ScotlandCasualties per 1,000 fires by location, 2006-07 to 2015-16, ScotlandCasualties by location, 2015-16, Local AuthorityCasualties from accidental dwelling fires, 2006-07 to 2015-16, ScotlandCasualties from accidental dwelling fires, 2015-16, Local AuthorityDwelling fires by motive per 100,000 dwellings 2015-16p - local authority
False fire alarms, 2006-07 to 2015-16, ScotlandFalse fire alarms, 2015-16, Local AuthorityFalse fire alarms per 100,000 population, 2015-16, Local Authority
Non-fire incident false alarms, 2009-10 to 2015-16, ScotlandNon-fire incident false alarms, 2015-16, Local AuthorityNon-fire incidents, 2009-10 to 2015-16, ScotlandNon-fire incidents, 2015-16, Local AuthorityNon-fire incidents by type (main categories) per 100,000 population, 2015-16, Local AuthorityCasualties from non-fire incidents, 2009-10 to 2015-16, Scotland
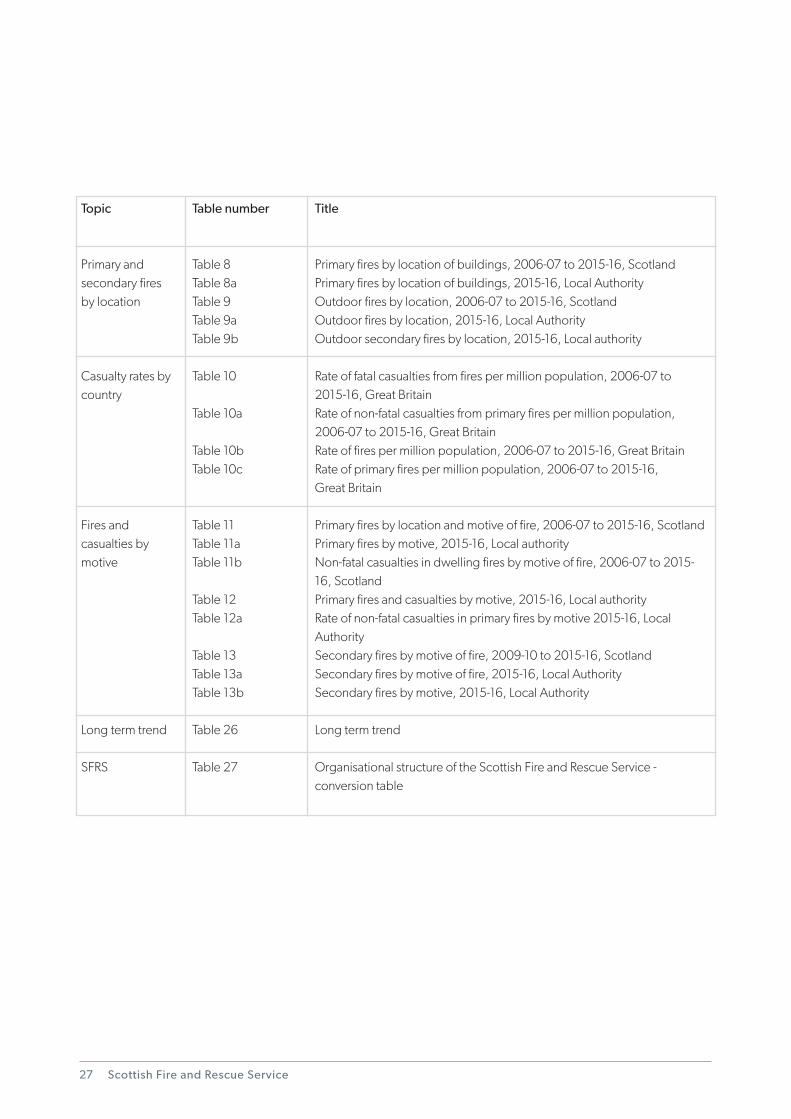
7.1 Data tables in this bulletin
Scottish Fire and Rescue Service27
Topic
Primary and secondary fires by location
Casualty rates by country
Fires and casualties by motive
Long term trend
SFRS
Table number
Table 8Table 8aTable 9 Table 9aTable 9b
Table 10
Table 10a
Table 10bTable 10c
Table 11Table 11aTable 11b
Table 12Table 12a
Table 13Table 13aTable 13b
Table 26
Table 27
Title
Primary fires by location of buildings, 2006-07 to 2015-16, ScotlandPrimary fires by location of buildings, 2015-16, Local AuthorityOutdoor fires by location, 2006-07 to 2015-16, ScotlandOutdoor fires by location, 2015-16, Local AuthorityOutdoor secondary fires by location, 2015-16, Local authority
Rate of fatal casualties from fires per million population, 2006-07 to 2015-16, Great BritainRate of non-fatal casualties from primary fires per million population, 2006-07 to 2015-16, Great BritainRate of fires per million population, 2006-07 to 2015-16, Great BritainRate of primary fires per million population, 2006-07 to 2015-16, Great Britain
Primary fires by location and motive of fire, 2006-07 to 2015-16, ScotlandPrimary fires by motive, 2015-16, Local authority Non-fatal casualties in dwelling fires by motive of fire, 2006-07 to 2015-16, Scotland Primary fires and casualties by motive, 2015-16, Local authority Rate of non-fatal casualties in primary fires by motive 2015-16, Local Authority Secondary fires by motive of fire, 2009-10 to 2015-16, Scotland Secondary fires by motive of fire, 2015-16, Local Authority Secondary fires by motive, 2015-16, Local Authority
Long term trend
Organisational structure of the Scottish Fire and Rescue Service - conversion table
Fire and Rescue Incident Statistics Scotland 2015-16
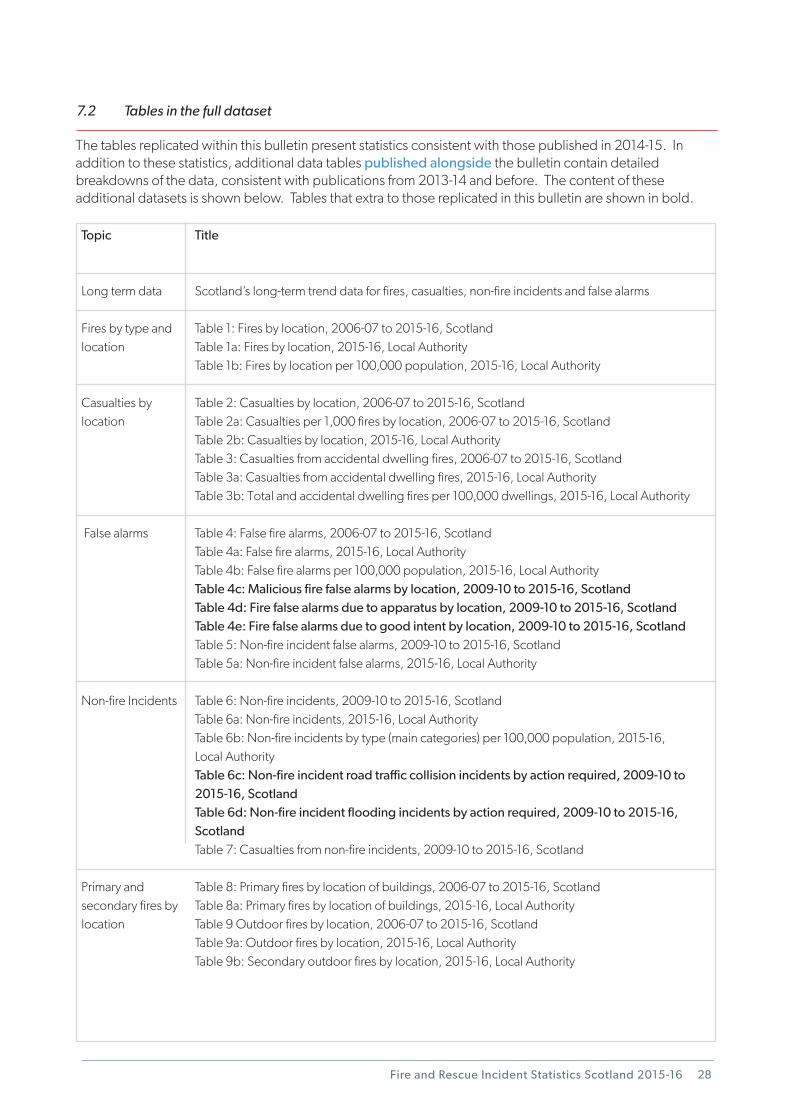
7.2 Tables in the full dataset
The tables replicated within this bulletin present statistics consistent with those published in 2014-15. In addition to these statistics, additional data tables published alongside the bulletin contain detailed breakdowns of the data, consistent with publications from 2013-14 and before. The content of these additional datasets is shown below. Tables that extra to those replicated in this bulletin are shown in bold.
Topic
Long term data
Fires by type and location
Casualties by location
False alarms
Non-fire Incidents
Primary and secondary fires by location
Title
Scotland’s long-term trend data for fires, casualties, non-fire incidents and false alarms
Table 1: Fires by location, 2006-07 to 2015-16, ScotlandTable 1a: Fires by location, 2015-16, Local AuthorityTable 1b: Fires by location per 100,000 population, 2015-16, Local Authority
Table 2: Casualties by location, 2006-07 to 2015-16, ScotlandTable 2a: Casualties per 1,000 fires by location, 2006-07 to 2015-16, ScotlandTable 2b: Casualties by location, 2015-16, Local AuthorityTable 3: Casualties from accidental dwelling fires, 2006-07 to 2015-16, ScotlandTable 3a: Casualties from accidental dwelling fires, 2015-16, Local AuthorityTable 3b: Total and accidental dwelling fires per 100,000 dwellings, 2015-16, Local Authority
Table 4: False fire alarms, 2006-07 to 2015-16, ScotlandTable 4a: False fire alarms, 2015-16, Local AuthorityTable 4b: False fire alarms per 100,000 population, 2015-16, Local AuthorityTable 4c: Malicious fire false alarms by location, 2009-10 to 2015-16, ScotlandTable 4d: Fire false alarms due to apparatus by location, 2009-10 to 2015-16, ScotlandTable 4e: Fire false alarms due to good intent by location, 2009-10 to 2015-16, ScotlandTable 5: Non-fire incident false alarms, 2009-10 to 2015-16, ScotlandTable 5a: Non-fire incident false alarms, 2015-16, Local Authority
Table 6: Non-fire incidents, 2009-10 to 2015-16, ScotlandTable 6a: Non-fire incidents, 2015-16, Local AuthorityTable 6b: Non-fire incidents by type (main categories) per 100,000 population, 2015-16, Local AuthorityTable 6c: Non-fire incident road traffic collision incidents by action required, 2009-10 to 2015-16, ScotlandTable 6d: Non-fire incident flooding incidents by action required, 2009-10 to 2015-16, ScotlandTable 7: Casualties from non-fire incidents, 2009-10 to 2015-16, Scotland
Table 8: Primary fires by location of buildings, 2006-07 to 2015-16, ScotlandTable 8a: Primary fires by location of buildings, 2015-16, Local AuthorityTable 9 Outdoor fires by location, 2006-07 to 2015-16, ScotlandTable 9a: Outdoor fires by location, 2015-16, Local AuthorityTable 9b: Secondary outdoor fires by location, 2015-16, Local Authority
28
Scottish Fire and Rescue Service
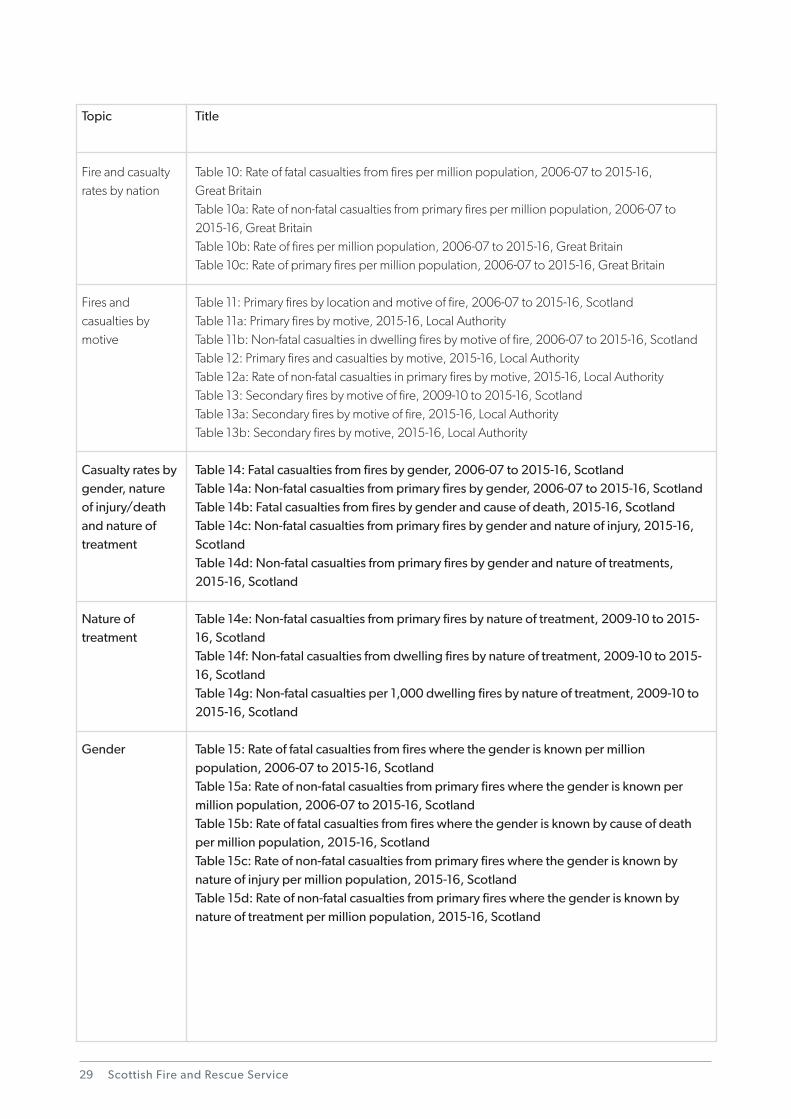
Topic
Fire and casualty rates by nation
Fires and casualties by motive
Casualty rates by gender, nature of injury/death and nature of treatment
Nature of treatment
Gender
Title
Table 10: Rate of fatal casualties from fires per million population, 2006-07 to 2015-16, Great BritainTable 10a: Rate of non-fatal casualties from primary fires per million population, 2006-07 to 2015-16, Great BritainTable 10b: Rate of fires per million population, 2006-07 to 2015-16, Great BritainTable 10c: Rate of primary fires per million population, 2006-07 to 2015-16, Great Britain
Table 11: Primary fires by location and motive of fire, 2006-07 to 2015-16, ScotlandTable 11a: Primary fires by motive, 2015-16, Local AuthorityTable 11b: Non-fatal casualties in dwelling fires by motive of fire, 2006-07 to 2015-16, ScotlandTable 12: Primary fires and casualties by motive, 2015-16, Local AuthorityTable 12a: Rate of non-fatal casualties in primary fires by motive, 2015-16, Local AuthorityTable 13: Secondary fires by motive of fire, 2009-10 to 2015-16, ScotlandTable 13a: Secondary fires by motive of fire, 2015-16, Local AuthorityTable 13b: Secondary fires by motive, 2015-16, Local Authority
Table 14: Fatal casualties from fires by gender, 2006-07 to 2015-16, ScotlandTable 14a: Non-fatal casualties from primary fires by gender, 2006-07 to 2015-16, ScotlandTable 14b: Fatal casualties from fires by gender and cause of death, 2015-16, ScotlandTable 14c: Non-fatal casualties from primary fires by gender and nature of injury, 2015-16, ScotlandTable 14d: Non-fatal casualties from primary fires by gender and nature of treatments, 2015-16, Scotland
Table 14e: Non-fatal casualties from primary fires by nature of treatment, 2009-10 to 2015-16, ScotlandTable 14f: Non-fatal casualties from dwelling fires by nature of treatment, 2009-10 to 2015-16, ScotlandTable 14g: Non-fatal casualties per 1,000 dwelling fires by nature of treatment, 2009-10 to 2015-16, Scotland
Table 15: Rate of fatal casualties from fires where the gender is known per million population, 2006-07 to 2015-16, ScotlandTable 15a: Rate of non-fatal casualties from primary fires where the gender is known per million population, 2006-07 to 2015-16, ScotlandTable 15b: Rate of fatal casualties from fires where the gender is known by cause of death per million population, 2015-16, ScotlandTable 15c: Rate of non-fatal casualties from primary fires where the gender is known by nature of injury per million population, 2015-16, ScotlandTable 15d: Rate of non-fatal casualties from primary fires where the gender is known by nature of treatment per million population, 2015-16, Scotland
29
Fire and Rescue Incident Statistics Scotland 2015-16
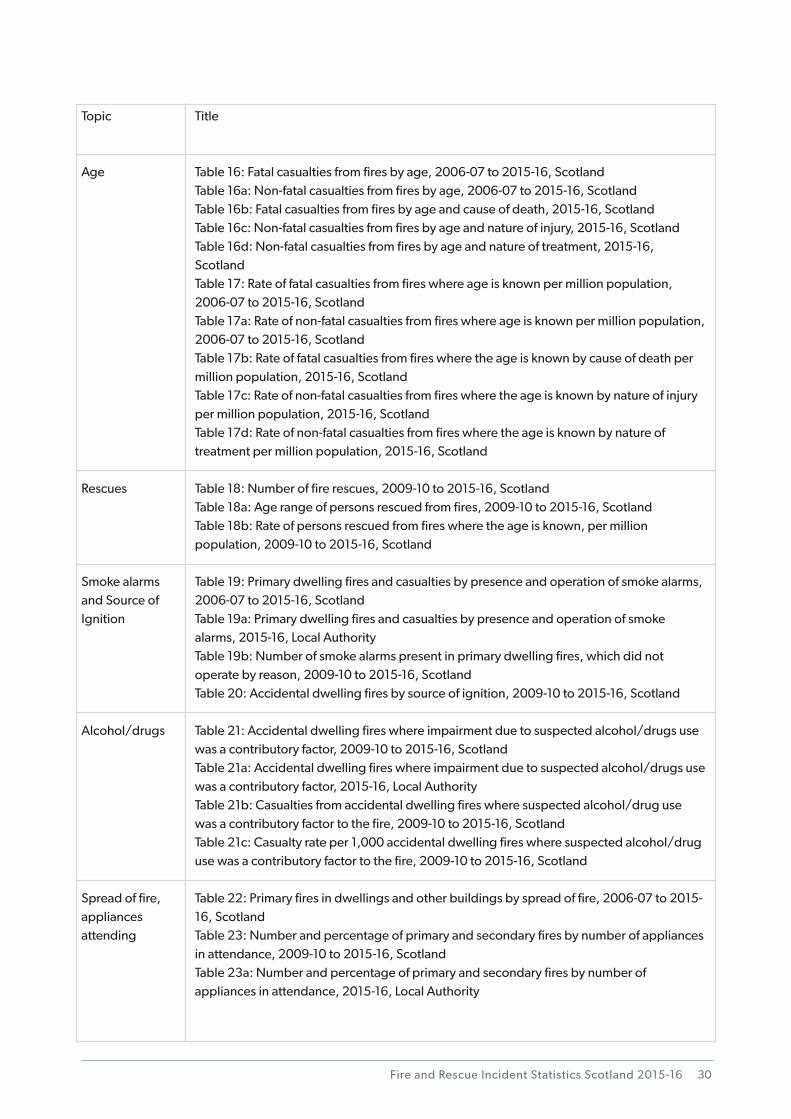
Topic
Age
Rescues
Smoke alarms and Source of Ignition
Alcohol/drugs
Spread of fire, appliances attending
Title
Table 16: Fatal casualties from fires by age, 2006-07 to 2015-16, ScotlandTable 16a: Non-fatal casualties from fires by age, 2006-07 to 2015-16, ScotlandTable 16b: Fatal casualties from fires by age and cause of death, 2015-16, ScotlandTable 16c: Non-fatal casualties from fires by age and nature of injury, 2015-16, ScotlandTable 16d: Non-fatal casualties from fires by age and nature of treatment, 2015-16, ScotlandTable 17: Rate of fatal casualties from fires where age is known per million population, 2006-07 to 2015-16, ScotlandTable 17a: Rate of non-fatal casualties from fires where age is known per million population, 2006-07 to 2015-16, ScotlandTable 17b: Rate of fatal casualties from fires where the age is known by cause of death per million population, 2015-16, ScotlandTable 17c: Rate of non-fatal casualties from fires where the age is known by nature of injury per million population, 2015-16, ScotlandTable 17d: Rate of non-fatal casualties from fires where the age is known by nature of treatment per million population, 2015-16, Scotland
Table 18: Number of fire rescues, 2009-10 to 2015-16, ScotlandTable 18a: Age range of persons rescued from fires, 2009-10 to 2015-16, ScotlandTable 18b: Rate of persons rescued from fires where the age is known, per million population, 2009-10 to 2015-16, Scotland
Table 19: Primary dwelling fires and casualties by presence and operation of smoke alarms, 2006-07 to 2015-16, ScotlandTable 19a: Primary dwelling fires and casualties by presence and operation of smoke alarms, 2015-16, Local AuthorityTable 19b: Number of smoke alarms present in primary dwelling fires, which did not operate by reason, 2009-10 to 2015-16, ScotlandTable 20: Accidental dwelling fires by source of ignition, 2009-10 to 2015-16, Scotland
Table 21: Accidental dwelling fires where impairment due to suspected alcohol/drugs use was a contributory factor, 2009-10 to 2015-16, ScotlandTable 21a: Accidental dwelling fires where impairment due to suspected alcohol/drugs use was a contributory factor, 2015-16, Local AuthorityTable 21b: Casualties from accidental dwelling fires where suspected alcohol/drug use was a contributory factor to the fire, 2009-10 to 2015-16, ScotlandTable 21c: Casualty rate per 1,000 accidental dwelling fires where suspected alcohol/drug use was a contributory factor to the fire, 2009-10 to 2015-16, Scotland
Table 22: Primary fires in dwellings and other buildings by spread of fire, 2006-07 to 2015-16, ScotlandTable 23: Number and percentage of primary and secondary fires by number of appliances in attendance, 2009-10 to 2015-16, ScotlandTable 23a: Number and percentage of primary and secondary fires by number of appliances in attendance, 2015-16, Local Authority
30
Scottish Fire and Rescue Service
Topic
Time of call
Revisions
Title
Table 24: Primary fires by location and time of call, 2006-07 to 2015-16, ScotlandTable 25: Rates of Casualties in Dwelling fires by time of call, 2006-07 to 2015-16, Scotland
Changes due to revision of 2014-15 data
31
Fire and Rescue Incident Statistics Scotland 2015-16
Number
Year1 Dwellings Other Buildings
Road Vehicles Others
2006-07 6,963 2,887 3,856 1,052 14,758 32,397 1,430 48,5852007-08 6,666 2,922 3,064 966 13,618 30,385 1,633 45,6362008-09 6,705 2,630 2,931 908 13,174 25,651 1,745 40,5702009-10 6,573 3,008 2,992 1,445 14,018 22,981 1,738 38,7372010-11 6,300 2,838 2,688 1,372 13,198 24,207 1,565 38,9702011-12 6,160 2,717 2,362 1,175 12,414 18,681 1,243 32,3382012-13 5,836 2,409 2,034 814 11,093 14,278 1,375 26,7462013-14r 5,334 2,353 1,938 914 10,539 16,360 1,093 27,9922014-15r 5,581 2,326 1,897 838 10,642 13,406 977 25,0252015-16p 5,673 2,496 1,965 871 11,005 14,726 882 26,613
Notep - provisionalr - revised
Number
Local Authority Dwellings Other Buildings
Road Vehicles Others
Aberdeen City 334 121 80 18 553 441 10 1,004Aberdeenshire 192 83 90 39 404 184 77 665Angus 95 42 32 12 181 147 21 349Argyll and Bute 64 38 21 14 137 68 67 272Clackmannanshire 75 23 4 10 112 102 4 218Dumfries and Galloway 94 45 67 23 229 153 57 439Dundee City 256 78 40 9 383 680 3 1,066East Ayrshire 104 54 42 19 219 616 13 848East Dunbartonshire 77 29 31 10 147 171 1 319East Lothian 85 35 50 27 197 195 27 419East Renfrewshire 71 33 16 11 131 147 3 281Edinburgh, City of 633 289 203 99 1,224 1,893 8 3,125Falkirk 133 71 55 47 306 343 5 654Fife 277 133 117 45 572 736 28 1,336Glasgow City 960 408 291 79 1,738 2,436 10 4,184Highland 131 103 87 56 377 342 238 957Inverclyde 129 37 32 17 215 405 2 622Midlothian 69 32 29 40 170 301 14 485Moray 50 36 28 11 125 95 29 249Na H-Eileanan an Iar 20 7 9 5 41 30 38 109North Ayrshire 176 63 34 11 284 507 16 807North Lanarkshire 336 140 146 33 655 1,540 4 2,199Orkney Islands 11 9 11 6 37 13 13 63Perth and Kinross 123 74 50 23 270 144 66 480Renfrewshire 242 89 56 19 406 566 5 977Scottish Borders 110 48 32 37 227 92 54 373Shetland Islands 19 4 7 7 37 11 11 59South Ayrshire 99 54 30 4 187 211 16 414South Lanarkshire 294 99 123 23 539 906 14 1,459Stirling 108 72 34 18 232 209 23 464West Dunbartonshire 156 59 40 15 270 312 1 583West Lothian 150 88 78 84 400 730 4 1,134
Scotland (total) 5,673 2,496 1,965 871 11,005 14,726 882 26,613
Notep - provisional
Table 1: Fires by location, 2006-07 to 2015-16, Scotland
Table 1a: Fires by location, 2015-16p, Local Authority
Primary Fires Primary Total
Secondary Fires
Chimney Fires Total Fires
Primary Fires Primary Total
Secondary Fires
Chimney Fires Total Fires
1 - Primary fire figures from before 2009-10 are based on sample data weighted to (former) Fire and Rescue Service totals.
1 1 1a 1b
32
Scottish Fire and Rescue Service
Rate
Local Authority Dwellings Other Buildings
Road Vehicles Others
Aberdeen City 144.9 52.5 34.7 7.8 240.1 191.4 4.3 435.9 230,350Aberdeenshire 73.3 31.7 34.4 14.9 154.2 70.2 29.4 253.9 261,960Angus 81.3 35.9 27.4 10.3 154.8 125.7 18.0 298.5 116,900Argyll and Bute 73.7 43.7 24.2 16.1 157.7 78.3 77.1 313.0 86,890Clackmannanshire 146.0 44.8 7.8 19.5 218.1 198.6 7.8 424.5 51,360Dumfries and Galloway 62.8 30.1 44.8 15.4 153.0 102.2 38.1 293.3 149,670Dundee City 172.7 52.6 27.0 6.1 258.4 458.8 2.0 719.2 148,210East Ayrshire 85.2 44.2 34.4 15.6 179.4 504.7 10.7 694.7 122,060East Dunbartonshire 72.0 27.1 29.0 9.3 137.4 159.9 0.9 298.2 106,960East Lothian 82.5 34.0 48.5 26.2 191.2 189.2 26.2 406.6 103,050East Renfrewshire 76.4 35.5 17.2 11.8 141.0 158.2 3.2 302.3 92,940Edinburgh, City of 126.9 57.9 40.7 19.8 245.4 379.5 1.6 626.5 498,810Falkirk 83.9 44.8 34.7 29.7 193.1 216.5 3.2 412.7 158,460Fife 75.3 36.1 31.8 12.2 155.4 200.0 7.6 363.0 368,080Glasgow City 158.3 67.3 48.0 13.0 286.6 401.8 1.6 690.0 606,340Highland 56.0 44.0 37.2 23.9 161.0 146.1 101.7 408.8 234,110Inverclyde 162.3 46.5 40.3 21.4 270.4 509.4 2.5 782.4 79,500Midlothian 79.0 36.6 33.2 45.8 194.5 344.4 16.0 555.0 87,390Moray 52.4 37.7 29.3 11.5 130.9 99.5 30.4 260.7 95,510Na H-Eileanan an Iar 73.9 25.9 33.2 18.5 151.5 110.8 140.4 402.7 27,070North Ayrshire 129.3 46.3 25.0 8.1 208.6 372.4 11.8 592.8 136,130North Lanarkshire 99.3 41.4 43.2 9.8 193.6 455.3 1.2 650.1 338,260Orkney Islands 50.8 41.5 50.8 27.7 170.7 60.0 60.0 290.7 21,670Perth and Kinross 82.0 49.4 33.3 15.3 180.1 96.0 44.0 320.1 149,930Renfrewshire 138.6 51.0 32.1 10.9 232.6 324.2 2.9 559.7 174,560Scottish Borders 96.5 42.1 28.1 32.4 199.1 80.7 47.4 327.1 114,030Shetland Islands 81.9 17.2 30.2 30.2 159.5 47.4 47.4 254.3 23,200South Ayrshire 88.1 48.0 26.7 3.6 166.4 187.7 14.2 368.3 112,400South Lanarkshire 93.0 31.3 38.9 7.3 170.4 286.5 4.4 461.4 316,230Stirling 116.3 77.6 36.6 19.4 249.9 225.1 24.8 499.8 92,830West Dunbartonshire 174.1 65.9 44.6 16.7 301.4 348.3 1.1 650.7 89,590West Lothian 84.0 49.3 43.7 47.0 224.0 408.8 2.2 635.1 178,550
Scotland (total) 105.6 46.5 36.6 16.2 204.8 274.1 16.4 495.3 5,373,000
Notep-provisional
Table 1b: Fires by location per 100,000 population, 2015-16p, Local Authority
Primary Fires Primary Total
1- Local Authority population estimates produced by National Records Scotland. Taken from:http://www.nrscotland.gov.uk/statistics-and-data/statistics/statistics-by-theme/population/population-estimates/mid-year-population-estimates/mid-2015-and-corrected-mid-2012-to-mid-2014
Population1Secondary Fires
Chimney Fires Total Fires
1 1 1a 1b33
Fire and Rescue Incident Statistics Scotland 2015-16
Num
ber
Year
Dw
ellin
gsO
ther
B
uild
ings
Roa
d Ve
hicl
esO
ther
sD
wel
lings
Oth
er
Bui
ldin
gsR
oad
Vehi
cles
Oth
ers
Dw
ellin
gsO
ther
B
uild
ings
Roa
d Ve
hicl
esO
ther
s
2006
-07
38
1
6
1
461,
450
125
6335
1,67
375
066
4832
896
2007
-08
58
4
6
4
721,
537
109
4726
1,71
979
359
3522
909
2008
-09
54
2
3
5
641,
457
8068
431,
648
737
5658
3788
820
09-1
053
4
4
1
62
1,02
495
6629
1,21
478
184
5925
949
2010
-11
45
3
3
1
521,
142
109
4136
1,32
893
589
3532
1,09
120
11-1
251
4
3
1
59
1,22
199
5838
1,41
693
885
4333
1,09
920
12-1
340
2
2
2
46
1,16
692
3526
1,31
987
076
3224
1,00
220
13-1
4r29
1
1
-
311,
140
8750
341,
311
928
7646
251,
075
2014
-15r
32
3
1
5
4194
991
4021
1,10
171
077
3016
833
2015
-16p
39
3
3
-
45
1,04
511
561
351,
256
806
101
5629
992
Not
ep
- pro
visi
onal
r - re
vise
d
Rat
e
Year
Dw
ellin
gsO
ther
B
uild
ings
Roa
d Ve
hicl
esO
ther
sD
wel
lings
Oth
er
Bui
ldin
gsR
oad
Vehi
cles
Oth
ers
Dw
ellin
gsO
ther
B
uild
ings
Roa
d Ve
hicl
esO
ther
s
2006
-07
5.5
0.3
1.6
1.0
3.1
208.
243
.316
.333
.311
3.4
107.
722
.912
.430
.460
.720
07-0
88.
71.
42.
04.
15.
323
0.6
37.3
15.3
26.9
126.
211
9.0
20.2
11.4
22.8
66.7
2008
-09
8.1
0.8
1.0
5.5
4.9
217.
330
.423
.247
.412
5.1
109.
921
.319
.840
.767
.420
09-1
08.
11.
31.
30.
74.
415
5.8
31.6
22.1
20.1
86.6
118.
827
.919
.717
.367
.720
10-1
17.
11.
11.
10.
73.
918
1.3
38.4
15.3
26.2
100.
614
8.4
31.4
13.0
23.3
82.7
2011
-12
8.3
1.5
1.3
0.9
4.8
198.
236
.424
.632
.311
4.1
152.
331
.318
.228
.188
.520
12-1
36.
90.
81.
02.
54.
119
9.8
38.2
17.2
31.9
118.
914
9.1
31.5
15.7
29.5
90.3
2013
-14r
5.4
0.4
0.5
0.0
2.9
213.
737
.025
.837
.212
4.4
174.
032
.323
.727
.410
2.0
2014
-15r
5.7
1.3
0.5
6.0
3.9
170.
039
.121
.125
.110
3.5
127.
233
.115
.819
.178
.320
15-1
6p6.
91.
21.
50.
04.
118
4.2
46.1
31.0
40.2
114.
114
2.1
40.5
28.5
33.3
90.1
Not
ep
- pro
visi
onal
r - re
vise
d
Tabl
e 2:
Cas
ualti
es b
y lo
catio
n, 2
006-
07 to
201
5-16
, Scot
land
Tabl
e 2a
: Cas
ualti
es p
er 1
,000
fire
s by
loca
tion,
200
6-07
to 2
015-
16, S
cotla
nd
Fata
l Cas
ualti
es in
Fire
sFa
tal
Cas
ualti
es
Tota
l
Non
-Fat
al C
asua
lties
in P
rimar
y Fi
res1
Non
-Fat
al
Cas
ualti
es
Tota
l
Non
-Fat
al C
asua
lties
in P
rimar
y Fi
res
excl
udin
g pr
ecau
tiona
ry c
heck
-ups
1N
on-F
atal
C
asua
lties
To
tal
Non
-Fat
al
Cas
ualti
es
Tota
l
1 - N
on-fa
tal c
asua
lty d
ata
from
200
9-10
onw
ards
can
not b
e co
mpa
red
to p
revi
ous
year
s. T
his
is d
ue to
a c
hang
e in
the
reco
rdin
g of
non
-fata
l cas
ualti
es -
see
Not
es o
n St
atis
tics
for d
etai
ls.
1 - N
on-fa
tal c
asua
lty d
ata
from
200
9-10
onw
ards
can
not b
e co
mpa
red
to p
revi
ous
year
s. T
his
is d
ue to
a c
hang
e in
the
reco
rdin
g of
non
-fata
l cas
ualti
es -
see
Not
es o
n St
atis
tics
for d
etai
ls.
Fata
l Cas
ualti
es in
Fire
sFa
tal
Cas
ualti
es
Tota
l
Non
-Fat
al C
asua
lties
in P
rimar
y Fi
res1
Non
-Fat
al
Cas
ualti
es
Tota
l
Non
-Fat
al C
asua
lties
in P
rimar
y Fi
res
excl
udin
g pr
ecau
tiona
ry c
heck
-ups
1
12
2a 2
b
34
Scottish Fire and Rescue Service
Num
ber
Loca
l Aut
horit
yD
wel
lings
Oth
er
Bui
ldin
gsR
oad
Vehi
cles
Oth
ers
Dw
ellin
gsO
ther
B
uild
ings
Roa
d Ve
hicl
esO
ther
sD
wel
lings
Oth
er
Bui
ldin
gsR
oad
Vehi
cles
Oth
ers
Abe
rdee
n C
ity
1
-
-
-
1
6
0
9
-
2
71
53
9
-
2
64A
berd
eens
hire
2
-
-
-
2
20
7
1
0
3
40
19
6
9
3
37A
ngus
-
1
-
-
1
35
-
1
2
38
23
-
1
-
24
Arg
yll a
nd B
ute
-
1
-
-
1
7
5
1
3
16
3
4
1
1
9
Cla
ckm
anna
nshi
re-
-
-
-
-
1
1 -
-
2
13
7
-
-
2
9D
umfr
ies
and
Gal
low
ay
2
-
1
-
3
5
1
4
1
11
5
1
4
1
11D
unde
e C
ity
2
-
-
-
2
7
1
4
-
2
77
45
4
-
1
50Ea
st A
yrsh
ire
- -
-
-
-
3
0
4
6
1
41
23
4
5
1
33Ea
st D
unba
rton
shire
-
-
-
-
-
11
2
-
-
13
10
2
-
-
12
East
Lot
hian
1
-
-
-
1
6
1
1
-
8
6
1
1
-
8
East
Ren
frew
shire
1
1
-
-
2
12
1
-
-
13
8
1
-
-
9
Edin
burg
h, C
ity o
f
4
-
-
-
4
104
8
-
1
11
3
95
7
-
1
10
3Fa
lkirk
2
-
-
-
2
21
2
4
3
30
19
2
4
3
28
Fife
1
-
-
-
1
27
3
1
2
33
19
2
1
2
24
Gla
sgow
City
4
-
-
-
4
1
81
1
2
4
3
20
0
141
10
4
3
158
Hig
hlan
d
5
-
1
-
6
3
5
6
12
2
55
26
6
12
2
46In
verc
lyde
1
-
-
-
1
41
3
-
1
45
27
3
-
1
31
Mid
loth
ian
-
-
-
-
-
9
-
1
-
10
9
-
1
-
10
Mor
ay
- -
-
-
-
1
1
2
2
1
16
9
2
2
1
14N
a H
-Eile
anan
an
Iar
-
-
-
-
-
7
-
-
1
8
6
-
-
1
7
Nor
th A
yrsh
ire
1
-
-
-
1
4
3
5
-
-
48
31
5
-
-
36N
orth
Lan
arks
hire
4
-
-
-
4
75
8
2
-
85
51
7
1
-
59
Ork
ney
Isla
nds
-
-
-
-
-
2
-
-
-
2
1
-
-
-
1
Pert
h an
d K
inro
ss
- -
-
-
-
2
3
2
6
2
33
12
2
6
1
21R
enfr
ewsh
ire
- -
-
-
-
3
7
1
-
-
38
25
1
-
-
26Sc
ottis
h B
orde
rs
1
-
-
-
1
1
4
3
-
-
17
14
3
-
-
17Sh
etla
nd Is
land
s
1
-
-
-
1
2 -
-
-
2
1
-
-
-
1So
uth
Ayr
shire
-
-
1
-
1
20
3
1
-
24
18
3
1
-
22
Sout
h La
nark
shire
4
-
-
-
4
62
7
3
1
73
47
5
2
1
55
Stirl
ing
1
-
-
-
1
5
7
1
1
14
5
5
1
1
12
Wes
t Dun
bart
onsh
ire
- -
-
-
-
3
5 -
-
-
35
27
-
-
-
27W
est L
othi
an
1
-
-
-
1
2
3
9
1
1
34
21
6
-
1
28
Scot
land
(tot
al)
393
30
451,
045
115
6135
1,25
680
610
156
2999
2
Not
ep
- pro
visi
onal
Tabl
e 2b
: Cas
ualti
es b
y lo
catio
n, 2
015-
16p , L
ocal
Aut
horit
y
Non
-Fat
al
Cas
ualti
es
Tota
l
Fata
l Cas
ualti
es in
Fire
sFa
tal
Cas
ualti
es
Tota
l
Non
-Fat
al C
asua
lties
in P
rimar
y Fi
res
Non
-Fat
al
Cas
ualti
es
Tota
l
Non
-Fat
al C
asua
lties
in P
rimar
y Fi
res
excl
udin
g pr
ecau
tiona
ry c
heck
-ups
12
2a 2
b
35
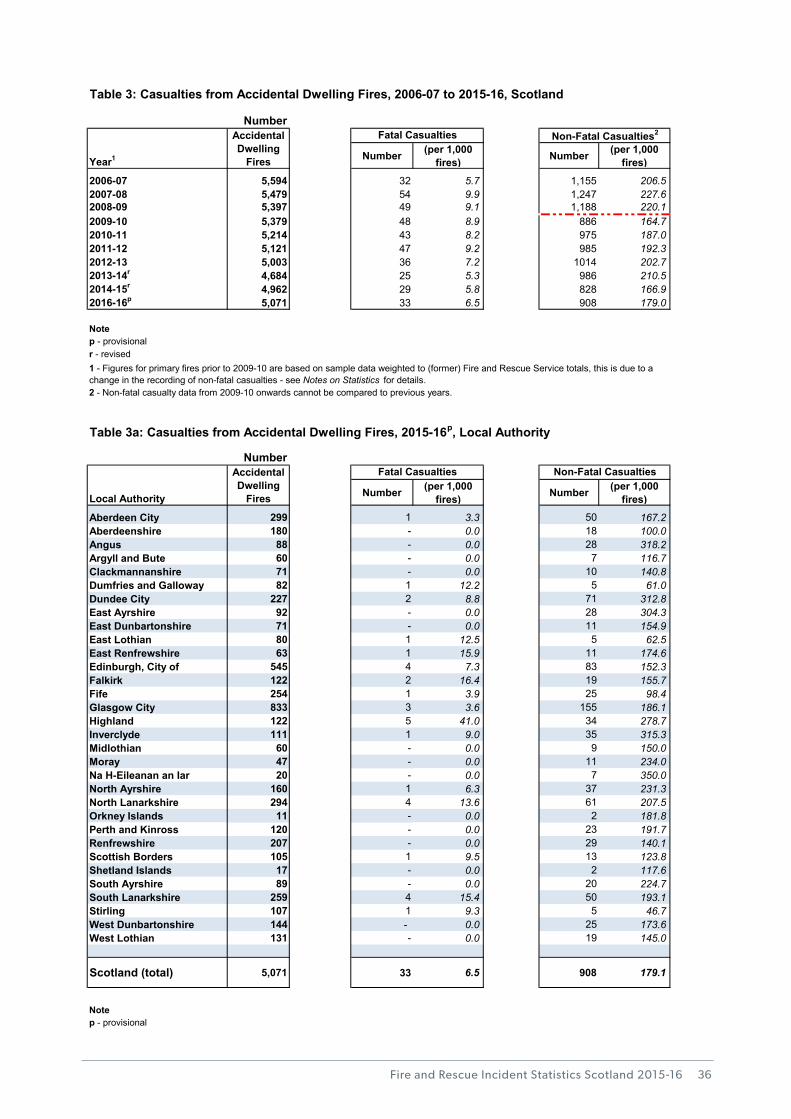
Fire and Rescue Incident Statistics Scotland 2015-16
Number
Number (per 1,000 fires) Number (per 1,000
fires)
2006-07 5,594 32 5.7 1,155 206.52007-08 5,479 54 9.9 1,247 227.62008-09 5,397 49 9.1 1,188 220.12009-10 5,379 48 8.9 886 164.72010-11 5,214 43 8.2 975 187.02011-12 5,121 47 9.2 985 192.32012-13 5,003 36 7.2 1014 202.72013-14r 4,684 25 5.3 986 210.52014-15r 4,962 29 5.8 828 166.92016-16p 5,071 33 6.5 908 179.0
Notep - provisionalr - revised
Number
Number (per 1,000 fires) Number (per 1,000
fires)
Aberdeen City 299 1 3.3 50 167.2Aberdeenshire 180 - 0.0 18 100.0Angus 88 - 0.0 28 318.2Argyll and Bute 60 - 0.0 7 116.7Clackmannanshire 71 - 0.0 10 140.8Dumfries and Galloway 82 1 12.2 5 61.0Dundee City 227 2 8.8 71 312.8East Ayrshire 92 - 0.0 28 304.3East Dunbartonshire 71 - 0.0 11 154.9East Lothian 80 1 12.5 5 62.5East Renfrewshire 63 1 15.9 11 174.6Edinburgh, City of 545 4 7.3 83 152.3Falkirk 122 2 16.4 19 155.7Fife 254 1 3.9 25 98.4Glasgow City 833 3 3.6 155 186.1Highland 122 5 41.0 34 278.7Inverclyde 111 1 9.0 35 315.3Midlothian 60 - 0.0 9 150.0Moray 47 - 0.0 11 234.0Na H-Eileanan an Iar 20 - 0.0 7 350.0North Ayrshire 160 1 6.3 37 231.3North Lanarkshire 294 4 13.6 61 207.5Orkney Islands 11 - 0.0 2 181.8Perth and Kinross 120 - 0.0 23 191.7Renfrewshire 207 - 0.0 29 140.1Scottish Borders 105 1 9.5 13 123.8Shetland Islands 17 - 0.0 2 117.6South Ayrshire 89 - 0.0 20 224.7South Lanarkshire 259 4 15.4 50 193.1Stirling 107 1 9.3 5 46.7West Dunbartonshire 144 - 0.0 25 173.6West Lothian 131 - 0.0 19 145.0
Scotland (total) 5,071 33 6.5 908 179.1
Notep - provisional
Local Authority
Accidental Dwelling
Fires
Fatal Casualties Non-Fatal Casualties
Table 3a: Casualties from Accidental Dwelling Fires, 2015-16p, Local Authority
1 - Figures for primary fires prior to 2009-10 are based on sample data weighted to (former) Fire and Rescue Service totals, this is due to a change in the recording of non-fatal casualties - see Notes on Statistics for details.2 - Non-fatal casualty data from 2009-10 onwards cannot be compared to previous years.
Table 3: Casualties from Accidental Dwelling Fires, 2006-07 to 2015-16, Scotland
Year1
Accidental Dwelling
Fires
Fatal Casualties Non-Fatal Casualties2
1 3 3a36
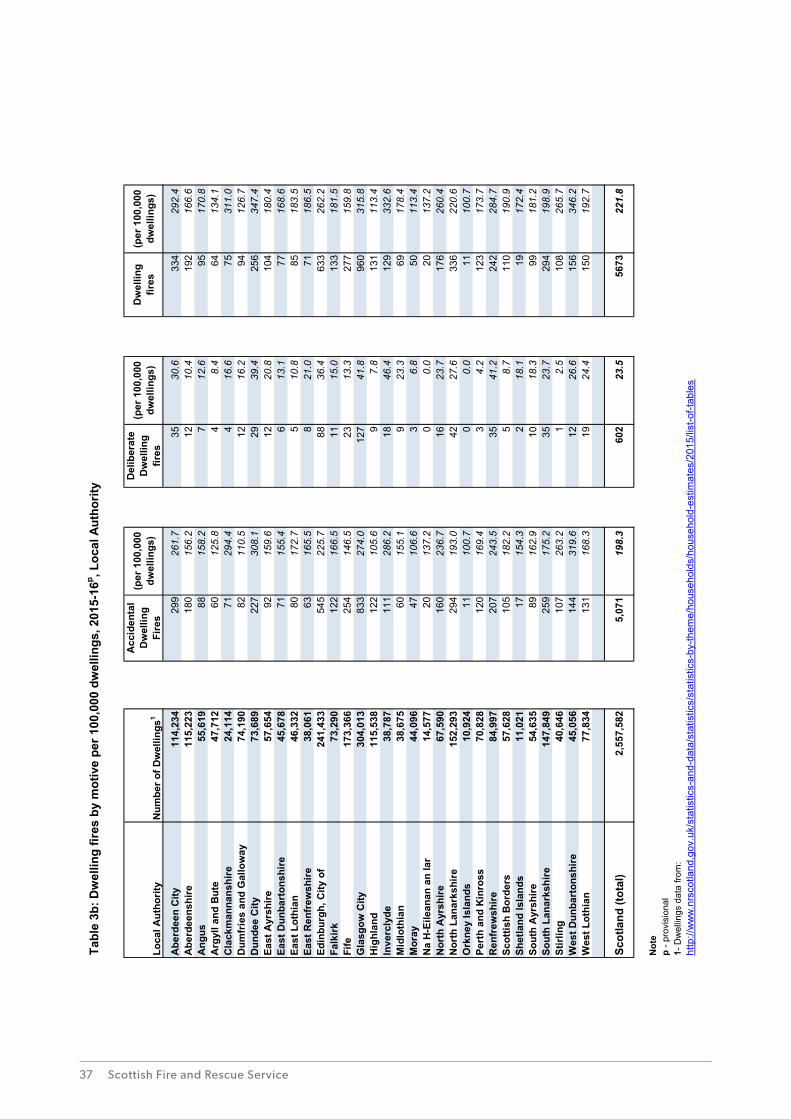
Scottish Fire and Rescue Service37
Loca
l Aut
horit
yN
umbe
r of D
wel
lings
1
Acc
iden
tal
Dw
ellin
g Fi
res
(per
100
,000
dw
ellin
gs)
Del
iber
ate
Dw
ellin
g fir
es
(per
100
,000
dw
ellin
gs)
Dw
ellin
g fir
es(p
er 1
00,0
00
dwel
lings
)
Abe
rdee
n C
ity11
4,23
429
926
1.7
3530
.633
429
2.4
Abe
rdee
nshi
re11
5,22
318
015
6.2
1210
.419
216
6.6
Ang
us55
,619
8815
8.2
712
.695
170.
8A
rgyl
l and
But
e47
,712
6012
5.8
48.
464
134.
1C
lack
man
nans
hire
24,1
1471
294.
44
16.6
7531
1.0
Dum
frie
s an
d G
allo
way
74,1
9082
110.
512
16.2
9412
6.7
Dun
dee
City
73,6
8922
730
8.1
2939
.425
634
7.4
East
Ayr
shire
57,6
5492
159.
612
20.8
104
180.
4Ea
st D
unba
rton
shire
45,6
7871
155.
46
13.1
7716
8.6
East
Lot
hian
46,3
3280
172.
75
10.8
8518
3.5
East
Ren
frew
shire
38,0
6163
165.
58
21.0
7118
6.5
Edin
burg
h, C
ity o
f24
1,43
354
522
5.7
8836
.463
326
2.2
Falk
irk73
,290
122
166.
511
15.0
133
181.
5Fi
fe17
3,36
625
414
6.5
2313
.327
715
9.8
Gla
sgow
City
304,
013
833
274.
012
741
.896
031
5.8
Hig
hlan
d11
5,53
812
210
5.6
97.
813
111
3.4
Inve
rcly
de38
,787
111
286.
218
46.4
129
332.
6M
idlo
thia
n38
,675
6015
5.1
923
.369
178.
4M
oray
44,0
9647
106.
63
6.8
5011
3.4
Na
H-E
ilean
an a
n Ia
r14
,577
2013
7.2
00.
020
137.
2N
orth
Ayr
shire
67,5
9016
023
6.7
1623
.717
626
0.4
Nor
th L
anar
kshi
re15
2,29
329
419
3.0
4227
.633
622
0.6
Ork
ney
Isla
nds
10,9
2411
100.
70
0.0
1110
0.7
Pert
h an
d K
inro
ss70
,828
120
169.
43
4.2
123
173.
7R
enfr
ewsh
ire84
,997
207
243.
535
41.2
242
284.
7Sc
ottis
h B
orde
rs57
,628
105
182.
25
8.7
110
190.
9Sh
etla
nd Is
land
s11
,021
1715
4.3
218
.119
172.
4So
uth
Ayr
shire
54,6
3589
162.
910
18.3
9918
1.2
Sout
h La
nark
shire
147,
849
259
175.
235
23.7
294
198.
9St
irlin
g40
,646
107
263.
21
2.5
108
265.
7W
est D
unba
rton
shire
45,0
5614
431
9.6
1226
.615
634
6.2
Wes
t Lot
hian
77,8
3413
116
8.3
1924
.415
019
2.7
Scot
land
(tot
al)
2,55
7,58
25,
071
198.
360
223
.556
7322
1.8
Not
ep
- pro
visi
onal
1- D
wel
lings
dat
a fro
m:
Tabl
e 3b
: Dw
ellin
g fir
es b
y m
otiv
e pe
r 100
,000
dw
ellin
gs, 2
015-
16p , L
ocal
Aut
horit
y
http
://w
ww
.nrs
cotla
nd.g
ov.u
k/st
atis
tics-
and-
data
/sta
tistic
s/st
atis
tics-
by-th
eme/
hous
ehol
ds/h
ouse
hold
-est
imat
es/2
015/
list-o
f-tab
les
13b
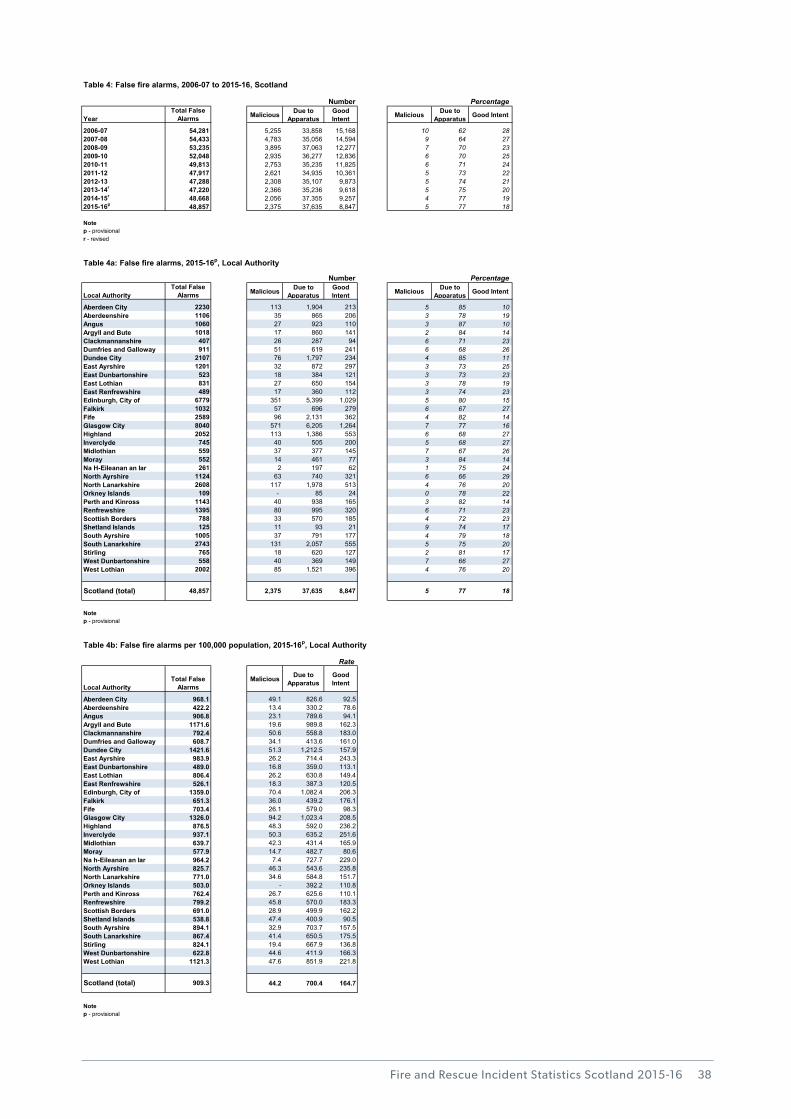
Fire and Rescue Incident Statistics Scotland 2015-16
Number Percentage
YearTotal False
Alarms Malicious Due to Apparatus
Good Intent Malicious Due to
Apparatus Good Intent
2006-07 54,281 5,255 33,858 15,168 10 62 282007-08 54,433 4,783 35,056 14,594 9 64 272008-09 53,235 3,895 37,063 12,277 7 70 232009-10 52,048 2,935 36,277 12,836 6 70 252010-11 49,813 2,753 35,235 11,825 6 71 242011-12 47,917 2,621 34,935 10,361 5 73 222012-13 47,288 2,308 35,107 9,873 5 74 212013-14r 47,220 2,366 35,236 9,618 5 75 202014-15r 48,668 2,056 37,355 9,257 4 77 192015-16p 48,857 2,375 37,635 8,847 5 77 18
Notep - provisionalr - revised
Number Percentage
Local AuthorityTotal False
Alarms Malicious Due to Apparatus
Good Intent Malicious Due to
Apparatus Good Intent
Aberdeen City 2230 113 1,904 213 5 85 10Aberdeenshire 1106 35 865 206 3 78 19Angus 1060 27 923 110 3 87 10Argyll and Bute 1018 17 860 141 2 84 14Clackmannanshire 407 26 287 94 6 71 23Dumfries and Galloway 911 51 619 241 6 68 26Dundee City 2107 76 1,797 234 4 85 11East Ayrshire 1201 32 872 297 3 73 25East Dunbartonshire 523 18 384 121 3 73 23East Lothian 831 27 650 154 3 78 19East Renfrewshire 489 17 360 112 3 74 23Edinburgh, City of 6779 351 5,399 1,029 5 80 15Falkirk 1032 57 696 279 6 67 27Fife 2589 96 2,131 362 4 82 14Glasgow City 8040 571 6,205 1,264 7 77 16Highland 2052 113 1,386 553 6 68 27Inverclyde 745 40 505 200 5 68 27Midlothian 559 37 377 145 7 67 26Moray 552 14 461 77 3 84 14Na H-Eileanan an Iar 261 2 197 62 1 75 24North Ayrshire 1124 63 740 321 6 66 29North Lanarkshire 2608 117 1,978 513 4 76 20Orkney Islands 109 - 85 24 0 78 22Perth and Kinross 1143 40 938 165 3 82 14Renfrewshire 1395 80 995 320 6 71 23Scottish Borders 788 33 570 185 4 72 23Shetland Islands 125 11 93 21 9 74 17South Ayrshire 1005 37 791 177 4 79 18South Lanarkshire 2743 131 2,057 555 5 75 20Stirling 765 18 620 127 2 81 17West Dunbartonshire 558 40 369 149 7 66 27West Lothian 2002 85 1,521 396 4 76 20
Scotland (total) 48,857 2,375 37,635 8,847 5 77 18
Notep - provisional
Rate
Local AuthorityTotal False
AlarmsMalicious Due to
ApparatusGood Intent
Aberdeen City 968.1 49.1 826.6 92.5 Aberdeenshire 422.2 13.4 330.2 78.6 Angus 906.8 23.1 789.6 94.1 Argyll and Bute 1171.6 19.6 989.8 162.3 Clackmannanshire 792.4 50.6 558.8 183.0 Dumfries and Galloway 608.7 34.1 413.6 161.0 Dundee City 1421.6 51.3 1,212.5 157.9 East Ayrshire 983.9 26.2 714.4 243.3 East Dunbartonshire 489.0 16.8 359.0 113.1 East Lothian 806.4 26.2 630.8 149.4 East Renfrewshire 526.1 18.3 387.3 120.5 Edinburgh, City of 1359.0 70.4 1,082.4 206.3 Falkirk 651.3 36.0 439.2 176.1 Fife 703.4 26.1 579.0 98.3 Glasgow City 1326.0 94.2 1,023.4 208.5 Highland 876.5 48.3 592.0 236.2 Inverclyde 937.1 50.3 635.2 251.6 Midlothian 639.7 42.3 431.4 165.9 Moray 577.9 14.7 482.7 80.6 Na h-Eileanan an Iar 964.2 7.4 727.7 229.0 North Ayrshire 825.7 46.3 543.6 235.8 North Lanarkshire 771.0 34.6 584.8 151.7 Orkney Islands 503.0 - 392.2 110.8 Perth and Kinross 762.4 26.7 625.6 110.1 Renfrewshire 799.2 45.8 570.0 183.3 Scottish Borders 691.0 28.9 499.9 162.2 Shetland Islands 538.8 47.4 400.9 90.5 South Ayrshire 894.1 32.9 703.7 157.5 South Lanarkshire 867.4 41.4 650.5 175.5 Stirling 824.1 19.4 667.9 136.8 West Dunbartonshire 622.8 44.6 411.9 166.3 West Lothian 1121.3 47.6 851.9 221.8
Scotland (total) 909.3 44.2 700.4 164.7
Notep - provisional
Table 4b: False fire alarms per 100,000 population, 2015-16p, Local Authority
Table 4: False fire alarms, 2006-07 to 2015-16, Scotland
Table 4a: False fire alarms, 2015-16p, Local Authority
1 4 4a 4b38
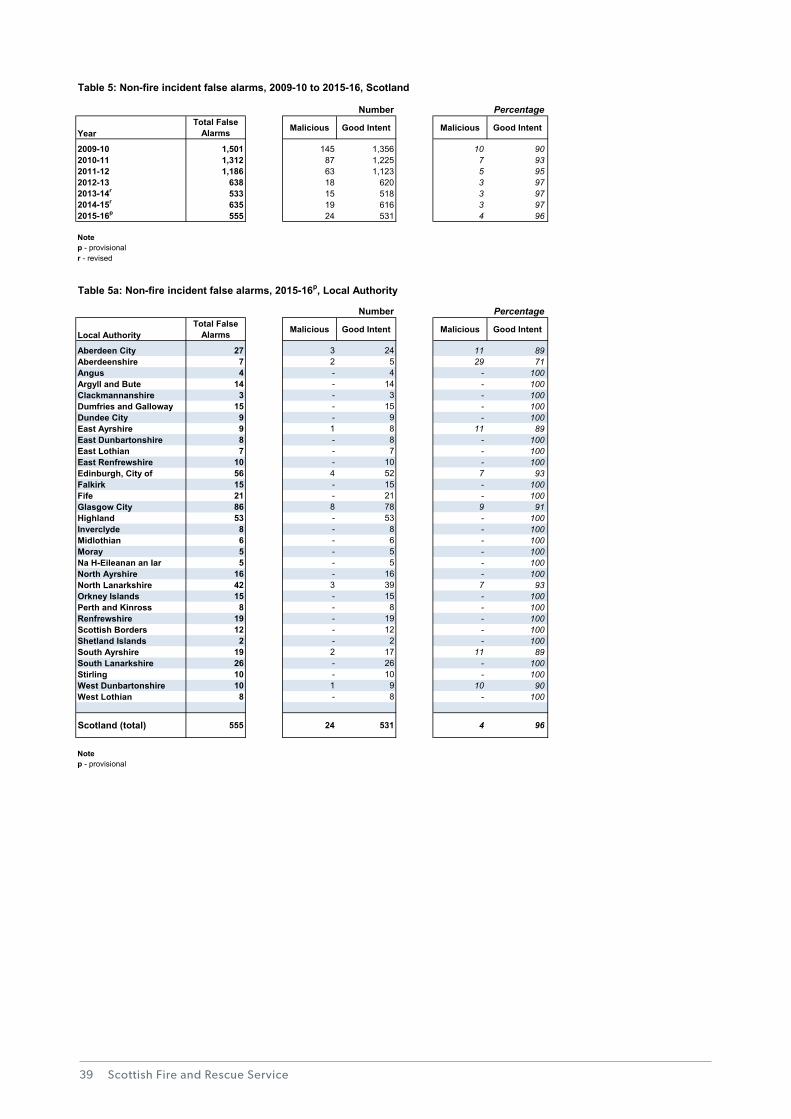
Scottish Fire and Rescue Service39
Number Percentage
YearTotal False
Alarms Malicious Good Intent Malicious Good Intent
2009-10 1,501 145 1,356 10 902010-11 1,312 87 1,225 7 932011-12 1,186 63 1,123 5 952012-13 638 18 620 3 972013-14r 533 15 518 3 972014-15r 635 19 616 3 972015-16p 555 24 531 4 96
Notep - provisionalr - revised
Number Percentage
Local AuthorityTotal False
Alarms Malicious Good Intent Malicious Good Intent
Aberdeen City 27 3 24 11 89Aberdeenshire 7 2 5 29 71Angus 4 - 4 - 100Argyll and Bute 14 - 14 - 100Clackmannanshire 3 - 3 - 100Dumfries and Galloway 15 - 15 - 100Dundee City 9 - 9 - 100East Ayrshire 9 1 8 11 89East Dunbartonshire 8 - 8 - 100East Lothian 7 - 7 - 100East Renfrewshire 10 - 10 - 100Edinburgh, City of 56 4 52 7 93Falkirk 15 - 15 - 100Fife 21 - 21 - 100Glasgow City 86 8 78 9 91Highland 53 - 53 - 100Inverclyde 8 - 8 - 100Midlothian 6 - 6 - 100Moray 5 - 5 - 100Na H-Eileanan an Iar 5 - 5 - 100North Ayrshire 16 - 16 - 100North Lanarkshire 42 3 39 7 93Orkney Islands 15 - 15 - 100Perth and Kinross 8 - 8 - 100Renfrewshire 19 - 19 - 100Scottish Borders 12 - 12 - 100Shetland Islands 2 - 2 - 100South Ayrshire 19 2 17 11 89South Lanarkshire 26 - 26 - 100Stirling 10 - 10 - 100West Dunbartonshire 10 1 9 10 90West Lothian 8 - 8 - 100
Scotland (total) 555 24 531 4 96
Notep - provisional
Table 5a: Non-fire incident false alarms, 2015-16p, Local Authority
Table 5: Non-fire incident false alarms, 2009-10 to 2015-16, Scotland
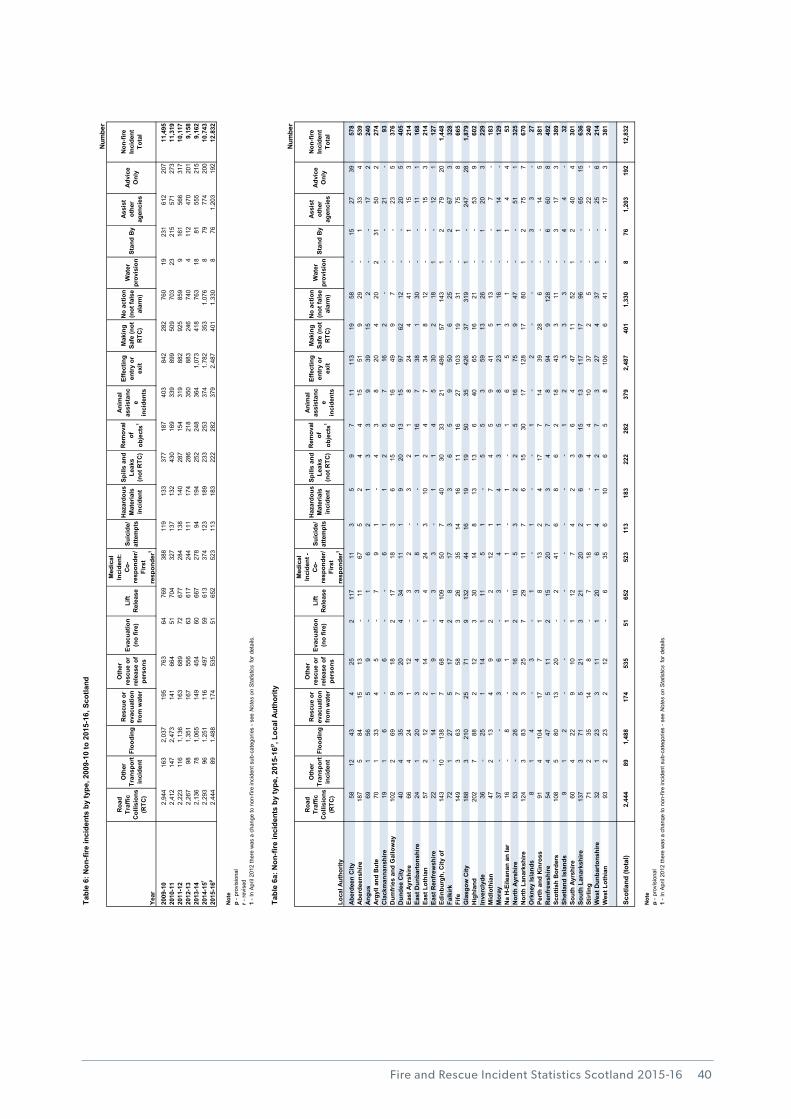
Fire and Rescue Incident Statistics Scotland 2015-16
Num
ber
Year
Roa
d Tr
affic
C
ollis
ions
(R
TC)
Oth
er
Tran
spor
t in
cide
ntFl
oodi
ngR
escu
e or
ev
acua
tion
from
wat
er
Oth
er
resc
ue o
r re
leas
e of
pe
rson
s
Evac
uatio
n (n
o fir
e)Li
ft R
elea
se
Med
ical
In
cide
nt:
Co-
resp
onde
r/ Fi
rst
resp
onde
r1
Suic
ide/
at
tem
pts
Haz
ardo
us
Mat
eria
ls
inci
dent
Spill
s an
d Le
aks
(not
RTC
)
Rem
oval
of
ob
ject
s1
Anim
al
assi
stan
ce
inci
dent
s
Effe
ctin
g en
try
or
exit
Mak
ing
Safe
(not
R
TC)
No
actio
n (n
ot fa
lse
alar
m)
Wat
er
prov
isio
nSt
and
By
Assi
st
othe
r ag
enci
es
Advi
ce
Onl
y
Non
-fire
In
cide
nt
Tota
l
2009
-10
2,94
416
32,
037
195
763
6476
938
811
913
337
718
740
384
228
276
019
231
612
207
11,4
9520
10-1
12,
412
147
2,47
314
166
451
704
327
137
132
430
169
339
899
509
703
2321
557
127
311
,319
2011
-12
2,22
311
61,
136
163
689
7267
728
413
814
028
715
431
988
292
585
99
161
566
317
10,1
1720
12-1
32,
267
981,
351
167
556
6361
724
411
117
428
621
835
088
324
674
04
112
470
201
9,15
820
13-1
42,
136
781,
065
149
454
6066
727
894
194
252
248
364
1,07
341
876
318
8155
521
59,
162
2014
-15r
2,29
396
1,25
111
649
759
613
374
123
189
233
253
374
1,78
235
31,
076
879
774
200
10,7
4320
15-1
6p2,
444
891,
488
174
535
5165
252
311
318
322
228
237
92,
487
401
1,33
08
761,
203
192
12,8
32
Not
ep
- pro
visi
onal
r - re
vise
d
Num
ber
Loca
l Aut
horit
y
Roa
d Tr
affic
C
ollis
ions
(R
TC)
Oth
er
Tran
spor
t in
cide
ntFl
oodi
ngR
escu
e or
ev
acua
tion
from
wat
er
Oth
er
resc
ue o
r re
leas
e of
pe
rson
s
Evac
uatio
n (n
o fir
e)Li
ft R
elea
se
Med
ical
In
cide
nt -
Co-
resp
onde
r/ Fi
rst
resp
onde
r1
Suic
ide/
at
tem
pts
Haz
ardo
us
Mat
eria
ls
inci
dent
Spill
s an
d Le
aks
(not
RTC
)
Rem
oval
of
ob
ject
s1
Anim
al
assi
stan
ce
inci
dent
s
Effe
ctin
g en
try
or
exit
Mak
ing
Safe
(not
R
TC)
No
actio
n (n
ot fa
lse
alar
m)
Wat
er
prov
isio
nSt
and
By
Assi
st
othe
r ag
enci
es
Advi
ce
Onl
y
Non
-fire
In
cide
nt
Tota
l
Aber
deen
City
58
12
43
4
25
2
117
11
3
5
9
7
11
113
19
58
-
15
27
39
57
8
Aber
deen
shire
187
5
84
15
13
-
11
67
5
2
4
4
15
51
9
29
-
1
33
4
53
9
Angu
s69
1
56
5
9
-
1
6
2
1
3
3
9
39
15
2
-
-
17
2
240
Ar
gyll
and
But
e70
1
33
4
5
-
7
9
1
-
4
3
8
20
4
20
2
31
50
2
27
4
Cla
ckm
anna
nshi
re19
1
6
-
6
-
-
6
1
1
2
5
7
16
2
-
-
-
21
-
93
D
umfr
ies
and
Gal
low
ay10
2
2
69
9
18
2
17
18
3
6
15
6
16
49
9
7
-
-
23
5
376
D
unde
e C
ity40
4
35
3
20
4
34
11
1
9
20
13
15
97
62
12
-
-
20
5
405
Ea
st A
yrsh
ire66
4
24
1
12
-
3
2
-
3
2
1
8
24
4
41
-
1
15
3
214
Ea
st D
unba
rton
shire
24
1
20
3
4
-
3
8
-
-
1
16
7
38
1
30
-
-
11
1
168
Ea
st L
othi
an57
2
12
2
14
1
4
24
3
10
2
4
7
34
8
12
-
-
15
3
21
4
East
Ren
frew
shire
22
-
14
1
9
-
3
3
-
1
1
4
5
30
2
18
1
-
12
1
12
7
Edin
burg
h, C
ity o
f14
3
10
138
7
68
4
109
50
7
40
30
33
21
48
6
57
143
1
2
79
20
1,44
8
Fa
lkirk
72
1
27
5
17
2
8
17
3
3
6
5
9
50
6
25
-
2
67
3
328
Fi
fe14
9
3
63
7
58
3
26
35
14
16
11
16
27
10
3
19
31
-
1
75
8
66
5
Gla
sgow
City
188
3
210
25
71
9
13
2
44
16
19
19
50
35
42
6
37
319
1
-
247
28
1,87
9
H
ighl
and
202
7
88
2
12
3
30
14
8
13
13
6
40
65
16
21
-
-
53
9
602
In
verc
lyde
36
-
25
1
14
1
11
5
1
-
5
5
3
59
13
26
-
1
20
3
229
M
idlo
thia
n47
2
13
4
9
2
2
12
1
7
4
5
9
41
5
13
-
-
7
-
183
M
oray
37
-
-
3
6
-
3
4
1
4
3
5
8
23
1
16
-
1
14
-
129
N
a H
-Eile
anan
an
Iar
16
-
8
-
1
1
-
1
-
1
-
1
6
5
3
1
-
1
4
4
53
Nor
th A
yrsh
ire53
-
26
2
16
2
10
5
3
2
2
5
16
75
9
47
-
-
51
1
32
5
Nor
th L
anar
kshi
re12
4
3
83
3
25
7
29
11
7
6
15
30
17
128
17
80
1
2
75
7
67
0
Ork
ney
Isla
nds
8
1
4
-
3
-
1
-
1
-
-
1
-
2
-
-
-
3
3
-
27
Pe
rth
and
Kin
ross
91
4
10
4
17
7
1
8
13
2
4
17
7
14
39
28
6
-
-
14
5
38
1
Ren
frew
shire
54
4
47
5
11
2
15
20
7
3
4
7
8
94
9
12
8
-
6
60
8
492
Sc
ottis
h B
orde
rs10
8
5
80
13
20
-
2
41
6
8
6
2
18
43
3
11
-
3
17
3
389
Sh
etla
nd Is
land
s9
1
2
-
-
-
-
-
-
-
-
1
2
3
3
3
-
4
4
-
32
So
uth
Ayrs
hire
60
4
22
9
10
1
12
7
4
2
3
6
4
47
11
52
1
2
40
4
30
1
Sout
h La
nark
shire
137
3
71
5
21
3
21
20
2
6
9
15
13
117
17
96
-
-
65
15
636
St
irlin
g71
2
35
14
8
-
7
18
1
-
4
4
10
37
2
5
-
-
22
-
24
0
Wes
t Dun
bart
onsh
ire32
1
23
3
11
1
20
6
4
1
2
7
3
27
4
37
1
-
25
6
21
4
Wes
t Lot
hian
93
2
23
2
12
-
6
35
6
10
6
5
8
106
6
41
-
-
17
3
38
1
Scot
land
(tot
al)
2,44
4
89
1,
488
174
535
51
652
52
3
11
3
183
222
282
37
9
2,
487
40
1
1,33
0
8
76
1,
203
192
12
,832
Not
ep
- pro
visi
onal
Tabl
e 6:
Non
-fire
inci
dent
s by
type
, 200
9-10
to 2
015-
16, S
cotla
nd
Tabl
e 6a
: Non
-fire
inci
dent
s by
type
, 201
5-16
p , Loc
al A
utho
rity
1 - I
n Ap
ril 2
012
ther
e w
as a
cha
nge
to n
on-fi
re in
cide
nt s
ub-c
ateg
orie
s - s
ee N
otes
on
Stat
istic
s fo
r det
ails
.
1 - I
n Ap
ril 2
012
ther
e w
as a
cha
nge
to n
on-fi
re in
cide
nt s
ub-c
ateg
orie
s - s
ee N
otes
on
Stat
istic
s fo
r det
ails
.
16
6a
40
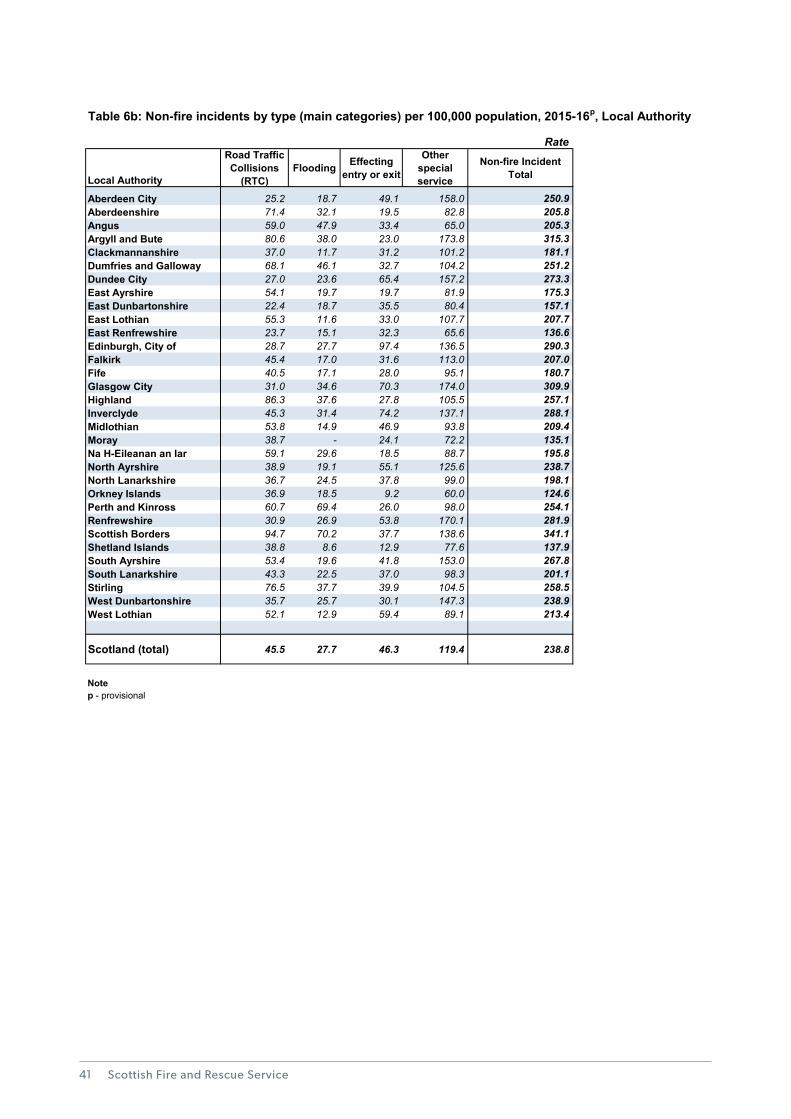
Scottish Fire and Rescue Service41
Rate
Local Authority
Road Traffic Collisions
(RTC)Flooding Effecting
entry or exit
Other special service
Non-fire Incident Total
Aberdeen City 25.2 18.7 49.1 158.0 250.9 Aberdeenshire 71.4 32.1 19.5 82.8 205.8 Angus 59.0 47.9 33.4 65.0 205.3 Argyll and Bute 80.6 38.0 23.0 173.8 315.3 Clackmannanshire 37.0 11.7 31.2 101.2 181.1 Dumfries and Galloway 68.1 46.1 32.7 104.2 251.2 Dundee City 27.0 23.6 65.4 157.2 273.3 East Ayrshire 54.1 19.7 19.7 81.9 175.3 East Dunbartonshire 22.4 18.7 35.5 80.4 157.1 East Lothian 55.3 11.6 33.0 107.7 207.7 East Renfrewshire 23.7 15.1 32.3 65.6 136.6 Edinburgh, City of 28.7 27.7 97.4 136.5 290.3 Falkirk 45.4 17.0 31.6 113.0 207.0 Fife 40.5 17.1 28.0 95.1 180.7 Glasgow City 31.0 34.6 70.3 174.0 309.9 Highland 86.3 37.6 27.8 105.5 257.1 Inverclyde 45.3 31.4 74.2 137.1 288.1 Midlothian 53.8 14.9 46.9 93.8 209.4 Moray 38.7 - 24.1 72.2 135.1 Na H-Eileanan an Iar 59.1 29.6 18.5 88.7 195.8 North Ayrshire 38.9 19.1 55.1 125.6 238.7 North Lanarkshire 36.7 24.5 37.8 99.0 198.1 Orkney Islands 36.9 18.5 9.2 60.0 124.6 Perth and Kinross 60.7 69.4 26.0 98.0 254.1 Renfrewshire 30.9 26.9 53.8 170.1 281.9 Scottish Borders 94.7 70.2 37.7 138.6 341.1 Shetland Islands 38.8 8.6 12.9 77.6 137.9 South Ayrshire 53.4 19.6 41.8 153.0 267.8 South Lanarkshire 43.3 22.5 37.0 98.3 201.1 Stirling 76.5 37.7 39.9 104.5 258.5 West Dunbartonshire 35.7 25.7 30.1 147.3 238.9 West Lothian 52.1 12.9 59.4 89.1 213.4
Scotland (total) 45.5 27.7 46.3 119.4 238.8
Notep - provisional
Table 6b: Non-fire incidents by type (main categories) per 100,000 population, 2015-16p, Local Authority
1 6b
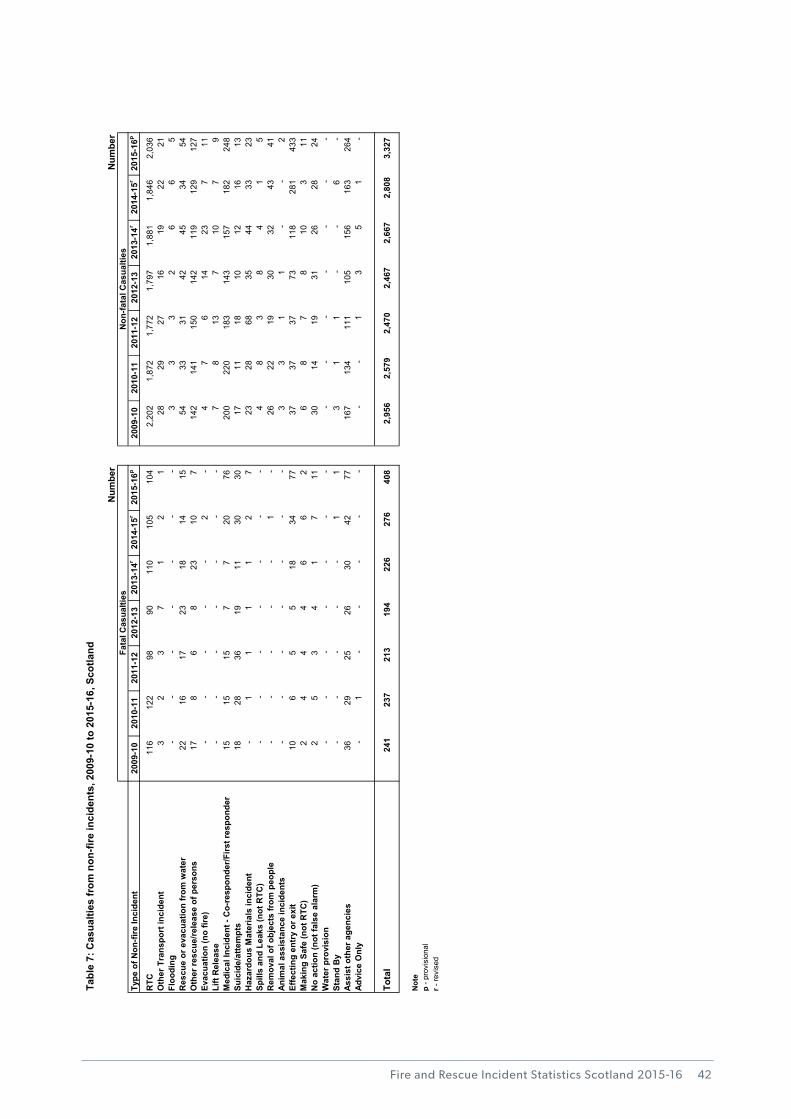
Fire and Rescue Incident Statistics Scotland 2015-16
Num
ber
Num
ber
Type
of N
on-fi
re In
cide
nt20
09-1
020
10-1
120
11-1
220
12-1
320
13-1
4r20
14-1
5r20
15-1
6p20
09-1
020
10-1
120
11-1
220
12-1
320
13-1
4r20
14-1
5r20
15-1
6p
RTC
116
122
98
90
110
105
104
2,20
2
1,87
2
1,77
2
1,79
7
1,88
1
1,84
6
2,03
6
O
ther
Tra
nspo
rt in
cide
nt3
2
3
7
1
2
1
28
29
27
16
19
22
21
Floo
ding
-
-
-
-
-
-
-
3
3
3
2
6
6
5
Res
cue
or e
vacu
atio
n fr
om w
ater
22
16
17
23
18
14
15
54
33
31
42
45
34
54
Oth
er re
scue
/rele
ase
of p
erso
ns17
8
6
8
23
10
7
142
141
150
142
119
129
127
Ev
acua
tion
(no
fire)
-
-
-
--
2
-
4
7
6
14
23
7
11
Li
ft R
elea
se-
-
-
-
-
-
-
7
8
13
7
10
7
9
M
edic
al In
cide
nt -
Co-
resp
onde
r/Firs
t res
pond
er15
15
15
7
7
20
76
200
220
183
143
157
182
248
Su
icid
e/at
tem
pts
18
28
36
19
11
30
30
17
11
18
10
12
16
13
Haz
ardo
us M
ater
ials
inci
dent
-
1
1
1
1
2
7
23
28
68
35
44
33
23
Sp
ills
and
Leak
s (n
ot R
TC)
-
-
-
-
-
-
-
4
8
3
8
4
1
5
Rem
oval
of o
bjec
ts fr
om p
eopl
e-
-
-
-
-
1
-
26
22
19
30
32
43
41
Anim
al a
ssis
tanc
e in
cide
nts
-
-
-
-
-
-
-
3
3
1
1
--
2
Ef
fect
ing
entr
y or
exi
t 10
6
5
5
18
34
77
37
37
37
73
11
8
28
1
43
3
Mak
ing
Safe
(not
RTC
)2
4
4
4
6
6
2
6
8
7
8
10
3
11
N
o ac
tion
(not
fals
e al
arm
)2
5
3
4
1
7
11
30
14
19
31
26
28
24
W
ater
pro
visi
on-
-
-
-
-
-
-
-
-
-
-
-
-
-
St
and
By
-
-
-
-
-
1
1
3
1
1
-
-
6
-
Assi
st o
ther
age
ncie
s36
29
25
26
30
42
77
167
134
111
105
156
163
264
Ad
vice
Onl
y-
1
-
-
-
-
-
-
-
1
3
5
1
-
Tota
l24
123
721
319
422
627
640
8
2,
956
2,57
92,
470
2,46
72,
667
2,80
83,
327
Not
ep
- pro
visi
onal
r - re
vise
d
Tabl
e 7:
Cas
ualti
es fr
om n
on-fi
re in
cide
nts,
200
9-10
to 2
015-
16, S
cotla
nd Fata
l Cas
ualti
esN
on-fa
tal C
asua
lties
17
42
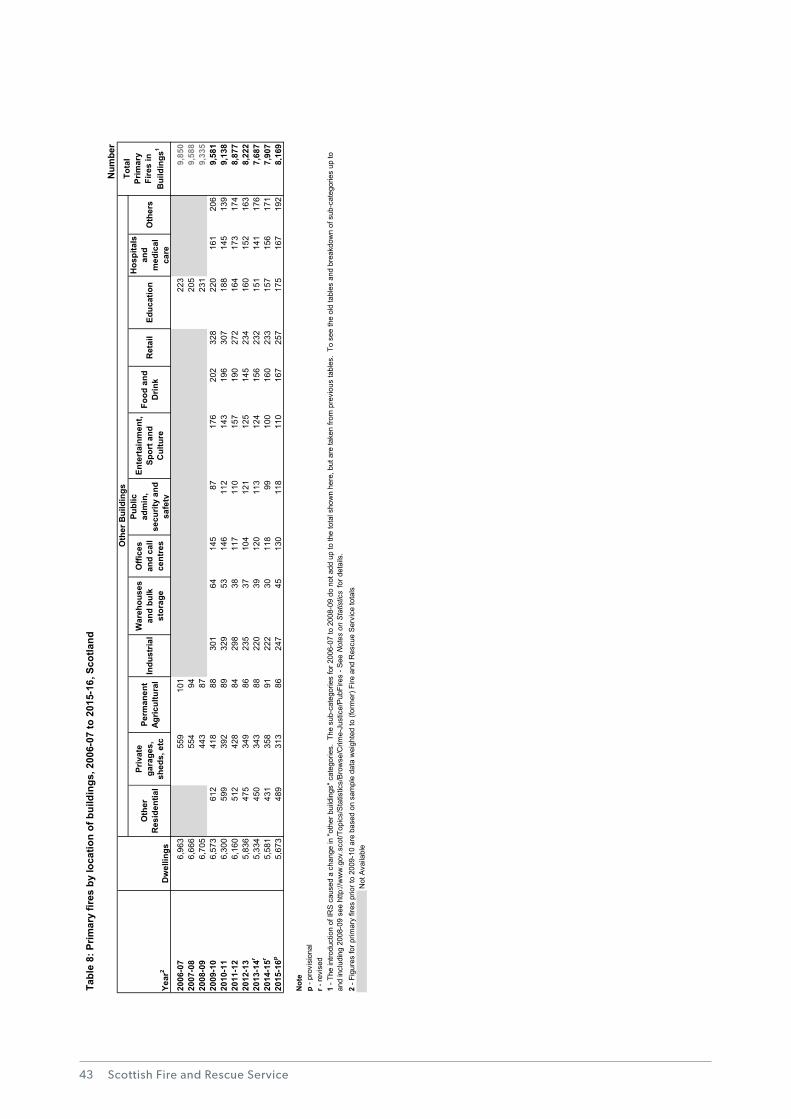
Scottish Fire and Rescue Service43
Num
ber
Oth
er
Res
iden
tial
Priv
ate
gara
ges,
sh
eds,
etc
Perm
anen
t Ag
ricul
tura
lIn
dust
rial
War
ehou
ses
and
bulk
st
orag
e
Offi
ces
and
call
cent
res
Publ
ic
adm
in,
secu
rity
and
safe
ty
Ente
rtai
nmen
t, Sp
ort a
nd
Cul
ture
Food
and
D
rink
Ret
ail
Educ
atio
n
Hos
pita
ls
and
med
ical
ca
re
Oth
ers
2006
-07
6,96
355
910
122
39,
850
2007
-08
6,66
655
494
205
9,58
820
08-0
96,
705
443
8723
19,
335
2009
-10
6,57
361
241
888
301
6414
587
176
202
328
220
161
206
9,58
120
10-1
16,
300
599
392
8932
953
146
112
143
196
307
188
145
139
9,13
820
11-1
26,
160
512
428
8429
838
117
110
157
190
272
164
173
174
8,87
720
12-1
35,
836
475
349
8623
537
104
121
125
145
234
160
152
163
8,22
220
13-1
4r5,
334
450
343
8822
039
120
113
124
156
232
151
141
176
7,68
720
14-1
5r5,
581
431
358
9122
230
118
9910
016
023
315
715
617
17,
907
2015
-16p
5,67
348
931
386
247
4513
011
811
016
725
717
516
719
28,
169
Not
ep
- pro
visi
onal
r - re
vise
d
Not
Ava
ilabl
e
Oth
er B
uild
ings
Tabl
e 8:
Prim
ary
fires
by
loca
tion
of b
uild
ings
, 200
6-07
to 2
015-
16, S
cotla
nd
2 - F
igur
es fo
r prim
ary
fires
prio
r to
2009
-10
are
base
d on
sam
ple
data
wei
ghte
d to
(for
mer
) Fire
and
Res
cue
Ser
vice
tota
ls
1 - T
he in
trodu
ctio
n of
IRS
cau
sed
a ch
ange
in "o
ther
bui
ldin
gs" c
ateg
orie
s. T
he s
ub-c
ateg
orie
s fo
r 200
6-07
to 2
008-
09 d
o no
t add
up
to th
e to
tal s
how
n he
re, b
ut a
re ta
ken
from
pre
viou
s ta
bles
. To
see
the
old
tabl
es a
nd b
reak
dow
n of
sub
-cat
egor
ies
up to
an
d in
clud
ing
2008
-09
see
http
://w
ww
.gov
.sco
t/Top
ics/
Sta
tistic
s/B
row
se/C
rime-
Just
ice/
Pub
Fire
s - S
ee N
otes
on
Sta
tistic
s fo
r det
ails
.
Tota
l Pr
imar
y Fi
res
in
Bui
ldin
gs1
Year
2D
wel
lings
18
8a
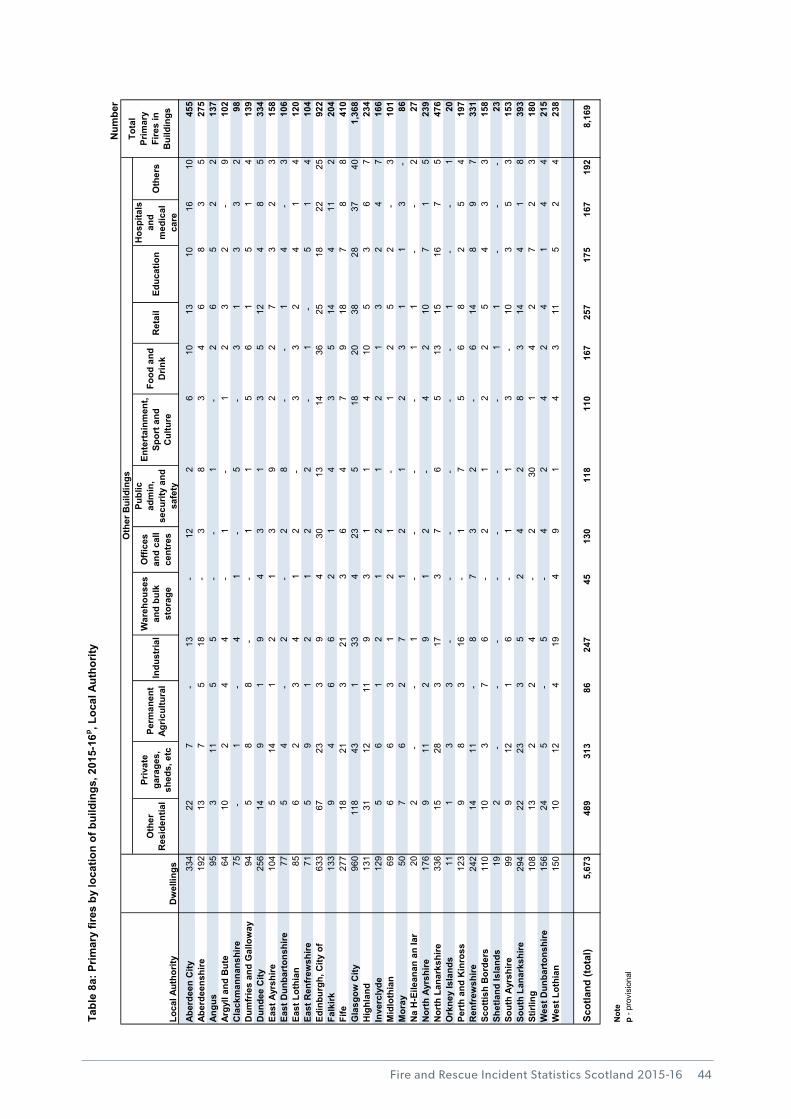
Fire and Rescue Incident Statistics Scotland 2015-16
Num
ber
Oth
er
Res
iden
tial
Priv
ate
gara
ges,
sh
eds,
etc
Perm
anen
t Ag
ricul
tura
lIn
dust
rial
War
ehou
ses
and
bulk
st
orag
e
Offi
ces
and
call
cent
res
Publ
ic
adm
in,
secu
rity
and
safe
ty
Ente
rtai
nmen
t, Sp
ort a
nd
Cul
ture
Food
and
D
rink
Ret
ail
Educ
atio
n
Hos
pita
ls
and
med
ical
ca
re
Oth
ers
Aber
deen
City
334
22
7
-
1
3 -
12
2
6
1
0
13
10
16
1
0
4
55
Aber
deen
shire
192
13
7
5
1
8 -
3
8
3
4
6
8
3
5
2
75
Angu
s95
3
11
5
5
-
-
1
-
2
6
5
2
2
137
Ar
gyll
and
But
e64
10
2
4
4
-
1
-
1
2
3
2 -
9
102
C
lack
man
nans
hire
75-
1 -
4
1
-
5
-
3
1
3
3
2
98
Dum
frie
s an
d G
allo
way
94
5
8
8
-
-
1
1
5
6
1
5
1
4
1
39
Dun
dee
City
256
14
9
1
9
4
3
1
3
5
12
4
8
5
334
Ea
st A
yrsh
ire10
4
5
14
1
2
1
3
9
2
2
7
3
2
3
1
58
East
Dun
bart
onsh
ire77
5
4
-
2
-
2
8
-
-
1
4 -
3
106
Ea
st L
othi
an85
6
2
3
4
1
2
-
3
3
2
4
1
4
120
Ea
st R
enfr
ewsh
ire71
5
9
1
2
1
2
2
-
1 -
5
1
4
104
Ed
inbu
rgh,
City
of
633
67
23
3
9
4
3
0
13
14
3
6
25
18
22
2
5
9
22
Falk
irk13
3
9
4
6
6
2
1
4
3
5
14
4
1
1
2
204
Fi
fe27
7
18
21
3
21
3
6
4
7
9
18
7
8
8
410
G
lasg
ow C
ity96
0
1
18
4
3
1
33
4
2
3
5
18
20
38
28
3
7
40
1
,368
H
ighl
and
131
31
12
1
1
9
3
1
1
4
10
5
3
6
7
2
34
Inve
rcly
de12
9
5
6
1
2
1
2
1
2
1
3
2
4
7
1
66
Mid
loth
ian
69
6
6
3
1
2
1
-
1
2
5
2
-
3
1
01
Mor
ay50
7
6
2
7
1
2
1
2
3
1
1
3
-
8
6 N
a H
-Eile
anan
an
Iar
20
2
-
-
1
-
-
-
-
1
1
-
-
2
27
Nor
th A
yrsh
ire17
6
9
11
2
9
1
2
-
4
2
10
7
1
5
2
39
Nor
th L
anar
kshi
re33
6
15
28
3
17
3
7
6
5
1
3
15
16
7
5
476
O
rkne
y Is
land
s11
1
3
3
-
-
-
-
-
-
1
-
-
1
2
0 Pe
rth
and
Kin
ross
123
9
8
3
1
6 -
1
7
5
6
8
2
5
4
1
97
Ren
frew
shire
242
14
11
-
8
7
3
2
-
6
14
8
9
7
331
Sc
ottis
h B
orde
rs11
0
10
3
7
6
-
2
1
2
2
5
4
3
3
1
58
Shet
land
Isla
nds
19
2
-
-
-
-
-
-
-
1
1
-
-
-
23
Sout
h Ay
rshi
re99
9
12
1
6
-
1
1
3
-
10
3
5
3
153
So
uth
Lana
rksh
ire29
4
22
23
3
5
2
4
2
8
3
14
4
1
8
3
93
Stirl
ing
108
13
2
2
4
-
2
3
0
1
4
2
7
2
3
1
80
Wes
t Dun
bart
onsh
ire15
6
24
5
-
5
-
4
2
4
2
4
1
4
4
2
15
Wes
t Lot
hian
150
10
12
4
1
9
4
9
1
4
3
11
5
2
4
2
38
Scot
land
(tot
al)
5,67
348
931
386
247
4513
011
811
016
725
717
516
719
28,
169
Not
ep
- pro
visi
onal
Oth
er B
uild
ings
Tabl
e 8a
: Prim
ary
fires
by
loca
tion
of b
uild
ings
, 201
5-16
p , Loc
al A
utho
rity
Loca
l Aut
horit
yD
wel
lings
Tota
l Pr
imar
y Fi
res
in
Bui
ldin
gs
18
8a
44
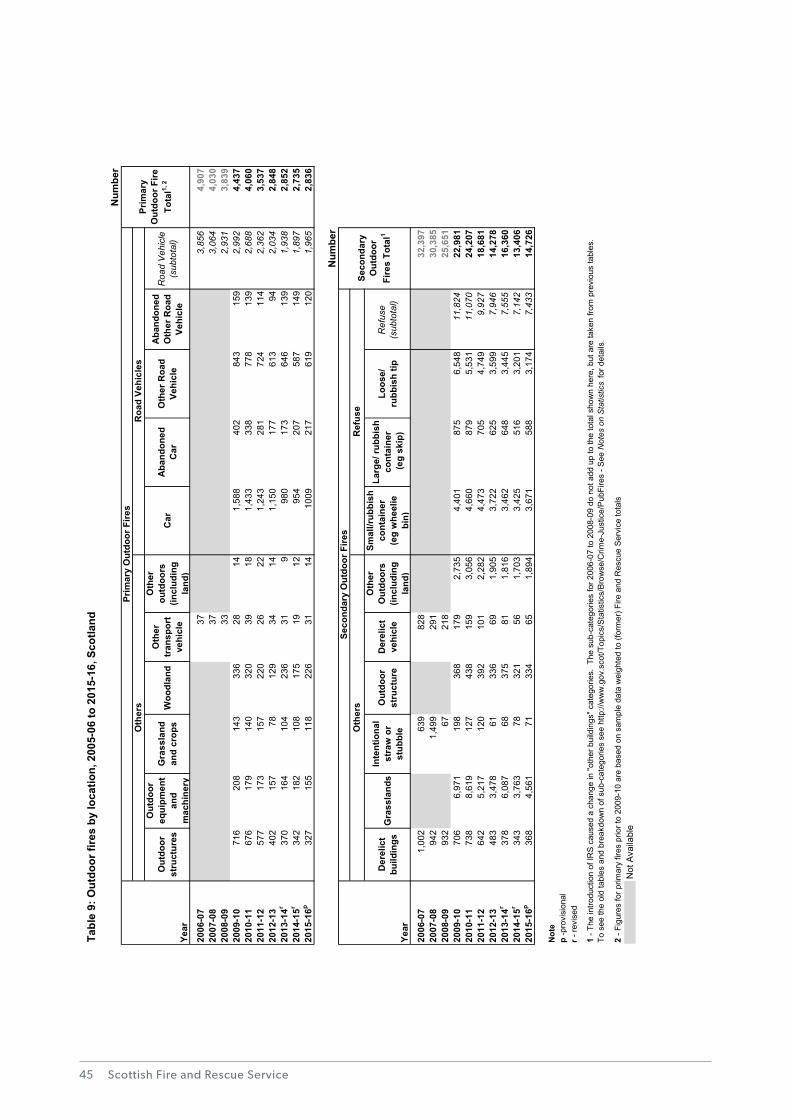
Scottish Fire and Rescue Service45
Num
ber
Out
door
st
ruct
ures
Out
door
eq
uipm
ent
and
mac
hine
ry
Gra
ssla
nd
and
crop
sW
oodl
and
Oth
er
tran
spor
t ve
hicl
e
Oth
er
outd
oors
(in
clud
ing
land
)
Car
Aba
ndon
ed
Car
Oth
er R
oad
Vehi
cle
Aba
ndon
ed
Oth
er R
oad
Vehi
cle
Roa
d V
ehic
le
(sub
tota
l)
2006
-07
373,
856
4,90
720
07-0
837
3,06
44,
030
2008
-09
332,
931
3,83
920
09-1
071
620
814
333
628
141,
588
402
843
159
2,99
24,
437
2010
-11
676
179
140
320
3918
1,43
333
877
813
92,
688
4,06
020
11-1
257
717
315
722
026
221,
243
281
724
114
2,36
23,
537
2012
-13
402
157
7812
934
141,
150
177
613
942,
034
2,84
820
13-1
4r37
016
410
423
631
998
017
364
613
91,
938
2,85
220
14-1
5r34
218
210
817
519
1295
420
758
714
91,
897
2,73
520
15-1
6p32
715
511
822
631
1410
0921
761
912
01,
965
2,83
6
Num
ber
Der
elic
t bu
ildin
gsG
rass
land
sIn
tent
iona
l st
raw
or
stub
ble
Out
door
st
ruct
ure
Der
elic
t ve
hicl
e
Oth
er
Out
door
s (in
clud
ing
land
)
Smal
l/rub
bish
co
ntai
ner
(eg
whe
elie
bi
n)
Larg
e/ ru
bbis
h co
ntai
ner
(eg
skip
)
Loos
e/
rubb
ish
tipR
efus
e (s
ubto
tal)
2006
-07
1,00
263
982
832
,397
2007
-08
942
1,49
929
130
,385
2008
-09
932
6721
825
,651
2009
-10
706
6,97
119
836
817
92,
735
4,40
187
56,
548
11,8
2422
,981
2010
-11
738
8,61
912
743
815
93,
056
4,66
087
95,
531
11,0
7024
,207
2011
-12
642
5,21
712
039
210
12,
282
4,47
370
54,
749
9,92
718
,681
2012
-13
483
3,47
861
336
691,
905
3,72
262
53,
599
7,94
614
,278
2013
-14r
378
6,08
768
375
811,
816
3,46
264
83,
445
7,55
516
,360
2014
-15r
343
3,76
378
321
561,
703
3,42
551
63,
201
7,14
213
,406
2015
-16p
368
4,56
171
334
651,
894
3,67
158
83,
174
7,43
314
,726
Not
ep
-pro
visi
onal
r - re
vise
d
Not
Ava
ilabl
e
Tabl
e 9:
Out
door
fire
s by
loca
tion,
200
5-06
to 2
015-
16, S
cotla
nd
Prim
ary
Out
door
Fire
sO
ther
sR
oad
Vehi
cles
Seco
ndar
y O
utdo
or F
ires
1 - T
he in
trodu
ctio
n of
IRS
cau
sed
a ch
ange
in "o
ther
bui
ldin
gs" c
ateg
orie
s. T
he s
ub-c
ateg
orie
s fo
r 200
6-07
to 2
008-
09 d
o no
t add
up
to th
e to
tal s
how
n he
re, b
ut a
re ta
ken
from
pre
viou
s ta
bles
. To
see
the
old
tabl
es a
nd b
reak
dow
n of
sub
-cat
egor
ies
see
http
://w
ww
.gov
.sco
t/Top
ics/
Sta
tistic
s/B
row
se/C
rime-
Just
ice/
Pub
Fire
s - S
ee N
otes
on
Sta
tistic
s fo
r det
ails
.
Prim
ary
Out
door
Fire
To
tal1,
2
Seco
ndar
y O
utdo
or
Fire
s To
tal1
2 - F
igur
es fo
r prim
ary
fires
prio
r to
2009
-10
are
base
d on
sam
ple
data
wei
ghte
d to
(for
mer
) Fire
and
Res
cue
Ser
vice
tota
ls
Ref
use
Oth
ers
Year
Year
19
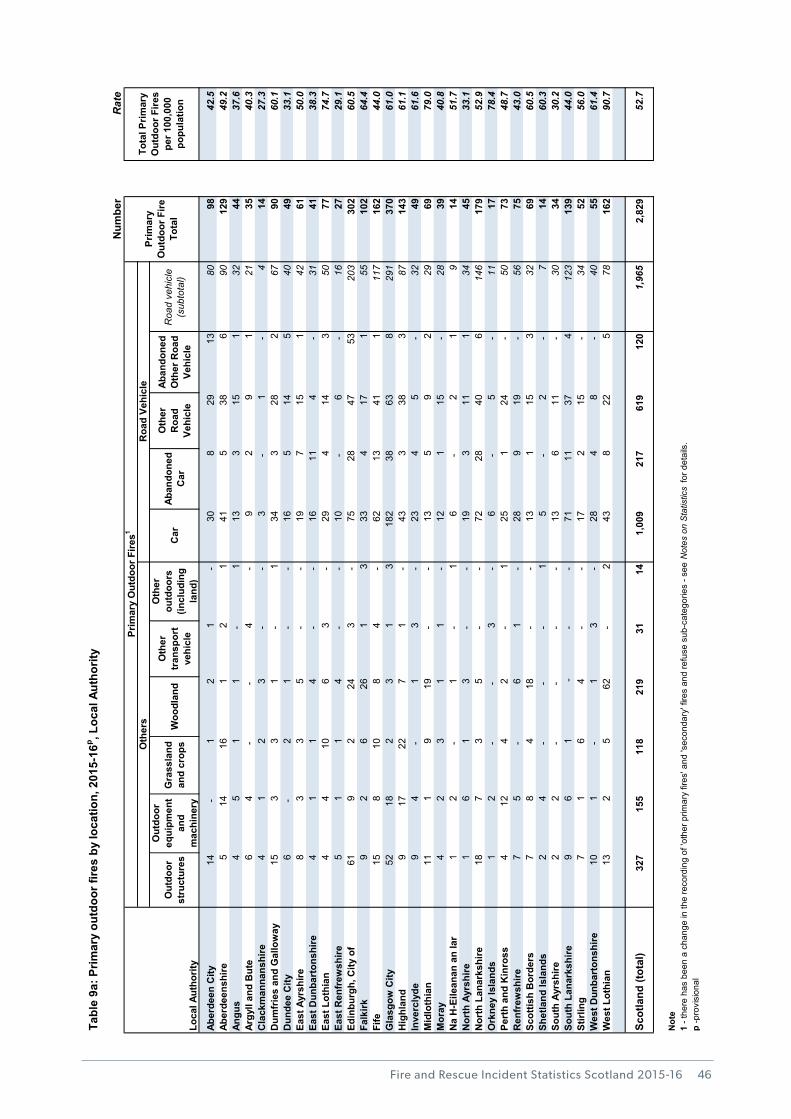
Fire and Rescue Incident Statistics Scotland 2015-16
Num
ber
Rat
e
Out
door
st
ruct
ures
Out
door
eq
uipm
ent
and
mac
hine
ry
Gra
ssla
nd
and
crop
sW
oodl
and
Oth
er
tran
spor
t ve
hicl
e
Oth
er
outd
oors
(in
clud
ing
land
)
Car
Aban
done
d C
ar
Oth
er
Roa
d Ve
hicl
e
Aban
done
d O
ther
Roa
d Ve
hicl
e
Roa
d ve
hicl
e (s
ubto
tal)
Aber
deen
City
14
-
1
2
1
-
3
0
8
29
1
3 80
9842
.5Ab
erde
ensh
ire
5
14
16
1
2
1
4
1
5
38
6 90
129
49.2
Angu
s
4
5
1
1
-
1
13
3
1
5
1
3244
37.6
Argy
ll an
d B
ute
6
4
-
-
4
-
9
2
9
1
2135
40.3
Cla
ckm
anna
nshi
re
4
1
2
3
-
-
3
-
1
-
4
1427
.3D
umfr
ies
and
Gal
low
ay
1
5
3
3
1
-
1
34
3
2
8
2
6790
60.1
Dun
dee
City
6
-
2
1
-
-
1
6
5
14
5 40
4933
.1Ea
st A
yrsh
ire
8
3
3
5
-
-
19
7
1
5
1
4261
50.0
East
Dun
bart
onsh
ire
4
1
1
4
-
-
16
11
4
-
31
4138
.3Ea
st L
othi
an
4
4
10
6
3
-
2
9
4
14
3 50
7774
.7Ea
st R
enfr
ewsh
ire
5
1
1
4
-
-
10
-
6
-
16
2729
.1Ed
inbu
rgh,
City
of
61
9
2
24
3
-
7
5
28
47
5
3 20
330
260
.5Fa
lkirk
9
2
6
26
1
3
3
3
4
17
1 55
102
64.4
Fife
15
8
1
0
8
4
-
62
13
4
1
1
117
162
44.0
Gla
sgow
City
52
18
2
3
1
3
182
38
63
8 29
137
061
.0H
ighl
and
9
17
2
2
7
1
-
43
3
3
8
3
8714
361
.1In
verc
lyde
9
4
-
1
3
-
2
3
4
5
-
3249
61.6
Mid
loth
ian
11
1
9
19
-
-
1
3
5
9
2
2969
79.0
Mor
ay
4
2
3
1
1
-
12
1
1
5 -
2839
40.8
Na
H-E
ilean
an a
n Ia
r
1
2
-
1
-
1
6
-
2
1 9
1451
.7N
orth
Ayr
shire
1
6
1
3
-
-
1
9
3
11
1 34
4533
.1N
orth
Lan
arks
hire
18
7
3
5
-
-
7
2
28
40
6 14
617
952
.9O
rkne
y Is
land
s
1
2
-
-
3
-
6
-
5
-
11
1778
.4Pe
rth
and
Kin
ross
4
12
4
2
-
1
2
5
1
24
-
50
7348
.7R
enfr
ewsh
ire
7
5
-
6
1
-
28
9
1
9 -
5675
43.0
Scot
tish
Bor
ders
7
8
4
18
-
-
1
3
1
15
3 32
6960
.5Sh
etla
nd Is
land
s
2
4
-
-
-
1
5
-
2
-
7
1460
.3So
uth
Ayrs
hire
2
2
-
-
-
-
1
3
6
11
-
30
3430
.2So
uth
Lana
rksh
ire
9
6
1
-
-
-
71
11
3
7
4
123
139
44.0
Stirl
ing
7
1
6
4
-
-
1
7
2
15
-
34
5256
.0W
est D
unba
rton
shire
10
1
-
1
3
-
2
8
4
8
-
4055
61.4
Wes
t Lot
hian
13
2
5
62
-
2
4
3
8
22
5 78
162
90.7
Scot
land
(tot
al)
327
155
118
219
3114
1,00
921
761
912
01,
965
2,82
952
.7
Not
e
p -p
rovi
sion
al
Prim
ary
Out
door
Fire
s1
Oth
ers
Roa
d Ve
hicl
e
Tabl
e 9a
: Prim
ary
outd
oor f
ires
by lo
catio
n, 2
015-
16p , L
ocal
Aut
horit
y
1 - t
here
has
bee
n a
chan
ge in
the
reco
rdin
g of
'oth
er p
rimar
y fir
es' a
nd 's
econ
dary
' fire
s an
d re
fuse
sub
-cat
egor
ies
- see
Not
es o
n S
tatis
tics
for d
etai
ls.
Loca
l Aut
horit
y
Prim
ary
Out
door
Fire
To
tal
Tota
l Prim
ary
Out
door
Fire
s pe
r 100
,000
po
pula
tion
19a
46
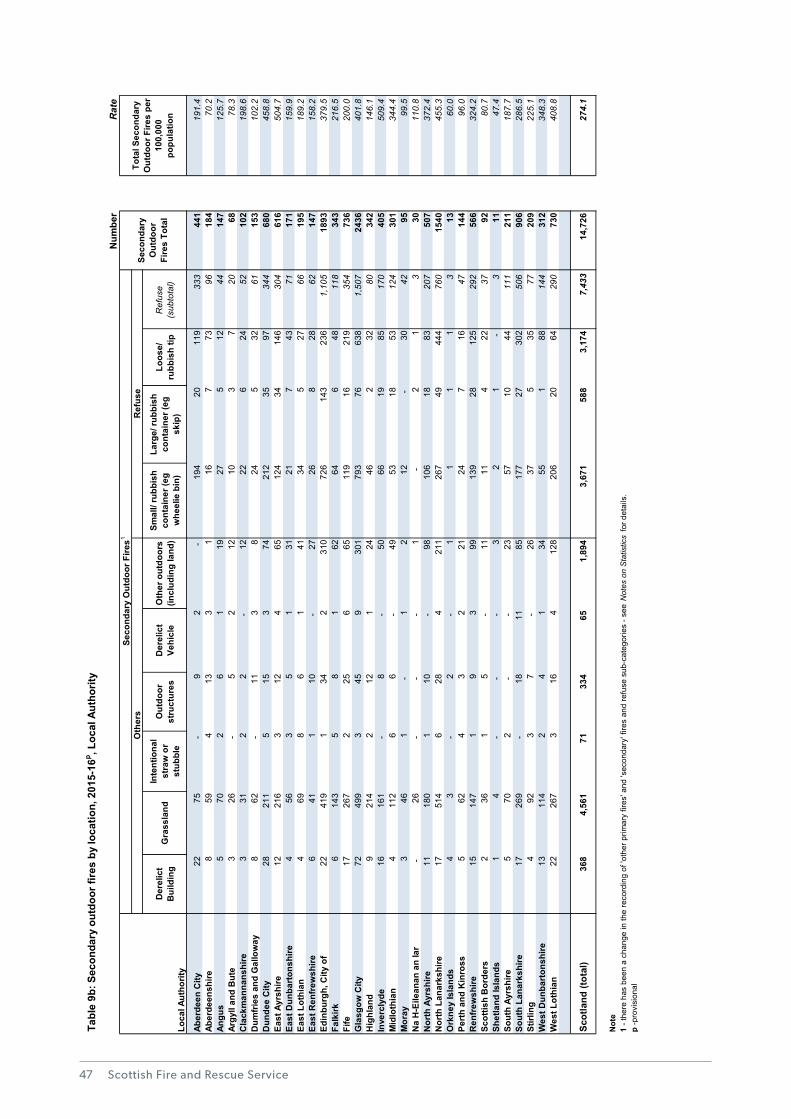
Scottish Fire and Rescue Service47
Num
ber
Rat
e
Der
elic
t B
uild
ing
Gra
ssla
ndIn
tent
iona
l st
raw
or
stub
ble
Out
door
st
ruct
ures
Der
elic
t Ve
hicl
eO
ther
out
door
s (in
clud
ing
land
)
Smal
l/ ru
bbis
h co
ntai
ner (
eg
whe
elie
bin
)
Larg
e/ ru
bbis
h co
ntai
ner (
eg
skip
)
Loos
e/
rubb
ish
tipR
efus
e (s
ubto
tal)
Aber
deen
City
22
75
-
9
2
-
194
2
0
119
333
44
119
1.4
Aber
deen
shire
8
59
4
13
3
1
16
7
7
3 96
184
70.2
Angu
s
5
7
0
2
6
1
1
9
27
5
12
44
14
712
5.7
Argy
ll an
d B
ute
3
26
-
5
2
12
10
3
7
20
68
78.3
Cla
ckm
anna
nshi
re
3
3
1
2
2
-
1
2
22
6
24
52
10
219
8.6
Dum
frie
s an
d G
allo
way
8
62
-
11
3
8
24
5
3
2 61
153
102.
2D
unde
e C
ity
28
211
5
15
3
7
4
212
3
5
97
344
68
045
8.8
East
Ayr
shire
12
2
16
3
12
4
65
1
24
34
14
6 30
4
616
504.
7Ea
st D
unba
rton
shire
4
56
3
5
1
31
21
7
4
3 71
171
159.
9Ea
st L
othi
an
4
6
9
8
6
1
4
1
34
5
27
66
19
518
9.2
East
Ren
frew
shire
6
41
1
10
-
27
26
8
2
8 62
147
158.
2Ed
inbu
rgh,
City
of
22
4
19
1
34
2
3
10
7
26
1
43
23
6 1,
105
1893
379.
5Fa
lkirk
6
1
43
5
8
1
62
64
6
4
8 11
8
343
216.
5Fi
fe
17
267
2
25
6
6
5
119
1
6
219
354
73
620
0.0
Gla
sgow
City
72
4
99
3
45
9
3
01
7
93
76
63
8 1,
507
2436
401.
8H
ighl
and
9
2
14
2
12
1
24
46
2
3
2 80
342
146.
1In
verc
lyde
16
1
61
-
8
-
50
66
19
8
5 17
0
405
509.
4M
idlo
thia
n
4
112
6
6
-
4
9
53
1
8
53
124
30
134
4.4
Mor
ay
3
4
6
1
-
1
2
12
-
3
0 42
9599
.5N
a H
-Eile
anan
an
Iar
-
26
-
-
-
1
-
2
1
3
3011
0.8
Nor
th A
yrsh
ire
11
180
1
10
-
9
8
106
1
8
83
207
50
737
2.4
Nor
th L
anar
kshi
re
17
514
6
28
4
211
267
4
9
444
760
15
4045
5.3
Ork
ney
Isla
nds
4
3
-
2
-
1
1
1
1
3
1360
.0Pe
rth
and
Kin
ross
5
62
4
3
2
21
24
7
1
6 47
144
96.0
Ren
frew
shire
15
1
47
1
9
3
99
1
39
28
12
5 29
2
566
324.
2Sc
ottis
h B
orde
rs
2
3
6
1
5
-
1
1
11
4
22
37
92
80.7
Shet
land
Isla
nds
1
4
-
-
-
3
2
1
-
3
1147
.4So
uth
Ayrs
hire
5
70
2
-
-
23
57
10
4
4 11
1
211
187.
7So
uth
Lana
rksh
ire
17
269
-
18
1
1
85
1
77
27
30
2 50
6
906
286.
5St
irlin
g
4
9
2
3
7
-
2
6
37
5
35
77
20
922
5.1
Wes
t Dun
bart
onsh
ire
13
114
2
4
1
3
4
55
1
88
144
31
234
8.3
Wes
t Lot
hian
22
2
67
3
16
4
1
28
2
06
20
6
4 29
0
730
408.
8
Scot
land
(tot
al)
368
4,56
171
334
651,
894
3,67
158
83,
174
7,43
314
,726
274.
1
Not
e
p -p
rovi
sion
al
Seco
ndar
y O
utdo
or F
ires1
Oth
ers
Ref
use
Tabl
e 9b
: Sec
onda
ry o
utdo
or fi
res
by lo
catio
n, 2
015-
16p , L
ocal
Aut
horit
y
1 - t
here
has
bee
n a
chan
ge in
the
reco
rdin
g of
'oth
er p
rimar
y fir
es' a
nd 's
econ
dary
' fire
s an
d re
fuse
sub
-cat
egor
ies
- see
Not
es o
n S
tatis
tics
for d
etai
ls.
Loca
l Aut
horit
y
Seco
ndar
y O
utdo
or
Fire
s To
tal
Tota
l Sec
onda
ry
Out
door
Fire
s pe
r 10
0,00
0 po
pula
tion
19b
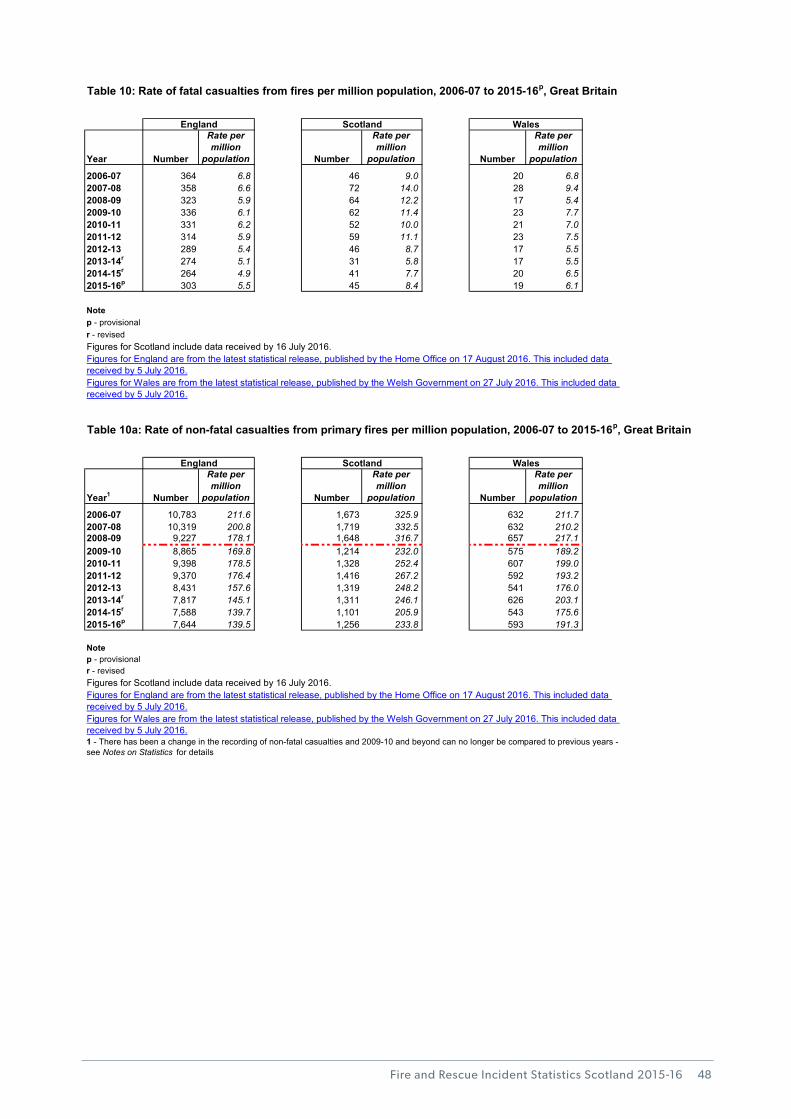
Fire and Rescue Incident Statistics Scotland 2015-16
Year Number
Rate per million
population Number
Rate per million
population Number
Rate per million
population
2006-07 364 6.8 46 9.0 20 6.82007-08 358 6.6 72 14.0 28 9.42008-09 323 5.9 64 12.2 17 5.42009-10 336 6.1 62 11.4 23 7.72010-11 331 6.2 52 10.0 21 7.02011-12 314 5.9 59 11.1 23 7.52012-13 289 5.4 46 8.7 17 5.52013-14r 274 5.1 31 5.8 17 5.52014-15r 264 4.9 41 7.7 20 6.52015-16p 303 5.5 45 8.4 19 6.1
Notep - provisionalr - revised
Year1 Number
Rate per million
population Number
Rate per million
population Number
Rate per million
population
2006-07 10,783 211.6 1,673 325.9 632 211.72007-08 10,319 200.8 1,719 332.5 632 210.22008-09 9,227 178.1 1,648 316.7 657 217.12009-10 8,865 169.8 1,214 232.0 575 189.22010-11 9,398 178.5 1,328 252.4 607 199.02011-12 9,370 176.4 1,416 267.2 592 193.22012-13 8,431 157.6 1,319 248.2 541 176.02013-14r 7,817 145.1 1,311 246.1 626 203.12014-15r 7,588 139.7 1,101 205.9 543 175.62015-16p 7,644 139.5 1,256 233.8 593 191.3
Notep - provisionalr - revised
Table 10: Rate of fatal casualties from fires per million population, 2006-07 to 2015-16p, Great Britain
Table 10a: Rate of non-fatal casualties from primary fires per million population, 2006-07 to 2015-16p, Great Britain
Figures for England are from the latest statistical release, published by the Home Office on 17 August 2016. This included data received by 5 July 2016.
Figures for Scotland include data received by 16 July 2016.
Figures for Wales are from the latest statistical release, published by the Welsh Government on 27 July 2016. This included data received by 5 July 2016.1 - There has been a change in the recording of non-fatal casualties and 2009-10 and beyond can no longer be compared to previous years - see Notes on Statistics for details
England Scotland Wales
England Scotland Wales
Figures for England are from the latest statistical release, published by the Home Office on 17 August 2016. This included data received by 5 July 2016.
Figures for Scotland include data received by 16 July 2016.
Figures for Wales are from the latest statistical release, published by the Welsh Government on 27 July 2016. This included data received by 5 July 2016.
1 10 10a
48
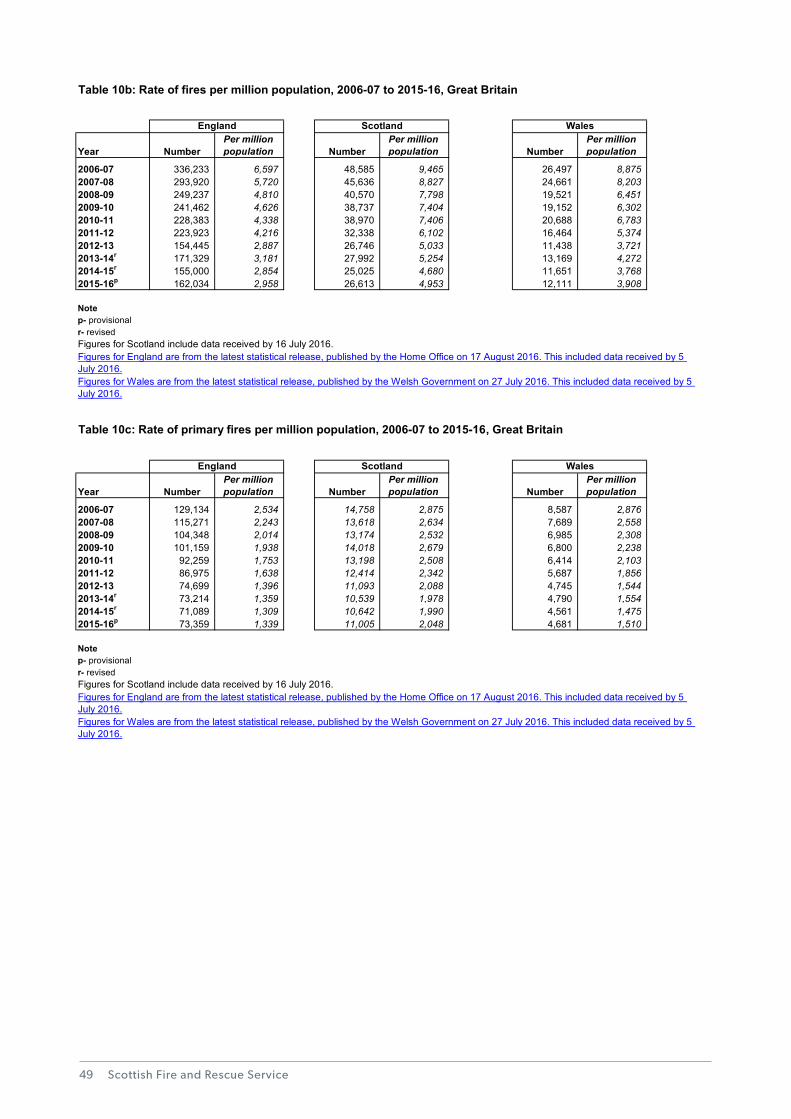
Scottish Fire and Rescue Service49
Year NumberPer million population Number
Per million population Number
Per million population
2006-07 336,233 6,597 48,585 9,465 26,497 8,875 2007-08 293,920 5,720 45,636 8,827 24,661 8,203 2008-09 249,237 4,810 40,570 7,798 19,521 6,451 2009-10 241,462 4,626 38,737 7,404 19,152 6,302 2010-11 228,383 4,338 38,970 7,406 20,688 6,783 2011-12 223,923 4,216 32,338 6,102 16,464 5,374 2012-13 154,445 2,887 26,746 5,033 11,438 3,721 2013-14r 171,329 3,181 27,992 5,254 13,169 4,272 2014-15r 155,000 2,854 25,025 4,680 11,651 3,768 2015-16p 162,034 2,958 26,613 4,953 12,111 3,908
Notep- provisionalr- revised
Year NumberPer million population Number
Per million population Number
Per million population
2006-07 129,134 2,534 14,758 2,875 8,587 2,876 2007-08 115,271 2,243 13,618 2,634 7,689 2,558 2008-09 104,348 2,014 13,174 2,532 6,985 2,308 2009-10 101,159 1,938 14,018 2,679 6,800 2,238 2010-11 92,259 1,753 13,198 2,508 6,414 2,103 2011-12 86,975 1,638 12,414 2,342 5,687 1,856 2012-13 74,699 1,396 11,093 2,088 4,745 1,544 2013-14r 73,214 1,359 10,539 1,978 4,790 1,554 2014-15r 71,089 1,309 10,642 1,990 4,561 1,475 2015-16p 73,359 1,339 11,005 2,048 4,681 1,510
Notep- provisionalr- revised
Figures for England are from the latest statistical release, published by the Home Office on 17 August 2016. This included data received by 5 July 2016.
Figures for Scotland include data received by 16 July 2016.
Figures for Wales are from the latest statistical release, published by the Welsh Government on 27 July 2016. This included data received by 5 July 2016.
Table 10b: Rate of fires per million population, 2006-07 to 2015-16, Great Britain
Figures for England are from the latest statistical release, published by the Home Office on 17 August 2016. This included data received by 5 July 2016.
Figures for Scotland include data received by 16 July 2016.
Figures for Wales are from the latest statistical release, published by the Welsh Government on 27 July 2016. This included data received by 5 July 2016.
England Scotland Wales
England Scotland Wales
Table 10c: Rate of primary fires per million population, 2006-07 to 2015-16, Great Britain
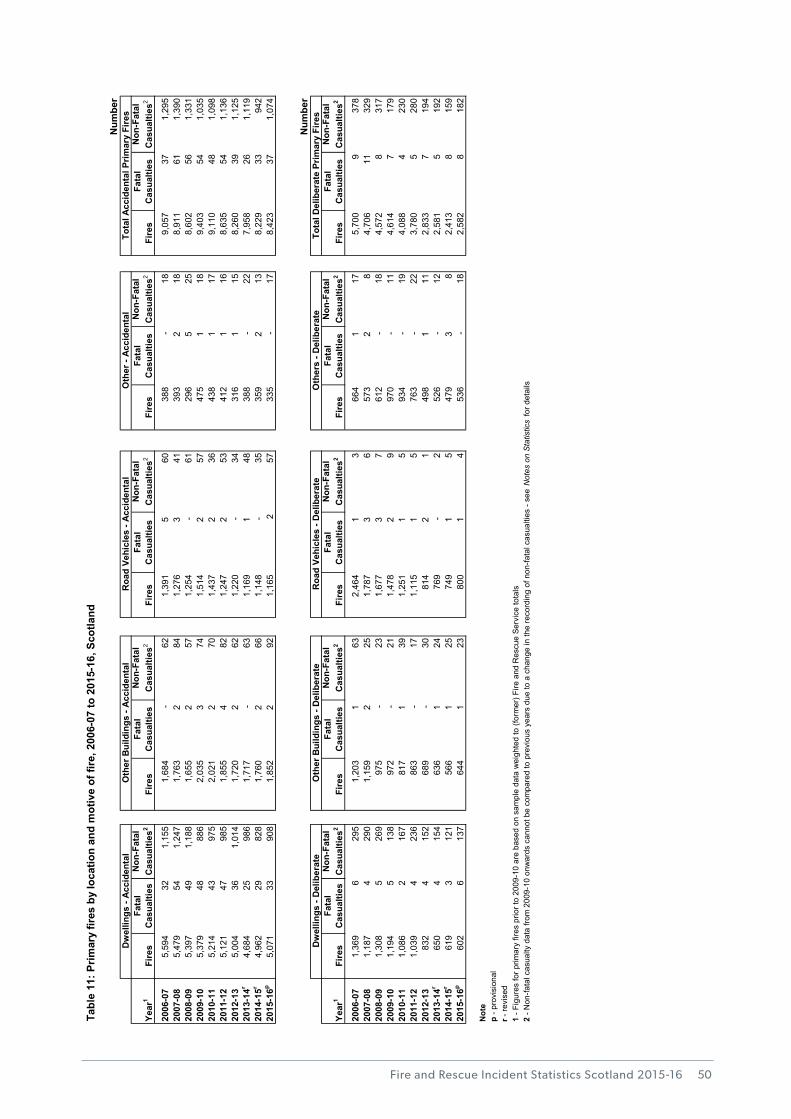
Fire and Rescue Incident Statistics Scotland 2015-16
Num
ber
Year
1Fi
res
Fata
l C
asua
lties
Non
-Fat
al
Cas
ualti
es2
Fire
sFa
tal
Cas
ualti
esN
on-F
atal
C
asua
lties
2Fi
res
Fata
l C
asua
lties
Non
-Fat
al
Cas
ualti
es2
Fire
sFa
tal
Cas
ualti
esN
on-F
atal
C
asua
lties
2Fi
res
Fata
l C
asua
lties
Non
-Fat
al
Cas
ualti
es2
2006
-07
5,59
432
1,15
51,
684
-
62
1,39
15
60
388
-
18
9,05
737
1,29
520
07-0
85,
479
541,
247
1,76
32
841,
276
3
4139
32
188,
911
611,
390
2008
-09
5,39
749
1,18
81,
655
2
57
1,25
4-
61
296
5
25
8,60
256
1,33
120
09-1
05,
379
4888
62,
035
3
74
1,51
42
57
475
1
18
9,40
354
1,03
520
10-1
15,
214
4397
52,
021
2
70
1,43
72
36
438
1
17
9,11
048
1,09
820
11-1
25,
121
4798
51,
855
4
82
1,24
72
53
412
1
16
8,63
554
1,13
620
12-1
35,
004
361,
014
1,72
02
621,
220
-
3431
61
158,
260
391,
125
2013
-14r
4,68
425
986
1,71
7-
631,
169
1
4838
8-
227,
958
261,
119
2014
-15r
4,96
229
828
1,76
02
661,
148
-
3535
92
138,
229
3394
220
15-1
6p5,
071
3390
81,
852
2
92
1,16
52
5733
5-
178,
423
371,
074
Num
ber
Year
1Fi
res
Fata
l C
asua
lties
Non
-Fat
al
Cas
ualti
es2
Fire
sFa
tal
Cas
ualti
esN
on-F
atal
C
asua
lties
2Fi
res
Fata
l C
asua
lties
Non
-Fat
al
Cas
ualti
es2
Fire
sFa
tal
Cas
ualti
esN
on-F
atal
C
asua
lties
2Fi
res
Fata
l C
asua
lties
Non
-Fat
al
Cas
ualti
es2
2006
-07
1,36
96
295
1,20
31
632,
464
1
366
41
175,
700
937
820
07-0
81,
187
429
01,
159
2
25
1,78
73
6
573
2
8
4,70
611
329
2008
-09
1,30
85
269
975
-
23
1,67
73
7
612
-
18
4,57
28
317
2009
-10
1,19
45
138
972
-
21
1,47
82
9
970
-
11
4,61
47
179
2010
-11
1,08
62
167
817
1
39
1,25
11
5
934
-
19
4,08
84
230
2011
-12
1,03
94
236
863
-
17
1,11
51
5
763
-
22
3,78
05
280
2012
-13
832
415
268
9-
3081
42
1
498
1
11
2,83
37
194
2013
-14r
650
415
463
61
2476
9-
2
526
-
12
2,58
15
192
2014
-15r
619
312
156
61
2574
91
5
479
3
8
2,41
38
159
2015
-16p
602
613
764
41
2380
01
4
536
-
18
2,58
28
182
Not
ep
- pro
visi
onal
r - re
vise
d
Tota
l Acc
iden
tal P
rimar
y Fi
res
Dw
ellin
gs -
Del
iber
ate
Oth
er B
uild
ings
- D
elib
erat
eR
oad
Vehi
cles
- D
elib
erat
eO
ther
s - D
elib
erat
eTo
tal D
elib
erat
e Pr
imar
y Fi
res
1 - F
igur
es fo
r prim
ary
fires
prio
r to
2009
-10
are
base
d on
sam
ple
data
wei
ghte
d to
(for
mer
) Fire
and
Res
cue
Serv
ice
tota
ls2
- Non
-fata
l cas
ualty
dat
a fro
m 2
009-
10 o
nwar
ds c
anno
t be
com
pare
d to
pre
viou
s ye
ars
due
to a
cha
nge
in th
e re
cord
ing
of n
on-fa
tal c
asua
lties
- se
e N
otes
on
Sta
tistic
s fo
r det
ails
Tabl
e 11
: Prim
ary
fires
by
loca
tion
and
mot
ive
of fi
re, 2
006-
07 to
201
5-16
, Sco
tland
Dw
ellin
gs -
Acci
dent
alO
ther
Bui
ldin
gs -
Acci
dent
alR
oad
Vehi
cles
- Ac
cide
ntal
Oth
er -
Acci
dent
al
111
50
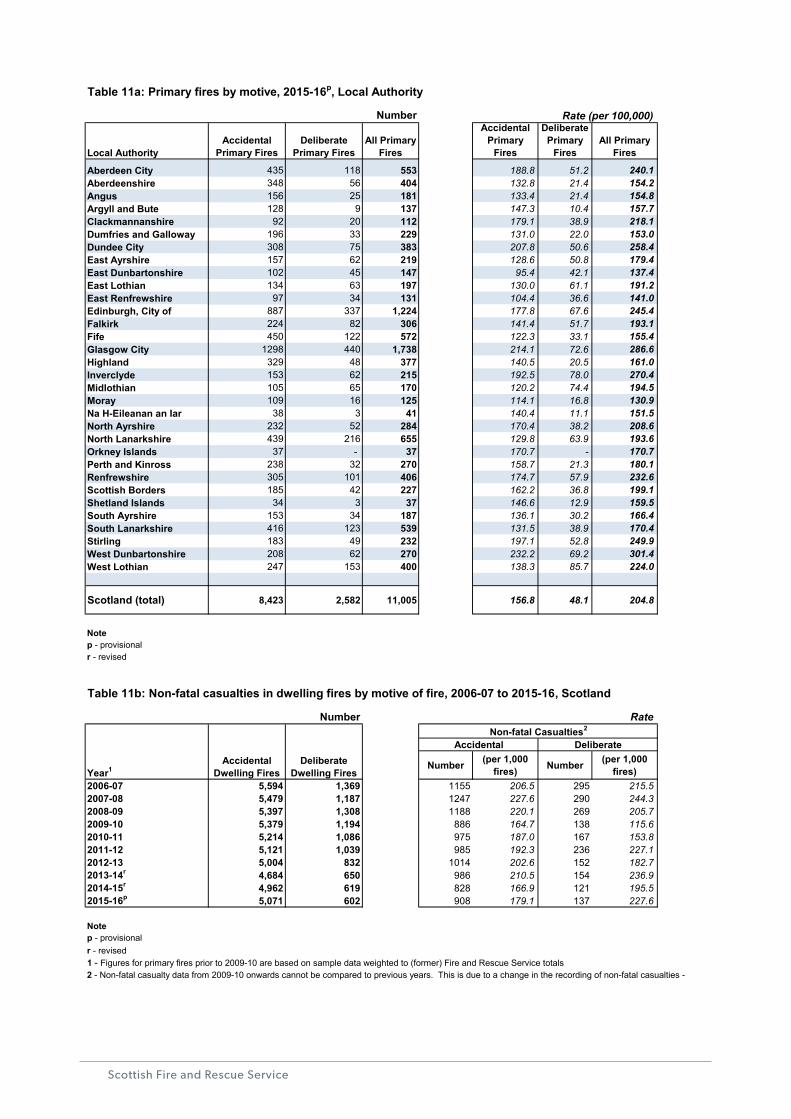
Scottish Fire and Rescue Service
Number
Local AuthorityAccidental
Primary FiresDeliberate
Primary FiresAll Primary
Fires
Accidental Primary
Fires
Deliberate Primary
FiresAll Primary
Fires
Aberdeen City 435 118 553 188.8 51.2 240.1 Aberdeenshire 348 56 404 132.8 21.4 154.2 Angus 156 25 181 133.4 21.4 154.8 Argyll and Bute 128 9 137 147.3 10.4 157.7 Clackmannanshire 92 20 112 179.1 38.9 218.1 Dumfries and Galloway 196 33 229 131.0 22.0 153.0 Dundee City 308 75 383 207.8 50.6 258.4 East Ayrshire 157 62 219 128.6 50.8 179.4 East Dunbartonshire 102 45 147 95.4 42.1 137.4 East Lothian 134 63 197 130.0 61.1 191.2 East Renfrewshire 97 34 131 104.4 36.6 141.0 Edinburgh, City of 887 337 1,224 177.8 67.6 245.4 Falkirk 224 82 306 141.4 51.7 193.1 Fife 450 122 572 122.3 33.1 155.4 Glasgow City 1298 440 1,738 214.1 72.6 286.6 Highland 329 48 377 140.5 20.5 161.0 Inverclyde 153 62 215 192.5 78.0 270.4 Midlothian 105 65 170 120.2 74.4 194.5 Moray 109 16 125 114.1 16.8 130.9 Na H-Eileanan an Iar 38 3 41 140.4 11.1 151.5 North Ayrshire 232 52 284 170.4 38.2 208.6 North Lanarkshire 439 216 655 129.8 63.9 193.6 Orkney Islands 37 - 37 170.7 - 170.7 Perth and Kinross 238 32 270 158.7 21.3 180.1 Renfrewshire 305 101 406 174.7 57.9 232.6 Scottish Borders 185 42 227 162.2 36.8 199.1 Shetland Islands 34 3 37 146.6 12.9 159.5 South Ayrshire 153 34 187 136.1 30.2 166.4 South Lanarkshire 416 123 539 131.5 38.9 170.4 Stirling 183 49 232 197.1 52.8 249.9 West Dunbartonshire 208 62 270 232.2 69.2 301.4 West Lothian 247 153 400 138.3 85.7 224.0
Scotland (total) 8,423 2,582 11,005 156.8 48.1 204.8
Notep - provisionalr - revised
Number Rate
Number (per 1,000 fires) Number (per 1,000
fires)2006-07 5,594 1,369 1155 206.5 295 215.52007-08 5,479 1,187 1247 227.6 290 244.32008-09 5,397 1,308 1188 220.1 269 205.72009-10 5,379 1,194 886 164.7 138 115.62010-11 5,214 1,086 975 187.0 167 153.82011-12 5,121 1,039 985 192.3 236 227.12012-13 5,004 832 1014 202.6 152 182.72013-14r 4,684 650 986 210.5 154 236.92014-15r 4,962 619 828 166.9 121 195.52015-16p 5,071 602 908 179.1 137 227.6
Notep - provisionalr - revised1 - Figures for primary fires prior to 2009-10 are based on sample data weighted to (former) Fire and Rescue Service totals2 - Non-fatal casualty data from 2009-10 onwards cannot be compared to previous years. This is due to a change in the recording of non-fatal casualties -
Table 11a: Primary fires by motive, 2015-16p, Local Authority
Rate (per 100,000)
Table 11b: Non-fatal casualties in dwelling fires by motive of fire, 2006-07 to 2015-16, Scotland
Year1Accidental
Dwelling FiresDeliberate
Dwelling Fires
Non-fatal Casualties2
Accidental Deliberate
1 11a 11b
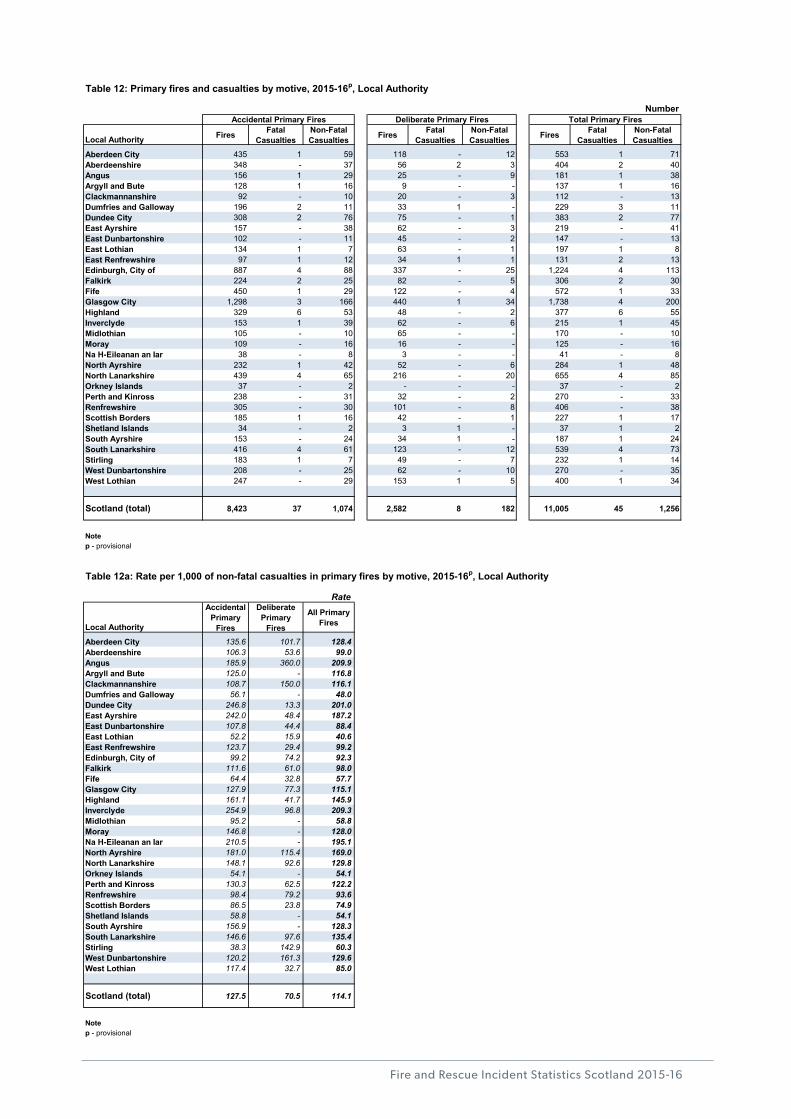
Fire and Rescue Incident Statistics Scotland 2015-16
Number
Local Authority Fires Fatal Casualties
Non-Fatal Casualties Fires Fatal
CasualtiesNon-Fatal Casualties Fires Fatal
CasualtiesNon-Fatal Casualties
Aberdeen City 435 1 59 118 - 12 553 1 71 Aberdeenshire 348 - 37 56 2 3 404 2 40 Angus 156 1 29 25 - 9 181 1 38 Argyll and Bute 128 1 16 9 - - 137 1 16 Clackmannanshire 92 - 10 20 - 3 112 - 13 Dumfries and Galloway 196 2 11 33 1 - 229 3 11 Dundee City 308 2 76 75 - 1 383 2 77 East Ayrshire 157 - 38 62 - 3 219 - 41 East Dunbartonshire 102 - 11 45 - 2 147 - 13 East Lothian 134 1 7 63 - 1 197 1 8 East Renfrewshire 97 1 12 34 1 1 131 2 13 Edinburgh, City of 887 4 88 337 - 25 1,224 4 113 Falkirk 224 2 25 82 - 5 306 2 30 Fife 450 1 29 122 - 4 572 1 33 Glasgow City 1,298 3 166 440 1 34 1,738 4 200 Highland 329 6 53 48 - 2 377 6 55 Inverclyde 153 1 39 62 - 6 215 1 45 Midlothian 105 - 10 65 - - 170 - 10 Moray 109 - 16 16 - - 125 - 16 Na H-Eileanan an Iar 38 - 8 3 - - 41 - 8 North Ayrshire 232 1 42 52 - 6 284 1 48 North Lanarkshire 439 4 65 216 - 20 655 4 85 Orkney Islands 37 - 2 - - - 37 - 2 Perth and Kinross 238 - 31 32 - 2 270 - 33 Renfrewshire 305 - 30 101 - 8 406 - 38 Scottish Borders 185 1 16 42 - 1 227 1 17 Shetland Islands 34 - 2 3 1 - 37 1 2 South Ayrshire 153 - 24 34 1 - 187 1 24 South Lanarkshire 416 4 61 123 - 12 539 4 73 Stirling 183 1 7 49 - 7 232 1 14 West Dunbartonshire 208 - 25 62 - 10 270 - 35 West Lothian 247 - 29 153 1 5 400 1 34
Scotland (total) 8,423 37 1,074 2,582 8 182 11,005 45 1,256
Notep - provisional
Rate
Local Authority
Accidental Primary
Fires
Deliberate Primary
Fires
All Primary Fires
Aberdeen City 135.6 101.7 128.4 Aberdeenshire 106.3 53.6 99.0 Angus 185.9 360.0 209.9 Argyll and Bute 125.0 - 116.8 Clackmannanshire 108.7 150.0 116.1 Dumfries and Galloway 56.1 - 48.0 Dundee City 246.8 13.3 201.0 East Ayrshire 242.0 48.4 187.2 East Dunbartonshire 107.8 44.4 88.4 East Lothian 52.2 15.9 40.6 East Renfrewshire 123.7 29.4 99.2 Edinburgh, City of 99.2 74.2 92.3 Falkirk 111.6 61.0 98.0 Fife 64.4 32.8 57.7 Glasgow City 127.9 77.3 115.1 Highland 161.1 41.7 145.9 Inverclyde 254.9 96.8 209.3 Midlothian 95.2 - 58.8 Moray 146.8 - 128.0 Na H-Eileanan an Iar 210.5 - 195.1 North Ayrshire 181.0 115.4 169.0 North Lanarkshire 148.1 92.6 129.8 Orkney Islands 54.1 - 54.1 Perth and Kinross 130.3 62.5 122.2 Renfrewshire 98.4 79.2 93.6 Scottish Borders 86.5 23.8 74.9 Shetland Islands 58.8 - 54.1 South Ayrshire 156.9 - 128.3 South Lanarkshire 146.6 97.6 135.4 Stirling 38.3 142.9 60.3 West Dunbartonshire 120.2 161.3 129.6 West Lothian 117.4 32.7 85.0
Scotland (total) 127.5 70.5 114.1
Notep - provisional
Table 12: Primary fires and casualties by motive, 2015-16p, Local Authority
Table 12a: Rate per 1,000 of non-fatal casualties in primary fires by motive, 2015-16p, Local Authority
Accidental Primary Fires Deliberate Primary Fires Total Primary Fires
1 12 12a
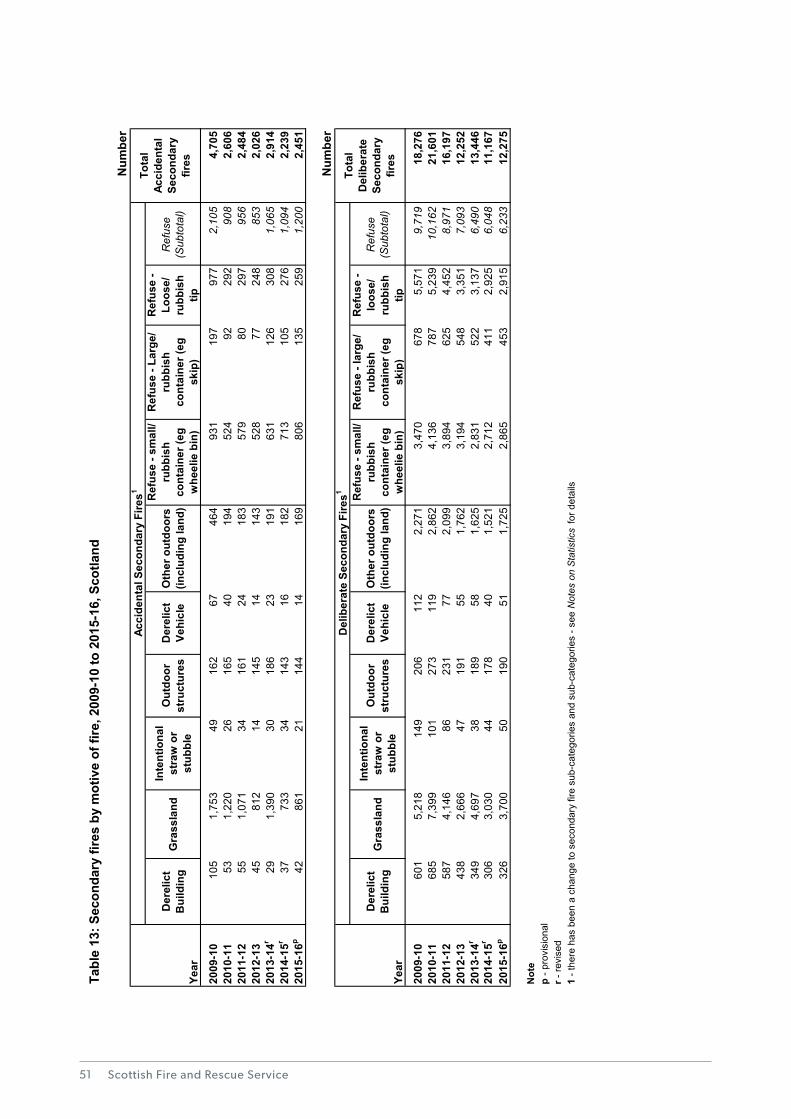
Scottish Fire and Rescue Service
Num
ber
Der
elic
t B
uild
ing
Gra
ssla
ndIn
tent
iona
l st
raw
or
stub
ble
Out
door
st
ruct
ures
Der
elic
t Ve
hicl
eO
ther
out
door
s (in
clud
ing
land
)
Ref
use
- sm
all/
rubb
ish
cont
aine
r (eg
w
heel
ie b
in)
Ref
use
- Lar
ge/
rubb
ish
cont
aine
r (eg
sk
ip)
Ref
use
- Lo
ose/
ru
bbis
h tip
Ref
use
(Sub
tota
l)
2009
-10
105
1,75
349
162
6746
493
119
797
72,
105
4,70
520
10-1
153
1,22
026
165
4019
452
492
292
908
2,60
620
11-1
255
1,07
134
161
2418
357
980
297
956
2,48
420
12-1
345
812
1414
514
143
528
7724
885
32,
026
2013
-14r
291,
390
3018
623
191
631
126
308
1,06
52,
914
2014
-15r
3773
334
143
1618
271
310
527
61,
094
2,23
920
15-1
6p42
861
2114
414
169
806
135
259
1,20
02,
451
Num
ber
Der
elic
t B
uild
ing
Gra
ssla
ndIn
tent
iona
l st
raw
or
stub
ble
Out
door
st
ruct
ures
Der
elic
t Ve
hicl
eO
ther
out
door
s (in
clud
ing
land
)
Ref
use
- sm
all/
rubb
ish
cont
aine
r (eg
w
heel
ie b
in)
Ref
use
- lar
ge/
rubb
ish
cont
aine
r (eg
sk
ip)
Ref
use
- lo
ose/
ru
bbis
h tip
Ref
use
(Sub
tota
l)
2009
-10
601
5,21
814
920
611
22,
271
3,47
067
85,
571
9,71
918
,276
2010
-11
685
7,39
910
127
311
92,
862
4,13
678
75,
239
10,1
6221
,601
2011
-12
587
4,14
686
231
772,
099
3,89
462
54,
452
8,97
116
,197
2012
-13
438
2,66
647
191
551,
762
3,19
454
83,
351
7,09
312
,252
2013
-14r
349
4,69
738
189
581,
625
2,83
152
23,
137
6,49
013
,446
2014
-15r
306
3,03
044
178
401,
521
2,71
241
12,
925
6,04
811
,167
2015
-16p
326
3,70
050
190
511,
725
2,86
545
32,
915
6,23
312
,275
Not
e
r - re
vise
d1
- the
re h
as b
een
a ch
ange
to s
econ
dary
fire
sub
-cat
egor
ies
and
sub-
cate
gorie
s - s
ee N
otes
on
Sta
tistic
s fo
r det
ails
p - p
rovi
sion
al
Tabl
e 13
: Sec
onda
ry fi
res
by m
otiv
e of
fire
, 200
9-10
to 2
015-
16, S
cotla
nd
Year
Acci
dent
al S
econ
dary
Fire
s1To
tal
Acci
dent
al
Seco
ndar
y fir
es
Del
iber
ate
Seco
ndar
y Fi
res1
Tota
l D
elib
erat
e Se
cond
ary
fires
Year
113
51
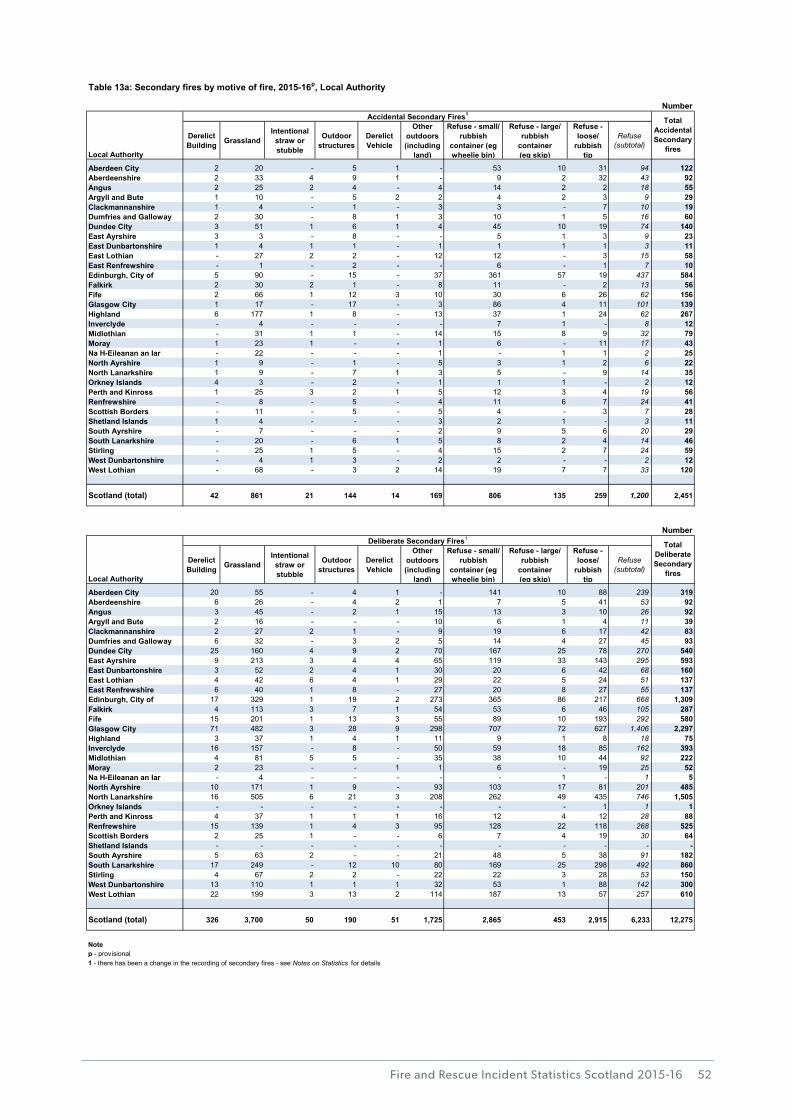
Fire and Rescue Incident Statistics Scotland 2015-16
Number
Derelict Building Grassland
Intentional straw or stubble
Outdoor structures
Derelict Vehicle
Other outdoors (including
land)
Refuse - small/ rubbish
container (eg wheelie bin)
Refuse - large/ rubbish
container (eg skip)
Refuse - loose/
rubbish tip
Refuse (subtotal)
Aberdeen City 2 20 - 5 1 - 53 10 31 94 122 Aberdeenshire 2 33 4 9 1 - 9 2 32 43 92 Angus 2 25 2 4 - 4 14 2 2 18 55 Argyll and Bute 1 10 - 5 2 2 4 2 3 9 29 Clackmannanshire 1 4 - 1 - 3 3 - 7 10 19 Dumfries and Galloway 2 30 - 8 1 3 10 1 5 16 60 Dundee City 3 51 1 6 1 4 45 10 19 74 140 East Ayrshire 3 3 - 8 - - 5 1 3 9 23 East Dunbartonshire 1 4 1 1 - 1 1 1 1 3 11 East Lothian - 27 2 2 - 12 12 - 3 15 58 East Renfrewshire - 1 - 2 - - 6 - 1 7 10 Edinburgh, City of 5 90 - 15 - 37 361 57 19 437 584 Falkirk 2 30 2 1 - 8 11 - 2 13 56 Fife 2 66 1 12 3 10 30 6 26 62 156 Glasgow City 1 17 - 17 - 3 86 4 11 101 139 Highland 6 177 1 8 - 13 37 1 24 62 267 Inverclyde - 4 - - - - 7 1 - 8 12 Midlothian - 31 1 1 - 14 15 8 9 32 79 Moray 1 23 1 - - 1 6 - 11 17 43 Na H-Eileanan an Iar - 22 - - - 1 - 1 1 2 25 North Ayrshire 1 9 - 1 - 5 3 1 2 6 22 North Lanarkshire 1 9 - 7 1 3 5 - 9 14 35 Orkney Islands 4 3 - 2 - 1 1 1 - 2 12 Perth and Kinross 1 25 3 2 1 5 12 3 4 19 56 Renfrewshire - 8 - 5 - 4 11 6 7 24 41 Scottish Borders - 11 - 5 - 5 4 - 3 7 28 Shetland Islands 1 4 - - - 3 2 1 - 3 11 South Ayrshire - 7 - - - 2 9 5 6 20 29 South Lanarkshire - 20 - 6 1 5 8 2 4 14 46 Stirling - 25 1 5 - 4 15 2 7 24 59 West Dunbartonshire - 4 1 3 - 2 2 - - 2 12 West Lothian - 68 - 3 2 14 19 7 7 33 120
Scotland (total) 42 861 21 144 14 169 806 135 259 1,200 2,451
Number
Derelict Building Grassland
Intentional straw or stubble
Outdoor structures
Derelict Vehicle
Other outdoors (including
land)
Refuse - small/ rubbish
container (eg wheelie bin)
Refuse - large/ rubbish
container(eg skip)
Refuse - loose/
rubbish tip
Refuse (subtotal)
Aberdeen City 20 55 - 4 1 - 141 10 88 239 319 Aberdeenshire 6 26 - 4 2 1 7 5 41 53 92 Angus 3 45 - 2 1 15 13 3 10 26 92 Argyll and Bute 2 16 - - - 10 6 1 4 11 39 Clackmannanshire 2 27 2 1 - 9 19 6 17 42 83 Dumfries and Galloway 6 32 - 3 2 5 14 4 27 45 93 Dundee City 25 160 4 9 2 70 167 25 78 270 540 East Ayrshire 9 213 3 4 4 65 119 33 143 295 593 East Dunbartonshire 3 52 2 4 1 30 20 6 42 68 160 East Lothian 4 42 6 4 1 29 22 5 24 51 137 East Renfrewshire 6 40 1 8 - 27 20 8 27 55 137 Edinburgh, City of 17 329 1 19 2 273 365 86 217 668 1,309 Falkirk 4 113 3 7 1 54 53 6 46 105 287 Fife 15 201 1 13 3 55 89 10 193 292 580 Glasgow City 71 482 3 28 9 298 707 72 627 1,406 2,297 Highland 3 37 1 4 1 11 9 1 8 18 75 Inverclyde 16 157 - 8 - 50 59 18 85 162 393 Midlothian 4 81 5 5 - 35 38 10 44 92 222 Moray 2 23 - - 1 1 6 - 19 25 52 Na H-Eileanan an Iar - 4 - - - - - 1 - 1 5 North Ayrshire 10 171 1 9 - 93 103 17 81 201 485 North Lanarkshire 16 505 6 21 3 208 262 49 435 746 1,505 Orkney Islands - - - - - - - - 1 1 1 Perth and Kinross 4 37 1 1 1 16 12 4 12 28 88 Renfrewshire 15 139 1 4 3 95 128 22 118 268 525 Scottish Borders 2 25 1 - - 6 7 4 19 30 64 Shetland Islands - - - - - - - - - - - South Ayrshire 5 63 2 - - 21 48 5 38 91 182 South Lanarkshire 17 249 - 12 10 80 169 25 298 492 860 Stirling 4 67 2 2 - 22 22 3 28 53 150 West Dunbartonshire 13 110 1 1 1 32 53 1 88 142 300 West Lothian 22 199 3 13 2 114 187 13 57 257 610
Scotland (total) 326 3,700 50 190 51 1,725 2,865 453 2,915 6,233 12,275
Notep - provisional1 - there has been a change in the recording of secondary fires - see Notes on Statistics for details
Table 13a: Secondary fires by motive of fire, 2015-16p, Local Authority
Local Authority
Accidental Secondary Fires1Total
Accidental Secondary
fires
Local Authority
Deliberate Secondary Fires1Total
Deliberate Secondary
fires
1 13a52
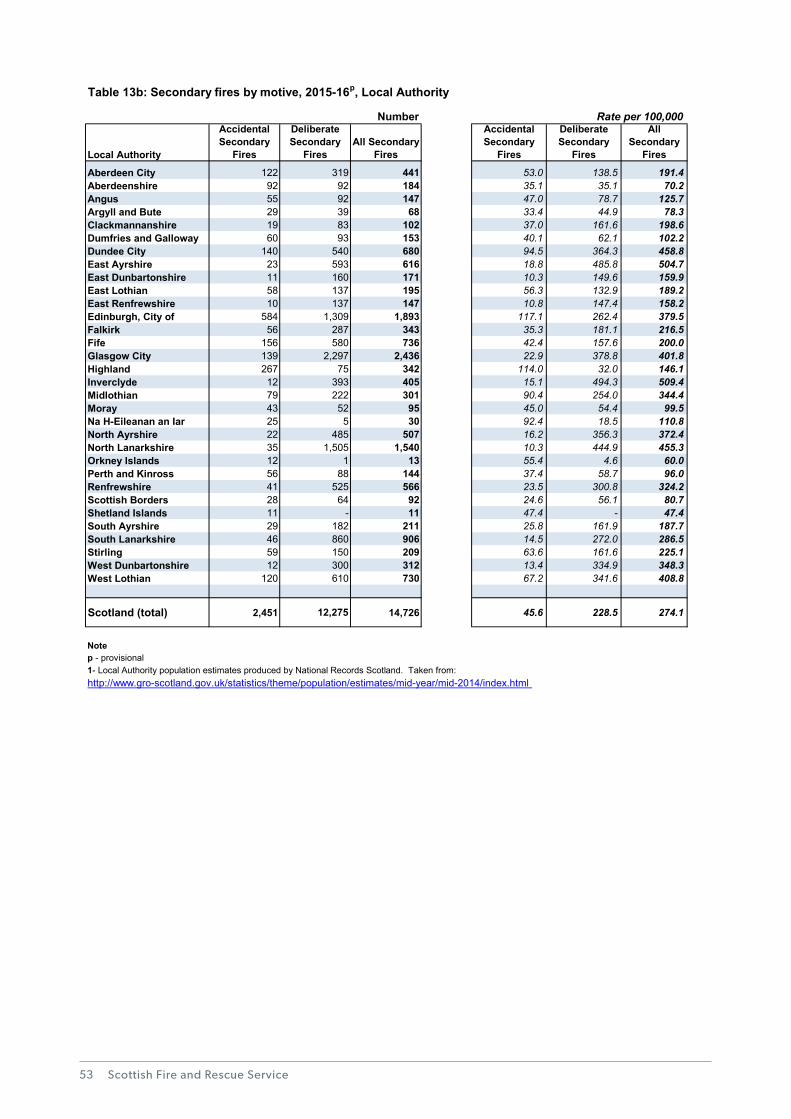
Scottish Fire and Rescue Service
Number
Local Authority
Accidental Secondary
Fires
Deliberate Secondary
FiresAll Secondary
Fires
Accidental Secondary
Fires
Deliberate Secondary
Fires
All Secondary
Fires
Aberdeen City 122 319 441 53.0 138.5 191.4 Aberdeenshire 92 92 184 35.1 35.1 70.2 Angus 55 92 147 47.0 78.7 125.7 Argyll and Bute 29 39 68 33.4 44.9 78.3 Clackmannanshire 19 83 102 37.0 161.6 198.6 Dumfries and Galloway 60 93 153 40.1 62.1 102.2 Dundee City 140 540 680 94.5 364.3 458.8 East Ayrshire 23 593 616 18.8 485.8 504.7 East Dunbartonshire 11 160 171 10.3 149.6 159.9 East Lothian 58 137 195 56.3 132.9 189.2 East Renfrewshire 10 137 147 10.8 147.4 158.2 Edinburgh, City of 584 1,309 1,893 117.1 262.4 379.5 Falkirk 56 287 343 35.3 181.1 216.5 Fife 156 580 736 42.4 157.6 200.0 Glasgow City 139 2,297 2,436 22.9 378.8 401.8 Highland 267 75 342 114.0 32.0 146.1 Inverclyde 12 393 405 15.1 494.3 509.4 Midlothian 79 222 301 90.4 254.0 344.4 Moray 43 52 95 45.0 54.4 99.5 Na H-Eileanan an Iar 25 5 30 92.4 18.5 110.8 North Ayrshire 22 485 507 16.2 356.3 372.4 North Lanarkshire 35 1,505 1,540 10.3 444.9 455.3 Orkney Islands 12 1 13 55.4 4.6 60.0 Perth and Kinross 56 88 144 37.4 58.7 96.0 Renfrewshire 41 525 566 23.5 300.8 324.2 Scottish Borders 28 64 92 24.6 56.1 80.7 Shetland Islands 11 - 11 47.4 - 47.4 South Ayrshire 29 182 211 25.8 161.9 187.7 South Lanarkshire 46 860 906 14.5 272.0 286.5 Stirling 59 150 209 63.6 161.6 225.1 West Dunbartonshire 12 300 312 13.4 334.9 348.3 West Lothian 120 610 730 67.2 341.6 408.8
Scotland (total) 2,451 12,275 14,726 45.6 228.5 274.1
Notep - provisional
http://www.gro-scotland.gov.uk/statistics/theme/population/estimates/mid-year/mid-2014/index.html
Table 13b: Secondary fires by motive, 2015-16p, Local Authority
Rate per 100,000
1- Local Authority population estimates produced by National Records Scotland. Taken from:
1 13b53
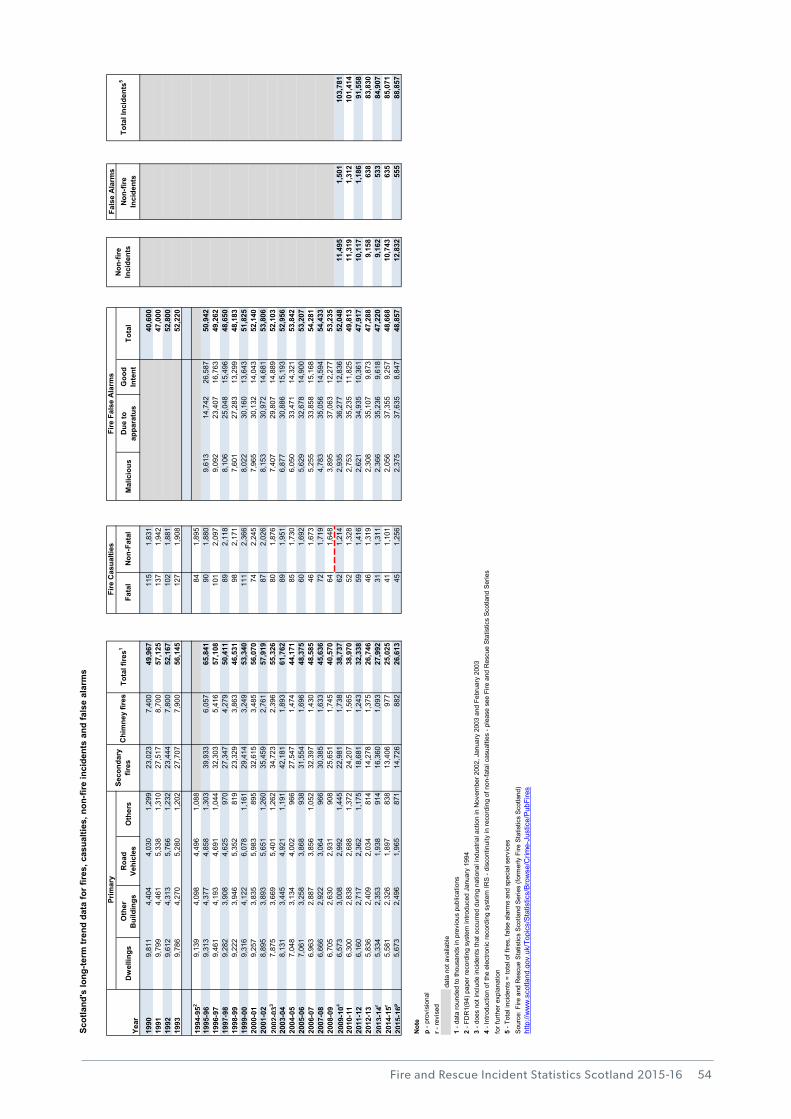
Fire and Rescue Incident Statistics Scotland 2015-16
Fals
e A
larm
s
Dw
ellin
gsO
ther
B
uild
ings
Roa
d Ve
hicl
esO
ther
sFa
tal
Non
-Fat
alM
alic
ious
Due
to
appa
ratu
sG
ood
Inte
ntTo
tal
Non
-fire
In
cide
nts
1990
9,81
14,
404
4,03
01,
299
23,0
237,
400
49,9
6711
51,
831
40,6
0019
919,
799
4,46
15,
338
1,31
027
,517
8,70
057
,125
137
1,94
247
,000
1992
9,61
24,
313
5,76
61,
232
23,4
447,
800
52,1
6710
21,
881
52,8
0019
939,
786
4,27
05,
280
1,20
227
,707
7,90
056
,145
127
1,90
852
,220
1994
-952
9,13
94,
098
4,49
61,
088
841,
895
1995
-96
9,31
34,
377
4,85
81,
303
39,9
336,
057
65,8
4190
1,88
09,
613
14,7
4226
,587
50,9
4219
96-9
79,
461
4,19
34,
691
1,04
432
,303
5,41
657
,108
101
2,09
79,
092
23,4
0716
,763
49,2
6219
97-9
89,
282
3,90
84,
625
970
27,3
474,
279
50,4
1189
2,11
88,
106
25,0
4815
,496
48,6
5019
98-9
99,
222
3,94
65,
352
819
23,3
293,
863
46,5
3198
2,17
17,
601
27,2
8313
,299
48,1
8319
99-0
09,
316
4,12
26,
078
1,16
129
,414
3,24
953
,340
111
2,36
68,
022
30,1
6013
,643
51,8
2520
00-0
19,
257
3,83
55,
983
895
32,6
153,
485
56,0
7074
2,24
57,
965
30,1
3214
,043
52,1
4020
01-0
28,
895
3,89
35,
651
1,26
035
,459
2,76
157
,919
872,
026
8,15
330
,972
14,6
8153
,806
2002
-033
7,87
53,
669
5,40
11,
262
34,7
232,
396
55,3
2680
1,87
67,
407
29,8
0714
,889
52,1
0320
03-0
48,
131
3,44
54,
921
1,19
142
,181
1,89
361
,762
891,
951
6,87
730
,886
15,1
9352
,956
2004
-05
7,04
83,
134
4,00
296
627
,547
1,47
444
,171
851,
730
6,05
033
,471
14,3
2153
,842
2005
-06
7,06
13,
258
3,86
893
831
,554
1,69
648
,375
601,
692
5,62
932
,678
14,9
0053
,207
2006
-07
6,96
32,
887
3,85
61,
052
32,3
971,
430
48,5
8546
1,67
35,
255
33,8
5815
,168
54,2
8120
07-0
86,
666
2,92
23,
064
966
30,3
851,
633
45,6
3672
1,71
94,
783
35,0
5614
,594
54,4
3320
08-0
96,
705
2,63
02,
931
908
25,6
511,
745
40,5
7064
1,64
83,
895
37,0
6312
,277
53,2
3520
09-1
046,
573
3,00
82,
992
1,44
522
,981
1,73
838
,737
621,
214
2,93
536
,277
12,8
3652
,048
11,4
951,
501
103,
781
2010
-11
6,30
02,
838
2,68
81,
372
24,2
071,
565
38,9
7052
1,32
82,
753
35,2
3511
,825
49,8
1311
,319
1,31
210
1,41
420
11-1
26,
160
2,71
72,
362
1,17
518
,681
1,24
332
,338
591,
416
2,62
134
,935
10,3
6147
,917
10,1
171,
186
91,5
5820
12-1
35,
836
2,40
92,
034
814
14,2
781,
375
26,7
4646
1,31
92,
308
35,1
079,
873
47,2
889,
158
638
83,8
3020
13-1
4r5,
334
2,35
31,
938
914
16,3
601,
093
27,9
9231
1,31
12,
366
35,2
369,
618
47,2
209,
162
533
84,9
0720
14-1
5r5,
581
2,32
61,
897
838
13,4
0697
725
,025
411,
101
2,05
637
,355
9,25
748
,668
10,7
4363
585
,071
2015
-16p
5,67
32,
496
1,96
587
114
,726
882
26,6
1345
1,25
62,
375
37,6
358,
847
48,8
5712
,832
555
88,8
57
Not
ep
- pro
visi
onal
r - re
vise
dda
ta n
ot a
vaila
ble
1 - d
ata
roun
ded
to th
ousa
nds
in p
revi
ous
publ
icat
ions
2 - F
DR
1(94
) pap
er re
cord
ing
syst
em in
trodu
ced
Janu
ary
1994
3 - d
oes
not i
nclu
de in
cide
nts
that
occ
urre
d du
ring
natio
nal i
ndus
trial
act
ion
in N
ovem
ber 2
002,
Jan
uary
200
3 an
d Fe
brua
ry 2
003
4 - I
ntro
duct
ion
of th
e el
ectro
nic
reco
rdin
g sy
stem
IRS
- di
scon
tinui
ty in
reco
rdin
g of
non
-fata
l cas
ualti
es -
plea
se s
ee F
ire a
nd R
escu
e S
tatis
tics
Sco
tland
Ser
ies
for f
urth
er e
xpla
natio
n5
- Tot
al in
cide
nts
= to
tal o
f fire
s, fa
lse
alar
ms
and
spec
ial s
ervi
ces
Sou
rce:
Fire
and
Res
cue
Sta
tistic
s S
cotla
nd S
erie
s (fo
rmer
ly F
ire S
tatis
tics
Sco
tland
)ht
tp://
ww
w.s
cotla
nd.g
ov.u
k/To
pics
/Sta
tistic
s/Br
owse
/Crim
e-Ju
stic
e/Pu
bFire
s
Non
-fire
In
cide
nts
Tota
l Inc
iden
ts5
Prim
ary
Fire
Cas
ualti
esFi
re F
alse
Ala
rms
Scot
land
's lo
ng-te
rm tr
end
data
for f
ires,
cas
ualti
es, n
on-fi
re in
cide
nts
and
fals
e al
arm
s
Year
Tota
l fire
s1C
him
ney
fires
Seco
ndar
y fir
es
1Lo
ng-te
rm T
rend
s
54
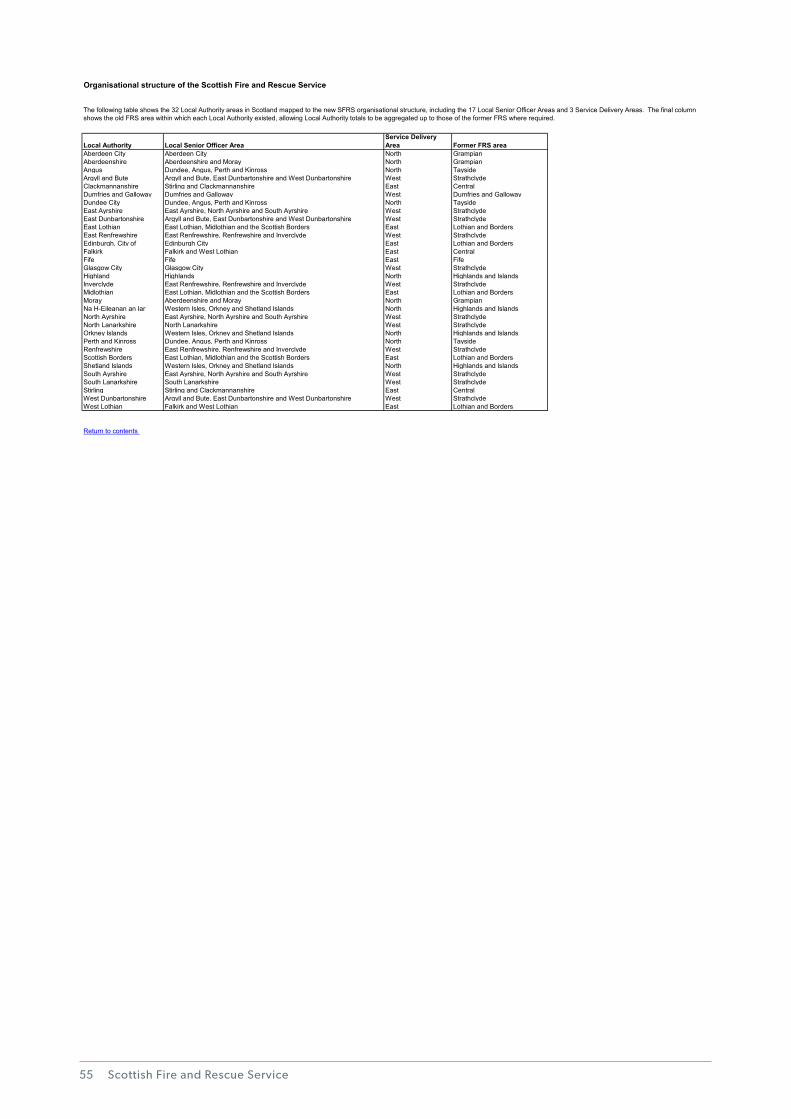
Scottish Fire and Rescue Service
Local Authority Local Senior Officer AreaService Delivery Area Former FRS area
Aberdeen City Aberdeen City North GrampianAberdeenshire Aberdeenshire and Moray North GrampianAngus Dundee, Angus, Perth and Kinross North TaysideArgyll and Bute Argyll and Bute, East Dunbartonshire and West Dunbartonshire West StrathclydeClackmannanshire Stirling and Clackmannanshire East CentralDumfries and Galloway Dumfries and Galloway West Dumfries and GallowayDundee City Dundee, Angus, Perth and Kinross North TaysideEast Ayrshire East Ayrshire, North Ayrshire and South Ayrshire West StrathclydeEast Dunbartonshire Argyll and Bute, East Dunbartonshire and West Dunbartonshire West StrathclydeEast Lothian East Lothian, Midlothian and the Scottish Borders East Lothian and BordersEast Renfrewshire East Renfrewshire, Renfrewshire and Inverclyde West StrathclydeEdinburgh, City of Edinburgh City East Lothian and BordersFalkirk Falkirk and West Lothian East CentralFife Fife East FifeGlasgow City Glasgow City West StrathclydeHighland Highlands North Highlands and IslandsInverclyde East Renfrewshire, Renfrewshire and Inverclyde West StrathclydeMidlothian East Lothian, Midlothian and the Scottish Borders East Lothian and BordersMoray Aberdeenshire and Moray North GrampianNa H-Eileanan an Iar Western Isles, Orkney and Shetland Islands North Highlands and IslandsNorth Ayrshire East Ayrshire, North Ayrshire and South Ayrshire West StrathclydeNorth Lanarkshire North Lanarkshire West StrathclydeOrkney Islands Western Isles, Orkney and Shetland Islands North Highlands and IslandsPerth and Kinross Dundee, Angus, Perth and Kinross North TaysideRenfrewshire East Renfrewshire, Renfrewshire and Inverclyde West StrathclydeScottish Borders East Lothian, Midlothian and the Scottish Borders East Lothian and BordersShetland Islands Western Isles, Orkney and Shetland Islands North Highlands and IslandsSouth Ayrshire East Ayrshire, North Ayrshire and South Ayrshire West StrathclydeSouth Lanarkshire South Lanarkshire West StrathclydeStirling Stirling and Clackmannanshire East CentralWest Dunbartonshire Argyll and Bute, East Dunbartonshire and West Dunbartonshire West StrathclydeWest Lothian Falkirk and West Lothian East Lothian and Borders
Return to contents
The following table shows the 32 Local Authority areas in Scotland mapped to the new SFRS organisational structure, including the 17 Local Senior Officer Areas and 3 Service Delivery Areas. The final column shows the old FRS area within which each Local Authority existed, allowing Local Authority totals to be aggregated up to those of the former FRS where required.
Organisational structure of the Scottish Fire and Rescue Service
1 SFRS Organisational Structure
55
Fire and Rescue Incident Statistics Scotland 2015-16
8. Correspondence and enquiries
For enquiries about this publication please contact:
Scottish Fire and Rescue Servicee-mail: [email protected]
How to access background or source data
The data presented in this statistical bulletin is available in Excel datasets on http://www.firescotland.gov.uk/about-us/fire-and-rescue-statistics.aspx. The datasets contain many more tables than are included in the bulletin.
Specific data may be made available on request, subject to consideration of legal and ethical factors. Please contact us using the email address above for further information.
If you would like to be consulted about statistical collections or receive notification of publications, please register your interest on the ScotStat system at www.scotland.gov.uk/scotstat.
56

SFRS Incident Statistics 2015-16 Draft Version 0.3 13 October 2016
www.firescotland.gov.uk