Embed Size (px)
Citation preview
Fire statistics
Great Britain, 2011 to 2012
December 2012 Department for Communities and Local Government

© Crown copyright, 2012 Copyright in the typographical arrangement rests with the Crown. You may re-use this information (not including logos) free of charge in any format or medium, under the terms of the Open Government Licence. To view this licence, visit www.nationalarchives.gov.uk/doc/open-government-licence/ or write to the Information Policy Team, The National Archives, Kew, London TW9 4DU, or email: [email protected]. This document/publication is also available on our website at www.gov.uk/dclg If you have any enquiries regarding this document/publication, email [email protected] or write to us at: Department for Communities and Local Government Eland House Bressenden Place London SW1E 5DU Telephone: 030 3444 0000 December 2012 ISBN: 978-1-4098-3742-8
3
Contents
KEY POINTS 2011-12 10
INTRODUCTION 12
CHAPTER 1 – SUMMARY 13
Total number of fires and false alarms attended by fire and rescue authorities 13
Causes of fires 16 Interpretation of trends in accidental and deliberate fires 16
Accidental fires (Table 1.2, Figure 1.2) 17
Deliberate fires (Tables 1.2 and 14 and Figure 1.3) 18
Fatalities from fires (Table 6, 17a, 26 and Figure 1.4) 19 Location (Tables 6 and 26, Figure 1.5) 20 Cause of death (Table 7, Figure 1.6) 21 Fatality rates by age and gender (Tables 5b, 17a, 17b and 1.3) 22
Non-fatal casualties 23 Location (Table 6, Figure 1.7) 23 Severity of injury (Figure 1.8) 24 Nature of injury (Table 8, Figure 1.9) 24
Type of fires and country 26 Primary fires (Tables 5a and Figure 1.9) 26 Secondary fires (Table 5a) 26 Chimney fires (Tables 5a) 27
Fatalities casualties and rates by country and fire and rescue service area (Table 5b and Table 22a) 27
Non-fatal casualties and rates by country and rescue service area (Table 5b and Table 22b) 27
CHAPTER 2 - DWELLINGS 28
Introduction 28
Accidental fires 28 Cause of fire 28 Source of ignition 28 Casualties from accidental fires (Tables 10 and 11) 29
Fatalities by cause of fire (Figure 2.1 and Table 10) 29
Fatalities and rates by source of ignition of fire (Tables 2.1 and 11) 30
Non-fatal casualties and rates by source of ignition of fire (Tables 2.1 and 11) 31
Non-fatal casualties by cause of fire (Figure 2.2 and Table 10) 32
4
CASUALTIES BY ROOM OF ORIGIN OF FIRE (TABLES 2.2, 12A AND 12B) 33
SMOKE ALARM ANALYSIS (TABLES 2.3 TO 2.9 AND FIGURE 2.3) 34 Introduction 34 Smoke alarm presence, type and operation 37 Type of alarm (Table 2.5) 38 Discovery of fires (Table 2.6) 38 Smoke alarm failures (Tables 2.7 to 2.9) 39
DELIBERATE FIRES (TABLES 2, 24 AND 2.10) 43
CHAPTER 3 – OTHER BUILDINGS 44
Introduction 44
Accidental fires 44 Trends 44 Cause of fire 44 Source of ignition (Table 3) 45
Deliberate fires 45 Trends 45 Location 46 Non-fatal casualties and Location 46
Automatic smoke alarm analyses 47 Introduction 47 Automatic smoke alarm presence and operation 47
CHAPTER 4 – ROAD VEHICLE FIRES 50
Introduction 50
Casualties (Table 6 and 4.1) 50
CHAPTER 5 – OUTDOOR FIRES 52
Introduction 52
When fires occur 53
DEFINITIONS 54
EXPLANATORY NOTES 59
REVISIONS 62 Revisions in this release 62
5
List of Tables in Text Table 1.1: Fires by location and false alarm, 2000-01 to 2011-12 11
Table 1.2: Primary fires by cause and location of fire, 2000-01 to 2011-12 16
Table 1.3: Fatal casualties from fires by age and gender, 2006-07 to 2011-12 22
Table 2.1: Sources of ignition for accidental dwelling fires, with casualties, 2011-12 36
Table 2.2: Casualties in accidental dwelling fires by use of room where fire started, 2011-12 37
Table 2.3: Smoke alarm ownership, percentage of households, 1988-2008 38
Table 2.4: Fires and casualties from fires in dwellings by presence and operation of smoke alarms, 2006-07 to 2011-12 40
Table 2.5: Dwelling fires where a smoke alarm was present by type of alarm, 2006-07 to 2011-12 41
Table 2.6: Fires and casualties from fires in dwellings by smoke alarm presence and operation, and by percentage discovered in under 5 minutes, 2006-07 to 2011-12 42
Table 2.7: Smoke alarm failures in dwelling fires by type of alarm, 2006-07 to 2011-12 43
Table 2.8: Fires in dwellings with a smoke alarm where alarm did not operate by type of alarm and reason for failure, 2006-07 to 2011-12 44
Table 2.9: Fires in dwellings with a smoke alarm where alarm operated but did not raise the alarm by reason, 2006-07 to 2011-12 44
Table 2.10: Deliberate fires and casualties by location, 2010-11 and 2011-12 45
Table 3.1: Fires and casualties from fires in other buildings by presence and operation of fire alarms, 2006-07 to 2011-12 49
Table 3.2: Fires in other buildings with fire alarm where alarm did not operate by reason, 2006-07 to 2011-12 50
Table 3.3: Fires in other buildings with automatic fire alarm where alarm operated but did not raise the alarm by reason, 2006-07 to 2011-12 50
Table 4.1: Number of fatalities in fires in road vehicles, 2000-01 to 2011-12 55
Table 5.1: Primary and secondary outdoor fires by location, 2000-01 to 2011-12 56
Table 5.2: Daily rates of fires by month and location, 2011-12 57
6
List of Figures
Figure 1.1: Fires by location group and Chimney fires, 2000-01 to 2011-12 14
Figure 1.2: Accidental fires by location group, 2000-01 to 2011-12 18
Figure 1.3: Deliberate fires by location group, 2000-01 to 2011-12 20
Figure 1.4: Fatalities from fires, 2000-01 to 2011-12
Figure 1.5: Fatalities from fires by location group, 2000-01 to 2011-12 21
Figure 1.6: Fatalities by cause, 2011-12 23
Figure 1.7: Non-fatal casualties by location group, 2000-01 to 2011-12 24
Figure 1.8: Non-fatal casualties from fires by severity, 2000-01 to 2011-12 25
Figure 1.9: Non-fatal casualties from fires (excluding fire fighter casualties) by nature
of injuries, 2000-01 to 2011-12
Figure 1.10: Primary fires by country and location, 2011-12 28
Figure 2.1: Sources of ignition in accidental fires in dwellings, 2011-12 30
Figure 2.2: Fatalities from accidental dwelling fires by cause 2000-01 to 2011-12 32
Figure 2.3: Non-fatal casualties from accidental dwelling fires by cause, 2000-01 to 2011-12 35
Figure 2.4: Fires in dwellings by smoke alarm presence and operation, 2011-12 38
Figure 3.1: Building fires: deliberate fires as a percentage of all fires in each location category, 2011-12 47
Figure 3.2: Building fires: Non-fatal casualty rates per 1,000 fires in each location category, 2011-12 48
Figure 3.3: Fires in other buildings by automatic fire alarm presence and operation, 2011-12 49
Figure 4.1: Number of fatalities in road vehicle fires, 2000-01 to 2011-12 53
7
Detailed Tables Detail tables referred to in this document are available as separate downloadable files on the new website (where Department for Communities and Local Government recently moved their corporate site to) at
https://www.gov.uk/government/organisations/department-for-communities-and-local-government/series/fire-statistics-monitor
Time Series Tables
Table 1a: Fires by location, 2000-01 to 2011-12
Table 1b: Fires by location, detail for buildings, 2000-01 to 2011-12
Table 1c: Fires by location, detail for outdoor fires, 2000-01 to 2011-12
Table 2: Fires in dwellings and other buildings by cause, 2000-01 to 2011-12
Table 3: Accidental fires in dwellings and other buildings by source of
ignition, 2000-01 to 2011-12
Table 4: Fires in dwellings and other buildings by spread of fire, 2000-01 to 2011-12
Table 5a: Fires by location and country, 2000-01 to 2011-12
Table 5b: Casualties from fires by country, 2000-01 to 2011-12
Table 6: Casualties from fires by location group, 2000-01 to 2011-12
Table 7: Fatal casualties from fires by cause of death, 2000-01 to 2011-12
Table 8: Non-fatal casualties from fires (excluding firefighters) by nature of injury, 2000-01 to 2011-12
Table 9: Non-fatal firefighter casualties from fires by nature of injury, 2000-01 to 2011-12
Table 10: Casualties from fires in dwellings by cause, 2000-01 to 2011-12
Table 11: Casualties from accidental fires in dwellings by source of ignition, 2000-01 to 2011-12
Table 12a: Non-Fatal Casualties in accidental fires in dwellings by use of room & where fire started and location of casualty in relation to fire 2000-01 to 2011-12
Table 12b: Non-Fatal Casualties in accidental fires in dwellings by use of room & where fire started and location of casualty in relation to fire 2000-01 to 2011-12
Table 13: Casualties by severity of injury, 2011-12
Table 14: Deliberate primary fires and casualties in buildings by location, 2000-01 to 2011-12
Table 15: Discontinued – see Summary of responses to 2012 Fire Statistics User Survey
Table 16: Fires in road vehicles by cause and type of vehicle, 2000-01 to 2011-12
8
Annual Tables
Table 17a: Casualties from fires by age, gender and location, 2011-12
Table 17b: Casualties from fires by age and cause of death/nature of injury, 2011-12
Table 17c: Casualties from accidental dwelling fires by age and cause of death/nature
of injury, 2011-12
Table 18: Fires and casualties from fires in buildings by location and country, 2011-12
Table 19: Fires and casualties from fires in dwellings and other buildings by material
or item first ignited, 2011-12
Table 20: Fires and casualties from fires in dwellings and other buildings by material mainly responsible for the development of the fire, 2011-12
Table 21: Accidental fires in dwellings by source of ignition and cause, 2011-12
Table 21interactive (fires), 2009-10 to 2011-12 NEW
Table 21interactive (casualties), 2009-10 to 2011-12 NEW
Table 22: Casualties by fire and rescue service area and location group, 2011-12
Table 23: Discontinued – see Summary of responses to 2012 Fire Statistics User Survey
Table 24: Deliberate primary fires by fire and rescue service and location, 2011-12
Long Time Series Tables
Table 25: Fires by location and types, GB, 1981-82 to 2011-12
Table 26: Fatal casualties in fires by location, GB, 1981-82 to 2011-12
Table 27: Fires by location and types, England, 1981-82 to 2011-12
Table 28: Fatal casualties in fires by location, England, 1981-82 to 2011-12
9
Definitions 54
Explanatory Notes
Comparability of data under the Incident Recording System (IRS) and
its predecessor, the Fire Data Report system 59
Industrial action 60
Definitions: primary fires, secondary and chimney fires and false alarms 61
Data for primary fires 61
Fatalities 61
Survey of English Housing 61
Population data 62
Selection of samples of primary fires 62
Revisions 62
Uses of these data and data quality 63
Symbols 63
Links to other publications 64
Enquiries 65
10
Key Points 2011-12
NB: Headline data up to March 2012 is available at www.gov.uk/government/publications/fire-statistics-monitor-april-2011-to-march-2012
Overview • In 2011-12 fire and rescue authorities attended 585,000 fires or false alarms in Britain,
7% fewer than in 2011-12 (para 1.1).
• A total of 272,000 fires were attended, 6% fewer than in 2010-11. Around 71% were outdoor fires (193,000), e.g. road vehicles, refuse, grassland. A total of 44,000 (16%) were fires in dwellings (para 1.1, 1.2 & 5.1).
• The total number of accidental dwelling fires fell by 3% to 37,600 in 2011-12 (para 1.7).
Fatalities from fires
• In 2011-12, there were 380 fire-related fatalities in Britain, 24 fewer than in 2010-11 and lower than in any year in the last fifty years. The highest number of fatalities recorded was 967 in 1985-86. Through the 1990s and 2000s there was a general downward trend. (para 1.10).
• Three quarters (76%) of fire-related fatalities occurred in dwelling fires (para 1.11). Fire fatality rates are notably higher for people aged 80+ and for males, and in Scotland (para 1.14 & 1.25).
• Being overcome by gas, smoke or toxic fumes was partly or wholly the cause of death in over half (53%) of all fire fatalities.
Non-fatal casualties
• There were 11,300 non-fatal casualties in fires in Britain in 2011-12, 32 per cent lower than in 2000/01. The number was similar to that recorded in 2011-12 and lower than any other year except 2009-10. (para 1.15).
Dwelling Fires
• There were 43,500 dwelling fires in Britain in 2011-12, 3% lower than in 2010-11. Most dwelling fires were accidental (86%), 37,600 fires (paras 2.1 & 2.2).
Accidental dwelling fires
• The main cause of accidental dwelling fires remained the misuse of equipment/appliances (14,700 fires), while the main source of ignition was cooking appliances which accounted for more than half of all accidental dwelling fires) (paras 2.3 & 2.5).
11
Fatalities in dwelling fires
• Of the 287 fatalities in dwellings in 2011-12, 244 (85%) were of accidental causes. The main cause was careless handling of fire or hot substances (e.g. careless disposal of cigarettes), amounting to 35% of all fatalities due to accidental causes (para 2.7 & 2.8). The highest fatality rate is for fires which started in the living or dining room (para 2.21).
Non-fatal casualties in dwelling fires
• Of the 11,300 non-fatal casualties in dwellings, the largest cause of injury in accidental dwelling fires was the misuse of equipment and appliances (2,600 injuries) (para 2.14 & 2.15).
Smoke alarms status in dwelling fires
• No smoke alarm was present in 14,800 (34%) dwelling fires (para 2.26). A smoke alarm was present but did not operate in 18% of dwelling fires.
• Smoke alarm ownership increased rapidly from 8% in 1988 to 70% in 1994, and has continued to rise in recent years to 86% in 2008 (para 2.27).
Other Building Fires
• In 2011-12 there were 24,100 fires recorded in buildings other than dwellings, 4% fewer than in 2010-11. Of these, 70% were accidental compared to 86% of those in dwellings (para 3.1 & 3.3).
• Twenty five people died and there were 1,200 non-fatal casualties in fires in buildings other than dwellings. (para 3.2 & 3.8).
Road Vehicle Fires
• There were 28,000 road vehicle fires in 2011-12 – 14% fewer than 2010-11. This was the lowest in more than a decade and 75 per cent lower than its peak in 2001/02 (para 4.1).
12
The statistics in this publication are compiled from Fire and Rescue Service records of incidents attended by fire and rescue authorities across Great Britain1.
This publication contains detailed analysis of fires, casualties and their causes for 2011-12. Headline data for 2011-12 was published in July 2012 in the Fire Statistics Monitor series.
This is the second edition of this publication using data since the new Incident Recording System was adopted. Incomplete records from one Fire and Rescue Authority meant that it was not possible to produce some more detailed statistics for 2009-10. The notes and definitions section at the rear of the publication provide definitions and context, including signposting to some changes to the detailed categories which will feed into statistics from the 2012-13 edition of this publication. The impact on data tables is expected to be very minor, but these are nevertheless flagged up for information at the end of the definitions section.
This publication follows the content and order of previous editions as far as possible in order to be consistent for those familiar with previous editions. Following a critical review of all of the content of the publication, which had changed little over the past 15 years, some sections of the commentary and six annex tables have been discontinued, and new interactive tables showing numbers of fires and casualties by source of ignition has been introduced. The review involved a detailed user survey to which 22 users responded. The views expressed by users have been written up in the document ‘Summary of responses to the 2012 Fire Statistics User Survey’ which can be found on the Department’s website. This notes that many of the other comments from users are being addressed by access to incident records being delivered. We are keen to hear from users to broaden our knowledge of all the various uses to which these statistics are out, and as to what other analyses would be valuable in the future. Please see the user interests form which can be downloaded from https://www.gov.uk/government/publications/fire-statistics.
Responsible statistician Gavin Sayer 0303 444 2818
1 Until 2008, this was a UK publication. Since then it has covered Great Britain. This is because the new Incident Recording System with electronic data capture and transfer was adopted by Fire and Rescue Authorities across Great Britain in 2009.
Introduction
13
Chapter 1 – Summary
Total number of fires and false alarms attended by fire and rescue authorities (Tables 1.1, 1.2 and Figure 1.1)
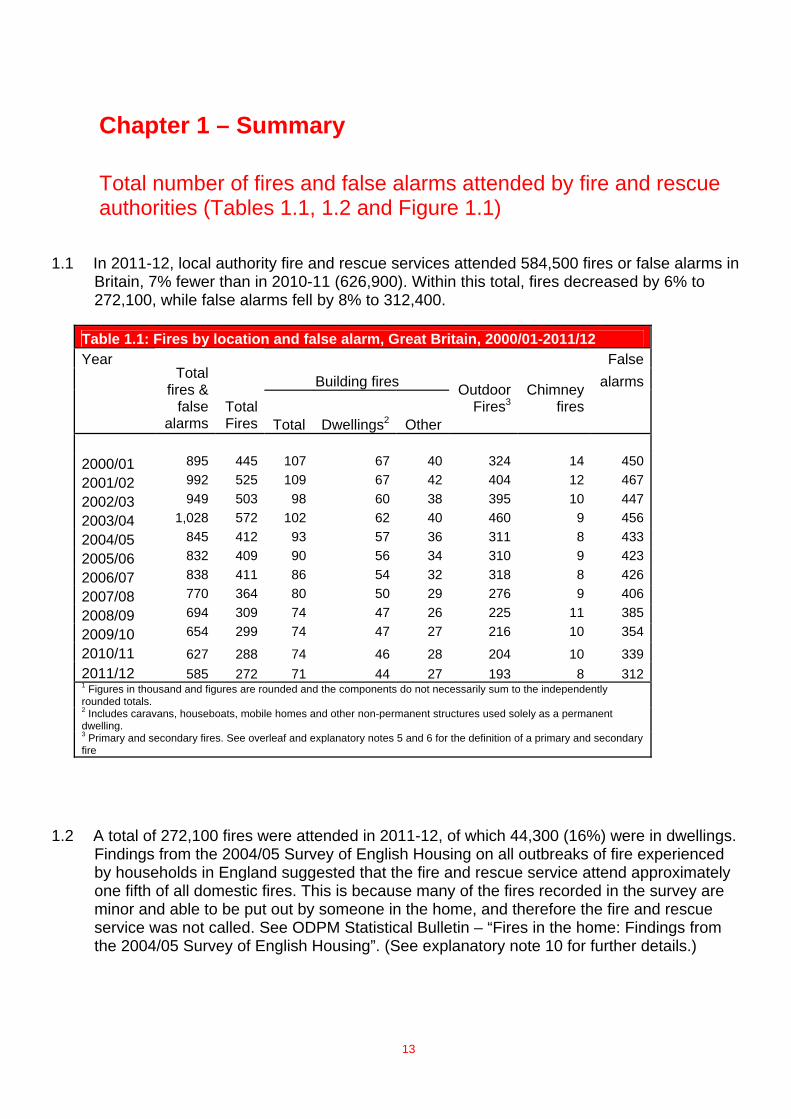
1.1 In 2011-12, local authority fire and rescue services attended 584,500 fires or false alarms in
Britain, 7% fewer than in 2010-11 (626,900). Within this total, fires decreased by 6% to 272,100, while false alarms fell by 8% to 312,400.
Table 1.1: Fires by location and false alarm, Great Britain, 2000/01-2011/12 Year False Building fires alarms
Total fires &
false alarms
Total Fires Total Dwellings2 Other
Outdoor Fires3
.
Chimney fires
. 2000/01 895 445 107 67 40 324 14 450
2001/02 992 525 109 67 42 404 12 467
2002/03 949 503 98 60 38 395 10 447
2003/04 1,028 572 102 62 40 460 9 456
2004/05 845 412 93 57 36 311 8 433
2005/06 832 409 90 56 34 310 9 423
2006/07 838 411 86 54 32 318 8 426
2007/08 770 364 80 50 29 276 9 406
2008/09 694 309 74 47 26 225 11 385
2009/10 654 299 74 47 27 216 10 354
2010/11 627 288 74 46 28 204 10 339 2011/12 585 272 71 44 27 193 8 312 1 Figures in thousand and figures are rounded and the components do not necessarily sum to the independently rounded totals. 2 Includes caravans, houseboats, mobile homes and other non-permanent structures used solely as a permanent dwelling. 3 Primary and secondary fires. See overleaf and explanatory notes 5 and 6 for the definition of a primary and secondary fire
1.2 A total of 272,100 fires were attended in 2011-12, of which 44,300 (16%) were in dwellings. Findings from the 2004/05 Survey of English Housing on all outbreaks of fire experienced by households in England suggested that the fire and rescue service attend approximately one fifth of all domestic fires. This is because many of the fires recorded in the survey are minor and able to be put out by someone in the home, and therefore the fire and rescue service was not called. See ODPM Statistical Bulletin – “Fires in the home: Findings from the 2004/05 Survey of English Housing”. (See explanatory note 10 for further details.)
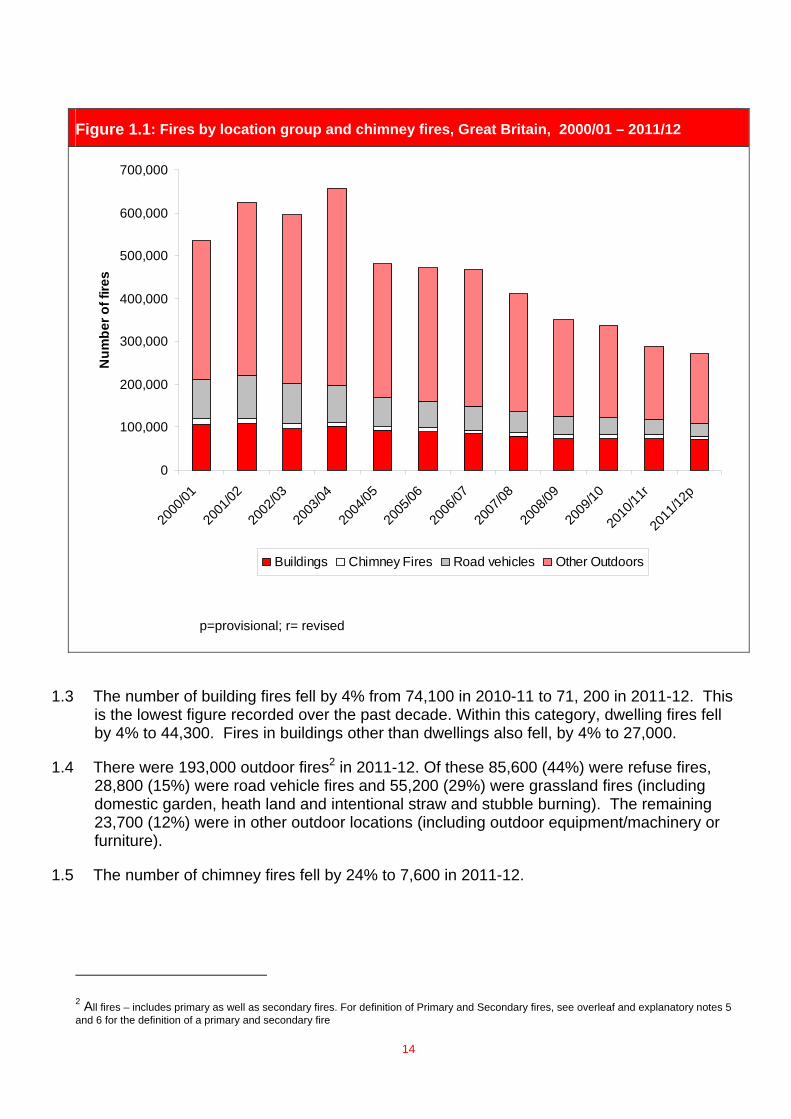
Figure 1.1: Fires by location group and chimney fires, Great Britain, 2000/01 – 2011/12
0
100,000
200,000
300,000
400,000
500,000
600,000
700,000
2000
/01
2001
/02
2002
/03
2003
/04
2004
/05
2005
/06
2006
/07
2007
/08
2008
/09
2009
/10
2010
/11r
2011
/12p
Num
ber o
f fire
s
Buildings Chimney Fires Road vehicles Other Outdoors
p=provisional; r= revised
1.3 The number of building fires fell by 4% from 74,100 in 2010-11 to 71, 200 in 2011-12. This is the lowest figure recorded over the past decade. Within this category, dwelling fires fell by 4% to 44,300. Fires in buildings other than dwellings also fell, by 4% to 27,000.
1.4 There were 193,000 outdoor fires2 in 2011-12. Of these 85,600 (44%) were refuse fires, 28,800 (15%) were road vehicle fires and 55,200 (29%) were grassland fires (including domestic garden, heath land and intentional straw and stubble burning). The remaining 23,700 (12%) were in other outdoor locations (including outdoor equipment/machinery or furniture).
1.5 The number of chimney fires fell by 24% to 7,600 in 2011-12.
2 All fires – includes primary as well as secondary fires. For definition of Primary and Secondary fires, see overleaf and explanatory notes 5 and 6 for the definition of a primary and secondary fire
14
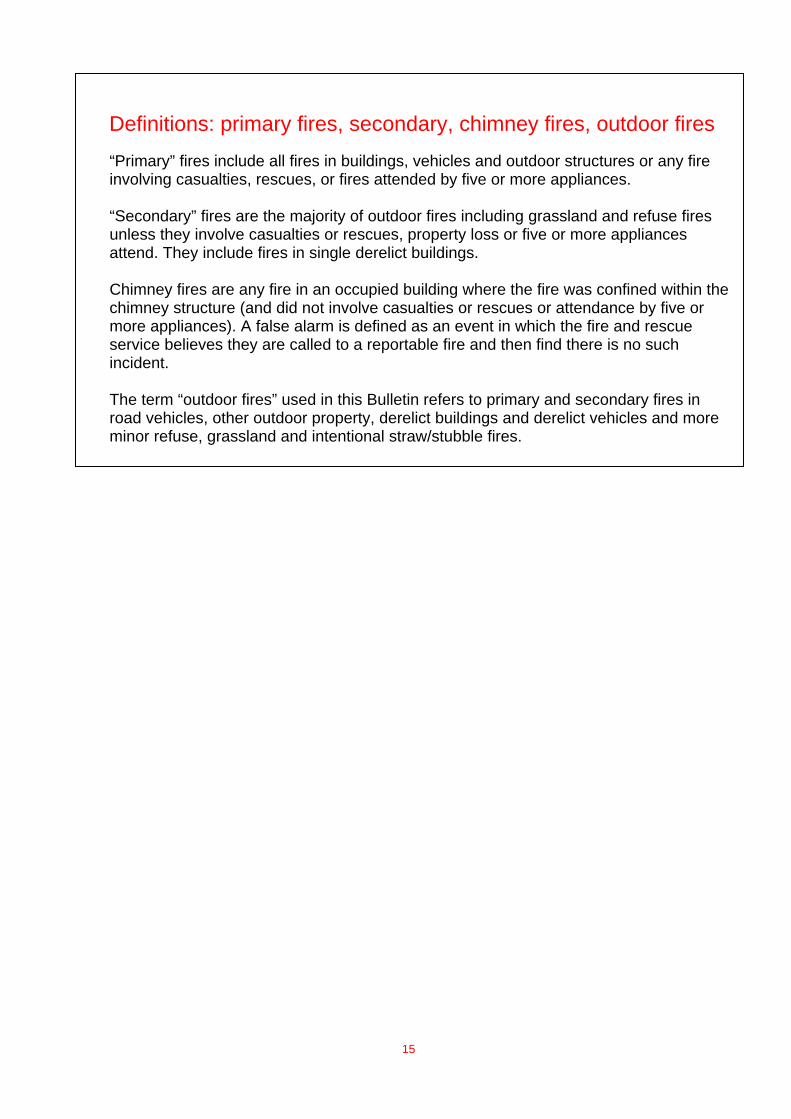
Definitions: primary fires, secondary, chimney fires, outdoor fires “Primary” fires include all fires in buildings, vehicles and outdoor structures or any fire involving casualties, rescues, or fires attended by five or more appliances. “Secondary” fires are the majority of outdoor fires including grassland and refuse fires unless they involve casualties or rescues, property loss or five or more appliances attend. They include fires in single derelict buildings.
Chimney fires are any fire in an occupied building where the fire was confined within the chimney structure (and did not involve casualties or rescues or attendance by five or more appliances). A false alarm is defined as an event in which the fire and rescue service believes they are called to a reportable fire and then find there is no such incident.
The term “outdoor fires” used in this Bulletin refers to primary and secondary fires in road vehicles, other outdoor property, derelict buildings and derelict vehicles and more minor refuse, grassland and intentional straw/stubble fires.
15
16
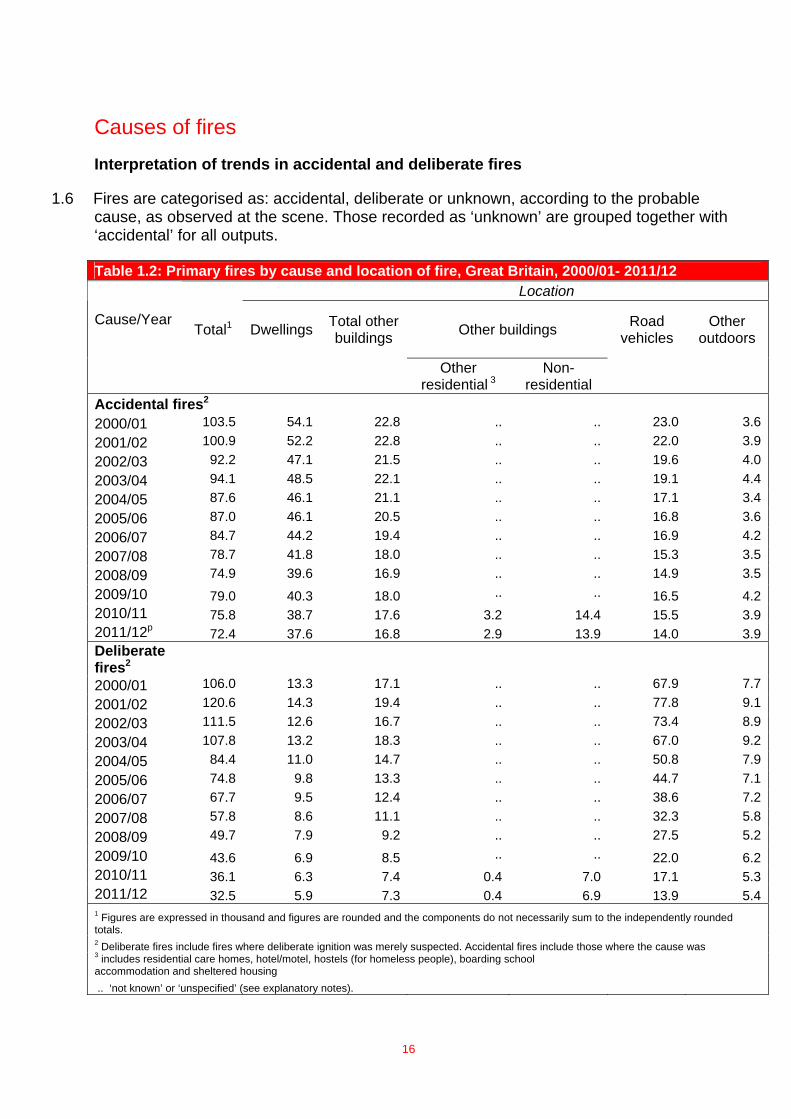
Causes of fires Interpretation of trends in accidental and deliberate fires
1.6 Fires are categorised as: accidental, deliberate or unknown, according to the probable cause, as observed at the scene. Those recorded as ‘unknown’ are grouped together with ‘accidental’ for all outputs.
Table 1.2: Primary fires by cause and location of fire, Great Britain, 2000/01- 2011/12 Location
Cause/Year Total1 Dwellings Total other
buildings Other buildings Road vehicles
Other outdoors
Other residential 3
Non- residential
Accidental fires2 2000/01 103.5 54.1 22.8 .. .. 23.0 3.62001/02 100.9 52.2 22.8 .. .. 22.0 3.92002/03 92.2 47.1 21.5 .. .. 19.6 4.02003/04 94.1 48.5 22.1 .. .. 19.1 4.42004/05 87.6 46.1 21.1 .. .. 17.1 3.42005/06 87.0 46.1 20.5 .. .. 16.8 3.62006/07 84.7 44.2 19.4 .. .. 16.9 4.22007/08 78.7 41.8 18.0 .. .. 15.3 3.52008/09 74.9 39.6 16.9 .. .. 14.9 3.52009/10 79.0 40.3 18.0 .. .. 16.5 4.22010/11 75.8 38.7 17.6 3.2 14.4 15.5 3.92011/12p 72.4 37.6 16.8 2.9 13.9 14.0 3.9Deliberate fires2
2000/01 106.0 13.3 17.1 .. .. 67.9 7.72001/02 120.6 14.3 19.4 .. .. 77.8 9.12002/03 111.5 12.6 16.7 .. .. 73.4 8.92003/04 107.8 13.2 18.3 .. .. 67.0 9.22004/05 84.4 11.0 14.7 .. .. 50.8 7.92005/06 74.8 9.8 13.3 .. .. 44.7 7.12006/07 67.7 9.5 12.4 .. .. 38.6 7.22007/08 57.8 8.6 11.1 .. .. 32.3 5.82008/09 49.7 7.9 9.2 .. .. 27.5 5.22009/10 43.6 6.9 8.5 .. .. 22.0 6.22010/11 36.1 6.3 7.4 0.4 7.0 17.1 5.32011/12 32.5 5.9 7.3 0.4 6.9 13.9 5.41 Figures are expressed in thousand and figures are rounded and the components do not necessarily sum to the independently rounded totals. 2 Deliberate fires include fires where deliberate ignition was merely suspected. Accidental fires include those where the cause was 3 includes residential care homes, hotel/motel, hostels (for homeless people), boarding school accommodation and sheltered housing .. ‘not known’ or ‘unspecified’ (see explanatory notes).
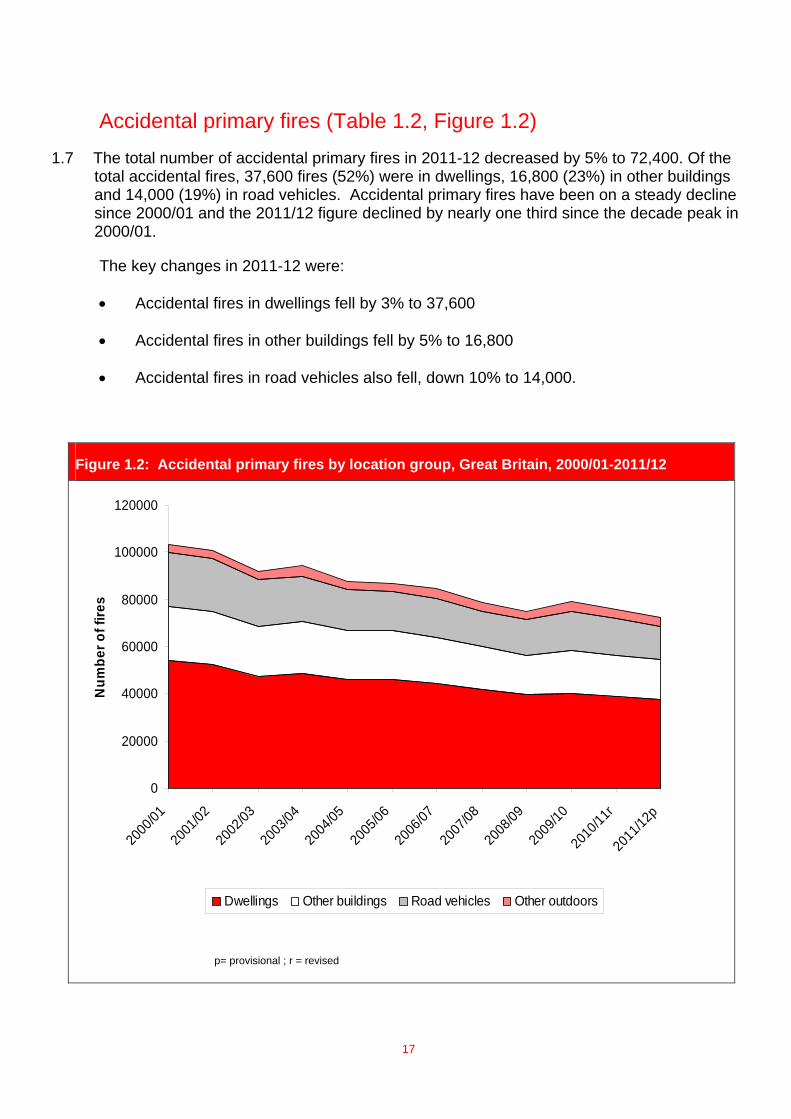
Accidental primary fires (Table 1.2, Figure 1.2) 1.7 The total number of accidental primary fires in 2011-12 decreased by 5% to 72,400. Of the
total accidental fires, 37,600 fires (52%) were in dwellings, 16,800 (23%) in other buildings and 14,000 (19%) in road vehicles. Accidental primary fires have been on a steady decline since 2000/01 and the 2011/12 figure declined by nearly one third since the decade peak in 2000/01.
The key changes in 2011-12 were:
• Accidental fires in dwellings fell by 3% to 37,600
• Accidental fires in other buildings fell by 5% to 16,800
• Accidental fires in road vehicles also fell, down 10% to 14,000.
Figure 1.2: Accidental primary fires by location group, Great Britain, 2000/01-2011/12
0
20000
40000
60000
80000
100000
120000
2000
/01
2001
/02
2002
/03
2003
/04
2004
/05
2005
/06
2006
/07
2007
/08
2008
/09
2009
/10
2010
/11r
2011
/12p
Num
ber o
f fire
s
Dwellings Other buildings Road vehicles Other outdoors
p= provisional ; r = revised
17
Deliberate primary fires (Tables 1.2 and 14 and Figure 1.3)
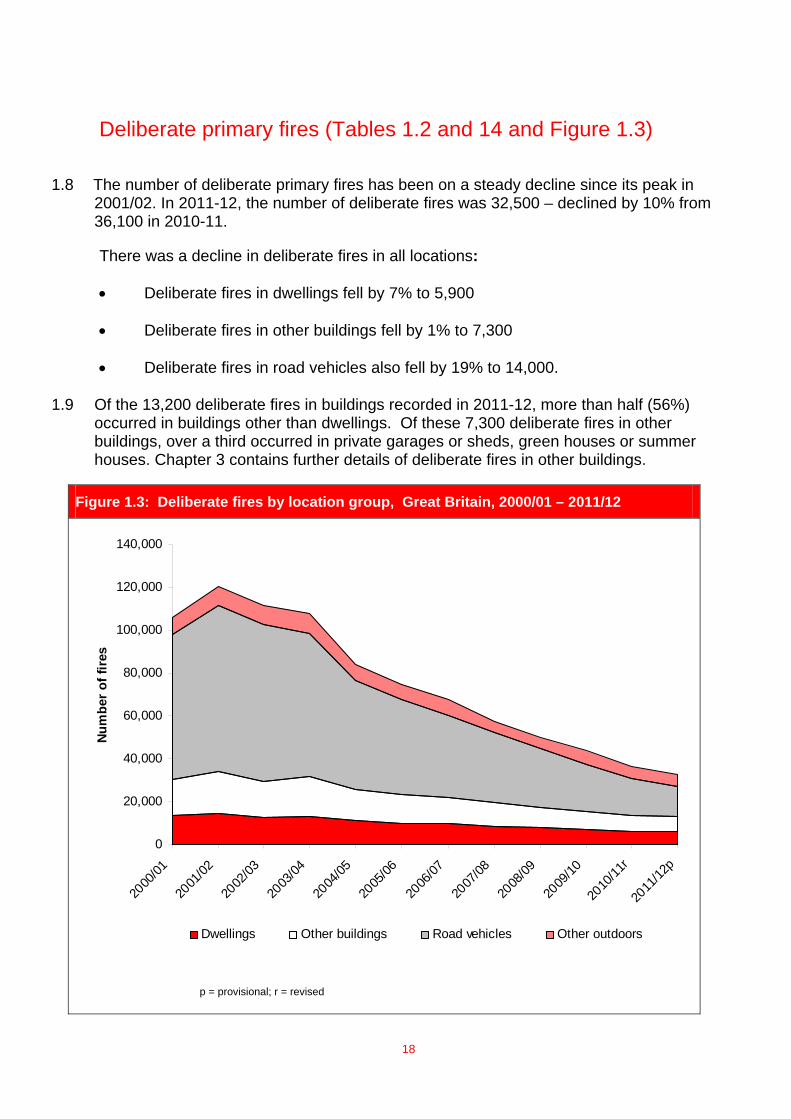
1.8 The number of deliberate primary fires has been on a steady decline since its peak in 2001/02. In 2011-12, the number of deliberate fires was 32,500 – declined by 10% from 36,100 in 2010-11.
There was a decline in deliberate fires in all locations:
• Deliberate fires in dwellings fell by 7% to 5,900
• Deliberate fires in other buildings fell by 1% to 7,300
• Deliberate fires in road vehicles also fell by 19% to 14,000.
1.9 Of the 13,200 deliberate fires in buildings recorded in 2011-12, more than half (56%) occurred in buildings other than dwellings. Of these 7,300 deliberate fires in other buildings, over a third occurred in private garages or sheds, green houses or summer houses. Chapter 3 contains further details of deliberate fires in other buildings.
Figure 1.3: Deliberate fires by location group, Great Britain, 2000/01 – 2011/12
0
20,000
40,000
60,000
80,000
100,000
120,000
140,000
2000
/01
2001
/02
2002
/03
2003
/04
2004
/05
2005
/06
2006
/07
2007
/08
2008
/09
2009
/10
2010
/11r
2011
/12p
Num
ber o
f fir
es
Dwellings Other buildings Road vehicles Other outdoors
p = provisional; r = revised
18
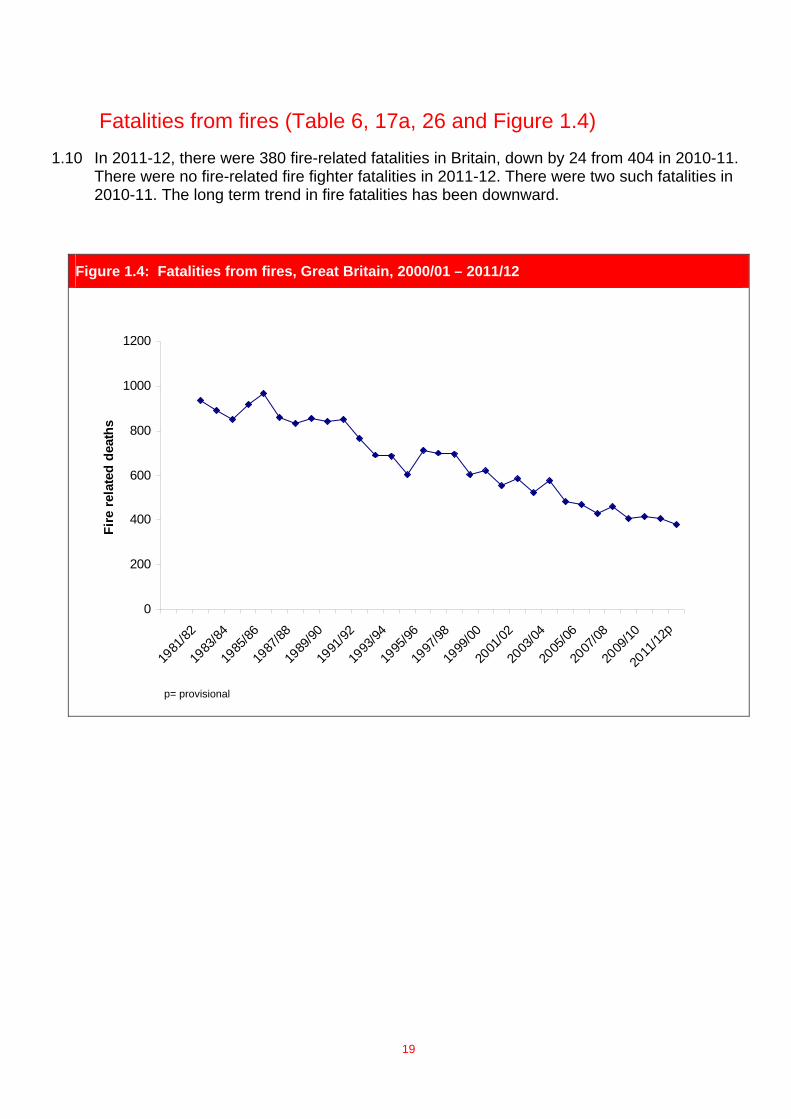
Fatalities from fires (Table 6, 17a, 26 and Figure 1.4) 1.10 In 2011-12, there were 380 fire-related fatalities in Britain, down by 24 from 404 in 2010-11.
There were no fire-related fire fighter fatalities in 2011-12. There were two such fatalities in 2010-11. The long term trend in fire fatalities has been downward.
Figure 1.4: Fatalities from fires, Great Britain, 2000/01 – 2011/12
0
200
400
600
800
1000
1200
1981
/82
1983
/84
1985
/86
1987
/88
1989
/90
1991
/92
1993
/94
1995
/96
1997
/98
1999
/00
2001
/02
2003
/04
2005
/06
2007
/08
2009
/10
2011
/12p
Fire
rela
ted
deat
hs
p= provisional
19
Location (Tables 6 and 26, Figure 1.5)
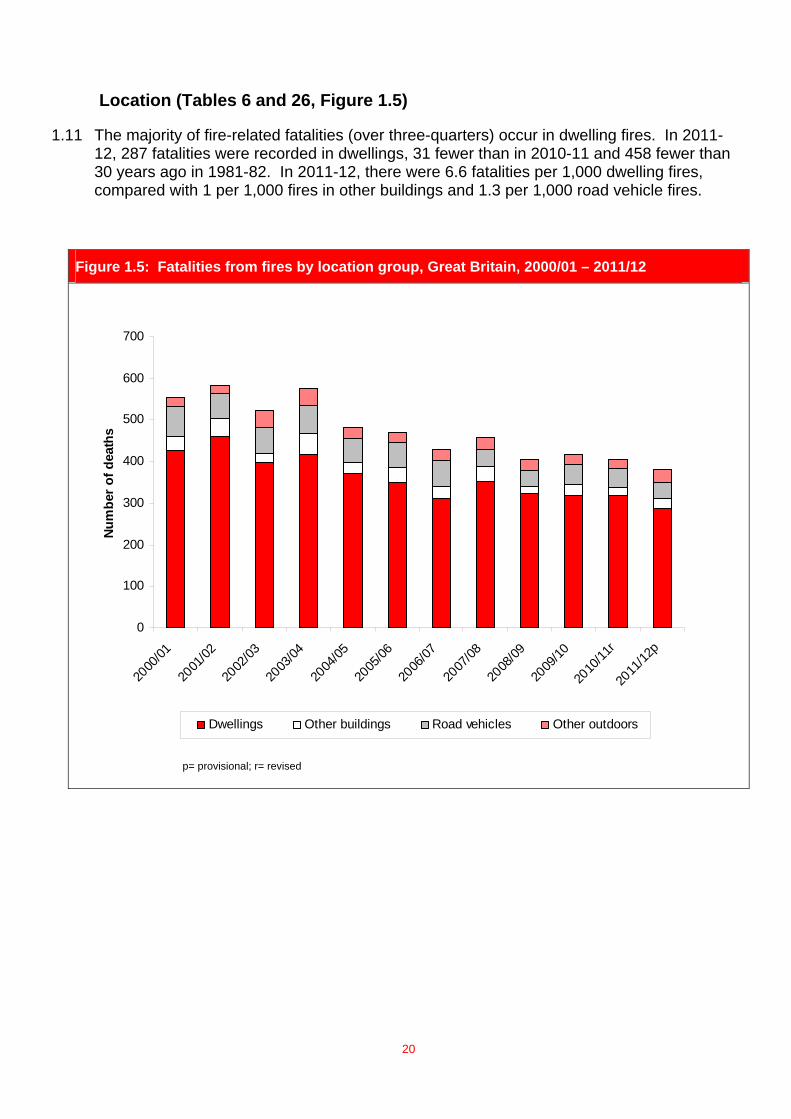
1.11 The majority of fire-related fatalities (over three-quarters) occur in dwelling fires. In 2011-12, 287 fatalities were recorded in dwellings, 31 fewer than in 2010-11 and 458 fewer than 30 years ago in 1981-82. In 2011-12, there were 6.6 fatalities per 1,000 dwelling fires, compared with 1 per 1,000 fires in other buildings and 1.3 per 1,000 road vehicle fires.
Figure 1.5: Fatalities from fires by location group, Great Britain, 2000/01 – 2011/12
0
100
200
300
400
500
600
700
2000
/01
2001
/02
2002
/03
2003
/04
2004
/05
2005
/06
2006
/07
2007
/08
2008
/09
2009
/10
2010
/11r
2011
/12p
Num
ber
of d
eath
s
Dwellings Other buildings Road vehicles Other outdoors
p= provisional; r= revised
20
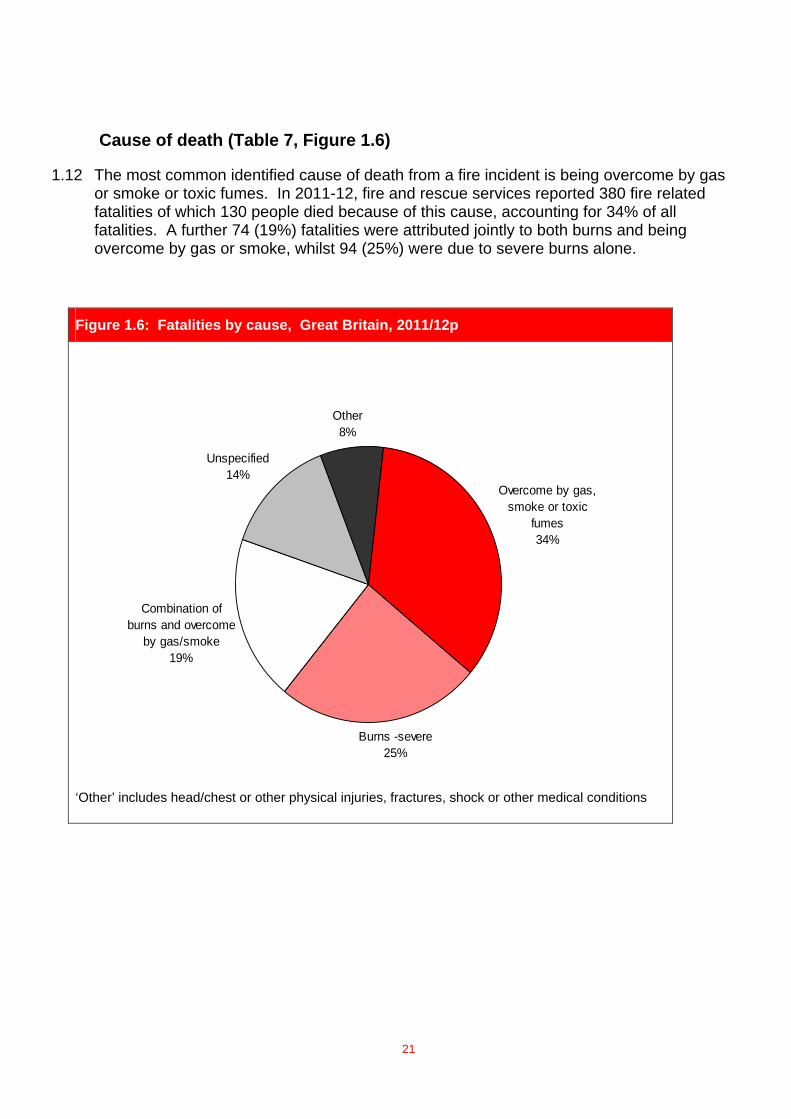
Cause of death (Table 7, Figure 1.6)
1.12 The most common identified cause of death from a fire incident is being overcome by gas or smoke or toxic fumes. In 2011-12, fire and rescue services reported 380 fire related fatalities of which 130 people died because of this cause, accounting for 34% of all fatalities. A further 74 (19%) fatalities were attributed jointly to both burns and being overcome by gas or smoke, whilst 94 (25%) were due to severe burns alone.
Figure 1.6: Fatalities by cause, Great Britain, 2011/12p
Burns -severe25%
Overcome by gas, smoke or toxic
fumes34%
Combination of burns and overcome
by gas/smoke19%
Unspecified14%
Other8%
‘Other’ includes head/chest or other physical injuries, fractures, shock or other medical conditions
21
22
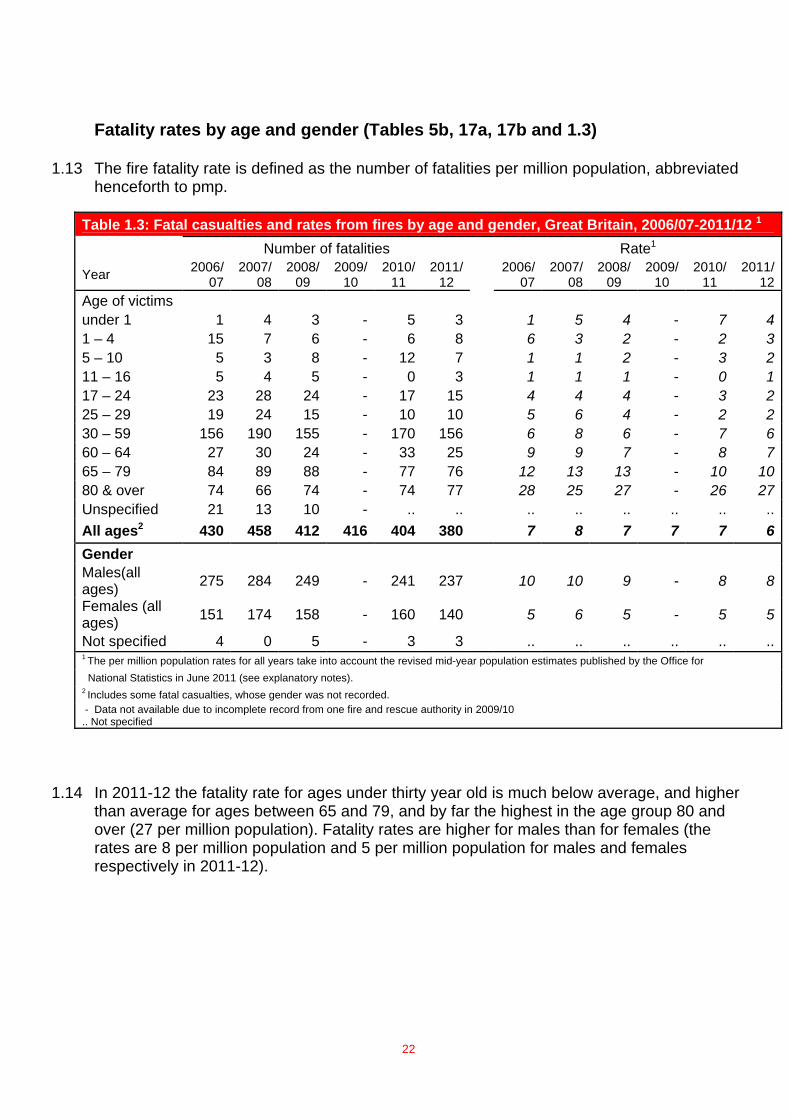
Fatality rates by age and gender (Tables 5b, 17a, 17b and 1.3)
1.13 The fire fatality rate is defined as the number of fatalities per million population, abbreviated henceforth to pmp.
Table 1.3: Fatal casualties and rates from fires by age and gender, Great Britain, 2006/07-2011/12 1 Number of fatalities Rate1
Year 2006/07
2007/08
2008/09
2009/10
2010/11
2011/12 2006/
072007/
08 2008/
09 2009/
10 2010/
11 2011/
12Age of victims under 1 1 4 3 - 5 3 1 5 4 - 7 41 – 4 15 7 6 - 6 8 6 3 2 - 2 35 – 10 5 3 8 - 12 7 1 1 2 - 3 211 – 16 5 4 5 - 0 3 1 1 1 - 0 117 – 24 23 28 24 - 17 15 4 4 4 - 3 225 – 29 19 24 15 - 10 10 5 6 4 - 2 230 – 59 156 190 155 - 170 156 6 8 6 - 7 660 – 64 27 30 24 - 33 25 9 9 7 - 8 765 – 79 84 89 88 - 77 76 12 13 13 - 10 1080 & over 74 66 74 - 74 77 28 25 27 - 26 27Unspecified 21 13 10 - .. .. .. .. .. .. .. ..All ages2 430 458 412 416 404 380 7 8 7 7 7 6Gender Males(all ages) 275 284 249 - 241 237 10 10 9 - 8 8
Females (all ages) 151 174 158 - 160 140 5 6 5 - 5 5
Not specified 4 0 5 - 3 3 .. .. .. .. .. ..1 The per million population rates for all years take into account the revised mid-year population estimates published by the Office for National Statistics in June 2011 (see explanatory notes). 2 Includes some fatal casualties, whose gender was not recorded. - Data not available due to incomplete record from one fire and rescue authority in 2009/10 .. Not specified
1.14 In 2011-12 the fatality rate for ages under thirty year old is much below average, and higher than average for ages between 65 and 79, and by far the highest in the age group 80 and over (27 per million population). Fatality rates are higher for males than for females (the rates are 8 per million population and 5 per million population for males and females respectively in 2011-12).
Non-fatal casualties
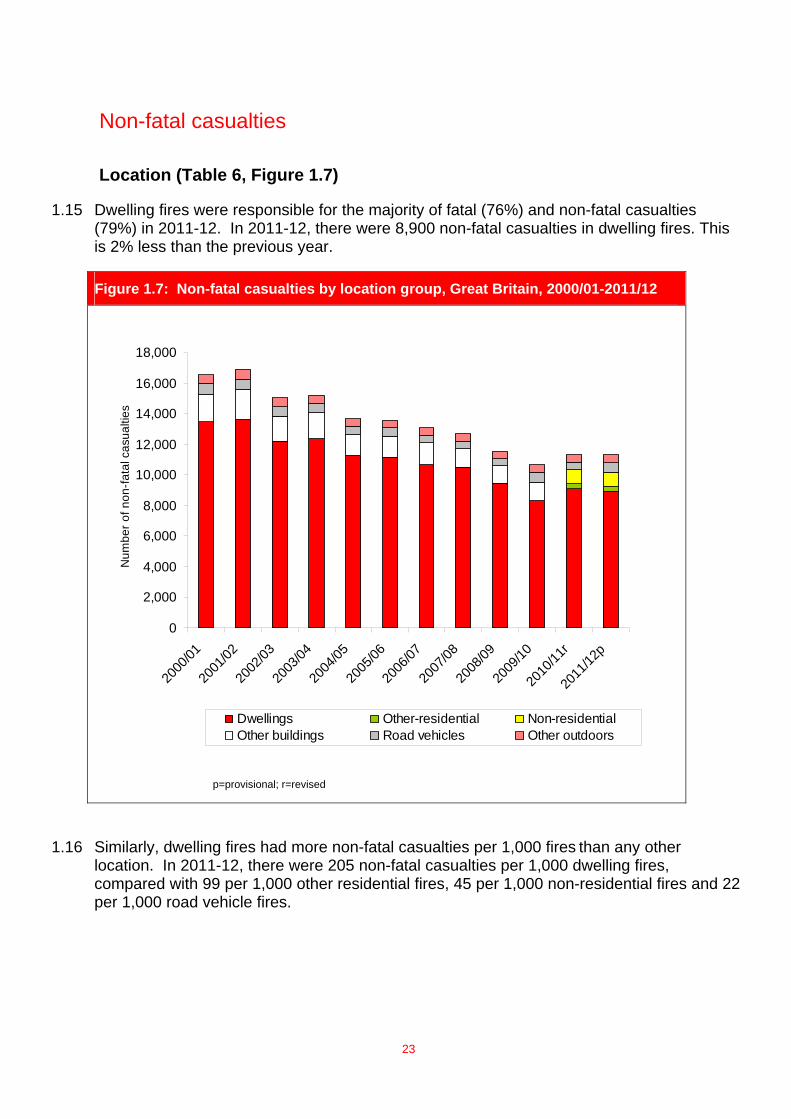
Location (Table 6, Figure 1.7)
1.15 Dwelling fires were responsible for the majority of fatal (76%) and non-fatal casualties (79%) in 2011-12. In 2011-12, there were 8,900 non-fatal casualties in dwelling fires. This is 2% less than the previous year.
Figure 1.7: Non-fatal casualties by location group, Great Britain, 2000/01-2011/12
0
2,000
4,000
6,000
8,000
10,000
12,000
14,000
16,000
18,000
2000
/01
2001
/02
2002
/03
2003
/04
2004
/05
2005
/06
2006
/07
2007
/08
2008
/09
2009
/10
2010
/11r
2011
/12p
Num
ber o
f non
-fata
l cas
ualti
es
Dwellings Other-residential Non-residentialOther buildings Road vehicles Other outdoors
p=provisional; r=revised
1.16 Similarly, dwelling fires had more non-fatal casualties per 1,000 fires than any other location. In 2011-12, there were 205 non-fatal casualties per 1,000 dwelling fires, compared with 99 per 1,000 other residential fires, 45 per 1,000 non-residential fires and 22 per 1,000 road vehicle fires.
23
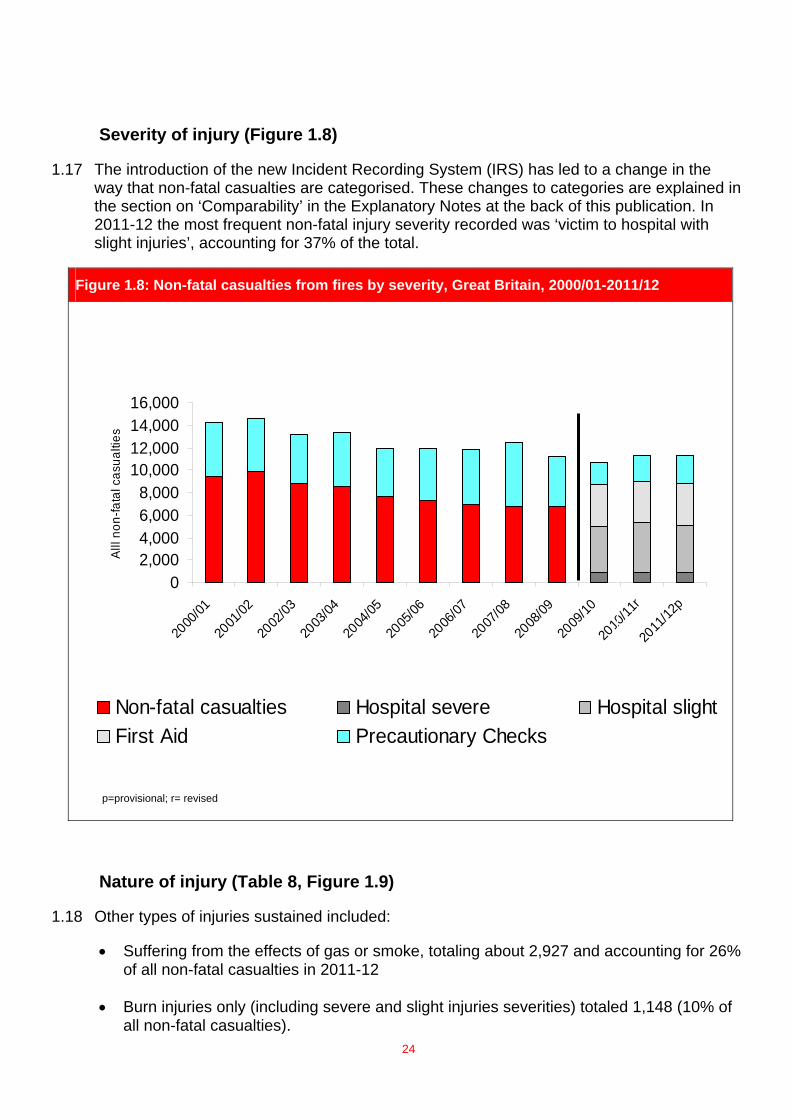
Severity of injury (Figure 1.8)
1.17 The introduction of the new Incident Recording System (IRS) has led to a change in the way that non-fatal casualties are categorised. These changes to categories are explained in the section on ‘Comparability’ in the Explanatory Notes at the back of this publication. In 2011-12 the most frequent non-fatal injury severity recorded was ‘victim to hospital with slight injuries’, accounting for 37% of the total.
Figure 1.8: Non-fatal casualties from fires by severity, Great Britain, 2000/01-2011/12
24
p=provisional; r= revised
02,0004,0006,0008,000
10,00012,00014,00016,000
2000
/01
2001
/02
2002
/03
2003
/04
2004
/05
2005
/06
2006
/07
2007
/08
2008
/09
2009
/10
2010
/11r
2011
/12p
Alll
non-
fata
l cas
ualti
es
Non-fatal casualties Hospital severe Hospital slightFirst Aid Precautionary Checks
Nature of injury (Table 8, Figure 1.9)
1.18 Other types of injuries sustained included:
• Suffering from the effects of gas or smoke, totaling about 2,927 and accounting for 26% of all non-fatal casualties in 2011-12
• Burn injuries only (including severe and slight injuries severities) totaled 1,148 (10% of all non-fatal casualties).
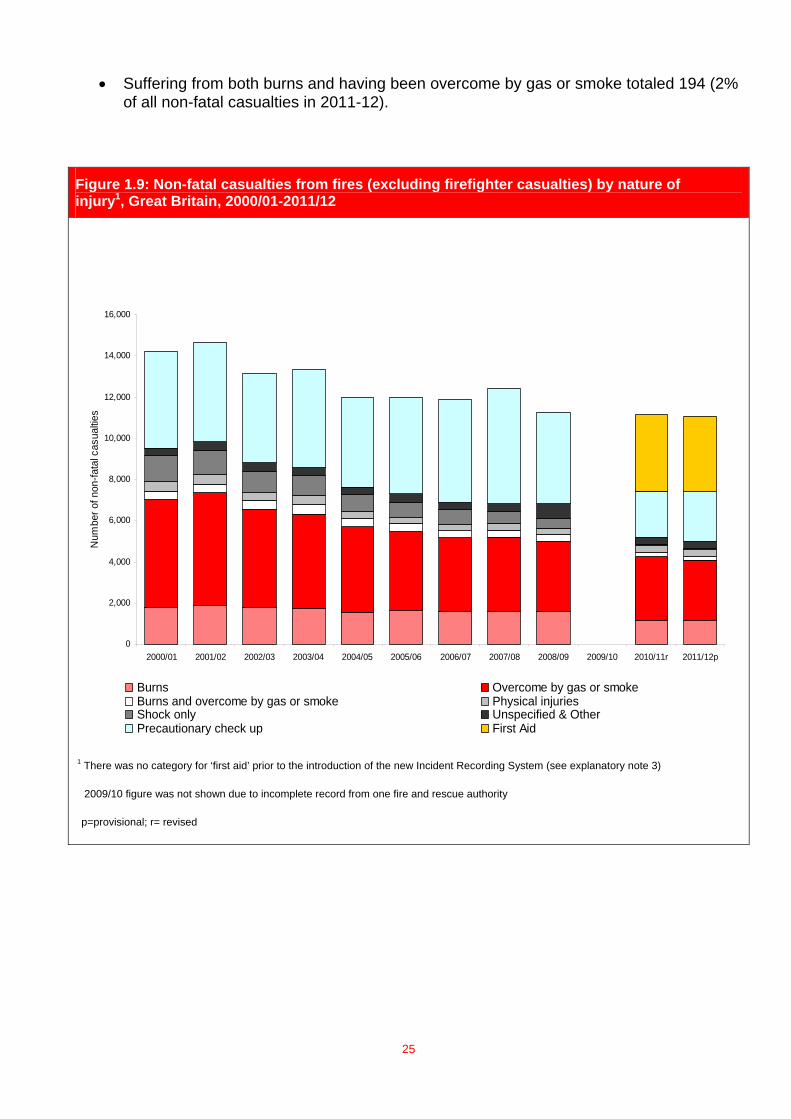
• Suffering from both burns and having been overcome by gas or smoke totaled 194 (2% of all non-fatal casualties in 2011-12).
Figure 1.9: Non-fatal casualties from fires (excluding firefighter casualties) by nature of injury1, Great Britain, 2000/01-2011/12
0
2,000
4,000
6,000
8,000
10,000
12,000
14,000
16,000
2000/01 2001/02 2002/03 2003/04 2004/05 2005/06 2006/07 2007/08 2008/09 2009/10 2010/11r 2011/12p
Num
ber o
f non
-fata
l cas
ualtie
s
Burns Overcome by gas or smokeBurns and overcome by gas or smoke Physical injuriesShock only Unspecified & OtherPrecautionary check up First Aid
1 There was no category for ‘first aid’ prior to the introduction of the new Incident Recording System (see explanatory note 3)
2009/10 figure was not shown due to incomplete record from one fire and rescue authority
p=provisional; r= revised
25
Type of fires and country
Primary fires (Tables 5a and Figure 1.9)
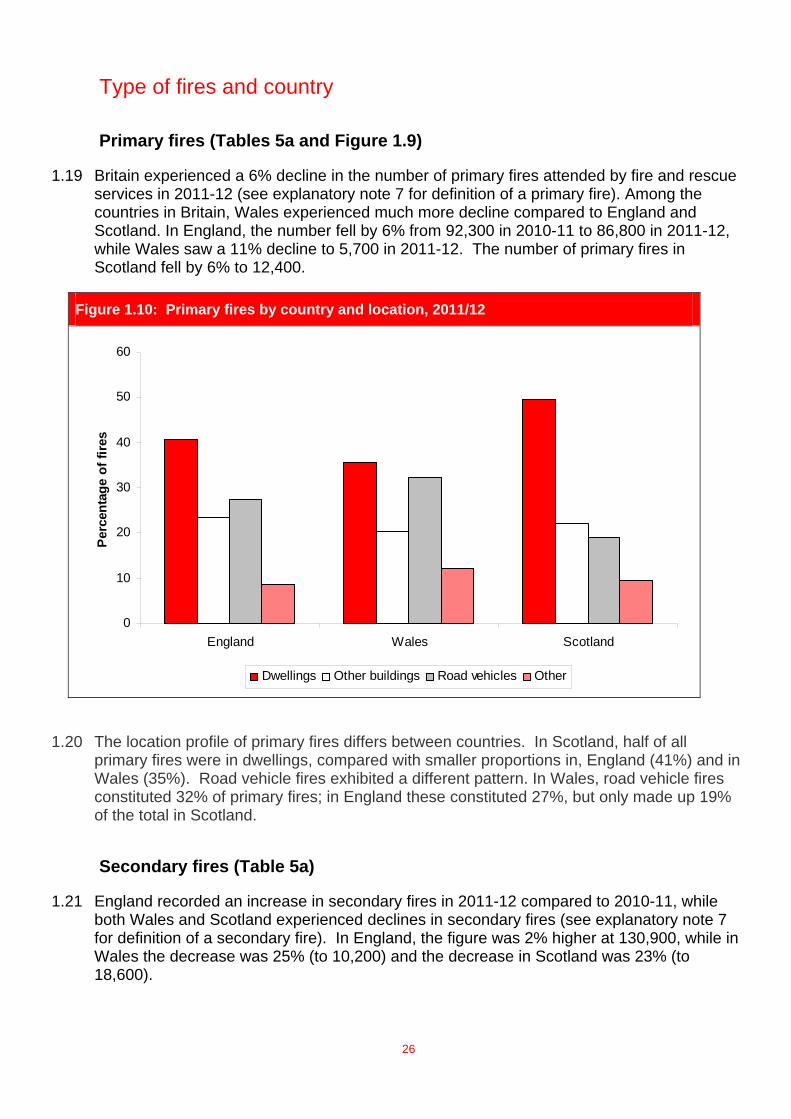
1.19 Britain experienced a 6% decline in the number of primary fires attended by fire and rescue services in 2011-12 (see explanatory note 7 for definition of a primary fire). Among the countries in Britain, Wales experienced much more decline compared to England and Scotland. In England, the number fell by 6% from 92,300 in 2010-11 to 86,800 in 2011-12, while Wales saw a 11% decline to 5,700 in 2011-12. The number of primary fires in Scotland fell by 6% to 12,400.
Figure 1.10: Primary fires by country and location, 2011/12
0
10
20
30
40
50
60
England Wales Scotland
Perc
enta
ge o
f fire
s
Dwellings Other buildings Road vehicles Other
1.20 The location profile of primary fires differs between countries. In Scotland, half of all primary fires were in dwellings, compared with smaller proportions in, England (41%) and in Wales (35%). Road vehicle fires exhibited a different pattern. In Wales, road vehicle fires constituted 32% of primary fires; in England these constituted 27%, but only made up 19% of the total in Scotland.
Secondary fires (Table 5a)
1.21 England recorded an increase in secondary fires in 2011-12 compared to 2010-11, while both Wales and Scotland experienced declines in secondary fires (see explanatory note 7 for definition of a secondary fire). In England, the figure was 2% higher at 130,900, while in Wales the decrease was 25% (to 10,200) and the decrease in Scotland was 23% (to 18,600).
26
27
Chimney fires (Tables 5a)
1.22 Britain experienced a fall (24%) in chimney fires in 2011-12. England, Wales and Scotland had 25%, 22% and 24% declines in chimney fires compared with 2010-11.
Fatalities casualties and rates by country and fire and rescue service area (Table 5b and Table 22a)
1.23 There were 380 fire-related fatalities in Britain in 2011-12, down by 24 fatalities from 404 in 2010-11. The fatality rate in fires in Britain in 2011-12 was 6.2 per million population (pmp). Fatality rates differ between countries:
• Scotland has had a consistently higher fatality rate over the years compared to the rest of Britain, currently at 10.8 pmp, up from 10.0 pmp in 2010-11.
• The rate in Wales in 2011-12 was 6.2 pmp, down from 7.0 pmp in 2010-11 to.
• In England the rate was 5.7 pmp in 2011-12, down 6.3 pmp in 2010-11.
Non-fatal casualties and rates by country and rescue service area (Table 5b and Table 22b)
1.24 The number of non-fatal casualties in England fell by 1% in 2011-12 to 9,300 from 9,400 in 2010-11 and in Wales the figure fell by 4% to 580 from 610 in 2010-11. Meanwhile non-fatal casualties in Scotland rose by 5% to 1,400 in 2011-12.
1.25 The non-fatal casualty rate per million population (pmp) declined from 187 in 2010-11 to 184 in 2011-12. This is the second lowest rate over the past 12 years. By country, the non-fatal casualty rates were:
• England, 175 pmp in 2011-12, down from 180 pmp in 2010-11
• Wales, 190 pmp in 2011-12, down from 202 pmp in 2010-11
• Scotland, 266 pmp in 2011-12, up from 254 pmp in 2010-11
• Some of the highest non-fatality rates occurred in England were in the metropolitan fire and rescue service areas, with Greater Manchester (420 per million population) 70% higher than any other metropolitan area. The highest rate recorded by an English non-metropolitan fire and rescue service was in Lancashire (332 pmp). The highest casualty rate in Wales was in North Wales (331 pmp)
28
Chapter 2 – Dwellings
Introduction (Tables 2 and 6)
2.1 Dwelling fires account for nearly two-thirds of all building fires and 88% of all casualties occur in building fires. (See explanatory notes for further information on the definitions of primary and dwelling fires.) Overall, the number of dwelling fires fell by 3% to 43,500 in 2011-12, continuing the downward trend since 2000-01. The number of fatalities in such fires was 287, down by 31 in 2011-12 compared to the previous year. There was a 2% fall compared with 2010-11 in the number of non-fatal casualties in fires in dwellings to 8,930.
Accidental fires (Table 2)
2.2 Most of fires in dwellings are accidental (87%) in 2011-12. The 2011-12 figure is the lowest number of such fires recorded in more than a decade.
Cause of fire (Table 2)
2.3 The main cause of accidental fires in dwellings remains the misuse of equipment or appliances, with 14,700 cases recorded in 2011-12, little change (1 % fewer) than in 2011-12. This is the lowest figure since 2000-01. Other changes in accidental dwelling fires since 2000-01 include:
• Chip/fat pan fires have fallen by over three quarters in ten years to 2,600.
• Instances of playing with fire have fallen by nearly half in the last decade.
• Incidences of placing articles too close to heat or fire have fallen by one fifth in the last decade.
Source of ignition (Figure 2.1 and Table 3)
2.4 This section looks in more detail at the source of the flame, spark or heat that first ignited the fire. This is related to the cause of the fire, and for many sources of ignition there was only one major cause responsible for the fire. For example, for most fires in which the source of ignition was smokers’ materials the cause was most likely to be careless handling of fire or hot substances.
2.5 Cooking appliances were the main sources of ignition in accidental dwelling fires (over half in 2011-12). Fires from this source show a continual fall of around a third from the peak of 32,000 in 2000-01.
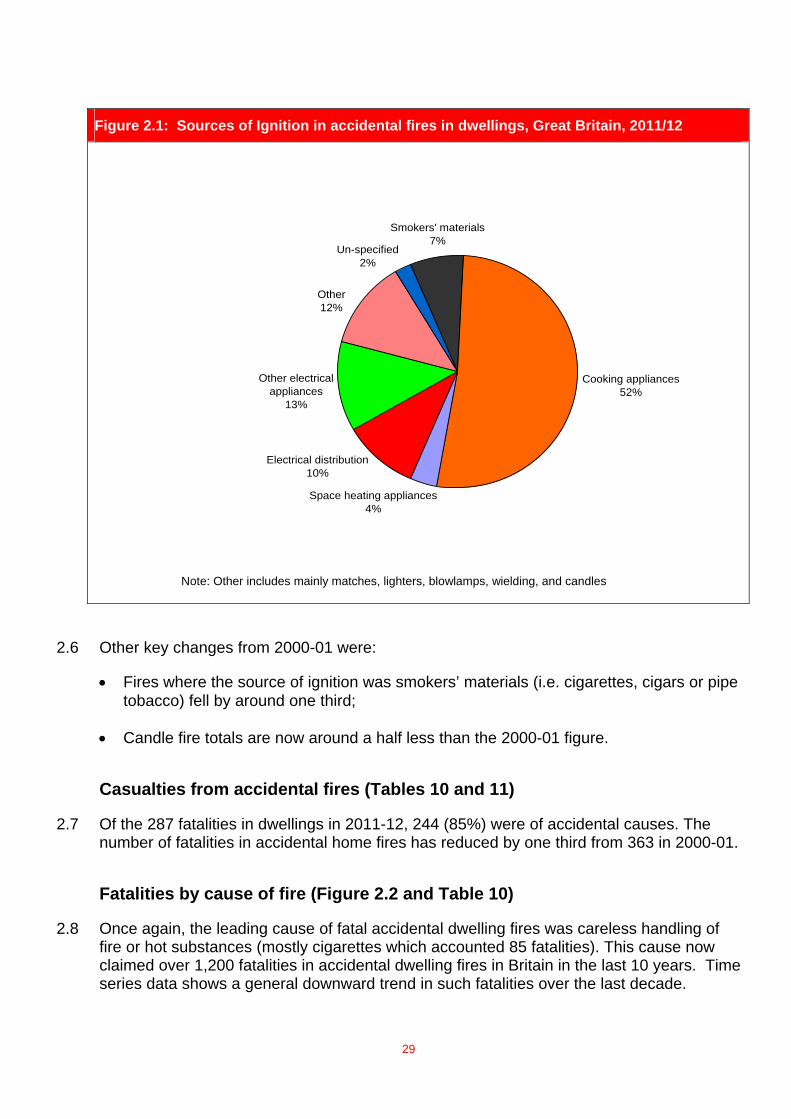
Figure 2.1: Sources of Ignition in accidental fires in dwellings, Great Britain, 2011/12
Cooking appliances52%
Other electrical appliances
13%
Un-specified2%
Electrical distribution10%
Space heating appliances 4%
Smokers' materials7%
Other12%
Note: Other includes mainly matches, lighters, blowlamps, wielding, and candles
2.6 Other key changes from 2000-01 were:
• Fires where the source of ignition was smokers’ materials (i.e. cigarettes, cigars or pipe tobacco) fell by around one third;
• Candle fire totals are now around a half less than the 2000-01 figure.
Casualties from accidental fires (Tables 10 and 11)
2.7 Of the 287 fatalities in dwellings in 2011-12, 244 (85%) were of accidental causes. The number of fatalities in accidental home fires has reduced by one third from 363 in 2000-01.
Fatalities by cause of fire (Figure 2.2 and Table 10)
2.8 Once again, the leading cause of fatal accidental dwelling fires was careless handling of fire or hot substances (mostly cigarettes which accounted 85 fatalities). This cause now claimed over 1,200 fatalities in accidental dwelling fires in Britain in the last 10 years. Time series data shows a general downward trend in such fatalities over the last decade.
29
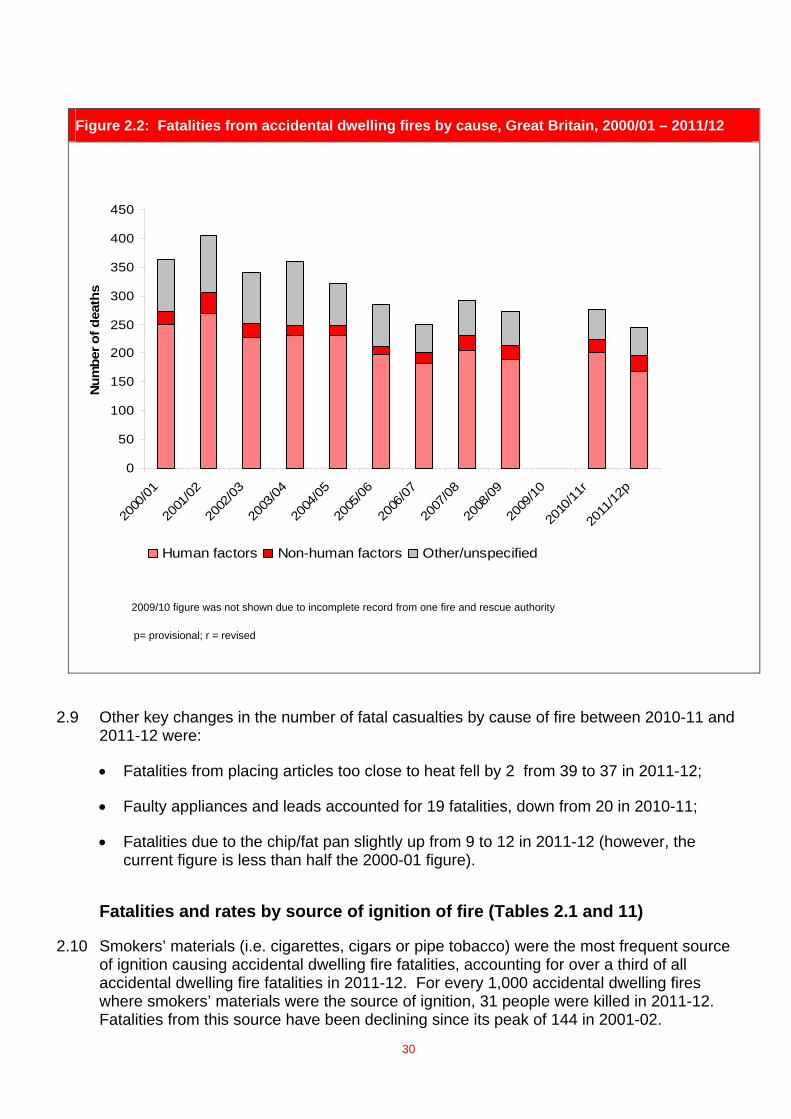
Figure 2.2: Fatalities from accidental dwelling fires by cause, Great Britain, 2000/01 – 2011/12
0
50
100
150
200
250
300
350
400
450
2000
/01
2001
/02
2002
/03
2003
/04
2004
/05
2005
/06
2006
/07
2007
/08
2008
/09
2009
/10
2010
/11r
2011
/12p
Num
ber o
f dea
ths
Human factors Non-human factors Other/unspecified
2009/10 figure was not shown due to incomplete record from one fire and rescue authority
p= provisional; r = revised
2.9 Other key changes in the number of fatal casualties by cause of fire between 2010-11 and 2011-12 were:
• Fatalities from placing articles too close to heat fell by 2 from 39 to 37 in 2011-12;
• Faulty appliances and leads accounted for 19 fatalities, down from 20 in 2010-11;
• Fatalities due to the chip/fat pan slightly up from 9 to 12 in 2011-12 (however, the current figure is less than half the 2000-01 figure).
Fatalities and rates by source of ignition of fire (Tables 2.1 and 11)
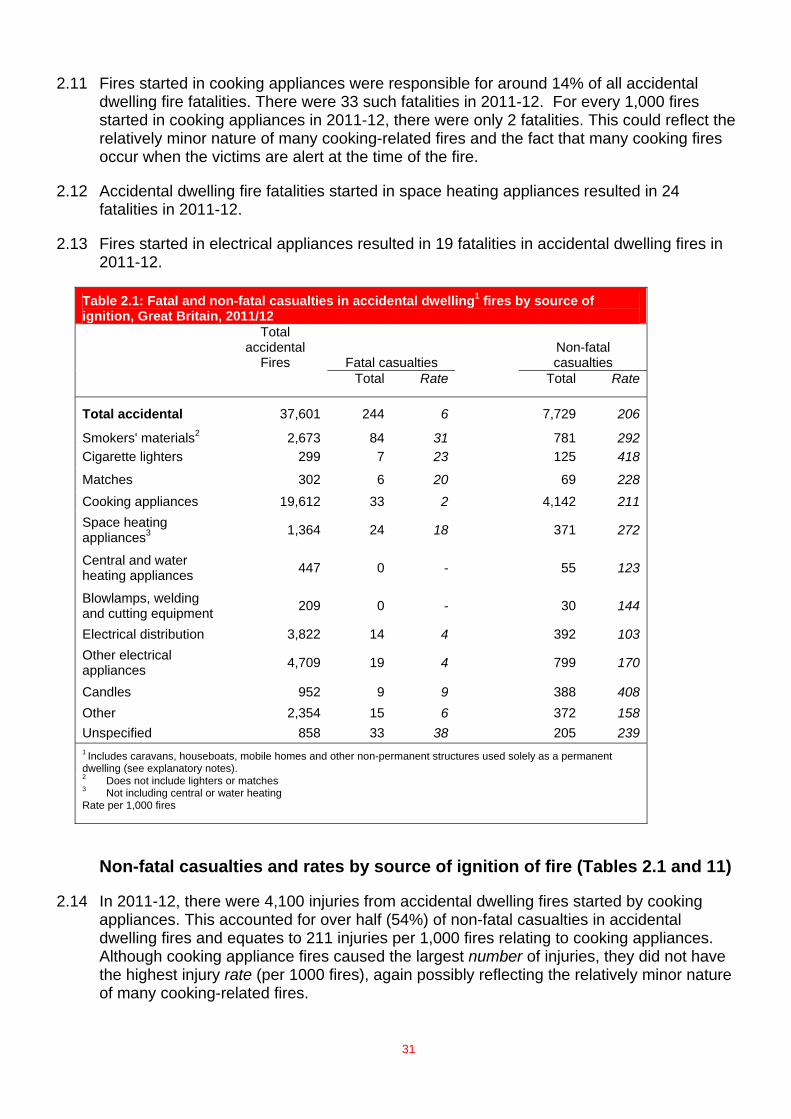
2.10 Smokers’ materials (i.e. cigarettes, cigars or pipe tobacco) were the most frequent source of ignition causing accidental dwelling fire fatalities, accounting for over a third of all accidental dwelling fire fatalities in 2011-12. For every 1,000 accidental dwelling fires where smokers’ materials were the source of ignition, 31 people were killed in 2011-12. Fatalities from this source have been declining since its peak of 144 in 2001-02.
30
31
2.11 Fires started in cooking appliances were responsible for around 14% of all accidental dwelling fire fatalities. There were 33 such fatalities in 2011-12. For every 1,000 fires started in cooking appliances in 2011-12, there were only 2 fatalities. This could reflect the relatively minor nature of many cooking-related fires and the fact that many cooking fires occur when the victims are alert at the time of the fire.
2.12 Accidental dwelling fire fatalities started in space heating appliances resulted in 24 fatalities in 2011-12.
2.13 Fires started in electrical appliances resulted in 19 fatalities in accidental dwelling fires in 2011-12.
Table 2.1: Fatal and non-fatal casualties in accidental dwelling1 fires by source of ignition, Great Britain, 2011/12
Total accidental
Fires Fatal casualties Non-fatal casualties
Total Rate Total Rate
Total accidental 37,601 244 6 7,729 206
Smokers' materials2 2,673 84 31 781 292 Cigarette lighters 299 7 23 125 418
Matches 302 6 20 69 228 Cooking appliances 19,612 33 2 4,142 211 Space heating appliances3 1,364 24 18 371 272
Central and water heating appliances 447 0 - 55 123
Blowlamps, welding and cutting equipment 209 0 - 30 144
Electrical distribution 3,822 14 4 392 103 Other electrical appliances 4,709 19 4 799 170
Candles 952 9 9 388 408 Other 2,354 15 6 372 158 Unspecified 858 33 38 205 239 1 Includes caravans, houseboats, mobile homes and other non-permanent structures used solely as a permanent dwelling (see explanatory notes). 2 Does not include lighters or matches 3 Not including central or water heating Rate per 1,000 fires
Non-fatal casualties and rates by source of ignition of fire (Tables 2.1 and 11)
2.14 In 2011-12, there were 4,100 injuries from accidental dwelling fires started by cooking appliances. This accounted for over half (54%) of non-fatal casualties in accidental dwelling fires and equates to 211 injuries per 1,000 fires relating to cooking appliances. Although cooking appliance fires caused the largest number of injuries, they did not have the highest injury rate (per 1000 fires), again possibly reflecting the relatively minor nature of many cooking-related fires.
32
2.15 The injury rate was highest for fires started by cigarette lighters – 418 per 1,000 fires, a total of 125 injuries in 2011-12. The next highest was for fires caused by candles – 408 per 1,000 fires, a total of 388 injuries in 2011-12
2.16 Accidental dwelling fires caused by other electrical appliances resulted in 799 non-fatal casualties in 2011-12. This is the lowest figure recorded in more than a decade.
2.17 Fires started by smokers’ materials resulted in 781 injuries –maintaining the long term downward trend (there were 1,440 injuries occurred from this source in accidental dwelling fires in 2001-02).
Non-fatal casualties by cause of fire (Figure 2.3 and Table 10)
2.18 The total number of non-fatal casualties in accidental dwelling fire has been steadily declining since 2000-01. In 2011-12, the total number of non-fatal casualties was 8,900 – 2% fewer than in 2010-11. The vast majority of these casualties occurred in fires caused accidentally (87%). The number of non-fatal casualties in accidental dwelling fires fell by 3% from 7,900 in 2010-11 to 7,700 in 2011-12.
2.19 The misuse of equipment and appliances was the biggest cause of non-fatal casualties in accidental dwelling fires (2,600 in 2011-12). Chip/fat pans were the biggest cause in accidental dwelling fires casualties until 2004. In 2011-12 they caused 1,230 non-fatal casualties, about two-third fewer than 11 years before.
2.20 Other key changes between 2010-11 and 2011-12 in the number of non-fatal casualties by cause of fire were:
• Chip pan fire non-fatal casualties were down by 9% to 1,200 in 2011-12. Injuries from this cause are at its lowest level since 2000-01.
• Playing with fire – non-fatal casualties were up by 18 injuries to 149 in 2011-12 (the increase is mainly due to increase in slight injuries and precautionary checks recommended)
• Careless handling of fire or hot substances – non-fatal casualties declined from 1,200 to 1,100 in 2011-12.
• Faulty appliances and leads – non-fatal casualties declined from 980 to 900 in 2011-12.
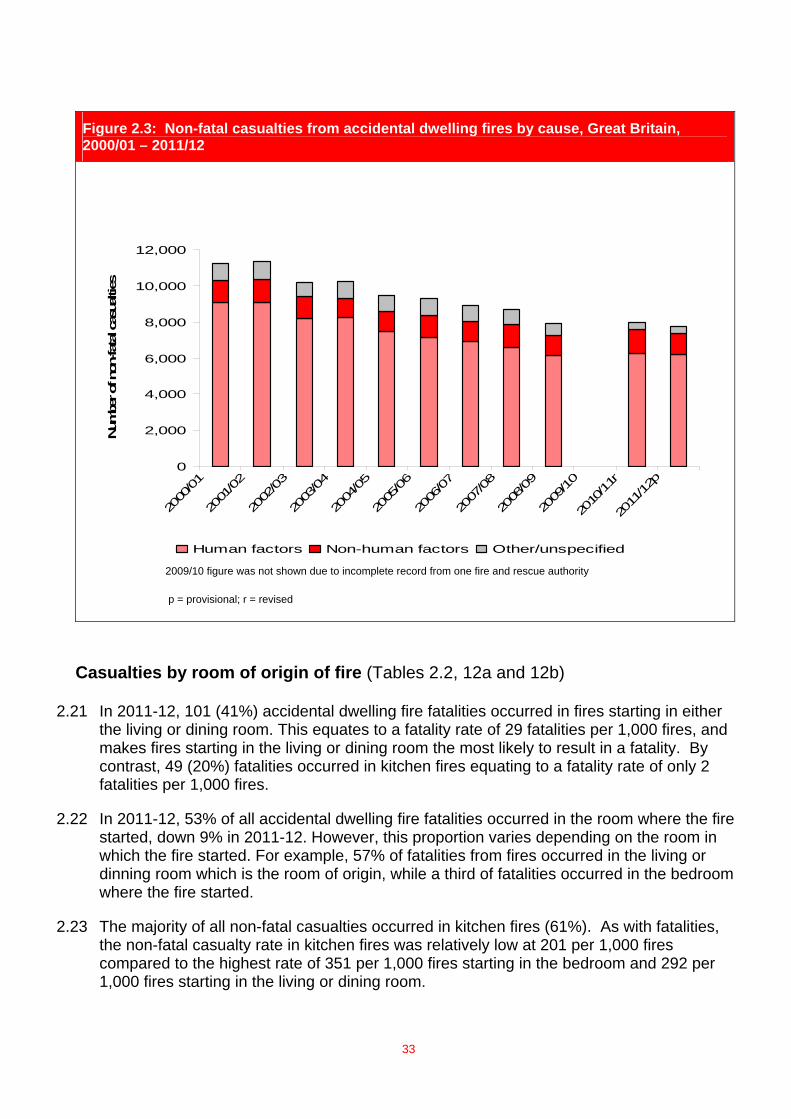
Figure 2.3: Non-fatal casualties from accidental dwelling fires by cause, Great Britain, 2000/01 – 2011/12
0
2,000
4,000
6,000
8,000
10,000
12,000
2000
/01
2001
/02
2002
/03
2003
/04
2004
/05
2005
/06
2006
/07
2007
/08
2008
/09
2009
/10
2010
/11r
2011
/12p
Num
ber o
f non
-fata
l cas
ualti
es
Human factors Non-human factors Other/unspecified
2009/10 figure was not shown due to incomplete record from one fire and rescue authority
p = provisional; r = revised
Casualties by room of origin of fire (Tables 2.2, 12a and 12b)
2.21 In 2011-12, 101 (41%) accidental dwelling fire fatalities occurred in fires starting in either the living or dining room. This equates to a fatality rate of 29 fatalities per 1,000 fires, and makes fires starting in the living or dining room the most likely to result in a fatality. By contrast, 49 (20%) fatalities occurred in kitchen fires equating to a fatality rate of only 2 fatalities per 1,000 fires.
2.22 In 2011-12, 53% of all accidental dwelling fire fatalities occurred in the room where the fire started, down 9% in 2011-12. However, this proportion varies depending on the room in which the fire started. For example, 57% of fatalities from fires occurred in the living or dinning room which is the room of origin, while a third of fatalities occurred in the bedroom where the fire started.
2.23 The majority of all non-fatal casualties occurred in kitchen fires (61%). As with fatalities, the non-fatal casualty rate in kitchen fires was relatively low at 201 per 1,000 fires compared to the highest rate of 351 per 1,000 fires starting in the bedroom and 292 per 1,000 fires starting in the living or dining room.
33
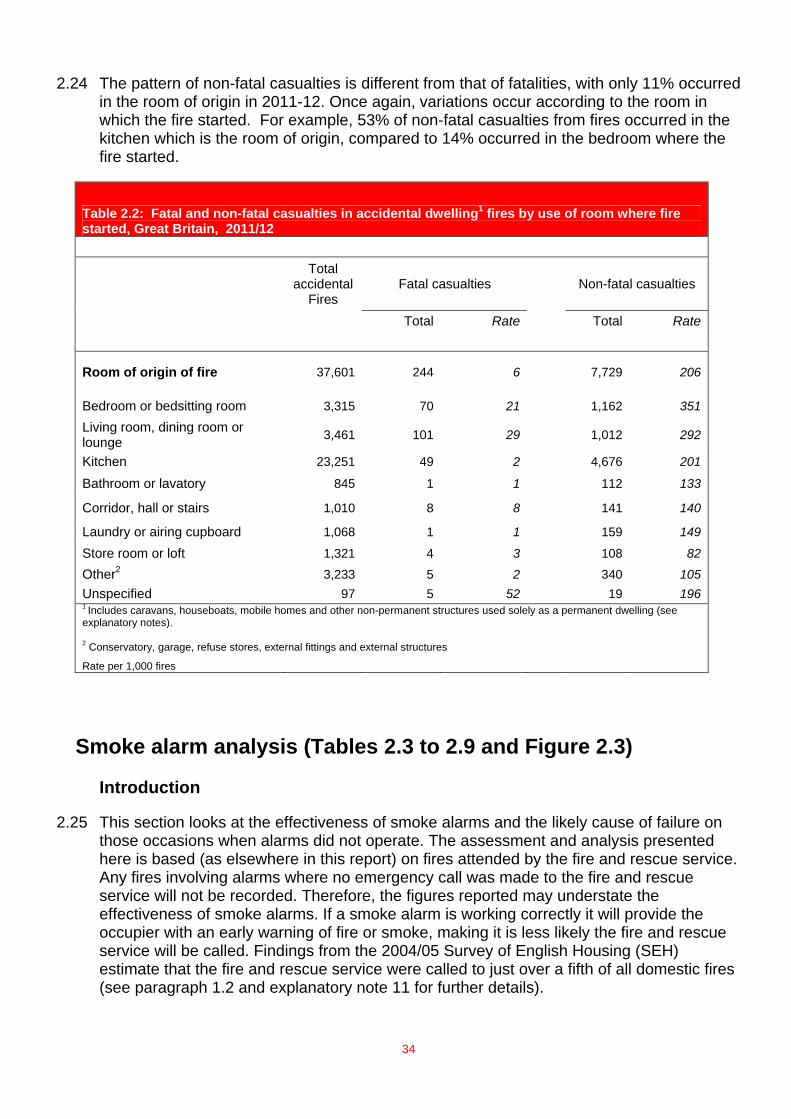
34
2.24 The pattern of non-fatal casualties is different from that of fatalities, with only 11% occurred in the room of origin in 2011-12. Once again, variations occur according to the room in which the fire started. For example, 53% of non-fatal casualties from fires occurred in the kitchen which is the room of origin, compared to 14% occurred in the bedroom where the fire started.
Table 2.2: Fatal and non-fatal casualties in accidental dwelling1 fires by use of room where fire started, Great Britain, 2011/12
Total accidental
Fires Fatal casualties Non-fatal casualties
Total Rate Total Rate
Room of origin of fire 37,601 244 6 7,729 206
Bedroom or bedsitting room 3,315 70 21 1,162 351
Living room, dining room or lounge 3,461 101 29 1,012 292
Kitchen 23,251 49 2 4,676 201
Bathroom or lavatory 845 1 1 112 133
Corridor, hall or stairs 1,010 8 8 141 140
Laundry or airing cupboard 1,068 1 1 159 149
Store room or loft 1,321 4 3 108 82
Other2 3,233 5 2 340 105 Unspecified 97 5 52 19 196 1 Includes caravans, houseboats, mobile homes and other non-permanent structures used solely as a permanent dwelling (see explanatory notes). 2 Conservatory, garage, refuse stores, external fittings and external structures
Rate per 1,000 fires
Smoke alarm analysis (Tables 2.3 to 2.9 and Figure 2.3)
Introduction
2.25 This section looks at the effectiveness of smoke alarms and the likely cause of failure on those occasions when alarms did not operate. The assessment and analysis presented here is based (as elsewhere in this report) on fires attended by the fire and rescue service. Any fires involving alarms where no emergency call was made to the fire and rescue service will not be recorded. Therefore, the figures reported may understate the effectiveness of smoke alarms. If a smoke alarm is working correctly it will provide the occupier with an early warning of fire or smoke, making it is less likely the fire and rescue service will be called. Findings from the 2004/05 Survey of English Housing (SEH) estimate that the fire and rescue service were called to just over a fifth of all domestic fires (see paragraph 1.2 and explanatory note 11 for further details).
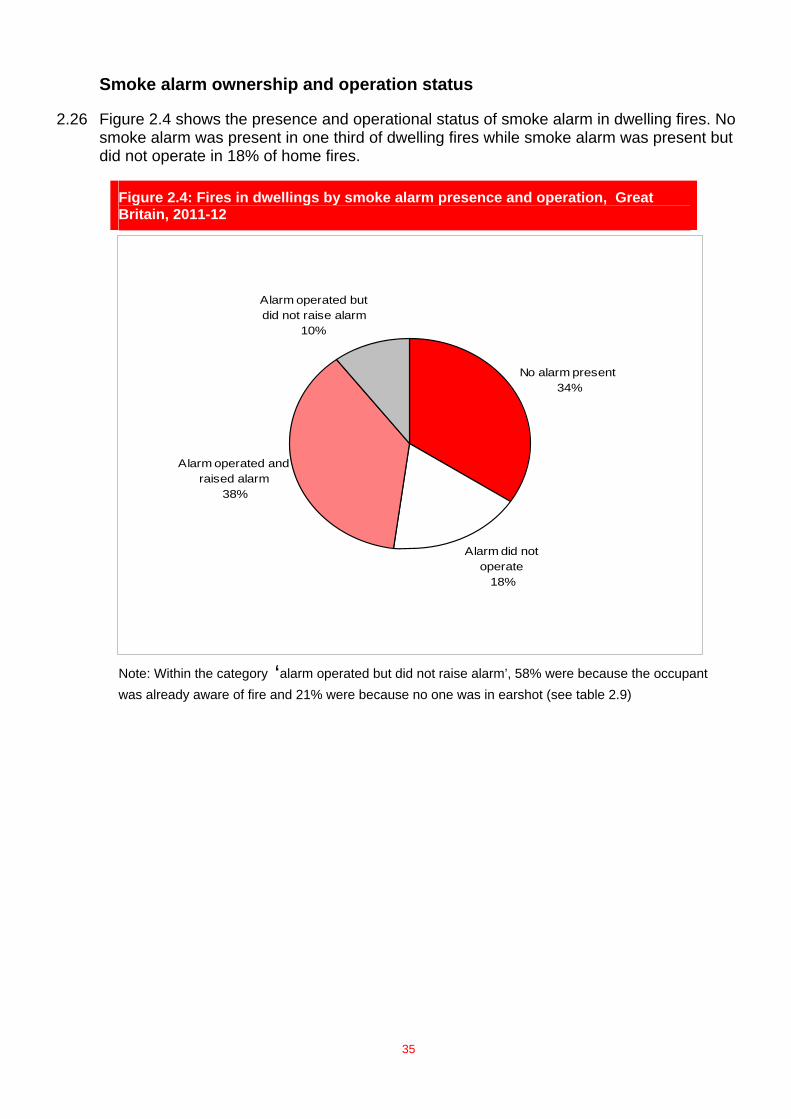
Smoke alarm ownership and operation status
2.26 Figure 2.4 shows the presence and operational status of smoke alarm in dwelling fires. No smoke alarm was present in one third of dwelling fires while smoke alarm was present but did not operate in 18% of home fires.
Figure 2.4: Fires in dwellings by smoke alarm presence and operation, Great Britain, 2011-12
Alarm operated and raised alarm
38%
Alarm operated but did not raise alarm
10%
Alarm did not operate 18%
No alarm present 34%
Note: Within the category ‘alarm operated but did not raise alarm’, 58% were because the occupant was already aware of fire and 21% were because no one was in earshot (see table 2.9)
35
36
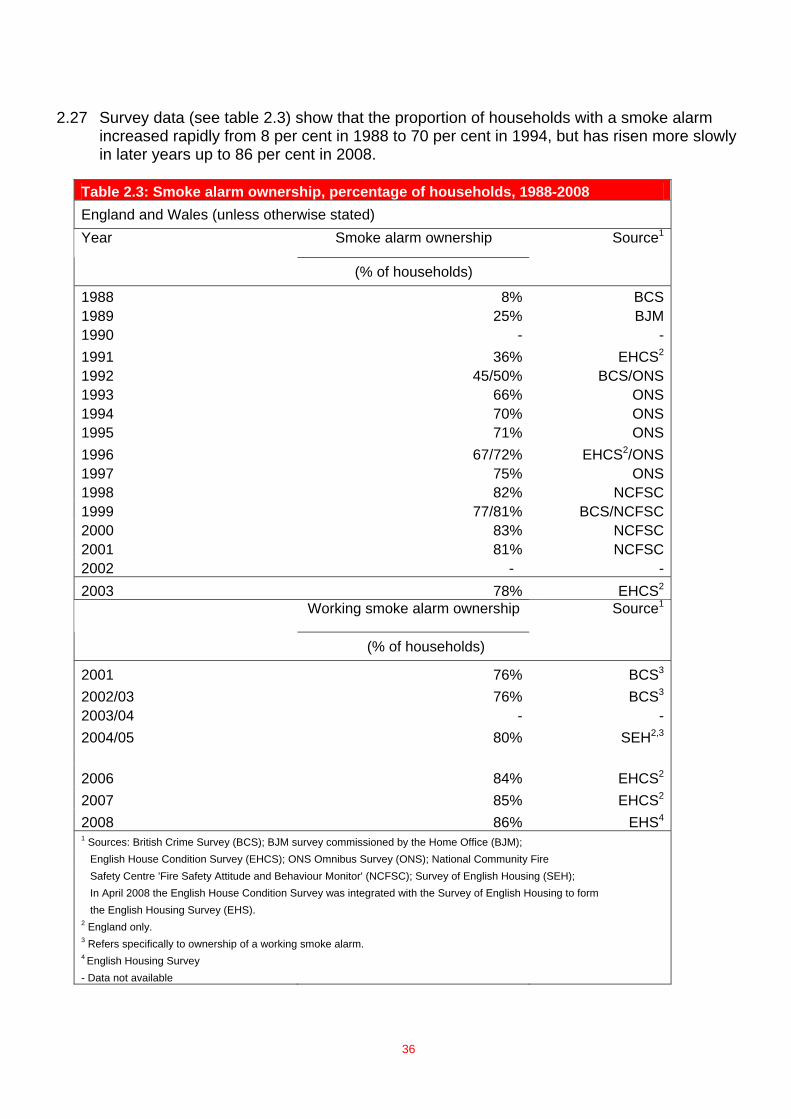
2.27 Survey data (see table 2.3) show that the proportion of households with a smoke alarm increased rapidly from 8 per cent in 1988 to 70 per cent in 1994, but has risen more slowly in later years up to 86 per cent in 2008.
Table 2.3: Smoke alarm ownership, percentage of households, 1988-2008 England and Wales (unless otherwise stated)
Smoke alarm ownership Year
(% of households)
Source1
1988 8% BCS1989 25% BJM1990 - -1991 36% EHCS2
1992 45/50% BCS/ONS1993 66% ONS1994 70% ONS1995 71% ONS1996 67/72% EHCS2/ONS1997 75% ONS1998 82% NCFSC1999 77/81% BCS/NCFSC2000 83% NCFSC2001 81% NCFSC2002 - -2003 78% EHCS2
Working smoke alarm ownership
(% of households)
Source1
2001 76% BCS3
2002/03 76% BCS3
2003/04 - -2004/05 80% SEH2,3
2006 84% EHCS2
2007 85% EHCS2
2008 86% EHS4
1 Sources: British Crime Survey (BCS); BJM survey commissioned by the Home Office (BJM); English House Condition Survey (EHCS); ONS Omnibus Survey (ONS); National Community Fire Safety Centre 'Fire Safety Attitude and Behaviour Monitor' (NCFSC); Survey of English Housing (SEH); In April 2008 the English House Condition Survey was integrated with the Survey of English Housing to form the English Housing Survey (EHS). 2 England only. 3 Refers specifically to ownership of a working smoke alarm. 4 English Housing Survey - Data not available
37
Smoke alarm presence, type and operation (Tables 2.4 to 2.6)
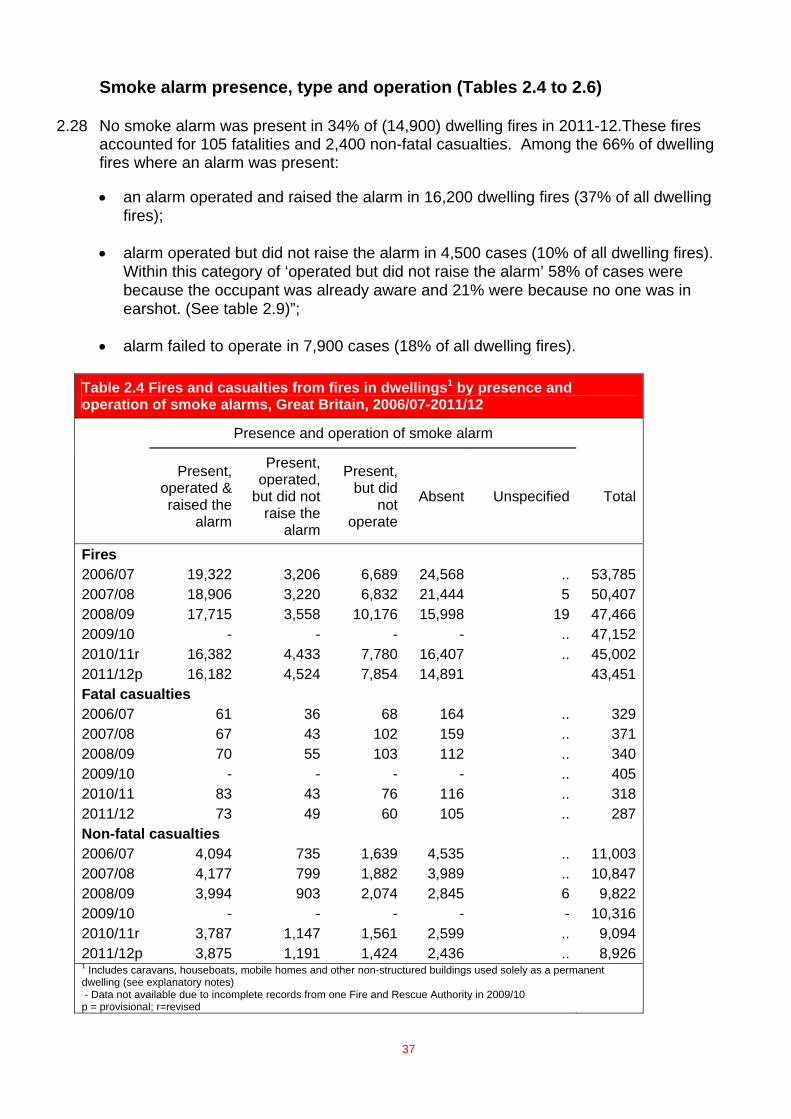
2.28 No smoke alarm was present in 34% of (14,900) dwelling fires in 2011-12.These fires accounted for 105 fatalities and 2,400 non-fatal casualties. Among the 66% of dwelling fires where an alarm was present:
• an alarm operated and raised the alarm in 16,200 dwelling fires (37% of all dwelling fires);
• alarm operated but did not raise the alarm in 4,500 cases (10% of all dwelling fires). Within this category of ‘operated but did not raise the alarm’ 58% of cases were because the occupant was already aware and 21% were because no one was in earshot. (See table 2.9)”;
• alarm failed to operate in 7,900 cases (18% of all dwelling fires).
Table 2.4 Fires and casualties from fires in dwellings1 by presence and operation of smoke alarms, Great Britain, 2006/07-2011/12
Presence and operation of smoke alarm
Present, operated & raised the
alarm
Present, operated,
but did not raise the
alarm
Present, but did
not operate
Absent Unspecified Total
Fires 2006/07 19,322 3,206 6,689 24,568 .. 53,785 2007/08 18,906 3,220 6,832 21,444 5 50,407 2008/09 17,715 3,558 10,176 15,998 19 47,466 2009/10 - - - - .. 47,152 2010/11r 16,382 4,433 7,780 16,407 .. 45,002 2011/12p 16,182 4,524 7,854 14,891 43,451 Fatal casualties 2006/07 61 36 68 164 .. 329 2007/08 67 43 102 159 .. 371 2008/09 70 55 103 112 .. 340 2009/10 - - - - .. 405 2010/11 83 43 76 116 .. 318 2011/12 73 49 60 105 .. 287 Non-fatal casualties 2006/07 4,094 735 1,639 4,535 .. 11,003 2007/08 4,177 799 1,882 3,989 .. 10,847 2008/09 3,994 903 2,074 2,845 6 9,822 2009/10 - - - - - 10,316 2010/11r 3,787 1,147 1,561 2,599 .. 9,094 2011/12p 3,875 1,191 1,424 2,436 .. 8,926 1 Includes caravans, houseboats, mobile homes and other non-structured buildings used solely as a permanent dwelling (see explanatory notes) - Data not available due to incomplete records from one Fire and Rescue Authority in 2009/10 p = provisional; r=revised
38
Type of alarm (Table 2.5)
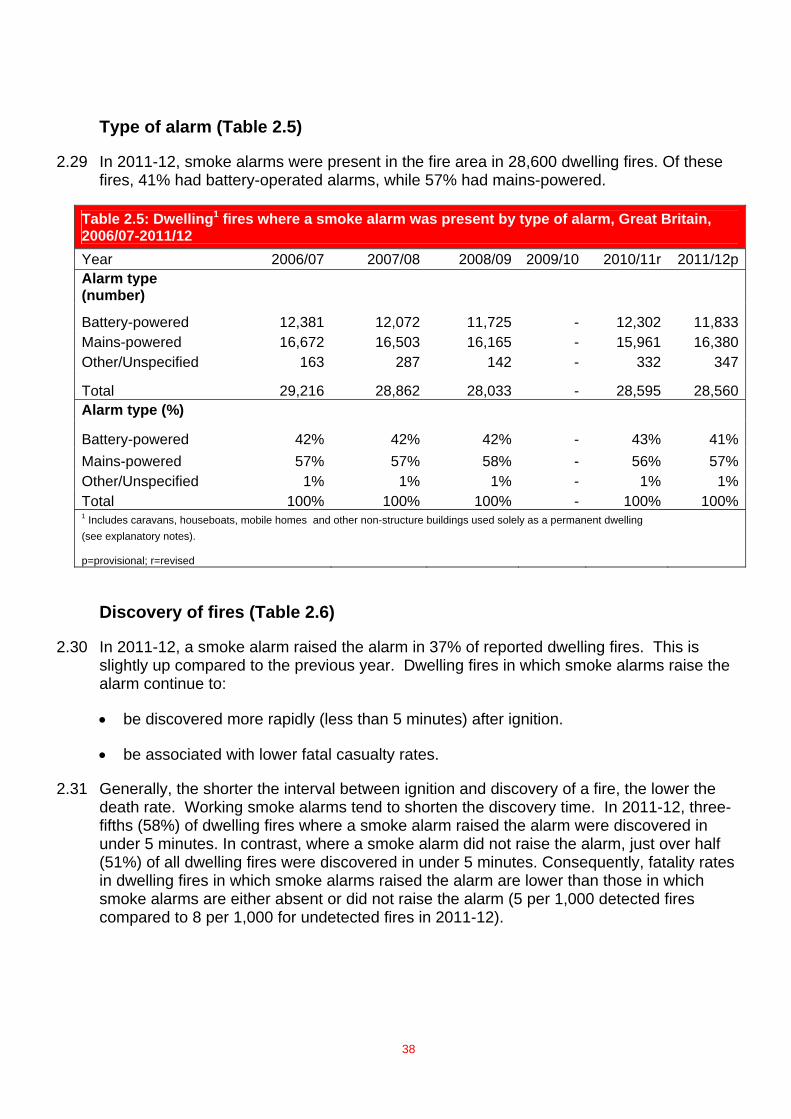
2.29 In 2011-12, smoke alarms were present in the fire area in 28,600 dwelling fires. Of these fires, 41% had battery-operated alarms, while 57% had mains-powered.
Table 2.5: Dwelling1 fires where a smoke alarm was present by type of alarm, Great Britain, 2006/07-2011/12 Year 2006/07 2007/08 2008/09 2009/10 2010/11r 2011/12pAlarm type (number)
Battery-powered 12,381 12,072 11,725 - 12,302 11,833Mains-powered 16,672 16,503 16,165 - 15,961 16,380Other/Unspecified 163 287 142 - 332 347
Total 29,216 28,862 28,033 - 28,595 28,560Alarm type (%)
Battery-powered 42% 42% 42% - 43% 41%Mains-powered 57% 57% 58% - 56% 57%Other/Unspecified 1% 1% 1% - 1% 1%Total 100% 100% 100% - 100% 100%1 Includes caravans, houseboats, mobile homes and other non-structure buildings used solely as a permanent dwelling (see explanatory notes). p=provisional; r=revised
Discovery of fires (Table 2.6)
2.30 In 2011-12, a smoke alarm raised the alarm in 37% of reported dwelling fires. This is slightly up compared to the previous year. Dwelling fires in which smoke alarms raise the alarm continue to:
• be discovered more rapidly (less than 5 minutes) after ignition.
• be associated with lower fatal casualty rates.
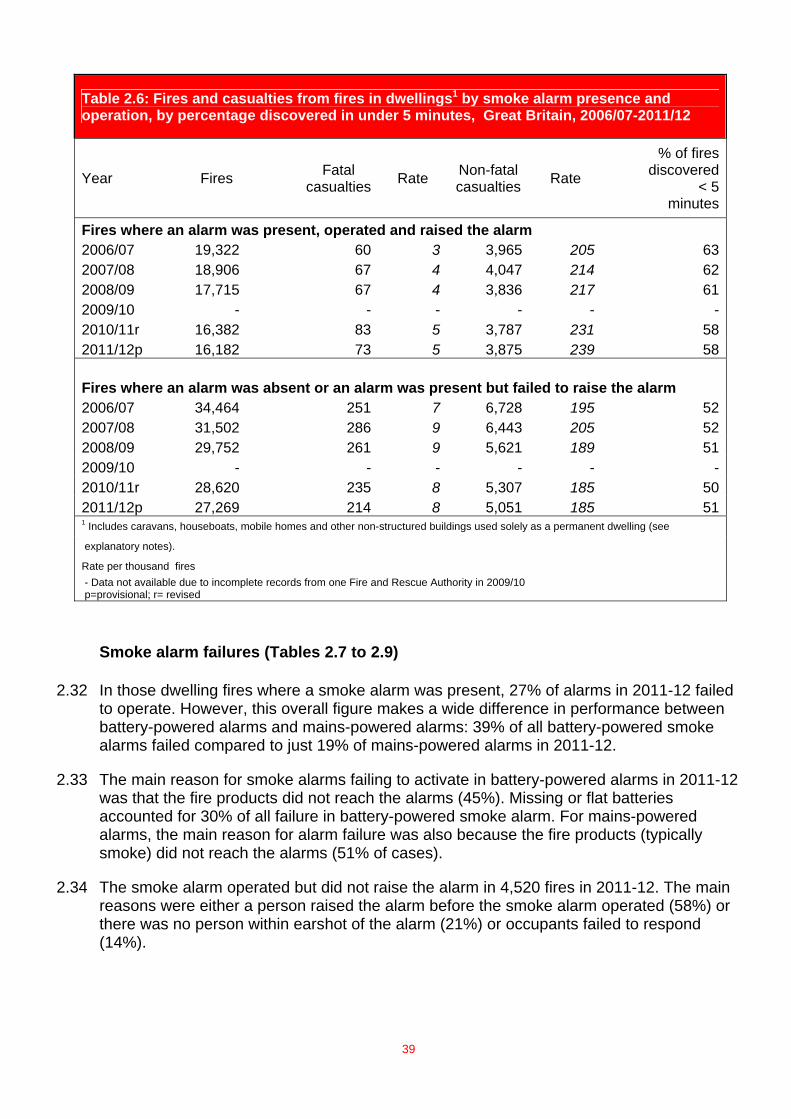
2.31 Generally, the shorter the interval between ignition and discovery of a fire, the lower the death rate. Working smoke alarms tend to shorten the discovery time. In 2011-12, three-fifths (58%) of dwelling fires where a smoke alarm raised the alarm were discovered in under 5 minutes. In contrast, where a smoke alarm did not raise the alarm, just over half (51%) of all dwelling fires were discovered in under 5 minutes. Consequently, fatality rates in dwelling fires in which smoke alarms raised the alarm are lower than those in which smoke alarms are either absent or did not raise the alarm (5 per 1,000 detected fires compared to 8 per 1,000 for undetected fires in 2011-12).
39
Table 2.6: Fires and casualties from fires in dwellings1 by smoke alarm presence and operation, by percentage discovered in under 5 minutes, Great Britain, 2006/07-2011/12
Year Fires Fatal casualties Rate Non-fatal
casualties Rate
% of fires discovered
< 5 minutes
Fires where an alarm was present, operated and raised the alarm 2006/07 19,322 60 3 3,965 205 632007/08 18,906 67 4 4,047 214 622008/09 17,715 67 4 3,836 217 612009/10 - - - - - -2010/11r 16,382 83 5 3,787 231 582011/12p 16,182 73 5 3,875 239 58
Fires where an alarm was absent or an alarm was present but failed to raise the alarm 2006/07 34,464 251 7 6,728 195 522007/08 31,502 286 9 6,443 205 522008/09 29,752 261 9 5,621 189 512009/10 - - - - - -2010/11r 28,620 235 8 5,307 185 502011/12p 27,269 214 8 5,051 185 511 Includes caravans, houseboats, mobile homes and other non-structured buildings used solely as a permanent dwelling (see
explanatory notes).
Rate per thousand fires - Data not available due to incomplete records from one Fire and Rescue Authority in 2009/10 p=provisional; r= revised
Smoke alarm failures (Tables 2.7 to 2.9)
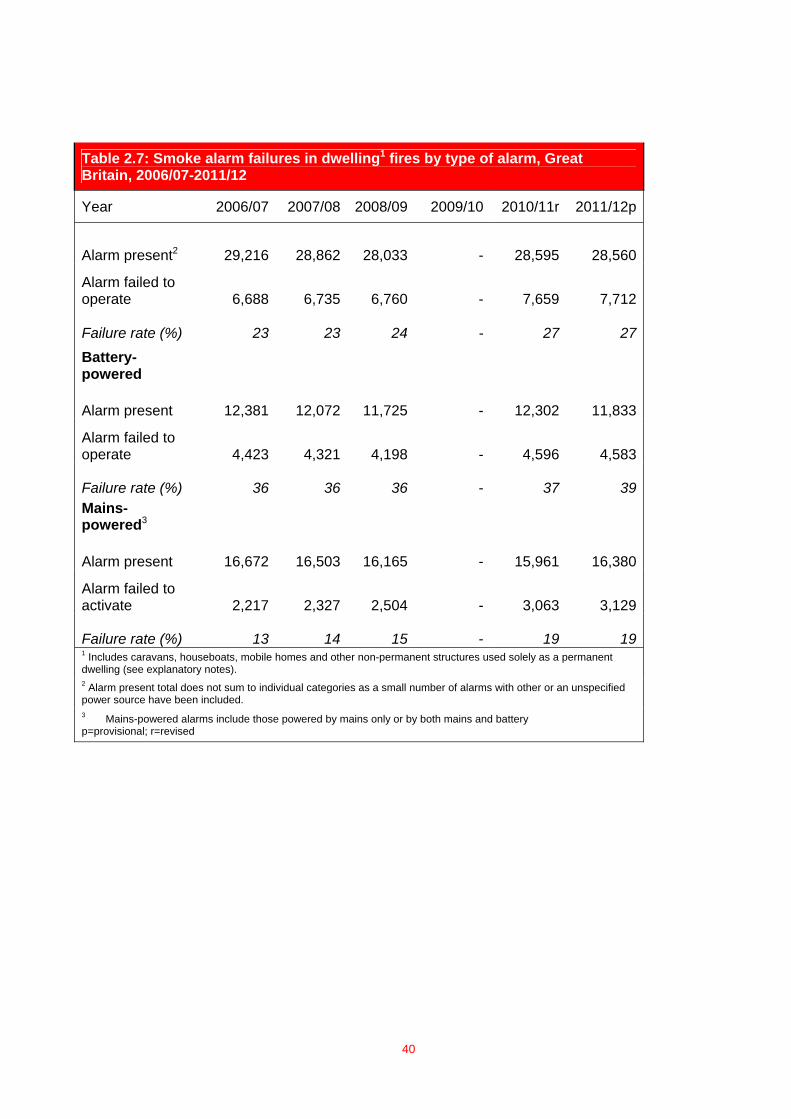
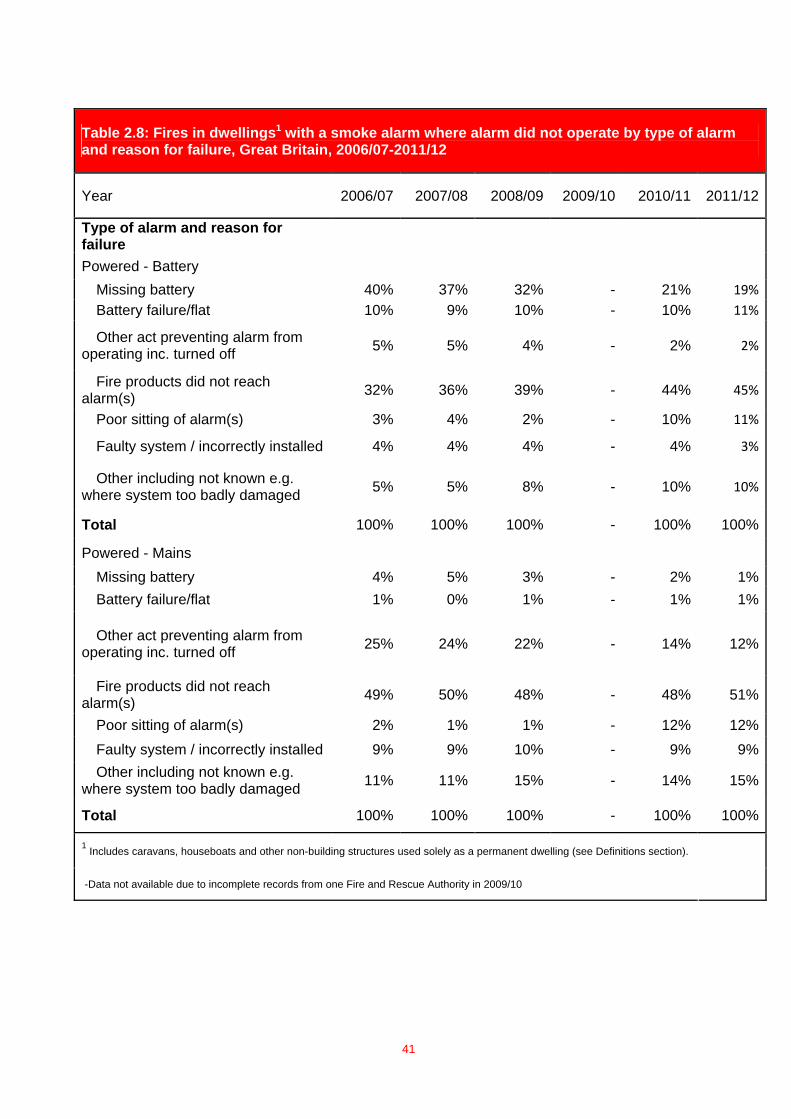
2.32 In those dwelling fires where a smoke alarm was present, 27% of alarms in 2011-12 failed to operate. However, this overall figure makes a wide difference in performance between battery-powered alarms and mains-powered alarms: 39% of all battery-powered smoke alarms failed compared to just 19% of mains-powered alarms in 2011-12.
2.33 The main reason for smoke alarms failing to activate in battery-powered alarms in 2011-12 was that the fire products did not reach the alarms (45%). Missing or flat batteries accounted for 30% of all failure in battery-powered smoke alarm. For mains-powered alarms, the main reason for alarm failure was also because the fire products (typically smoke) did not reach the alarms (51% of cases).
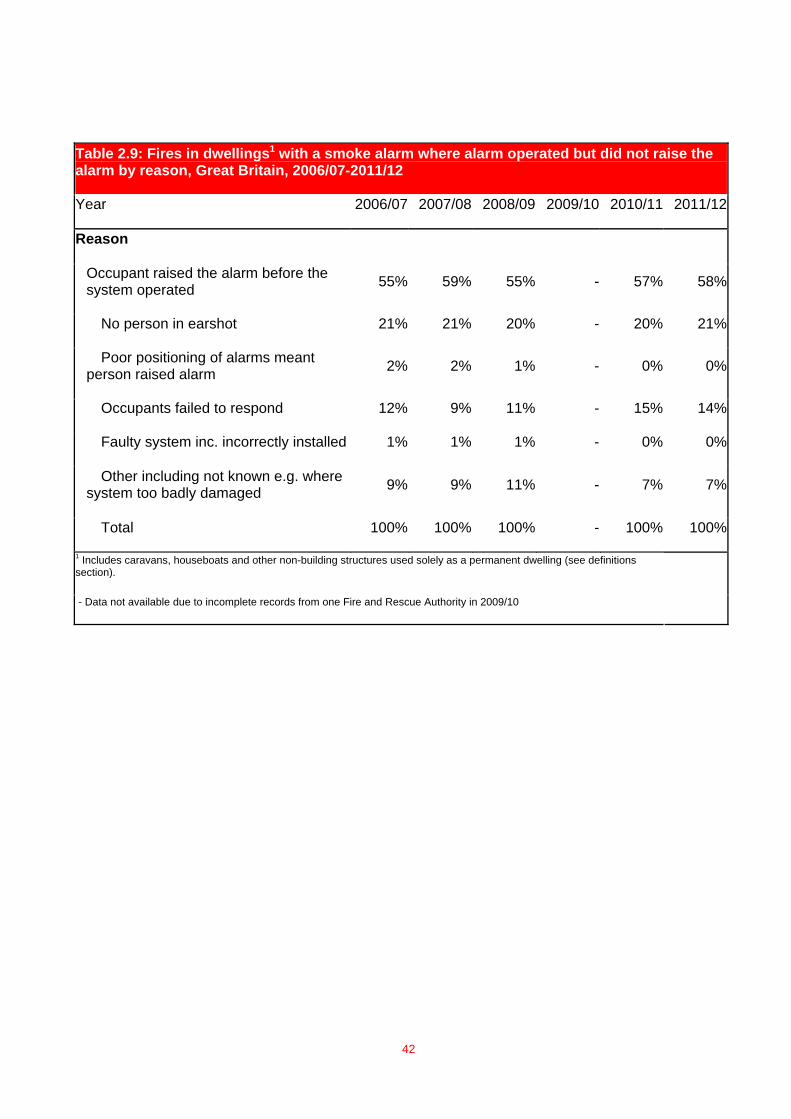
2.34 The smoke alarm operated but did not raise the alarm in 4,520 fires in 2011-12. The main reasons were either a person raised the alarm before the smoke alarm operated (58%) or there was no person within earshot of the alarm (21%) or occupants failed to respond (14%).
40
Table 2.7: Smoke alarm failures in dwelling1 fires by type of alarm, Great Britain, 2006/07-2011/12
Year 2006/07 2007/08 2008/09 2009/10 2010/11r 2011/12p
Alarm present2 29,216 28,862 28,033 - 28,595 28,560
Alarm failed to operate 6,688 6,735 6,760 - 7,659 7,712
Failure rate (%) 23 23 24 - 27 27 Battery-powered
Alarm present 12,381 12,072 11,725 - 12,302 11,833
Alarm failed to operate 4,423 4,321 4,198 - 4,596 4,583
Failure rate (%) 36 36 36 - 37 39 Mains-powered3
Alarm present 16,672 16,503 16,165 - 15,961 16,380
Alarm failed to activate 2,217 2,327 2,504 - 3,063 3,129
Failure rate (%) 13 14 15 - 19 19 1 Includes caravans, houseboats, mobile homes and other non-permanent structures used solely as a permanent dwelling (see explanatory notes). 2 Alarm present total does not sum to individual categories as a small number of alarms with other or an unspecified power source have been included. 3 Mains-powered alarms include those powered by mains only or by both mains and battery p=provisional; r=revised
41
Table 2.8: Fires in dwellings1 with a smoke alarm where alarm did not operate by type of alarm and reason for failure, Great Britain, 2006/07-2011/12
Year 2006/07 2007/08 2008/09 2009/10 2010/11 2011/12
Type of alarm and reason for failure
Powered - Battery Missing battery 40% 37% 32% - 21% 19%Battery failure/flat 10% 9% 10% - 10% 11%
Other act preventing alarm from operating inc. turned off 5% 5% 4% - 2% 2%
Fire products did not reach alarm(s) 32% 36% 39% - 44% 45%
Poor sitting of alarm(s) 3% 4% 2% - 10% 11%
Faulty system / incorrectly installed 4% 4% 4% - 4% 3%
Other including not known e.g. where system too badly damaged 5% 5% 8% - 10% 10%
Total 100% 100% 100% - 100% 100%
Powered - Mains Missing battery 4% 5% 3% - 2% 1%Battery failure/flat 1% 0% 1% - 1% 1%
Other act preventing alarm from operating inc. turned off 25% 24% 22% - 14% 12%
Fire products did not reach alarm(s) 49% 50% 48% - 48% 51%
Poor sitting of alarm(s) 2% 1% 1% - 12% 12%
Faulty system / incorrectly installed 9% 9% 10% - 9% 9%Other including not known e.g.
where system too badly damaged 11% 11% 15% - 14% 15%
Total 100% 100% 100% - 100% 100%
1 Includes caravans, houseboats and other non-building structures used solely as a permanent dwelling (see Definitions section).
-Data not available due to incomplete records from one Fire and Rescue Authority in 2009/10
42
Table 2.9: Fires in dwellings1 with a smoke alarm where alarm operated but did not raise the alarm by reason, Great Britain, 2006/07-2011/12
Year 2006/07 2007/08 2008/09 2009/10 2010/11 2011/12
Reason
Occupant raised the alarm before the system operated 55% 59% 55% - 57% 58%
No person in earshot 21% 21% 20% - 20% 21%
Poor positioning of alarms meant person raised alarm 2% 2% 1% - 0% 0%
Occupants failed to respond 12% 9% 11% - 15% 14%
Faulty system inc. incorrectly installed 1% 1% 1% - 0% 0%
Other including not known e.g. where system too badly damaged 9% 9% 11% - 7% 7%
Total 100% 100% 100% - 100% 100%
1 Includes caravans, houseboats and other non-building structures used solely as a permanent dwelling (see definitions section).
- Data not available due to incomplete records from one Fire and Rescue Authority in 2009/10
43
Deliberate fires (Tables 2, 24 and 2.10)
2.35 Approximately 14% of all dwelling fires in 2011-12 were deliberate or suspected to be deliberately started. The number of deliberate dwelling fires fell for the eighth consecutive year - down by more than a half from 13,200 in 2003-04 to 5,900 in 2011-12. Of the total 32,496 deliberate fires in 2011-12, only 18% were in dwellings. The majority of deliberate fires (43%) involved road vehicles – 13,900 fires (see Chapter 4 for further details).
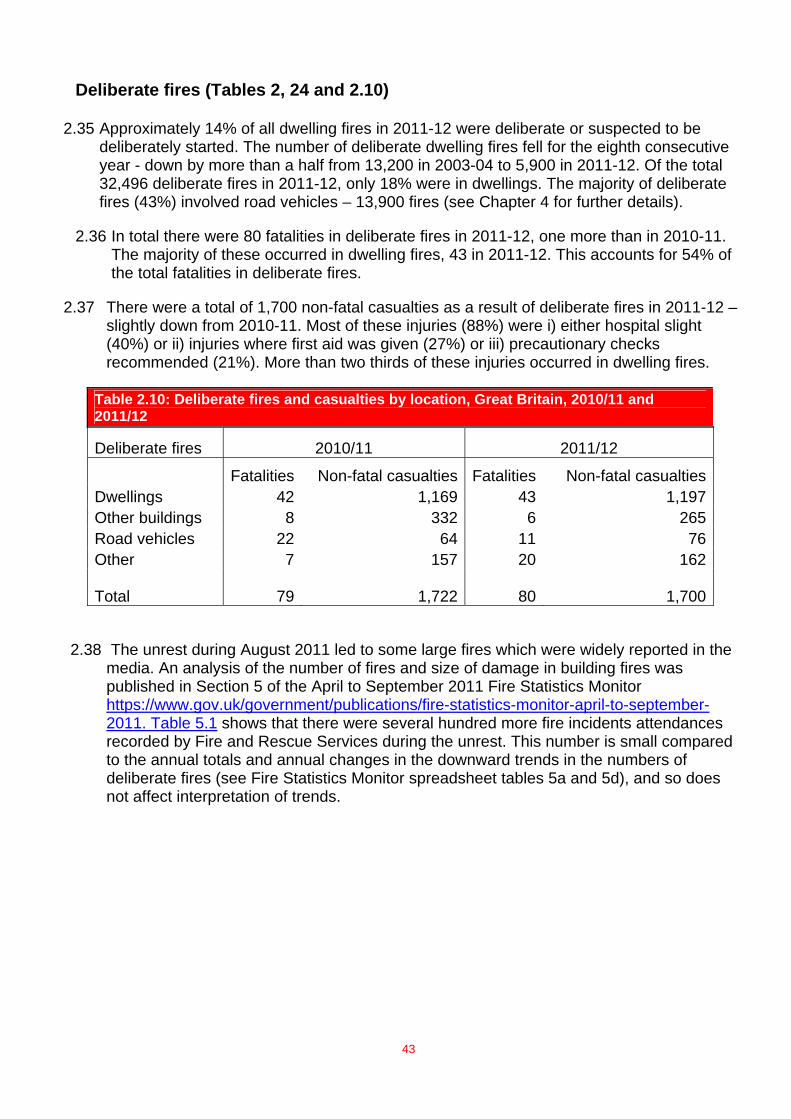
2.36 In total there were 80 fatalities in deliberate fires in 2011-12, one more than in 2010-11. The majority of these occurred in dwelling fires, 43 in 2011-12. This accounts for 54% of the total fatalities in deliberate fires.
2.37 There were a total of 1,700 non-fatal casualties as a result of deliberate fires in 2011-12 – slightly down from 2010-11. Most of these injuries (88%) were i) either hospital slight (40%) or ii) injuries where first aid was given (27%) or iii) precautionary checks recommended (21%). More than two thirds of these injuries occurred in dwelling fires.
Table 2.10: Deliberate fires and casualties by location, Great Britain, 2010/11 and 2011/12
Deliberate fires 2010/11 2011/12
Fatalities Non-fatal casualties Fatalities Non-fatal casualtiesDwellings 42 1,169 43 1,197Other buildings 8 332 6 265Road vehicles 22 64 11 76Other 7 157 20 162 Total 79 1,722 80 1,700
2.38 The unrest during August 2011 led to some large fires which were widely reported in the media. An analysis of the number of fires and size of damage in building fires was published in Section 5 of the April to September 2011 Fire Statistics Monitor https://www.gov.uk/government/publications/fire-statistics-monitor-april-to-september-2011. Table 5.1 shows that there were several hundred more fire incidents attendances recorded by Fire and Rescue Services during the unrest. This number is small compared to the annual totals and annual changes in the downward trends in the numbers of deliberate fires (see Fire Statistics Monitor spreadsheet tables 5a and 5d), and so does not affect interpretation of trends.
44
Chapter 3 – Other Buildings
Introduction (Tables 1b, 2 and 6)
3.1 In 2011-12 there were 24,100 fires recorded in buildings other than dwellings, 4% fewer than 2010-11. This is the lowest figure recorded in more than a decade. The majority of fires occurred in:
• private garages and sheds (26%) – 6,200 fires
• retail distribution (15%) - 3,700 fires
• industrial premises (12%) - 2,900 fires
• restaurants, cafes, public houses etc (10%) - 2,500 fires
• recreational and other cultural services (6%) - 1,500 fires.
3.2 In 2011-12, 25 people died in buildings fires other than dwellings – compared with 21 in 2010-11. Also, 1,200 injuries were sustained in other building fires in 2011-12 - little changed (1% lower) compared with 2010-11. These figures represent around 7% of all fire fatalities and 11% of non-fatal injuries.
Accidental fires (Table 2)
Trends
3.3 Seventy per cent of all fires in other buildings were started accidentally compared to 86% of those in fires in dwellings. In 2011-12, a total of 16,800 accidental fires were recorded in other buildings, 5% fewer than in 2010-11. The overall trend in such fires over the last ten years has been downward, with the 2011-12 figure 27% lower than the 2001-02 figure of 23,000.
Cause of fire
3.4 As in the previous year, the main cause of accidental fires in other buildings in 2011-12 was faulty appliances and leads. This represented 24% of all such fires. Fires from this cause reduced by 10% to 4,000 in 2011-12. Another key cause of accidental fires in other buildings was the misuse of equipments or appliances which accounted for 2,600, and was down by 9% on 2010-11.
Source of ignition (Table 3)
3.5 Main sources of ignition in fires in other buildings are cooking appliances and other electrical appliances. They accounted for more than one third of accidental fires. The number of fires started by cooking appliances declined by 9% and fires from other electrical appliances declined by 7% in 2011-12. Other key changes relating to source of ignition from 2010-11 were:
• Smokers’ materials – increased by 6% to 1,200, while there were 261 fires started by cigarette lighters or matches;
• Electrical distribution (leads to appliances, wires and cables) – decreased by 7% to 2,800.
Deliberate fires (Tables 2 and 24, Figure 3.1)
Trends
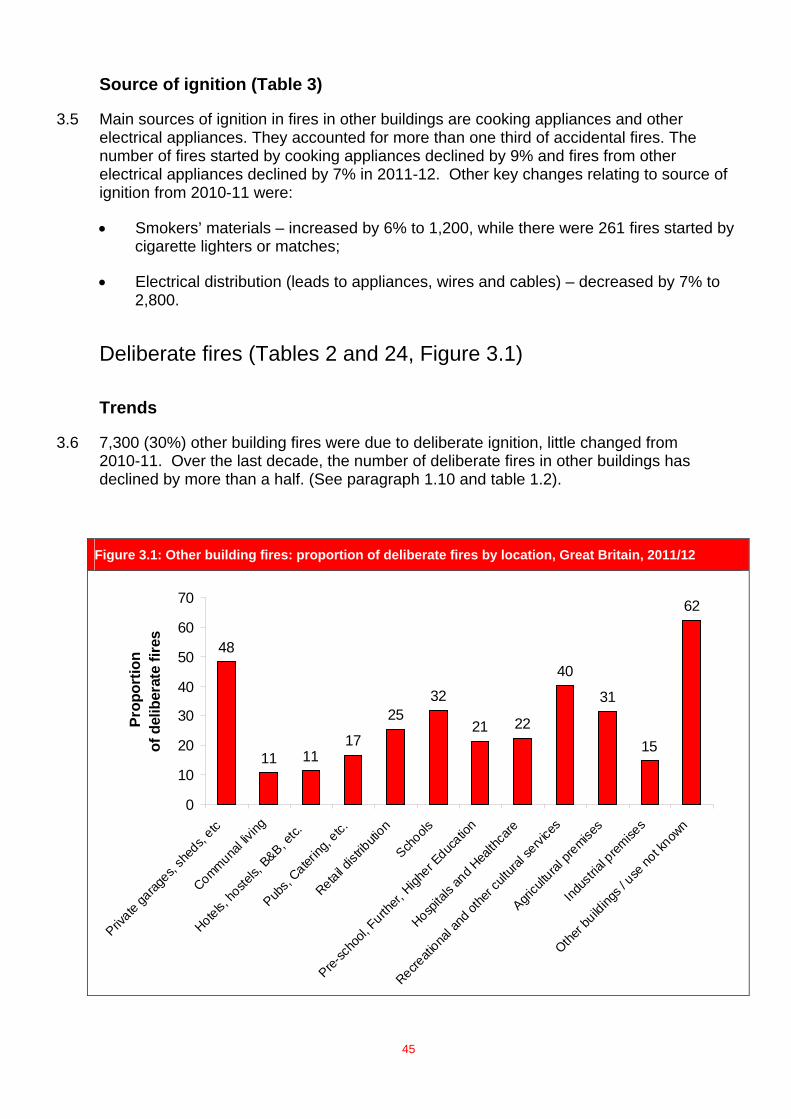
3.6 7,300 (30%) other building fires were due to deliberate ignition, little changed from 2010-11. Over the last decade, the number of deliberate fires in other buildings has declined by more than a half. (See paragraph 1.10 and table 1.2).
Figure 3.1: Other building fires: proportion of deliberate fires by location, Great Britain, 2011/12
48
11 1117
2532
21 22
40
31
15
62
0
10
20
30
40
50
60
70
Private ga
rages,
shed
s, etc
Communal liv
ing
Hotels, ho
stels,
B&B, etc.
Pubs,
Catering
, etc.
Retail dist
ributi
on
Schools
Pre-sc
hool,
Further,
High
er Educ
ation
Hospita
ls an
d Hea
lthca
re
Recreati
onal a
nd ot
her c
ultura
l servi
ces
Agricu
ltural
premise
s
Indus
trial p
remise
s
Other b
uilding
s / use
not k
nown
Prop
ortio
n of
del
iber
ate
fires
45
Location (Figure 3.1)
3.7 A comparison of the number of deliberate fires in other building locations with the total fires shows that certain buildings are more prone to deliberate ignition than others. The main locations in 2011-12 were private garages and sheds (48%), recreational and other cultural services premises (40%); and schools (32%) and buildings whose use was not known or not categorised (62%),
Non-fatal casualties and Location (Figure 3.2)
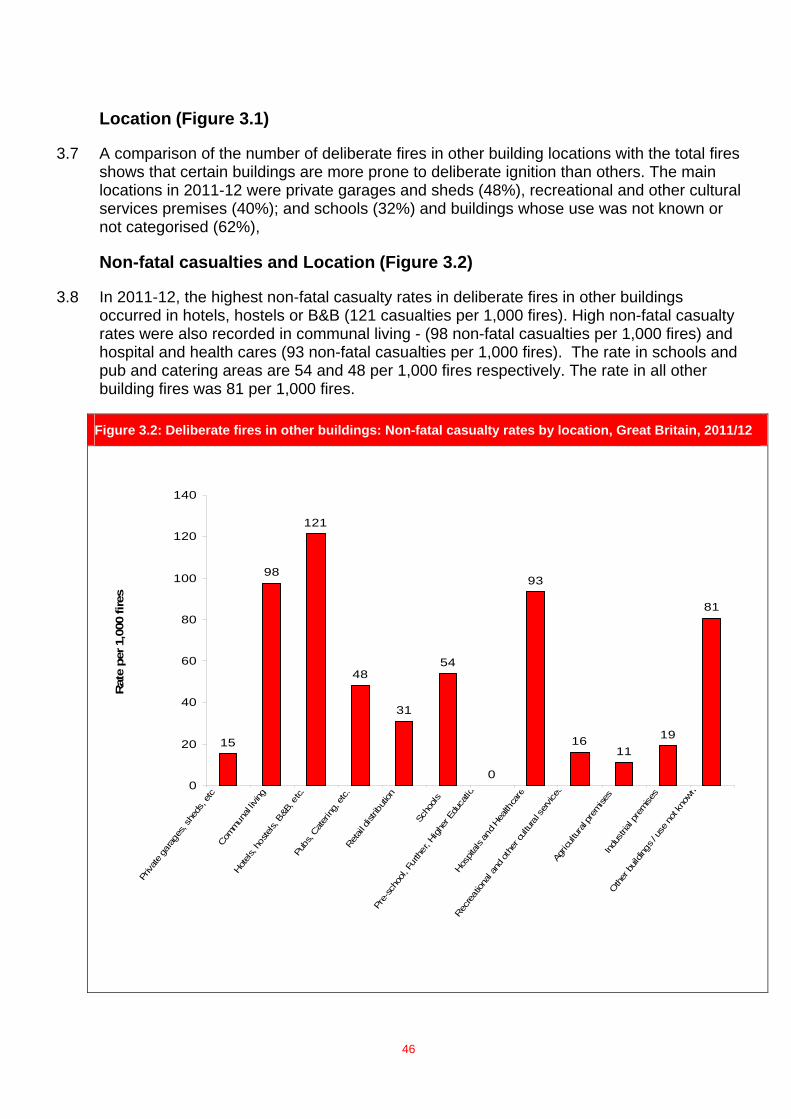
3.8 In 2011-12, the highest non-fatal casualty rates in deliberate fires in other buildings occurred in hotels, hostels or B&B (121 casualties per 1,000 fires). High non-fatal casualty rates were also recorded in communal living - (98 non-fatal casualties per 1,000 fires) and hospital and health cares (93 non-fatal casualties per 1,000 fires). The rate in schools and pub and catering areas are 54 and 48 per 1,000 fires respectively. The rate in all other building fires was 81 per 1,000 fires.
Figure 3.2: Deliberate fires in other buildings: Non-fatal casualty rates by location, Great Britain, 2011/12
15
98
121
48
31
54
0
93
1611
19
81
0
20
40
60
80
100
120
140
Priva
te g
arag
es, s
heds
, etc
Comm
unal
living
Hote
ls, h
ostels,
B&B
, etc.
Pubs
, Cat
ering,
etc.
Retail d
istrib
ution
Scho
ols
Pre-
scho
ol, F
urth
er, H
ighe
r Edu
catio
n
Hosp
itals
and He
althc
are
Recr
eatio
nal a
nd o
ther
cul
tura
l ser
vices
Agric
ultura
l pre
mise
sIn
dust
rial p
rem
ises
Oth
er b
uildin
gs / us
e no
t kno
wn
Rat
e pe
r 1,0
00 fi
res
46
Automatic smoke alarm analyses in other buildings (Tables 3.1 to 3.3, Figure 3.3)
Introduction
3.9 This section looks at the effectiveness of smoke alarms and the likely causes of failure on those occasions when alarms did not operate. The assessment and analysis presented here is based (as elsewhere in this report) on fires attended by the fire and rescue service. Any fires involving alarms where no emergency call was made will not be recorded, meaning that effectiveness of automatic fire alarms may be understated. See paragraph 2.26 for further details in relation to domestic smoke alarms.
Automatic smoke alarm presence and operation
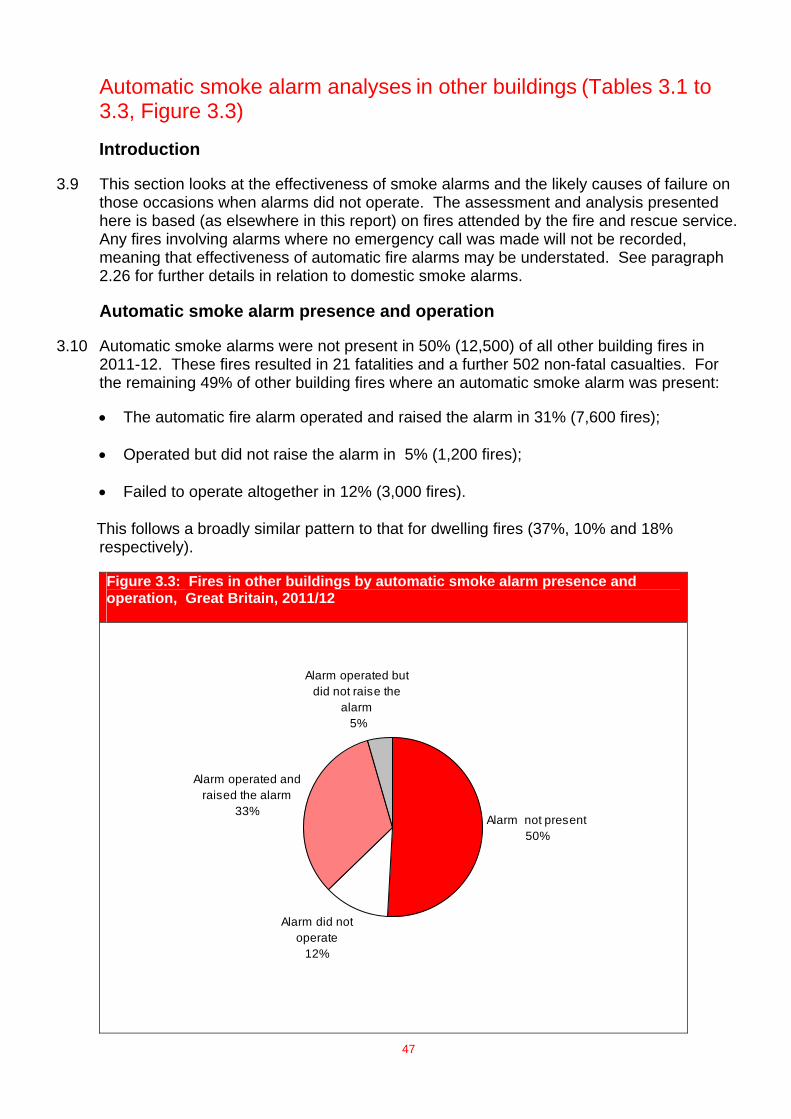
3.10 Automatic smoke alarms were not present in 50% (12,500) of all other building fires in 2011-12. These fires resulted in 21 fatalities and a further 502 non-fatal casualties. For the remaining 49% of other building fires where an automatic smoke alarm was present:
• The automatic fire alarm operated and raised the alarm in 31% (7,600 fires);
• Operated but did not raise the alarm in 5% (1,200 fires);
• Failed to operate altogether in 12% (3,000 fires).
This follows a broadly similar pattern to that for dwelling fires (37%, 10% and 18% respectively).
Figure 3.3: Fires in other buildings by automatic smoke alarm presence and operation, Great Britain, 2011/12
Alarm did not operate
12%
Alarm operated and raised the alarm
33%
Alarm operated but did not raise the
alarm 5%
Alarm not present 50%
47
48
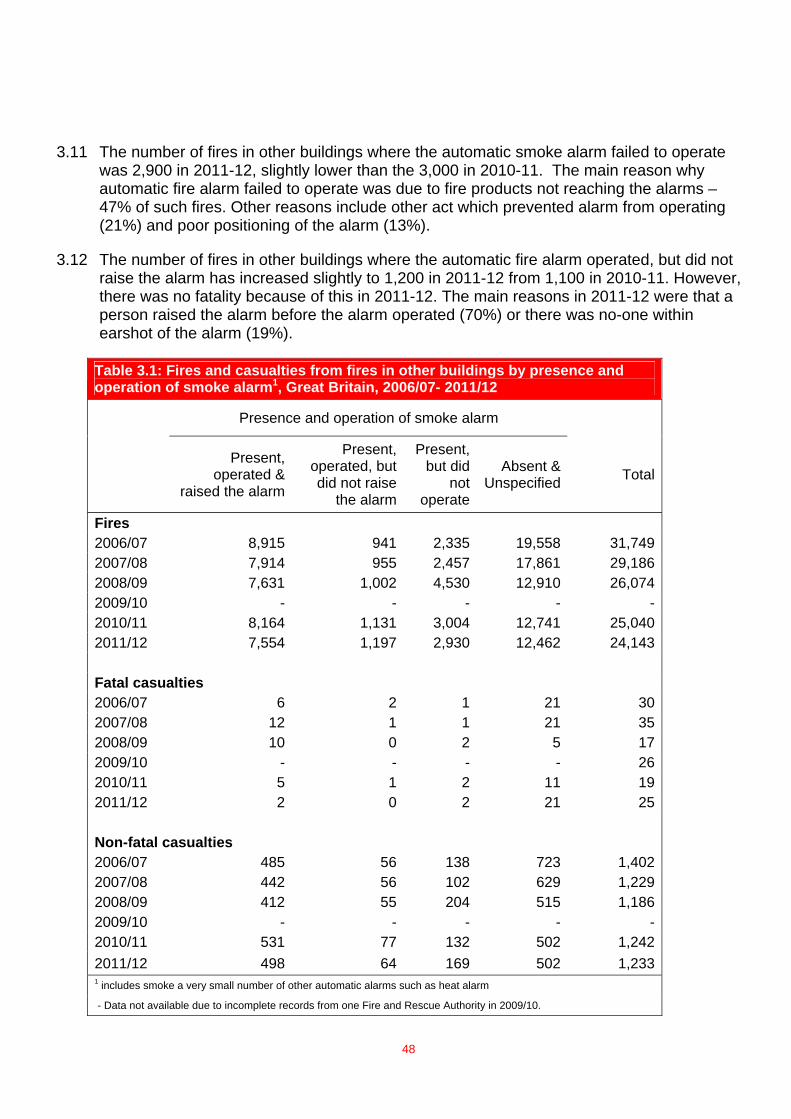
3.11 The number of fires in other buildings where the automatic smoke alarm failed to operate was 2,900 in 2011-12, slightly lower than the 3,000 in 2010-11. The main reason why automatic fire alarm failed to operate was due to fire products not reaching the alarms – 47% of such fires. Other reasons include other act which prevented alarm from operating (21%) and poor positioning of the alarm (13%).
3.12 The number of fires in other buildings where the automatic fire alarm operated, but did not raise the alarm has increased slightly to 1,200 in 2011-12 from 1,100 in 2010-11. However, there was no fatality because of this in 2011-12. The main reasons in 2011-12 were that a person raised the alarm before the alarm operated (70%) or there was no-one within earshot of the alarm (19%).
Table 3.1: Fires and casualties from fires in other buildings by presence and operation of smoke alarm1, Great Britain, 2006/07- 2011/12
Presence and operation of smoke alarm
Present,
operated & raised the alarm
Present, operated, but did not raise
the alarm
Present, but did
not operate
Absent & Unspecified Total
Fires 2006/07 8,915 941 2,335 19,558 31,7492007/08 7,914 955 2,457 17,861 29,1862008/09 7,631 1,002 4,530 12,910 26,0742009/10 - - - - -2010/11 8,164 1,131 3,004 12,741 25,0402011/12 7,554 1,197 2,930 12,462 24,143 Fatal casualties 2006/07 6 2 1 21 302007/08 12 1 1 21 352008/09 10 0 2 5 172009/10 - - - - 262010/11 5 1 2 11 192011/12 2 0 2 21 25 Non-fatal casualties 2006/07 485 56 138 723 1,4022007/08 442 56 102 629 1,2292008/09 412 55 204 515 1,1862009/10 - - - - -2010/11 531 77 132 502 1,2422011/12 498 64 169 502 1,2331 includes smoke a very small number of other automatic alarms such as heat alarm - Data not available due to incomplete records from one Fire and Rescue Authority in 2009/10.
49
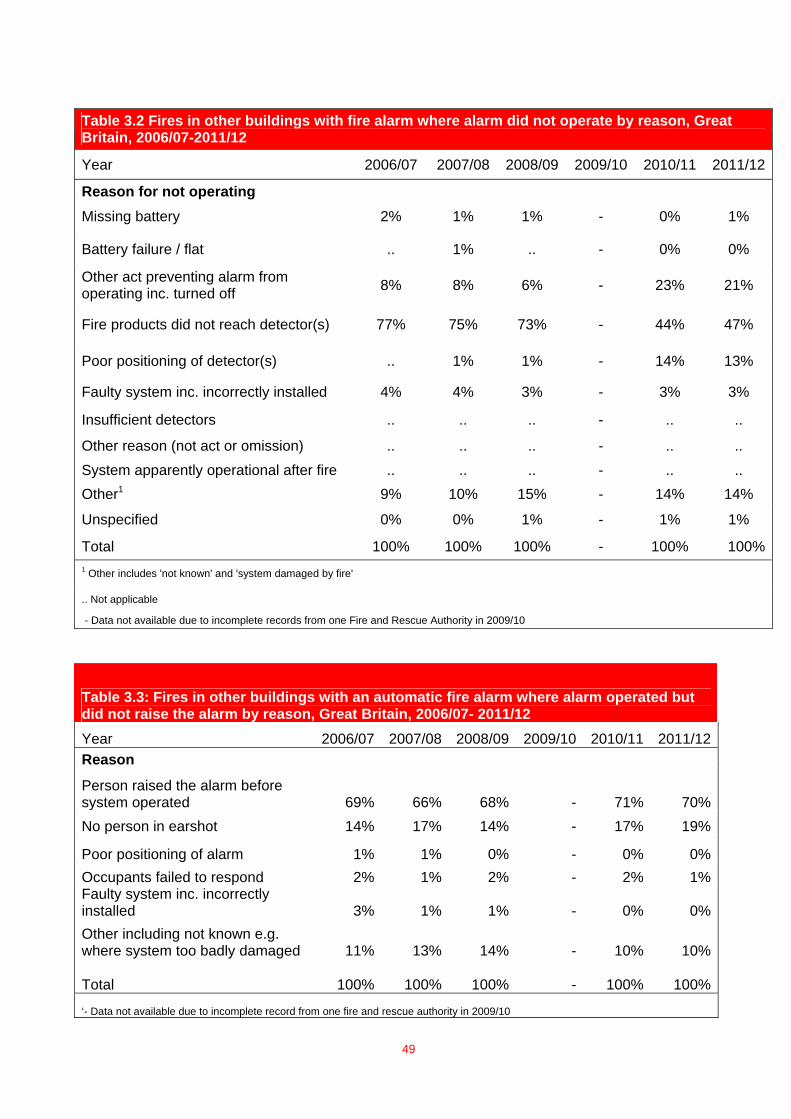
Table 3.2 Fires in other buildings with fire alarm where alarm did not operate by reason, Great Britain, 2006/07-2011/12
Year 2006/07 2007/08 2008/09 2009/10 2010/11 2011/12
Reason for not operating
Missing battery 2% 1% 1% - 0% 1%
Battery failure / flat .. 1% .. - 0% 0%
Other act preventing alarm from operating inc. turned off 8% 8% 6% - 23% 21%
Fire products did not reach detector(s) 77% 75% 73% - 44% 47%
Poor positioning of detector(s) .. 1% 1% - 14% 13%
Faulty system inc. incorrectly installed 4% 4% 3% - 3% 3%
Insufficient detectors .. .. .. - .. ..
Other reason (not act or omission) .. .. .. - .. ..
System apparently operational after fire .. .. .. - .. .. Other1 9% 10% 15% - 14% 14%
Unspecified 0% 0% 1% - 1% 1%
Total 100% 100% 100% - 100% 100%1 Other includes 'not known' and 'system damaged by fire' .. Not applicable - Data not available due to incomplete records from one Fire and Rescue Authority in 2009/10
Table 3.3: Fires in other buildings with an automatic fire alarm where alarm operated but did not raise the alarm by reason, Great Britain, 2006/07- 2011/12 Year 2006/07 2007/08 2008/09 2009/10 2010/11 2011/12Reason
Person raised the alarm before system operated 69% 66% 68% - 71% 70%No person in earshot 14% 17% 14% - 17% 19%
Poor positioning of alarm 1% 1% 0% - 0% 0%Occupants failed to respond 2% 1% 2% - 2% 1%Faulty system inc. incorrectly installed 3% 1% 1% - 0% 0%Other including not known e.g. where system too badly damaged 11% 13% 14% - 10% 10%
Total 100% 100% 100% - 100% 100%
‘- Data not available due to incomplete record from one fire and rescue authority in 2009/10
Chapter 4 – Road Vehicle Fires
Introduction (Table 16) 4.1 Road vehicle fires in 2011-12 totalled 28,000 in 2011-12, down by 14% from 32,600 in
2010-11. The 2011-12 total represented the lowest in more than a decade and declined by nearly three quarters from its peak in 2001/02.
4.2 A breakdown of the road vehicles figure shows that the majority (65%) of fires occurred in cars, 10% were in vans, 4% were in lorries and 2% in buses or minibuses. The number of car fires was 17% lower than in 2010-11 and 79% lower than in 2001-02.
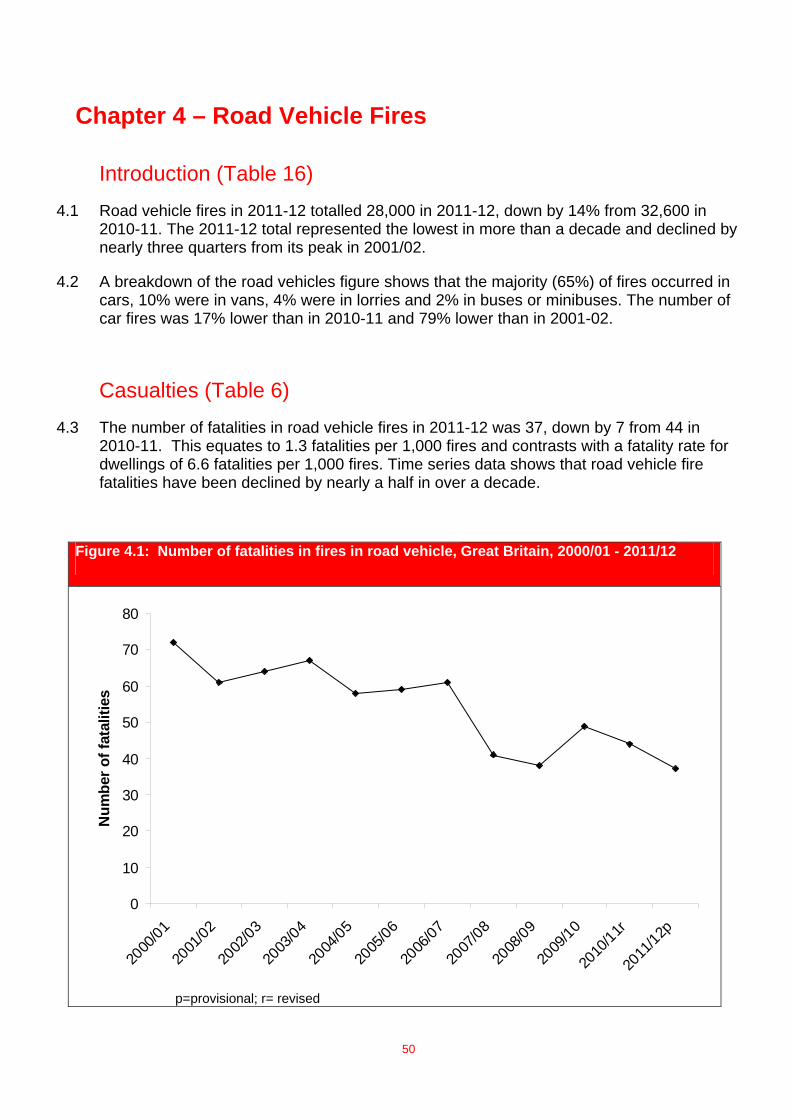
Casualties (Table 6) 4.3 The number of fatalities in road vehicle fires in 2011-12 was 37, down by 7 from 44 in
2010-11. This equates to 1.3 fatalities per 1,000 fires and contrasts with a fatality rate for dwellings of 6.6 fatalities per 1,000 fires. Time series data shows that road vehicle fire fatalities have been declined by nearly a half in over a decade.
Figure 4.1: Number of fatalities in fires in road vehicle, Great Britain, 2000/01 - 2011/12
0
10
20
30
40
50
60
70
80
2000
/01
2001
/02
2002
/03
2003
/04
2004
/05
2005
/06
2006
/07
2007
/08
2008
/09
2009
/10
2010
/11r
2011
/12p
Num
ber o
f fat
aliti
es
p=provisional; r= revised
50

51
4.4 The number of non-fatal casualties in road vehicle fires increased slightly to 600 in 2011-12 from 520 in 2010-11. This is much lower than the levels recorded in 2000-01 (700 non-fatal cases). These latest figures equate to 21 non-fatal casualties per 1,000 fires, compared with 205 in dwellings and 51 in other buildings.
52
Chapter 5 – Outdoor Fires
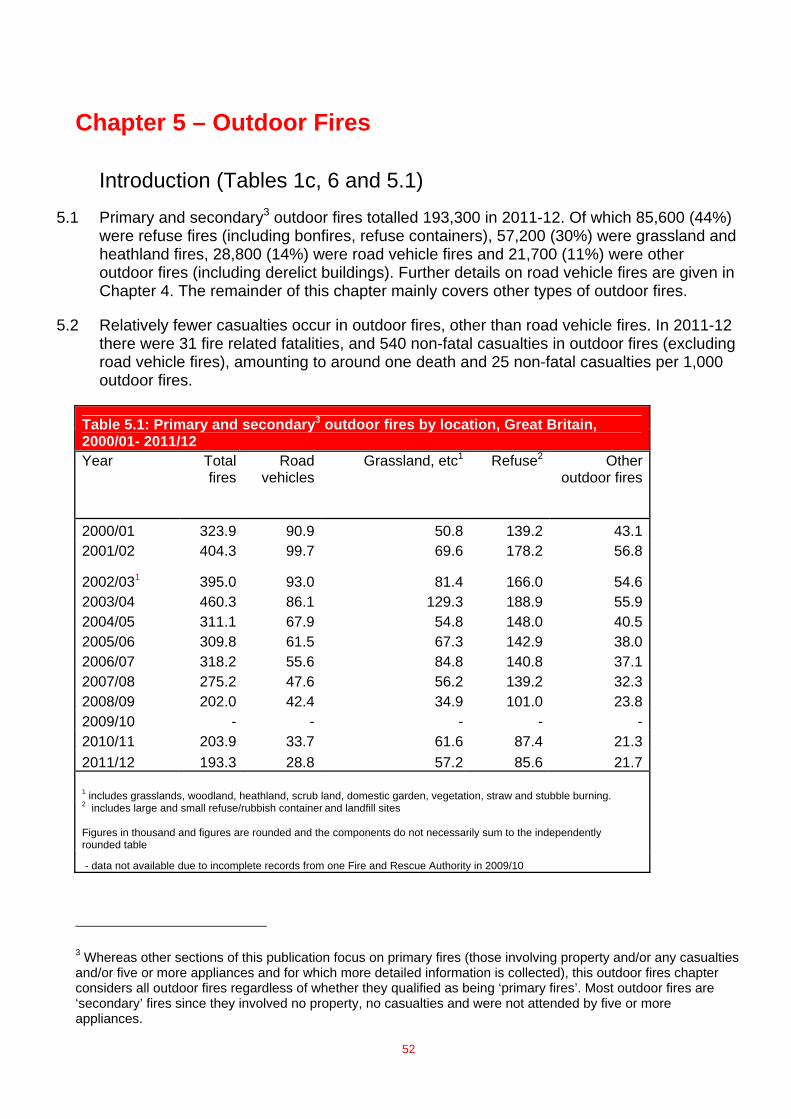
Introduction (Tables 1c, 6 and 5.1) 5.1 Primary and secondary3 outdoor fires totalled 193,300 in 2011-12. Of which 85,600 (44%)
were refuse fires (including bonfires, refuse containers), 57,200 (30%) were grassland and heathland fires, 28,800 (14%) were road vehicle fires and 21,700 (11%) were other outdoor fires (including derelict buildings). Further details on road vehicle fires are given in Chapter 4. The remainder of this chapter mainly covers other types of outdoor fires.
5.2 Relatively fewer casualties occur in outdoor fires, other than road vehicle fires. In 2011-12 there were 31 fire related fatalities, and 540 non-fatal casualties in outdoor fires (excluding road vehicle fires), amounting to around one death and 25 non-fatal casualties per 1,000 outdoor fires.
Table 5.1: Primary and secondary3 outdoor fires by location, Great Britain, 2000/01- 2011/12 Year Total
firesRoad
vehicles Grassland, etc1 Refuse2 Other
outdoor fires
2000/01 323.9 90.9 50.8 139.2 43.1 2001/02 404.3 99.7 69.6 178.2 56.8
2002/031 395.0 93.0 81.4 166.0 54.6 2003/04 460.3 86.1 129.3 188.9 55.9 2004/05 311.1 67.9 54.8 148.0 40.5 2005/06 309.8 61.5 67.3 142.9 38.0 2006/07 318.2 55.6 84.8 140.8 37.1 2007/08 275.2 47.6 56.2 139.2 32.3 2008/09 202.0 42.4 34.9 101.0 23.8 2009/10 - - - - - 2010/11 203.9 33.7 61.6 87.4 21.3 2011/12 193.3 28.8 57.2 85.6 21.7
1 includes grasslands, woodland, heathland, scrub land, domestic garden, vegetation, straw and stubble burning. 2 includes large and small refuse/rubbish container and landfill sites
Figures in thousand and figures are rounded and the components do not necessarily sum to the independently rounded table
- data not available due to incomplete records from one Fire and Rescue Authority in 2009/10
3 Whereas other sections of this publication focus on primary fires (those involving property and/or any casualties and/or five or more appliances and for which more detailed information is collected), this outdoor fires chapter considers all outdoor fires regardless of whether they qualified as being ‘primary fires’. Most outdoor fires are ‘secondary’ fires since they involved no property, no casualties and were not attended by five or more appliances.
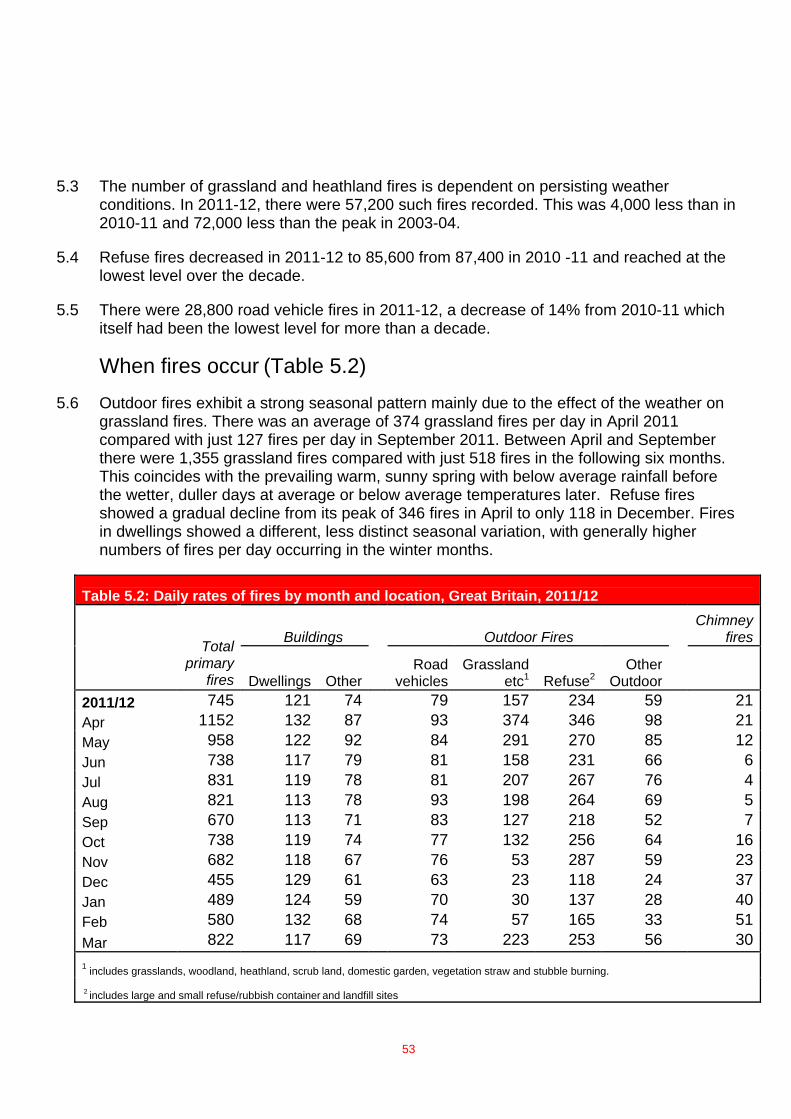
53
5.3 The number of grassland and heathland fires is dependent on persisting weather conditions. In 2011-12, there were 57,200 such fires recorded. This was 4,000 less than in 2010-11 and 72,000 less than the peak in 2003-04.
5.4 Refuse fires decreased in 2011-12 to 85,600 from 87,400 in 2010 -11 and reached at the lowest level over the decade.
5.5 There were 28,800 road vehicle fires in 2011-12, a decrease of 14% from 2010-11 which itself had been the lowest level for more than a decade.
When fires occur (Table 5.2)
5.6 Outdoor fires exhibit a strong seasonal pattern mainly due to the effect of the weather on grassland fires. There was an average of 374 grassland fires per day in April 2011 compared with just 127 fires per day in September 2011. Between April and September there were 1,355 grassland fires compared with just 518 fires in the following six months. This coincides with the prevailing warm, sunny spring with below average rainfall before the wetter, duller days at average or below average temperatures later. Refuse fires showed a gradual decline from its peak of 346 fires in April to only 118 in December. Fires in dwellings showed a different, less distinct seasonal variation, with generally higher numbers of fires per day occurring in the winter months.
Table 5.2: Daily rates of fires by month and location, Great Britain, 2011/12
Buildings Outdoor Fires Chimney
fires
Total primary
fires Dwellings Other Road
vehiclesGrassland
etc1 Refuse2 Other
Outdoor 2011/12 745 121 74 79 157 234 59 21Apr 1152 132 87 93 374 346 98 21May 958 122 92 84 291 270 85 12Jun 738 117 79 81 158 231 66 6Jul 831 119 78 81 207 267 76 4Aug 821 113 78 93 198 264 69 5Sep 670 113 71 83 127 218 52 7Oct 738 119 74 77 132 256 64 16Nov 682 118 67 76 53 287 59 23Dec 455 129 61 63 23 118 24 37Jan 489 124 59 70 30 137 28 40Feb 580 132 68 74 57 165 33 51Mar 822 117 69 73 223 253 56 301 includes grasslands, woodland, heathland, scrub land, domestic garden, vegetation straw and stubble burning.
2 includes large and small refuse/rubbish container and landfill sites
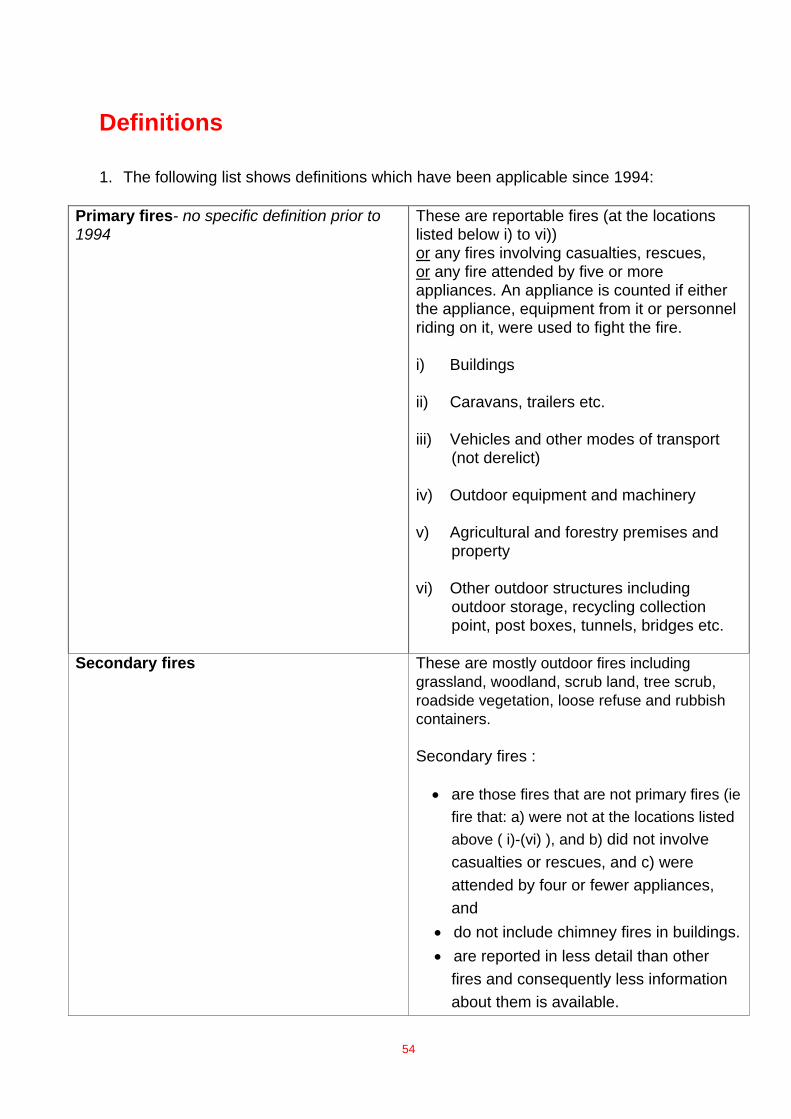
Definitions
1. The following list shows definitions which have been applicable since 1994:
Primary fires- no specific definition prior to 1994
These are reportable fires (at the locations listed below i) to vi)) or any fires involving casualties, rescues, or any fire attended by five or more appliances. An appliance is counted if either the appliance, equipment from it or personnel riding on it, were used to fight the fire.
i) Buildings
ii) Caravans, trailers etc.
iii) Vehicles and other modes of transport (not derelict)
iv) Outdoor equipment and machinery
v) Agricultural and forestry premises and property
vi) Other outdoor structures including outdoor storage, recycling collection point, post boxes, tunnels, bridges etc.
Secondary fires These are mostly outdoor fires including grassland, woodland, scrub land, tree scrub, roadside vegetation, loose refuse and rubbish containers.
Secondary fires :
• are those fires that are not primary fires (ie fire that: a) were not at the locations listed above ( i)-(vi) ), and b) did not involve casualties or rescues, and c) were attended by four or fewer appliances, and
• do not include chimney fires in buildings. • are reported in less detail than other
fires and consequently less information about them is available.
54
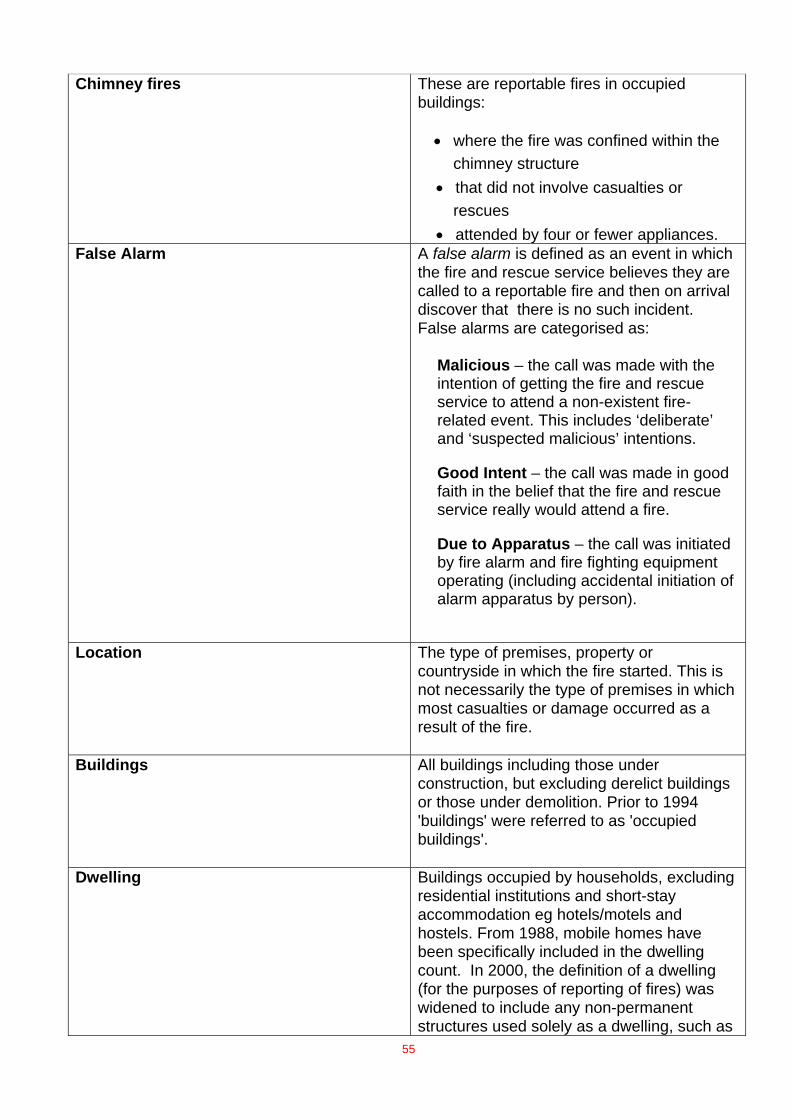
55
Chimney fires
These are reportable fires in occupied buildings:
• where the fire was confined within the chimney structure
• that did not involve casualties or rescues
• attended by four or fewer appliances. False Alarm
A false alarm is defined as an event in which the fire and rescue service believes they are called to a reportable fire and then on arrival discover that there is no such incident. False alarms are categorised as:
Malicious – the call was made with the intention of getting the fire and rescue service to attend a non-existent fire-related event. This includes ‘deliberate’ and ‘suspected malicious’ intentions.
Good Intent – the call was made in good faith in the belief that the fire and rescue service really would attend a fire.
Due to Apparatus – the call was initiated by fire alarm and fire fighting equipment operating (including accidental initiation of alarm apparatus by person).
Location
The type of premises, property or countryside in which the fire started. This is not necessarily the type of premises in which most casualties or damage occurred as a result of the fire.
Buildings
All buildings including those under construction, but excluding derelict buildings or those under demolition. Prior to 1994 'buildings' were referred to as 'occupied buildings'.
Dwelling Buildings occupied by households, excluding residential institutions and short-stay accommodation eg hotels/motels and hostels. From 1988, mobile homes have been specifically included in the dwelling count. In 2000, the definition of a dwelling (for the purposes of reporting of fires) was widened to include any non-permanent structures used solely as a dwelling, such as
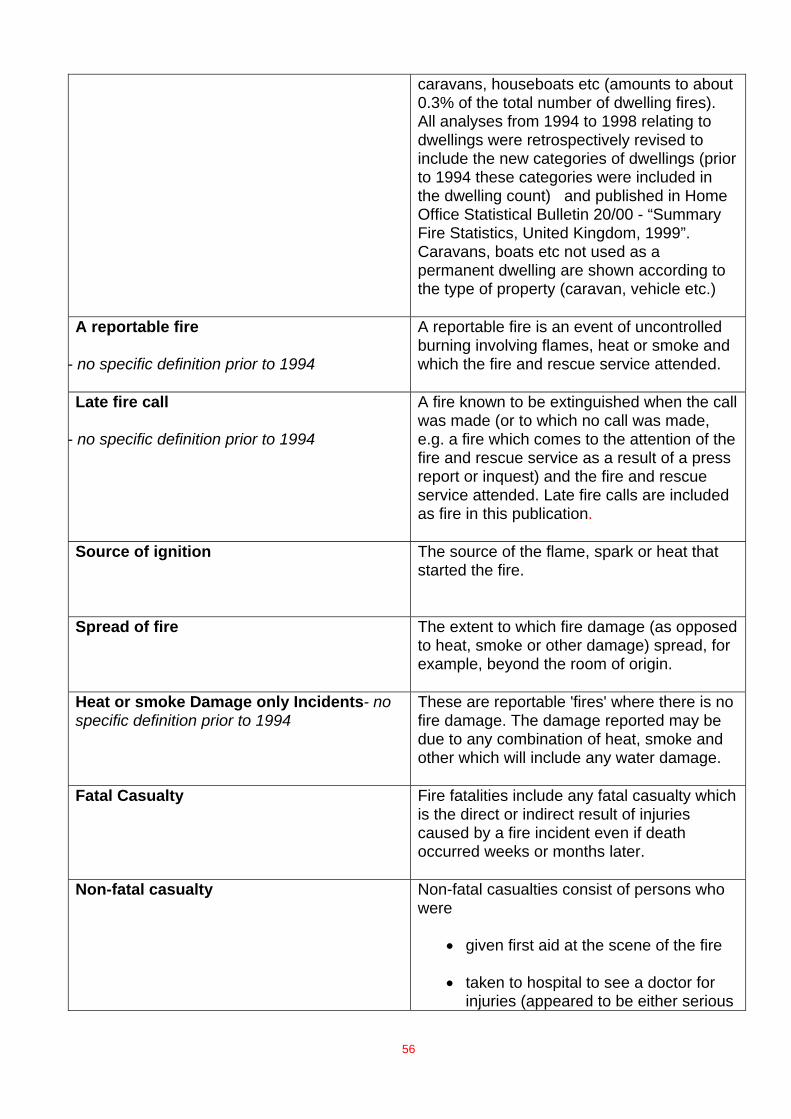
56
caravans, houseboats etc (amounts to about 0.3% of the total number of dwelling fires). All analyses from 1994 to 1998 relating to dwellings were retrospectively revised to include the new categories of dwellings (prior to 1994 these categories were included in the dwelling count) and published in Home Office Statistical Bulletin 20/00 - “Summary Fire Statistics, United Kingdom, 1999”. Caravans, boats etc not used as a permanent dwelling are shown according to the type of property (caravan, vehicle etc.)
A reportable fire
- no specific definition prior to 1994
A reportable fire is an event of uncontrolled burning involving flames, heat or smoke and which the fire and rescue service attended.
Late fire call
- no specific definition prior to 1994
A fire known to be extinguished when the call was made (or to which no call was made, e.g. a fire which comes to the attention of the fire and rescue service as a result of a press report or inquest) and the fire and rescue service attended. Late fire calls are included as fire in this publication.
Source of ignition The source of the flame, spark or heat that started the fire.
Spread of fire
The extent to which fire damage (as opposed to heat, smoke or other damage) spread, for example, beyond the room of origin.
Heat or smoke Damage only Incidents- no specific definition prior to 1994
These are reportable 'fires' where there is no fire damage. The damage reported may be due to any combination of heat, smoke and other which will include any water damage.
Fatal Casualty
Fire fatalities include any fatal casualty which is the direct or indirect result of injuries caused by a fire incident even if death occurred weeks or months later.
Non-fatal casualty
Non-fatal casualties consist of persons who were
• given first aid at the scene of the fire
• taken to hospital to see a doctor for injuries (appeared to be either serious
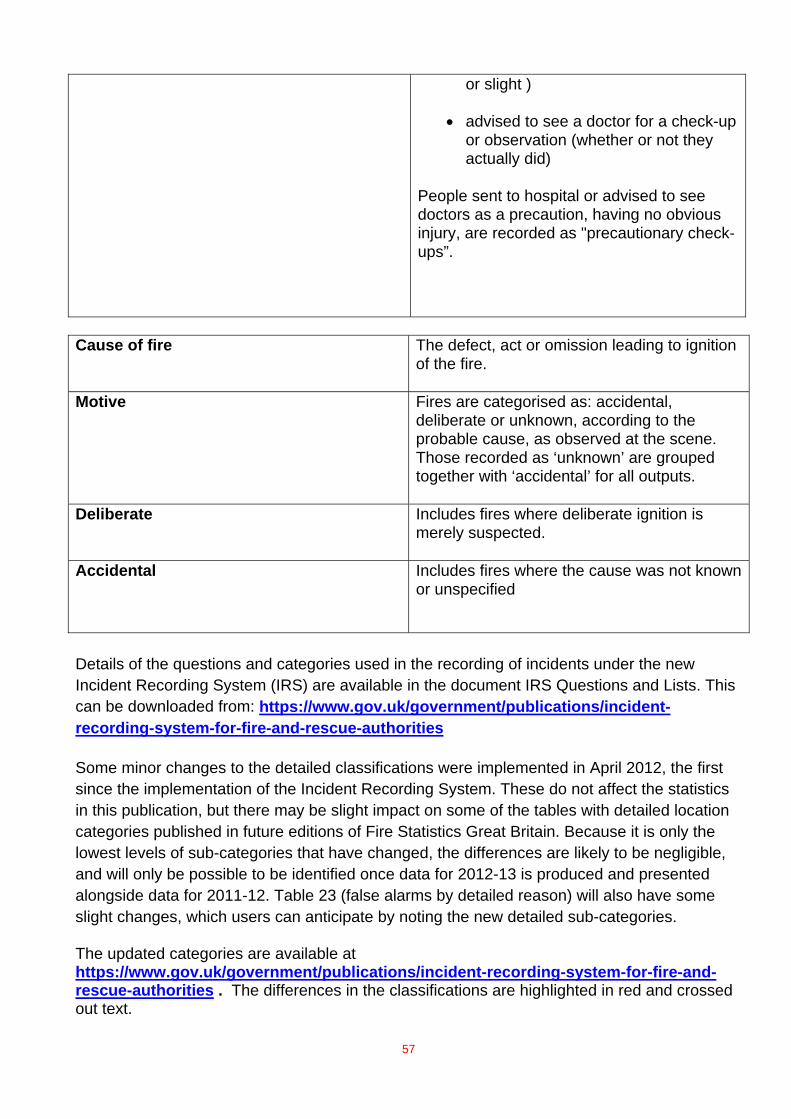
or slight )
• advised to see a doctor for a check-up or observation (whether or not they actually did)
People sent to hospital or advised to see doctors as a precaution, having no obvious injury, are recorded as "precautionary check-ups”.
Cause of fire The defect, act or omission leading to ignition of the fire.
Motive Fires are categorised as: accidental, deliberate or unknown, according to the probable cause, as observed at the scene. Those recorded as ‘unknown’ are grouped together with ‘accidental’ for all outputs.
Deliberate Includes fires where deliberate ignition is merely suspected.
Accidental Includes fires where the cause was not known or unspecified
Details of the questions and categories used in the recording of incidents under the new Incident Recording System (IRS) are available in the document IRS Questions and Lists. This can be downloaded from: https://www.gov.uk/government/publications/incident-recording-system-for-fire-and-rescue-authorities
Some minor changes to the detailed classifications were implemented in April 2012, the first since the implementation of the Incident Recording System. These do not affect the statistics in this publication, but there may be slight impact on some of the tables with detailed location categories published in future editions of Fire Statistics Great Britain. Because it is only the lowest levels of sub-categories that have changed, the differences are likely to be negligible, and will only be possible to be identified once data for 2012-13 is produced and presented alongside data for 2011-12. Table 23 (false alarms by detailed reason) will also have some slight changes, which users can anticipate by noting the new detailed sub-categories.
The updated categories are available at https://www.gov.uk/government/publications/incident-recording-system-for-fire-and-rescue-authorities . The differences in the classifications are highlighted in red and crossed out text.
57

58
The categories in force prior to April 2012 are also available at https://www.gov.uk/government/publications/incident-recording-system-for-fire-and-rescue-authorities-questions-and-lists-v1-4
59
Explanatory Notes
Comparability of data under the Incident Recording System (IRS) and its predecessor, the Fire Data Report system
1 The Incident Recording System was adopted nationally by 1 April 2009. Sixteen Fire and Rescue Services switched to the Incident Recording System before this date: Five switched by 1 April 2008. A further three switched in Autumn 2008, and eight switched in the first quarter of 2009. Quality assurance of the data on which this publication is based identified the following two fundamental areas of potential discontinuity arising from the switchover from the old Fire Data Report system, which was largely paper-based, to the new Incident Recording System questions.
2 The first area relates to increases (typically slight) in the numbers of certain types of incident within the data of a handful of Fire and Rescue Services, notably in numbers of primary outdoor fires. These are apparently not real increases, but for example they may rather be the result of a small proportion of incidents in the past having been incorrectly reported as being ‘secondary fires’ rather than ‘primary fires’. The following conclusions can be drawn:
• it appears that these differences follow from incorrect reporting under the old Fire Data Report system
• the effect on national totals appears to be slight
• there is no suggestion of difference in completeness of recording of casualties.
3 The second area is the possibility of discontinuity in numbers of non-fatal casualties. Though the totals themselves do not suggest change in recording overall, the new categories have clearly affected sub-totals, notably the category ‘precautionary check recommended’. This all follows from two improvements to the way in which non-fatal casualties have been recorded since the introduction of the Incident Recording System:
a. The first change is that each casualty or fatality can be marked as ‘not fire- related’. Around eight per cent of non-fatal casualties were marked as not fire-related in April 2010 to March 2011. However, in fire incidents, almost all non-fatal casualties can be expected to be ‘fire-related’, since very few would have occurred if there had not been a fire. Due to this concern, those non-fatal casualties marked ‘not fire-related’ have not been excluded. It is also worth noting that excluding the 8 per cent of non-fatal casualties would have introduced a large discontinuity compared to data from before the introduction of the new Incident Recording System.
b. The other potential issue arises since the Incident Recording System collects details of the injury of each non-fatal casualty in two questions, the first categorising the casualty as one of: ‘severe injury (hospital)’, or ‘slight injury’, or ‘first aid’ or ‘precautionary check advised’, while the second question records the type of injury.
60
This contrasts with the Fire Data Report system where a single question was used instead, with no category for ‘first aid’. It appears that casualty cases recorded under Incident Recording System as ‘first aid’ would have most commonly been recorded under the old Fire Data Report system as ‘precautionary check’ (see figure 1.7), and a smaller proportion recorded as a specific type of injury. As noted, overall the total of all non-fatal casualty categories (including non-fatal casualties whose severity was either ‘first aid’ or ‘precautionary check recommended’ under Incident Recording System) appears to be consistent with totals under the Fire Data Report system.
Recording during industrial action in 2002 & 2003
4 Due to the industrial action by firefighters in November 2002 and January and February 2003 the reporting of fires for these days was disrupted. In total fifteen 24-hour periods were affected;
from 18:00 on 13th to 18:00 on 15th November 2002 (2 days);
from 09:00 on 22nd to 09:00 on 30th November 2002 (8 days);
from 09:00 on 21st to 09:00 on 22nd January 2003 (1 day);
from 09:00 on 28th to 09:00 on 30th January 2003 (2 days);
from 09:00 on 1st to 09:00 on 3rd February 2003 (2 days);
In previous editions of this publication, these gaps were covered by estimates for some tables. Due to resource constraints, it was not possible to include such estimates in this publication.
61
Definitions: primary fires, secondary, chimney fires, outdoor fires and false alarms 5 “Primary” fires include all fires in buildings, vehicles and outdoor structures or any fire
involving casualties, rescues, or fires attended by five or more appliances. 6 “Secondary” fires are the majority of outdoor fires including grassland and refuse fires
unless they involve casualties or rescues, property loss or five or more appliances attend. They include fires in single derelict buildings.
7 Chimney fires are any fire in an occupied building where the fire was confined within
the chimney structure (and did not involve casualties or rescues or attendance by five or more appliances). A false alarm is defined as an event in which the fire and rescue service believes they are called to a reportable fire and then find there is no such incident.
8 The term “outdoor fires” used in this Bulletin refers to primary and secondary fires in
road vehicles, other outdoor property, derelict buildings and derelict vehicles and more minor refuse, grassland and intentional straw/stubble fires.
Data for primary fires 9 Two categories of fire-related incident have been recorded in the fire statistics from the
since 1994. These categories are described as late fire calls and heat and smoke damage only incidents:
• “late fire calls” which are fires not attended as an emergency because they are known to be extinguished when the call was made, or to which no emergency call was made;
• heat or smoke damage only ‘fires’ - where no fire damage is reported (see definitions section for fuller explanation).
Survey of English Housing 10 The Survey of English Housing (SEH) was a large continuous survey carried out
primarily to collect information on households in England, their housing and other related issues. It has been superseded by the English Housing Survey. In 2004/05 the Survey of English Housing also asked a set of questions about fire-related issues in the home. A similar module of fire questions was asked in previous years in the British Crime Survey. This information collected on experience of fire provides a valuable source of additional information in measuring the prevalence of domestic fires in England. This is because many of the fires measured by the survey result in little or no damage and consequently are often not brought to the attention of fire and rescue service, thus being outside the scope of those incidents attended and recorded by Fire and Rescue Services. Even fires involving property damage or injury are not always brought to their attention. The survey data also collects a wide variety of social and demographic information from households, including details about their ethnicity,
62
housing tenure and economic status. The publication ‘Fires in the Home’ is the result of analysis of these characteristics to identify the groups most likely to experience a fire or least likely to own a smoke alarm.
Population data 11 Population data used in this Bulletin have been provided by the Office for National
Statistics (ONS) in the form of mid-year estimates. Further information on the exact changes made to the population estimates can be obtained via the ONS website www.statistics.gov.uk.
Selection of samples of primary fires 12 For incidents between 2004 and March 2009, only a dozen key fields were entered
from every Fire Data Report paper form. The details of incidents were entered for all fires with casualties, but for only a proportion of other primary fire incidents attended. Previous editions of this publication provided detail of the sampling and weighting methodology used.
Revisions
13 Revisions will be handled as per the Department for Communities and Local Government revisions policy http://www.communities.gov.uk/documents/corporate/pdf/1466387.pdf. This requires explanation of the handling of scheduled revisions due to the receipt of subsequent information in the case of each statistical publication. For this publication, any such revisions will be included in the future as follows:
14 Barring exceptional circumstances, revisions will be made only once and will affect only the preceding year’s data - ie when new provisional 2011-12 data are published for the first time in the 2011-12 edition, then data for 2010-11 will be revised.
15 In practice, numbers of fatalities can experience revisions that are small but not insignificant in percentage terms. As noted in the Definitions section, Fire fatalities include any fatal casualty which is the direct or indirect result of injuries caused by a fire incident even if death occurred weeks or months later. Therefore numbers can be revised by those that die subsequently, and by changes in the information about whether the fatality was caused by the fire. Fire investigations and coroners’ findings can both lead to such a revision, for example.
16 By contrast, numbers of non-fatal casualties and incidents experience revisions that are very small in percentage terms.
Revisions in this release
17 This release includes routine revisions to the 2010-11 data as per the revisions policy above. The scale of revisions to 2010-11 figures compared to when 2010-11 data were published first is laid out on pages 21 and 22 of the 2011-12 Fire Statistics Monitor (www.gov.uk/government/organisations/department-for-communities-and-local-
63
government/series/fire-statistics-monitor). This is because Fire Statistics Great Britain is derived from the same snapshot of the Fire and Rescue Incidents data base as the end of financial year edition of the Fire Statistics Monitor.
Uses of these data and data quality
18 The data are used to monitor trends and emerging patterns to inform national and local fire prevention and safety policy, initiatives and campaigns. For example:
• This data in this publication and its accompanying spreadsheet annex tables focus on national totals of incidents and casualties, in particular by detailed categories of the location and cause of fires. Key users include Government, Fire and Rescue Authorities, safety campaign organisations and the Association of Manufacturers of Domestic Appliances.
• There are also i) detailed sections on the outcome of fire detection apparatus, typically smoke alarms, and ii) analysis of rates of casualties by age, which highlight that elderly people have higher rates of fire casualty, and that the reduction in casualties has come more from reductions in numbers of casualties of those who are not elderly.
19 We judge that the quality and reliability of the data are suitable for these uses. Fire and Rescue Incident data are collected across Great Britain under common definitions and guidance. Records undergo quality assurance within each Fire and Rescue Authority where data are also analysed, as well as being submitted to the national data base. The Department of Communities and Local Government published a quality assurance best practice guide in 2010. This was informed by ideas and experience of Fire and Rescue Authorities. The data are also subjected to quality assurance by statistical staff in the Department of Communities and Local Government, Scottish Government and Welsh Assembly Government.
Symbols
20 Symbols used in the tables are:
• - Not available.
• .. Not applicable.
• p Provisional figures
• r Revised figures
• pmp Per million population
64
Links to previous editions of this publication This publication, as well as previous editions of Fire Statistics Great Britain and related publications, can be downloaded free of charge from the Department for Communities and Local Government website https://www.gov.uk/government/organisations/department-for-communities-and-local-government/series/fire-statistics-great-britain
Earlier editions of the predecessor Fire Statistics UK publication for the years 2000 to 2008 can be downloaded from: http://webarchive.nationalarchives.gov.uk/20121108165934/http://www.communities.gov.uk/fire/researchandstatistics/firestatistics/firestatisticsuk/
Related Statistics for Scotland, Wales and Northern Ireland Fire incident statistics for other UK countries are available as follows:
Scotland: http://www.scotland.gov.uk/Topics/Statistics/Browse/Crime-Justice/PubFires Wales: http://wales.gov.uk/topics/statistics/headlines/fire2012/ Northern Ireland: Equivalent data is not available for Northern Ireland. Annual fire incident data is available from: http://www.nifrs.org/statistics.php
Links to other Fire Statistics Publications produced by the Department for Communities and Local Government Fire statistics publications can be accessed via this link https://www.gov.uk/government/publications/fire-statistics
This includes the Department’s annual publication on fire response times, and non-financial annual return data, Fire and Rescue Operational Statistics. https://www.gov.uk/government/organisations/department-for-communities-and-local-government/series/fire-and-rescue-authorities-operational-statistics This includes headline data on fire prevention and protection activity as well as numbers of staff and fire stations.
Overseas fire data Internationally, there are significant variations in the scope of reporting fire incidents, both in definitional terms, and whether such data are collected nationally. The Department commissioned a project examining comparability of fire statistics around Europe, which can be accessed from: http://webarchive.nationalarchives.gov.uk/20121108165934/http://www.communities.gov.uk/documents/corporate/pdf/2159418.pdf
That said, data for other countries can be found at http://www.genevaassociation.org/Affiliated_Organizations/WFSC.aspx, which has a link to the October 2012 edition of their World Fire Statistics Bulletin http://www.genevaassociation.org/PDF/WFSC/GA2012-FIRE28.pdf.
65
Enquiries Enquiries about the figures in this publication should be addressed to
Nazneen Chowdhury Department for Communities and Local Government Fire Statistics Branch 3/B6 Eland House Bressenden Place London SW1E 5DU Tel: 0303 444 2144 Email: [email protected]
This publication was produced by Nazneen Chowdhury, Ian Rowe and Gavin Sayer.