Embed Size (px)
Citation preview
1. Introduction 3
2. Key Points 4
3. Fires, false alarm and
casualties 6
4. Location of fires,
source of ignition,
cause and
operational status of
smoke alarm
21
Definitions 47
Technical notes 53
Symbols 58
Enquiries 60
Fire and Rescue Authorities in Britain attended 192,600 fires in 2012-13. This is nearly a third fewer than the year before, due to fewer outdoor fires as a result of above average rain-fall.
While only 12 per cent of dwellings report not having a working smoke alarm in England, more than one third of fires occurred in dwellings in Great Britain where no alarm was installed.
Three quarters of fire-related fatalities occurred in dwelling fires, the figure fell by 11 per cent (32 deaths) compared to 2011-12.
Smoker’s materials (i.e. cigarettes, cigars or pipe tobacco) have caused the largest share of deaths in dwelling fires, while cooking appliances are the source of ignition in more than half of fires in dwellings.
Half of fire deaths in buildings that were not dwellings resulted from smoker’s material or cigarette lighters.
The risk of dying in a fire for elderly people (65 and over) is
over twice as high as the average for all ages.
In the year to 2012-13 fire fatalities rates fell by 10% in Eng-land and by over 20% in Scotland and Wales. Scotland con-tinued to have a higher rate of fire deaths compared to both England and to Wales.
Males have higher rates of fire fatality than females, but the gender gap in fire fatality rate narrowed in 2012-13.
Fire & Rescue Statistical Release
Statistical enquiries
See contact details at rear
Media Enquiries:
0303 444 1201
Date of next publication:
December 2014
Fire Statistics: Great Britain
April 2012 to March 2013

2 Fire and Rescue Statistical Release
© Crown copyright, 2014
Copyright in the typographical arrangement rests with the Crown.
You may re-use this information (not including logos) free of charge in any format or medium, under the terms of the Open Government Licence. To view this licence, www.nationalarchives.gov.uk/doc/open-government-licence/ or write to the Information Policy Team, The National Archives, Kew, London TW9 4DU, or email: [email protected].
This document/publication is also available on our website at www.gov.uk/dclg
If you have any enquiries regarding this document/publication, email [email protected] or write to us at:
Department for Communities and Local Government Eland House Bressenden Place London SW1E 5DU Telephone: 030 3444 0000
23 May 2014
For all our latest news and updates follow us on Twitter: https://twitter.com/CommunitiesUK
ISBN: 978-1-4098-4211-8
1. Introduction
The statistics in this publication are compiled from Fire and Rescue Service records of
incidents attended by fire and rescue authorities across Great Britain1.
This publication contains detailed analysis of fires, casualties and their causes for 2012-13.
Headline data for 2012-13 was published in June 2013 in the Fire Statistics Monitor series.
This is the third edition of this publication using data since the new Incident Recording
System was adopted. Incomplete records from one Fire and Rescue Authority meant that it
was not possible to produce some of the more detailed statistics for 2009-10.
The notes and definitions section at the rear of the publication provide definitions and
context, including signposting to some changes to the detailed categories which which fed
into statistics as of this edition of this publication. The impact on data tables was very minor,
but these are nevertheless flagged up for information at the end of the definitions section.
This publication follows the content and order of previous editions as far as possible in order
to be consistent for those familiar with previous editions.
In response to user comments enquiring into the composition of various categories in the
data tables of this publication, a workbook showing the combinations of these has been
produced
We are keen to hear from users to broaden our knowledge of all the various uses to which these statistics are out, and as to what other analyses would be valuable in the future. Please see the user interests form which can be downloaded from https://www.gov.uk/government/publications/fire-statistics.
1 Until 2008, this was a UK publication. Since then it has covered Great Britain. This is because the new Incident
Recording System with electronic data capture and transfer was adopted by Fire and Rescue Authorities across
Great Britain in 2009.
4 Fire and Rescue Statistical Release
2. Key points
Fires and false alarm
In 2012-13 fire and rescue authorities attended 487,000 fires or false alarms in Britain. This was 17% fewer than in 2011-12 (para1.1).
Fire and Rescue authorities attended a total of 192,600 fires in 2012-13, 29% fewer than in the previous year. Almost two thirds (62%) of these were outdoor fires (119,700), e.g. refuse, road vehicles, grassland and heathland. Over one fifth (22%)
were dwelling fires, and these were 6% down compared to 2011-12.
The number of false alarms fell by 6% to 294,800 in 2012-13 from 313,300 in 2011-12 (para1.7).
Fatalities from fires
In 2012-13, there were 350 fire-related deaths in Britain, 47 fewer than in 2011-12 and lower than in any year in the last fifty years. The highest number of fatalities recorded was 967 in 1985-86. Throughout the 1990s and 2000s there was a clear downward trend. (para1.10).
Three quarters (76%) of fire-related fatalities occurred in dwelling fires (para1.11). In 2012-13 there were 266 dwelling fire fatalities, 32 fewer than in 2011-12. Fire fatality rates are four times higher for people aged 80 and over, compared to the rate across all ages. The gap in fatality rates between male and female narrowed in 2012-13. (paras1.14 & 1.15).
34% of fire-related deaths in Britain were caused by the victim being overcome by gas, smoke or toxic fumes. The other leading causes are burns alone (30%) and combina-tion of burns and being overcome by gas or fumes (19%).
Non-fatal casualties
There were 10,300 non-fatal casualties in fires in Britain in 2012-13, 10 per cent and 32 per cent lower compared to the previous year and ten years before respectively (para1.16).
Dwelling Fires
There were 41,000 dwelling fires in Britain in 2012-13, 6% fewer than in 2011-12. 36,400 (89%) of dwelling fires were accidental (paras2.1 & para2.2).
Accidental dwelling fires
Accidental dwelling fires were 4% and 22% lower in Britain in 2012-13 compared to the previous year and ten years before respectively. The main cause of accidental dwelling fires remained the misuse of equipment/appliances (13,900 fires), while the main source of ignition was cooking appliances which accounted for more than half of all accidental dwelling fires) (paras2.3 & para2.4).
Fatalities in dwelling fires
Of the 266 deaths in dwellings in 2012-13, 217 (82%) were of accidental causes. The main cause was careless handling of fire or hot substances (e.g. careless disposal of cigarettes), which accounted for 40% of all fatalities due to accidental causes (para 2.7 & 2.8). More than half of accidental dwelling fire deaths resulted from fires which started in the living room or dining room. (paras2.8,2.9,&2.24).
Dwelling fires in which textiles, upholstery and furnishings were mainly responsible for the development of the fires, accounted for nearly 60% of deaths in dwelling fires.
Smoke alarms status in dwelling fires
No smoke alarm was present in 12,800 (31%) dwelling fires (para2.29). A smoke alarm was present but did not operate in 19% of dwelling fires.
Smoke alarm ownership increased rapidly from 8% in 1988 to 70% in 1994 in Eng-land, and has continued to rise in recent years to 88% in 2011 (para2.30).
Nearly a third of dwelling fire deaths occurred in properties where no alarm was in-stalled.
Other Building Fires
In 2012-13 there were 22,500 fires recorded in buildings that were not dwellings, these were 18% and 41% fewer than in 2011-12 and 2002-03 respectively. The majority of these occurred in non-residential buildings (e.g. retails units, pubs/wine bars/cafés/take aways, private garden sheds and industrial manufacturing plants) (paras3.1& 3.3).
In total, 17 fatal and 1,013 non-fatal casualties occurred in fires in buildings other than dwellings (para3.2).
65% of deaths occurred in other building fires where there was no smoke alarm.
Road Vehicle Fires
There were 23,900 road vehicle fires in 2012-13 – 15% fewer than 2011-12. This was the lowest in more than a decade and 76% lower than the peak in 2001/02 (para 4.1). Road vehicle fires resulted in 39 deaths in 2012-13, 2 more than in 2011-12 but 25 fewer than a decade ago in 2002-03. (para4.4)
6 Fire and Rescue Statistical Release
Chapter 1 - Fires, false alarm and fatal and
non-fatal casualties
Total number of fires and false alarms attended by fire and rescue authorities (Tables 1.1, 1.2 and Figure 1.1)
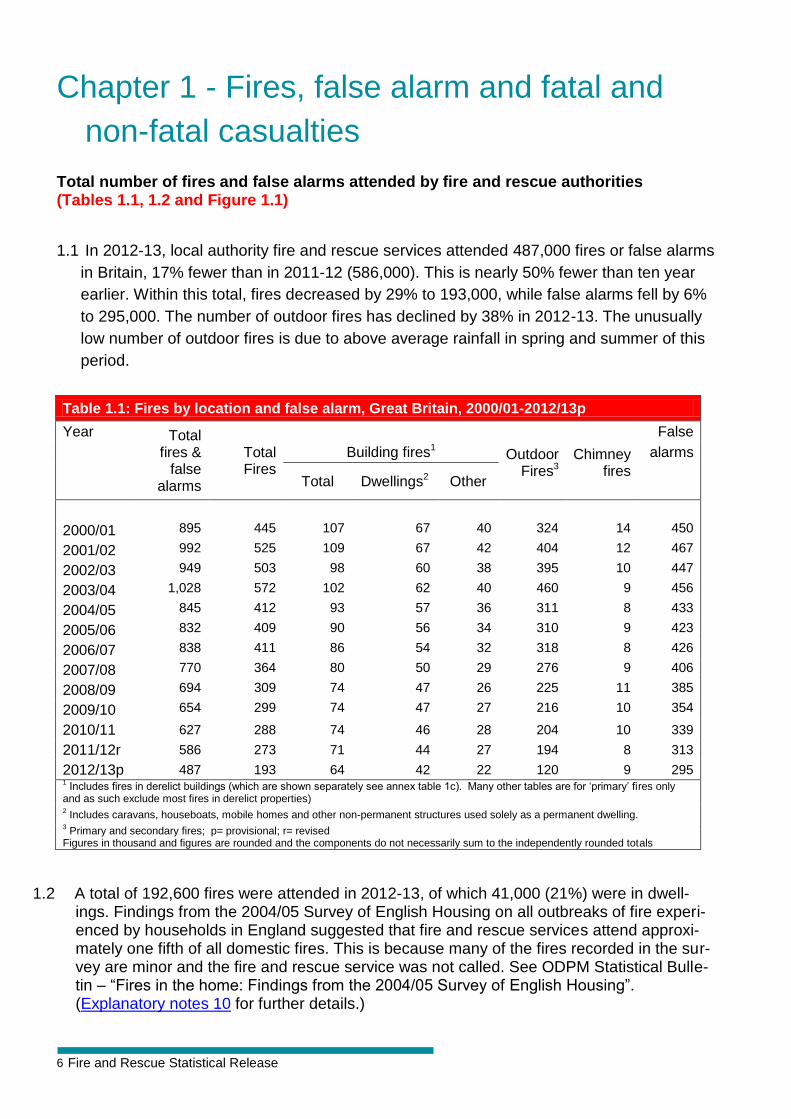
1.1 In 2012-13, local authority fire and rescue services attended 487,000 fires or false alarms
in Britain, 17% fewer than in 2011-12 (586,000). This is nearly 50% fewer than ten year
earlier. Within this total, fires decreased by 29% to 193,000, while false alarms fell by 6%
to 295,000. The number of outdoor fires has declined by 38% in 2012-13. The unusually
low number of outdoor fires is due to above average rainfall in spring and summer of this
period.
Table 1.1: Fires by location and false alarm, Great Britain, 2000/01-2012/13p
Year Total fires &
false alarms
Total Fires
False
Building fires1 Outdoor Fires3
.
Chimney fires
.
alarms
Total Dwellings2 Other
2000/01 895 445 107 67 40 324 14 450
2001/02 992 525 109 67 42 404 12 467
2002/03 949 503 98 60 38 395 10 447
2003/04 1,028 572 102 62 40 460 9 456
2004/05 845 412 93 57 36 311 8 433
2005/06 832 409 90 56 34 310 9 423
2006/07 838 411 86 54 32 318 8 426
2007/08 770 364 80 50 29 276 9 406
2008/09 694 309 74 47 26 225 11 385
2009/10 654 299 74 47 27 216 10 354
2010/11 627 288 74 46 28 204 10 339
2011/12r 586 273 71 44 27 194 8 313
2012/13p 487 193 64 42 22 120 9 295 1 Includes fires in derelict buildings (which are shown separately see annex table 1c). Many other tables are for ‘primary’ fires only
and as such exclude most fires in derelict properties) 2 Includes caravans, houseboats, mobile homes and other non-permanent structures used solely as a permanent dwelling.
3 Primary and secondary fires; p= provisional; r= revised
Figures in thousand and figures are rounded and the components do not necessarily sum to the independently rounded totals
1.2 A total of 192,600 fires were attended in 2012-13, of which 41,000 (21%) were in dwell-ings. Findings from the 2004/05 Survey of English Housing on all outbreaks of fire experi-enced by households in England suggested that fire and rescue services attend approxi-mately one fifth of all domestic fires. This is because many of the fires recorded in the sur-vey are minor and the fire and rescue service was not called. See ODPM Statistical Bulle-tin – “Fires in the home: Findings from the 2004/05 Survey of English Housing”. (Explanatory notes 10 for further details.)
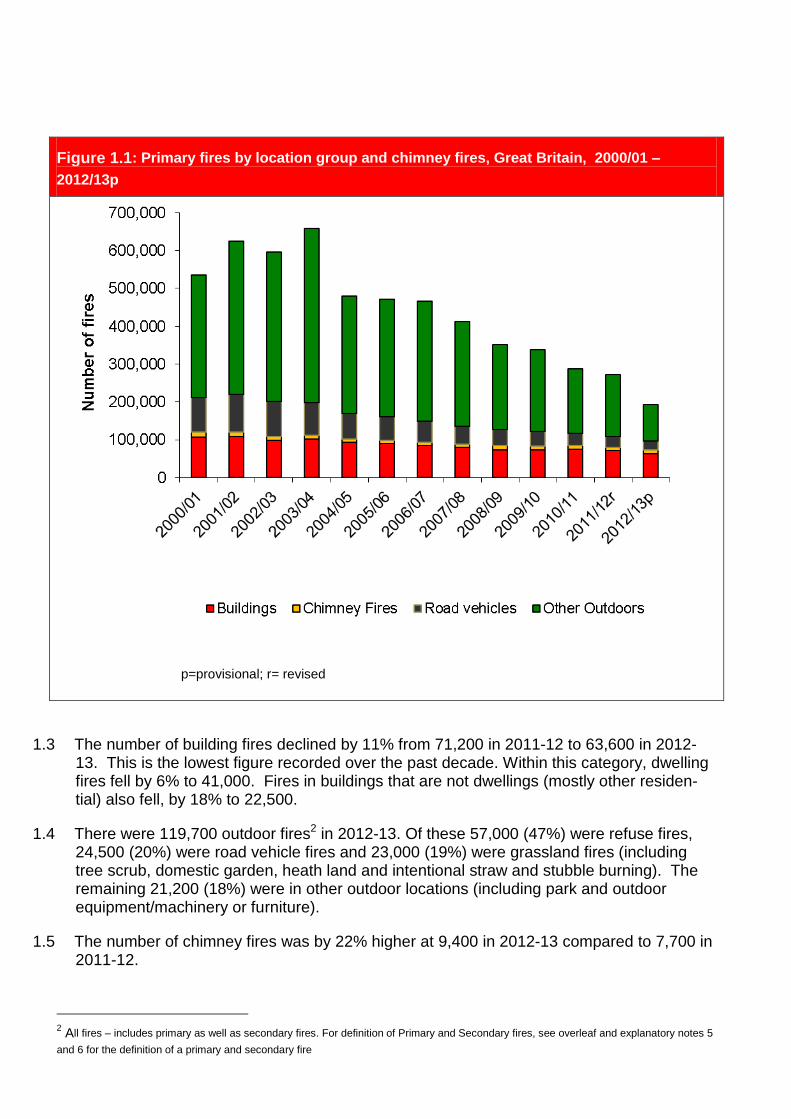
Figure 1.1: Primary fires by location group and chimney fires, Great Britain, 2000/01 –
2012/13p
p=provisional; r= revised
1.3 The number of building fires declined by 11% from 71,200 in 2011-12 to 63,600 in 2012-13. This is the lowest figure recorded over the past decade. Within this category, dwelling fires fell by 6% to 41,000. Fires in buildings that are not dwellings (mostly other residen-tial) also fell, by 18% to 22,500.
1.4 There were 119,700 outdoor fires2 in 2012-13. Of these 57,000 (47%) were refuse fires, 24,500 (20%) were road vehicle fires and 23,000 (19%) were grassland fires (including tree scrub, domestic garden, heath land and intentional straw and stubble burning). The remaining 21,200 (18%) were in other outdoor locations (including park and outdoor equipment/machinery or furniture).
1.5 The number of chimney fires was by 22% higher at 9,400 in 2012-13 compared to 7,700 in 2011-12.
2 All fires – includes primary as well as secondary fires. For definition of Primary and Secondary fires, see overleaf and explanatory notes 5
and 6 for the definition of a primary and secondary fire
8 Fire and Rescue Statistical Release
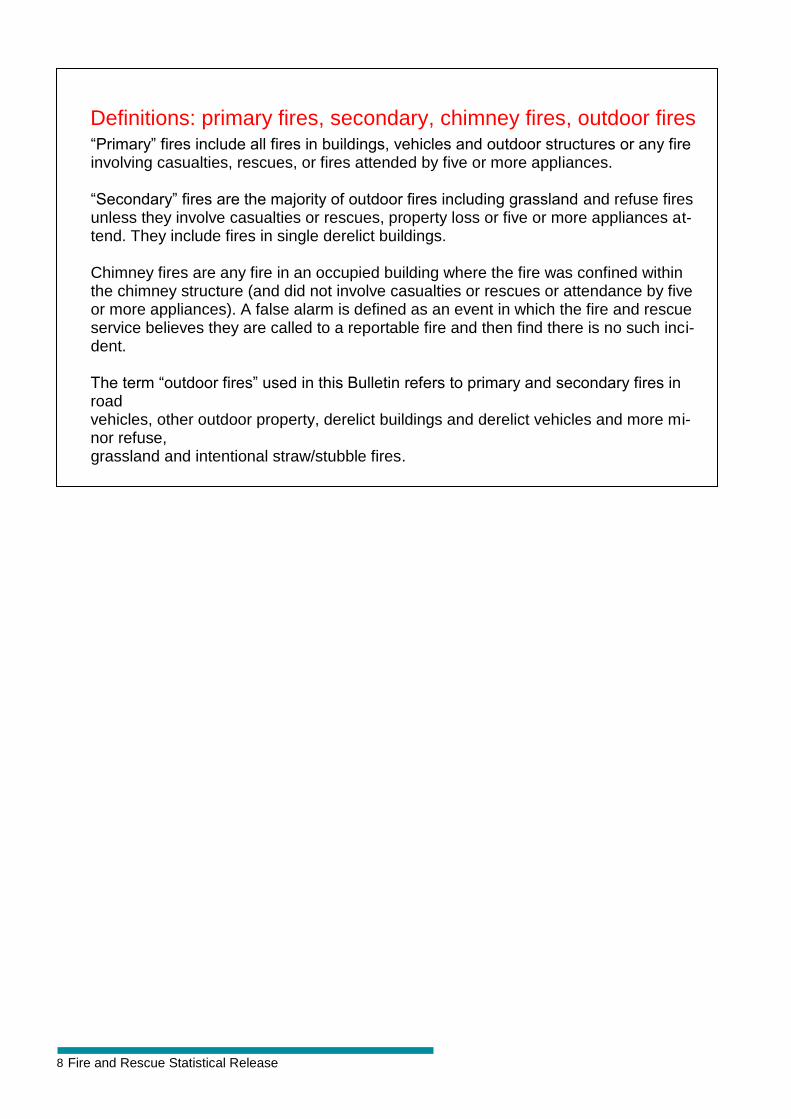
Definitions: primary fires, secondary, chimney fires, outdoor fires “Primary” fires include all fires in buildings, vehicles and outdoor structures or any fire involving casualties, rescues, or fires attended by five or more appliances. “Secondary” fires are the majority of outdoor fires including grassland and refuse fires unless they involve casualties or rescues, property loss or five or more appliances at-tend. They include fires in single derelict buildings.
Chimney fires are any fire in an occupied building where the fire was confined within the chimney structure (and did not involve casualties or rescues or attendance by five or more appliances). A false alarm is defined as an event in which the fire and rescue service believes they are called to a reportable fire and then find there is no such inci-dent.
The term “outdoor fires” used in this Bulletin refers to primary and secondary fires in road vehicles, other outdoor property, derelict buildings and derelict vehicles and more mi-nor refuse, grassland and intentional straw/stubble fires.
Causes of fires
Interpretation of trends in accidental and deliberate fires
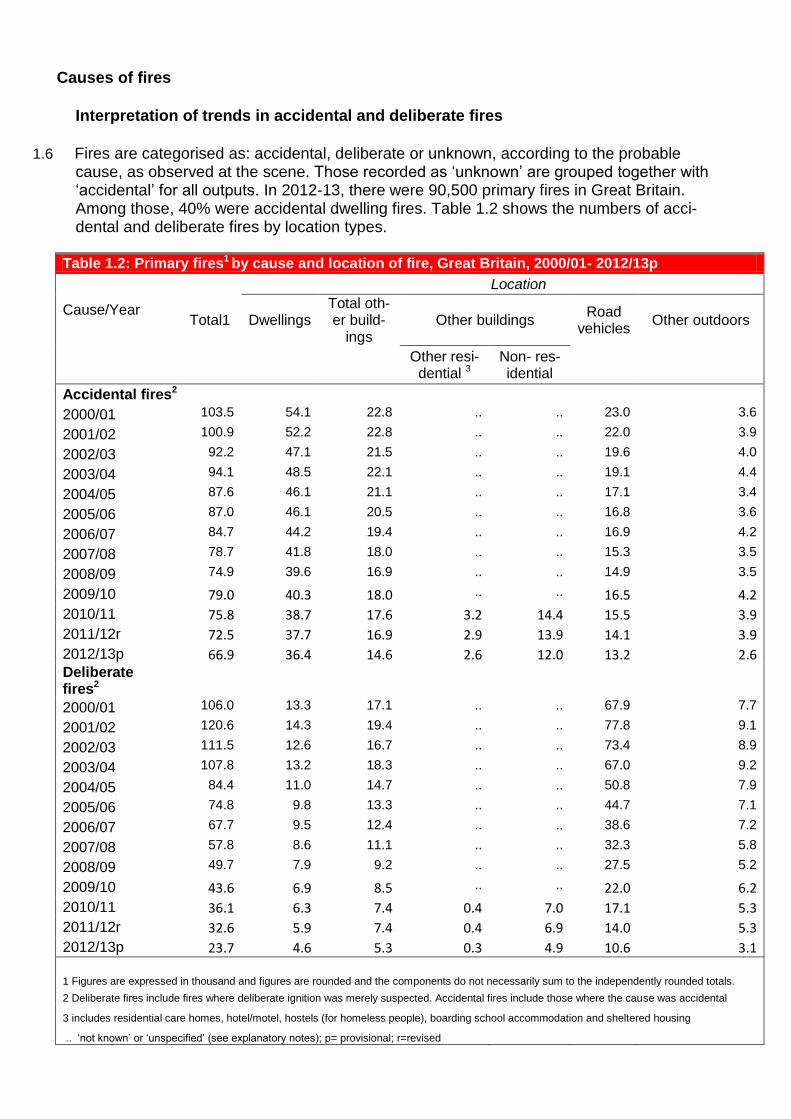
1.6 Fires are categorised as: accidental, deliberate or unknown, according to the probable cause, as observed at the scene. Those recorded as ‘unknown’ are grouped together with ‘accidental’ for all outputs. In 2012-13, there were 90,500 primary fires in Great Britain. Among those, 40% were accidental dwelling fires. Table 1.2 shows the numbers of acci-dental and deliberate fires by location types.ble 1.2: Primary fires1 by cause and location of fire, Great Britain, 2000/01- 2012/13
Table 1.2: Primary fires1 by cause and location of fire, Great Britain, 2000/01- 2012/13p
Cause/Year
Location
Total1 Dwellings Total oth-er build-
ings Other buildings
Road vehicles
Other outdoors
Other resi-
dential 3 Non- res-idential
Accidental fires2
2000/01 103.5 54.1 22.8 .. .. 23.0 3.6
2001/02 100.9 52.2 22.8 .. .. 22.0 3.9
2002/03 92.2 47.1 21.5 .. .. 19.6 4.0
2003/04 94.1 48.5 22.1 .. .. 19.1 4.4
2004/05 87.6 46.1 21.1 .. .. 17.1 3.4
2005/06 87.0 46.1 20.5 .. .. 16.8 3.6
2006/07 84.7 44.2 19.4 .. .. 16.9 4.2
2007/08 78.7 41.8 18.0 .. .. 15.3 3.5
2008/09 74.9 39.6 16.9 .. .. 14.9 3.5
2009/10 79.0 40.3 18.0 .. .. 16.5 4.2
2010/11 75.8 38.7 17.6 3.2 14.4 15.5 3.9
2011/12r 72.5 37.7 16.9 2.9 13.9 14.1 3.9
2012/13p 66.9 36.4 14.6 2.6 12.0 13.2 2.6 Deliberate fires2
2000/01 106.0 13.3 17.1 .. .. 67.9 7.7
2001/02 120.6 14.3 19.4 .. .. 77.8 9.1
2002/03 111.5 12.6 16.7 .. .. 73.4 8.9
2003/04 107.8 13.2 18.3 .. .. 67.0 9.2
2004/05 84.4 11.0 14.7 .. .. 50.8 7.9
2005/06 74.8 9.8 13.3 .. .. 44.7 7.1
2006/07 67.7 9.5 12.4 .. .. 38.6 7.2
2007/08 57.8 8.6 11.1 .. .. 32.3 5.8
2008/09 49.7 7.9 9.2 .. .. 27.5 5.2
2009/10 43.6 6.9 8.5 .. .. 22.0 6.2
2010/11 36.1 6.3 7.4 0.4 7.0 17.1 5.3
2011/12r 32.6 5.9 7.4 0.4 6.9 14.0 5.3
2012/13p 23.7 4.6 5.3 0.3 4.9 10.6 3.1
1 Figures are expressed in thousand and figures are rounded and the components do not necessarily sum to the independently rounded totals.
2 Deliberate fires include fires where deliberate ignition was merely suspected. Accidental fires include those where the cause was accidental
3 includes residential care homes, hotel/motel, hostels (for homeless people), boarding school accommodation and sheltered housing
.. ‘not known’ or ‘unspecified’ (see explanatory notes); p= provisional; r=revised
10 Fire and Rescue Statistical Release
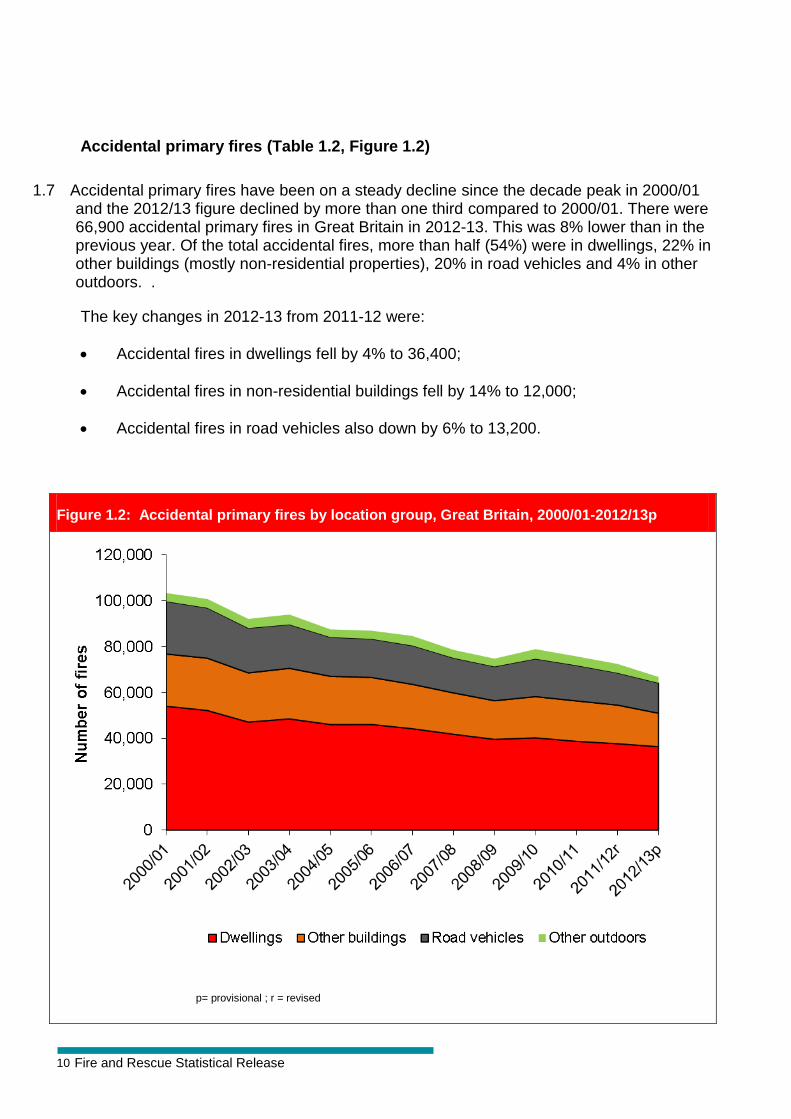
Accidental primary fires (Table 1.2, Figure 1.2)
1.7 Accidental primary fires have been on a steady decline since the decade peak in 2000/01 and the 2012/13 figure declined by more than one third compared to 2000/01. There were 66,900 accidental primary fires in Great Britain in 2012-13. This was 8% lower than in the previous year. Of the total accidental fires, more than half (54%) were in dwellings, 22% in other buildings (mostly non-residential properties), 20% in road vehicles and 4% in other outdoors. .
The key changes in 2012-13 from 2011-12 were:
Accidental fires in dwellings fell by 4% to 36,400;
Accidental fires in non-residential buildings fell by 14% to 12,000;
Accidental fires in road vehicles also down by 6% to 13,200.
Figure 1.2: Accidental primary fires by location group, Great Britain, 2000/01-2012/13p
p= provisional ; r = revised
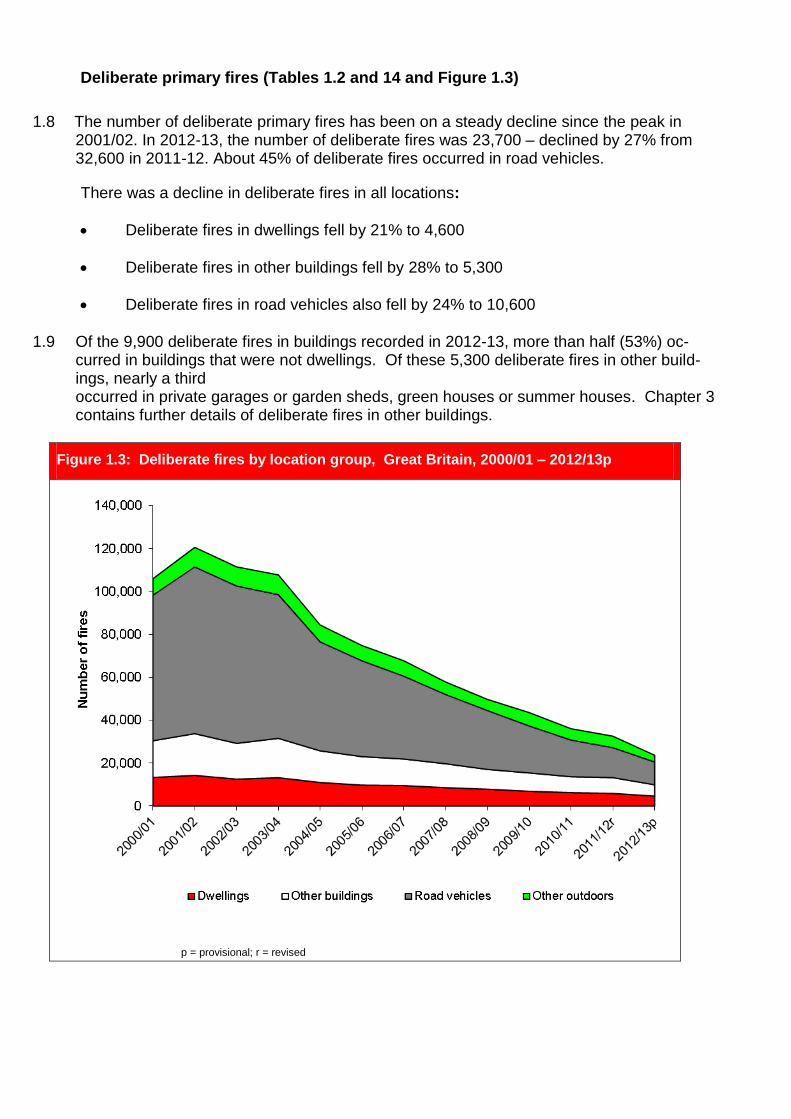
Deliberate primary fires (Tables 1.2 and 14 and Figure 1.3)
1.8 The number of deliberate primary fires has been on a steady decline since the peak in 2001/02. In 2012-13, the number of deliberate fires was 23,700 – declined by 27% from 32,600 in 2011-12. About 45% of deliberate fires occurred in road vehicles.
There was a decline in deliberate fires in all locations:
Deliberate fires in dwellings fell by 21% to 4,600
Deliberate fires in other buildings fell by 28% to 5,300
Deliberate fires in road vehicles also fell by 24% to 10,600
1.9 Of the 9,900 deliberate fires in buildings recorded in 2012-13, more than half (53%) oc-curred in buildings that were not dwellings. Of these 5,300 deliberate fires in other build-ings, nearly a third occurred in private garages or garden sheds, green houses or summer houses. Chapter 3 contains further details of deliberate fires in other buildings.
Figure 1.3: Deliberate fires by location group, Great Britain, 2000/01 – 2012/13p
p = provisional; r = revised
12 Fire and Rescue Statistical Release
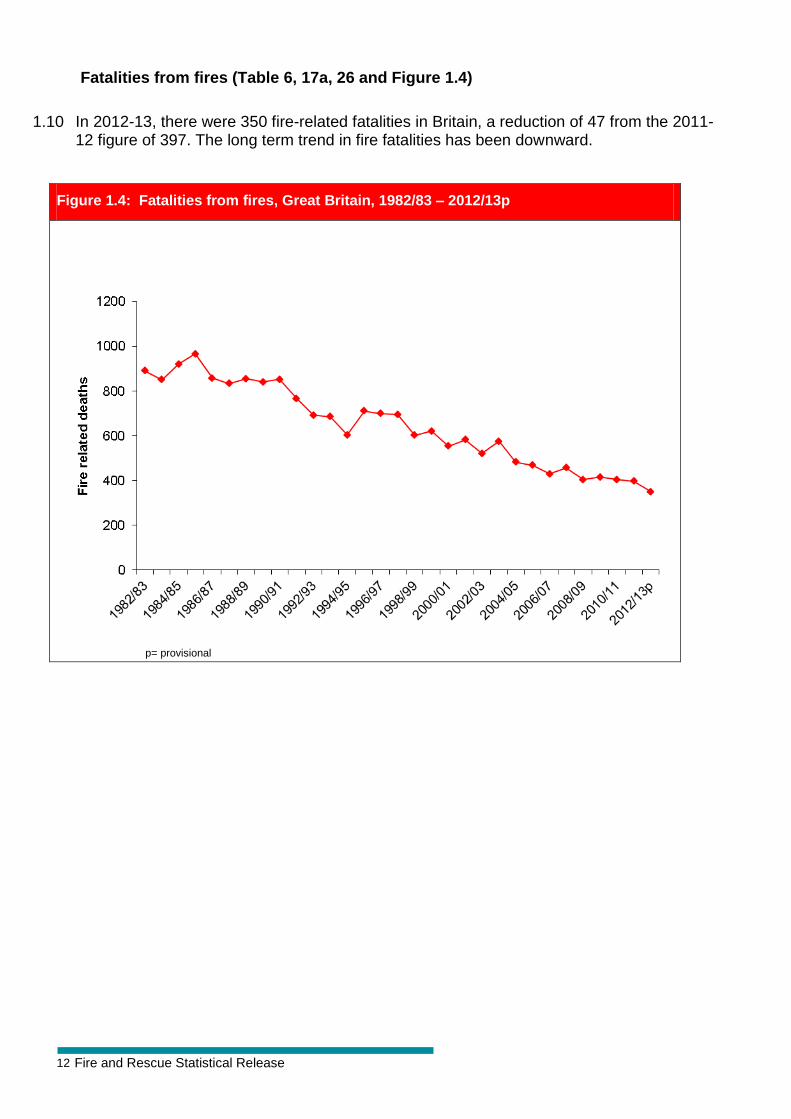
Fatalities from fires (Table 6, 17a, 26 and Figure 1.4)
1.10 In 2012-13, there were 350 fire-related fatalities in Britain, a reduction of 47 from the 2011-12 figure of 397. The long term trend in fire fatalities has been downward.
Figure 1.4: Fatalities from fires, Great Britain, 1982/83 – 2012/13p
p= provisional
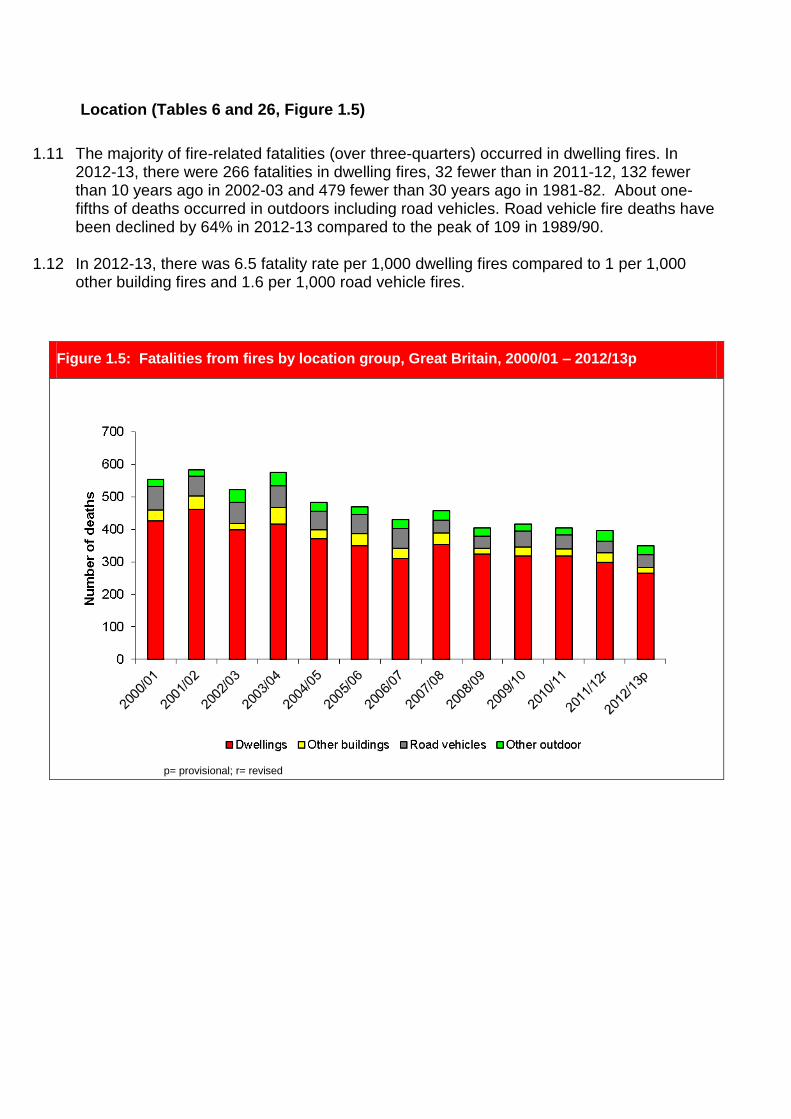
Location (Tables 6 and 26, Figure 1.5)
1.11 The majority of fire-related fatalities (over three-quarters) occurred in dwelling fires. In 2012-13, there were 266 fatalities in dwelling fires, 32 fewer than in 2011-12, 132 fewer than 10 years ago in 2002-03 and 479 fewer than 30 years ago in 1981-82. About one-fifths of deaths occurred in outdoors including road vehicles. Road vehicle fire deaths have been declined by 64% in 2012-13 compared to the peak of 109 in 1989/90.
1.12 In 2012-13, there was 6.5 fatality rate per 1,000 dwelling fires compared to 1 per 1,000 other building fires and 1.6 per 1,000 road vehicle fires.
Figure 1.5: Fatalities from fires by location group, Great Britain, 2000/01 – 2012/13p
p= provisional; r= revised
14 Fire and Rescue Statistical Release
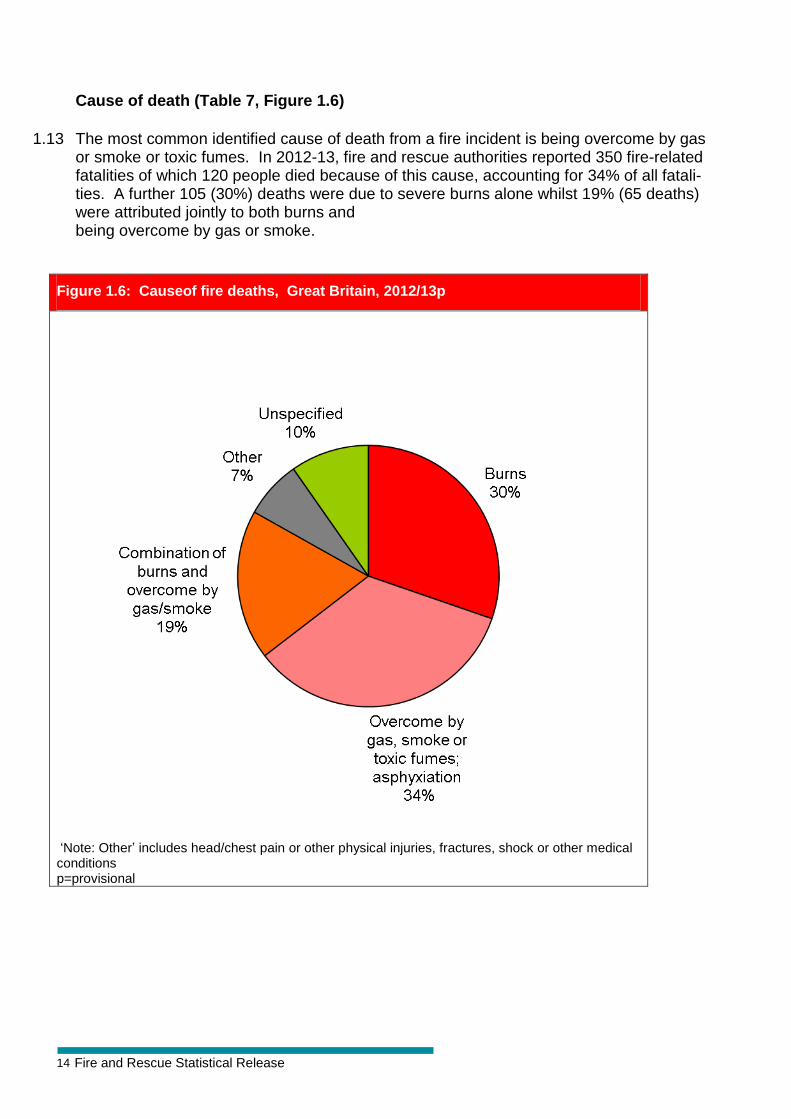
Cause of death (Table 7, Figure 1.6)
1.13 The most common identified cause of death from a fire incident is being overcome by gas or smoke or toxic fumes. In 2012-13, fire and rescue authorities reported 350 fire-related fatalities of which 120 people died because of this cause, accounting for 34% of all fatali-ties. A further 105 (30%) deaths were due to severe burns alone whilst 19% (65 deaths) were attributed jointly to both burns and being overcome by gas or smoke.
Figure 1.6: Causeof fire deaths, Great Britain, 2012/13p
‘Note: Other’ includes head/chest pain or other physical injuries, fractures, shock or other medical conditions p=provisional
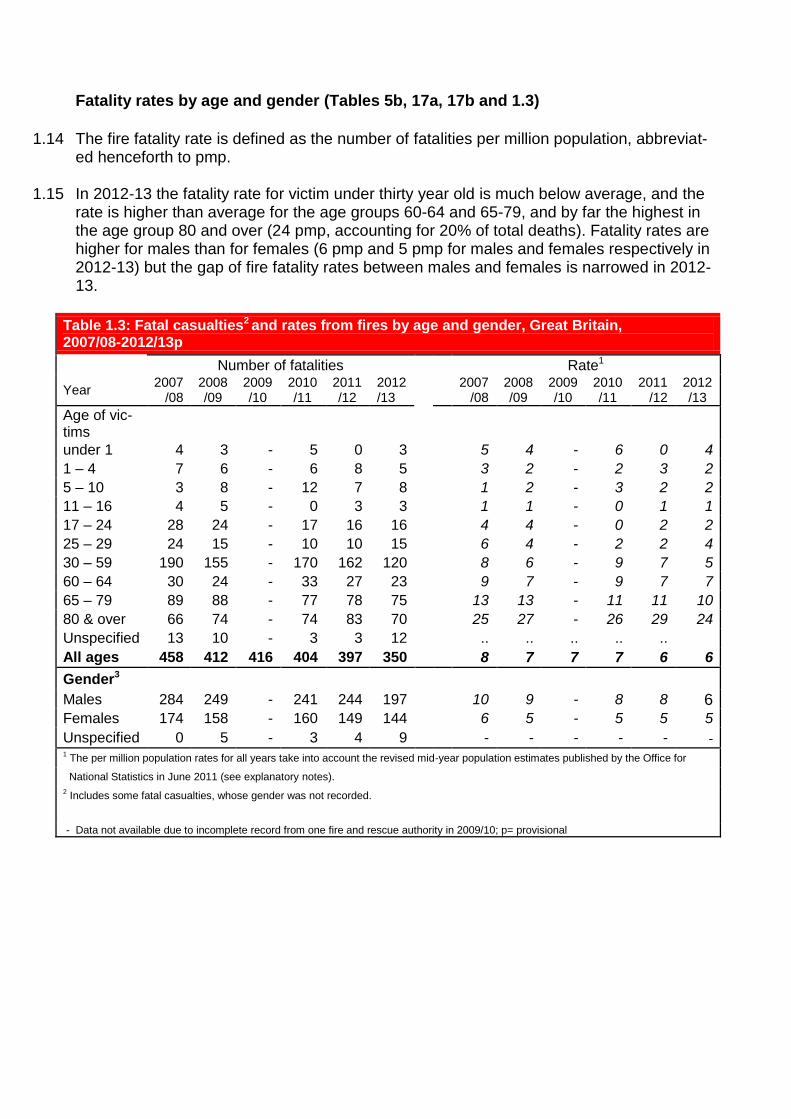
Fatality rates by age and gender (Tables 5b, 17a, 17b and 1.3)
1.14 The fire fatality rate is defined as the number of fatalities per million population, abbreviat-ed henceforth to pmp.
1.15 In 2012-13 the fatality rate for victim under thirty year old is much below average, and the rate is higher than average for the age groups 60-64 and 65-79, and by far the highest in the age group 80 and over (24 pmp, accounting for 20% of total deaths). Fatality rates are higher for males than for females (6 pmp and 5 pmp for males and females respectively in 2012-13) but the gap of fire fatality rates between males and females is narrowed in 2012-13.
Table 1.3: Fatal casualties2 and rates from fires by age and gender, Great Britain, 2007/08-2012/13p
Number of fatalities Rate1
Year 2007
/08 2008 /09
2009 /10
2010 /11
2011 /12
2012 /13
2007
/08 2008 /09
2009 /10
2010 /11
2011 /12
2012 /13
Age of vic-tims
under 1 4 3 - 5 0 3 5 4 - 6 0 4
1 – 4 7 6 - 6 8 5 3 2 - 2 3 2
5 – 10 3 8 - 12 7 8 1 2 - 3 2 2
11 – 16 4 5 - 0 3 3 1 1 - 0 1 1
17 – 24 28 24 - 17 16 16 4 4 - 0 2 2
25 – 29 24 15 - 10 10 15 6 4 - 2 2 4
30 – 59 190 155 - 170 162 120 8 6 - 9 7 5
60 – 64 30 24 - 33 27 23 9 7 - 9 7 7
65 – 79 89 88 - 77 78 75 13 13 - 11 11 10
80 & over 66 74 - 74 83 70 25 27 - 26 29 24
Unspecified 13 10 - 3 3 12 .. .. .. .. ..
All ages 458 412 416 404 397 350 8 7 7 7 6 6
Gender3
Males 284 249 - 241 244 197 10 9 - 8 8 6 Females 174 158 - 160 149 144 6 5 - 5 5 5
Unspecified 0 5 - 3 4 9 - - - - - - 1 The per million population rates for all years take into account the revised mid-year population estimates published by the Office for
National Statistics in June 2011 (see explanatory notes).
2 Includes some fatal casualties, whose gender was not recorded.
- Data not available due to incomplete record from one fire and rescue authority in 2009/10; p= provisional
16 Fire and Rescue Statistical Release
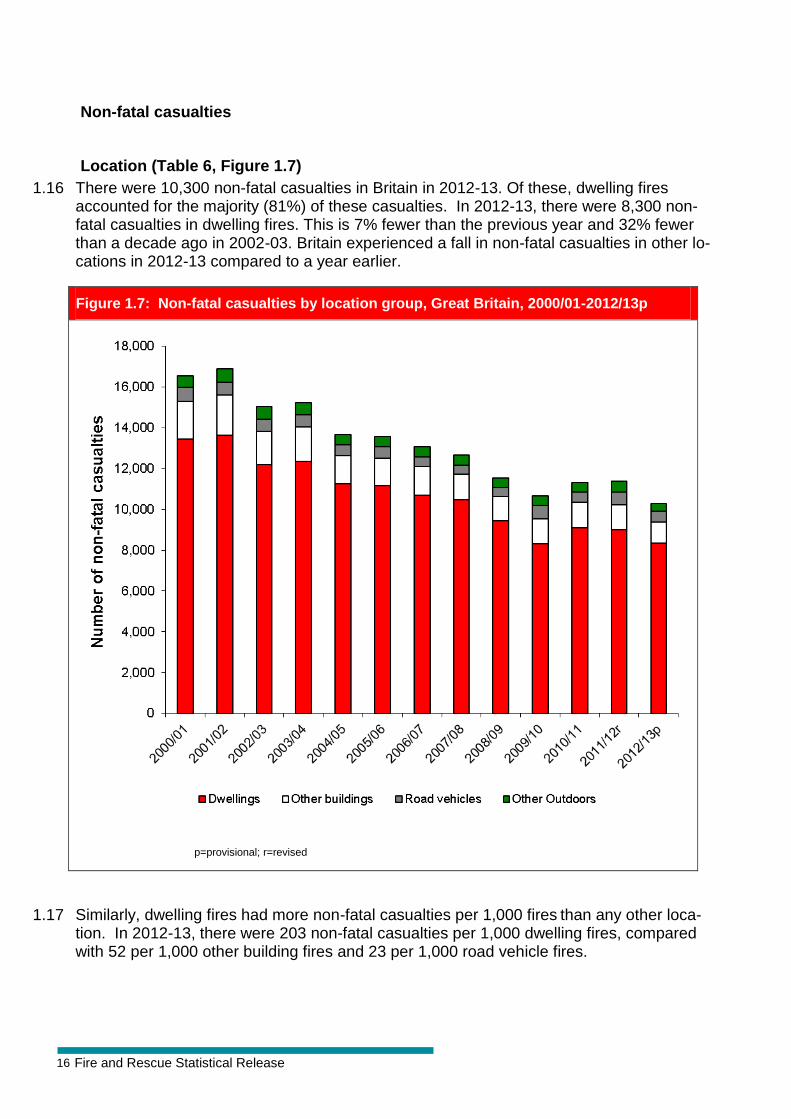
Non-fatal casualties
Location (Table 6, Figure 1.7)
1.16 There were 10,300 non-fatal casualties in Britain in 2012-13. Of these, dwelling fires accounted for the majority (81%) of these casualties. In 2012-13, there were 8,300 non-fatal casualties in dwelling fires. This is 7% fewer than the previous year and 32% fewer than a decade ago in 2002-03. Britain experienced a fall in non-fatal casualties in other lo-cations in 2012-13 compared to a year earlier.
Figure 1.7: Non-fatal casualties by location group, Great Britain, 2000/01-2012/13p
p=provisional; r=revised
1.17 Similarly, dwelling fires had more non-fatal casualties per 1,000 fires than any other loca-tion. In 2012-13, there were 203 non-fatal casualties per 1,000 dwelling fires, compared with 52 per 1,000 other building fires and 23 per 1,000 road vehicle fires.
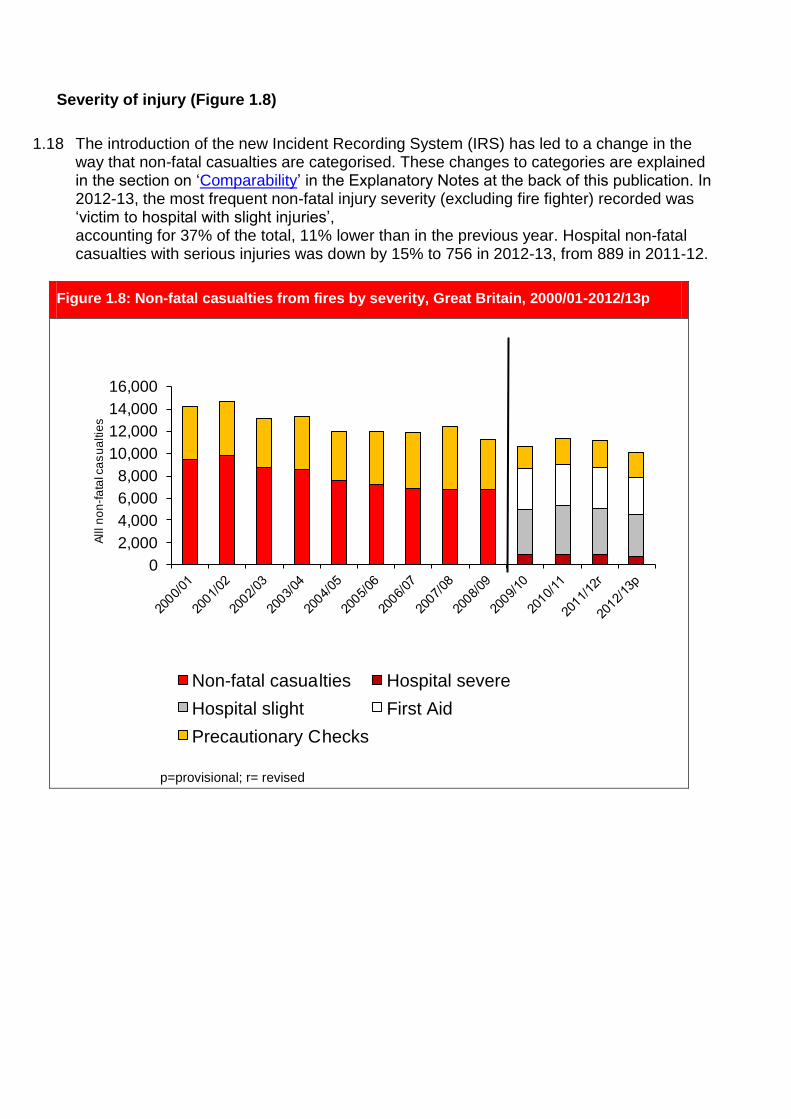
Severity of injury (Figure 1.8)
1.18 The introduction of the new Incident Recording System (IRS) has led to a change in the way that non-fatal casualties are categorised. These changes to categories are explained in the section on ‘Comparability’ in the Explanatory Notes at the back of this publication. In 2012-13, the most frequent non-fatal injury severity (excluding fire fighter) recorded was ‘victim to hospital with slight injuries’, accounting for 37% of the total, 11% lower than in the previous year. Hospital non-fatal casualties with serious injuries was down by 15% to 756 in 2012-13, from 889 in 2011-12.
Figure 1.8: Non-fatal casualties from fires by severity, Great Britain, 2000/01-2012/13p
0
2,000
4,000
6,000
8,000
10,000
12,000
14,000
16,000
Alll n
on
-fa
tal c
as
ua
ltie
s
Non-fatal casualties Hospital severe
Hospital slight First Aid
Precautionary Checks
p=provisional; r= revised
18 Fire and Rescue Statistical Release
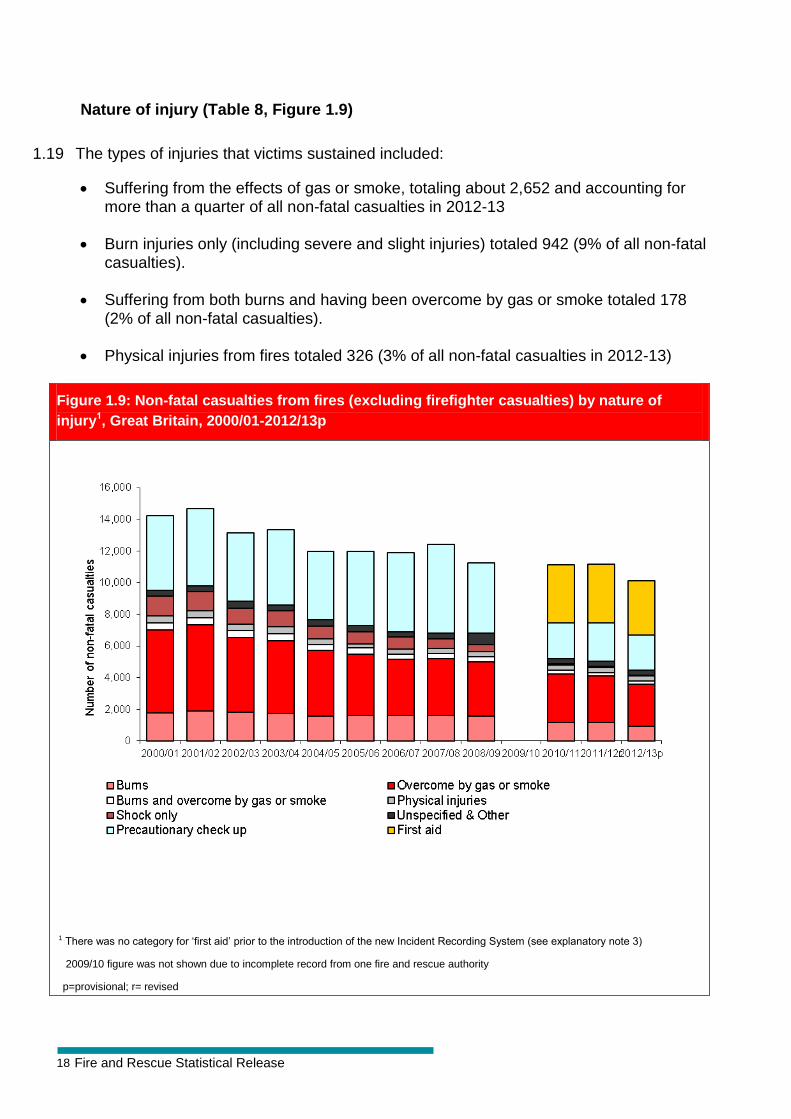
Nature of injury (Table 8, Figure 1.9)
1.19 The types of injuries that victims sustained included:
Suffering from the effects of gas or smoke, totaling about 2,652 and accounting for more than a quarter of all non-fatal casualties in 2012-13
Burn injuries only (including severe and slight injuries) totaled 942 (9% of all non-fatal casualties).
Suffering from both burns and having been overcome by gas or smoke totaled 178
(2% of all non-fatal casualties).
Physical injuries from fires totaled 326 (3% of all non-fatal casualties in 2012-13)
Figure 1.9: Non-fatal casualties from fires (excluding firefighter casualties) by nature of
injury1, Great Britain, 2000/01-2012/13p
1 There was no category for ‘first aid’ prior to the introduction of the new Incident Recording System (see explanatory note 3)
2009/10 figure was not shown due to incomplete record from one fire and rescue authority
p=provisional; r= revised
Type of fires and country
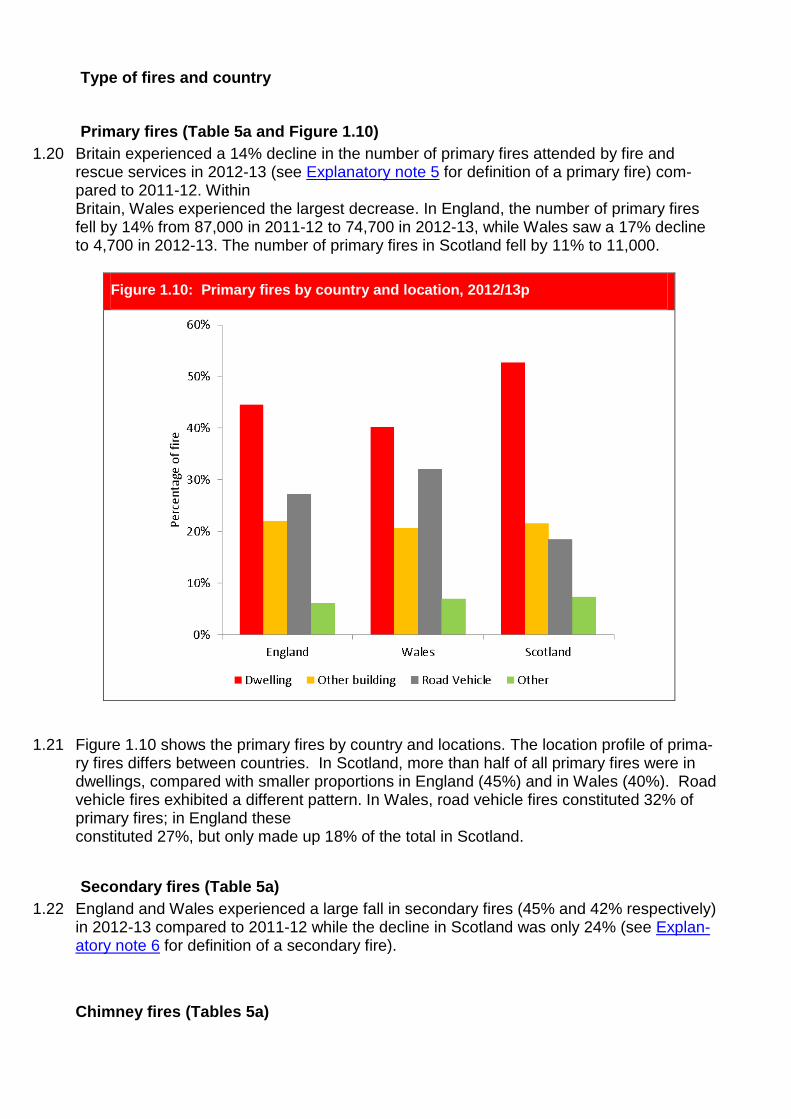
Primary fires (Table 5a and Figure 1.10)
1.20 Britain experienced a 14% decline in the number of primary fires attended by fire and rescue services in 2012-13 (see Explanatory note 5 for definition of a primary fire) com-pared to 2011-12. Within Britain, Wales experienced the largest decrease. In England, the number of primary fires fell by 14% from 87,000 in 2011-12 to 74,700 in 2012-13, while Wales saw a 17% decline to 4,700 in 2012-13. The number of primary fires in Scotland fell by 11% to 11,000.
Figure 1.10: Primary fires by country and location, 2012/13p
1.21 Figure 1.10 shows the primary fires by country and locations. The location profile of prima-ry fires differs between countries. In Scotland, more than half of all primary fires were in dwellings, compared with smaller proportions in England (45%) and in Wales (40%). Road vehicle fires exhibited a different pattern. In Wales, road vehicle fires constituted 32% of primary fires; in England these constituted 27%, but only made up 18% of the total in Scotland.
Secondary fires (Table 5a)
1.22 England and Wales experienced a large fall in secondary fires (45% and 42% respectively) in 2012-13 compared to 2011-12 while the decline in Scotland was only 24% (see Explan-atory note 6 for definition of a secondary fire).
Chimney fires (Tables 5a)
20 Fire and Rescue Statistical Release
1.23 All the countries in Britain experienced a rise in chimney fires in 2012-13. Scotland saw an 11% increase in chimney fires whilst the increase in both England and Wales was 24%. .
Fatalities casualties and rates by country and fire and rescue service area (Table 5b and Table 22a)
1.24 There were 350 fire-related fatalities in Britain in 2012-13, a reduction of 47 fatalities from 2011-12 of 397 fires that started accidentally. The fatality rate in fires in Britain in 2012-13 was 5.7 per million population (pmp). There are notable differences in fatality rates be-tween Scotland and other countries: Scotland has had a consistently higher fatality rate over the years compared to the
rest of Britain, currently at 8.7 pmp, down from 11.4 pmp in 2011-12;
The rate in Wales was 5.5 pmp, down from 7.5 pmp in 2011-12;
In England, the rate in 2012-13 was 5.3 pmp, down from 5.9 pmp in 2011-12.
Non-fatal casualties and rates by country and rescue service area (Table 5b and
Table 22b)
1.25 There were 10,300 non-fatal casualties in Britain in 2012-13, 10% lower than the previous year. Within Britain, England experienced a 10% decline while the decreases in Wales and Scotland were 9% and 7% respectively.
1.26 The non-fatal casualty rate in Britain declined from 185 in 2011-12 to 167 in 2012-13. This is the lowest rate recorded over the past 12 years. By country, the non-fatal casualty rates were:
England, 157 pmp in 2012-13, down from 177 pmp in 2011-12;
Wales, 175 pmp in 2012-13, down from 193 pmp in 2011-12;
Scotland, 247 pmp in 2012-13, down from 269 pmp in 2011-12;
Some of the highest non-fatality rates occurred in England occurred in the metropolitan fire and rescue authorities areas, with Greater Manchester (353 casualties per million population) and Merseyside 264 pmp. The highest rate recorded by an English non-metropolitan fire and rescue service area was in Lancashire (287 pmp). The highest casualty rate in Wales was in North Wales (309 pmp).
Chapter 2 - Dwellings
Introduction (Tables 2 and 6)
2.1 Dwelling fires account for 45% of all primary fires and 76% of all deaths in Great Britain in 2012-13 (see Explanatory note 5 for further information on the definitions of primary and dwelling fires). Overall, the number of dwelling fires fell by 6% to 41,000 in 2012-13, continuing the downward trend since 2000-01.
2.2 Dwelling fires continue to account for the vast majority of fire related deaths. The number of fatalities in such fires was 266, down by 32 in 2012-13 compared to the previous year and down by a third compared to ten years earlier. Single occupancy house/ bungalow or flat accounts for 88% of all dwelling fire deaths and casualties.
Accidental fires (Table 2)
2.3 Most dwelling fires in Britain in 2012-13 were accidental (89%). The 2012-13 figure is the lowest number of such fires recorded in more than a decade.
Cause of fire (Table 2)
2.4 The main cause of accidental fires in dwellings remains the misuse of equipment or appliances, with 13,900 cases recorded in 2012-13, 6% fewer than in 2011-12. This is the lowest figure recorded since 2000-01. Other leading causes are:
faulty appliances or leads. These have fallen by 20% in over a decade to 5,800;
careless handling of fire or hot substances. These declined by 28% since 2000-01;
Chip/fat pan fries. These have fallen by 77% in the last decade;
Incidences of placing articles too close to heat or fire. These have fallen by 17% since 2000-01.
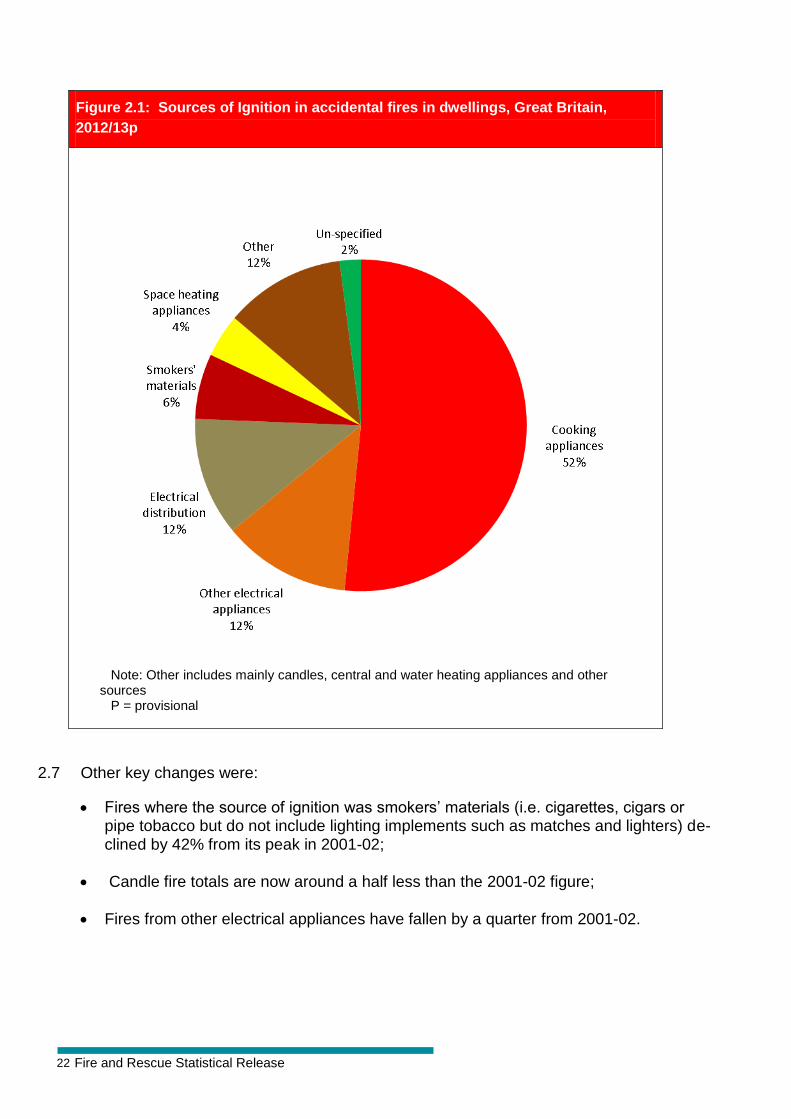
Source of ignition (Figure 2.1 and Table 3)
2.5 This section looks in more detail at the source of the flame, spark or heat that first ignited the fire. This is related to the cause of the fire, and for many sources of ignition there was only one major cause responsible for the fire. For example, for most fires in which the source of ignition was smokers’ materials the cause was most likely to be careless handling of fire or hot sub-stances.
2.6 Cooking appliances have been the main source of ignition (more than half) in accidental dwelling fires in 2012-13. Fires from this source show an almost continuous fall of around 41% from the peak of 32,000 in 2000-01.
22 Fire and Rescue Statistical Release
Figure 2.1: Sources of Ignition in accidental fires in dwellings, Great Britain,
2012/13p
Note: Other includes mainly candles, central and water heating appliances and other sources P = provisional
2.7 Other key changes were:
Fires where the source of ignition was smokers’ materials (i.e. cigarettes, cigars or pipe tobacco but do not include lighting implements such as matches and lighters) de-clined by 42% from its peak in 2001-02;
Candle fire totals are now around a half less than the 2001-02 figure;
Fires from other electrical appliances have fallen by a quarter from 2001-02.
Casualties from accidental fires (Tables 10 and 11)
2.8 Of the 266 fatalities in dwellings in 2012-13, 217 (82%) were of accidental causes. The number of fatalities in accidental home fires has reduced by 46% from the peak of 404 in 2001-02.
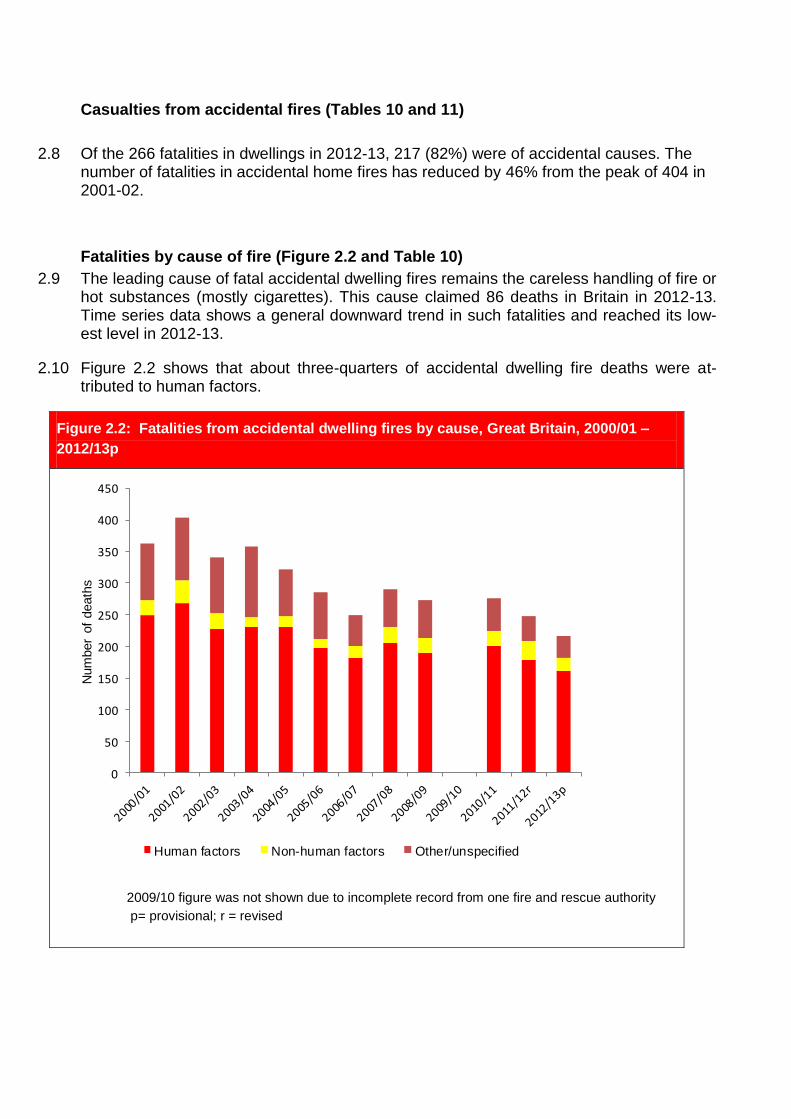
Fatalities by cause of fire (Figure 2.2 and Table 10)
2.9 The leading cause of fatal accidental dwelling fires remains the careless handling of fire or hot substances (mostly cigarettes). This cause claimed 86 deaths in Britain in 2012-13. Time series data shows a general downward trend in such fatalities and reached its low-est level in 2012-13.
2.10 Figure 2.2 shows that about three-quarters of accidental dwelling fire deaths were at-tributed to human factors.
Figure 2.2: Fatalities from accidental dwelling fires by cause, Great Britain, 2000/01 –
2012/13p
0
50
100
150
200
250
300
350
400
450
Num
ber
of
death
s
Human factors Non-human factors Other/unspecified
2009/10 figure was not shown due to incomplete record from one fire and rescue authority
p= provisional; r = revised
24 Fire and Rescue Statistical Release
2.11 Other key changes in the number of fatal casualties by cause of fire between 2001-02 and 2012-13 were:
Fatalities from ‘ placing articles too close to heat’ (second leading cause of accidental home fire deaths) fell by 8 from 44 to 36 in 2012-13;
Faulty appliances and leads accounted for 17 fatalities, down from 28 in 2001-02;
Fatalities due to the chip/fat pan fire down by 27 from 2001-02 to 11 in 2012-13.
Fatalities and rates by source of ignition of fire (Tables 2.1 and 11)
2.12 Smokers’ materials (i.e. cigarettes, cigars or pipe tobacco) were the most common source of ignition causing accidental dwelling fire fatalities, accounting for over a third of all acci-dental dwelling fire fatalities in 2012-13. For every 1,000 accidental dwelling fires caused by smokers’ materials, 35 people were killed in 2012-13. Fatalities from this source have fallen by 43% from the peak of 144 in 2001-02.
2.13 Interestingly, while cooking appliances were responsible for more than half of accidental dwelling fires, it was not the main source of ignition that claimed most deaths. These fires caused 27 deaths in 2012-13. For every 1,000 fires started in cooking appliances, there was only one fatality. This could reflect the relatively minor nature of many cooking-related fires and the fact that many cooking fires occur when the victims are alert at the time of the fire.
2.14 Accidental dwelling fires sourced from space heating appliances resulted in 30 fatalities in 2012-13.
2.15 Fires started in other electrical appliances resulted in 14 fatalities in accidental dwelling fires in 2012-13.
2.16 Fires from cigarette lighters and matches accounted for 11 fatalities in accidental dwelling fires in 2012-13.
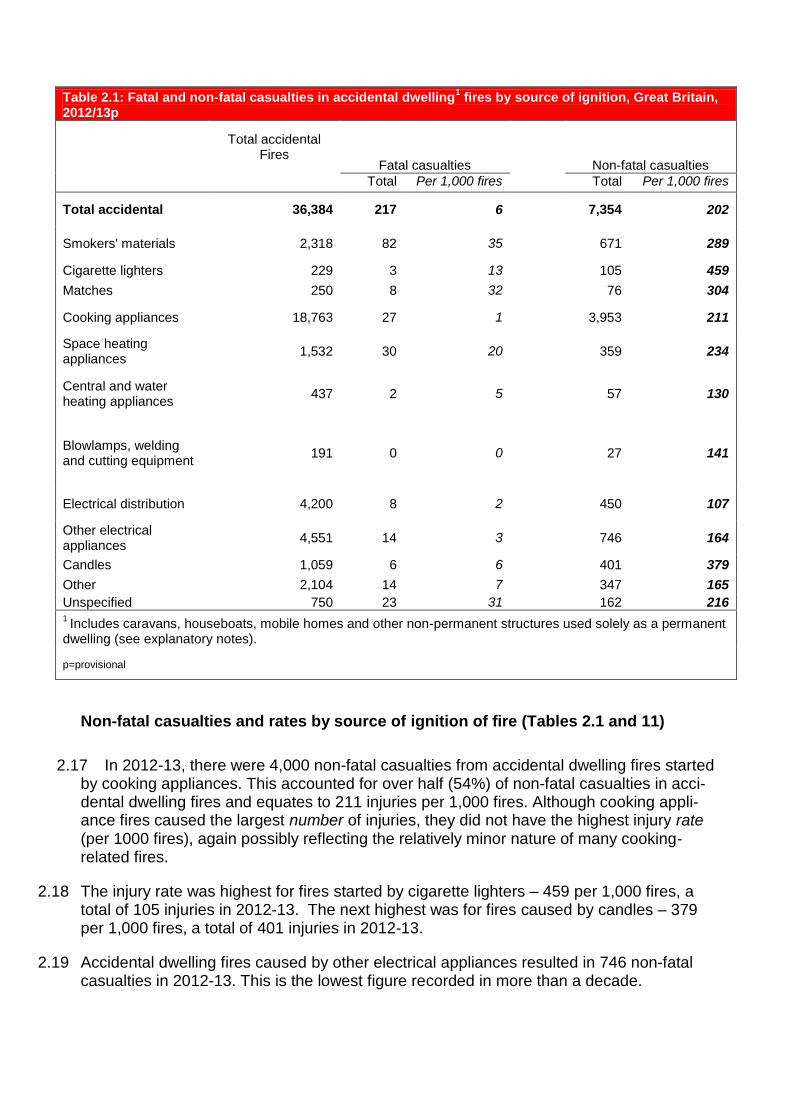
Table 2.1: Fatal and non-fatal casualties in accidental dwelling1 fires by source of ignition, Great Britain,
2012/13p
Total accidental Fires
Fatal casualties Non-fatal casualties
Total Per 1,000 fires Total Per 1,000 fires
Total accidental 36,384 217 6 7,354 202
Smokers' materials 2,318 82 35 671 289
Cigarette lighters 229 3 13 105 459
Matches 250 8 32 76 304
Cooking appliances 18,763 27 1 3,953 211
Space heating appliances
1,532 30 20 359 234
Central and water heating appliances
437 2 5 57 130
Blowlamps, welding and cutting equipment
191 0 0 27 141
Electrical distribution 4,200 8 2 450 107
Other electrical appliances
4,551 14 3 746 164
Candles 1,059 6 6 401 379
Other 2,104 14 7 347 165
Unspecified 750 23 31 162 216 1 Includes caravans, houseboats, mobile homes and other non-permanent structures used solely as a permanent
dwelling (see explanatory notes).
p=provisional
Non-fatal casualties and rates by source of ignition of fire (Tables 2.1 and 11)
2.17 In 2012-13, there were 4,000 non-fatal casualties from accidental dwelling fires started by cooking appliances. This accounted for over half (54%) of non-fatal casualties in acci-dental dwelling fires and equates to 211 injuries per 1,000 fires. Although cooking appli-ance fires caused the largest number of injuries, they did not have the highest injury rate (per 1000 fires), again possibly reflecting the relatively minor nature of many cooking-related fires.
2.18 The injury rate was highest for fires started by cigarette lighters – 459 per 1,000 fires, a total of 105 injuries in 2012-13. The next highest was for fires caused by candles – 379 per 1,000 fires, a total of 401 injuries in 2012-13.
2.19 Accidental dwelling fires caused by other electrical appliances resulted in 746 non-fatal casualties in 2012-13. This is the lowest figure recorded in more than a decade.
26 Fire and Rescue Statistical Release
2.20 Fires started by smokers’ materials resulted in 671 injuries –maintaining the long term downward trend (there were 1,440 injuries occurred from this source in accidental dwell-ing fires in 2001-02).
Non-fatal casualties by cause of fire (Figure 2.3 and Table 10)
2.21 In 2012-13 the total number of non-fatal casualties in dwelling fires Britain was 8,300 – 7% fewer than in 2011-12. The vast majority of these casualties occurred in fires caused accidentally (88%). The total number of non-fatal casualties in accidental dwelling fires fell by 6% from 7,800 in 2011-12 to 7,400 in 2012-13. Time series data shows a gradual de-cline in the number of non-fatal casualties since 2001-02.
2.22 The pattern of non-fatal casualties by cause has changed over time. Until 2004/05 Chip/fat pan fries was the leading cause of non-fatal casualties in Britain. From 2005/06 misuse of equipment and appliances was the biggest cause of non-fatal casualties in ac-cidental dwelling fires. Fires due to this cause resulted in 2,500 non-fatal casualties in 2012-13, 6% fewer than in 2011-12.
2.23 Other key changes between 2011-12 and 2012-13 in the number of non-fatal casualties by cause of fire were:
Chip pan fire non-fatal casualties were down by 10% to 1,100 in 2012-13. Injuries from this cause are at the lowest level since 2000-01.
Non-fatal casualties caused by careless handling of fire or hot substances declined by 12% to 1,000 in 2012-13.
Non-fatal casualties from fires caused by faulty appliances and leads declined by 8% to 830 in 2012-13.
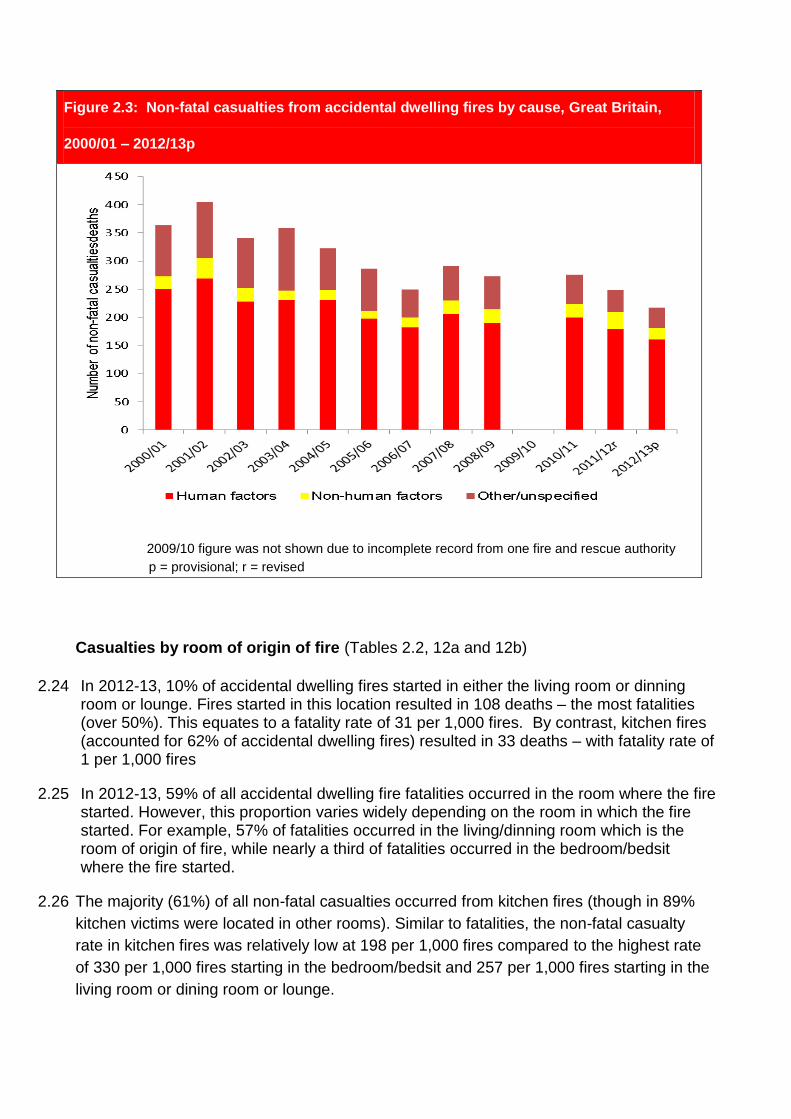
Figure 2.3: Non-fatal casualties from accidental dwelling fires by cause, Great Britain,
2000/01 – 2012/13p
2009/10 figure was not shown due to incomplete record from one fire and rescue authority
p = provisional; r = revised
Casualties by room of origin of fire (Tables 2.2, 12a and 12b)
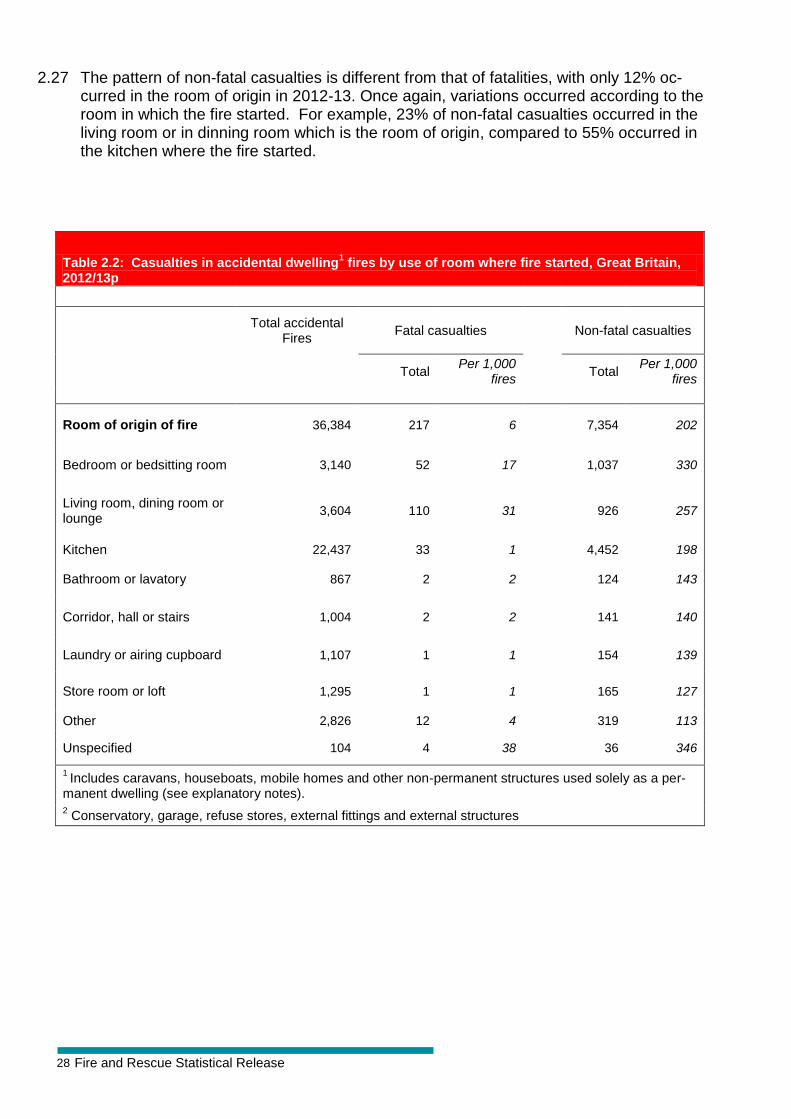
2.24 In 2012-13, 10% of accidental dwelling fires started in either the living room or dinning room or lounge. Fires started in this location resulted in 108 deaths – the most fatalities (over 50%). This equates to a fatality rate of 31 per 1,000 fires. By contrast, kitchen fires (accounted for 62% of accidental dwelling fires) resulted in 33 deaths – with fatality rate of 1 per 1,000 fires
2.25 In 2012-13, 59% of all accidental dwelling fire fatalities occurred in the room where the fire started. However, this proportion varies widely depending on the room in which the fire started. For example, 57% of fatalities occurred in the living/dinning room which is the room of origin of fire, while nearly a third of fatalities occurred in the bedroom/bedsit where the fire started.
2.26 The majority (61%) of all non-fatal casualties occurred from kitchen fires (though in 89%
kitchen victims were located in other rooms). Similar to fatalities, the non-fatal casualty
rate in kitchen fires was relatively low at 198 per 1,000 fires compared to the highest rate
of 330 per 1,000 fires starting in the bedroom/bedsit and 257 per 1,000 fires starting in the
living room or dining room or lounge.
28 Fire and Rescue Statistical Release
2.27 The pattern of non-fatal casualties is different from that of fatalities, with only 12% oc-curred in the room of origin in 2012-13. Once again, variations occurred according to the room in which the fire started. For example, 23% of non-fatal casualties occurred in the living room or in dinning room which is the room of origin, compared to 55% occurred in the kitchen where the fire started.
Table 2.2: Casualties in accidental dwelling1 fires by use of room where fire started, Great Britain,
2012/13p
Total accidental Fires
Fatal casualties Non-fatal casualties
Total
Per 1,000 fires
Total Per 1,000
fires
Room of origin of fire 36,384 217 6 7,354 202
Bedroom or bedsitting room 3,140 52 17 1,037 330
Living room, dining room or lounge
3,604 110 31 926 257
Kitchen 22,437 33 1 4,452 198
Bathroom or lavatory 867 2 2 124 143
Corridor, hall or stairs 1,004 2 2 141 140
Laundry or airing cupboard 1,107 1 1 154 139
Store room or loft 1,295 1 1 165 127
Other 2,826 12 4 319 113
Unspecified 104 4 38 36 346
1 Includes caravans, houseboats, mobile homes and other non-permanent structures used solely as a per-
manent dwelling (see explanatory notes). 2 Conservatory, garage, refuse stores, external fittings and external structures
Smoke alarm analysis (Tables 2.3 to 2.9 and Figure 2.3)
Introduction
2.28 This section looks at the ownership and effectiveness of smoke alarms and the likely cause of failure on those occasions when alarms did not operate. The assessment and analysis presented here is based (as elsewhere in this report) on fires attended by the fire and rescue service. Any fires involving alarms where no emergency call was made to the fire and rescue service will not be recorded. Therefore, the figures reported may under-state the effectiveness of smoke alarms. If a smoke alarm is working correctly it will pro-vide the occupier with an early warning of fire or smoke, making it is less likely the fire and rescue service will be called. Findings from the 2004/05 Survey of English Housing (SEH) estimate that the fire and rescue service were called to just over a fifth of all domestic fires (see paragraph 1.2 and explanatory note 11 for further details).
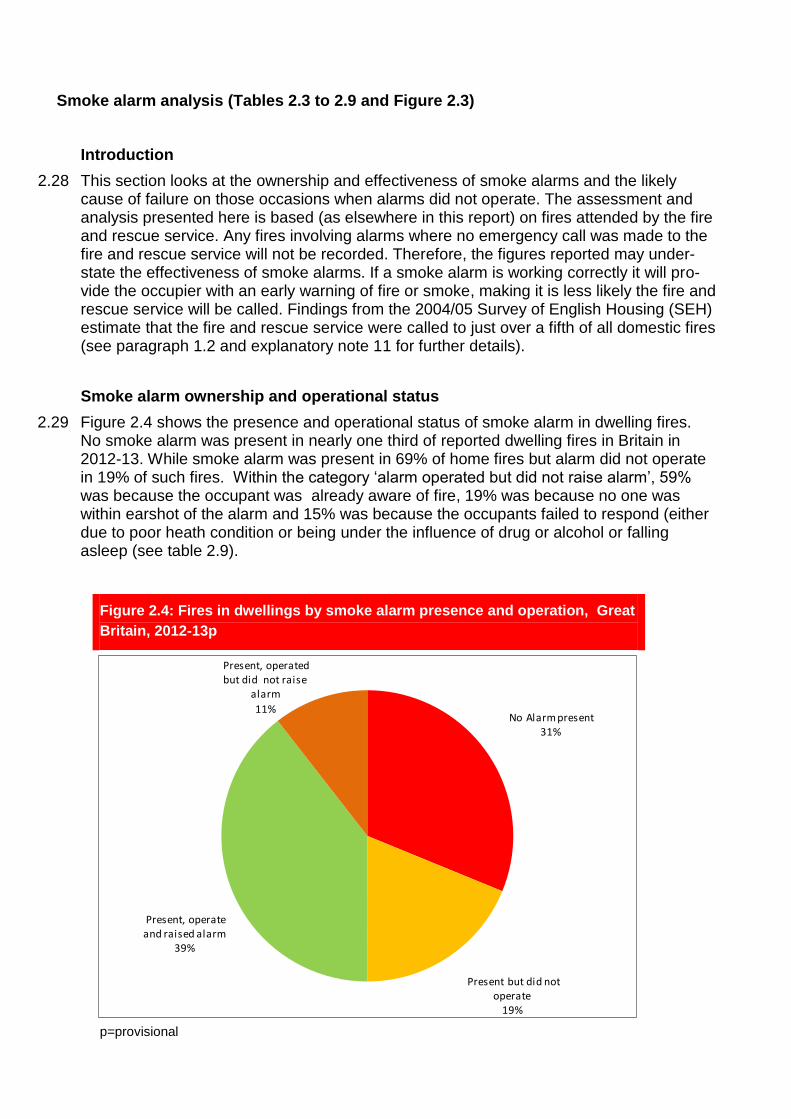
Smoke alarm ownership and operational status
2.29 Figure 2.4 shows the presence and operational status of smoke alarm in dwelling fires. No smoke alarm was present in nearly one third of reported dwelling fires in Britain in 2012-13. While smoke alarm was present in 69% of home fires but alarm did not operate in 19% of such fires. Within the category ‘alarm operated but did not raise alarm’, 59% was because the occupant was already aware of fire, 19% was because no one was within earshot of the alarm and 15% was because the occupants failed to respond (either due to poor heath condition or being under the influence of drug or alcohol or falling asleep (see table 2.9).
Figure 2.4: Fires in dwellings by smoke alarm presence and operation, Great
Britain, 2012-13p
No Alarm present31%
Present but did not operate
19%
Present, operate and raised alarm
39%
Present, operated but did not raise
alarm
11%
p=provisional
30 Fire and Rescue Statistical Release
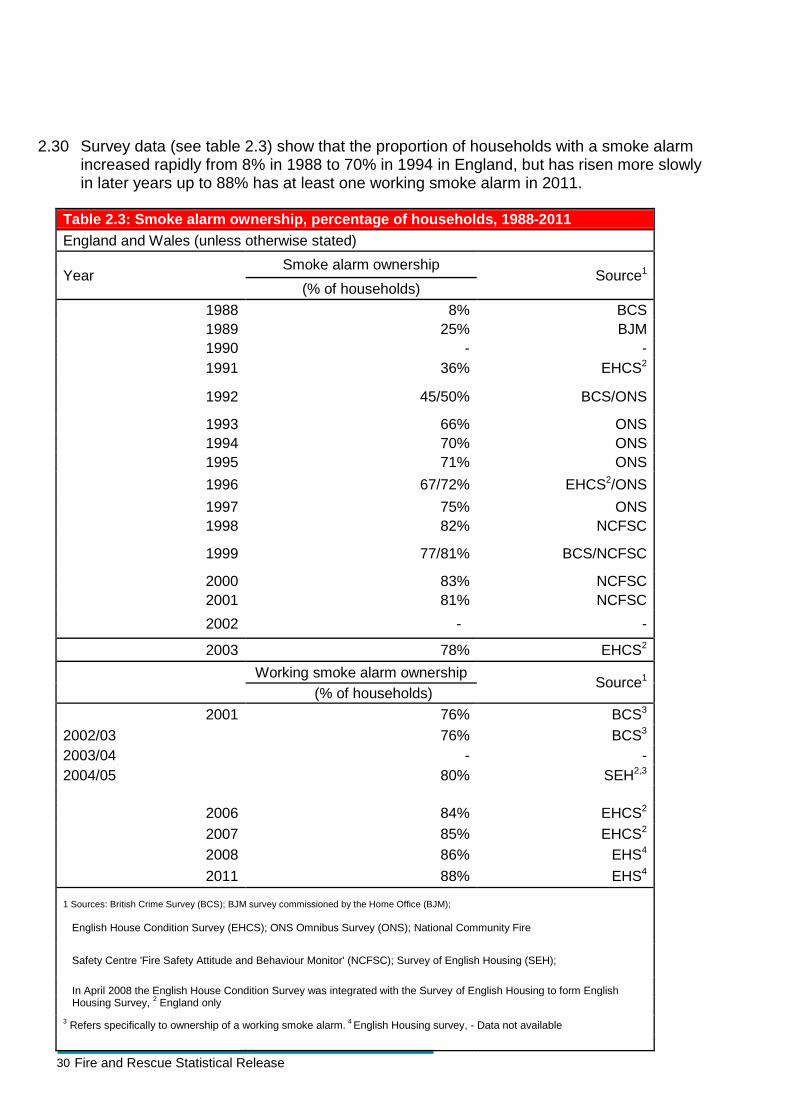
2.30 Survey data (see table 2.3) show that the proportion of households with a smoke alarm increased rapidly from 8% in 1988 to 70% in 1994 in England, but has risen more slowly in later years up to 88% has at least one working smoke alarm in 2011.
Table 2.3: Smoke alarm ownership, percentage of households, 1988-2011
England and Wales (unless otherwise stated)
Year Smoke alarm ownership
Source1 (% of households)
1988 8% BCS
1989 25% BJM
1990 - -
1991 36% EHCS2
1992 45/50% BCS/ONS
1993 66% ONS
1994 70% ONS
1995 71% ONS
1996 67/72% EHCS2/ONS
1997 75% ONS
1998 82% NCFSC
1999 77/81% BCS/NCFSC
2000 83% NCFSC
2001 81% NCFSC
2002 - -
2003 78% EHCS2
Working smoke alarm ownership
Source1 (% of households)
2001 76% BCS3
2002/03 76% BCS3
2003/04 - -
2004/05 80% SEH2,3
2006 84% EHCS2
2007 85% EHCS2
2008 86% EHS4
2011 88% EHS4
1 Sources: British Crime Survey (BCS); BJM survey commissioned by the Home Office (BJM);
English House Condition Survey (EHCS); ONS Omnibus Survey (ONS); National Community Fire
Safety Centre 'Fire Safety Attitude and Behaviour Monitor' (NCFSC); Survey of English Housing (SEH);
In April 2008 the English House Condition Survey was integrated with the Survey of English Housing to form English Housing Survey,
2 England only
3 Refers specifically to ownership of a working smoke alarm.
4 English Housing survey, - Data not available
Smoke alarm presence, operation and casualties (Tables 2.4 to 2.6)
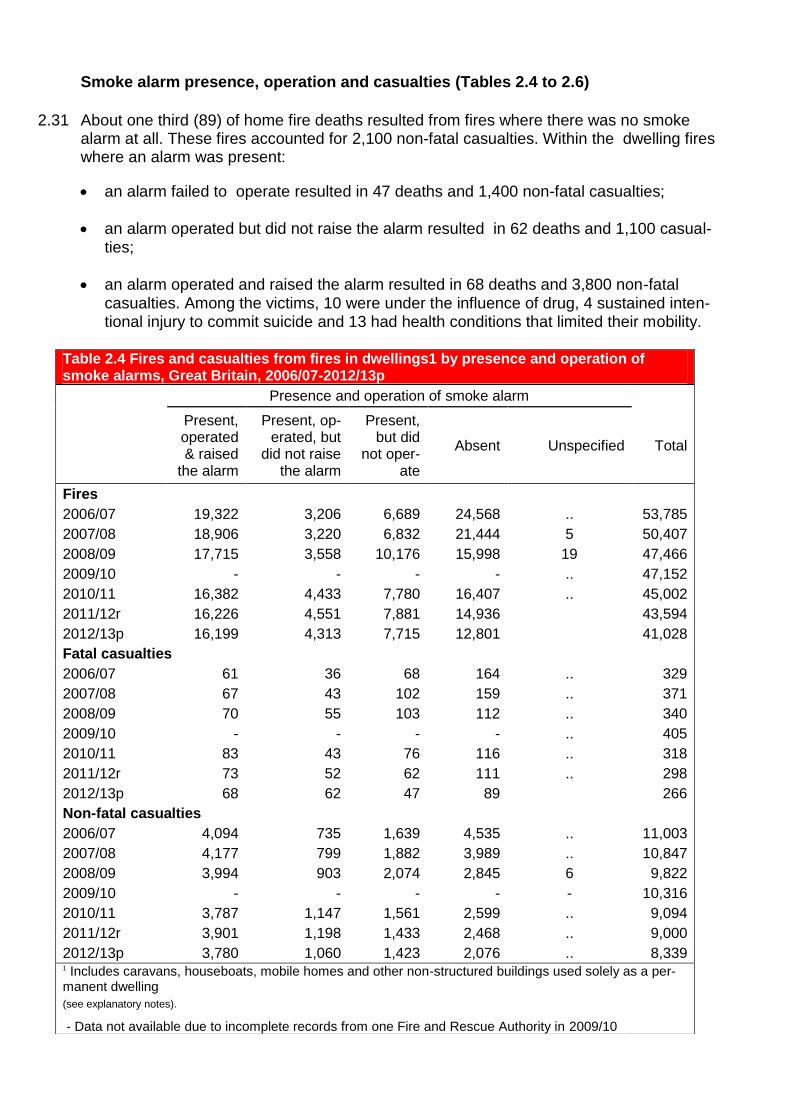
2.31 About one third (89) of home fire deaths resulted from fires where there was no smoke alarm at all. These fires accounted for 2,100 non-fatal casualties. Within the dwelling fires where an alarm was present:
an alarm failed to operate resulted in 47 deaths and 1,400 non-fatal casualties;
an alarm operated but did not raise the alarm resulted in 62 deaths and 1,100 casual-ties;
an alarm operated and raised the alarm resulted in 68 deaths and 3,800 non-fatal casualties. Among the victims, 10 were under the influence of drug, 4 sustained inten-tional injury to commit suicide and 13 had health conditions that limited their mobility.
Table 2.4 Fires and casualties from fires in dwellings1 by presence and operation of smoke alarms, Great Britain, 2006/07-2012/13p
Presence and operation of smoke alarm
Present, operated & raised
the alarm
Present, op-erated, but
did not raise the alarm
Present, but did
not oper-ate
Absent Unspecified Total
Fires
2006/07 19,322 3,206 6,689 24,568 .. 53,785
2007/08 18,906 3,220 6,832 21,444 5 50,407
2008/09 17,715 3,558 10,176 15,998 19 47,466
2009/10 - - - - .. 47,152
2010/11 16,382 4,433 7,780 16,407 .. 45,002
2011/12r 16,226 4,551 7,881 14,936 43,594
2012/13p 16,199 4,313 7,715 12,801 41,028
Fatal casualties
2006/07 61 36 68 164 .. 329
2007/08 67 43 102 159 .. 371
2008/09 70 55 103 112 .. 340
2009/10 - - - - .. 405
2010/11 83 43 76 116 .. 318
2011/12r 73 52 62 111 .. 298
2012/13p 68 62 47 89 266
Non-fatal casualties
2006/07 4,094 735 1,639 4,535 .. 11,003
2007/08 4,177 799 1,882 3,989 .. 10,847
2008/09 3,994 903 2,074 2,845 6 9,822
2009/10 - - - - - 10,316
2010/11 3,787 1,147 1,561 2,599 .. 9,094
2011/12r 3,901 1,198 1,433 2,468 .. 9,000
2012/13p 3,780 1,060 1,423 2,076 .. 8,339 1 Includes caravans, houseboats, mobile homes and other non-structured buildings used solely as a per-manent dwelling
(see explanatory notes).
- Data not available due to incomplete records from one Fire and Rescue Authority in 2009/10
32 Fire and Rescue Statistical Release
Type of alarm (Table 2.5)
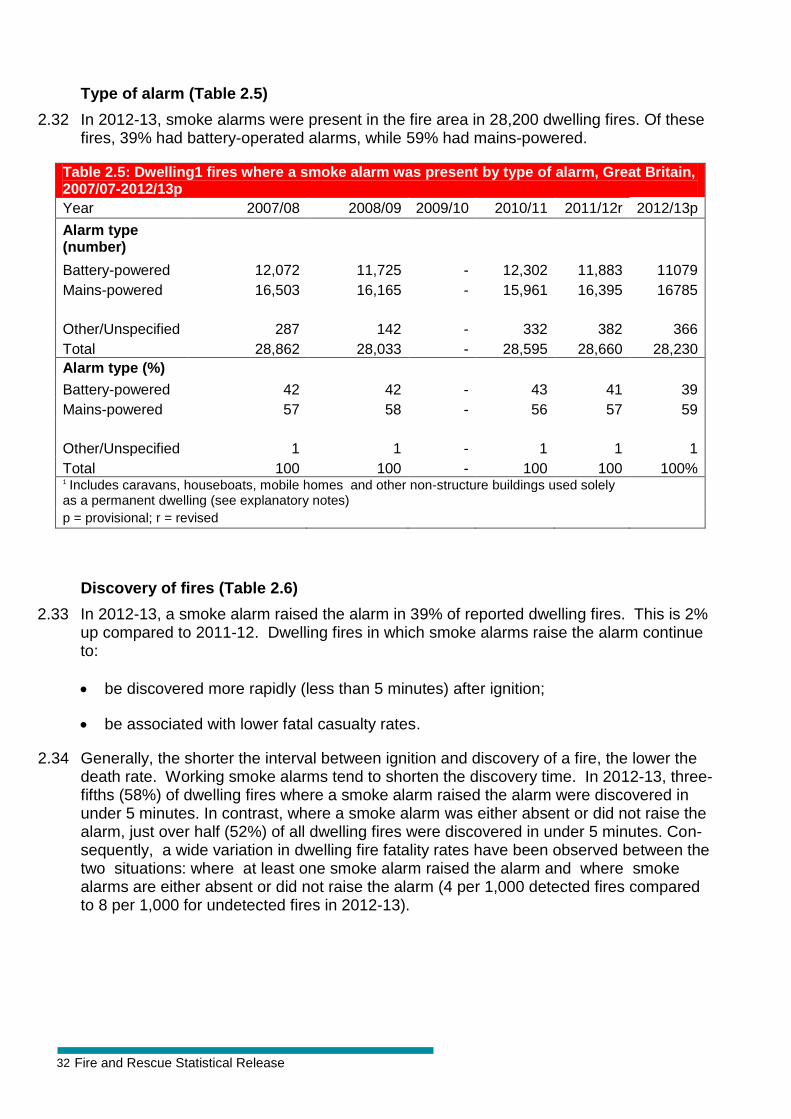
2.32 In 2012-13, smoke alarms were present in the fire area in 28,200 dwelling fires. Of these fires, 39% had battery-operated alarms, while 59% had mains-powered.
Table 2.5: Dwelling1 fires where a smoke alarm was present by type of alarm, Great Britain, 2007/07-2012/13p
Year 2007/08 2008/09 2009/10 2010/11 2011/12r 2012/13p
Alarm type (number)
Battery-powered 12,072 11,725 - 12,302 11,883 11079
Mains-powered 16,503 16,165 - 15,961 16,395 16785
Other/Unspecified 287 142 - 332 382 366
Total 28,862 28,033 - 28,595 28,660 28,230
Alarm type (%)
Battery-powered 42 42 - 43 41 39
Mains-powered 57 58 - 56 57 59
Other/Unspecified 1 1 - 1 1 1
Total 100 100 - 100 100 100% 1 Includes caravans, houseboats, mobile homes and other non-structure buildings used solely as a permanent dwelling (see explanatory notes)
p = provisional; r = revised
Discovery of fires (Table 2.6)
2.33 In 2012-13, a smoke alarm raised the alarm in 39% of reported dwelling fires. This is 2% up compared to 2011-12. Dwelling fires in which smoke alarms raise the alarm continue to:
be discovered more rapidly (less than 5 minutes) after ignition;
be associated with lower fatal casualty rates.
2.34 Generally, the shorter the interval between ignition and discovery of a fire, the lower the death rate. Working smoke alarms tend to shorten the discovery time. In 2012-13, three-fifths (58%) of dwelling fires where a smoke alarm raised the alarm were discovered in under 5 minutes. In contrast, where a smoke alarm was either absent or did not raise the alarm, just over half (52%) of all dwelling fires were discovered in under 5 minutes. Con-sequently, a wide variation in dwelling fire fatality rates have been observed between the two situations: where at least one smoke alarm raised the alarm and where smoke alarms are either absent or did not raise the alarm (4 per 1,000 detected fires compared to 8 per 1,000 for undetected fires in 2012-13).
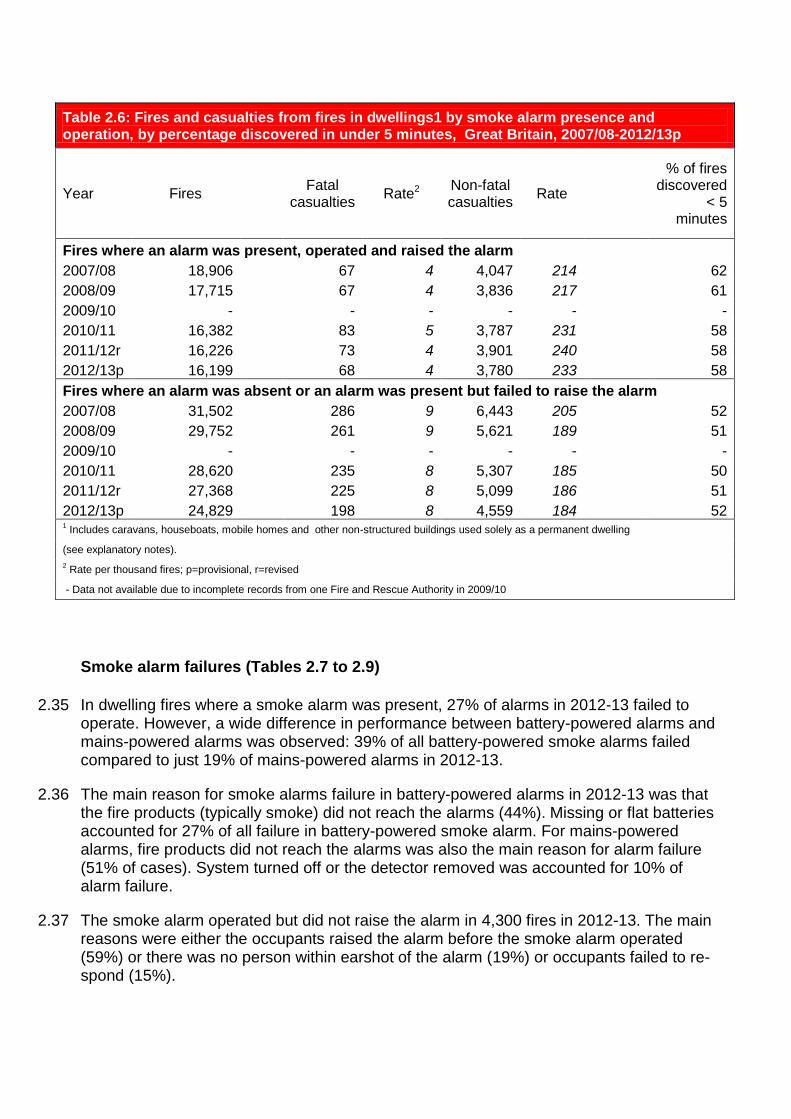
Table 2.6: Fires and casualties from fires in dwellings1 by smoke alarm presence and operation, by percentage discovered in under 5 minutes, Great Britain, 2007/08-2012/13p
Year Fires Fatal
casualties Rate2
Non-fatal casualties
Rate
% of fires discovered
< 5 minutes
Fires where an alarm was present, operated and raised the alarm
2007/08 18,906
67 4 4,047 214
62
2008/09 17,715
67 4 3,836 217
61
2009/10 - - - - - -
2010/11 16,382 83 5 3,787 231 58
2011/12r 16,226
73 4 3,901 240 58
2012/13p 16,199 68 4 3,780 233 58
Fires where an alarm was absent or an alarm was present but failed to raise the alarm
2007/08 31,502
286 9 6,443 205
52
2008/09 29,752
261 9 5,621 189
51
2009/10 - - - - - -
2010/11 28,620 235 8 5,307 185 50
2011/12r 27,368
225 8 5,099 186 51
2012/13p 24,829 198 8 4,559 184 52 1 Includes caravans, houseboats, mobile homes and other non-structured buildings used solely as a permanent dwelling
(see explanatory notes).
2 Rate per thousand fires; p=provisional, r=revised
- Data not available due to incomplete records from one Fire and Rescue Authority in 2009/10
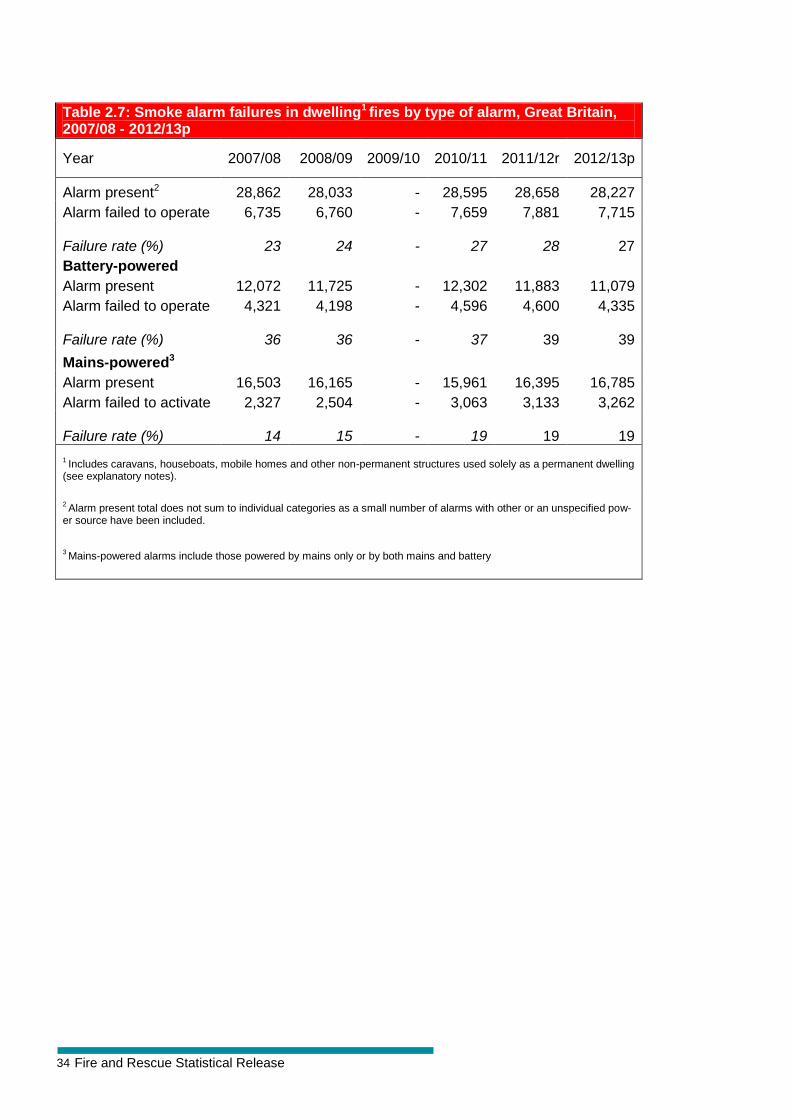
Smoke alarm failures (Tables 2.7 to 2.9)
2.35 In dwelling fires where a smoke alarm was present, 27% of alarms in 2012-13 failed to operate. However, a wide difference in performance between battery-powered alarms and mains-powered alarms was observed: 39% of all battery-powered smoke alarms failed compared to just 19% of mains-powered alarms in 2012-13.
2.36 The main reason for smoke alarms failure in battery-powered alarms in 2012-13 was that the fire products (typically smoke) did not reach the alarms (44%). Missing or flat batteries accounted for 27% of all failure in battery-powered smoke alarm. For mains-powered alarms, fire products did not reach the alarms was also the main reason for alarm failure (51% of cases). System turned off or the detector removed was accounted for 10% of alarm failure.
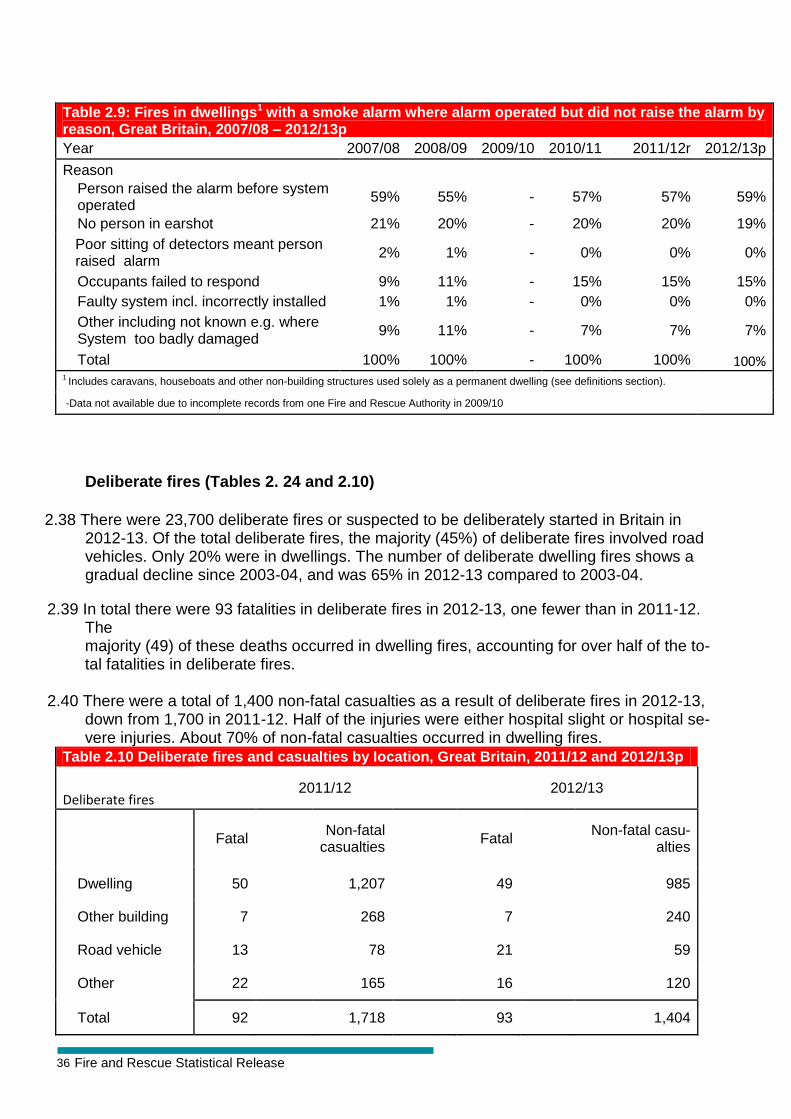
2.37 The smoke alarm operated but did not raise the alarm in 4,300 fires in 2012-13. The main reasons were either the occupants raised the alarm before the smoke alarm operated (59%) or there was no person within earshot of the alarm (19%) or occupants failed to re-spond (15%).
34 Fire and Rescue Statistical Release
Table 2.7: Smoke alarm failures in dwelling1 fires by type of alarm, Great Britain, 2007/08 - 2012/13p
Year 2007/08 2008/09 2009/10 2010/11 2011/12r 2012/13p
Alarm present2 28,862 28,033 - 28,595 28,658 28,227
Alarm failed to operate 6,735 6,760 - 7,659 7,881 7,715 Failure rate (%) 23 24 - 27 28 27
Battery-powered
Alarm present 12,072 11,725 - 12,302 11,883 11,079
Alarm failed to operate 4,321 4,198 - 4,596 4,600 4,335 Failure rate (%) 36 36 - 37 39 39
Mains-powered3
Alarm present 16,503 16,165 - 15,961 16,395 16,785
Alarm failed to activate 2,327 2,504 - 3,063 3,133 3,262 Failure rate (%) 14 15 - 19 19 19
1 Includes caravans, houseboats, mobile homes and other non-permanent structures used solely as a permanent dwelling
(see explanatory notes).
2 Alarm present total does not sum to individual categories as a small number of alarms with other or an unspecified pow-
er source have been included.
3 Mains-powered alarms include those powered by mains only or by both mains and battery
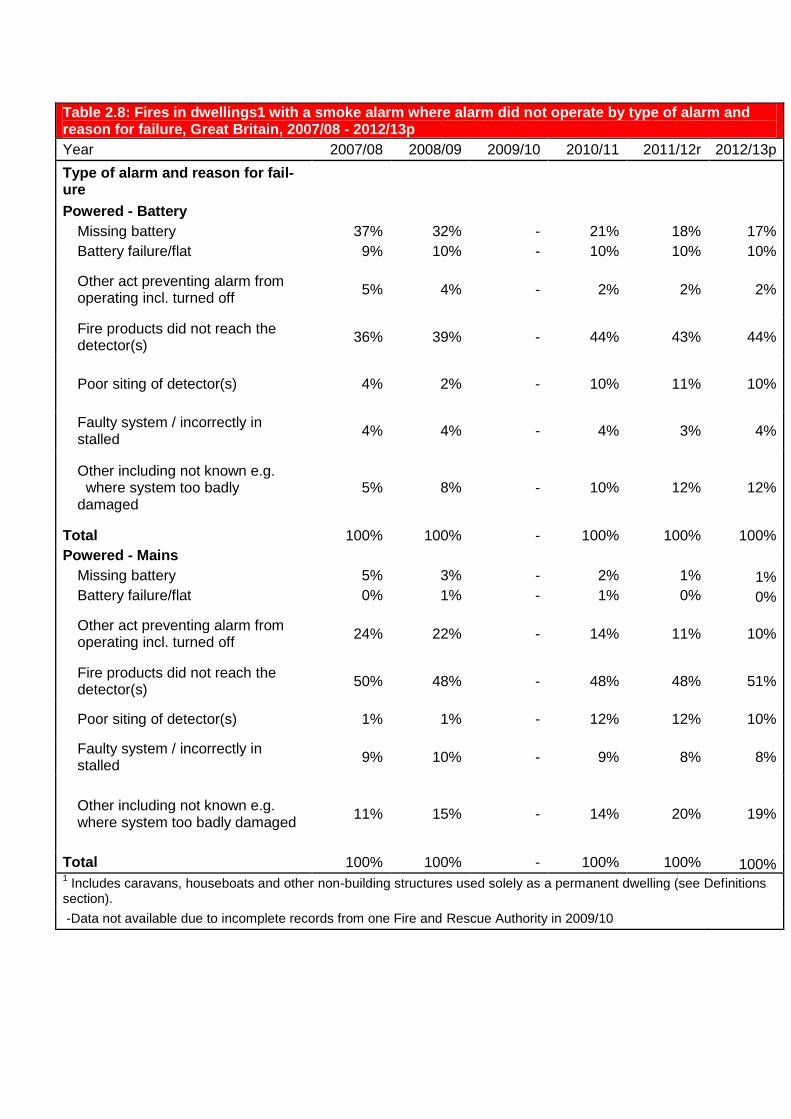
Table 2.8: Fires in dwellings1 with a smoke alarm where alarm did not operate by type of alarm and reason for failure, Great Britain, 2007/08 - 2012/13p
Year 2007/08 2008/09 2009/10 2010/11 2011/12r 2012/13p
Type of alarm and reason for fail-ure
Powered - Battery
Missing battery 37% 32% - 21% 18% 17%
Battery failure/flat 9% 10% - 10% 10% 10%
Other act preventing alarm from operating incl. turned off
5% 4% - 2% 2% 2%
Fire products did not reach the detector(s)
36% 39% - 44% 43% 44%
Poor siting of detector(s) 4% 2% - 10% 11% 10%
Faulty system / incorrectly in stalled
4% 4% - 4% 3% 4%
Other including not known e.g. where system too badly damaged
5% 8% - 10% 12% 12%
Total 100% 100% - 100% 100% 100%
Powered - Mains
Missing battery 5% 3% - 2% 1% 1%
Battery failure/flat 0% 1% - 1% 0% 0%
Other act preventing alarm from operating incl. turned off
24% 22% - 14% 11% 10%
Fire products did not reach the detector(s)
50% 48% - 48% 48% 51%
Poor siting of detector(s) 1% 1% - 12% 12% 10%
Faulty system / incorrectly in stalled
9% 10% - 9% 8% 8%
Other including not known e.g. where system too badly damaged
11% 15% - 14% 20% 19%
Total 100% 100% - 100% 100% 100% 1 Includes caravans, houseboats and other non-building structures used solely as a permanent dwelling (see Definitions
section).
-Data not available due to incomplete records from one Fire and Rescue Authority in 2009/10
36 Fire and Rescue Statistical Release
Table 2.9: Fires in dwellings1 with a smoke alarm where alarm operated but did not raise the alarm by reason, Great Britain, 2007/08 – 2012/13p
Year 2007/08 2008/09 2009/10 2010/11 2011/12r 2012/13p
Reason
Person raised the alarm before system operated
59% 55% - 57% 57% 59%
No person in earshot 21% 20% - 20% 20% 19%
Poor sitting of detectors meant person raised alarm
2% 1% - 0% 0% 0%
Occupants failed to respond 9% 11% - 15% 15% 15%
Faulty system incl. incorrectly installed 1% 1% - 0% 0% 0%
Other including not known e.g. where System too badly damaged
9% 11% - 7% 7% 7%
Total 100% 100% - 100% 100% 100% 1 Includes caravans, houseboats and other non-building structures used solely as a permanent dwelling (see definitions section).
-Data not available due to incomplete records from one Fire and Rescue Authority in 2009/10
Deliberate fires (Tables 2. 24 and 2.10)
2.38 There were 23,700 deliberate fires or suspected to be deliberately started in Britain in 2012-13. Of the total deliberate fires, the majority (45%) of deliberate fires involved road vehicles. Only 20% were in dwellings. The number of deliberate dwelling fires shows a gradual decline since 2003-04, and was 65% in 2012-13 compared to 2003-04.
2.39 In total there were 93 fatalities in deliberate fires in 2012-13, one fewer than in 2011-12. The majority (49) of these deaths occurred in dwelling fires, accounting for over half of the to-tal fatalities in deliberate fires.
2.40 There were a total of 1,400 non-fatal casualties as a result of deliberate fires in 2012-13,
down from 1,700 in 2011-12. Half of the injuries were either hospital slight or hospital se-vere injuries. About 70% of non-fatal casualties occurred in dwelling fires.
Table 2.10 Deliberate fires and casualties by location, Great Britain, 2011/12 and 2012/13p
Deliberate fires 2011/12 2012/13
Fatal Non-fatal
casualties Fatal
Non-fatal casu-alties
Dwelling 50 1,207 49
985
Other building 7 268 7
240
Road vehicle 13 78 21
59
Other 22 165 16
120
Total 92 1,718 93 1,404
Chapter 3 - Other Buildings
Introduction (Tables 1b and 6)
3.1 In 2012-13 there were 22,500 fires recorded in buildings that were not dwellings. This was 18% and 41% fewer than 2011-12 and 2002-03 respectively. This is the lowest figure rec-orded in more than a decade. The majority of fires occurred in:
private garages, sheds etc. (19%) – 4,300 fires;
retail distribution (14%) – 3,100 fires;
industrial premises (11%) – 2,600 fires;
restaurants, cafes, pub/wine bars, and take away (10%) – 2,300 fires;
communal living (9%) – 2,000 fires.
3.2 In 2012-13, 17 people died in buildings fires other than dwellings, twelve fewer than a year earlier. Also, 1,031 injuries were sustained in other building fires in 2012-13, 17% lower compared with 2011-12. These figures represent around 5% of all fire fatalities and 10% of non-fatal casualties in Great Britain.
Accidental fires (Table 2)
Trends
3.3 About three quarters of all fires in other buildings were started accidentally compared to 89% of those in fires in dwellings. In 2012-13, a total of 14,600 accidental fires were rec-orded in other buildings, 13% and 32% fewer than in 2011-12 and 2002-03 respectively.
Cause of fire
3.4 The main cause of accidental fires in other buildings remains faulty appliances and leads. In 2012-13, fires from this cause resulted in 3,900 fires, representing 26% of all such fires and down by 3% from 2011-12. Another key cause of accidental fires in other buildings was the misuse of equipment or appliances which accounted for 2,200 fires and was down by 13% in 2012-13 from a year earlier.
38 Fire and Rescue Statistical Release
Source of ignition (Table 3)
3.5 The main source of ignition in fires in other buildings is electrical (appliances and their leads). These accounted for one fifth of accidental fires in other buildings and slightly up 2% in 2012-13 compared to 2011-12. Other key sources are cooking appliances and oth-er electrical appliances. Fires whose source was from a cooking appliance fell by 9% in 2012-13. Other key changes relating to source of ignition from 2011-12 were:
Smokers’ materials – declined by 27% to 840,
Other electrical appliances – declined by 8% to 2,800.
Deliberate fires (Tables 2.14 and 24, Figure 3.1)
Trends
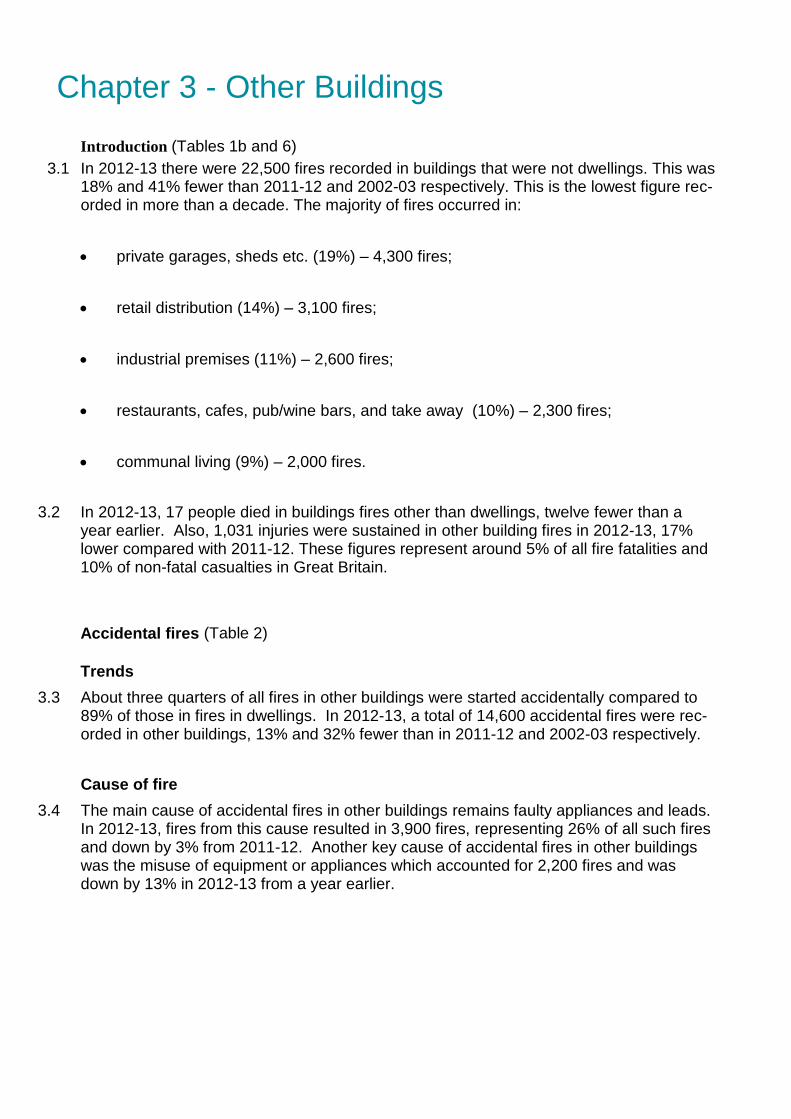
3.6 5,300 (26%) of other building fires were due to deliberate ignition, down by 28% from 2011-12. Over the last decade, the number of deliberate fires in other buildings has de-clined by more than two thirds. (See paragraph 1.10 and table 1.2).
Figure 3.1: Other building fires: proportion of deliberate fires by location, Great Britain, 2012/13p
35
4 25
10
3 24
73 4
21
0
10
20
30
40
50
60
70
Pro
po
rtio
n o
f d
elib
era
te f
ire
s
Location (Figure 3.1)
3.7 A comparison of the number of deliberate fires in other building locations shows that certain buildings are more prone to deliberate ignition than others. The main locations in 2012-13 were private garages and sheds (35%), buildings whose use was not known or not categorised (21%) and retail and distribution (10%).
Non-fatal casualties and Location (Figure 3.2)
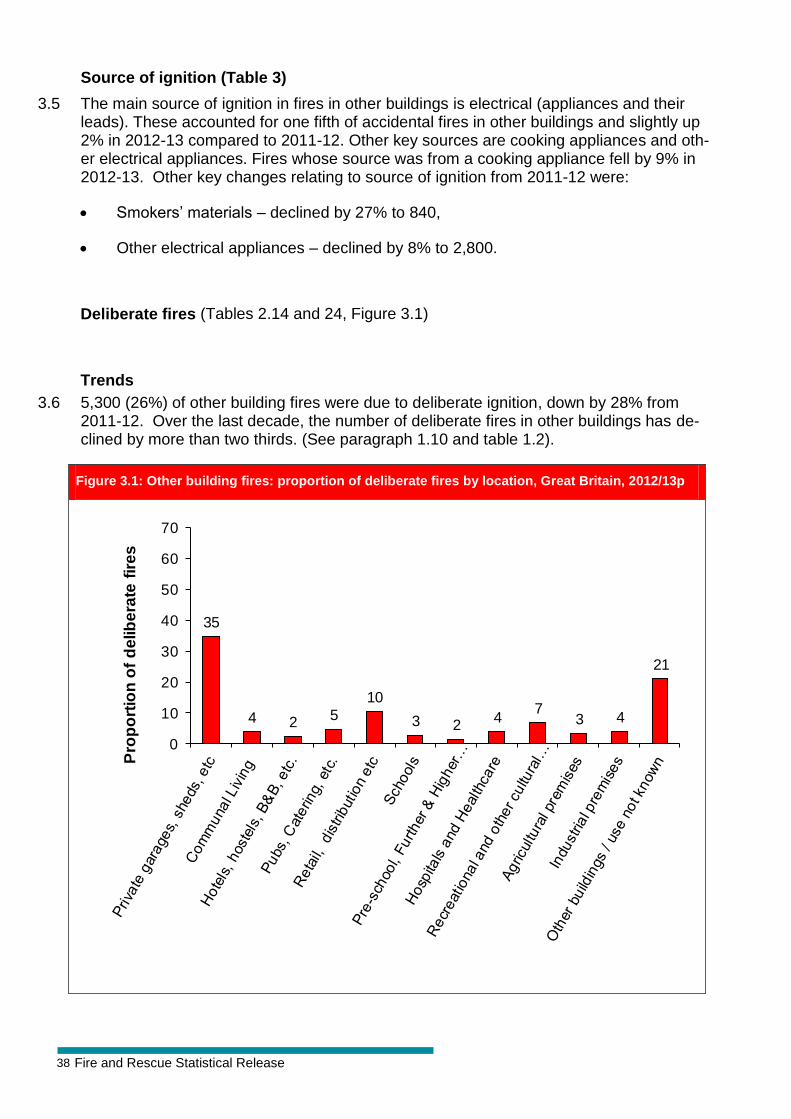
3.8 In 2012-13, the highest non-fatal casualty rates in deliberate fires in other buildings oc-curred in communal areas (194 casualties per 1,000 fires). High non-fatal casualty rates were also recorded in hotel, hostels and B&B - (101 non-fatal casualties per 1,000 fires) and hospital and health cares (100 non-fatal casualties per 1,000 fires). The rate in schools, and restaurant, cafe and pubs and catering areas are 34 and 28 per 1,000 fires respectively.
Figure 3.2: Deliberate fires in other buildings: Non-fatal casualty rates by location, Great Britain,
2012/13p
P= provisional
40 Fire and Rescue Statistical Release
Automatic smoke alarm analyses in other buildings (Tables 3.1 to 3.3, Figure 3.3)
Introduction
3.9 This section looks at the effectiveness of smoke alarms and the likely causes of failure on those occasions when alarms did not operate. The assessment and analysis presented here is based (as elsewhere in this report) on fires attended by the fire and rescue ser-vice. Any fires involving alarms where no emergency call was made will not be recorded, meaning that effectiveness of automatic fire alarms may be understated. See paragraph 2.26 for further details in relation to domestic smoke alarms.
Automatic smoke alarm presence and operation
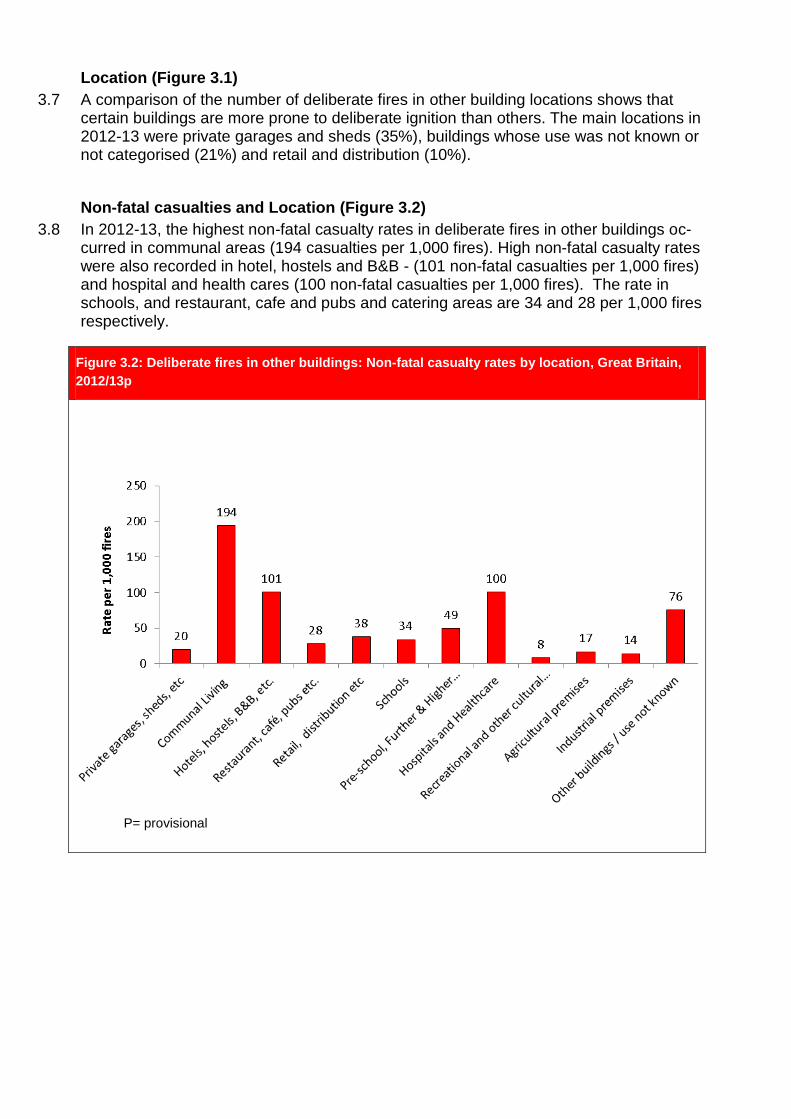
3.10 Automatic smoke alarms were not present in 46% (9,200) of other building fires in 2012-13, down by more than one fourth compared with 2011-12. These fires resulted in 11 fa-talities (65% of total other building fire deaths) and a further 387 non-fatal casualties. For the remaining 54% of other building fires where an automatic smoke alarm was present:
The automatic fire alarm operated and raised the alarm in 35% (7,000 fires);
The fire alarm operated but did not raise the alarm in 5% (1,000 fires);
The alarm failed to operate altogether in 13% (2,600 fires).
This follows a broadly similar pattern to that for dwelling fires (39%, 11% and 19% respec-tively). Again, 46% of fires occurred in other buildings without having any smoke alarm compared to 31% of dwelling fires occurred where smoke alarm was absent.
Figure 3.3: Fires in other buildings by automatic smoke alarm presence and operation, Great Britain, 2012/13p
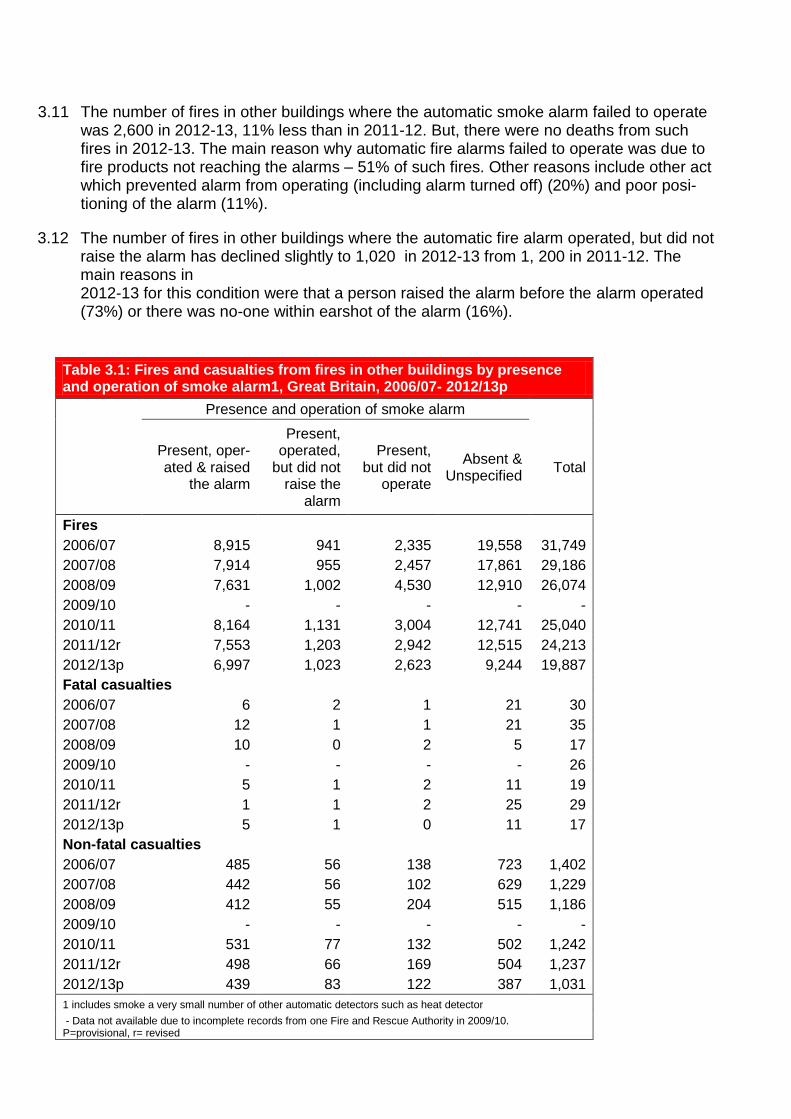
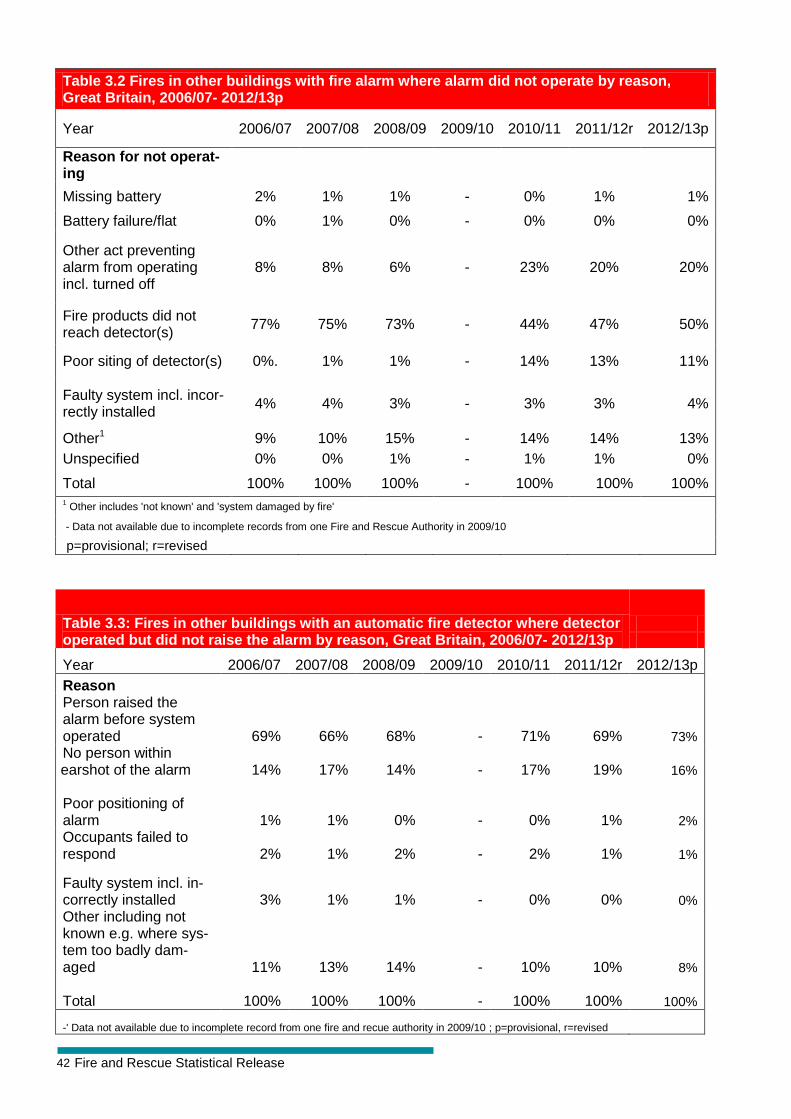
3.11 The number of fires in other buildings where the automatic smoke alarm failed to operate was 2,600 in 2012-13, 11% less than in 2011-12. But, there were no deaths from such fires in 2012-13. The main reason why automatic fire alarms failed to operate was due to fire products not reaching the alarms – 51% of such fires. Other reasons include other act which prevented alarm from operating (including alarm turned off) (20%) and poor posi-tioning of the alarm (11%).
3.12 The number of fires in other buildings where the automatic fire alarm operated, but did not raise the alarm has declined slightly to 1,020 in 2012-13 from 1, 200 in 2011-12. The main reasons in 2012-13 for this condition were that a person raised the alarm before the alarm operated (73%) or there was no-one within earshot of the alarm (16%).
Table 3.1: Fires and casualties from fires in other buildings by presence and operation of smoke alarm1, Great Britain, 2006/07- 2012/13p
Presence and operation of smoke alarm
Present, oper-ated & raised
the alarm
Present, operated,
but did not raise the
alarm
Present, but did not
operate
Absent & Unspecified
Total
Fires
2006/07 8,915 941 2,335 19,558 31,749
2007/08 7,914 955 2,457 17,861 29,186
2008/09 7,631 1,002 4,530 12,910 26,074
2009/10 - - - - -
2010/11 8,164 1,131 3,004 12,741 25,040
2011/12r 7,553 1,203 2,942 12,515 24,213
2012/13p 6,997 1,023 2,623 9,244 19,887
Fatal casualties
2006/07 6 2 1 21 30
2007/08 12 1 1 21 35
2008/09 10 0 2 5 17
2009/10 - - - - 26
2010/11 5 1 2 11 19
2011/12r 1 1 2 25 29
2012/13p 5 1 0 11 17
Non-fatal casualties
2006/07 485 56 138 723 1,402
2007/08 442 56 102 629 1,229
2008/09 412 55 204 515 1,186
2009/10 - - - - -
2010/11 531 77 132 502 1,242
2011/12r 498 66 169 504 1,237
2012/13p 439 83 122 387 1,031
1 includes smoke a very small number of other automatic detectors such as heat detector - Data not available due to incomplete records from one Fire and Rescue Authority in 2009/10. P=provisional, r= revised
42 Fire and Rescue Statistical Release
Table 3.2 Fires in other buildings with fire alarm where alarm did not operate by reason, Great Britain, 2006/07- 2012/13p
Year 2006/07 2007/08 2008/09 2009/10 2010/11 2011/12r 2012/13p
Reason for not operat-ing
Missing battery 2% 1% 1% - 0% 1% 1%
Battery failure/flat 0% 1% 0% - 0% 0% 0%
Other act preventing alarm from operating incl. turned off
8% 8% 6% - 23% 20% 20%
Fire products did not reach detector(s)
77% 75% 73% - 44% 47% 50%
Poor siting of detector(s) 0%. 1% 1% - 14% 13% 11%
Faulty system incl. incor-rectly installed
4% 4% 3% - 3% 3% 4%
Other1 9% 10% 15% - 14% 14% 13%
Unspecified 0% 0% 1% - 1% 1% 0%
Total 100% 100% 100% - 100% 100% 100% 1 Other includes 'not known' and 'system damaged by fire'
- Data not available due to incomplete records from one Fire and Rescue Authority in 2009/10 p=provisional; r=revised
Table 3.3: Fires in other buildings with an automatic fire detector where detector operated but did not raise the alarm by reason, Great Britain, 2006/07- 2012/13p
Year 2006/07 2007/08 2008/09 2009/10 2010/11 2011/12r 2012/13p
Reason
Person raised the alarm before system operated 69% 66% 68% - 71% 69% 73%
No person within earshot of the alarm 14% 17% 14% - 17% 19% 16%
Poor positioning of alarm 1% 1% 0% - 0% 1% 2%
Occupants failed to respond 2% 1% 2% - 2% 1% 1%
Faulty system incl. in-correctly installed 3% 1% 1% - 0% 0% 0%
Other including not known e.g. where sys-tem too badly dam-aged 11% 13% 14% - 10% 10% 8%
Total 100% 100% 100% - 100% 100% 100%
-' Data not available due to incomplete record from one fire and recue authority in 2009/10 ; p=provisional, r=revised
Chapter 4 - Road Vehicle Fires
Introduction (Table 1a, 16)
4.1 In 2012-13, Fire and rescue authorities in Britain responded to 23,900 road vehicle fires, down by 15% from 28,000 in 2011-12. The 2012-13 figure represented the lowest in more than a decade and declined by more than three quarters from the peak in 2001/02.
4.2 Breakdown by cause shows a downward trend for deliberate vehicle fires since 2002/03. Accidental fires in 2012-13 declined by 6% and 32% in 2011-12 and 2002-03 respectively.
4.3 Breakdown by types shows that the majority (66%) of fires occurred in cars, 9% in vans, 5% in lorries and 2% in coaches, buses or minibuses. The number of car fires was 80% fewer than ten years earlier.
Casualties (Table 6)
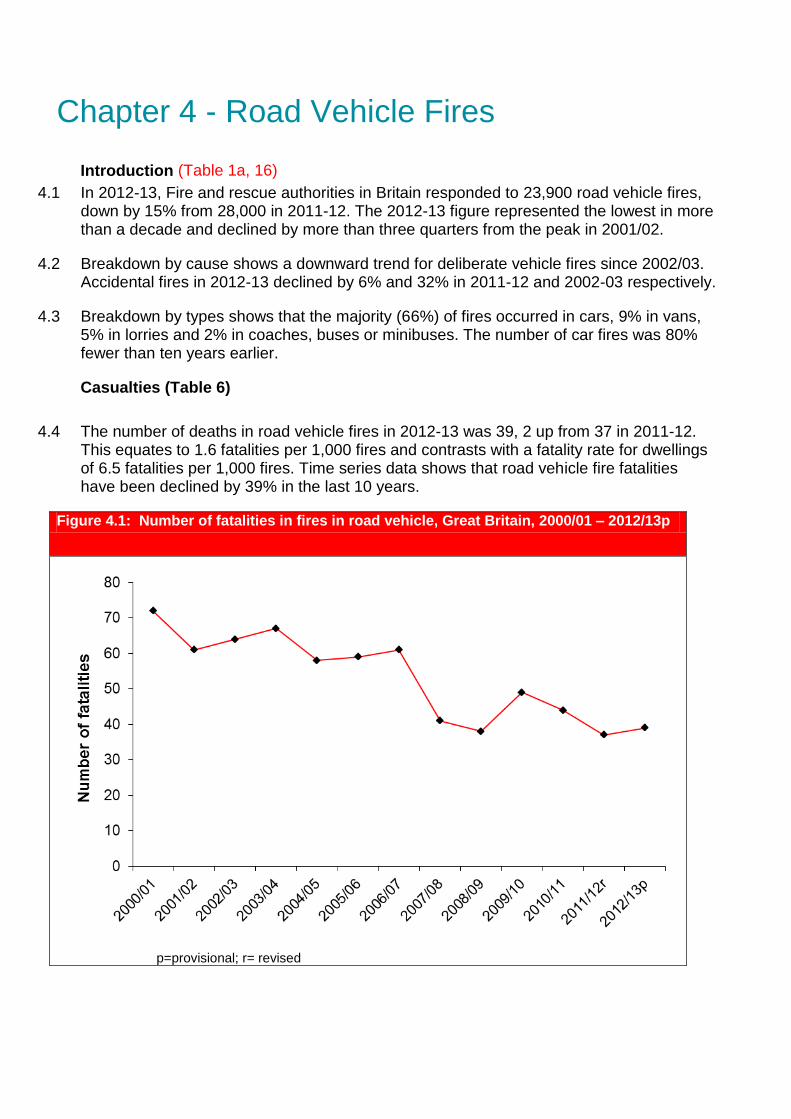
4.4 The number of deaths in road vehicle fires in 2012-13 was 39, 2 up from 37 in 2011-12. This equates to 1.6 fatalities per 1,000 fires and contrasts with a fatality rate for dwellings of 6.5 fatalities per 1,000 fires. Time series data shows that road vehicle fire fatalities have been declined by 39% in the last 10 years.
Figure 4.1: Number of fatalities in fires in road vehicle, Great Britain, 2000/01 – 2012/13p
p=provisional; r= revised
44 Fire and Rescue Statistical Release
4.5 The number of non-fatal casualties in road vehicle fires decreased slightly to 560 in 2012-13 from 610 in 2011-12. This is much lower than the level of fires recorded in 2000-01 (700 non-fatal cases). These latest figures equate to 23 non-fatal casualties per 1,000 fires, compared with 203 in dwellings and 52 in other buildings.
Chapter 5 – Outdoor Fires Introduction (Tables 1c, 6 and 5.1)
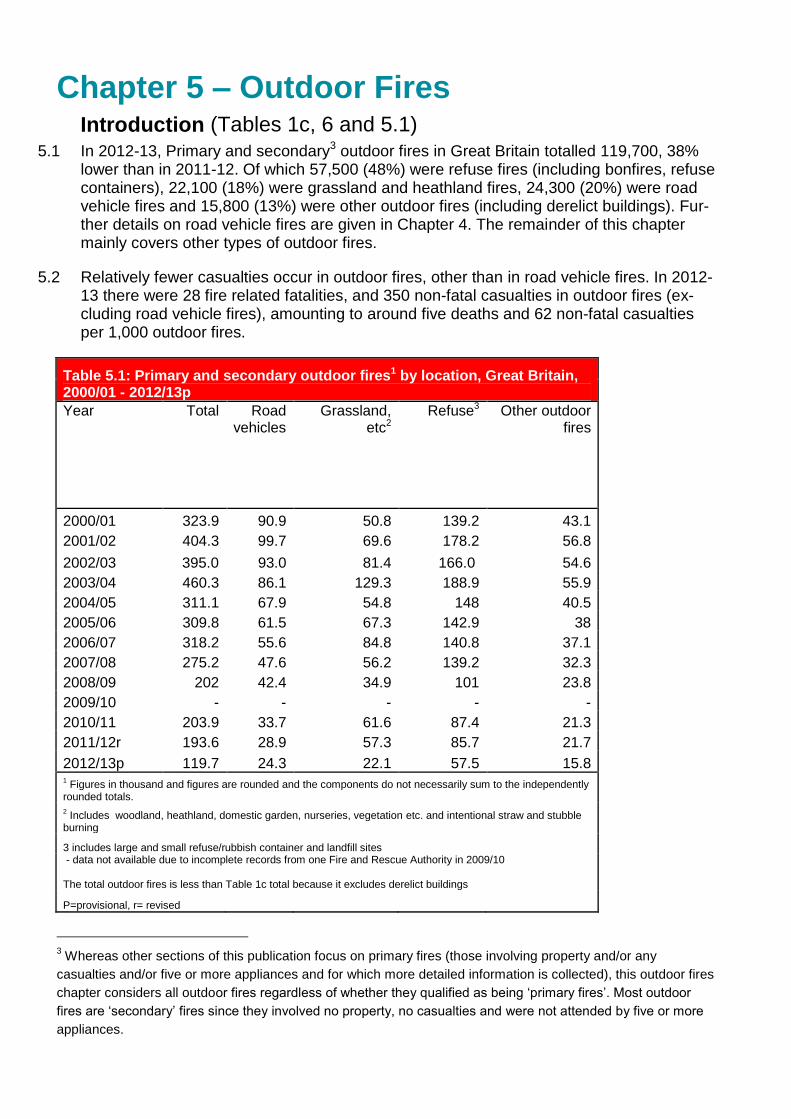
5.1 In 2012-13, Primary and secondary3 outdoor fires in Great Britain totalled 119,700, 38% lower than in 2011-12. Of which 57,500 (48%) were refuse fires (including bonfires, refuse containers), 22,100 (18%) were grassland and heathland fires, 24,300 (20%) were road vehicle fires and 15,800 (13%) were other outdoor fires (including derelict buildings). Fur-ther details on road vehicle fires are given in Chapter 4. The remainder of this chapter mainly covers other types of outdoor fires.
5.2 Relatively fewer casualties occur in outdoor fires, other than in road vehicle fires. In 2012-13 there were 28 fire related fatalities, and 350 non-fatal casualties in outdoor fires (ex-cluding road vehicle fires), amounting to around five deaths and 62 non-fatal casualties per 1,000 outdoor fires.
Table 5.1: Primary and secondary outdoor fires1 by location, Great Britain, 2000/01 - 2012/13p
Year Total Road vehicles
Grassland, etc2
Refuse3 Other outdoor fires
2000/01 323.9 90.9 50.8 139.2 43.1
2001/02 404.3 99.7 69.6 178.2 56.8
2002/03 395.0 93.0 81.4 166.0 54.6
2003/04 460.3 86.1 129.3 188.9 55.9
2004/05 311.1 67.9 54.8 148 40.5
2005/06 309.8 61.5 67.3 142.9 38
2006/07 318.2 55.6 84.8 140.8 37.1
2007/08 275.2 47.6 56.2 139.2 32.3
2008/09 202 42.4 34.9 101 23.8
2009/10 - - - - -
2010/11 203.9 33.7 61.6 87.4 21.3
2011/12r 193.6 28.9 57.3 85.7 21.7
2012/13p 119.7 24.3 22.1 57.5 15.8 1 Figures in thousand and figures are rounded and the components do not necessarily sum to the independently
rounded totals.
2 Includes woodland, heathland, domestic garden, nurseries, vegetation etc. and intentional straw and stubble
burning
3 includes large and small refuse/rubbish container and landfill sites - data not available due to incomplete records from one Fire and Rescue Authority in 2009/10 The total outdoor fires is less than Table 1c total because it excludes derelict buildings
P=provisional, r= revised
3 Whereas other sections of this publication focus on primary fires (those involving property and/or any
casualties and/or five or more appliances and for which more detailed information is collected), this outdoor fires
chapter considers all outdoor fires regardless of whether they qualified as being ‘primary fires’. Most outdoor
fires are ‘secondary’ fires since they involved no property, no casualties and were not attended by five or more
appliances.
46 Fire and Rescue Statistical Release
5.3 The number of grassland and heathland fires is dependent on persisting weather condi-tions. In 2012-13, there were 22,100 such fires recorded. This was 35,000 fewer than in 2011-12 due to 2012 having above average rainfall, and 107,000 less than the peak in 2003-04.
5.4 Refuse fires decreased in 2012-13 to 57,500 from 85,700 in 2011-12 This was the lowest level over the decade.
5.5 There were 24,300 road vehicle fires in 2012-13, a decrease of 15% from 2011-12 which itself had been the lowest level for more than a decade.
When fires occur (Table 5.2)
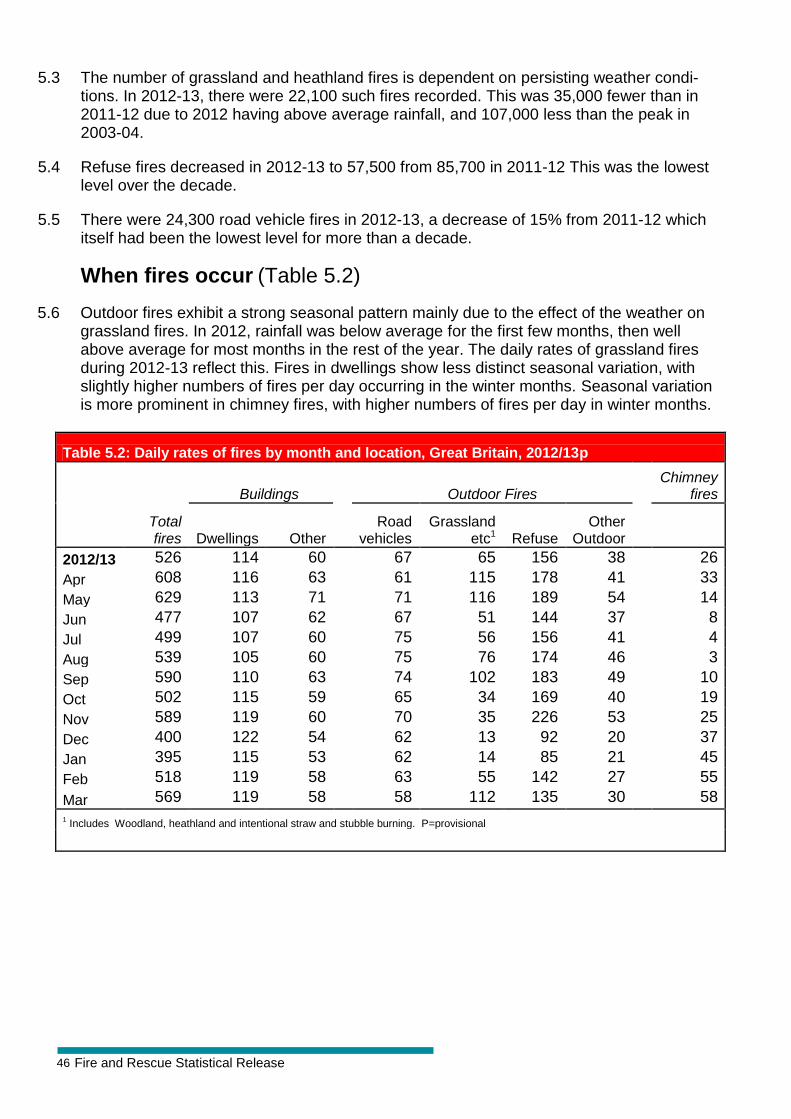
5.6 Outdoor fires exhibit a strong seasonal pattern mainly due to the effect of the weather on grassland fires. In 2012, rainfall was below average for the first few months, then well above average for most months in the rest of the year. The daily rates of grassland fires during 2012-13 reflect this. Fires in dwellings show less distinct seasonal variation, with slightly higher numbers of fires per day occurring in the winter months. Seasonal variation is more prominent in chimney fires, with higher numbers of fires per day in winter months.
Table 5.2: Daily rates of fires by month and location, Great Britain, 2012/13p
Total fires
Buildings Outdoor Fires Chimney
fires
Dwellings Other Road
vehicles Grassland
etc1 Refuse Other
Outdoor
2012/13 526 114 60 67 65 156 38 26
Apr 608 116 63 61 115 178 41 33
May 629 113 71 71 116 189 54 14
Jun 477 107 62 67 51 144 37 8
Jul 499 107 60 75 56 156 41 4
Aug 539 105 60 75 76 174 46 3
Sep 590 110 63 74 102 183 49 10
Oct 502 115 59 65 34 169 40 19
Nov 589 119 60 70 35 226 53 25
Dec 400 122 54 62 13 92 20 37
Jan 395 115 53 62 14 85 21 45
Feb 518 119 58 63 55 142 27 55
Mar 569 119 58 58 112 135 30 58
1 Includes Woodland, heathland and intentional straw and stubble burning. P=provisional
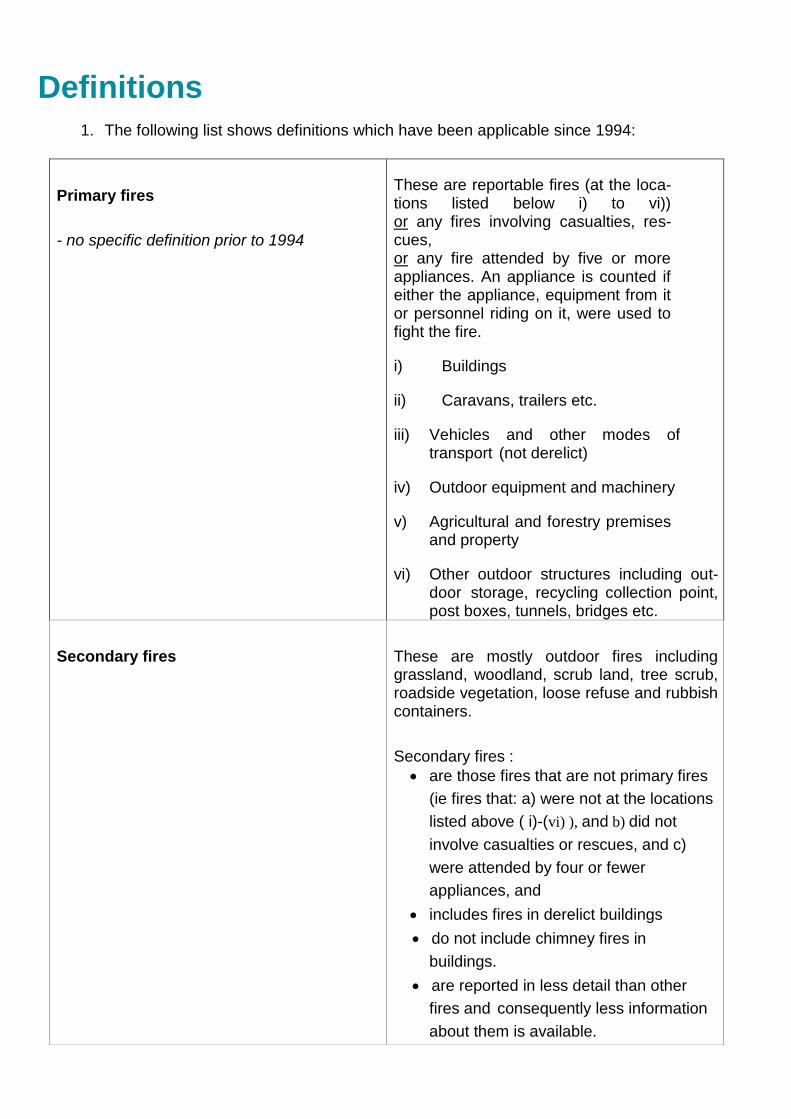
Definitions
1. The following list shows definitions which have been applicable since 1994:
Primary fires
- no specific definition prior to 1994
These are reportable fires (at the loca-tions listed below i) to vi)) or any fires involving casualties, res-cues, or any fire attended by five or more appliances. An appliance is counted if either the appliance, equipment from it or personnel riding on it, were used to fight the fire.
i) Buildings
ii) Caravans, trailers etc.
iii) Vehicles and other modes of transport (not derelict)
iv) Outdoor equipment and machinery
v) Agricultural and forestry premises and property
vi) Other outdoor structures including out-door storage, recycling collection point, post boxes, tunnels, bridges etc.
Secondary fires
These are mostly outdoor fires including grassland, woodland, scrub land, tree scrub, roadside vegetation, loose refuse and rubbish containers.
Secondary fires :
are those fires that are not primary fires
(ie fires that: a) were not at the locations
listed above ( i)-(vi) ), and b) did not
involve casualties or rescues, and c)
were attended by four or fewer
appliances, and
includes fires in derelict buildings
do not include chimney fires in
buildings.
are reported in less detail than other
fires and consequently less information
about them is available.
48 Fire and Rescue Statistical Release
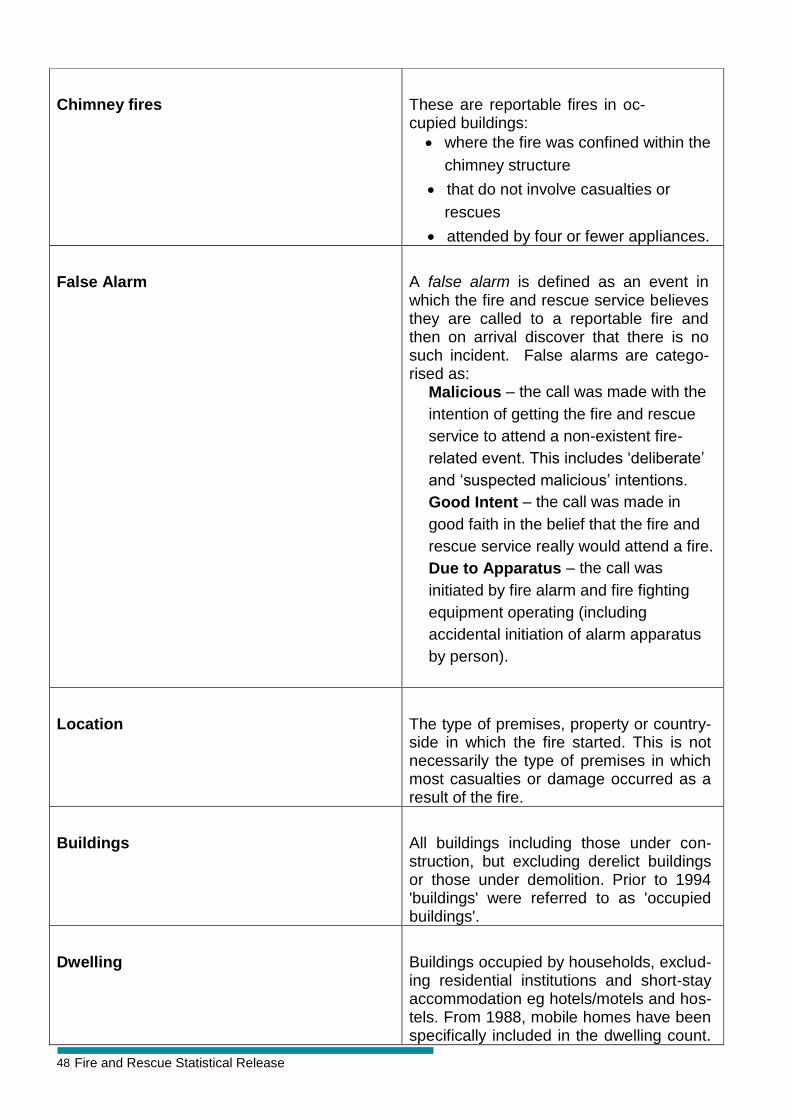
Chimney fires
These are reportable fires in oc-cupied buildings:
where the fire was confined within the
chimney structure
that do not involve casualties or
rescues
attended by four or fewer appliances.
False Alarm
A false alarm is defined as an event in which the fire and rescue service believes they are called to a reportable fire and then on arrival discover that there is no such incident. False alarms are catego-rised as:
Malicious – the call was made with the
intention of getting the fire and rescue
service to attend a non-existent fire-
related event. This includes ‘deliberate’
and ‘suspected malicious’ intentions.
Good Intent – the call was made in
good faith in the belief that the fire and
rescue service really would attend a fire.
Due to Apparatus – the call was
initiated by fire alarm and fire fighting
equipment operating (including
accidental initiation of alarm apparatus
by person).
Location
The type of premises, property or country-side in which the fire started. This is not necessarily the type of premises in which most casualties or damage occurred as a result of the fire.
Buildings
All buildings including those under con-struction, but excluding derelict buildings or those under demolition. Prior to 1994 'buildings' were referred to as 'occupied buildings'.
Dwelling Buildings occupied by households, exclud-ing residential institutions and short-stay accommodation eg hotels/motels and hos-tels. From 1988, mobile homes have been specifically included in the dwelling count.
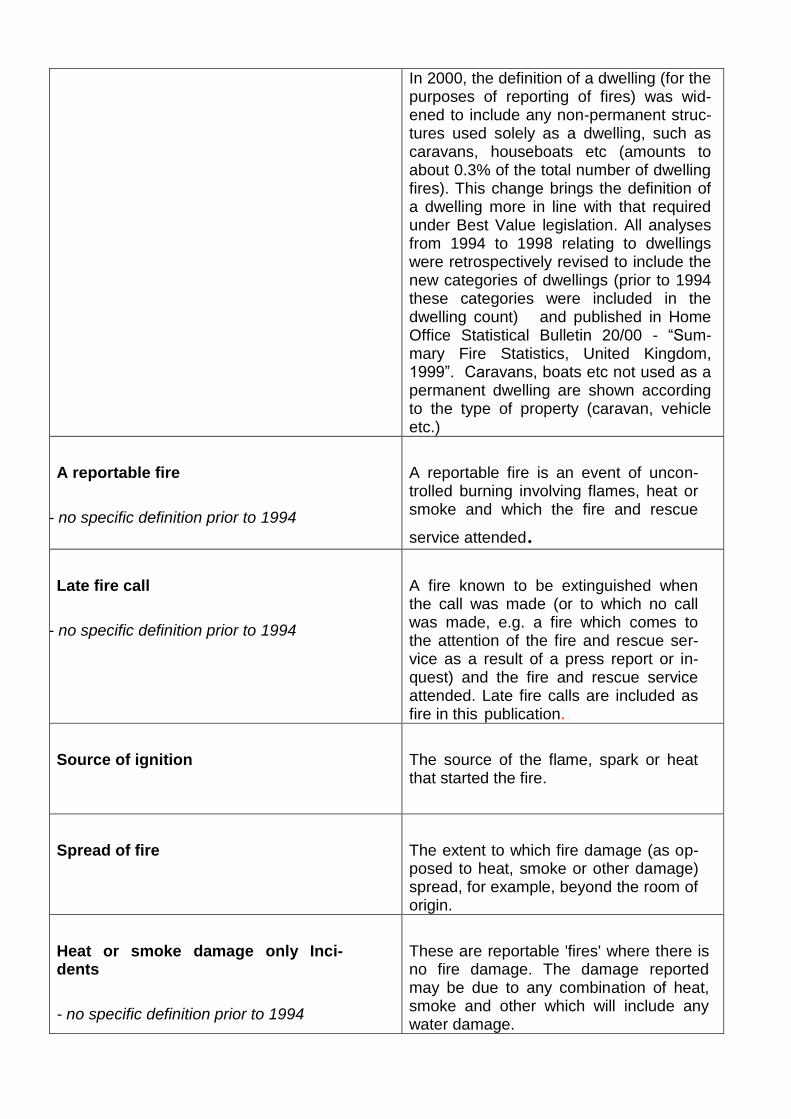
In 2000, the definition of a dwelling (for the purposes of reporting of fires) was wid-ened to include any non-permanent struc-tures used solely as a dwelling, such as caravans, houseboats etc (amounts to about 0.3% of the total number of dwelling fires). This change brings the definition of a dwelling more in line with that required under Best Value legislation. All analyses from 1994 to 1998 relating to dwellings were retrospectively revised to include the new categories of dwellings (prior to 1994 these categories were included in the dwelling count) and published in Home Office Statistical Bulletin 20/00 - “Sum-mary Fire Statistics, United Kingdom, 1999”. Caravans, boats etc not used as a permanent dwelling are shown according to the type of property (caravan, vehicle etc.)
A reportable fire
- no specific definition prior to 1994
A reportable fire is an event of uncon-trolled burning involving flames, heat or smoke and which the fire and rescue
service attended.
Late fire call
- no specific definition prior to 1994
A fire known to be extinguished when the call was made (or to which no call was made, e.g. a fire which comes to the attention of the fire and rescue ser-vice as a result of a press report or in-quest) and the fire and rescue service attended. Late fire calls are included as fire in this publication.
Source of ignition
The source of the flame, spark or heat that started the fire.
Spread of fire
The extent to which fire damage (as op-posed to heat, smoke or other damage) spread, for example, beyond the room of origin.
Heat or smoke damage only Inci-dents
- no specific definition prior to 1994
These are reportable 'fires' where there is no fire damage. The damage reported may be due to any combination of heat, smoke and other which will include any water damage.
50 Fire and Rescue Statistical Release
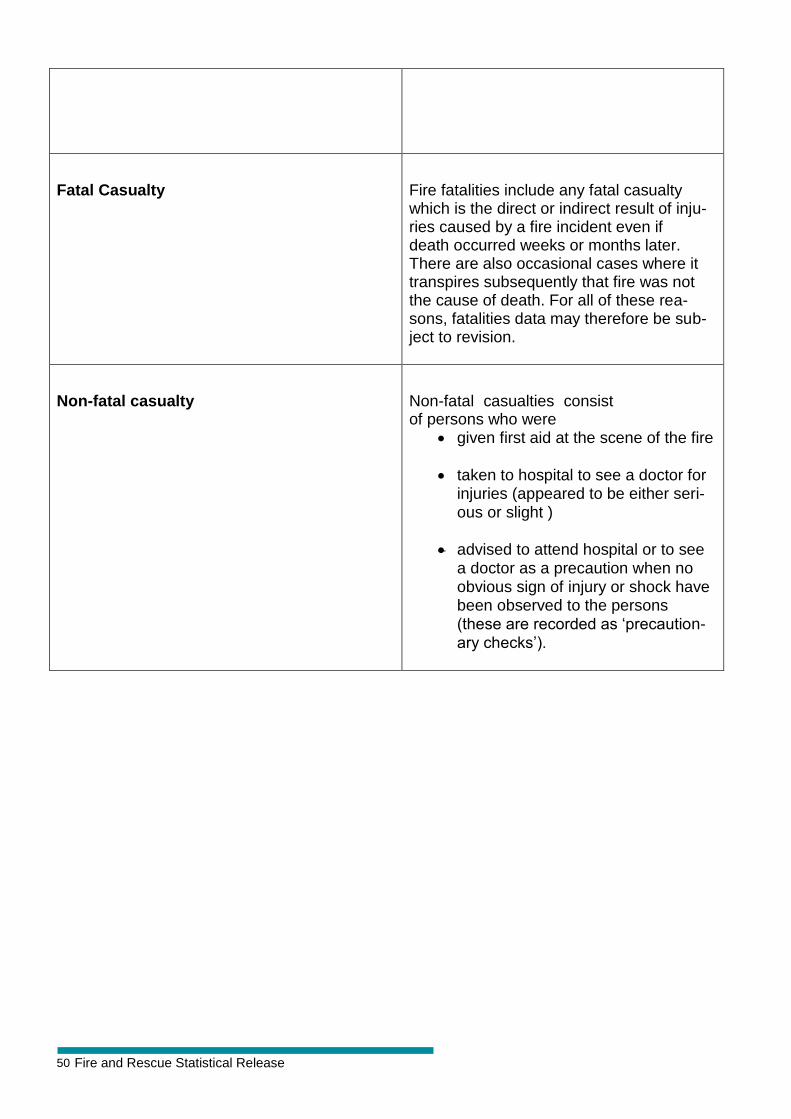
Fatal Casualty
Fire fatalities include any fatal casualty which is the direct or indirect result of inju-ries caused by a fire incident even if death occurred weeks or months later. There are also occasional cases where it transpires subsequently that fire was not the cause of death. For all of these rea-sons, fatalities data may therefore be sub-ject to revision.
Non-fatal casualty
Non-fatal casualties consist of persons who were
given first aid at the scene of the fire
taken to hospital to see a doctor for injuries (appeared to be either seri-ous or slight )
advised to attend hospital or to see a doctor as a precaution when no obvious sign of injury or shock have been observed to the persons (these are recorded as ‘precaution-ary checks’).
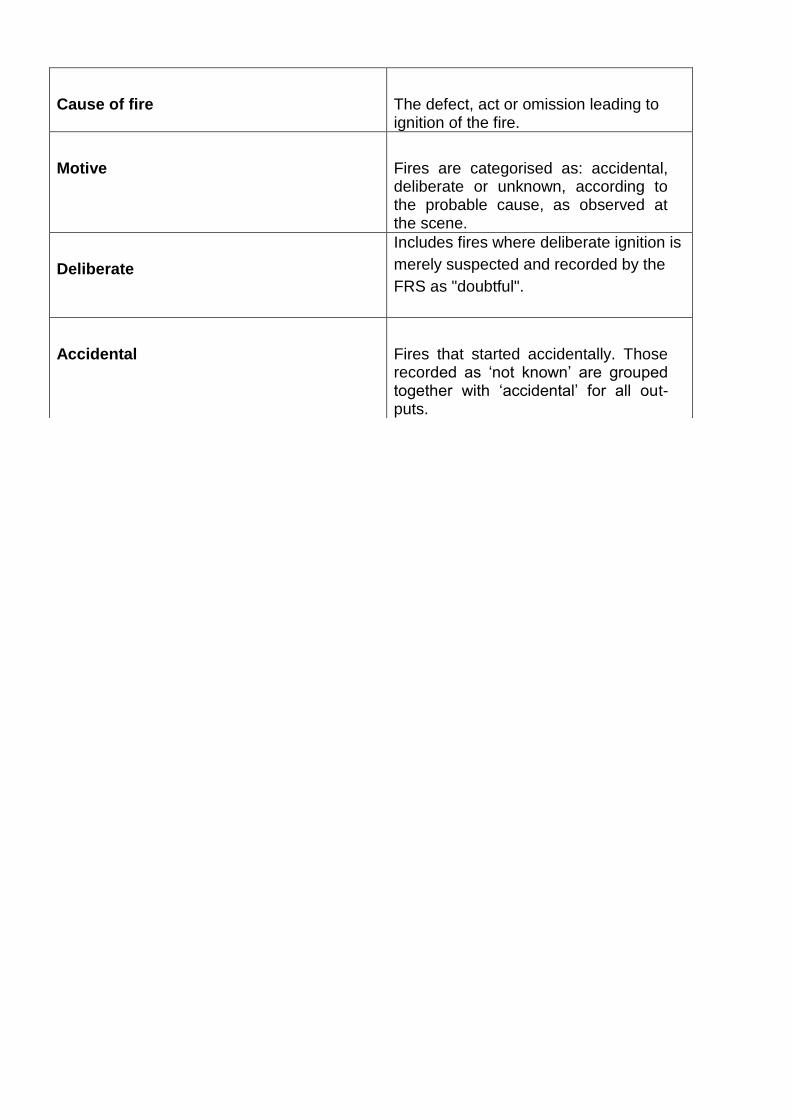
Cause of fire The defect, act or omission leading to ignition of the fire.
Motive Fires are categorised as: accidental, deliberate or unknown, according to the probable cause, as observed at the scene.
Deliberate
Includes fires where deliberate ignition is
merely suspected and recorded by the
FRS as "doubtful".
Accidental
Fires that started accidentally. Those recorded as ‘not known’ are grouped together with ‘accidental’ for all out-puts.
52 Fire and Rescue Statistical Release
Details of the questions and categories used in the recording of incidents under the new
Incident Recording System (IRS) are available in the document IRS Questions and Lists.
This can be downloaded from: https://www.gov.uk/government/publications/incident-
recording-system-for-fire-and-rescue-authorities
Some minor changes to the detailed classifications were implemented in April 2012, the first
since the implementation of the Incident Recording System. These do not affect the statistics
in this publication, but there may be a slight impact on some of the tables with detailed
location categories published in future editions of Fire Statistics Great Britain. Because it is
only the lowest levels of sub-categories that have changed, the differences are likely to be
negligible, and will only be possible to be identified once data for 2012-13 is produced and
presented alongside data for 2011-12. Table 23 (false alarms by detailed reason) will also
have some slight changes, which users can anticipate by noting the new detailed sub-
categories.
The updated categories are available at
https://www.gov.uk/government/publications/incident-recording-system-for-fire-and-
rescue-authorities . The differences in the classifications are highlighted in red and crossed
out text.
The categories in force prior to April 2012 are also available at
https://www.gov.uk/government/publications/incident-recording-system-for-fire-and-
rescue-authorities-questions-and-lists-v1-4
Technical Notes
Comparability of data under the Incident Recording System (IRS) and its predecessor, the Fire Data Report system
1 The Incident Recording System was adopted nationally by 1 April 2009. Sixteen Fire
and Rescue Services switched to the Incident Recording System before this date: Five
switched by 1 April 2008. A further three switched in Autumn 2008, and eight switched
in the first quarter of 2009. Quality assurance of the data on which this publication is
based identified the following two fundamental areas of potential discontinuity arising
from the switchover from the old Fire Data Report system, which was largely paper-
based, to the new Incident Recording System questions.
2 The first area relates to increases (typically slight) in the numbers of certain types of
incident within the data of a handful of Fire and Rescue Services, notably in numbers
of primary outdoor fires. These are apparently not real increases, but for example they
may rather be the result of a small proportion of incidents in the past having been
incorrectly reported as being ‘secondary fires’ rather than ‘primary fires’. The following
conclusions can be drawn:
it appears that these differences follow from incorrect reporting under the old Fire
Data Report system
the effect on national totals appears to be slight
there is no suggestion of difference in completeness of recording of casualties.
3 The second area is the possibility of discontinuity in numbers of non-fatal casualties.
Though the totals themselves do not suggest change in recording overall, the new
categories have clearly affected sub-totals, notably the category ‘precautionary check
recommended’. This all follows from two improvements to the way in which non-fatal
casualties have been recorded since the introduction of the Incident Recording
System:
a. The first change is that each casualty or fatality can be marked as ‘not fire-
related’. Around eight per cent of non-fatal casualties were marked as not fire-
related in April 2010 to March 2011. However, in fire incidents, almost all non-fatal
casualties can be expected to be ‘fire-related’, since very few would have occurred
if there had not been a fire. Due to this concern, those non-fatal casualties marked
‘not fire-related’ have not been excluded. It is also worth noting that excluding the
8 per cent of non-fatal casualties would have introduced a large discontinuity
compared to data from before the introduction of the new Incident Recording
System.
b. The other potential issue arises since the Incident Recording System collects
details of the injury of each non-fatal casualty in two questions, the first
54 Fire and Rescue Statistical Release
categorising the casualty as one of: ‘severe injury (hospital)’, or ‘slight injury’, or
‘first aid’ or ‘precautionary check advised’, while the second question records the
type of injury.
This contrasts with the Fire Data Report system where a single question was used
instead, with no category for ‘first aid’. It appears that casualty cases recorded
under Incident Recording System as ‘first aid’ would have most commonly been
recorded under the old Fire Data Report system as ‘precautionary check’ (see
figure 1.7), and a smaller proportion recorded as a specific type of injury. As noted,
overall the total of all non-fatal casualty categories (including non-fatal casualties
whose severity was either ‘first aid’ or ‘precautionary check recommended’ under
Incident Recording System) appears to be consistent with totals under the Fire
Data Report system.
Recording during industrial action in 2002 & 2003
4 Due to the industrial action by firefighters in November 2002 and January and Febru-ary 2003 the reporting of fires for these days was disrupted. In total fifteen 24-hour pe-riods were affected;
from 18:00 on 13th to 18:00 on 15th November 2002 (2 days);
from 09:00 on 22nd to 09:00 on 30th November 2002 (8 days);
from 09:00 on 21st to 09:00 on 22nd January 2003 (1 day);
from 09:00 on 28th to 09:00 on 30th January 2003 (2 days);
from 09:00 on 1st to 09:00 on 3rd February 2003 (2 days);
In previous editions of this publication, these gaps were covered by estimates for
some tables. Due to resource constraints, it was not possible to include such
estimates in this publication.
Definitions: primary fires, secondary, chimney fires, outdoor fires and false alarms
5 “Primary” fires include all fires in buildings, vehicles and outdoor structures or any fire involving casualties, rescues, or fires attended by five or more appliances.
6 “Secondary” fires are the majority of outdoor fires including grassland and refuse fires
unless they involve casualties or rescues, property loss or five or more appliances at-tend. They include fires in single derelict buildings.
7 Chimney fires are any fire in an occupied building where the fire was confined within
the chimney structure (and did not involve casualties or rescues or attendance by five or more appliances). A false alarm is defined as an event in which the fire and rescue service believes they are called to a reportable fire and then find there is no such inci-dent.
8 The term “outdoor fires” used in this Bulletin refers to primary and secondary fires in
road vehicles, other outdoor property, derelict buildings and derelict vehicles and more minor refuse, grassland and intentional straw/stubble fires.
Data for primary fires
9 Two categories of fire-related incident have been recorded in the fire statistics from the since 1994. These categories are described as late fire calls and heat and smoke damage only incidents:
• “late fire calls” which are fires not attended as an emergency because they are known to be extinguished when the call was made, or to which no emergency call was made;
• heat or smoke damage only ‘fires’ - where no fire damage is reported (see defi-nitions section for fuller explanation).
English Housing survey/Survey of English Housing
10 The English Housing Survey is a continuous national survey that collects information
on household, housing circumstances and the condition and energy efficiency of
housing in England. In April 2008 the English Housing Survey was created by merging
the English Housing Condition survey with the Survey of English housing. In 2004/05
the Survey of English Housing also asked a set of questions about fire-related issues
in the home including installation of smoke alarm. A similar module of fire questions
was asked in previous years in the British Crime Survey. This information collected on
experience of fire provides a valuable source of additional information in measuring
the prevalence of domestic fires in England. This is because many of the fires
measured by the survey result in little or no damage and consequently are often not
brought to the attention of fire and rescue service, thus being outside the scope of
those incidents attended and recorded by Fire and Rescue Services. Even fires
involving property damage or injury are not always brought to their attention. The
56 Fire and Rescue Statistical Release
survey data also collects a wide variety of social and demographic information from
households, including details about their ethnicity, housing tenure and economic
status. The publication ‘Fires in the Home’ is the result of analysis of these
characteristics to identify the groups most likely to experience a fire or least likely to
own a smoke alarm.
Population data
11 Population data used in this Bulletin have been provided by the Office for National Sta-tistics (ONS) in the form of mid-year estimates. Further information on the exact changes made to the population estimates can be obtained via the ONS website www.statistics.gov.uk.
Selection of samples of primary fires
12 For incidents between 2004 and March 2009, only a dozen key fields were entered from every Fire Data Report paper form. The details of incidents were entered for all fires with casualties, but for only a proportion of other primary fire incidents attended. Previous editions of this publication provided detail of the sampling and weighting methodology used.
Revisions
13 Revisions will be handled as per the Department for Communities and Local Govern-ment revisions policy http://www.communities.gov.uk/documents/corporate/pdf/1466387.pdf. This requires explanation of the handling of scheduled revisions due to the receipt of subsequent in-formation in the case of each statistical publication. For this publication, any such revi-sions will be included in the future as follows:
14 Barring exceptional circumstances, revisions will be made only once and will affect on-ly the preceding year’s data - i.e. when new provisional 2012-13 data are published for the first time in the 2012-13 edition, then data for 2011-12 will be revised.
15 In practice, numbers of fatalities can experience revisions that are small but not insig-nificant in percentage terms. As noted in the Definitions section, Fire fatalities include any fatal casualty which is the direct or indirect result of injuries caused by a fire inci-dent even if death occurred weeks or months later. Therefore, numbers can be revised by those that die subsequently, and by changes in the information about whether the fatality was caused by the fire. Fire investigations and coroners’ findings can both lead to such a revision, for example.
16 By contrast, numbers of non-fatal casualties and incidents experience revisions that are very small in percentage terms.
Revisions in this release
This release includes routine revisions to the 2011-12 data as per the revisions policy above. The scale of revisions to 2011-12 figures compared to when 2011-12 data were published first is laid out on pages 21 and 22 of the 2012-13 Fire Statistics Monitor (www.gov.uk/government/organisations/department-for-communities-and-local-government/series/fire-statistics-monitor). This is because Fire Statistics Great Britain is derived from the same snapshot of the Fire and Rescue Incidents data base as the end of financial year edition of the Fire Statistics Monitor.
Uses and user of these data
17. The data used in this publication and its accompanying spreadsheet annex tables are used to
inform and monitor the impact of fire prevention and safety policy through:
Identifying the prevalence of fires and fire false alarms, their causes, and their severi-
ty,
including casualty details
Showing when fires and casualties occur (seasonality and time of day)
Highlighting different outcomes (fires and casualties) according to whether smoke
alarms were
present, and whether they activated
Showing reasons why smoke alarms failed to operate
The users of fire statistics include Government, Fire and Rescue Authorities, and safety
campaign organisations. A list of users who responded to the 2012 Consultation on this
publication can be found at: https://www.gov.uk/government/publications/fire-statistics-
user-survey-2012-summary-of-responses
18. We judge that the quality and reliability of the data are suitable for these uses. Fire and Rescue Incident data are collected across Great Britain under common definitions and guidance. Records undergo quality assurance within each Fire and Rescue Authori-ty where data are also analysed, as well as being submitted to the national data base. The Department of Communities and Local Government published a quality assurance best practice guide in 2010. This was informed by ideas and experience of Fire and Rescue Authorities. The data are also subjected to quality assurance by statistical staff in the Department of Communities and Local Government, Scottish Government and Welsh Assembly Government.
58 Fire and Rescue Statistical Release
Symbols
17 Symbols used in the tables are:
- Not available.
.. Not applicable.
p Provisional figures
r Revised figures
pmp Per million population
Links to previous editions of this publication This publication, as well as previous editions of Fire Statistics Great Britain and related
publications, can be downloaded free of charge from the Department for Communities
and Local Government website
https://www.gov.uk/government/organisations/department-for-communities-and-local-
government/series/fire-statistics-great-britain
Earlier editions of the predecessor Fire Statistics UK publication for the years 2000 to
2008 can be downloaded from:
http://webarchive.nationalarchives.gov.uk/20121108165934/http://www.communities.g
ov.uk/fire/researchandstatistics/firestatistics/firestatisticsuk/
Related Statistics for Scotland, Wales and Northern Ireland Fire incident statistics for other UK countries are available as follows:
Scotland: http://www.scotland.gov.uk/Topics/Statistics/Browse/Crime-Justice/PubFires
Wales: http://wales.gov.uk/statistics-and-research/fire-statistics/?lang=en
Northern Ireland: Equivalent data is not available for Northern Ireland. Annual fire incident
data is available from: http://www.nifrs.org/statistics/
Links to other Fire Statistics Publications produced by the
Department for Communities and Local Government Fire statistics publications can be accessed via this link
https://www.gov.uk/government/publications/fire-statistics
This includes the Department’s annual publication on fire response times, and non-
financial annual return data, Fire and Rescue Operational Statistics.
https://www.gov.uk/government/organisations/department-for-communities-and-local-
government/series/fire-and-rescue-authorities-operational-statistics This includes headline
data on fire prevention and protection activity as well as numbers of staff and fire stations.
Overseas fire data Internationally, there are significant variations in the scope of reporting fire incidents, both in definitional terms, and whether such data are collected nationally. The De-partment commissioned a project examining comparability of fire statistics around Eu-rope, which can be accessed from: http://webarchive.nationalarchives.gov.uk/20121108165934/http://www.communities.gov.uk/documents/corporate/pdf/2159418.pdf
That said, data for other countries can be found at https://www.genevaassociation.org/search?Search=fire, which has a link to the April 2014 edition of their World Fire Statistics Bulletin https://www.genevaassociation.org/media/874729/ga2014-wfs29.pdf
60 Fire and Rescue Statistical Release
Enquiries Enquiries about the figures in this publication should be addressed to firestatistics
@communities.gsi.gov.uk or to:
Nazneen Chowdhury
Department for Communities and Local Government
Fire Statistics Branch
3/B6 Eland House
Bressenden Place
London
SW1E 5DU
Tel: 0303 444 2144
Email: [email protected]