Embed Size (px)
Citation preview
Fire StatisticsUnited Kingdom, 2008
www.communities.gov.ukcommunity, opportunity, prosperity
Fire StatisticsUnited Kingdom, 2008
November 2010Department for Communities and Local Government

© Crown copyright 2010
You may re-use this information (not including logos) free of charge in any format or medium, under the terms of the Open Government Licence. To view this licence, visit http://www.nationalarchives.gov.uk/doc/open-government-licence/ or write to the Information Policy Team, The National Archives, Kew, London TW9 4DU, or e-mail: [email protected].
This document/publication is also available on our website at www.communities.gov.uk
If you require this publication in an alternative format please email:[email protected]
Any enquiries regarding this document/publication should be sent to us at:
Department for Communities and Local GovernmentEland HouseBressenden PlaceLondon SW1E 5DUTelephone: 030 3444 0000
November 2010
ISBN: 978-1-4098-2660-6
Fire Statistics, United Kingdom 2008 1
ContentsIntroduction 11
Key Points 12
Chapter 1 Summary 14
Total number of fires and false alarms attended bythe fire and rescue service 14
Causes of fires 16
Interpretation of trends 16
Accidental fires 17
Deliberate fires 18
Deaths from fires 19
Location 19
Cause of death 20
Fatality rates by age and gender 20
Non-fatal casualties 20
Location 22
Nature of injury 23
Firefighter non-fatal casualties 23
Country and fire and rescue service area 24
Primary fires 24
Secondary fires 25
Chimney fires 25
Fatalities 25
Non-fatal casualties and rates by country 25
Non-fatal casualty rates by fire and rescue service area 26
Country and regional data 26
Casualties and rates 26
Cause of fire 28
2 Fire Statistics, United Kingdom 2008
Chapter 2 – Dwellings 29
Introduction 29
Accidental fires 29
Cause of fire 29
Source of ignition 29
Casualties from accidental fires 30
Deaths by cause of fire 30
Deaths by source of ignition of fire 31
Non-fatal casualties by cause of fire 31
Non-fatal casualties by source of ignition of fire 32
Casualties by room of origin of fire 34
Smoke alarm analyses 36
Introduction 36
Smoke alarm presence, type and operation 38
Type of alarm 39
Discovery of fires 39
Smoke alarm failures 40
Deliberate fires 43
Fire spread 44
Time of call to the fire and rescue service 44
Fire Statistics, United Kingdom 2008 3
Chapter 3 – Other Buildings 45
Introduction 45
Accidental fires 45
Trends 45
Cause of fire 45
Source of ignition 46
Deliberate fires 46
Trends 46
Location 47
Casualties 47
Location 47
Automatic fire detector analyses 48
Introduction 48
Automatic Fire Detector presence and operation 50
Fire spread 50
Chapter 4 – Road Vehicle Fires 51
Introduction 51
Car fires by cause of fire 51
Casualties 52
Time of call to fire and rescue service 53
Chapter 5 – Outdoor Fires 54
Introduction 54
When fires occur 56
Chapter 6 – False Alarms 57
4 Fire Statistics, United Kingdom 2008
List of tables in textTable 1.1: Fires by location, 1998-2008 14
Table 1.2: Primary fires by cause and location of fire, 1998-2008 16
Table 1.3: Fatal casualties from fires by age and gender, 2003-2008 21
Table 2.1: Sources of ignition for accidental dwelling fires, with casualties, 2007 and 2008 33
Table 2.2: Casualties in accidental dwelling fires by use of room where fire started, 2007 and 2008 35
Table 2.3: Smoke alarm ownership, percentage of households, 1988-2008 37
Table 2.4: Fires and casualties from fires in dwellings by presence and operation of smoke alarms, 2004-2008 38
Table 2.5: Dwelling fires where a smoke alarm was present by type of alarm, 2004-2008 39
Table 2.6: Fires and casualties from fires in dwellings by smoke alarm presence and operation, by percentage discovered in under 5 minutes and percentage confined to item first ignited, 2004-2008 40
Table 2.7: Smoke alarm failures in dwelling fires by type of alarm, 2004-2008 41
Table 2.8: Fires in dwellings with a smoke alarm where alarm did not operate by type of alarm and reason for failure, 2004-2008 42
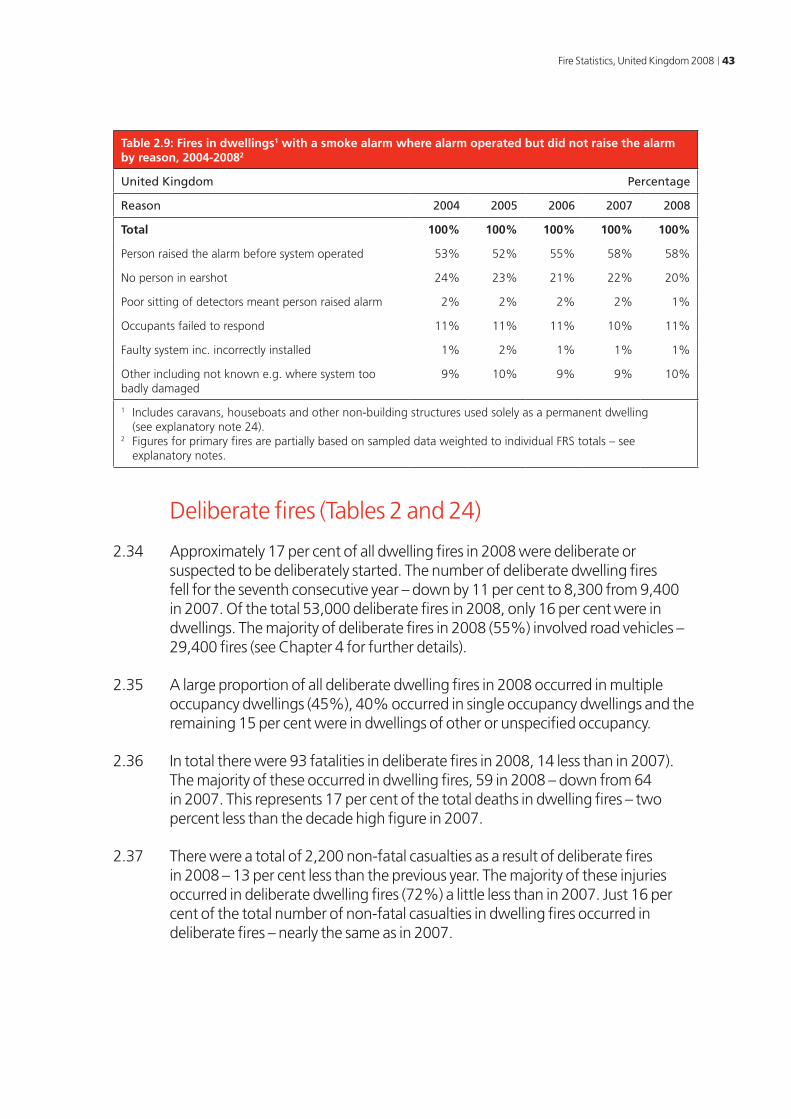
Table 2.9: Fires in dwellings with a smoke alarm where alarm operated but did not raise the alarm by reason, 2004-2008 43
Table 2.10: Accidental and deliberate dwelling fires, total dwelling fire casualties and casualties per 1,000 dwelling fires by time of day, 2008 44
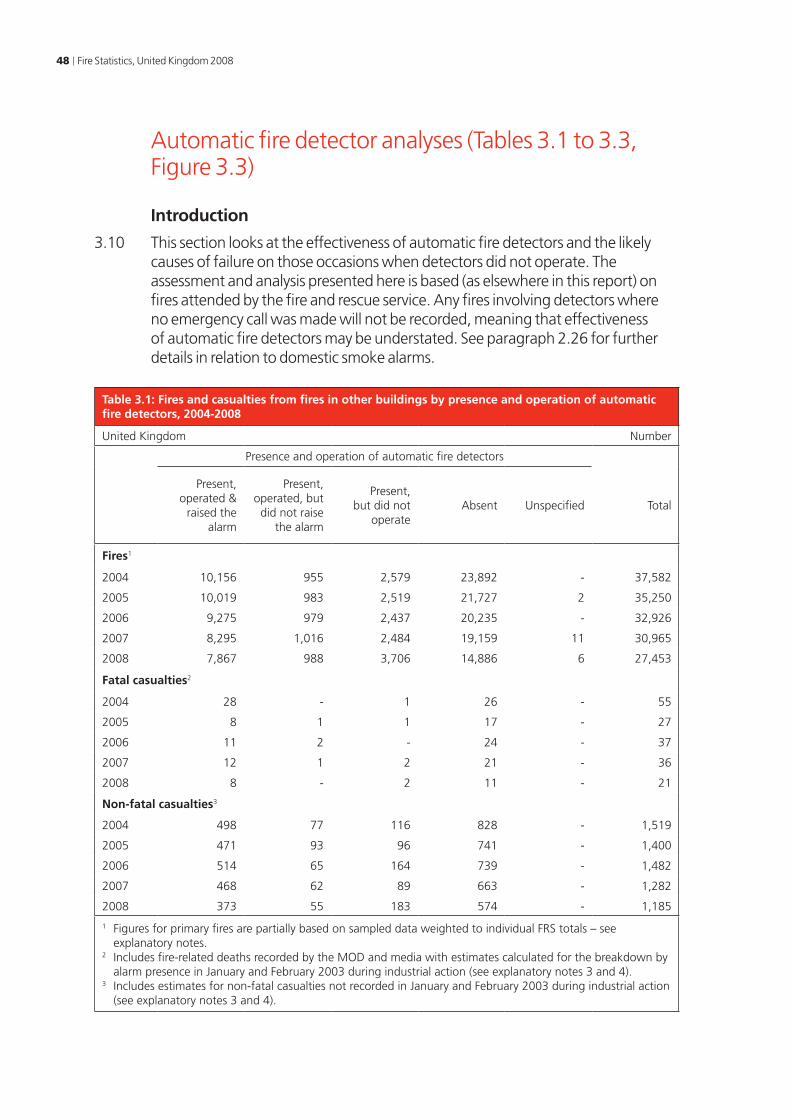
Table 3.1: Fires and casualties from fires in other buildings by presence and operation of automatic fire detectors, 2004-2008 48
Table 3.2: Fires in other buildings with a automatic fire detector where detector did not operate by reason, 2004-2008 49
5
Table 3.3: Fires in other buildings with automatic fire detector where detector operated but did not raise the alarm by reason, 2004-2008 49
Table 4.1: Accidental and deliberate road vehicle fires, total road vehicle fire casualties and casualties per 1,000 road vehicle fires by time of day, 2008 53
Table 5.1: Primary and secondary outdoor fires by location, 1998-2008 55
Table 5.2: Daily rates of fires by month and location, 2008 56
Table 6.1: False alarms, 1998-2008 58
Table 6.2: False fire alarms attended by the UK fire and rescue service, 2007 and 2008 59
6 Fire Statistics, United Kingdom 2008
List of figuresFigure 1.1: Fires by location group, 1998-2008 15
Figure 1.2: Accidental ires by location group, 1998-2008 17
Figure 1.3: Deliberate fires by location group, 1998-2008 18
Figure 1.4: Deaths from fires by location group, 1998-2008 19
Figure 1.5: Deaths by cause, 2008 20
Figure 1.6: Non-fatal casualties by location group, 1998-2008 22
Figure 1.7: Non-fatal casualties from fires (excluding firefighter casualties) by nature of injury, 1998-2008 23
Figure 1.8: Primary fires by country and location, 2008 24
Figure 1.9: Fatality rates, by region, 2006-2008 average 27
Figure 1.10: Non-fatal casualty rates by region, 2006-2008 average 28
Figure 2.1: Deaths from accidental dwelling fires by cause,1998-2008 30
Figure 2.2: Non-fatal casualties from accidental dwelling fires by cause, 1998-2008 32
Figure 2.3: Fires in dwellings by smoke alarm presence and operation, 2008 36
Figure 3.1: Building fires: deliberate fires as a percentage of all fires in each location category, 2008 46
Figure 3.2: Building fires: Non-fatal casualty rates per 1,000 fires in each location category, 2008 47
Figure 3.3: Fires in other buildings by automatic fire detector presence and operation, 2008 50
Figure 4.1: Fires in cars by cause, 1998-2008 52
Figure 6.1: Fire false alarms, 1998-2008 57
Fire Statistics, United Kingdom 2008 7
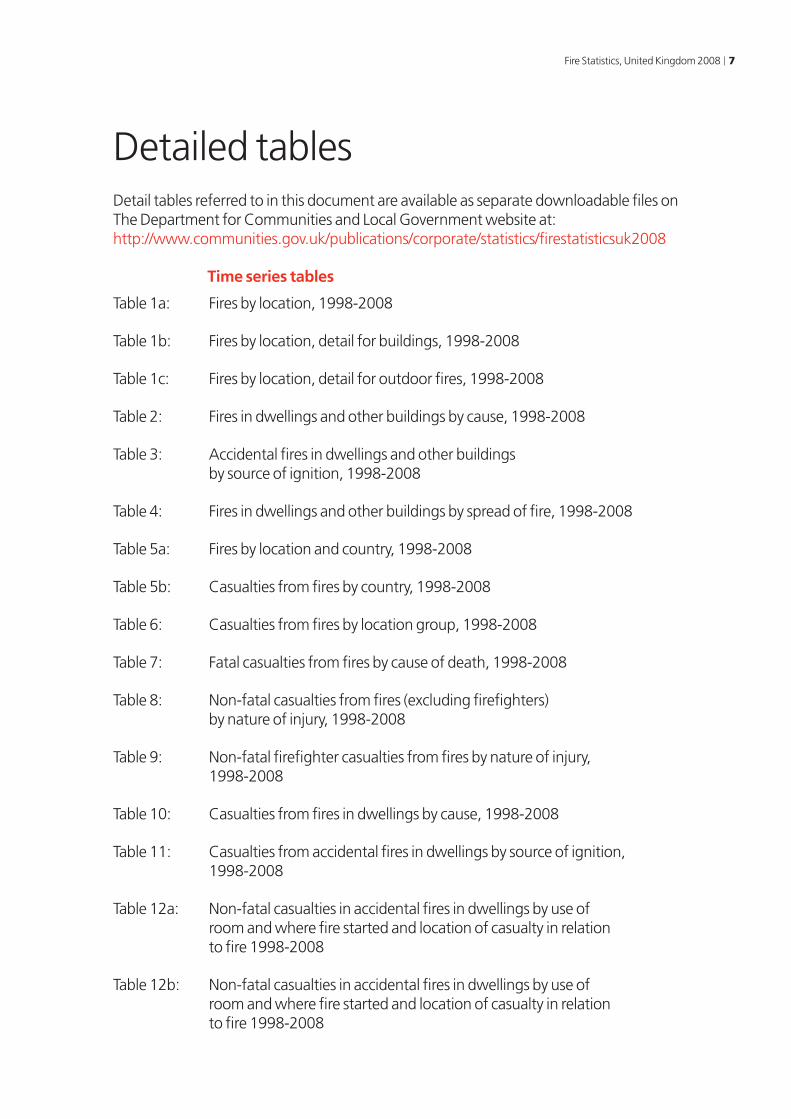
Detailed tablesDetail tables referred to in this document are available as separate downloadable files on The Department for Communities and Local Government website at: http://www.communities.gov.uk/publications/corporate/statistics/firestatisticsuk2008
Time series tables
Table 1a: Fires by location, 1998-2008
Table 1b: Fires by location, detail for buildings, 1998-2008
Table 1c: Fires by location, detail for outdoor fires, 1998-2008
Table 2: Fires in dwellings and other buildings by cause, 1998-2008
Table 3: Accidental fires in dwellings and other buildings by source of ignition, 1998-2008
Table 4: Fires in dwellings and other buildings by spread of fire, 1998-2008
Table 5a: Fires by location and country, 1998-2008
Table 5b: Casualties from fires by country, 1998-2008
Table 6: Casualties from fires by location group, 1998-2008
Table 7: Fatal casualties from fires by cause of death, 1998-2008
Table 8: Non-fatal casualties from fires (excluding firefighters) by nature of injury, 1998-2008
Table 9: Non-fatal firefighter casualties from fires by nature of injury, 1998-2008
Table 10: Casualties from fires in dwellings by cause, 1998-2008
Table 11: Casualties from accidental fires in dwellings by source of ignition, 1998-2008
Table 12a: Non-fatal casualties in accidental fires in dwellings by use of room and where fire started and location of casualty in relation to fire 1998-2008
Table 12b: Non-fatal casualties in accidental fires in dwellings by use of room and where fire started and location of casualty in relation to fire 1998-2008
8 Fire Statistics, United Kingdom 2008
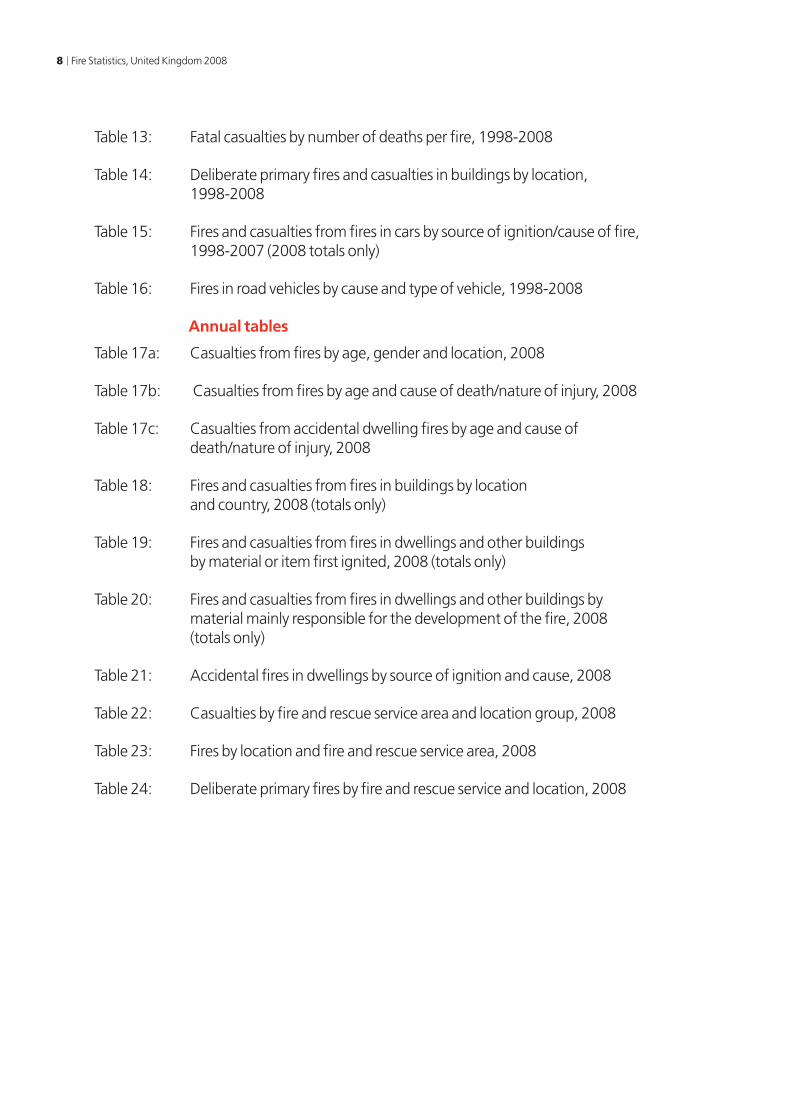
Table 13: Fatal casualties by number of deaths per fire, 1998-2008
Table 14: Deliberate primary fires and casualties in buildings by location, 1998-2008
Table 15: Fires and casualties from fires in cars by source of ignition/cause of fire, 1998-2007 (2008 totals only)
Table 16: Fires in road vehicles by cause and type of vehicle, 1998-2008
Annual tables
Table 17a: Casualties from fires by age, gender and location, 2008
Table 17b: Casualties from fires by age and cause of death/nature of injury, 2008
Table 17c: Casualties from accidental dwelling fires by age and cause of death/nature of injury, 2008
Table 18: Fires and casualties from fires in buildings by location and country, 2008 (totals only)
Table 19: Fires and casualties from fires in dwellings and other buildings by material or item first ignited, 2008 (totals only)
Table 20: Fires and casualties from fires in dwellings and other buildings by material mainly responsible for the development of the fire, 2008 (totals only)
Table 21: Accidental fires in dwellings by source of ignition and cause, 2008
Table 22: Casualties by fire and rescue service area and location group, 2008
Table 23: Fires by location and fire and rescue service area, 2008
Table 24: Deliberate primary fires by fire and rescue service and location, 2008
Fire Statistics, United Kingdom 2008 9
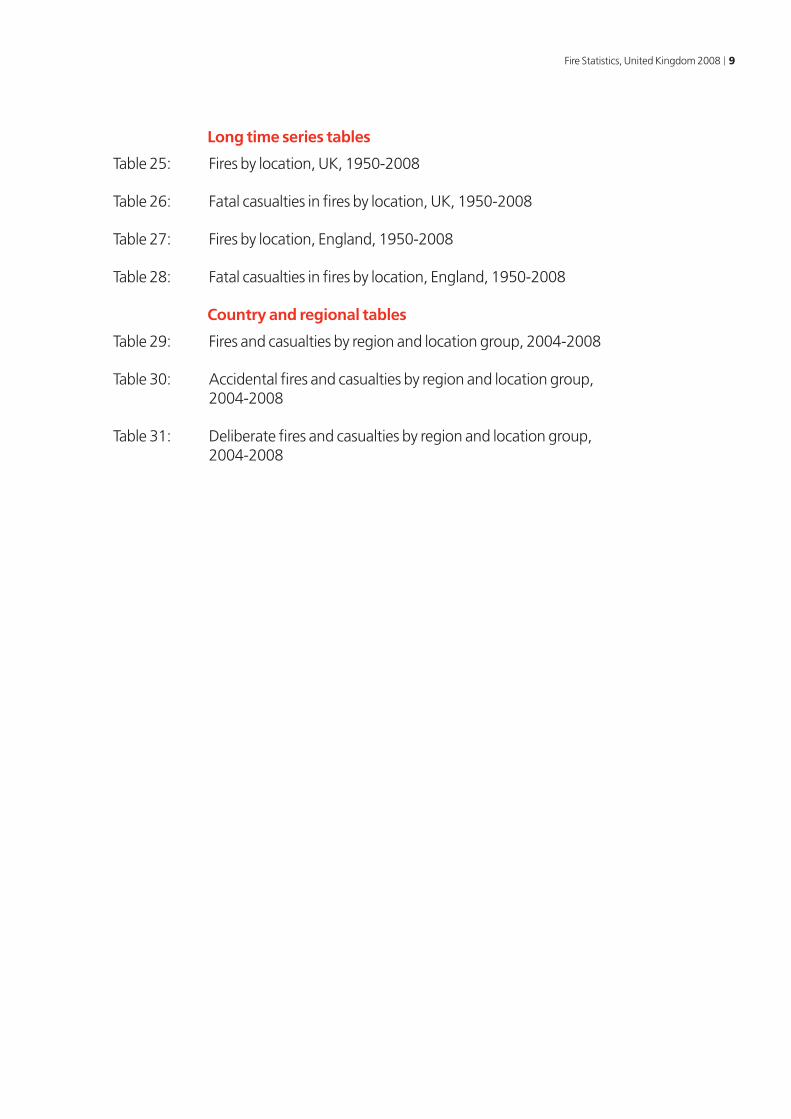
Long time series tables
Table 25: Fires by location, UK, 1950-2008
Table 26: Fatal casualties in fires by location, UK, 1950-2008
Table 27: Fires by location, England, 1950-2008
Table 28: Fatal casualties in fires by location, England, 1950-2008
Country and regional tables
Table 29: Fires and casualties by region and location group, 2004-2008
Table 30: Accidental fires and casualties by region and location group, 2004-2008
Table 31: Deliberate fires and casualties by region and location group, 2004-2008
10 Fire Statistics, United Kingdom 2008
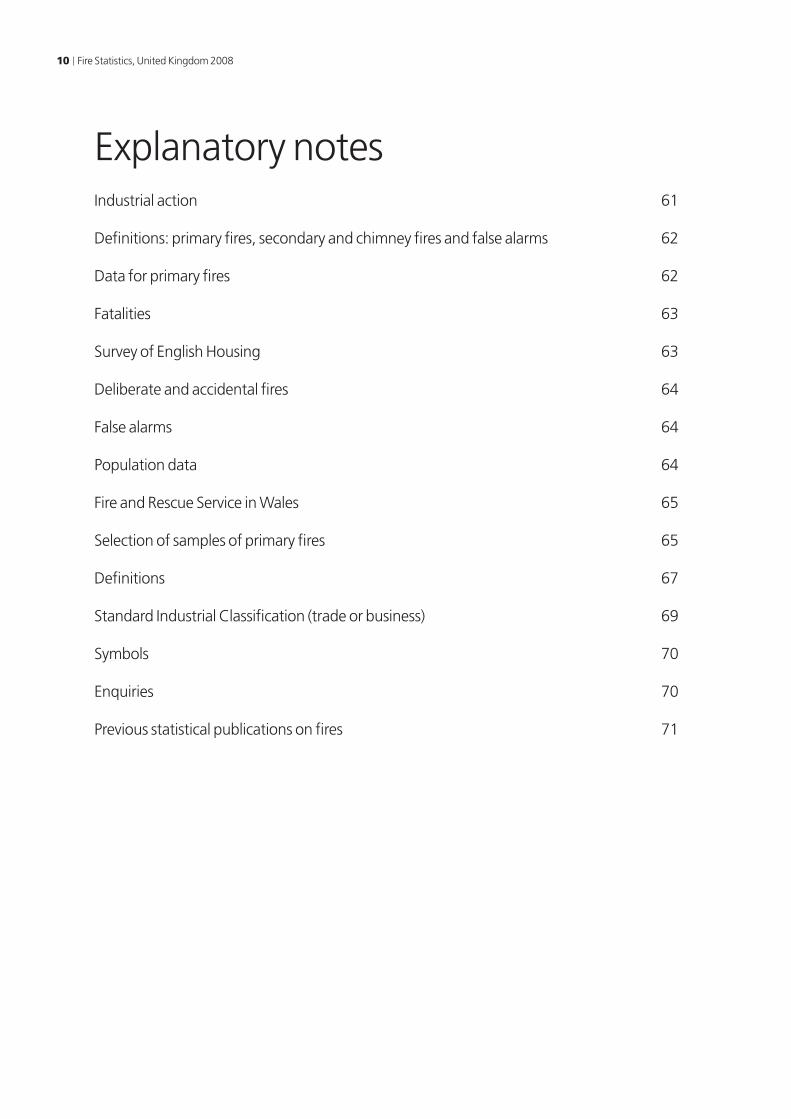
Explanatory notesIndustrial action 61
Definitions: primary fires, secondary and chimney fires and false alarms 62
Data for primary fires 62
Fatalities 63
Survey of English Housing 63
Deliberate and accidental fires 64
False alarms 64
Population data 64
Fire and Rescue Service in Wales 65
Selection of samples of primary fires 65
Definitions 67
Standard Industrial Classification (trade or business) 69
Symbols 70
Enquiries 70
Previous statistical publications on fires 71
Fire Statistics, United Kingdom 2008 11
IntroductionThe statistics in this publication are compiled from records submitted to the Department for Communities and Local Government on fires and false alarms attended by the Fire and Rescue Service (FRS) across the UK.
This publication contains detailed analysis of fires and their causes for 2008. The next edition of this publication will be for the period April 2009 to March 2010 and will be published by summer 2011. Headline data for 2009-10 was published in August 2010 in the Fire Statistics Monitor series.
This publication follows the format of previous years as the majority of FRSs switched over to the new Incident Recording System in early 2009. Eight FRSs had adopted the new system by the end of 2008. As a result this publication necessarily draws data from both the new system and its predecessor. Tables have been updated as far as possible. However some of the categories of information collected are different in the new system in a way that means it is not possible to map to the old categories. It was possible to create a mapping that enabled detailed Tables 2, 3, 10 and 11 to be produced in full. Meanwhile it was possible to map only parts of detailed Table 21, and it was not possible to map the categories in detailed Tables 15, 18, 19 and 20 at all.
Explanation of the comparability of data under the new Incident Recording System and its predecessor, the Fire Data Report system, can be found in the Fire Statistics Monitor publication published in August 2010 and which is available at: www.communities.gov.uk/publications/corporate/statistics/monitorq1q420091
Due to delays in receiving data, fatal casualty records since April 2008 have yet to be cross-checked against death certificate data, which takes account of coroner’s court findings for England. In the past, this cross-checking has consistently resulted in a small net reduction in the total number of fatalities caused by fire.
12 Fire Statistics, United Kingdom 2008
Key points 2008NOTE: Headline data up to March 2010 is available at www.communities.gov.uk/publications/corporate/statistics/monitorq1q420091
Overview
• In 2008 Fire and Rescue Services attended 727,200 fires or false alarms in the United Kingdom, 10 per cent fewer than in 2007 (para 1.1).
• A total of 328,000 fires were attended, 15 per cent less than in 2007. Around 73 per cent of all the fires were outdoor fires (240,000), e.g. vehicles, refuse, grassland. A total of 49,600 (15%) were in dwellings (para 1.1, 1.2 & 5.1).
• The total number of accidental primary fires fell by 6 per cent to 77,400 in 2008 – the lowest recorded in this last 14 year period (para 1.8). Deliberate fires decreased by 15 per cent to 53,000 (para 1.9).
Deaths from fires
• In 2008, there were 451 fire-related deaths in the UK, 8 more than in 2007. The highest number recorded was 1,096 deaths in 1979. Through the 1980s and 1990s there was a general downward trend. The 2008 figure is at the lowest level since the late 1950s (para 1.11).
• The majority of fire-related deaths occurred in dwelling fires (para 1.12). The highest fire fatality rates were for people aged 80+ and for males, and in Scotland (para 1.27).
Non-fatal casualties
• There was a 7 per cent fall in the number of non-fatal casualties to 12,200 in 2008 – the ninth consecutive annual fall and the lowest number in this last 20 year period (para 1.16). Non-fatal casualty rates were highest in the North West region (para 1.34).
• Firefighter casualties rose to 280 in 2008 from 268 in 2007 (para 1.20).
Dwelling fires
• The number of dwelling fires in the UK totaled 49,600 in 2008 – a fall of 6% since 2007. The majority of dwelling fires were accidental (83%), 41,000 fires (para 2.1 & 2.2).
Accidental dwelling fires
• The main cause of accidental dwelling fires remained the misuse of equipment/appliances (14,200 fires), while the main source of ignition was cooking appliances (54%) of all accidental dwelling fires) (para 2.3 & 2.5).
Fire Statistics, United Kingdom 2008 13
Deaths in dwelling fires
• Of the 353 deaths in dwellings in 2008, 294 (83%) were of accidental causes. The main cause was careless handling of fire or hot substances (e.g. careless disposal of cigarettes), amounting to 38 per cent of all deaths due to accidental causes (para 2.7 & 2.8). The highest fatality rate is for fires which started in the living or dining room (para 2.21).
Non-fatal casualties in dwelling fires
• The number of non-fatal casualties in dwelling fires decreased by 7 per cent to 10,100. The largest cause of injury in accidental dwelling fires was the misuse of equipment and appliances (2,300 injuries) (para 2.14 & 2.15).
Smoke alarms
• Research shows that smoke alarm ownership increased rapidly from 8 per cent in 1988 to 70 per cent in 1994, and has continued to rise in recent years to around 90 per cent in 2008 (para 2.26).
• Smoke alarms were absent from the fire area in 18,600 dwelling fires (38%) (para 2.27).
Other building fires
• In 2008 there were 27,500 fires recorded in buildings other than dwellings, 11 per cent fewer than in 2007. Of these, around 60 per cent were accidental compared to over 80 per cent of those in dwellings (para 3.1 & 3.3).
• Twenty-one people died and there were 1,200 injuries in fires in buildings other than dwellings. (para 3.2 & 3.8).
Road vehicle fires
• Road vehicle fires totaled 44,600 in 2008 – a decrease of 12 per cent from 2007. This is the lowest number of road vehicle fires since 1984 (para 4.1).
• In 2008 there were 44 fatalities and 426 non-fatal casualties in road vehicle fires (para 4.5 & 4.6).
False alarms
• There were 399,000 false alarms attended in 2008, a decrease of 5 per cent from 2007 and over 20 per cent lower than the peak level of 507,000 in 1995 (para 6.1).
• The most common type of false alarm was due to apparatus, representing two thirds of all false alarms in 2008 (para 6.2).
14 Fire Statistics, United Kingdom 2008
Chapter 1
Summary
Total number of fires and false alarms attended by the fire and rescue service (Tables 1.1, 1.2 and Figure 1.1)
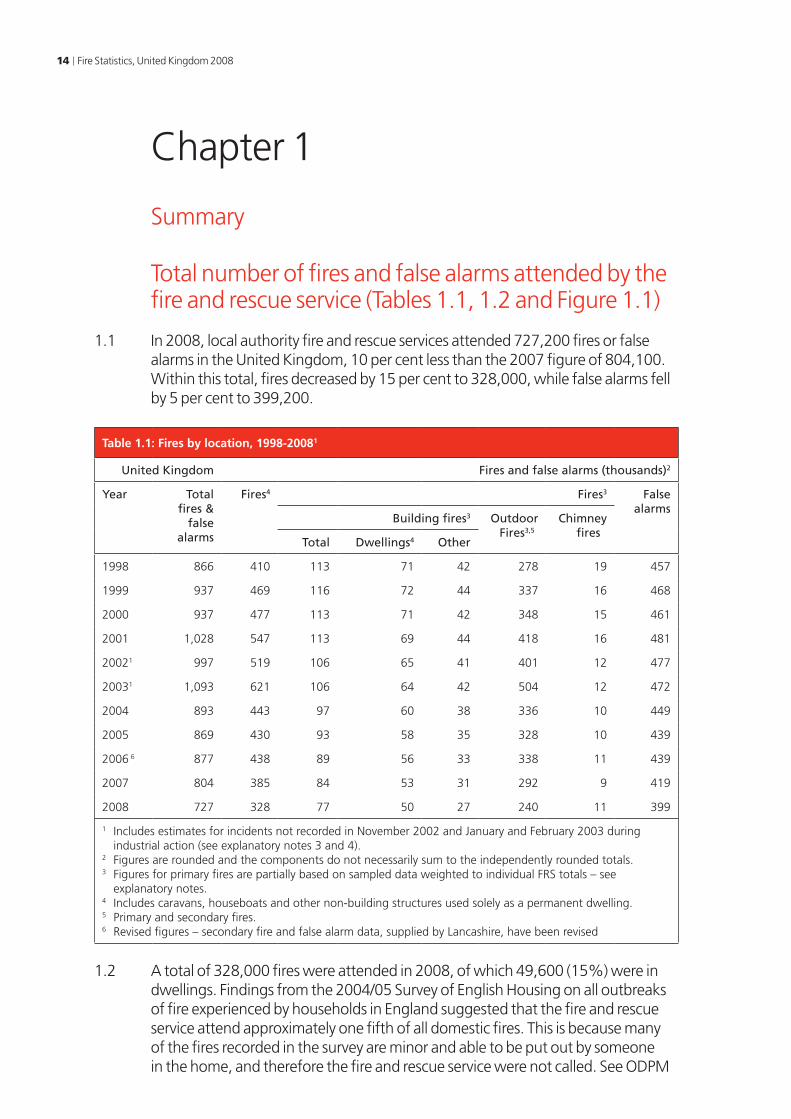
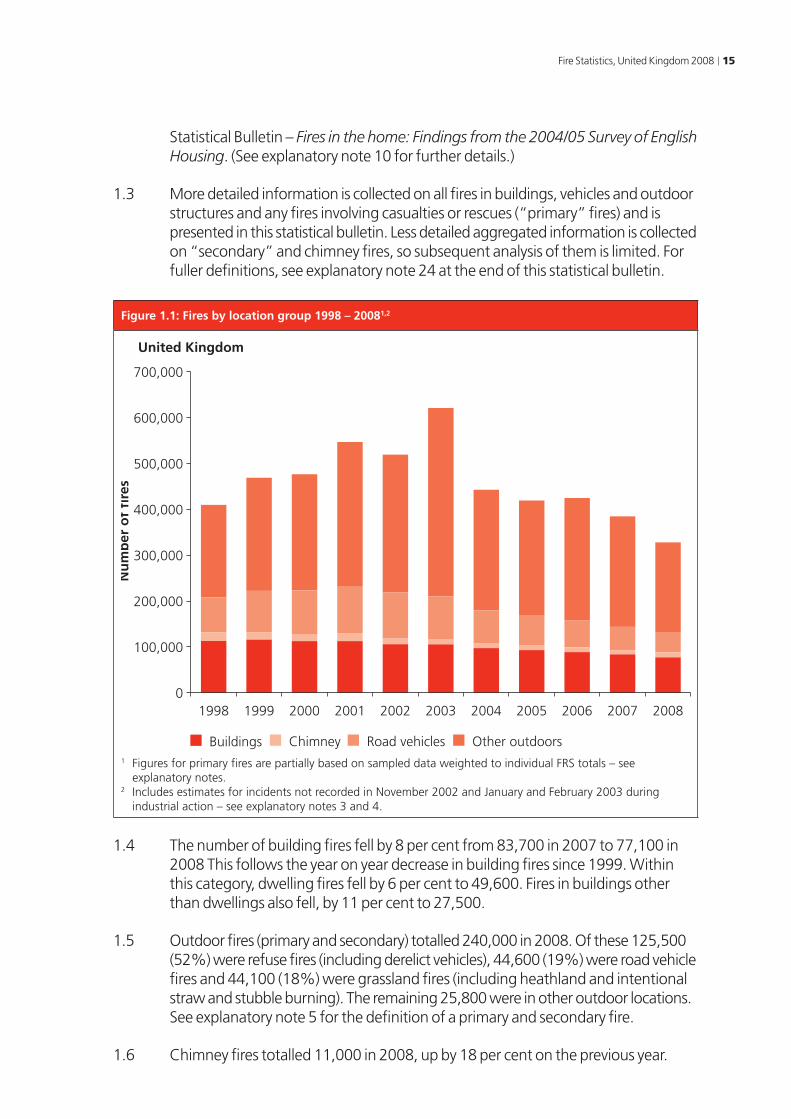
1.1 In 2008, local authority fire and rescue services attended 727,200 fires or false alarms in the United Kingdom, 10 per cent less than the 2007 figure of 804,100. Within this total, fires decreased by 15 per cent to 328,000, while false alarms fell by 5 per cent to 399,200.
Table 1.1: Fires by location, 1998-20081
United Kingdom Fires and false alarms (thousands)2
Year Total fires &
false alarms
Fires4 Fires3 Falsealarms
Building fires3 Outdoor Fires3,5 .
Chimney fires .
Total Dwellings4 Other
1998 866 410 113 71 42 278 19 457
1999 937 469 116 72 44 337 16 468
2000 937 477 113 71 42 348 15 461
2001 1,028 547 113 69 44 418 16 481
20021 997 519 106 65 41 401 12 477
20031 1,093 621 106 64 42 504 12 472
2004 893 443 97 60 38 336 10 449
2005 869 430 93 58 35 328 10 439
2006 6 877 438 89 56 33 338 11 439
2007 804 385 84 53 31 292 9 419
2008 727 328 77 50 27 240 11 399
1 Includes estimates for incidents not recorded in November 2002 and January and February 2003 during industrial action (see explanatory notes 3 and 4).
2 Figures are rounded and the components do not necessarily sum to the independently rounded totals.3 Figures for primary fires are partially based on sampled data weighted to individual FRS totals – see
explanatory notes. 4 Includes caravans, houseboats and other non-building structures used solely as a permanent dwelling.5 Primary and secondary fires.6 Revised figures – secondary fire and false alarm data, supplied by Lancashire, have been revised
1.2 A total of 328,000 fires were attended in 2008, of which 49,600 (15%) were in dwellings. Findings from the 2004/05 Survey of English Housing on all outbreaks of fire experienced by households in England suggested that the fire and rescue service attend approximately one fifth of all domestic fires. This is because many of the fires recorded in the survey are minor and able to be put out by someone in the home, and therefore the fire and rescue service were not called. See ODPM
Fire Statistics, United Kingdom 2008 15
Statistical Bulletin – Fires in the home: Findings from the 2004/05 Survey of English Housing. (See explanatory note 10 for further details.)
1.3 More detailed information is collected on all fires in buildings, vehicles and outdoor structures and any fires involving casualties or rescues (“primary” fires) and is presented in this statistical bulletin. Less detailed aggregated information is collected on “secondary” and chimney fires, so subsequent analysis of them is limited. For fuller definitions, see explanatory note 24 at the end of this statistical bulletin.
Figure 1.1: Fires by location group 1998 – 20081,2
Other outdoorsRoad vehiclesChimneyBuildings
0
100,000
200,000
300,000
400,000
500,000
600,000
700,000
20082007200620052004200320022001200019991998
United Kingdom
Nu
mb
er o
f fi
res
1 Figures for primary fires are partially based on sampled data weighted to individual FRS totals – see explanatory notes.
2 Includes estimates for incidents not recorded in November 2002 and January and February 2003 during industrial action – see explanatory notes 3 and 4.
1.4 The number of building fires fell by 8 per cent from 83,700 in 2007 to 77,100 in 2008 This follows the year on year decrease in building fires since 1999. Within this category, dwelling fires fell by 6 per cent to 49,600. Fires in buildings other than dwellings also fell, by 11 per cent to 27,500.
1.5 Outdoor fires (primary and secondary) totalled 240,000 in 2008. Of these 125,500 (52%) were refuse fires (including derelict vehicles), 44,600 (19%) were road vehicle fires and 44,100 (18%) were grassland fires (including heathland and intentional straw and stubble burning). The remaining 25,800 were in other outdoor locations. See explanatory note 5 for the definition of a primary and secondary fire.
1.6 Chimney fires totalled 11,000 in 2008, up by 18 per cent on the previous year.
16 Fire Statistics, United Kingdom 2008
Causes of fires
Interpretation of trends in accidental and deliberate fires
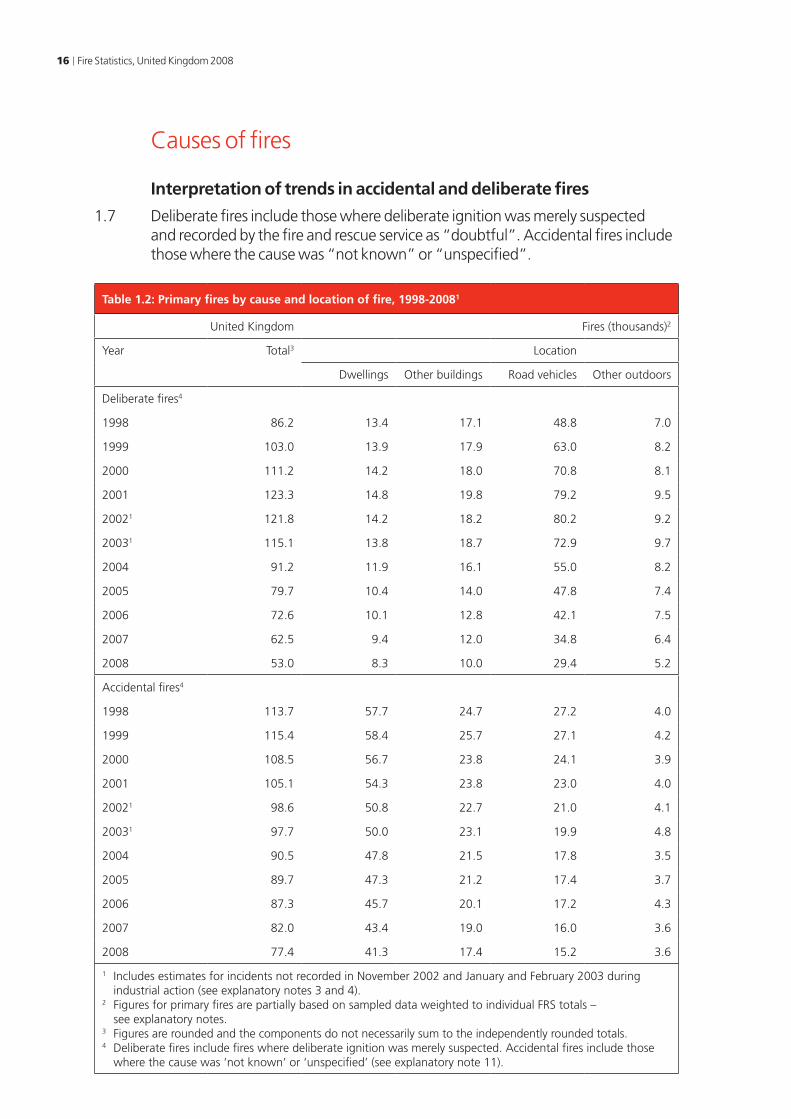
1.7 Deliberate fires include those where deliberate ignition was merely suspected and recorded by the fire and rescue service as “doubtful”. Accidental fires include those where the cause was “not known” or “unspecified”.
Table 1.2: Primary fires by cause and location of fire, 1998-20081
United Kingdom Fires (thousands)2
Year Total3 Location
Dwellings Other buildings Road vehicles Other outdoors
Deliberate fires4
1998 86.2 13.4 17.1 48.8 7.0
1999 103.0 13.9 17.9 63.0 8.2
2000 111.2 14.2 18.0 70.8 8.1
2001 123.3 14.8 19.8 79.2 9.5
20021 121.8 14.2 18.2 80.2 9.2
20031 115.1 13.8 18.7 72.9 9.7
2004 91.2 11.9 16.1 55.0 8.2
2005 79.7 10.4 14.0 47.8 7.4
2006 72.6 10.1 12.8 42.1 7.5
2007 62.5 9.4 12.0 34.8 6.4
2008 53.0 8.3 10.0 29.4 5.2
Accidental fires4
1998 113.7 57.7 24.7 27.2 4.0
1999 115.4 58.4 25.7 27.1 4.2
2000 108.5 56.7 23.8 24.1 3.9
2001 105.1 54.3 23.8 23.0 4.0
20021 98.6 50.8 22.7 21.0 4.1
20031 97.7 50.0 23.1 19.9 4.8
2004 90.5 47.8 21.5 17.8 3.5
2005 89.7 47.3 21.2 17.4 3.7
2006 87.3 45.7 20.1 17.2 4.3
2007 82.0 43.4 19.0 16.0 3.6
2008 77.4 41.3 17.4 15.2 3.6
1 Includes estimates for incidents not recorded in November 2002 and January and February 2003 during industrial action (see explanatory notes 3 and 4).
2 Figures for primary fires are partially based on sampled data weighted to individual FRS totals – see explanatory notes.
3 Figures are rounded and the components do not necessarily sum to the independently rounded totals. 4 Deliberate fires include fires where deliberate ignition was merely suspected. Accidental fires include those
where the cause was ‘not known’ or ‘unspecified’ (see explanatory note 11).
Fire Statistics, United Kingdom 2008 17
Accidental fires (Table 1.2, Figure 1.2)
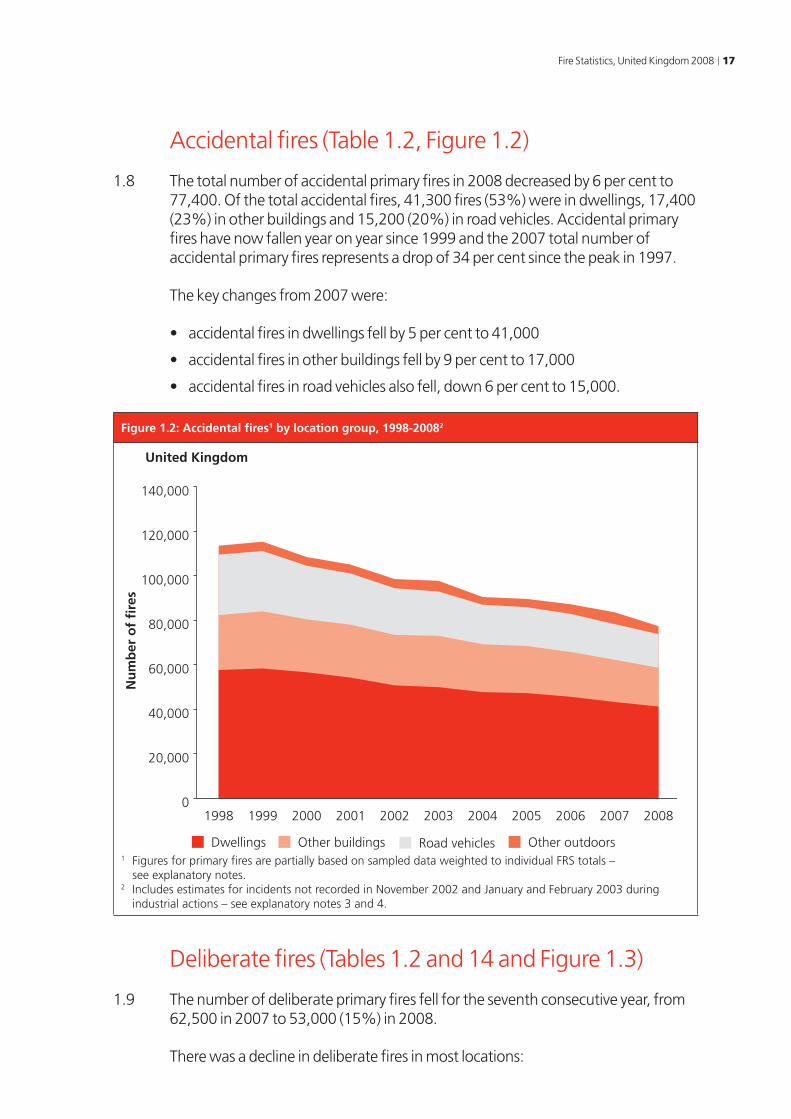
1.8 The total number of accidental primary fires in 2008 decreased by 6 per cent to 77,400. Of the total accidental fires, 41,300 fires (53%) were in dwellings, 17,400 (23%) in other buildings and 15,200 (20%) in road vehicles. Accidental primary fires have now fallen year on year since 1999 and the 2007 total number of accidental primary fires represents a drop of 34 per cent since the peak in 1997.
The key changes from 2007 were:
• accidental fires in dwellings fell by 5 per cent to 41,000
• accidental fires in other buildings fell by 9 per cent to 17,000
• accidental fires in road vehicles also fell, down 6 per cent to 15,000.
Figure 1.2: Accidental fires1 by location group, 1998-20082
United Kingdom
Nu
mb
er o
f fi
res
0
20,000
40,000
60,000
80,000
100,000
120,000
140,000
20082007200620052004200320022001200019991998
Other outdoorsRoad vehiclesOther buildingsDwellings1 Figures for primary fires are partially based on sampled data weighted to individual FRS totals –
see explanatory notes.2 Includes estimates for incidents not recorded in November 2002 and January and February 2003 during
industrial actions – see explanatory notes 3 and 4.
Deliberate fires (Tables 1.2 and 14 and Figure 1.3)
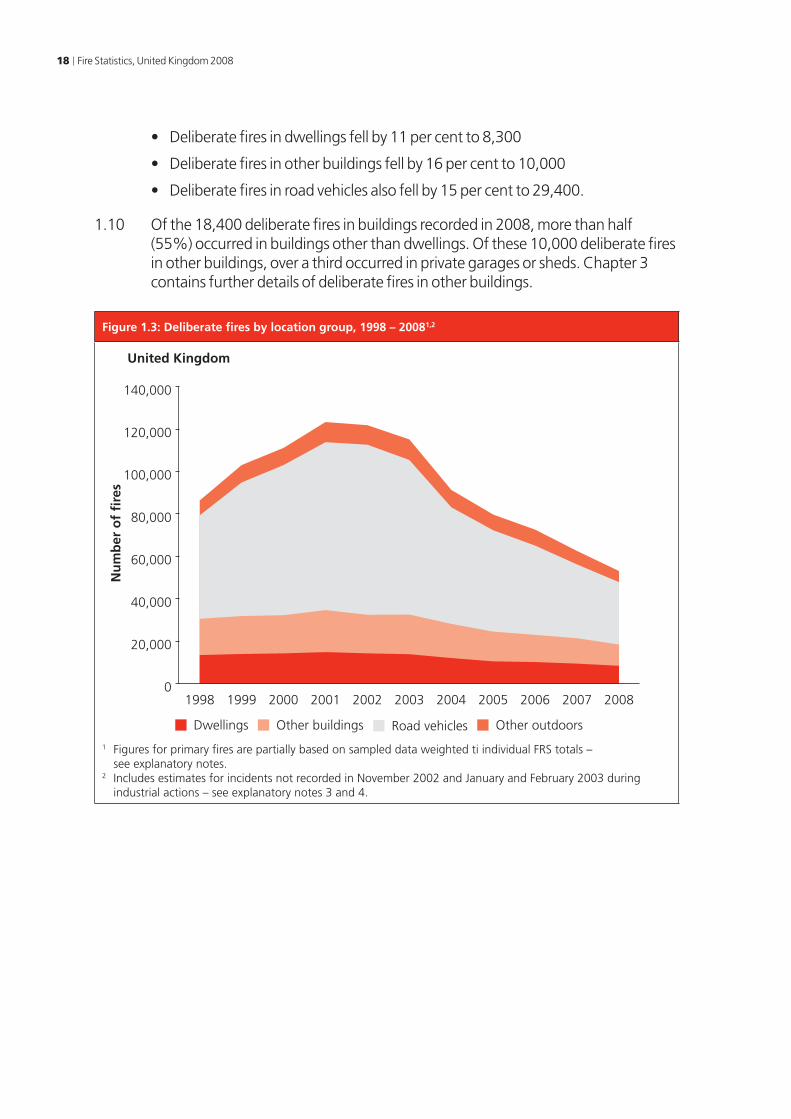
1.9 The number of deliberate primary fires fell for the seventh consecutive year, from 62,500 in 2007 to 53,000 (15%) in 2008.
There was a decline in deliberate fires in most locations:
18 Fire Statistics, United Kingdom 2008
• Deliberate fires in dwellings fell by 11 per cent to 8,300
• Deliberate fires in other buildings fell by 16 per cent to 10,000
• Deliberate fires in road vehicles also fell by 15 per cent to 29,400.
1.10 Of the 18,400 deliberate fires in buildings recorded in 2008, more than half (55%) occurred in buildings other than dwellings. Of these 10,000 deliberate fires in other buildings, over a third occurred in private garages or sheds. Chapter 3 contains further details of deliberate fires in other buildings.
Figure 1.3: Deliberate fires by location group, 1998 – 20081,2
United Kingdom
Nu
mb
er o
f fi
res
0
20,000
40,000
60,000
80,000
100,000
120,000
140,000
20082007200620052004200320022001200019991998
Other outdoorsRoad vehiclesOther buildingsDwellings
1 Figures for primary fires are partially based on sampled data weighted ti individual FRS totals – see explanatory notes.
2 Includes estimates for incidents not recorded in November 2002 and January and February 2003 during industrial actions – see explanatory notes 3 and 4.
Fire Statistics, United Kingdom 2008 19
Deaths from fires (Table 17a)
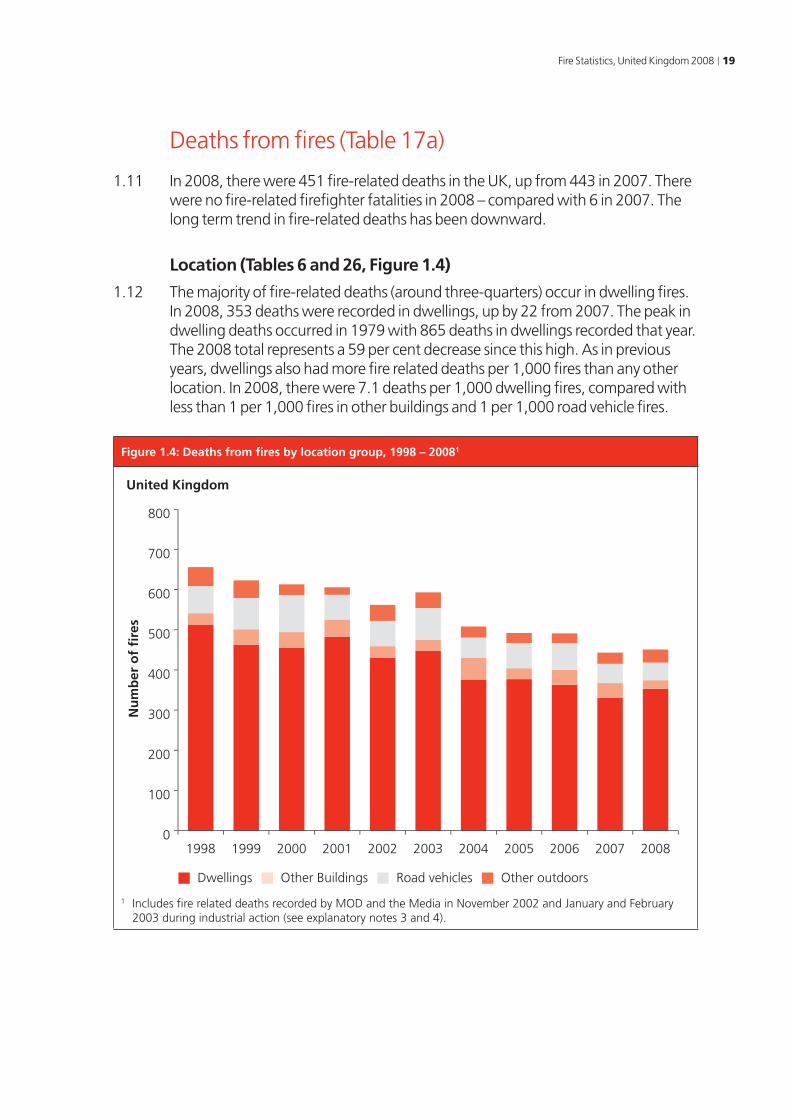
1.11 In 2008, there were 451 fire-related deaths in the UK, up from 443 in 2007. There were no fire-related firefighter fatalities in 2008 – compared with 6 in 2007. The long term trend in fire-related deaths has been downward.
Location (Tables 6 and 26, Figure 1.4)
1.12 The majority of fire-related deaths (around three-quarters) occur in dwelling fires. In 2008, 353 deaths were recorded in dwellings, up by 22 from 2007. The peak in dwelling deaths occurred in 1979 with 865 deaths in dwellings recorded that year. The 2008 total represents a 59 per cent decrease since this high. As in previous years, dwellings also had more fire related deaths per 1,000 fires than any other location. In 2008, there were 7.1 deaths per 1,000 dwelling fires, compared with less than 1 per 1,000 fires in other buildings and 1 per 1,000 road vehicle fires.
Figure 1.4: Deaths from fires by location group, 1998 – 20081
United Kingdom
Nu
mb
er o
f fi
res
0
100
200
300
400
500
600
700
800
20082007200620052004200320022001200019991998
Other outdoorsRoad vehiclesOther BuildingsDwellings
1 Includes fire related deaths recorded by MOD and the Media in November 2002 and January and February 2003 during industrial action (see explanatory notes 3 and 4).
20 Fire Statistics, United Kingdom 2008
Cause of death (Table 7, Figure 1.5)
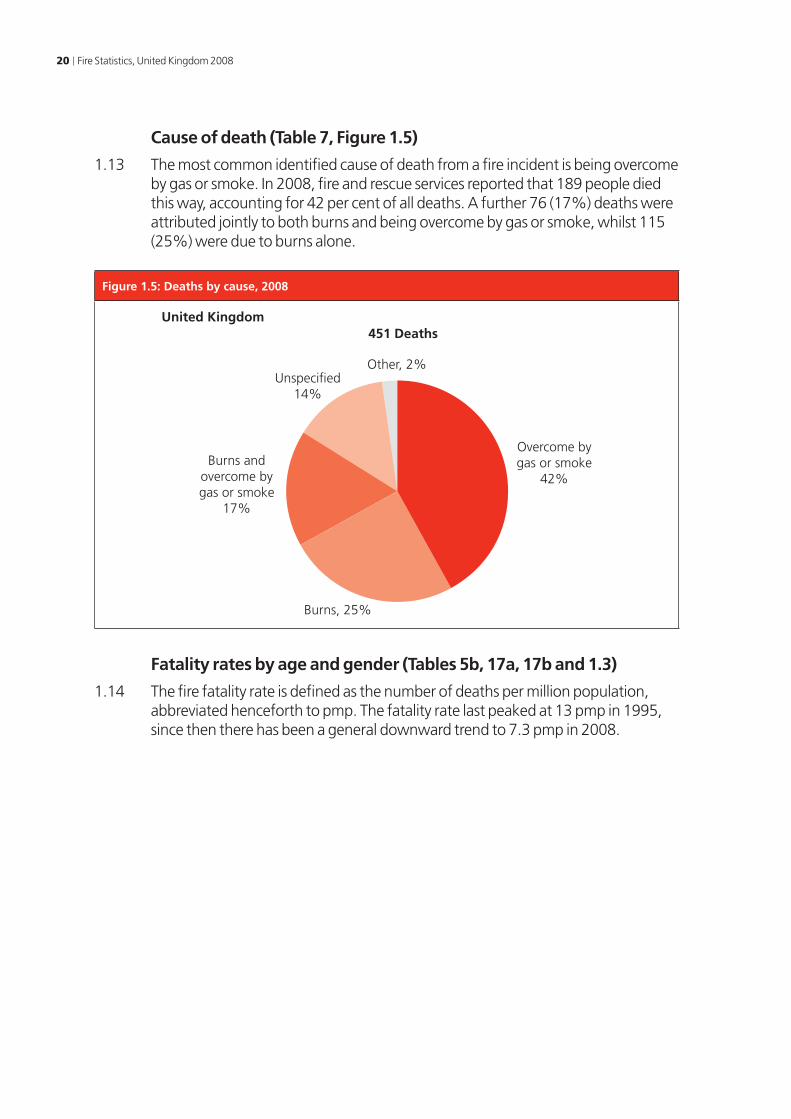
1.13 The most common identified cause of death from a fire incident is being overcome by gas or smoke. In 2008, fire and rescue services reported that 189 people died this way, accounting for 42 per cent of all deaths. A further 76 (17%) deaths were attributed jointly to both burns and being overcome by gas or smoke, whilst 115 (25%) were due to burns alone.
Figure 1.5: Deaths by cause, 2008
451 DeathsUnited Kingdom
Unspecified14%
Other, 2%
Overcome bygas or smoke
42%
Burns, 25%
Burns andovercome bygas or smoke
17%
Fatality rates by age and gender (Tables 5b, 17a, 17b and 1.3)
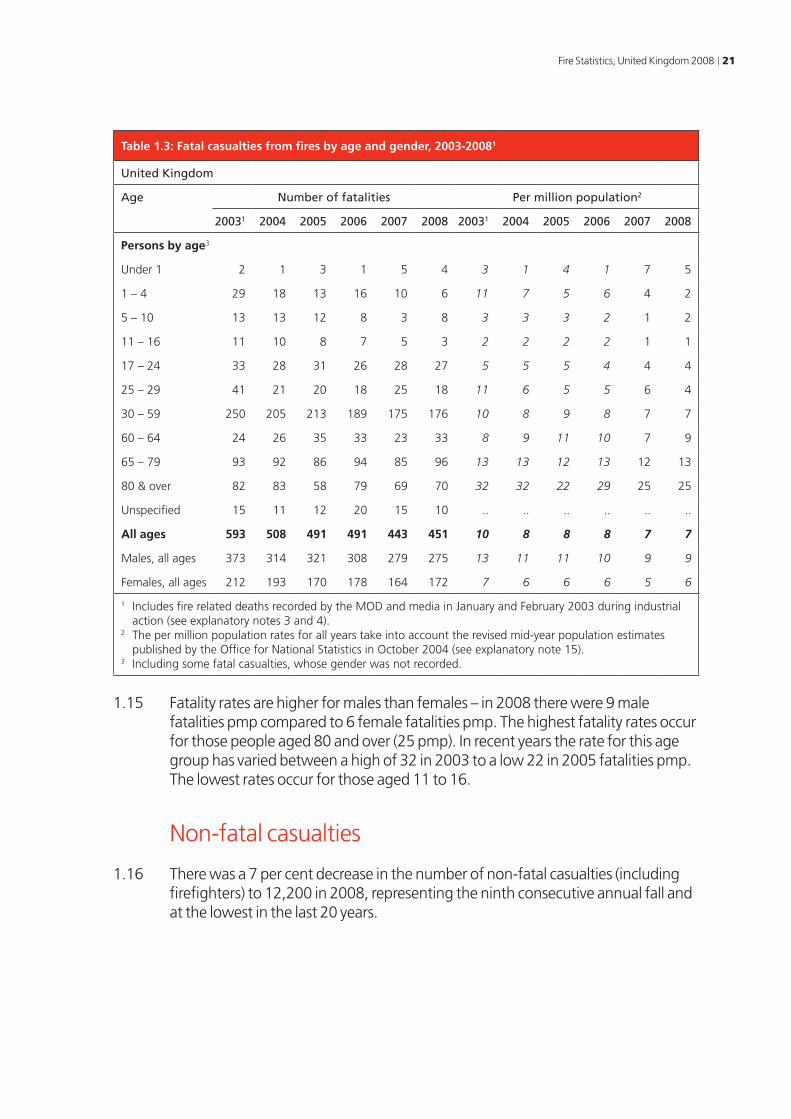
1.14 The fire fatality rate is defined as the number of deaths per million population, abbreviated henceforth to pmp. The fatality rate last peaked at 13 pmp in 1995, since then there has been a general downward trend to 7.3 pmp in 2008.
Fire Statistics, United Kingdom 2008 21
Table 1.3: Fatal casualties from fires by age and gender, 2003-20081
United Kingdom
Age Number of fatalities Per million population2
20031 2004 2005 2006 2007 2008 20031 2004 2005 2006 2007 2008
Persons by age3
Under 1 2 1 3 1 5 4 3 1 4 1 7 5
1 – 4 29 18 13 16 10 6 11 7 5 6 4 2
5 – 10 13 13 12 8 3 8 3 3 3 2 1 2
11 – 16 11 10 8 7 5 3 2 2 2 2 1 1
17 – 24 33 28 31 26 28 27 5 5 5 4 4 4
25 – 29 41 21 20 18 25 18 11 6 5 5 6 4
30 – 59 250 205 213 189 175 176 10 8 9 8 7 7
60 – 64 24 26 35 33 23 33 8 9 11 10 7 9
65 – 79 93 92 86 94 85 96 13 13 12 13 12 13
80 & over 82 83 58 79 69 70 32 32 22 29 25 25
Unspecified 15 11 12 20 15 10 .. .. .. .. .. ..
All ages 593 508 491 491 443 451 10 8 8 8 7 7
Males, all ages 373 314 321 308 279 275 13 11 11 10 9 9
Females, all ages 212 193 170 178 164 172 7 6 6 6 5 6
1 Includes fire related deaths recorded by the MOD and media in January and February 2003 during industrial action (see explanatory notes 3 and 4).
2 The per million population rates for all years take into account the revised mid-year population estimates published by the Office for National Statistics in October 2004 (see explanatory note 15).
3 Including some fatal casualties, whose gender was not recorded.
1.15 Fatality rates are higher for males than females – in 2008 there were 9 male fatalities pmp compared to 6 female fatalities pmp. The highest fatality rates occur for those people aged 80 and over (25 pmp). In recent years the rate for this age group has varied between a high of 32 in 2003 to a low 22 in 2005 fatalities pmp. The lowest rates occur for those aged 11 to 16.
Non-fatal casualties
1.16 There was a 7 per cent decrease in the number of non-fatal casualties (including firefighters) to 12,200 in 2008, representing the ninth consecutive annual fall and at the lowest in the last 20 years.
22 Fire Statistics, United Kingdom 2008
Location (Table 6, Figure 1.6)
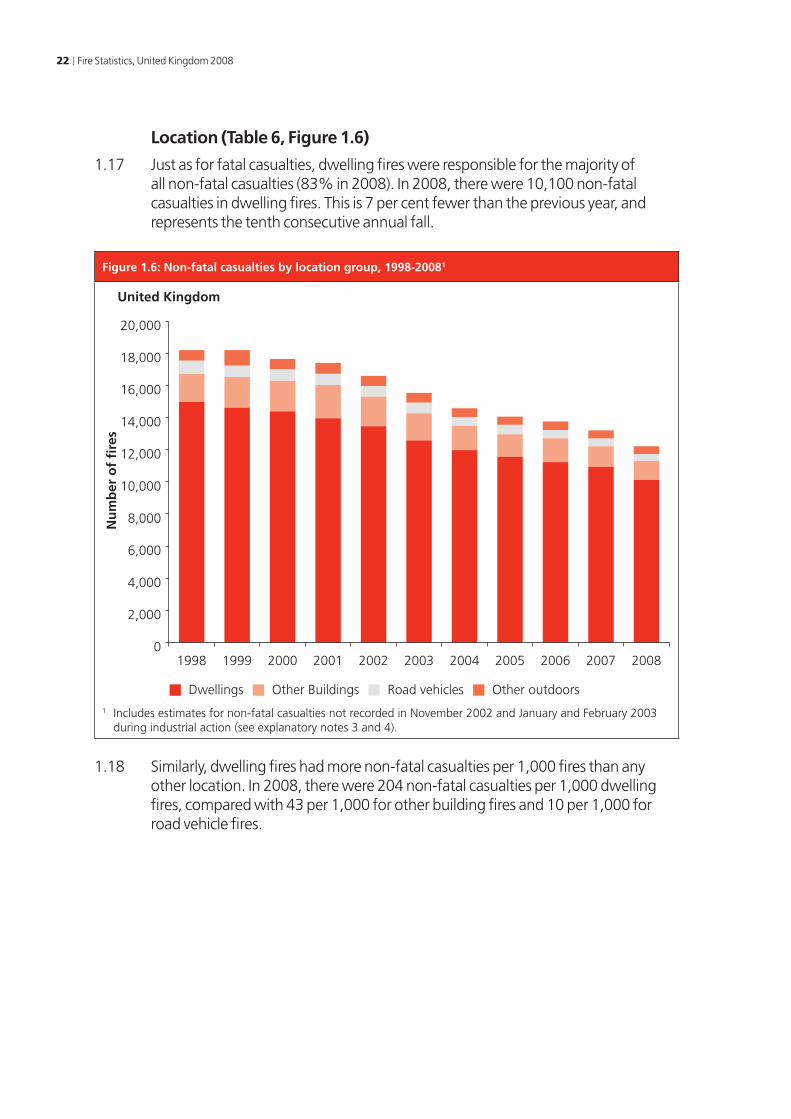
1.17 Just as for fatal casualties, dwelling fires were responsible for the majority of all non-fatal casualties (83% in 2008). In 2008, there were 10,100 non-fatal casualties in dwelling fires. This is 7 per cent fewer than the previous year, and represents the tenth consecutive annual fall.
Figure 1.6: Non-fatal casualties by location group, 1998-20081
United Kingdom
Nu
mb
er o
f fi
res
Other outdoorsRoad vehiclesOther BuildingsDwellings
0
2,000
4,000
6,000
8,000
10,000
12,000
14,000
16,000
18,000
20,000
20082007200620052004200320022001200019991998
1 Includes estimates for non-fatal casualties not recorded in November 2002 and January and February 2003 during industrial action (see explanatory notes 3 and 4).
1.18 Similarly, dwelling fires had more non-fatal casualties per 1,000 fires than any other location. In 2008, there were 204 non-fatal casualties per 1,000 dwelling fires, compared with 43 per 1,000 for other building fires and 10 per 1,000 for road vehicle fires.
Fire Statistics, United Kingdom 2008 23
Nature of injury (Table 8, Figure 1.7)
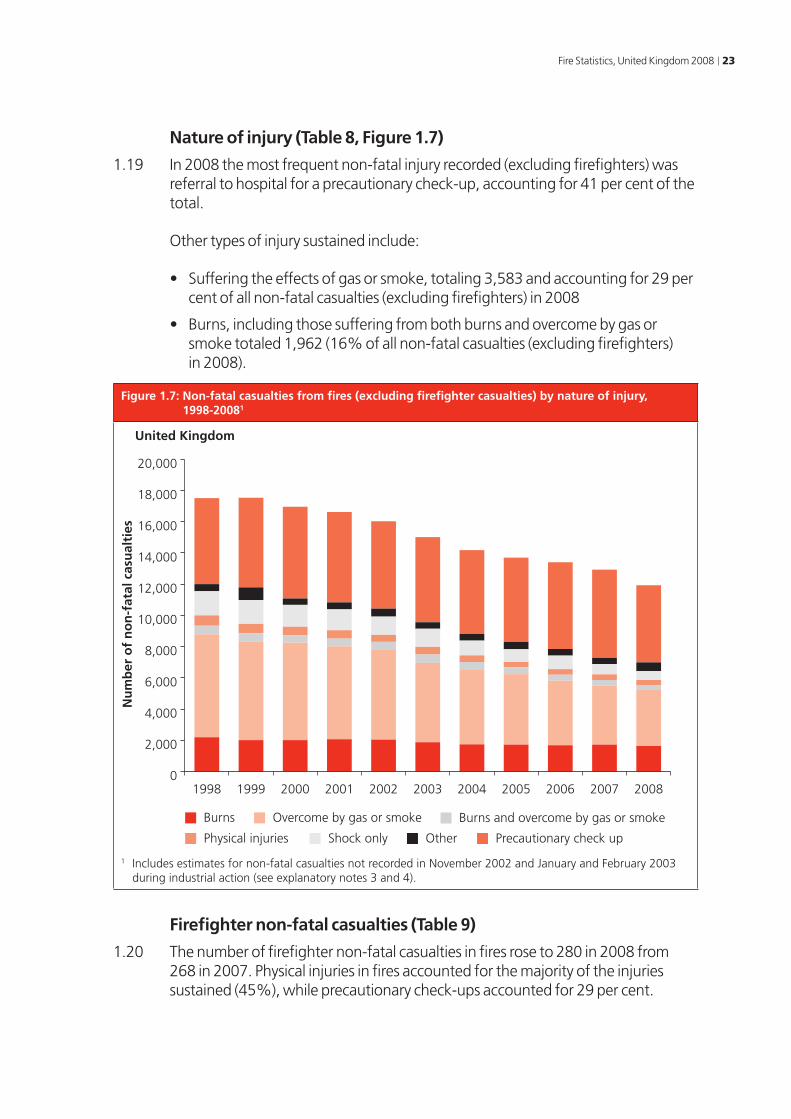
1.19 In 2008 the most frequent non-fatal injury recorded (excluding firefighters) was referral to hospital for a precautionary check-up, accounting for 41 per cent of the total.
Other types of injury sustained include:
• Suffering the effects of gas or smoke, totaling 3,583 and accounting for 29 per cent of all non-fatal casualties (excluding firefighters) in 2008
• Burns, including those suffering from both burns and overcome by gas or smoke totaled 1,962 (16% of all non-fatal casualties (excluding firefighters) in 2008).
Figure 1.7: Non-fatal casualties from fires (excluding firefighter casualties) by nature of injury, 1998-20081
United Kingdom
Nu
mb
er o
f n
on
-fat
al c
asu
alti
es
Precautionary check upOtherShock onlyPhysical injuries
Burns and overcome by gas or smoke Overcome by gas or smokeBurns
0
2,000
4,000
6,000
8,000
10,000
12,000
14,000
16,000
18,000
20,000
20082007200620052004200320022001200019991998
1 Includes estimates for non-fatal casualties not recorded in November 2002 and January and February 2003 during industrial action (see explanatory notes 3 and 4).
Firefighter non-fatal casualties (Table 9)
1.20 The number of firefighter non-fatal casualties in fires rose to 280 in 2008 from 268 in 2007. Physical injuries in fires accounted for the majority of the injuries sustained (45%), while precautionary check-ups accounted for 29 per cent.
24 Fire Statistics, United Kingdom 2008
Country and fire and rescue service area
Primary fires (Tables 5a and 23, Figure 1.8)
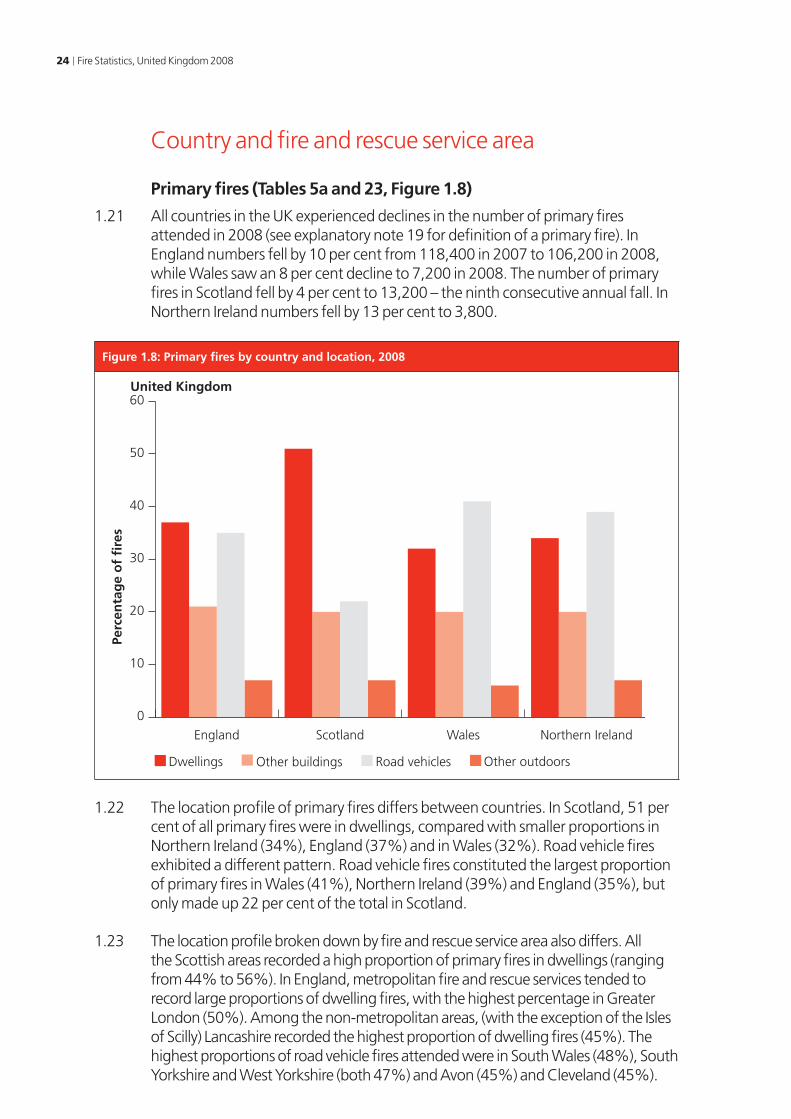
1.21 All countries in the UK experienced declines in the number of primary fires attended in 2008 (see explanatory note 19 for definition of a primary fire). In England numbers fell by 10 per cent from 118,400 in 2007 to 106,200 in 2008, while Wales saw an 8 per cent decline to 7,200 in 2008. The number of primary fires in Scotland fell by 4 per cent to 13,200 – the ninth consecutive annual fall. In Northern Ireland numbers fell by 13 per cent to 3,800.
Figure 1.8: Primary fires by country and location, 2008
0
10
20
30
40
50
60
Other outdoorsRoad vehiclesOther buildingsDwellings
Northern IrelandWalesScotlandEngland
United Kingdom
Perc
enta
ge
of
fire
s
1.22 The location profile of primary fires differs between countries. In Scotland, 51 per cent of all primary fires were in dwellings, compared with smaller proportions in Northern Ireland (34%), England (37%) and in Wales (32%). Road vehicle fires exhibited a different pattern. Road vehicle fires constituted the largest proportion of primary fires in Wales (41%), Northern Ireland (39%) and England (35%), but only made up 22 per cent of the total in Scotland.
1.23 The location profile broken down by fire and rescue service area also differs. All the Scottish areas recorded a high proportion of primary fires in dwellings (ranging from 44% to 56%). In England, metropolitan fire and rescue services tended to record large proportions of dwelling fires, with the highest percentage in Greater London (50%). Among the non-metropolitan areas, (with the exception of the Isles of Scilly) Lancashire recorded the highest proportion of dwelling fires (45%). The highest proportions of road vehicle fires attended were in South Wales (48%), South Yorkshire and West Yorkshire (both 47%) and Avon (45%) and Cleveland (45%).
Fire Statistics, United Kingdom 2008 25
Secondary fires (Tables 5a and 23)
1.24 England, Scotland, Wales and Northern Ireland all recorded a decrease in secondary fires in 2008 compared to 2007, (see explanatory note 24 for definition of a secondary fire). In England numbers fell by 19 per cent to 138,600, while in Scotland the decrease was 15 per cent (to 25,900). Secondary fires in Wales were down by 31 per cent at 11,400, whilst in Northern Ireland the decrease was 10 per cent (10,700 fires).
1.25 In 2008 refuse and derelict vehicle fires accounted for around two thirds of all secondary fires in the UK. Grassland fires (including intentional straw and stubble burning) contributed a further 23 per cent and derelict building fires accounted for 4 per cent.
Chimney fires (Tables 5a and 23)
1.26 There were 11,000 chimney fires in the UK in 2008, an increase of 18 per cent compared with 9,300 recorded in 2007.
Fatalities (Table 5b)
1.27 There were 451 fire-related deaths in the UK in 2008, of which 341 (76%) occurred in England. The fatality rate in fires in the UK in 2008 was 7.3 per million population (pmp). Fatality rates differ noticeably between countries:
• Scotland has had a consistently higher fatality rate over the years compared to the UK average, currently at 13.5 pmp
• the rate in Wales decreased from 8.7 pmp in 2007 to 6.7 pmp in 2008
• Northern Ireland’s rate increased from 10.8 pmp to 11.3 pmp
• in England the rate was unchanged at 7.3 pmp.
Non-fatal casualties and rates by country (Table 5b)
1.28 The number of non-fatal casualties in England fell by 10 per cent in 2008 to 9,400 from 10,500 in 2007. The number of non-fatal casualties in Wales was constant at 650 and rose by 16 per cent in Northern Ireland to 450. In Scotland the number of non-fatal casualties was constant at 1700.
1.29 Reflecting the decrease in the number of non-fatal casualties in the UK, the non-fatal casualty rate per million population (pmp) also fell, from 217 in 2007 to 199 in 2008. This represents the tenth consecutive annual fall, and the lowest rate in over 20 years. By country, the non-fatal casualty rates were:
• England, down from 205 pmp in 2007 to 183 pmp in 2008
• Wales, constant at 217 pmp in 2008
• Scotland, from 335 pmp in 2007 down slightly to 332 pmp in 2008
• Northern Ireland, from 218 pmp in 2007 up to 251 pmp in 2008.
26 Fire Statistics, United Kingdom 2008
Non-fatal casualty rates by fire and rescue service area (Table 22)
1.30 As in previous years, some of the highest non-fatal casualty rates in England were in the metropolitan fire and rescue service areas – Greater Manchester (536 pmp) and Merseyside (241 pmp). Northern Ireland had a higher than average rate of non-fatal casualties (251 pmp). In Scotland, Lothian and Borders had the highest rate (413 pmp) followed by Central (383 pmp). The highest casualty rate in Wales was in North Wales (335 pmp). The highest rate recorded by an English non-metropolitan fire and rescue service was in Cornwall (308 pmp). The lowest rate recorded (excluding Isles of Scilly) was in Warwickshire (54 pmp).
Country and regional data
1.31 Data for the last three years for primary fires, deaths and injuries have been aggregated to country and regional level totals and are shown in Table 29. Breakdowns by cause, whether accidental or deliberate, are shown in Tables 30 and 31.
1.32 Based on the average number of primary fires between 2006 and 2008, the five fire and rescue services in the North West region attended the most fires (21,400) although the numbers attended have fallen in recent years. The North East region (four fire and rescue services) attended the fewest fires out of all the English regions (7,800), although this region has a comparatively low population when compared against other regions. Northern Ireland had the least number of fires in the UK (4,300).
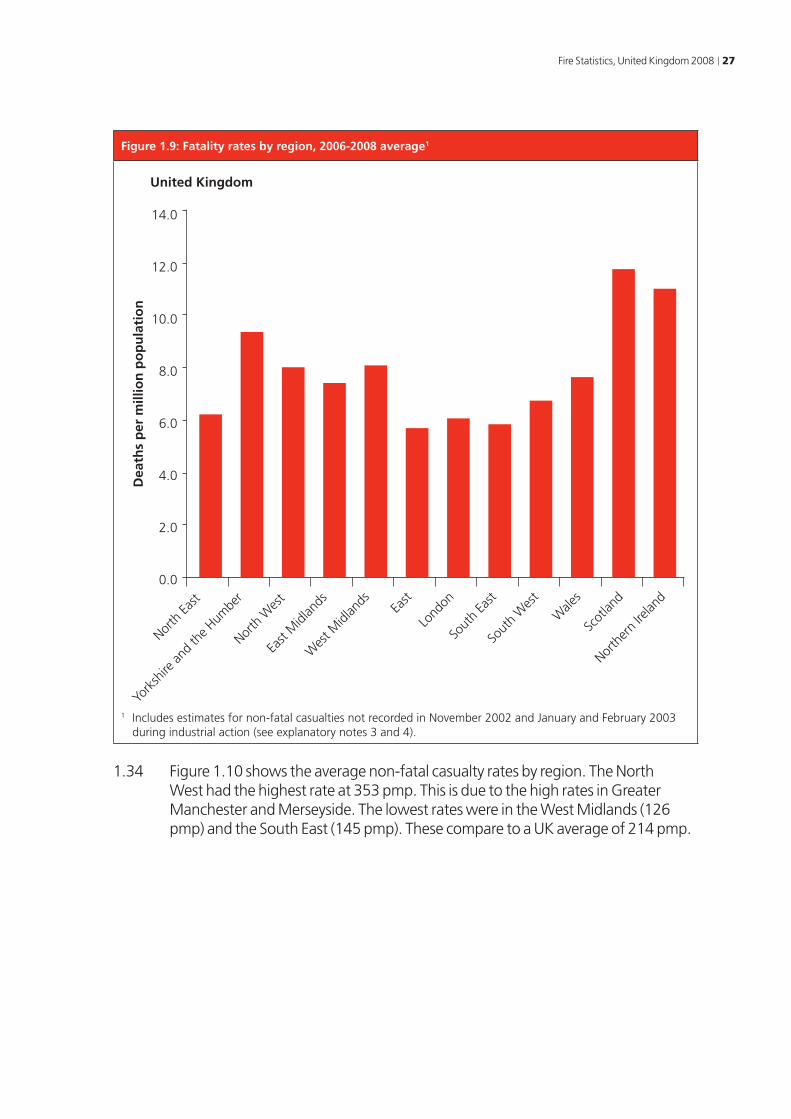
Casualties and rates (Table 29 and Figures 1.9 and 1.10)
1.33 Figure 1.9 shows the average fatality rate for each region for 2006-2008. Scotland had the highest rate at 11.7 deaths pmp. The next highest was in the Northern Ireland with 11.0 deaths pmp. The Eastern region had the lowest average fatality rate at 5.7 deaths pmp. The UK average was 7.6 pmp.
Fire Statistics, United Kingdom 2008 27
Figure 1.9: Fatality rates by region, 2006-2008 average1
14.0
12.0
10.0
8.0
6.0
4.0
2.0
0.0
North
East
North
Wes
t
York
shire
and
the H
umbe
r
East
Midl
ands
Wes
t Midl
ands Ea
st
Lond
on
Sout
h Ea
st
Sout
h W
est
Wale
s
Scot
land
North
ern
Irelan
d
United Kingdom
Dea
ths
per
mill
ion
po
pu
lati
on
1 Includes estimates for non-fatal casualties not recorded in November 2002 and January and February 2003 during industrial action (see explanatory notes 3 and 4).
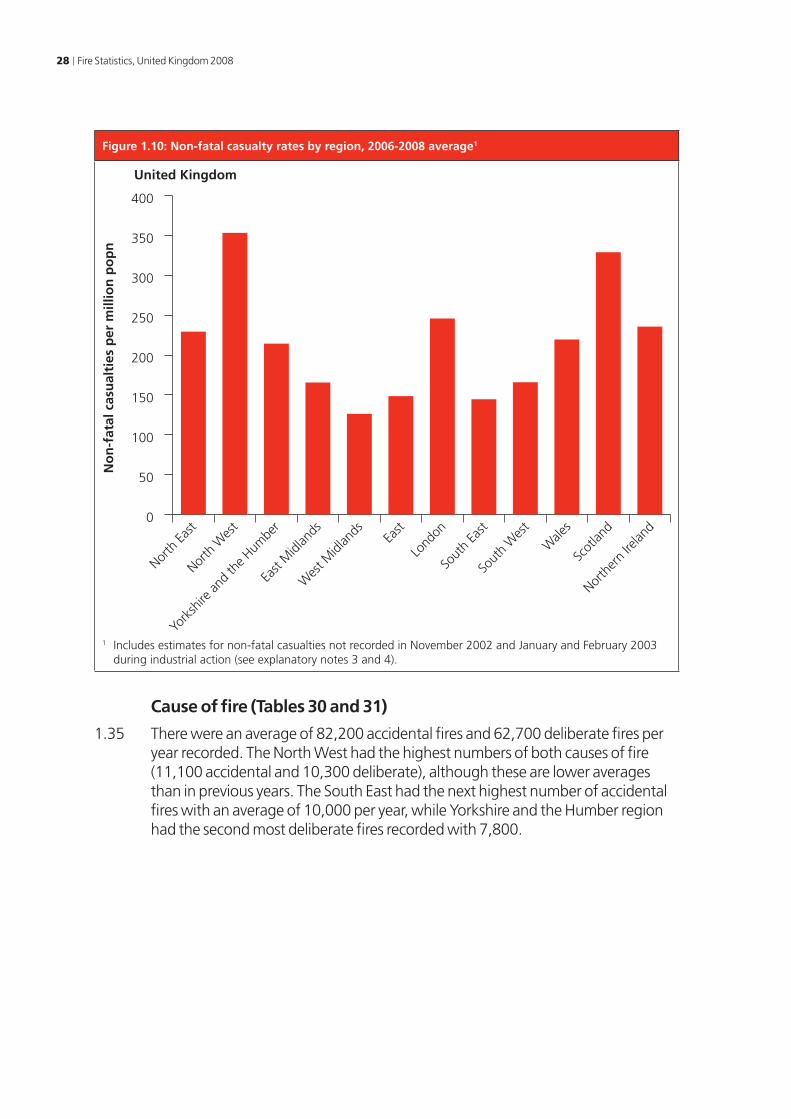
1.34 Figure 1.10 shows the average non-fatal casualty rates by region. The North West had the highest rate at 353 pmp. This is due to the high rates in Greater Manchester and Merseyside. The lowest rates were in the West Midlands (126 pmp) and the South East (145 pmp). These compare to a UK average of 214 pmp.
28 Fire Statistics, United Kingdom 2008
Figure 1.10: Non-fatal casualty rates by region, 2006-2008 average1
0
50
100
150
200
250
300
350
400
North
East
North
Wes
t
York
shire
and
the H
umbe
r
East
Midl
ands
Wes
t Midl
ands Ea
st
Lond
on
Sout
h Ea
st
Sout
h W
est
Wale
s
Scot
land
North
ern
Irelan
d
United Kingdom
No
n-f
atal
cas
ual
ties
per
mill
ion
po
pn
1 Includes estimates for non-fatal casualties not recorded in November 2002 and January and February 2003 during industrial action (see explanatory notes 3 and 4).
Cause of fire (Tables 30 and 31)
1.35 There were an average of 82,200 accidental fires and 62,700 deliberate fires per year recorded. The North West had the highest numbers of both causes of fire (11,100 accidental and 10,300 deliberate), although these are lower averages than in previous years. The South East had the next highest number of accidental fires with an average of 10,000 per year, while Yorkshire and the Humber region had the second most deliberate fires recorded with 7,800.
Fire Statistics, United Kingdom 2008 29
Chapter 2
Dwellings
Introduction (Tables 2 and 6)
2.1 Dwelling fires account for around two thirds of all building fires (i.e. primary building fires) and around 80 per cent of all casualties occur in fires in the home. (See explanatory note 24 for further information on the definitions of primary and dwelling fires.) Overall, the number of dwelling fires fell by 6 per cent to 49,600 in 2008, continuing the downward trend since 1999. The number of deaths in dwelling fires was 353, up 22 on 2007 – the first recorded increase since 2005. There was a 7 per cent fall in the number of non-fatal casualties in fires in dwellings to 10,100.
Accidental fires (Table 2)
2.2 The majority of fires in dwellings are accidental (83% in 2008). The number of accidental fires in dwellings fell by 5 per cent from 43,000 in 2007 to 41,000 in 2008. The 2008 figure represents the lowest number of such fires recorded in more than two decades.
Cause of fire (Table 2)
2.3 The main cause of accidental fires in dwellings remains the misuse of equipment or appliances, with 14,200 cases recorded in 2008 – six percent fewer than in 2007. However, this figure represents the lowest level in over a decade. Other changes in accidental dwelling fires since 1998 include:
• chip/fat pan fires have fallen by over half in ten years to 4,800
• instances of playing with fire have fallen by over two thirds in the decade.
Source of ignition (Table 3)
2.4 This section looks in more detail at the source of the flame, spark or heat that first ignited the fire. This is related to the cause of the fire, and for many sources of ignition there was only one major cause responsible for the fire. For example, for most fires in which the source of ignition was smokers’ materials the cause was most likely to be careless handling of fire or hot substances.
2.5 Cooking appliances were the main source of ignition in accidental dwelling fires (over half in 2008). These fires fell by 7 per cent to 22,200 in 2008, the eighth consecutive annual fall and a total fall of around a third from the peak of 34,000 in 2000.
30 Fire Statistics, United Kingdom 2008
2.6 Other key changes from 2000 were:
• fires where the source of ignition was smokers’ materials (i.e. cigarettes, cigars or pipe tobacco) fell by around one third;
• candle fire totals are now around a third less than the 2000 high – 1,400 compared to 2,100.
Casualties from accidental fires (Tables 10 and 11)
2.7 The majority of the deaths in dwellings result from fires caused accidentally. Of the 353 deaths in dwellings in 2008, 294 (83%) were of accidental causes. The number of deaths is also 35 per cent less than the 1998 accidental total of 454.
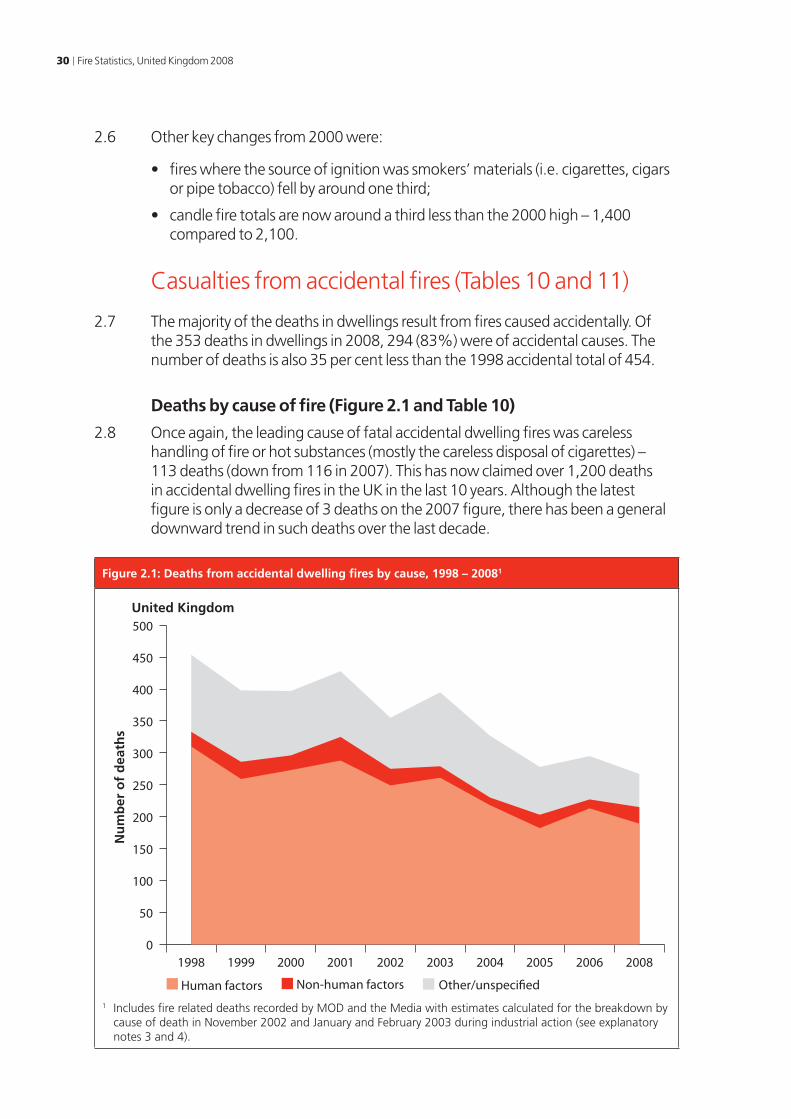
Deaths by cause of fire (Figure 2.1 and Table 10)
2.8 Once again, the leading cause of fatal accidental dwelling fires was careless handling of fire or hot substances (mostly the careless disposal of cigarettes) – 113 deaths (down from 116 in 2007). This has now claimed over 1,200 deaths in accidental dwelling fires in the UK in the last 10 years. Although the latest figure is only a decrease of 3 deaths on the 2007 figure, there has been a general downward trend in such deaths over the last decade.
Figure 2.1: Deaths from accidental dwelling fires by cause, 1998 – 20081
0
50
100
150
200
250
300
350
400
450
500
Other/unspeci edNon-human factorsHuman factors
2008200620052004200320022001200019991998
United Kingdom
Nu
mb
er o
f d
eath
s
1 Includes fire related deaths recorded by MOD and the Media with estimates calculated for the breakdown by cause of death in November 2002 and January and February 2003 during industrial action (see explanatory notes 3 and 4).
Fire Statistics, United Kingdom 2008 31
2.9 Other key changes in the number of fatal casualties by cause of fire between 2007 and 2008 were:
• faulty appliances and leads accounted for 30 deaths, up from 17 the previous year
• deaths due to the chip/fat pan fires rose from 8 to 19 (although the decade long trend remains downwards – with the 2008 total less than half the 1998 figure).
Deaths by source of ignition of fire (Tables 2.1 and 11)
2.10 Smokers’ materials (i.e. cigarettes, cigars or pipe tobacco) were the most frequent source of ignition causing accidental dwelling fire deaths, accounting for over a third of all accidental dwelling fire deaths in 2008. For every 1,000 accidental dwelling fires (where smokers’ materials were the source of ignition), 36 people were killed in 2008. Since 1998, such deaths have become increasingly less common and there has been a downward trend in the figures for most of the decade. In 2008 however, the number of these deaths was almost the same as in 2007.
2.11 Fires started by cooking appliances were responsible for 15 per cent of all accidental dwelling fire deaths. There were 44 such deaths in 2007, up from 36 in 2007. Only 2 people were killed for every 1,000 fires started in cooking appliances in 2008. This could reflect the relatively minor nature of many cooking-related fires and the fact that many cooking fires occur when the victims are alert at the time of the fire.
2.12 Accidental dwelling fire deaths started by space heating appliances rose from 20 in 2007 to 25 in 2008. Six people were killed in accidental dwelling fires started by central and water heating appliances.
2.13 In 2008 18 people were fatally injured in accidental dwelling fires started by candles, four more than in 2007.
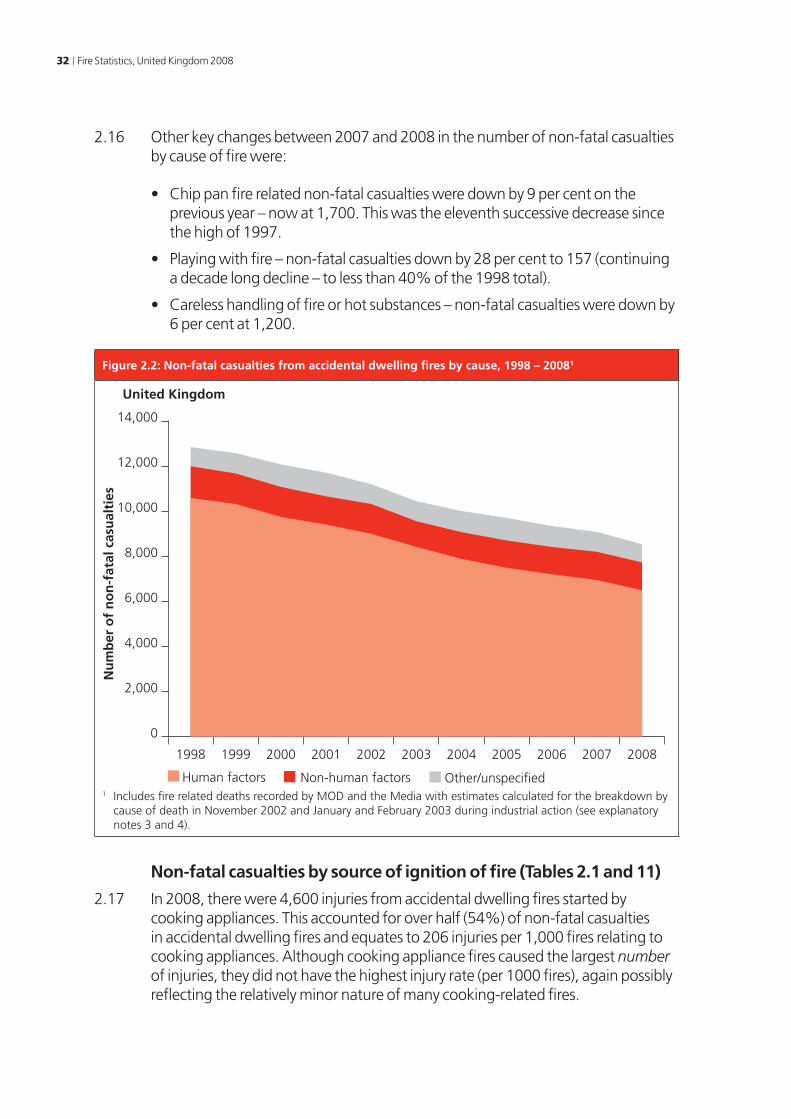
Non-fatal casualties by cause of fire (Figure 2.2 and Table 10)
2.14 In 2008, the total number of non-fatal casualties in dwelling fires fell by 7per cent to 10,100. The vast majority of these casualties occurred in fires caused accidentally (84%). The number of non-fatal casualties in accidental dwelling fires fell by 6 per cent from 9,100 in 2007 to 8,500 in 2008. This continues the downward trend seen in recent years and represents the lowest recorded figure in over a decade.
2.15 The misuse of equipment and appliances was the biggest cause of non-fatal casualties in accidental dwelling fires in 2008. Up until 2005, chip/fat pans had been the biggest cause in accidental dwelling fires injuries.
32 Fire Statistics, United Kingdom 2008
2.16 Other key changes between 2007 and 2008 in the number of non-fatal casualties by cause of fire were:
• Chip pan fire related non-fatal casualties were down by 9 per cent on the previous year – now at 1,700. This was the eleventh successive decrease since the high of 1997.
• Playing with fire – non-fatal casualties down by 28 per cent to 157 (continuing a decade long decline – to less than 40% of the 1998 total).
• Careless handling of fire or hot substances – non-fatal casualties were down by 6 per cent at 1,200.
Figure 2.2: Non-fatal casualties from accidental dwelling fires by cause, 1998 – 20081
Nu
mb
er o
f n
on
-fat
al c
asu
alti
es
United Kingdom
0
2,000
4,000
6,000
8,000
10,000
12,000
14,000
Other/unspecifiedNon-human factorsHuman factors
20082007200620052004200320022001200019991998
1 Includes fire related deaths recorded by MOD and the Media with estimates calculated for the breakdown by cause of death in November 2002 and January and February 2003 during industrial action (see explanatory notes 3 and 4).
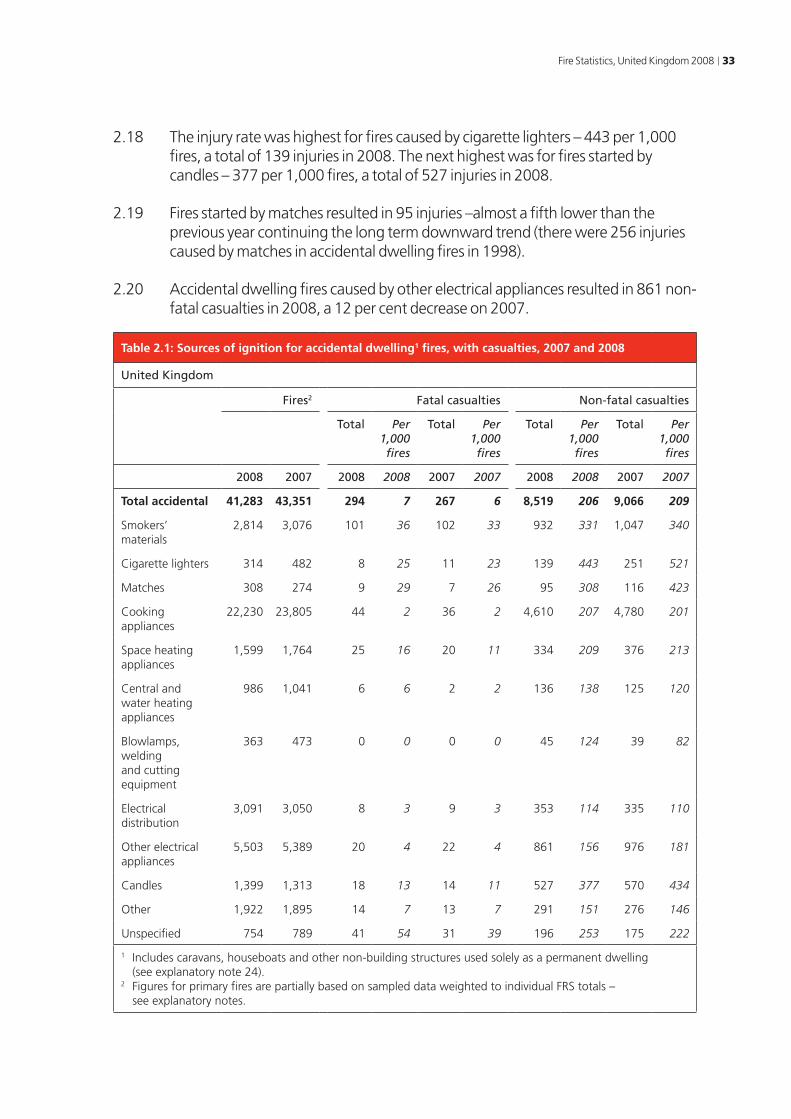
Non-fatal casualties by source of ignition of fire (Tables 2.1 and 11)
2.17 In 2008, there were 4,600 injuries from accidental dwelling fires started by cooking appliances. This accounted for over half (54%) of non-fatal casualties in accidental dwelling fires and equates to 206 injuries per 1,000 fires relating to cooking appliances. Although cooking appliance fires caused the largest number of injuries, they did not have the highest injury rate (per 1000 fires), again possibly reflecting the relatively minor nature of many cooking-related fires.
Fire Statistics, United Kingdom 2008 33
2.18 The injury rate was highest for fires caused by cigarette lighters – 443 per 1,000 fires, a total of 139 injuries in 2008. The next highest was for fires started by candles – 377 per 1,000 fires, a total of 527 injuries in 2008.
2.19 Fires started by matches resulted in 95 injuries –almost a fifth lower than the previous year continuing the long term downward trend (there were 256 injuries caused by matches in accidental dwelling fires in 1998).
2.20 Accidental dwelling fires caused by other electrical appliances resulted in 861 non-fatal casualties in 2008, a 12 per cent decrease on 2007.
Table 2.1: Sources of ignition for accidental dwelling1 fires, with casualties, 2007 and 2008
United Kingdom
Fires2 Fatal casualties Non-fatal casualties
Total Per 1,000 fires
Total Per 1,000 fires
Total Per 1,000 fires
Total Per 1,000 fires
2008 2007 2008 2008 2007 2007 2008 2008 2007 2007
Total accidental 41,283 43,351 294 7 267 6 8,519 206 9,066 209
Smokers’ materials
2,814 3,076 101 36 102 33 932 331 1,047 340
Cigarette lighters 314 482 8 25 11 23 139 443 251 521
Matches 308 274 9 29 7 26 95 308 116 423
Cooking appliances
22,230 23,805 44 2 36 2 4,610 207 4,780 201
Space heating appliances
1,599 1,764 25 16 20 11 334 209 376 213
Central and water heating appliances
986 1,041 6 6 2 2 136 138 125 120
Blowlamps, welding and cutting equipment
363 473 0 0 0 0 45 124 39 82
Electrical distribution
3,091 3,050 8 3 9 3 353 114 335 110
Other electrical appliances
5,503 5,389 20 4 22 4 861 156 976 181
Candles 1,399 1,313 18 13 14 11 527 377 570 434
Other 1,922 1,895 14 7 13 7 291 151 276 146
Unspecified 754 789 41 54 31 39 196 253 175 222
1 Includes caravans, houseboats and other non-building structures used solely as a permanent dwelling (see explanatory note 24).
2 Figures for primary fires are partially based on sampled data weighted to individual FRS totals – see explanatory notes.
34 Fire Statistics, United Kingdom 2008
Casualties by room of origin of fire (Tables 2.2, 12a and 12b)
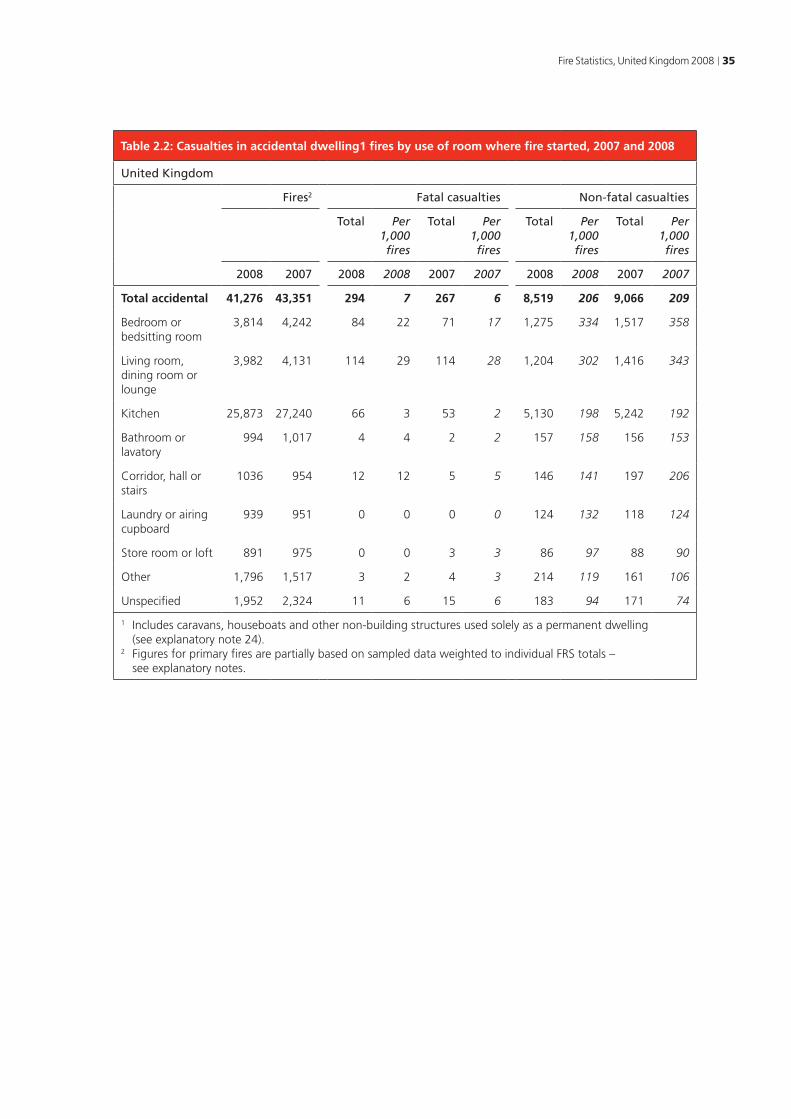
2.21 In 2008, 114 (38%) accidental dwelling fire fatalities occurred in fires starting in the living or dining room. This equates to a fatality rate of 29 deaths per 1,000 fires, and makes fires starting in the living or dining room the most likely to result in a fatality. By contrast, 66 (22%) fatalities occurred in kitchen fires equating to a fatality rate of only 3 deaths per 1,000 fires, which would again suggest that many cooking-related fires are relatively minor in nature.
2.22 The majority of all non-fatal casualties occurred in kitchen fires (60%), although there was a 2 per cent fall in 2008, down to 5,100 from 5,200 in 2007. As with fatalities, the non-fatal casualty rate in kitchen fires was relatively low at 198 per 1,000 fires compared to the highest rate of 334 per 1,000 fires starting in the bedroom and 302 per 1,000 fires starting in the living or dining room.
2.23 In 2008, 53 per cent of all accidental dwelling fire fatalities occurred in the room where the fire started, down 11 percent on 2007. However, this proportion varies depending on the room in which the fire started. For example, 62 per cent of fatalities from fires starting in the bedroom occurred in the room of origin, while a third of deaths in fires starting in the kitchen occurred in the room of origin.
2.24 The pattern for non-fatal casualties is different to that of fatalities, with 35 per cent occurring in the room of origin in 2008 (similar to previous years). Once again, variations occur according to the room in which the fire started. For example, 42 per cent of non-fatal casualties from fires starting in a bedroom occurred in the room of origin, compared to 34 per cent for fires starting in the kitchen.
Fire Statistics, United Kingdom 2008 35
Table 2.2: Casualties in accidental dwelling1 fires by use of room where fire started, 2007 and 2008
United Kingdom
Fires2 Fatal casualties Non-fatal casualties
Total Per 1,000 fires
Total Per 1,000 fires
Total Per 1,000 fires
Total Per 1,000 fires
2008 2007 2008 2008 2007 2007 2008 2008 2007 2007
Total accidental 41,276 43,351 294 7 267 6 8,519 206 9,066 209
Bedroom or bedsitting room
3,814 4,242 84 22 71 17 1,275 334 1,517 358
Living room, dining room or lounge
3,982 4,131 114 29 114 28 1,204 302 1,416 343
Kitchen 25,873 27,240 66 3 53 2 5,130 198 5,242 192
Bathroom or lavatory
994 1,017 4 4 2 2 157 158 156 153
Corridor, hall or stairs
1036 954 12 12 5 5 146 141 197 206
Laundry or airing cupboard
939 951 0 0 0 0 124 132 118 124
Store room or loft 891 975 0 0 3 3 86 97 88 90
Other 1,796 1,517 3 2 4 3 214 119 161 106
Unspecified 1,952 2,324 11 6 15 6 183 94 171 74
1 Includes caravans, houseboats and other non-building structures used solely as a permanent dwelling (see explanatory note 24).
2 Figures for primary fires are partially based on sampled data weighted to individual FRS totals – see explanatory notes.
36 Fire Statistics, United Kingdom 2008
Smoke alarm analyses (Tables 2.3 to 2.9 and Figure 2.4)
Introduction
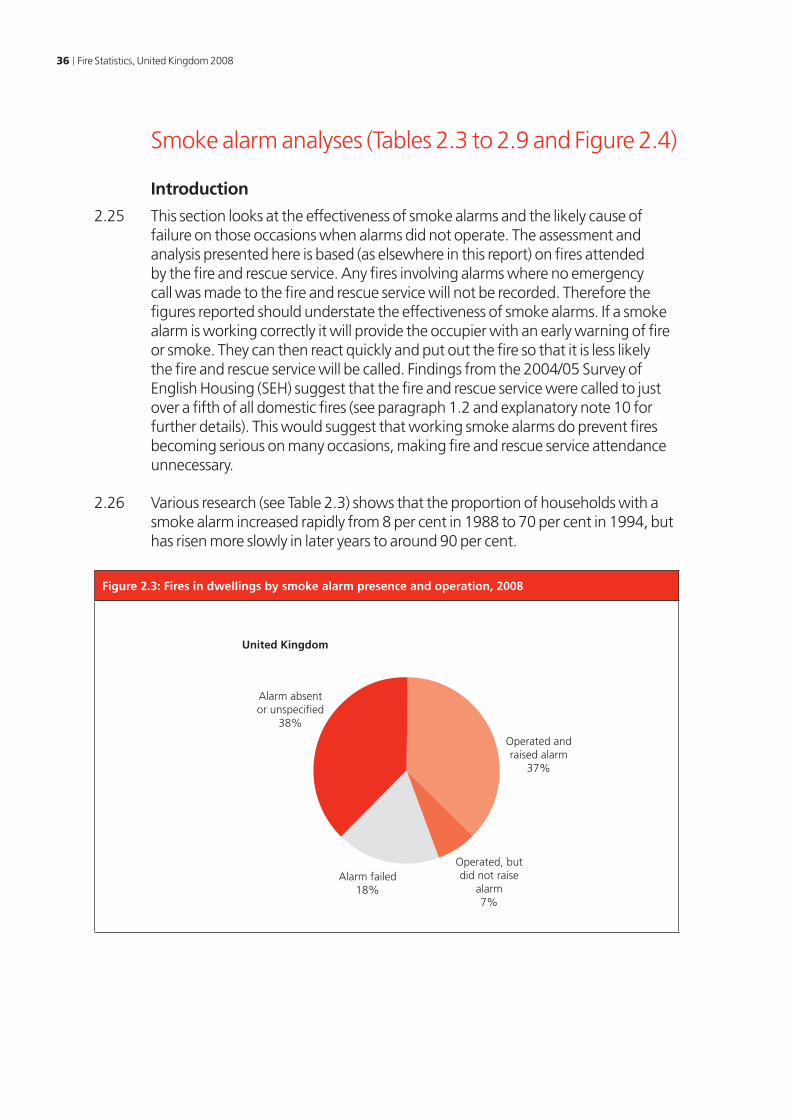
2.25 This section looks at the effectiveness of smoke alarms and the likely cause of failure on those occasions when alarms did not operate. The assessment and analysis presented here is based (as elsewhere in this report) on fires attended by the fire and rescue service. Any fires involving alarms where no emergency call was made to the fire and rescue service will not be recorded. Therefore the figures reported should understate the effectiveness of smoke alarms. If a smoke alarm is working correctly it will provide the occupier with an early warning of fire or smoke. They can then react quickly and put out the fire so that it is less likely the fire and rescue service will be called. Findings from the 2004/05 Survey of English Housing (SEH) suggest that the fire and rescue service were called to just over a fifth of all domestic fires (see paragraph 1.2 and explanatory note 10 for further details). This would suggest that working smoke alarms do prevent fires becoming serious on many occasions, making fire and rescue service attendance unnecessary.
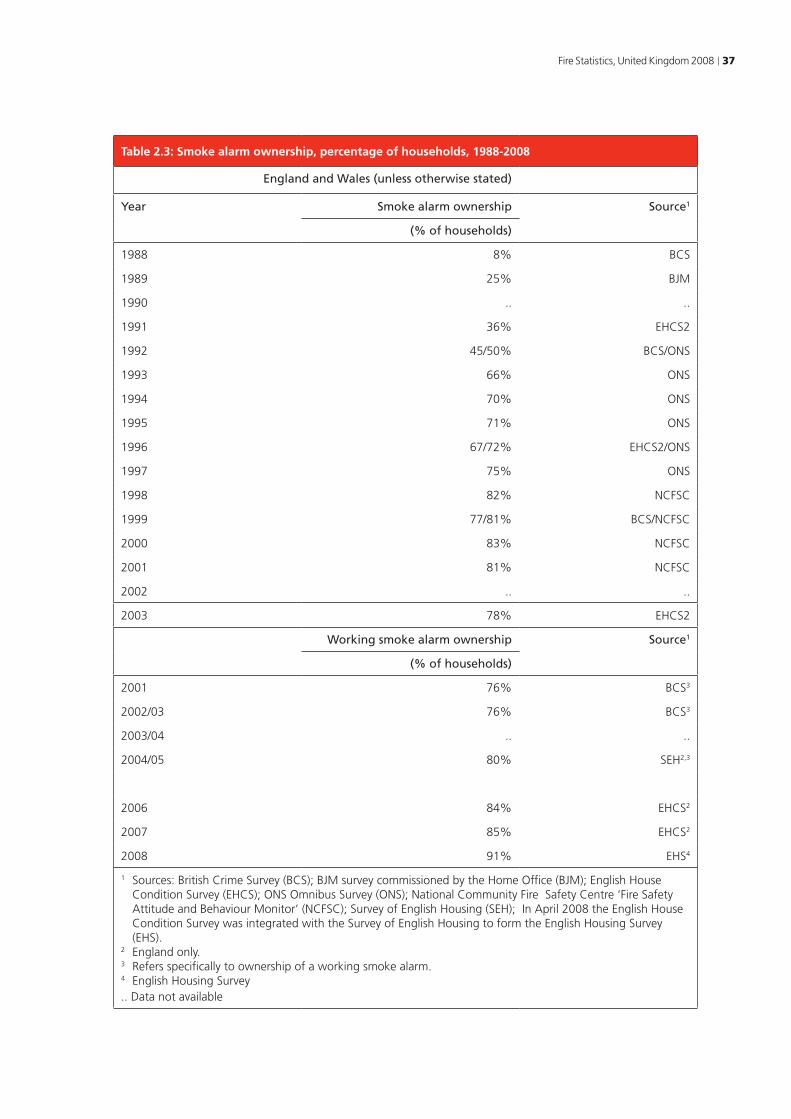
2.26 Various research (see Table 2.3) shows that the proportion of households with a smoke alarm increased rapidly from 8 per cent in 1988 to 70 per cent in 1994, but has risen more slowly in later years to around 90 per cent.
Figure 2.3: Fires in dwellings by smoke alarm presence and operation, 2008
United Kingdom
Alarm absentor unspecified
38%
Operated, butdid not raise
alarm7%
Operated andraised alarm
37%
Alarm failed18%
Fire Statistics, United Kingdom 2008 37
Table 2.3: Smoke alarm ownership, percentage of households, 1988-2008
England and Wales (unless otherwise stated)
Year Smoke alarm ownership Source1
(% of households)
1988 8% BCS
1989 25% BJM
1990 .. ..
1991 36% EHCS2
1992 45/50% BCS/ONS
1993 66% ONS
1994 70% ONS
1995 71% ONS
1996 67/72% EHCS2/ONS
1997 75% ONS
1998 82% NCFSC
1999 77/81% BCS/NCFSC
2000 83% NCFSC
2001 81% NCFSC
2002 .. ..
2003 78% EHCS2
Working smoke alarm ownership Source1
(% of households)
2001 76% BCS3
2002/03 76% BCS3
2003/04 .. ..
2004/05 80% SEH2,3
2006 84% EHCS2
2007 85% EHCS2
2008 91% EHS4
1 Sources: British Crime Survey (BCS); BJM survey commissioned by the Home Office (BJM); English House Condition Survey (EHCS); ONS Omnibus Survey (ONS); National Community Fire Safety Centre ‘Fire Safety Attitude and Behaviour Monitor’ (NCFSC); Survey of English Housing (SEH); In April 2008 the English House Condition Survey was integrated with the Survey of English Housing to form the English Housing Survey (EHS).
2 England only.3 Refers specifically to ownership of a working smoke alarm.4 English Housing Survey.. Data not available
38 Fire Statistics, United Kingdom 2008
Smoke alarm presence, type and operation (Tables 2.4 to 2.6)
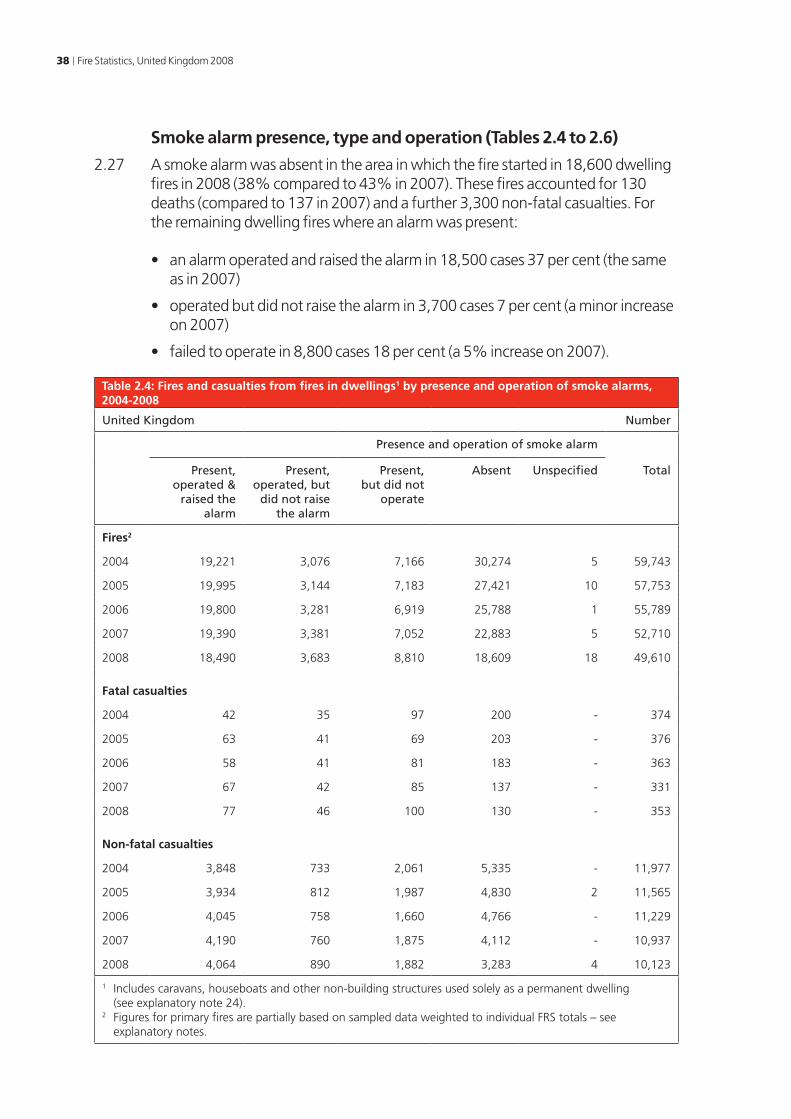
2.27 A smoke alarm was absent in the area in which the fire started in 18,600 dwelling fires in 2008 (38% compared to 43% in 2007). These fires accounted for 130 deaths (compared to 137 in 2007) and a further 3,300 non-fatal casualties. For the remaining dwelling fires where an alarm was present:
• an alarm operated and raised the alarm in 18,500 cases 37 per cent (the same as in 2007)
• operated but did not raise the alarm in 3,700 cases 7 per cent (a minor increase on 2007)
• failed to operate in 8,800 cases 18 per cent (a 5% increase on 2007).
Table 2.4: Fires and casualties from fires in dwellings1 by presence and operation of smoke alarms, 2004-2008
United Kingdom Number
Presence and operation of smoke alarm
Present, operated &
raised the alarm
Present, operated, but
did not raise the alarm
Present, but did not
operate
Absent Unspecified Total
Fires2
2004 19,221 3,076 7,166 30,274 5 59,743
2005 19,995 3,144 7,183 27,421 10 57,753
2006 19,800 3,281 6,919 25,788 1 55,789
2007 19,390 3,381 7,052 22,883 5 52,710
2008 18,490 3,683 8,810 18,609 18 49,610 Fatal casualties
2004 42 35 97 200 - 374
2005 63 41 69 203 - 376
2006 58 41 81 183 - 363
2007 67 42 85 137 - 331
2008 77 46 100 130 - 353 Non-fatal casualties
2004 3,848 733 2,061 5,335 - 11,977
2005 3,934 812 1,987 4,830 2 11,565
2006 4,045 758 1,660 4,766 - 11,229
2007 4,190 760 1,875 4,112 - 10,937
2008 4,064 890 1,882 3,283 4 10,123
1 Includes caravans, houseboats and other non-building structures used solely as a permanent dwelling (see explanatory note 24).
2 Figures for primary fires are partially based on sampled data weighted to individual FRS totals – see explanatory notes.
Fire Statistics, United Kingdom 2008 39
Type of alarm (Table 2.5)
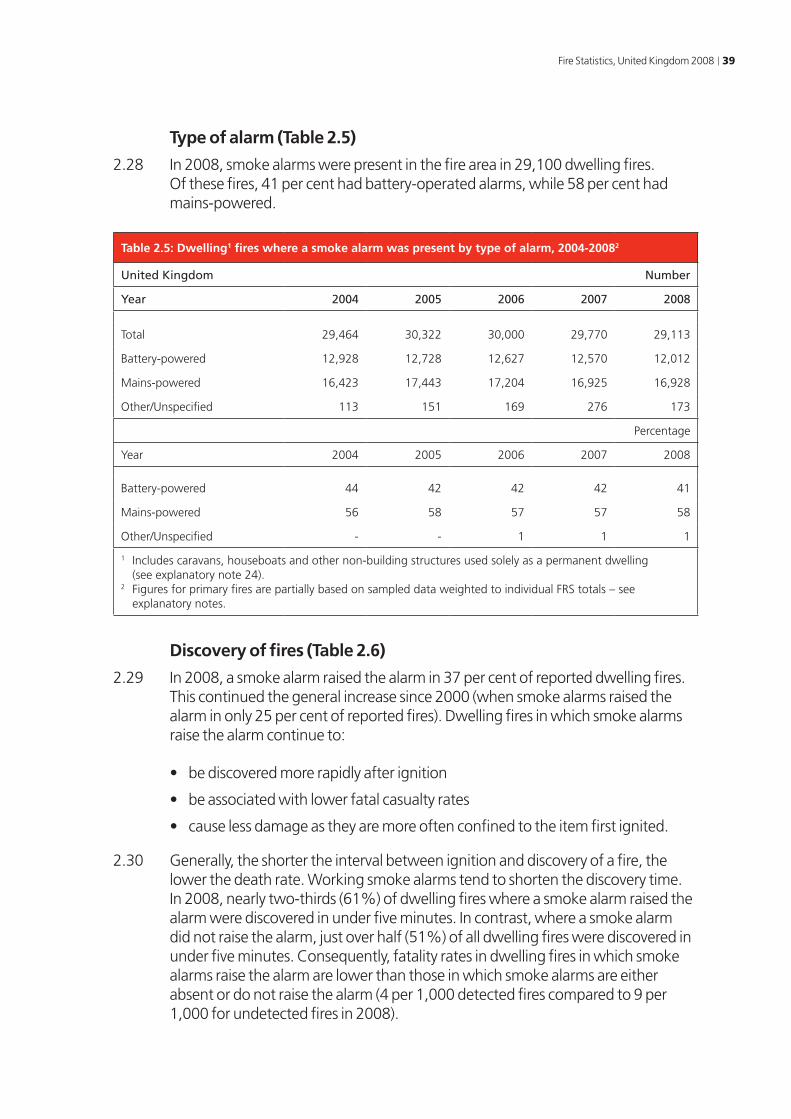
2.28 In 2008, smoke alarms were present in the fire area in 29,100 dwelling fires. Of these fires, 41 per cent had battery-operated alarms, while 58 per cent had mains-powered.
Table 2.5: Dwelling1 fires where a smoke alarm was present by type of alarm, 2004-20082
United Kingdom Number
Year 2004 2005 2006 2007 2008
Total 29,464 30,322 30,000 29,770 29,113
Battery-powered 12,928 12,728 12,627 12,570 12,012
Mains-powered 16,423 17,443 17,204 16,925 16,928
Other/Unspecified 113 151 169 276 173
Percentage
Year 2004 2005 2006 2007 2008
Battery-powered 44 42 42 42 41
Mains-powered 56 58 57 57 58
Other/Unspecified - - 1 1 1
1 Includes caravans, houseboats and other non-building structures used solely as a permanent dwelling(see explanatory note 24).
2 Figures for primary fires are partially based on sampled data weighted to individual FRS totals – see explanatory notes.
Discovery of fires (Table 2.6)
2.29 In 2008, a smoke alarm raised the alarm in 37 per cent of reported dwelling fires. This continued the general increase since 2000 (when smoke alarms raised the alarm in only 25 per cent of reported fires). Dwelling fires in which smoke alarms raise the alarm continue to:
• be discovered more rapidly after ignition
• be associated with lower fatal casualty rates
• cause less damage as they are more often confined to the item first ignited.
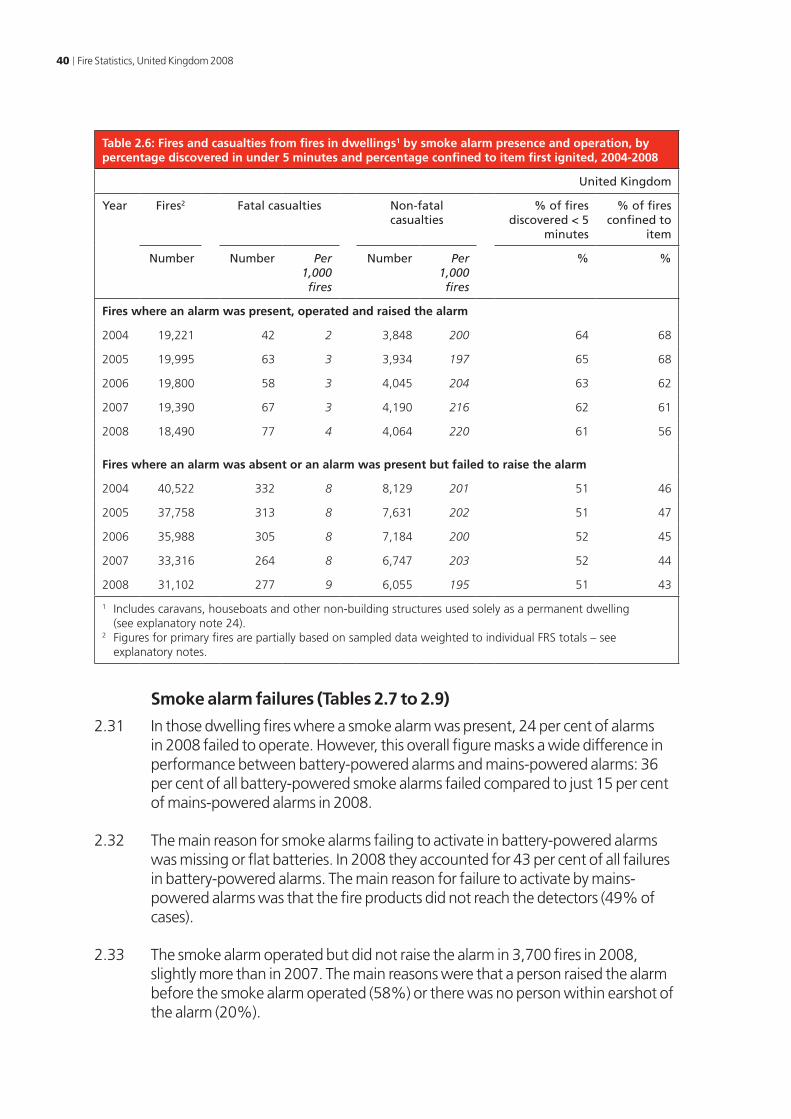
2.30 Generally, the shorter the interval between ignition and discovery of a fire, the lower the death rate. Working smoke alarms tend to shorten the discovery time. In 2008, nearly two-thirds (61%) of dwelling fires where a smoke alarm raised the alarm were discovered in under five minutes. In contrast, where a smoke alarm did not raise the alarm, just over half (51%) of all dwelling fires were discovered in under five minutes. Consequently, fatality rates in dwelling fires in which smoke alarms raise the alarm are lower than those in which smoke alarms are either absent or do not raise the alarm (4 per 1,000 detected fires compared to 9 per 1,000 for undetected fires in 2008).
40 Fire Statistics, United Kingdom 2008
Table 2.6: Fires and casualties from fires in dwellings1 by smoke alarm presence and operation, by percentage discovered in under 5 minutes and percentage confined to item first ignited, 2004-2008
United Kingdom
Year Fires2 Fatal casualties Non-fatal casualties
% of fires discovered < 5
minutes
% of fires confined to
item
Number Number Per 1,000 fires
Number Per 1,000 fires
% %
Fires where an alarm was present, operated and raised the alarm
2004 19,221 42 2 3,848 200 64 68
2005 19,995 63 3 3,934 197 65 68
2006 19,800 58 3 4,045 204 63 62
2007 19,390 67 3 4,190 216 62 61
2008 18,490 77 4 4,064 220 61 56
Fires where an alarm was absent or an alarm was present but failed to raise the alarm
2004 40,522 332 8 8,129 201 51 46
2005 37,758 313 8 7,631 202 51 47
2006 35,988 305 8 7,184 200 52 45
2007 33,316 264 8 6,747 203 52 44
2008 31,102 277 9 6,055 195 51 43
1 Includes caravans, houseboats and other non-building structures used solely as a permanent dwelling (see explanatory note 24).
2 Figures for primary fires are partially based on sampled data weighted to individual FRS totals – see explanatory notes.
Smoke alarm failures (Tables 2.7 to 2.9)
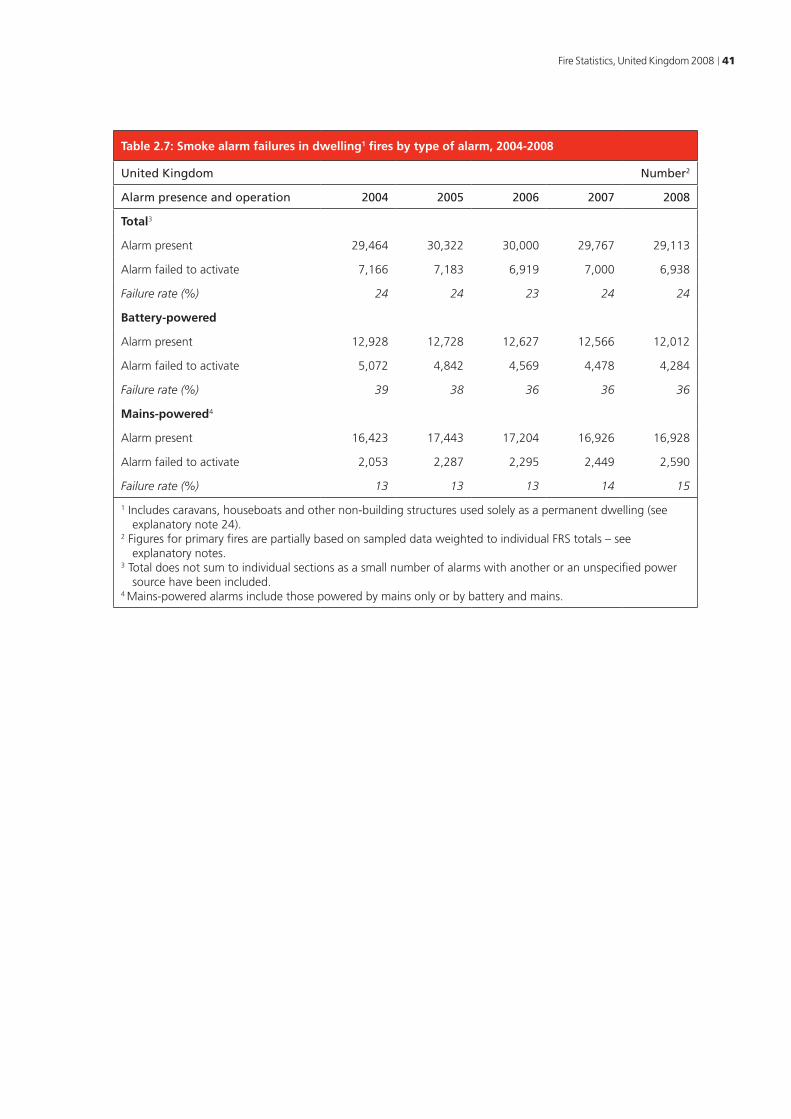
2.31 In those dwelling fires where a smoke alarm was present, 24 per cent of alarms in 2008 failed to operate. However, this overall figure masks a wide difference in performance between battery-powered alarms and mains-powered alarms: 36 per cent of all battery-powered smoke alarms failed compared to just 15 per cent of mains-powered alarms in 2008.
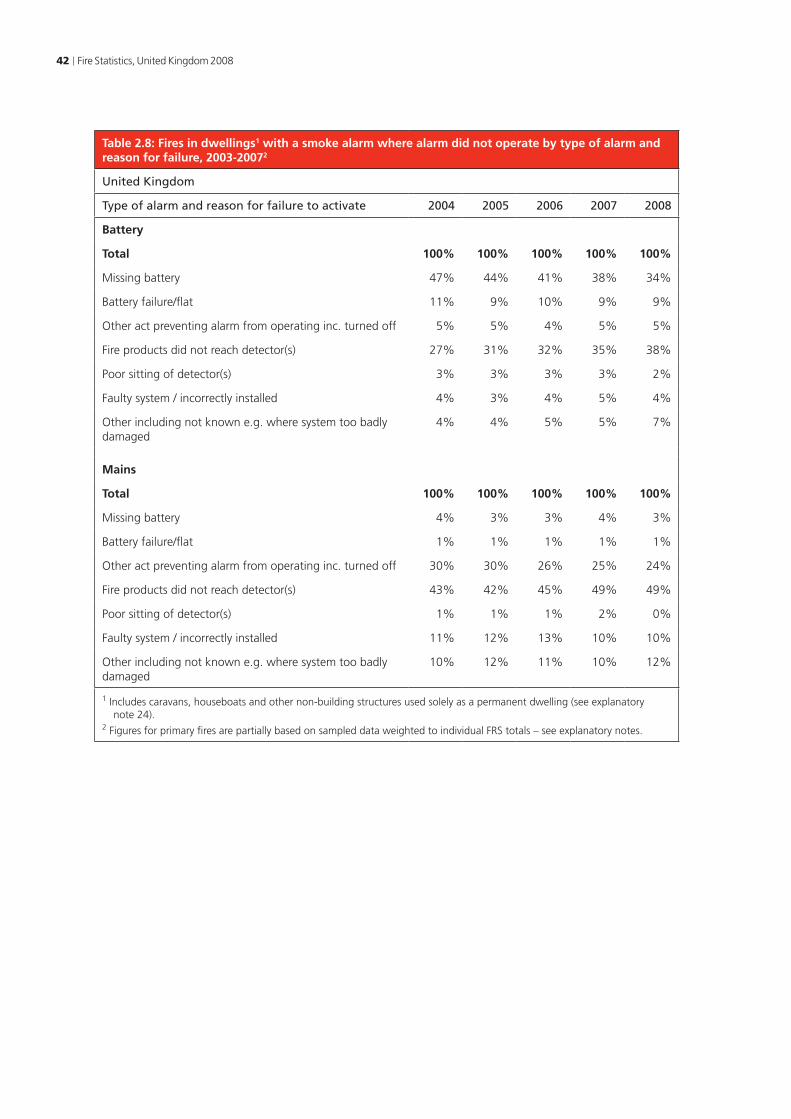
2.32 The main reason for smoke alarms failing to activate in battery-powered alarms was missing or flat batteries. In 2008 they accounted for 43 per cent of all failures in battery-powered alarms. The main reason for failure to activate by mains-powered alarms was that the fire products did not reach the detectors (49% of cases).
2.33 The smoke alarm operated but did not raise the alarm in 3,700 fires in 2008, slightly more than in 2007. The main reasons were that a person raised the alarm before the smoke alarm operated (58%) or there was no person within earshot of the alarm (20%).
Fire Statistics, United Kingdom 2008 41
Table 2.7: Smoke alarm failures in dwelling1 fires by type of alarm, 2004-2008
United Kingdom Number2
Alarm presence and operation 2004 2005 2006 2007 2008
Total3
Alarm present 29,464 30,322 30,000 29,767 29,113
Alarm failed to activate 7,166 7,183 6,919 7,000 6,938
Failure rate (%) 24 24 23 24 24
Battery-powered
Alarm present 12,928 12,728 12,627 12,566 12,012
Alarm failed to activate 5,072 4,842 4,569 4,478 4,284
Failure rate (%) 39 38 36 36 36
Mains-powered4
Alarm present 16,423 17,443 17,204 16,926 16,928
Alarm failed to activate 2,053 2,287 2,295 2,449 2,590
Failure rate (%) 13 13 13 14 15
1 Includes caravans, houseboats and other non-building structures used solely as a permanent dwelling (see explanatory note 24).
2 Figures for primary fires are partially based on sampled data weighted to individual FRS totals – see explanatory notes.
3 Total does not sum to individual sections as a small number of alarms with another or an unspecified power source have been included.
4 Mains-powered alarms include those powered by mains only or by battery and mains.
42 Fire Statistics, United Kingdom 2008
Table 2.8: Fires in dwellings1 with a smoke alarm where alarm did not operate by type of alarm and reason for failure, 2003-20072
United Kingdom
Type of alarm and reason for failure to activate 2004 2005 2006 2007 2008
Battery
Total 100% 100% 100% 100% 100%
Missing battery 47% 44% 41% 38% 34%
Battery failure/flat 11% 9% 10% 9% 9%
Other act preventing alarm from operating inc. turned off 5% 5% 4% 5% 5%
Fire products did not reach detector(s) 27% 31% 32% 35% 38%
Poor sitting of detector(s) 3% 3% 3% 3% 2%
Faulty system / incorrectly installed 4% 3% 4% 5% 4%
Other including not known e.g. where system too badly damaged
4% 4% 5% 5% 7%
Mains
Total 100% 100% 100% 100% 100%
Missing battery 4% 3% 3% 4% 3%
Battery failure/flat 1% 1% 1% 1% 1%
Other act preventing alarm from operating inc. turned off 30% 30% 26% 25% 24%
Fire products did not reach detector(s) 43% 42% 45% 49% 49%
Poor sitting of detector(s) 1% 1% 1% 2% 0%
Faulty system / incorrectly installed 11% 12% 13% 10% 10%
Other including not known e.g. where system too badly damaged
10% 12% 11% 10% 12%
1 Includes caravans, houseboats and other non-building structures used solely as a permanent dwelling (see explanatory note 24).
2 Figures for primary fires are partially based on sampled data weighted to individual FRS totals – see explanatory notes.
Fire Statistics, United Kingdom 2008 43
Table 2.9: Fires in dwellings1 with a smoke alarm where alarm operated but did not raise the alarm by reason, 2004-20082
United Kingdom Percentage
Reason 2004 2005 2006 2007 2008
Total 100% 100% 100% 100% 100%
Person raised the alarm before system operated 53% 52% 55% 58% 58%
No person in earshot 24% 23% 21% 22% 20%
Poor sitting of detectors meant person raised alarm 2% 2% 2% 2% 1%
Occupants failed to respond 11% 11% 11% 10% 11%
Faulty system inc. incorrectly installed 1% 2% 1% 1% 1%
Other including not known e.g. where system too badly damaged
9% 10% 9% 9% 10%
1 Includes caravans, houseboats and other non-building structures used solely as a permanent dwelling (see explanatory note 24).
2 Figures for primary fires are partially based on sampled data weighted to individual FRS totals – see explanatory notes.
Deliberate fires (Tables 2 and 24)
2.34 Approximately 17 per cent of all dwelling fires in 2008 were deliberate or suspected to be deliberately started. The number of deliberate dwelling fires fell for the seventh consecutive year – down by 11 per cent to 8,300 from 9,400 in 2007. Of the total 53,000 deliberate fires in 2008, only 16 per cent were in dwellings. The majority of deliberate fires in 2008 (55%) involved road vehicles – 29,400 fires (see Chapter 4 for further details).
2.35 A large proportion of all deliberate dwelling fires in 2008 occurred in multiple occupancy dwellings (45%), 40% occurred in single occupancy dwellings and the remaining 15 per cent were in dwellings of other or unspecified occupancy.
2.36 In total there were 93 fatalities in deliberate fires in 2008, 14 less than in 2007). The majority of these occurred in dwelling fires, 59 in 2008 – down from 64 in 2007. This represents 17 per cent of the total deaths in dwelling fires – two percent less than the decade high figure in 2007.
2.37 There were a total of 2,200 non-fatal casualties as a result of deliberate fires in 2008 – 13 per cent less than the previous year. The majority of these injuries occurred in deliberate dwelling fires (72%) a little less than in 2007. Just 16 per cent of the total number of non-fatal casualties in dwelling fires occurred in deliberate fires – nearly the same as in 2007.
44 Fire Statistics, United Kingdom 2008
Fire spread (Table 4)
2.38 Most dwelling fires were confined to the room of origin and did not spread elsewhere in the building (85% in 2008). Of these, 48 per cent were confined to the item first ignited. These proportions have remained fairly constant over the last decade.
Time of call to the fire and rescue service (Table 2.10)
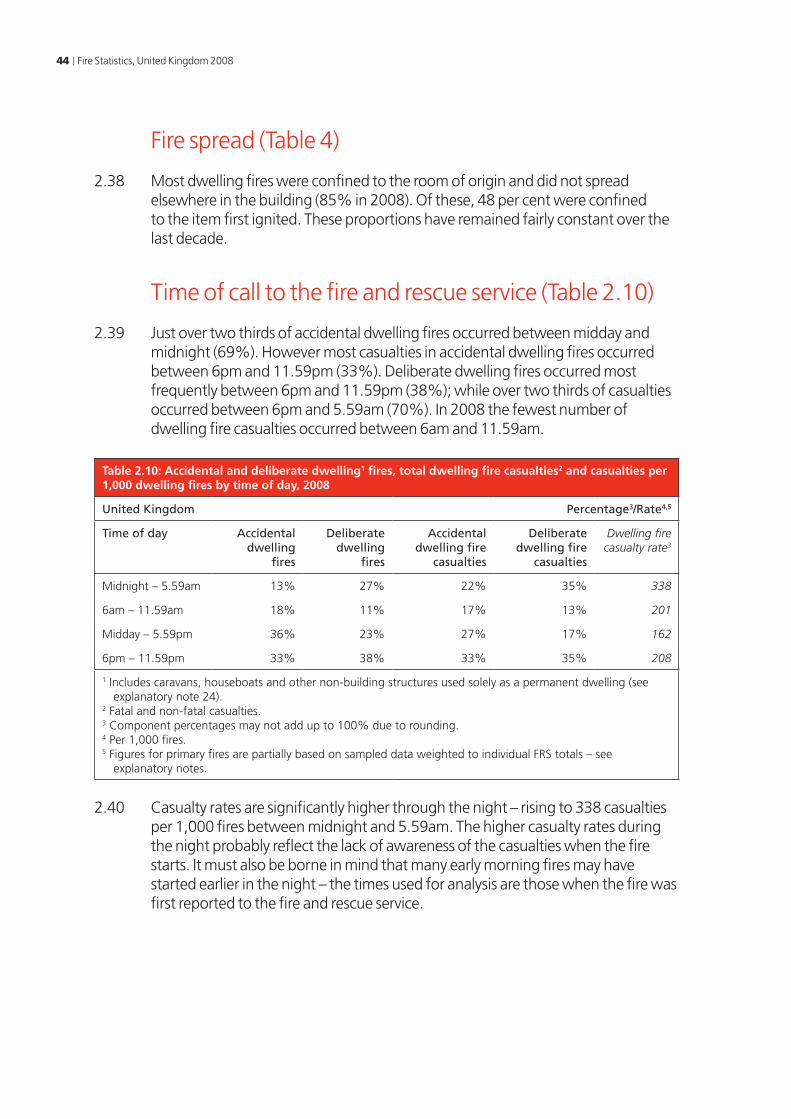
2.39 Just over two thirds of accidental dwelling fires occurred between midday and midnight (69%). However most casualties in accidental dwelling fires occurred between 6pm and 11.59pm (33%). Deliberate dwelling fires occurred most frequently between 6pm and 11.59pm (38%); while over two thirds of casualties occurred between 6pm and 5.59am (70%). In 2008 the fewest number of dwelling fire casualties occurred between 6am and 11.59am.
Table 2.10: Accidental and deliberate dwelling1 fires, total dwelling fire casualties2 and casualties per 1,000 dwelling fires by time of day, 2008
United Kingdom Percentage3/Rate4,5
Time of day Accidental dwelling
fires
Deliberate dwelling
fires
Accidental dwelling fire
casualties
Deliberate dwelling fire
casualties
Dwelling fire casualty rate3
Midnight – 5.59am 13% 27% 22% 35% 338
6am – 11.59am 18% 11% 17% 13% 201
Midday – 5.59pm 36% 23% 27% 17% 162
6pm – 11.59pm 33% 38% 33% 35% 208
1 Includes caravans, houseboats and other non-building structures used solely as a permanent dwelling (see explanatory note 24).
2 Fatal and non-fatal casualties.3 Component percentages may not add up to 100% due to rounding.4 Per 1,000 fires.5 Figures for primary fires are partially based on sampled data weighted to individual FRS totals – see
explanatory notes.
2.40 Casualty rates are significantly higher through the night – rising to 338 casualties per 1,000 fires between midnight and 5.59am. The higher casualty rates during the night probably reflect the lack of awareness of the casualties when the fire starts. It must also be borne in mind that many early morning fires may have started earlier in the night – the times used for analysis are those when the fire was first reported to the fire and rescue service.
Fire Statistics, United Kingdom 2008 45
Chapter 3
Other buildings
Introduction (Tables 1b, 2 and 6)
3.1 In 2008 there were 27,500 fires recorded in buildings other than dwellings, 11 per cent less (3,500 fires) than the previous year. This follows consecutive falls between 2003 and 2007 and follows the general downward trend since 1995. The majority of fires occurred in:
• private garages and sheds (21%) – 5,800 fires
• retail distribution (13%) – 3,700 fires
• restaurants, cafes, public houses etc (10%) – 2,600 fires
• industrial premises (other than construction) (6%) – 1,800 fires
• recreational and other cultural services (5%) – 1,400 fires.
3.2 In 2008, 21 people died in buildings other than dwellings – 15 less than in 2007. Also in fires in other buildings, 1,200 injuries were sustained in 2008 (a decrease of 8% compared with 2007). These figures represent around 5 per cent of all fire deaths and 10 per cent of non-fatal casualties.
Accidental fires (Table 2)
Trends
3.3 Over half of fires in other buildings were started accidentally (around 60% compared to over 80% of those in dwellings). In 2008, a total of 17,500 accidental fires in other buildings were recorded, 8 per cent less than in 2007. The general trend in such fires over the last ten years has been downward, with the 2008 figure nearly 33 per cent lower than the 1995 figure of 26,000.
Cause of fire
3.4 As in the previous year, the main cause of accidental fires in other buildings in 2008 was faulty appliances and leads. These represented 34% of all such fires, a total of 6,000 fires – a similar proportion to 2007 (6,000). There was an 16% fall in the number of fires caused by misuse of equipment or appliances, down to 2,700 fires. Other key changes in the causes of accidental fire in other buildings were:
• chip/fat pan fires – decreased by 10 per cent to 452
• playing with fire – increased by 12 per cent to 47.
46 Fire Statistics, United Kingdom 2008
Source of ignition (Table 3)
3.5 Around half of accidental fires in other buildings were started by either electrical appliances (5,100 fires) or by cooking appliances (3,300 fires). The number of fires started by electrical appliances was down 9% on the previous year, while cooking appliance fires fell by 11 per cent. Other key changes relating to source of ignition from 2007 were:
• smokers’ materials – decreased by 18 per cent to 1,000, while fires started by matches increased by 22 per cent to 107
• candle fires – decreased by 18% to 141
• electrical distribution (leads to appliances, wires and cables) – decreased by 2 per cent to 2,400.
Deliberate fires (Tables 2 and 24, Figure 3.1)
Trends
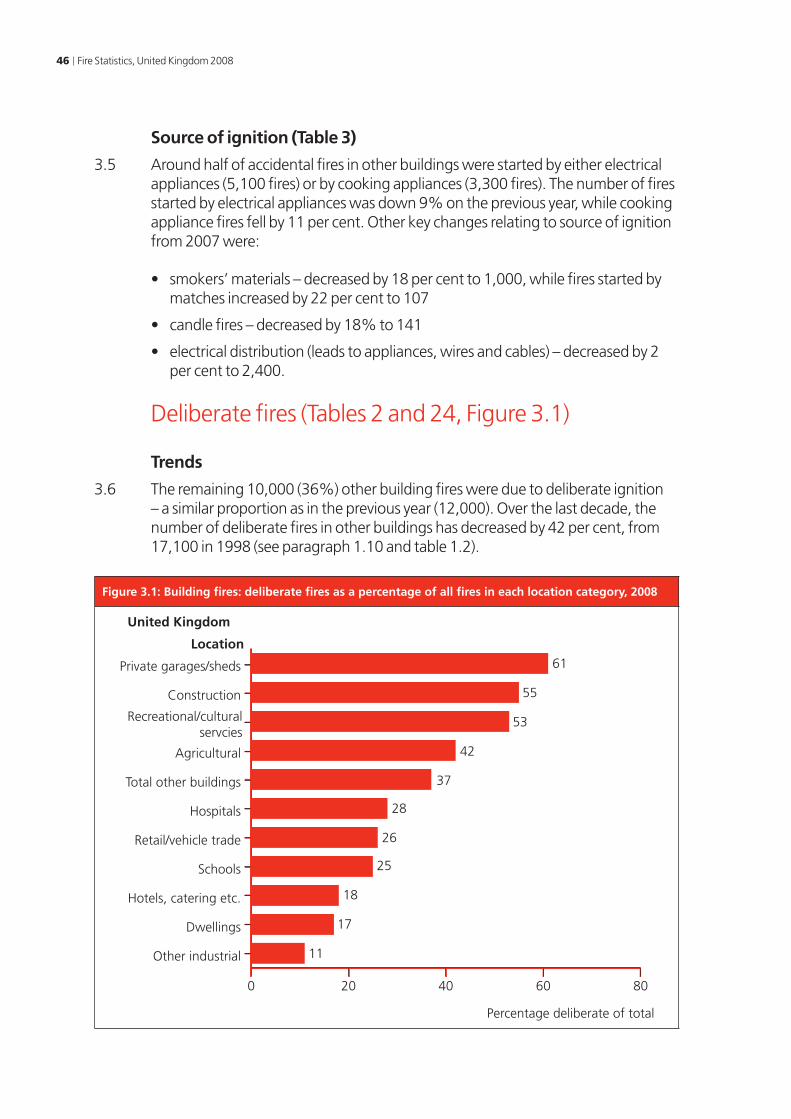
3.6 The remaining 10,000 (36%) other building fires were due to deliberate ignition – a similar proportion as in the previous year (12,000). Over the last decade, the number of deliberate fires in other buildings has decreased by 42 per cent, from 17,100 in 1998 (see paragraph 1.10 and table 1.2).
Figure 3.1: Building fires: deliberate fires as a percentage of all fires in each location category, 2008
0 20 40 60 80
61
55
53
42
37
28
26
25
18
17
11
Percentage deliberate of total
Other industrial
Dwellings
Hotels, catering etc.
Schools
Retail/vehicle trade
Hospitals
Total other buildings
Agricultural
Recreational/culturalservcies
Construction
Private garages/sheds
United Kingdom
Location
Fire Statistics, United Kingdom 2008 47
Location (Figure 3.1)
3.7 A comparison of the number of deliberate fires in other building locations with the total fires experienced shows that certain buildings are more prone to deliberate ignition than others. The main locations in 2008 were private garages and sheds (61% deliberate); construction industry premises (55%); recreational and other cultural services premises (53%); and agriculture (42%).
Casualties (Table 22 and Figure 3.2)
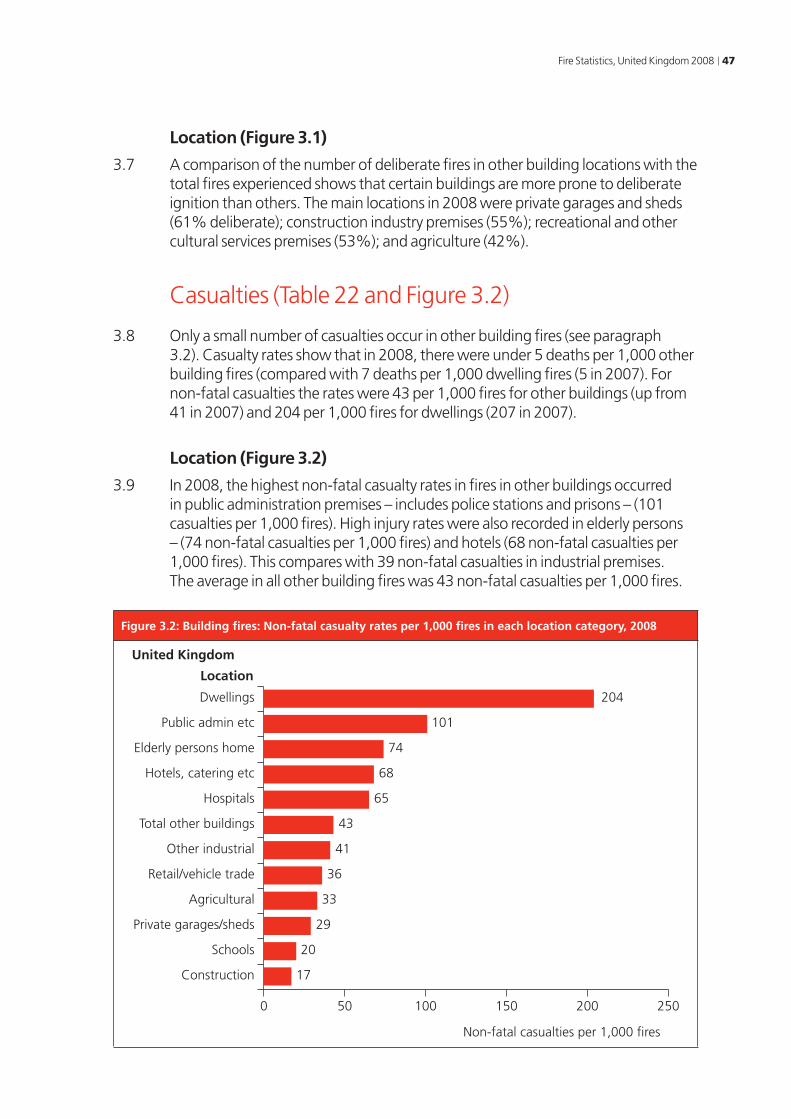
3.8 Only a small number of casualties occur in other building fires (see paragraph 3.2). Casualty rates show that in 2008, there were under 5 deaths per 1,000 other building fires (compared with 7 deaths per 1,000 dwelling fires (5 in 2007). For non-fatal casualties the rates were 43 per 1,000 fires for other buildings (up from 41 in 2007) and 204 per 1,000 fires for dwellings (207 in 2007).
Location (Figure 3.2)
3.9 In 2008, the highest non-fatal casualty rates in fires in other buildings occurred in public administration premises – includes police stations and prisons – (101 casualties per 1,000 fires). High injury rates were also recorded in elderly persons – (74 non-fatal casualties per 1,000 fires) and hotels (68 non-fatal casualties per 1,000 fires). This compares with 39 non-fatal casualties in industrial premises. The average in all other building fires was 43 non-fatal casualties per 1,000 fires.
Figure 3.2: Building fires: Non-fatal casualty rates per 1,000 fires in each location category, 2008
Construction
Schools
Private garages/sheds
Agricultural
Retail/vehicle trade
Other industrial
Total other buildings
Hospitals
Hotels, catering etc
Elderly persons home
Public admin etc
Dwellings
0 50 100 150 200 250
Non-fatal casualties per 1,000 fires
United Kingdom
Location
17
20
29
33
36
41
43
65
68
74
101
204
48 Fire Statistics, United Kingdom 2008
Automatic fire detector analyses (Tables 3.1 to 3.3, Figure 3.3)
Introduction
3.10 This section looks at the effectiveness of automatic fire detectors and the likely causes of failure on those occasions when detectors did not operate. The assessment and analysis presented here is based (as elsewhere in this report) on fires attended by the fire and rescue service. Any fires involving detectors where no emergency call was made will not be recorded, meaning that effectiveness of automatic fire detectors may be understated. See paragraph 2.26 for further details in relation to domestic smoke alarms.
Table 3.1: Fires and casualties from fires in other buildings by presence and operation of automatic fire detectors, 2004-2008
United Kingdom Number
Presence and operation of automatic fire detectors
Present, operated &
raised the alarm
Present, operated, but did not raise
the alarm
Present, but did not
operateAbsent Unspecified Total
Fires1
2004 10,156 955 2,579 23,892 - 37,582
2005 10,019 983 2,519 21,727 2 35,250
2006 9,275 979 2,437 20,235 - 32,926
2007 8,295 1,016 2,484 19,159 11 30,965
2008 7,867 988 3,706 14,886 6 27,453
Fatal casualties2
2004 28 - 1 26 - 55
2005 8 1 1 17 - 27
2006 11 2 - 24 - 37
2007 12 1 2 21 - 36
2008 8 - 2 11 - 21
Non-fatal casualties3
2004 498 77 116 828 - 1,519
2005 471 93 96 741 - 1,400
2006 514 65 164 739 - 1,482
2007 468 62 89 663 - 1,282
2008 373 55 183 574 - 1,185
1 Figures for primary fires are partially based on sampled data weighted to individual FRS totals – see explanatory notes.
2 Includes fire-related deaths recorded by the MOD and media with estimates calculated for the breakdown by alarm presence in January and February 2003 during industrial action (see explanatory notes 3 and 4).
3 Includes estimates for non-fatal casualties not recorded in January and February 2003 during industrial action (see explanatory notes 3 and 4).
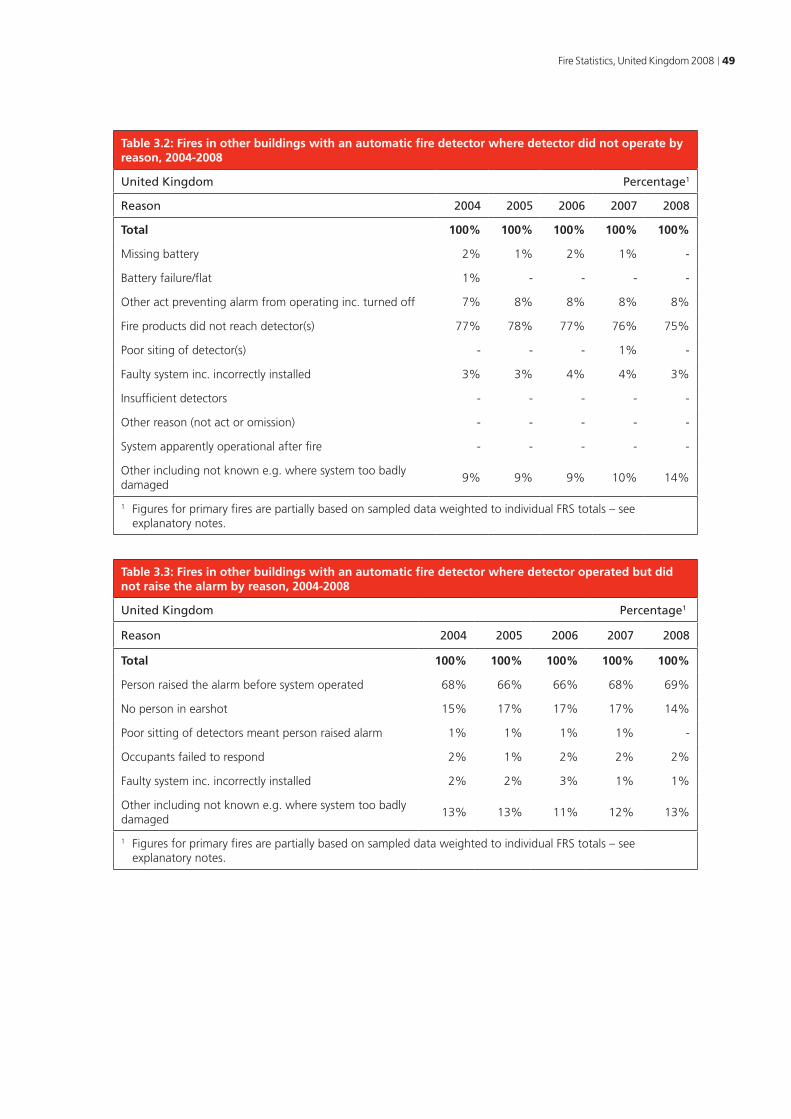
Fire Statistics, United Kingdom 2008 49
Table 3.2: Fires in other buildings with an automatic fire detector where detector did not operate by reason, 2004-2008
United Kingdom Percentage1
Reason 2004 2005 2006 2007 2008
Total 100% 100% 100% 100% 100%
Missing battery 2% 1% 2% 1% -
Battery failure/flat 1% - - - -
Other act preventing alarm from operating inc. turned off 7% 8% 8% 8% 8%
Fire products did not reach detector(s) 77% 78% 77% 76% 75%
Poor siting of detector(s) - - - 1% -
Faulty system inc. incorrectly installed 3% 3% 4% 4% 3%
Insufficient detectors - - - - -
Other reason (not act or omission) - - - - -
System apparently operational after fire - - - - -
Other including not known e.g. where system too badly damaged
9% 9% 9% 10% 14%
1 Figures for primary fires are partially based on sampled data weighted to individual FRS totals – see explanatory notes.
Table 3.3: Fires in other buildings with an automatic fire detector where detector operated but did not raise the alarm by reason, 2004-2008
United Kingdom Percentage1
Reason 2004 2005 2006 2007 2008
Total 100% 100% 100% 100% 100%
Person raised the alarm before system operated 68% 66% 66% 68% 69%
No person in earshot 15% 17% 17% 17% 14%
Poor sitting of detectors meant person raised alarm 1% 1% 1% 1% -
Occupants failed to respond 2% 1% 2% 2% 2%
Faulty system inc. incorrectly installed 2% 2% 3% 1% 1%
Other including not known e.g. where system too badly damaged
13% 13% 11% 12% 13%
1 Figures for primary fires are partially based on sampled data weighted to individual FRS totals – see explanatory notes.
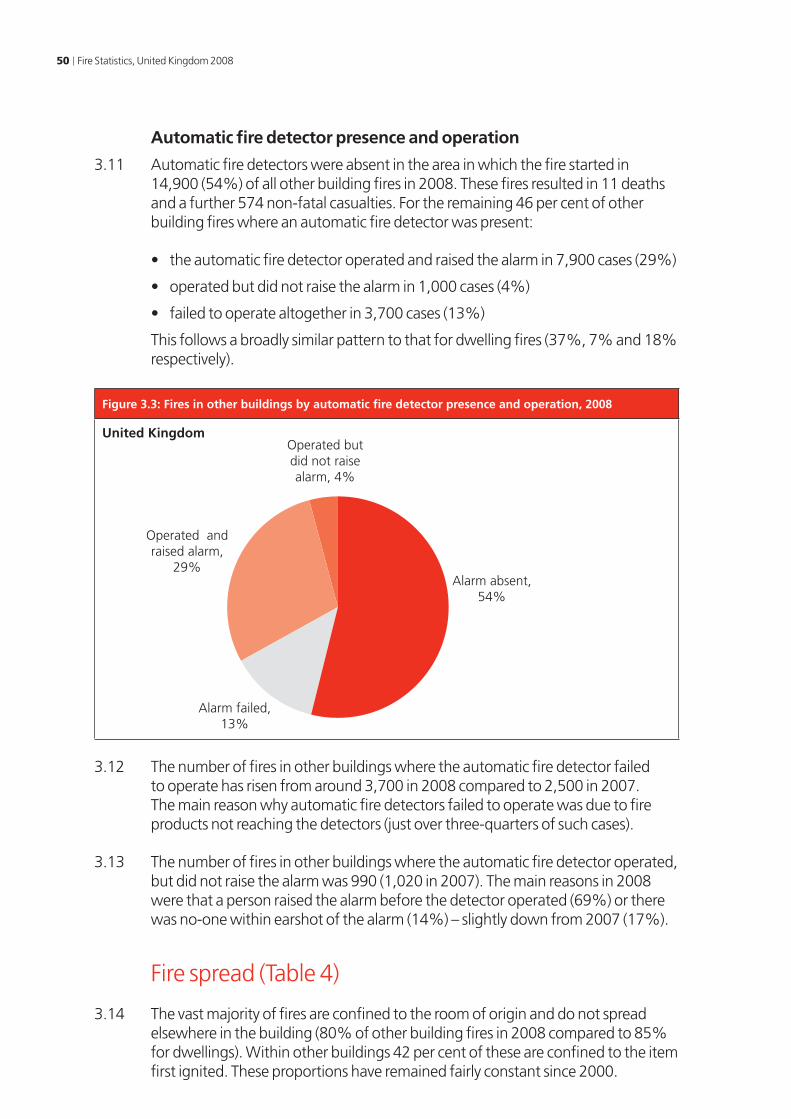
50 Fire Statistics, United Kingdom 2008
Automatic fire detector presence and operation
3.11 Automatic fire detectors were absent in the area in which the fire started in 14,900 (54%) of all other building fires in 2008. These fires resulted in 11 deaths and a further 574 non-fatal casualties. For the remaining 46 per cent of other building fires where an automatic fire detector was present:
• the automatic fire detector operated and raised the alarm in 7,900 cases (29%)
• operated but did not raise the alarm in 1,000 cases (4%)
• failed to operate altogether in 3,700 cases (13%)
This follows a broadly similar pattern to that for dwelling fires (37%, 7% and 18% respectively).
Figure 3.3: Fires in other buildings by automatic fire detector presence and operation, 2008
United Kingdom
Operated andraised alarm,
29%
Operated butdid not raisealarm, 4%
Alarm absent,54%
Alarm failed,13%
3.12 The number of fires in other buildings where the automatic fire detector failed to operate has risen from around 3,700 in 2008 compared to 2,500 in 2007. The main reason why automatic fire detectors failed to operate was due to fire products not reaching the detectors (just over three-quarters of such cases).
3.13 The number of fires in other buildings where the automatic fire detector operated, but did not raise the alarm was 990 (1,020 in 2007). The main reasons in 2008 were that a person raised the alarm before the detector operated (69%) or there was no-one within earshot of the alarm (14%) – slightly down from 2007 (17%).
Fire spread (Table 4)
3.14 The vast majority of fires are confined to the room of origin and do not spread elsewhere in the building (80% of other building fires in 2008 compared to 85% for dwellings). Within other buildings 42 per cent of these are confined to the item first ignited. These proportions have remained fairly constant since 2000.
Fire Statistics, United Kingdom 2008 51
Chapter 4
Road vehicle fires
Introduction (Table 16)
4.1 Road vehicle fires totalled 44,600 in 2008, of which 34,600 (78%) were in cars, 3,500 (8%) were in vans and 1,500 (3%) were in lorries. The total number of fires recorded in road vehicles decreased by 12% compared with 2007. The 2008 total represents the lowest in the decade – mainly due to a 56% fall in accidental fires in road vehicles since 1998.
Car fires by cause of fire (Table 15 and Figures 4.1)
4.2 In 2008, the total number of car fires fell for the seventh successive year – decreasing by 13 per cent to 34,600 from 39,800 in 2007. This sharp fall follows a rapid rise in car fires in previous years due to a significant increase in the number of deliberate fires. Deliberate fires now account for 67 per cent of all car fires, this compares with 66 per cent a decade earlier. However, the latest figure (23,200 deliberate car fires) shows another annual fall since the peak of 70,200 in 2001.
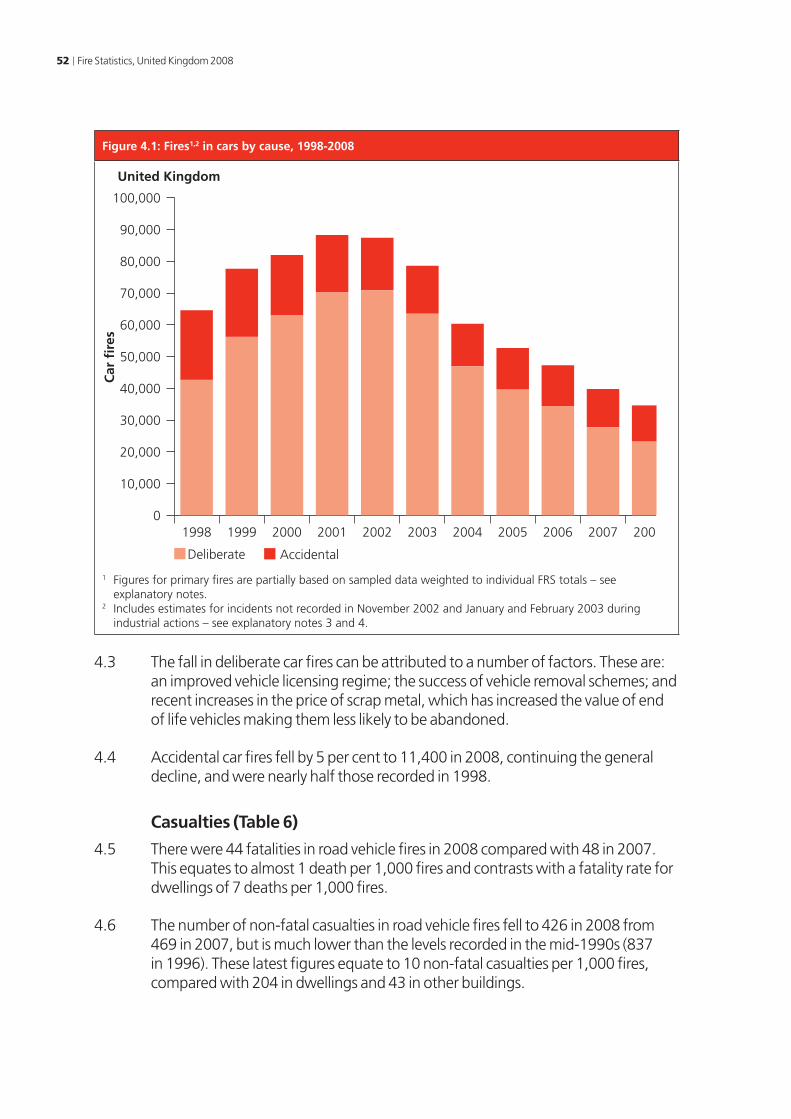
52 Fire Statistics, United Kingdom 2008
Figure 4.1: Fires1,2 in cars by cause, 1998-2008
0
10,000
20,000
30,000
40,000
50,000
60,000
70,000
80,000
90,000
100,000
AccidentalDeliberate
20082007200620052004200320022001200019991998
United Kingdom
Car
fire
s
1 Figures for primary fires are partially based on sampled data weighted to individual FRS totals – see explanatory notes.
2 Includes estimates for incidents not recorded in November 2002 and January and February 2003 during industrial actions – see explanatory notes 3 and 4.
4.3 The fall in deliberate car fires can be attributed to a number of factors. These are: an improved vehicle licensing regime; the success of vehicle removal schemes; and recent increases in the price of scrap metal, which has increased the value of end of life vehicles making them less likely to be abandoned.
4.4 Accidental car fires fell by 5 per cent to 11,400 in 2008, continuing the general decline, and were nearly half those recorded in 1998.
Casualties (Table 6)
4.5 There were 44 fatalities in road vehicle fires in 2008 compared with 48 in 2007. This equates to almost 1 death per 1,000 fires and contrasts with a fatality rate for dwellings of 7 deaths per 1,000 fires.
4.6 The number of non-fatal casualties in road vehicle fires fell to 426 in 2008 from 469 in 2007, but is much lower than the levels recorded in the mid-1990s (837 in 1996). These latest figures equate to 10 non-fatal casualties per 1,000 fires, compared with 204 in dwellings and 43 in other buildings.
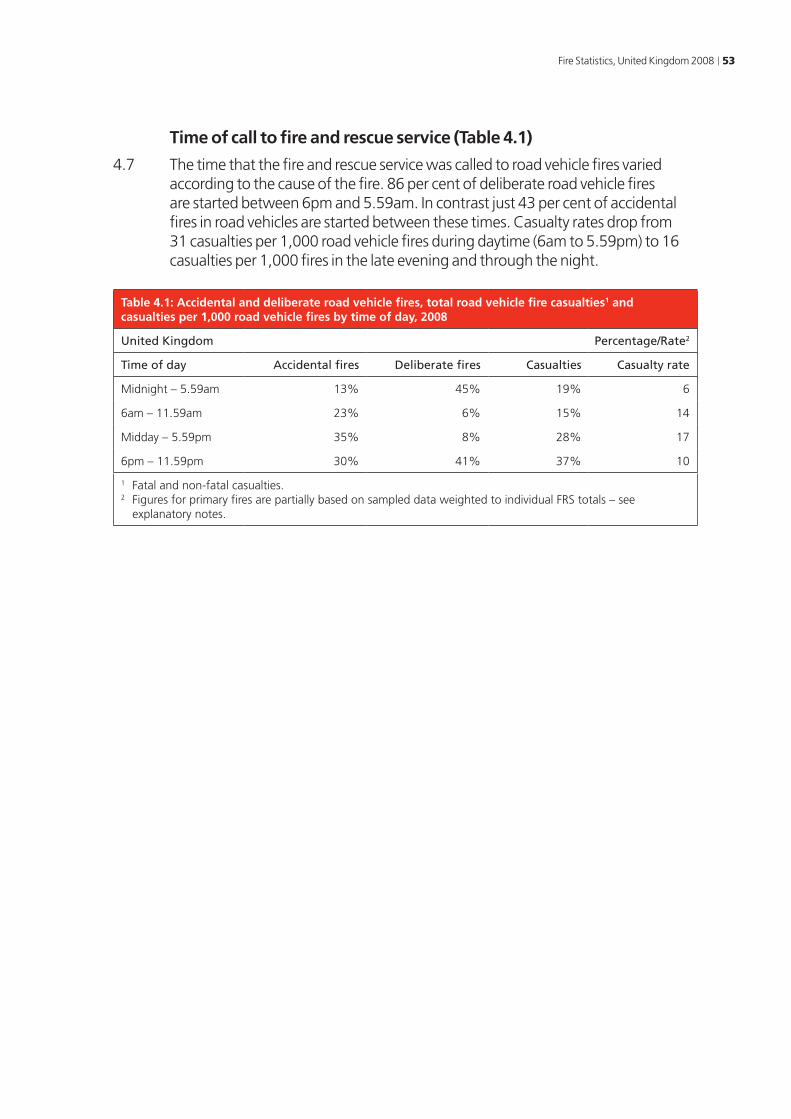
Fire Statistics, United Kingdom 2008 53
Time of call to fire and rescue service (Table 4.1)
4.7 The time that the fire and rescue service was called to road vehicle fires varied according to the cause of the fire. 86 per cent of deliberate road vehicle fires are started between 6pm and 5.59am. In contrast just 43 per cent of accidental fires in road vehicles are started between these times. Casualty rates drop from 31 casualties per 1,000 road vehicle fires during daytime (6am to 5.59pm) to 16 casualties per 1,000 fires in the late evening and through the night.
Table 4.1: Accidental and deliberate road vehicle fires, total road vehicle fire casualties1 and casualties per 1,000 road vehicle fires by time of day, 2008
United Kingdom Percentage/Rate2
Time of day Accidental fires Deliberate fires Casualties Casualty rate
Midnight – 5.59am 13% 45% 19% 6
6am – 11.59am 23% 6% 15% 14
Midday – 5.59pm 35% 8% 28% 17
6pm – 11.59pm 30% 41% 37% 10
1 Fatal and non-fatal casualties. 2 Figures for primary fires are partially based on sampled data weighted to individual FRS totals – see
explanatory notes.
54 Fire Statistics, United Kingdom 2008
Chapter 5
Outdoor fires
Introduction (Tables 1c, 5 and 5.1)
5.1 Primary and secondary outdoor fires totalled 240,000 in 2008. Of which 125,500 (52%) were refuse fires (including bonfires, fires in derelict vehicles and refuse containers), 44,100 (18%) were grassland and heathland fires, 44,600 (19%) were road vehicle fires and 25,800 (11%) were other outdoor structures (including derelict buildings). Further details on road vehicle fires are given in Chapter 4. The remainder of this chapter mainly covers other types of outdoor fires.
5.2 Relatively few casualties occur in outdoor fires, other than road vehicle fires. In 2008 there were 33 fire related deaths, and 481 non-fatal casualties in outdoor fires (excluding road vehicle fires), amounting to around four deaths and 54 non-fatal casualties per 1,000 outdoor fires.
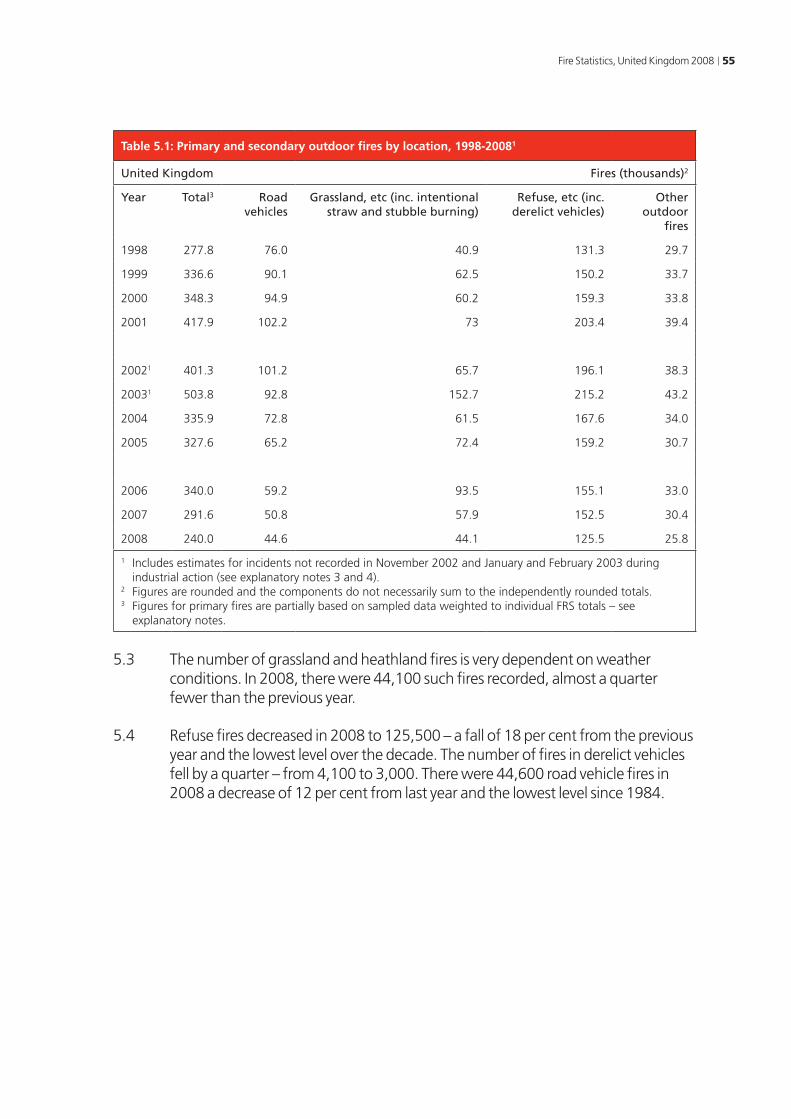
Fire Statistics, United Kingdom 2008 55
Table 5.1: Primary and secondary outdoor fires by location, 1998-20081
United Kingdom Fires (thousands)2
Year Total3 Road vehicles
Grassland, etc (inc. intentional straw and stubble burning)
Refuse, etc (inc.derelict vehicles)
Other outdoor
fires
1998 277.8 76.0 40.9 131.3 29.7
1999 336.6 90.1 62.5 150.2 33.7
2000 348.3 94.9 60.2 159.3 33.8
2001 417.9 102.2 73 203.4 39.4
20021 401.3 101.2 65.7 196.1 38.3
20031 503.8 92.8 152.7 215.2 43.2
2004 335.9 72.8 61.5 167.6 34.0
2005 327.6 65.2 72.4 159.2 30.7
2006 340.0 59.2 93.5 155.1 33.0
2007 291.6 50.8 57.9 152.5 30.4
2008 240.0 44.6 44.1 125.5 25.8
1 Includes estimates for incidents not recorded in November 2002 and January and February 2003 during industrial action (see explanatory notes 3 and 4).
2 Figures are rounded and the components do not necessarily sum to the independently rounded totals.3 Figures for primary fires are partially based on sampled data weighted to individual FRS totals – see
explanatory notes.
5.3 The number of grassland and heathland fires is very dependent on weather conditions. In 2008, there were 44,100 such fires recorded, almost a quarter fewer than the previous year.
5.4 Refuse fires decreased in 2008 to 125,500 – a fall of 18 per cent from the previous year and the lowest level over the decade. The number of fires in derelict vehicles fell by a quarter – from 4,100 to 3,000. There were 44,600 road vehicle fires in 2008 a decrease of 12 per cent from last year and the lowest level since 1984.
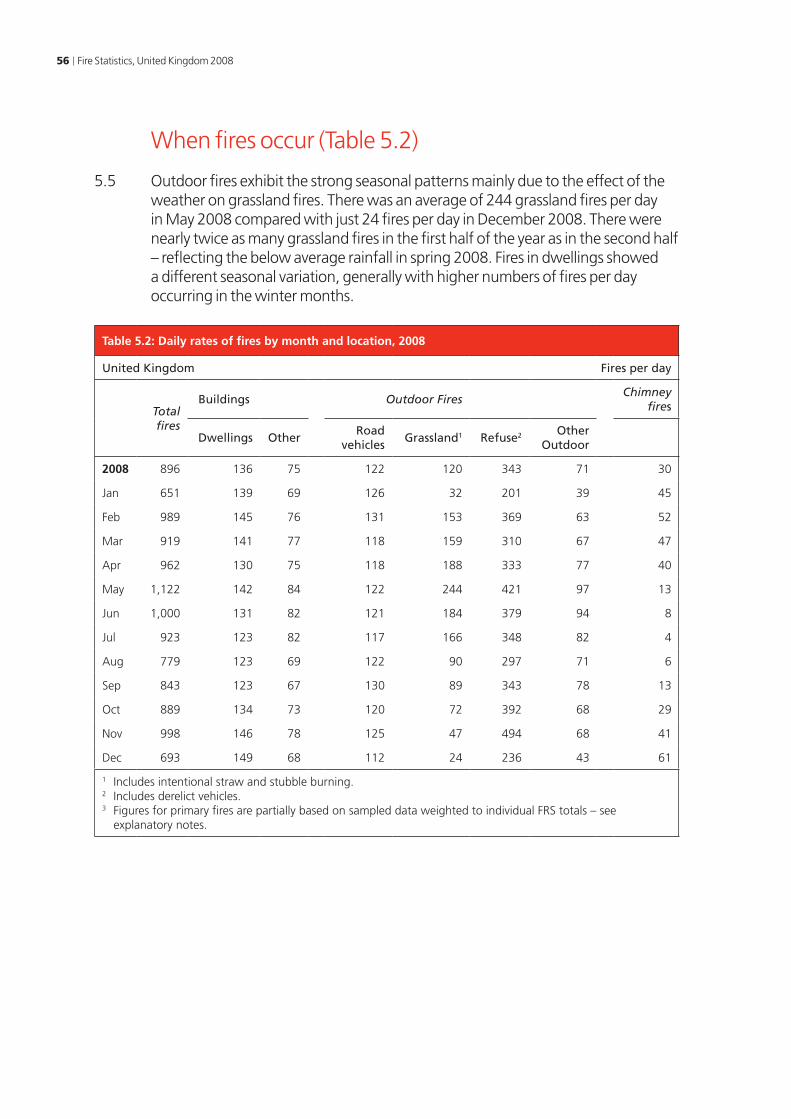
56 Fire Statistics, United Kingdom 2008
When fires occur (Table 5.2)
5.5 Outdoor fires exhibit the strong seasonal patterns mainly due to the effect of the weather on grassland fires. There was an average of 244 grassland fires per day in May 2008 compared with just 24 fires per day in December 2008. There were nearly twice as many grassland fires in the first half of the year as in the second half – reflecting the below average rainfall in spring 2008. Fires in dwellings showed a different seasonal variation, generally with higher numbers of fires per day occurring in the winter months.
Table 5.2: Daily rates of fires by month and location, 2008
United Kingdom Fires per day
Total fires
Buildings Outdoor Fires Chimney
fires
Dwellings Other Road
vehiclesGrassland1 Refuse2 Other
Outdoor
2008 896 136 75 122 120 343 71 30
Jan 651 139 69 126 32 201 39 45
Feb 989 145 76 131 153 369 63 52
Mar 919 141 77 118 159 310 67 47
Apr 962 130 75 118 188 333 77 40
May 1,122 142 84 122 244 421 97 13
Jun 1,000 131 82 121 184 379 94 8
Jul 923 123 82 117 166 348 82 4
Aug 779 123 69 122 90 297 71 6
Sep 843 123 67 130 89 343 78 13
Oct 889 134 73 120 72 392 68 29
Nov 998 146 78 125 47 494 68 41
Dec 693 149 68 112 24 236 43 61
1 Includes intentional straw and stubble burning.2 Includes derelict vehicles.3 Figures for primary fires are partially based on sampled data weighted to individual FRS totals – see
explanatory notes.
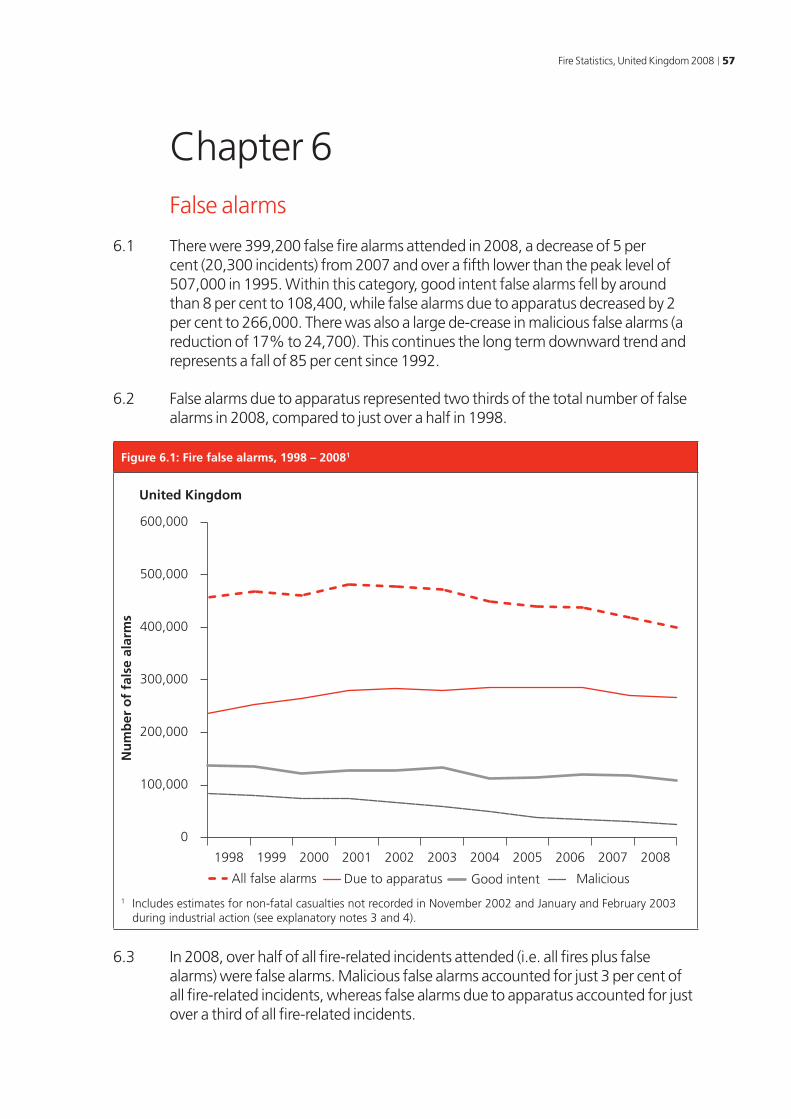
Fire Statistics, United Kingdom 2008 57
Chapter 6False alarms
6.1 There were 399,200 false fire alarms attended in 2008, a decrease of 5 per cent (20,300 incidents) from 2007 and over a fifth lower than the peak level of 507,000 in 1995. Within this category, good intent false alarms fell by around than 8 per cent to 108,400, while false alarms due to apparatus decreased by 2 per cent to 266,000. There was also a large de-crease in malicious false alarms (a reduction of 17% to 24,700). This continues the long term downward trend and represents a fall of 85 per cent since 1992.
6.2 False alarms due to apparatus represented two thirds of the total number of false alarms in 2008, compared to just over a half in 1998.
Figure 6.1: Fire false alarms, 1998 – 20081
0
100,000
200,000
300,000
400,000
500,000
600,000
MaliciousGood intentDue to apparatusAll false alarms
20082007200620052004200320022001200019991998
United Kingdom
Nu
mb
er o
f fa
lse
alar
ms
1 Includes estimates for non-fatal casualties not recorded in November 2002 and January and February 2003 during industrial action (see explanatory notes 3 and 4).
6.3 In 2008, over half of all fire-related incidents attended (i.e. all fires plus false alarms) were false alarms. Malicious false alarms accounted for just 3 per cent of all fire-related incidents, whereas false alarms due to apparatus accounted for just over a third of all fire-related incidents.
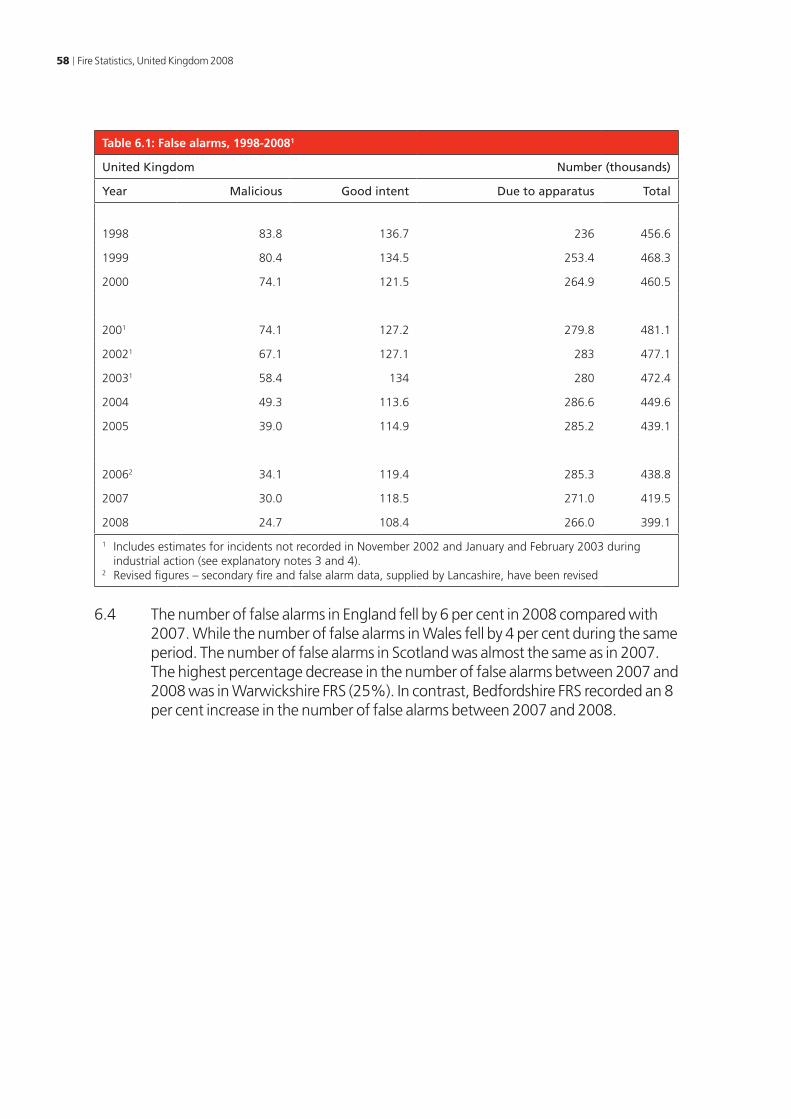
58 Fire Statistics, United Kingdom 2008
Table 6.1: False alarms, 1998-20081
United Kingdom Number (thousands)
Year Malicious Good intent Due to apparatus Total
1998 83.8 136.7 236 456.6
1999 80.4 134.5 253.4 468.3
2000 74.1 121.5 264.9 460.5
2001 74.1 127.2 279.8 481.1
20021 67.1 127.1 283 477.1
20031 58.4 134 280 472.4
2004 49.3 113.6 286.6 449.6
2005 39.0 114.9 285.2 439.1
20062 34.1 119.4 285.3 438.8
2007 30.0 118.5 271.0 419.5
2008 24.7 108.4 266.0 399.1
1 Includes estimates for incidents not recorded in November 2002 and January and February 2003 during industrial action (see explanatory notes 3 and 4).
2 Revised figures – secondary fire and false alarm data, supplied by Lancashire, have been revised
6.4 The number of false alarms in England fell by 6 per cent in 2008 compared with 2007. While the number of false alarms in Wales fell by 4 per cent during the same period. The number of false alarms in Scotland was almost the same as in 2007. The highest percentage decrease in the number of false alarms between 2007 and 2008 was in Warwickshire FRS (25%). In contrast, Bedfordshire FRS recorded an 8 per cent increase in the number of false alarms between 2007 and 2008.
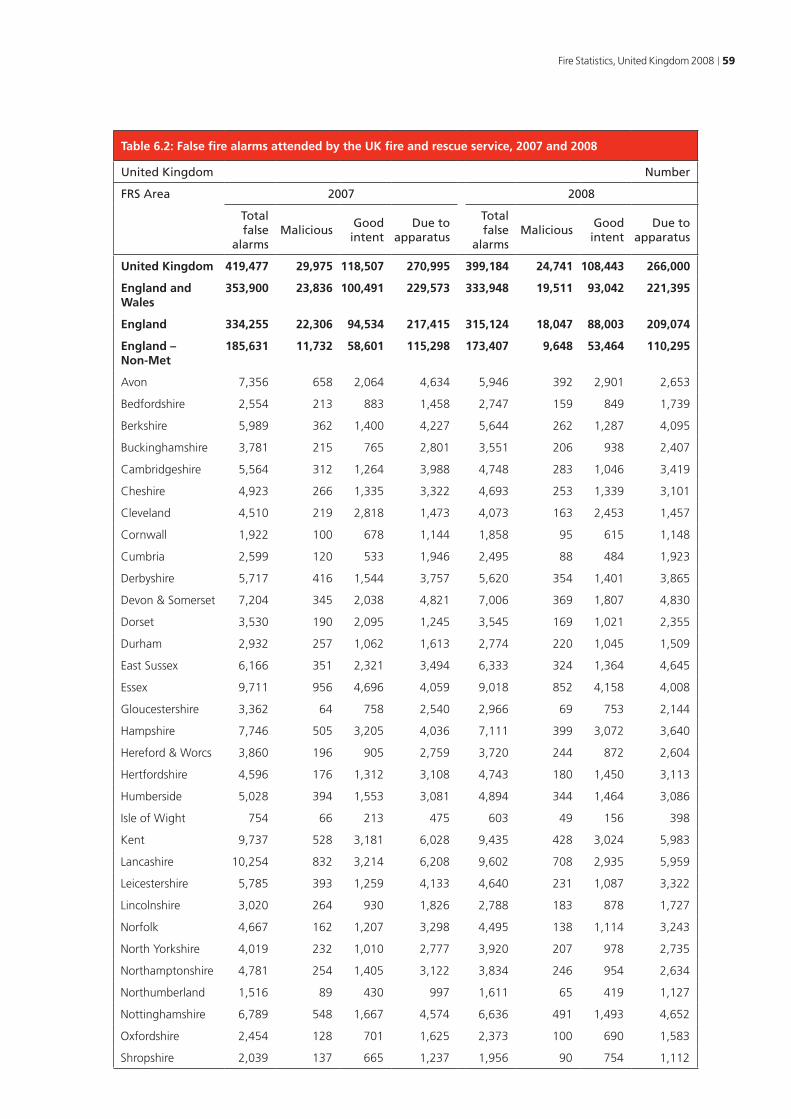
Fire Statistics, United Kingdom 2008 59
Table 6.2: False fire alarms attended by the UK fire and rescue service, 2007 and 2008
United Kingdom Number
FRS Area 2007 2008
Total false
alarmsMalicious
Good intent
Due to apparatus
Total false
alarmsMalicious
Good intent
Due to apparatus
United Kingdom 419,477 29,975 118,507 270,995 399,184 24,741 108,443 266,000
England and Wales
353,900 23,836 100,491 229,573 333,948 19,511 93,042 221,395
England 334,255 22,306 94,534 217,415 315,124 18,047 88,003 209,074
England – Non-Met
185,631 11,732 58,601 115,298 173,407 9,648 53,464 110,295
Avon 7,356 658 2,064 4,634 5,946 392 2,901 2,653
Bedfordshire 2,554 213 883 1,458 2,747 159 849 1,739
Berkshire 5,989 362 1,400 4,227 5,644 262 1,287 4,095
Buckinghamshire 3,781 215 765 2,801 3,551 206 938 2,407
Cambridgeshire 5,564 312 1,264 3,988 4,748 283 1,046 3,419
Cheshire 4,923 266 1,335 3,322 4,693 253 1,339 3,101
Cleveland 4,510 219 2,818 1,473 4,073 163 2,453 1,457
Cornwall 1,922 100 678 1,144 1,858 95 615 1,148
Cumbria 2,599 120 533 1,946 2,495 88 484 1,923
Derbyshire 5,717 416 1,544 3,757 5,620 354 1,401 3,865
Devon & Somerset 7,204 345 2,038 4,821 7,006 369 1,807 4,830
Dorset 3,530 190 2,095 1,245 3,545 169 1,021 2,355
Durham 2,932 257 1,062 1,613 2,774 220 1,045 1,509
East Sussex 6,166 351 2,321 3,494 6,333 324 1,364 4,645
Essex 9,711 956 4,696 4,059 9,018 852 4,158 4,008
Gloucestershire 3,362 64 758 2,540 2,966 69 753 2,144
Hampshire 7,746 505 3,205 4,036 7,111 399 3,072 3,640
Hereford & Worcs 3,860 196 905 2,759 3,720 244 872 2,604
Hertfordshire 4,596 176 1,312 3,108 4,743 180 1,450 3,113
Humberside 5,028 394 1,553 3,081 4,894 344 1,464 3,086
Isle of Wight 754 66 213 475 603 49 156 398
Kent 9,737 528 3,181 6,028 9,435 428 3,024 5,983
Lancashire 10,254 832 3,214 6,208 9,602 708 2,935 5,959
Leicestershire 5,785 393 1,259 4,133 4,640 231 1,087 3,322
Lincolnshire 3,020 264 930 1,826 2,788 183 878 1,727
Norfolk 4,667 162 1,207 3,298 4,495 138 1,114 3,243
North Yorkshire 4,019 232 1,010 2,777 3,920 207 978 2,735
Northamptonshire 4,781 254 1,405 3,122 3,834 246 954 2,634
Northumberland 1,516 89 430 997 1,611 65 419 1,127
Nottinghamshire 6,789 548 1,667 4,574 6,636 491 1,493 4,652
Oxfordshire 2,454 128 701 1,625 2,373 100 690 1,583
Shropshire 2,039 137 665 1,237 1,956 90 754 1,112
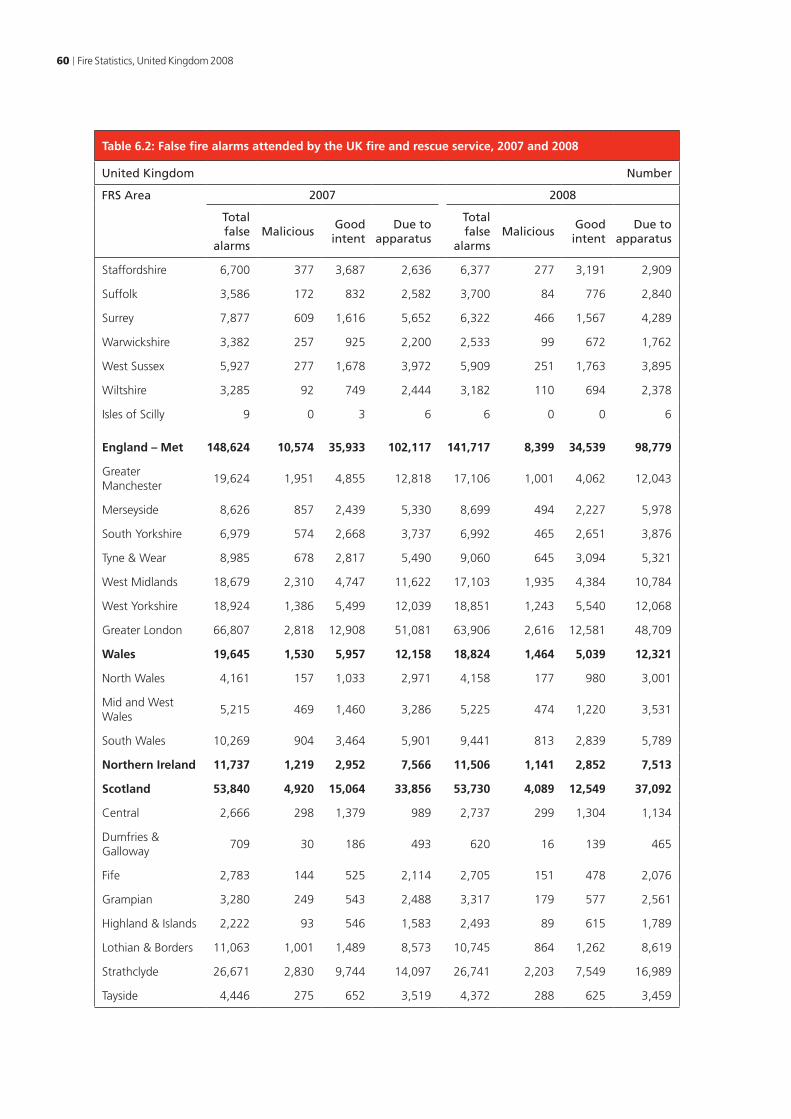
60 Fire Statistics, United Kingdom 2008
Table 6.2: False fire alarms attended by the UK fire and rescue service, 2007 and 2008
United Kingdom Number
FRS Area 2007 2008
Total false
alarmsMalicious
Good intent
Due to apparatus
Total false
alarmsMalicious
Good intent
Due to apparatus
Staffordshire 6,700 377 3,687 2,636 6,377 277 3,191 2,909
Suffolk 3,586 172 832 2,582 3,700 84 776 2,840
Surrey 7,877 609 1,616 5,652 6,322 466 1,567 4,289
Warwickshire 3,382 257 925 2,200 2,533 99 672 1,762
West Sussex 5,927 277 1,678 3,972 5,909 251 1,763 3,895
Wiltshire 3,285 92 749 2,444 3,182 110 694 2,378
Isles of Scilly 9 0 3 6 6 0 0 6 England – Met 148,624 10,574 35,933 102,117 141,717 8,399 34,539 98,779
Greater Manchester
19,624 1,951 4,855 12,818 17,106 1,001 4,062 12,043
Merseyside 8,626 857 2,439 5,330 8,699 494 2,227 5,978
South Yorkshire 6,979 574 2,668 3,737 6,992 465 2,651 3,876
Tyne & Wear 8,985 678 2,817 5,490 9,060 645 3,094 5,321
West Midlands 18,679 2,310 4,747 11,622 17,103 1,935 4,384 10,784
West Yorkshire 18,924 1,386 5,499 12,039 18,851 1,243 5,540 12,068
Greater London 66,807 2,818 12,908 51,081 63,906 2,616 12,581 48,709
Wales 19,645 1,530 5,957 12,158 18,824 1,464 5,039 12,321
North Wales 4,161 157 1,033 2,971 4,158 177 980 3,001
Mid and West Wales
5,215 469 1,460 3,286 5,225 474 1,220 3,531
South Wales 10,269 904 3,464 5,901 9,441 813 2,839 5,789
Northern Ireland 11,737 1,219 2,952 7,566 11,506 1,141 2,852 7,513
Scotland 53,840 4,920 15,064 33,856 53,730 4,089 12,549 37,092
Central 2,666 298 1,379 989 2,737 299 1,304 1,134
Dumfries & Galloway
709 30 186 493 620 16 139 465
Fife 2,783 144 525 2,114 2,705 151 478 2,076
Grampian 3,280 249 543 2,488 3,317 179 577 2,561
Highland & Islands 2,222 93 546 1,583 2,493 89 615 1,789
Lothian & Borders 11,063 1,001 1,489 8,573 10,745 864 1,262 8,619
Strathclyde 26,671 2,830 9,744 14,097 26,741 2,203 7,549 16,989
Tayside 4,446 275 652 3,519 4,372 288 625 3,459
Fire Statistics, United Kingdom 2008 61
Explanatory notes1. The Department for Communities and Local Government assumed responsibility
for the fire and rescue service in May 2006. Previously responsibility was held by the Home Office, the Department for Transport, Local Government and the Regions and the Office of the Deputy Prime Minister.
2. The statistics in this publication are compiled from reports submitted to the Department for Communities and Local Government on fires attended by the fire and rescue service in the UK. More detailed information is collected on all fires in buildings, vehicles and outdoor structures and any fires involving casualties or rescues (i.e. “primary” fires). Less detailed aggregated information is collected on “secondary” and chimney fires; so subsequent analysis of them is limited. Brief definitions of the fires and false alarms reported on are given below. However for fuller definitions see paragraph 24.
Industrial action
3. Due to the industrial action by firefighters in November 2002 and January and February 2003 the reporting of fires for these days was disrupted. In total fifteen 24 hour periods were affected:
from 18:00 on 13th to 18:00 on 15th November 2002 (2 days)
from 09:00 on 22nd to 09:00 on 30th November 2002 (8 days)
from 09:00 on 21st to 09:00 on 22nd January 2003 (1 day)
from 09:00 on 28th to 09:00 on 30th January 2003 (2 days)
from 09:00 on 1st to 09:00 on 3rd February 2003 (2 days).
In some cases, this gap has been covered by estimates made by the Department for Communities and Local Government’s fire statistics section. Some information relating to this period has been received via data collected by the Ministry of Defence and also from special summary reports submitted by some fire and rescue services. However, for the more complex tables, the figures are as reported by the service and therefore exclude any estimates for strike days. All the tables are labelled accordingly.
4. In order to present the most accurate picture of the fires, casualties and false alarms which occurred in 2002 and 2003, in some cases estimates have been incorporated into the figures to account for missing information. These have been produced using comparable data from November 2001, January 2002 and February 2002. Information on the actual number of fatal casualties which occurred during the strike periods has been obtained from the Ministry of Defence and media. For the
62 Fire Statistics, United Kingdom 2008
more complex tables in this bulletin the figures are as reported by the fire and rescue service and therefore exclude any estimates for strike days. All the tables are labelled accordingly.
Definitions: primary fires, secondary and chimney fires and false alarms
5. “Primary” fires include all fires in buildings, vehicles and outdoor structures or any fire involving casualties, rescues, or fires attended by five or more appliances. “Secondary” fires are the majority of outdoor fires including grassland and refuse fires unless they involve casualties or rescues, property loss or five or more appliances attend. They include fires in single derelict buildings. Chimney fires are any fire in an occupied building where the fire was confined within the chimney structure (and did not involve casualties or rescues or attendance by five or more appliances). A false alarm is defined as an event in which the fire and rescue service believes they are called to a reportable fire and then find there is no such incident. For fuller definitions, see paragraph 24 below. The term “outdoor fires” used in this bulletin refers to primary and secondary fires in road vehicles, other outdoor property, derelict buildings and derelict vehicles and more minor refuse, grassland and intentional straw/stubble fires.
Data for primary fires
6. The source of these data is the fire data report form FDR1(94) introduced from January 1994 and for Warwickshire from (October 2007) onwards, the electronic Incident Recording System (IRS). For data collected via the FDR1 form, the count specifically included two categories of fire-related incident not recorded in the fire statistics from the early 1980s to 1993. These categories are described as late fire calls and heat and smoke damage only incidents:
• “late fire calls” which are fires not attended as an emergency because they are known to be extinguished when the call was made, or to which no emergency call was made
• heat or smoke damage only ‘fires’ – where no fire damage is reported (see paragraph 24 for fuller explanation).
7. In order to avoid previous interpretation problems, the contents of all tables and charts were revised in Home Office Statistical Bulletin 25/98 – Fire Statistics, United Kingdom, 1997 so that analyses for 1994 and later years include both “late fire calls” and heat or smoke damage only ‘fires’. (Because of the way that these types of fire were processed in 1995, this involved some additional estimation for missing data.).
Fire Statistics, United Kingdom 2008 63
Fatalities
8. A person whose death is attributed to a fire is counted as a fatality even if the death occurred weeks or months later. However, it is not always the case that fire was the cause of death. The figures for fatalities are thus subject to revision, as information supplied by the fire and rescue service needs to be cross-checked against the cause of death that appears on the death certificate. The main area of uncertainty is whether fire was the cause of death in road accident fatalities. This publication contains the finalised fire death figures for all years.
9. Revisions to the time series data relating to fire deaths have been published in previous Statistical Bulletins. A comprehensive revision exercise was undertaken in 1998, which resulted in major revisions (mainly for fires in road vehicles) to fire-related deaths occurring between 1988 and 1996. These revisions were first published in Home Office Statistical Bulletin 25/98 – Summary Fire Statistics, United Kingdom, 1997. A further data refinement exercise was undertaken in June 2000 to complete the revision exercise undertaken to the 1998 deaths information. The 2000 exercise resulted in some very minor changes to the information held on non-fatal casualties, rescues and the information held on the location of some fatal casualties for the years 1989 to 1993. The results of these very minor revisions were published in Home Office Statistical Bulletin 20/00 – Summary Fire Statistics, United Kingdom, 1999.
Survey of English Housing
10. The Survey of English Housing (SEH) is a large continuous survey carried out primarily to collect information on households in England, their housing and other related issues. In 2004/05 the SEH also asked a set of questions about fire-related issues in the home. A similar module of fire questions was asked in previous years in the British Crime Survey (BCS). Information collected in the SEH on experience of fire provides a valuable source of additional information in measuring the prevalence of domestic fires in England. This is because many of the fires measured by the SEH result in little or no damage and consequently are often not brought to the attention of fire and rescue service, thus escaping official recording via fire data reports (FDR1 and FDR3 forms). Even fires involving property damage or injury are not always brought to their attention. The SEH also collects a wide variety of social and demographic information from households, including details about their ethnicity, housing tenure and economic status. These characteristics together with the fire module responses allow the groups most likely to experience a fire or least likely to own a smoke alarm to be identified.
64 Fire Statistics, United Kingdom 2008
Deliberate and accidental fires
11. Deliberate fires include those where deliberate ignition is merely suspected, and those recorded by the brigade as “doubtful”.
12. In 1994, as a result of a review of the assessment of the motive of primary fires (accidental or deliberate), there were changes in the recording of these classifications, which resulted in:
• some fires previously classified as accidental being classified as deliberate
• some deliberate fires previously considered to be “ignition of others’ property” being classified as “unspecified cause”
• a reduction in accidental fires due to “playing with fire”.
The effect appeared most noticeable for building fires, where an estimated 4,000 fires may have been categorised as deliberate where they were previously classed as accidental. These changes affect comparisons before and after 1994, but do not affect comparisons between 1994 and later years.
13. Data for deliberate and accidental fires were further revised in 2000. These revisions were published in Home Office Statistical Bulletin 20/00 – Summary Fire Statistics, United Kingdom, 1999. The revised data corrected an error, which resulted in a small distortion (about 3,500 fires) in the number of deliberate and accidental fires for the years 1996 to 1998. The total number of primary fires (involving property or casualties) for these years was not affected.
False alarms
14. The marked changes between 1995 and 1996 in the numbers of false alarm calls for “good intent” and “due to apparatus” are partly the result of coding changes. Guidance clarifying false alarm calls to be included in the “due to apparatus” category as applied by some fire brigades has resulted in some false alarm calls being classified into this category rather than “good intent”.
Population data
15. Population data used in this Bulletin have been provided by the Office for National Statistics (ONS) in the form of mid-year estimates. Since publication of Fire Statistics, United Kingdom, 2002 ONS revised the mid-year estimates (in May 2010) for all years from 2002 to 2008 and these figures have been incorporated into this bulletin. Further information on the exact changes made to the population estimates can be obtained via the ONS website www.statistics.gov.uk
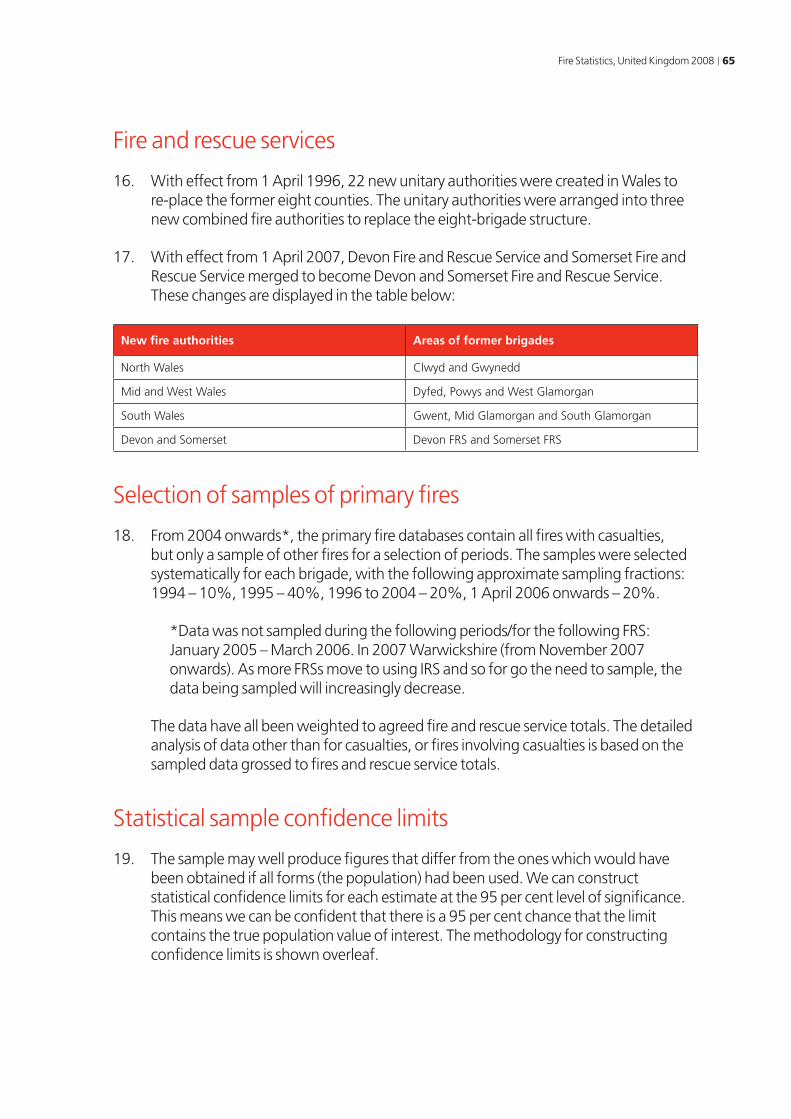
Fire Statistics, United Kingdom 2008 65
Fire and rescue services
16. With effect from 1 April 1996, 22 new unitary authorities were created in Wales to re-place the former eight counties. The unitary authorities were arranged into three new combined fire authorities to replace the eight-brigade structure.
17. With effect from 1 April 2007, Devon Fire and Rescue Service and Somerset Fire and Rescue Service merged to become Devon and Somerset Fire and Rescue Service. These changes are displayed in the table below:
New fire authorities Areas of former brigades
North Wales Clwyd and Gwynedd
Mid and West Wales Dyfed, Powys and West Glamorgan
South Wales Gwent, Mid Glamorgan and South Glamorgan
Devon and Somerset Devon FRS and Somerset FRS
Selection of samples of primary fires
18. From 2004 onwards*, the primary fire databases contain all fires with casualties, but only a sample of other fires for a selection of periods. The samples were selected systematically for each brigade, with the following approximate sampling fractions: 1994 – 10%, 1995 – 40%, 1996 to 2004 – 20%, 1 April 2006 onwards – 20%.
*Data was not sampled during the following periods/for the following FRS: January 2005 – March 2006. In 2007 Warwickshire (from November 2007 onwards). As more FRSs move to using IRS and so for go the need to sample, the data being sampled will increasingly decrease.
The data have all been weighted to agreed fire and rescue service totals. The detailed analysis of data other than for casualties, or fires involving casualties is based on the sampled data grossed to fires and rescue service totals.
Statistical sample confidence limits
19. The sample may well produce figures that differ from the ones which would have been obtained if all forms (the population) had been used. We can construct statistical confidence limits for each estimate at the 95 per cent level of significance. This means we can be confident that there is a 95 per cent chance that the limit contains the true population value of interest. The methodology for constructing confidence limits is shown overleaf.
66 Fire Statistics, United Kingdom 2008
20. A parameter (R) from the fire incident population (N) will take the form of a proportion (P = R/N) with a particular attribute, for example the number of dwelling fires as a pro-portion of fires in all locations. Using the normal distribution approximation gives confidence limits for p as:
p ± Zα √(1-f)pq_
√(n-1)
Where p = Proportion of fires with a given attribute
q = 1 – p
f = n/N = Sampling fraction
n = Sample size
N = Known population size
Zα= Normal distribution significance level α (i.e. α=0.05 ➾ Zα=1.96)
However, this normal approximation requires that
(i) n«min(R,N-R)
(ii) min(nP,nQ) ≥ 30
(See Cochran, William G, ‘Sampling Techniques’, Wiley Publications 1977, (p57-60) for details)
21. We cannot use these approximations safely if a proportion (p value) close to zero or one is being estimated. When the normal approximation does not apply limits for p may be found from binomial tables (e.g. Fisher and Yates Statistical Tables (1957)).
An example for car fires
22. In 2004 there were 144,456 primary fire incidents attended by UK Fire and Rescue Services and each of these incidents resulted in a form being sent to DCLG. Of the incidents reported to DCLG on FDR1 forms, data from 82,759, forms were captured and entered onto the database. This breaks down as follows: Of the 144,456 forms received by DCLG, 67,261 forms were automatically set aside to have their data entered on to the database as they were for fires involving casualties or they were received electronically from participating fire and rescue services. Out of the remaining 77,195 forms 20 per cent or 1 in 5 forms (15,498) were selected at random and their data was entered onto the database. Therefore, the 15,498 (n) sampled forms are based on a population of 144,456 – 67,261 = 77,195 forms and the overall sampling fraction (f) was 20 per cent (15,498).
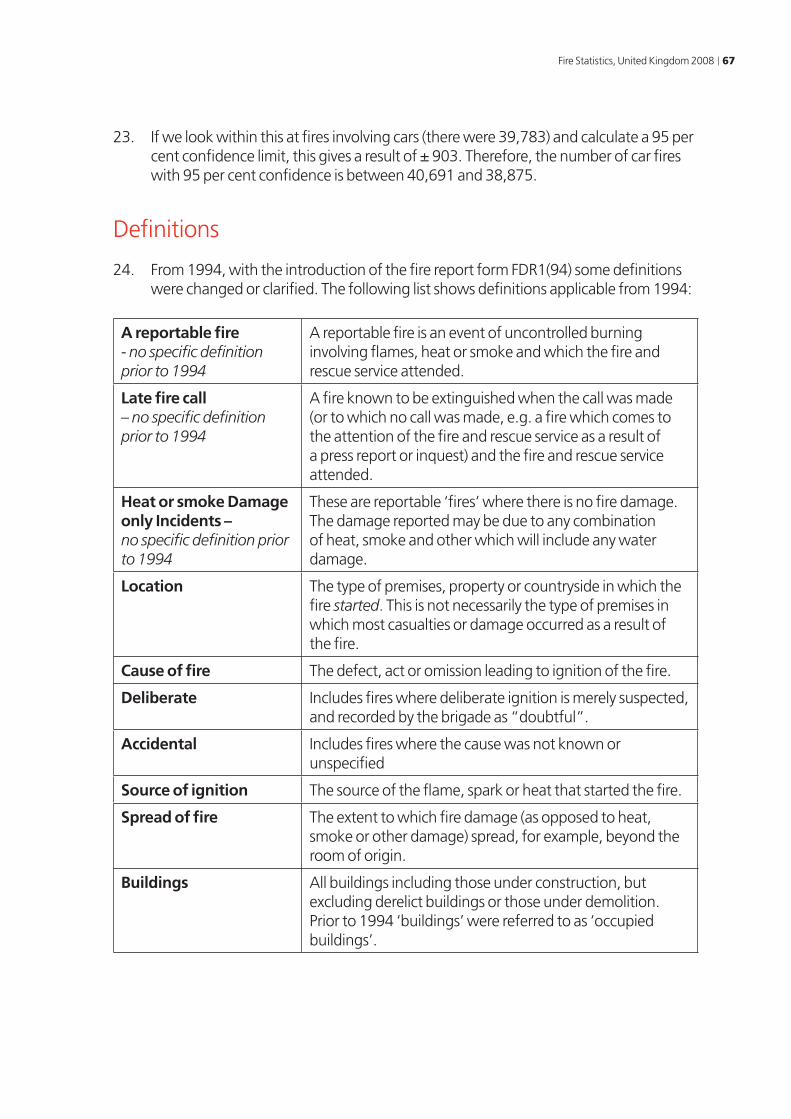
Fire Statistics, United Kingdom 2008 67
23. If we look within this at fires involving cars (there were 39,783) and calculate a 95 per cent confidence limit, this gives a result of ± 903. Therefore, the number of car fires with 95 per cent confidence is between 40,691 and 38,875.
Definitions
24. From 1994, with the introduction of the fire report form FDR1(94) some definitions were changed or clarified. The following list shows definitions applicable from 1994:
A reportable fire - no specific definition prior to 1994
A reportable fire is an event of uncontrolled burning involving flames, heat or smoke and which the fire and rescue service attended.
Late fire call – no specific definition prior to 1994
A fire known to be extinguished when the call was made (or to which no call was made, e.g. a fire which comes to the attention of the fire and rescue service as a result of a press report or inquest) and the fire and rescue service attended.
Heat or smoke Damage only Incidents – no specific definition prior to 1994
These are reportable ‘fires’ where there is no fire damage. The damage reported may be due to any combination of heat, smoke and other which will include any water damage.
Location The type of premises, property or countryside in which the fire started. This is not necessarily the type of premises in which most casualties or damage occurred as a result of the fire.
Cause of fire The defect, act or omission leading to ignition of the fire.
Deliberate Includes fires where deliberate ignition is merely suspected, and recorded by the brigade as “doubtful”.
Accidental Includes fires where the cause was not known or unspecified
Source of ignition The source of the flame, spark or heat that started the fire.
Spread of fire The extent to which fire damage (as opposed to heat, smoke or other damage) spread, for example, beyond the room of origin.
Buildings All buildings including those under construction, but excluding derelict buildings or those under demolition. Prior to 1994 ‘buildings’ were referred to as ‘occupied buildings’.
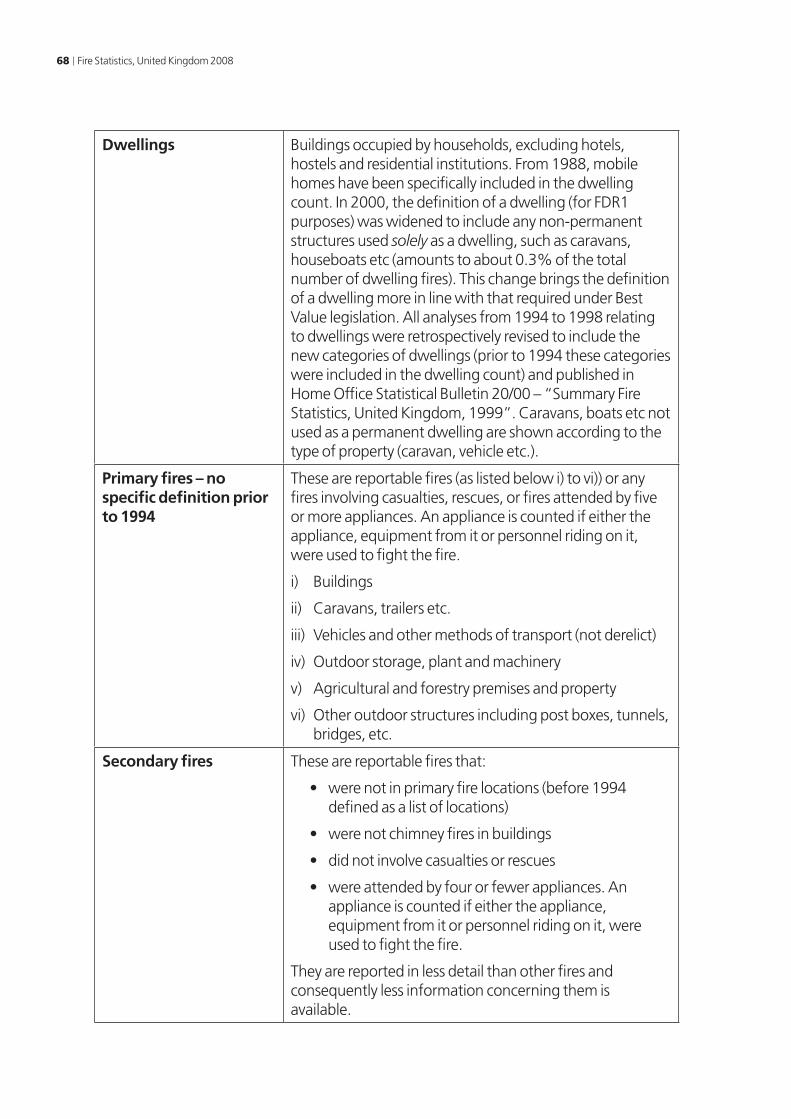
68 Fire Statistics, United Kingdom 2008
Dwellings Buildings occupied by households, excluding hotels, hostels and residential institutions. From 1988, mobile homes have been specifically included in the dwelling count. In 2000, the definition of a dwelling (for FDR1 purposes) was widened to include any non-permanent structures used solely as a dwelling, such as caravans, houseboats etc (amounts to about 0.3% of the total number of dwelling fires). This change brings the definition of a dwelling more in line with that required under Best Value legislation. All analyses from 1994 to 1998 relating to dwellings were retrospectively revised to include the new categories of dwellings (prior to 1994 these categories were included in the dwelling count) and published in Home Office Statistical Bulletin 20/00 – “Summary Fire Statistics, United Kingdom, 1999”. Caravans, boats etc not used as a permanent dwelling are shown according to the type of property (caravan, vehicle etc.).
Primary fires – no specific definition prior to 1994
These are reportable fires (as listed below i) to vi)) or any fires involving casualties, rescues, or fires attended by five or more appliances. An appliance is counted if either the appliance, equipment from it or personnel riding on it, were used to fight the fire.
i) Buildings
ii) Caravans, trailers etc.
iii) Vehicles and other methods of transport (not derelict)
iv) Outdoor storage, plant and machinery
v) Agricultural and forestry premises and property
vi) Other outdoor structures including post boxes, tunnels, bridges, etc.
Secondary fires These are reportable fires that:
• were not in primary fire locations (before 1994 defined as a list of locations)
• were not chimney fires in buildings
• did not involve casualties or rescues
• were attended by four or fewer appliances. An appliance is counted if either the appliance, equipment from it or personnel riding on it, were used to fight the fire.
They are reported in less detail than other fires and consequently less information concerning them is available.
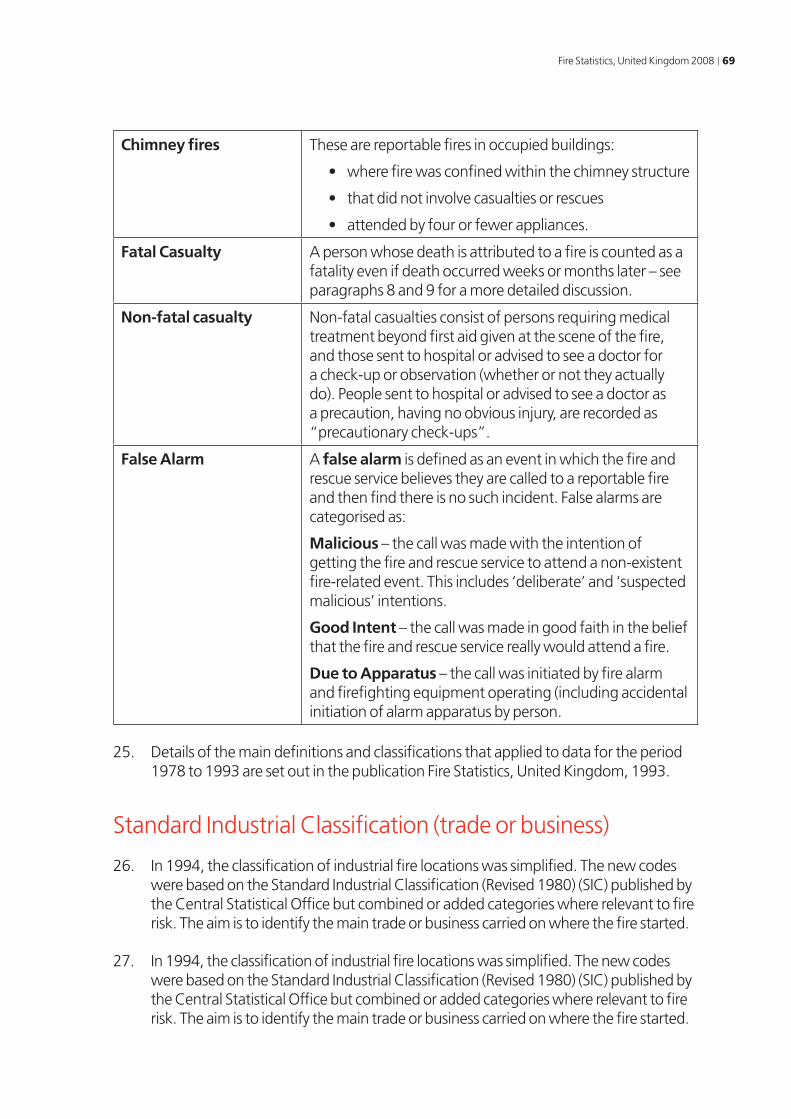
Fire Statistics, United Kingdom 2008 69
Chimney fires These are reportable fires in occupied buildings:
• where fire was confined within the chimney structure
• that did not involve casualties or rescues
• attended by four or fewer appliances.
Fatal Casualty A person whose death is attributed to a fire is counted as a fatality even if death occurred weeks or months later – see paragraphs 8 and 9 for a more detailed discussion.
Non-fatal casualty Non-fatal casualties consist of persons requiring medical treatment beyond first aid given at the scene of the fire, and those sent to hospital or advised to see a doctor for a check-up or observation (whether or not they actually do). People sent to hospital or advised to see a doctor as a precaution, having no obvious injury, are recorded as “precautionary check-ups”.
False Alarm A false alarm is defined as an event in which the fire and rescue service believes they are called to a reportable fire and then find there is no such incident. False alarms are categorised as:
Malicious – the call was made with the intention of getting the fire and rescue service to attend a non-existent fire-related event. This includes ‘deliberate’ and ‘suspected malicious’ intentions.
Good Intent – the call was made in good faith in the belief that the fire and rescue service really would attend a fire.
Due to Apparatus – the call was initiated by fire alarm and firefighting equipment operating (including accidental initiation of alarm apparatus by person.
25. Details of the main definitions and classifications that applied to data for the period 1978 to 1993 are set out in the publication Fire Statistics, United Kingdom, 1993.
Standard Industrial Classification (trade or business)
26. In 1994, the classification of industrial fire locations was simplified. The new codes were based on the Standard Industrial Classification (Revised 1980) (SIC) published by the Central Statistical Office but combined or added categories where relevant to fire risk. The aim is to identify the main trade or business carried on where the fire started.
27. In 1994, the classification of industrial fire locations was simplified. The new codes were based on the Standard Industrial Classification (Revised 1980) (SIC) published by the Central Statistical Office but combined or added categories where relevant to fire risk. The aim is to identify the main trade or business carried on where the fire started.
70 Fire Statistics, United Kingdom 2008
Symbols
28. Symbols used in the tables are:
– Nil or less than half the final digit shown.
.. Not available/Not applicable.
p Provisional figures
pmp Per million population
Enquiries
29. This publication was written by Sylvia Williams, Jon Gamble and Ray Tomey.
30. Enquiries about the figures in this publication should be addressed to
Jon Gamble
Department for Communities and Local Government Fire Statistics Branch 3/E1 Eland House Bressenden Place London SW1E 5DU Tel: 0303 4443923 Email: [email protected]
31. This publication, together with those listed in sections A and B at paragraph 26 below, can be downloaded free of charge via the Department for Communities and Local Government website http://www.communities.gov.uk/
Fire Statistics, United Kingdom 2008 71
Previous statistical publications on fires
32. A. Fire Statistical Publications:
Fire Statistics, United Kingdom, 2007 (ISBN 978-1-4098-1769-7)
Fire Statistics, United Kingdom, 2006 (ISBN 1-40980-046-0)
Fire Statistics, United Kingdom, 2005 (ISBN 1-85112-873-0)
Fire Statistics, United Kingdom, 2004 (ISBN 1-85112-843-3)
Fire Statistics, United Kingdom, 2003 (ISBN 1-85112-775-5)
Fire Statistics, United Kingdom, 2002 (ISBN 1-85112-695-3)
Fire Statistics, United Kingdom, 2001 (ISBN 1-85112-619-8)
Fire Statistics, United Kingdom, 2000 (FS/PPU/2765)
Fire Statistics, United Kingdom, 1999 (issue number 20/00)
Fire Statistics, United Kingdom, 1998 (issue number 15/99)
Fire Statistics, United Kingdom, 1997 (issue number 25/98)
Summary Fire Statistics, United Kingdom, 1996 (issue number 1/98)
Summary Fire Statistics, United Kingdom, 1995 (issue number 8/97)
Summary Fire Statistics, United Kingdom, 1994 (issue number 13/96)

ISBN 978-1-4098-2660-6
9 781409 826606
ISBN: 978-1-4098-2660-6
72 Fire Statistics, United Kingdom 2008
B. Other Department for Communities and Local Government fire related Statistical
Publications/research reports
Fires in the home: findings from the 2004/05 Survey of English Housing ISBN 978-185-112-8419)
Fires in the home: findings from the 2002/03 British Crime Survey (ISBN 1-85112-694-5)
Fires in the home: findings from the 2001/02 British Crime Survey (ISBN 1-85112-620-1)
The Economic Cost of Fire: Estimates for 2004
The Economic Cost of Fire: Estimates for 2003
The Economic Cost of Fire: Estimates for 2000 (ISBN 1-85112-667-8)