Embed Size (px)
Citation preview
_____________________________________________________________________________________________________ *Corresponding author: E-mail: [email protected];
British Journal of Education, Society & Behavioural Science
7(2): XX-XX, 2015, Article no.BJESBS.2015.073 ISSN: 2278-0998
SCIENCEDOMAIN international
www.sciencedomain.org
Firearms and Violent Death in the United States: Gun Ownership, Gun Control and
Mortality Rates in 16 States, 2005-2009
David Hamilton1* and Augustine J. Kposowa2
11991, Broadway, 24B, New York, NY 10023, USA.
2Department of Sociology, University of California, 1150 Watkins Hall, Riverside, CA 92521, USA.
Authors’ contributions
This work was carried out in collaboration between both authors. Author DH designed the study, carried out the literature search, performed the analysis, and wrote the first draft of the study. Author
AJK co-wrote the discussion and conclusion sections, revised the structure of the paper, assisted in the literature search, and edited the manuscript. Both authors approved the final manuscript.
Article Information
DOI:10.9734/BJESBS/2015/16126 Editor(s):
(1) (2)
Reviewers: (1) (2) (3) (4)
Complete Peer review History:
Received 8th
January 2015 Accepted 3
rd February 2015
Published 16th February 2015
ABSTRACT
Aims: Among advanced nations, the United States stands alone in its level of everyday violence, especially the number of citizens killed by gunfire. Debate about causes and cures ignores wide variances in rates of violent death among states and is focused on homicide to the neglect of suicide, resulting in skewed public perceptions of risk. To better inform policy discussion about gun violence, we delineate the distribution of risk for violent death from homicide and suicide across states and estimate the possible influence of gun ownership prevalence and state gun law strength on risk differences. Methodology: We compare age-adjusted mortality rates per 100,000 population for violent deaths by intent and mechanism in 16 states from 2005 through 2009.We then estimate bivariate
Original Research Article
Hamilton and Kposowa; BJESBS, 7(2): xxx-xxx, 2015; Article no.BJESBS.2015.073
85
relationships between differences in violent outcomes and demographics, gun ownership, and gun regulation. All data are drawn from publicly available sources: the National Violent Death Reporting System (mortality); 2004 Behavioral Risk Factor Surveillance Survey (household gun ownership); Brady Campaign and Law Center to Prevent Gun Violence (state gun laws). Results: We find wide variations in mortality rates that are statistically related to variations in the prevalence of guns in the home and the strength of state gun control laws. The incidence of suicide is most affected by the firearms availability and the weakness of gun controls. It is in more rural states with larger non-Hispanic white populations, where gun ownership is more prevalent, that suicide risk is greatest. Conclusion: While consistent with most previous research, our findings more fully document the extent and persistence of cross-state differences in fatal violence and show more comprehensively how suicide, more than homicide, determines state violent death levels. Populations that are most resistant to limits on the availability of firearms are most likely to benefit from them.
Keywords: Violent death; homicide; suicide; gun violence; gun control. 1. INTRODUCTION
1.1 Background Among advanced nations, the United States stands alone in its level of everyday violence, most strikingly the number of its citizens who are killed or wounded by gunfire. At least 55,000 people in the US die annually as a result of injuries caused by violence [1]. Americans do not kill themselves more frequently than do people in other nations, but they kill each other at uniquely high rates, compared with citizens of similarly developed countries in Europe and Asia. In 2009, the homicide rate in the United States was 5.0 per 100,000, only a fraction of the level in such extraordinarily violent states as South Africa (33.1), Guatemala (46.5), El Salvador (70.9), and Honduras (70.7), but more than four times the median rate (1.2) for all 34 members of the Organization for Economic Cooperation and Development [2,3]. Only in Estonia (6.2) and Chile (5.8), among OECD states, was murder more prevalent. The incidence of gun homicide in the US (3.0) was 8.5 times the OECD average (0.35). Guns accounted for 60% of US murders in 2009; only in Switzerland (72.2%) and Italy (66.7%), both countries with far fewer homicides, were firearms so frequently the means [3].
In 2009, the suicide rate in the US (10.5 per 100,000 population) was below the OECD average (11.3), but by 2011, it had risen to 12.5, slightly above the overall OECD level (12.4) [2,4]. Nonetheless, more than twice as many Americans die by their own hand as are killed by another each year. In 2010, there were 38,364 suicides and 16,259 homicides; gun suicides alone (19,392) outnumbered homicides by any
and all means, even though firearms are less often the instrument of self-harm [5].
Whether violence is directed against the self or others, the means of death matter. Guns are more lethal than other weapons, and only in the United States are they privately owned in such numbers by so many ordinary citizens. The gun ownership rate in the US (88 guns for every 100 persons) is by far the highest of 178 countries surveyed by the Small Arms Survey in 2007. Yemen is the next highest (54.8), followed by Switzerland (45.7) and Finland (45.3) [6].
While everyday violence is a national problem, it is not equally prevalent throughout the United States. States differ widely in rates of violent death—intentional and accidental, inflicted on self or others, with or without firearms—a difference of as much as 4:1 between the most and least violent states. In some states, murder is nearly as rare and suicide less frequent than in the rest of the industrial world, while in others violent deaths of one type or the other greatly exceed even high US levels [7,8]. These disparities among states persist, year after year, not just at the extremes but at every level in between.
1.2 Scope and Justification
Our objective in this study is to delineate the distribution of risk—how state populations differ in levels of homicide and suicide and why—with a view to informing the public discussion on how to reduce the still extraordinarily high level of lethal violence in the United States.
Hamilton and Kposowa; BJESBS, 7(2): xxx-xxx, 2015; Article no.BJESBS.2015.073
86
1.2.1 Research context Successive surveys of the literature [9,10,11] find that research conducted in the past 30 years and more consistently reveals an association between the presence of guns in the household and firearm death, intentional or accidental. This conclusion holds regardless of study design or whether comparisons are made at the individual or aggregate level, across nations, across jurisdictions within our country, or over time.
Because all of this work is of necessity quasi-experimental, differences remain on two essential points: One is the magnitude of the effect of firearms availability on mortality, which varies in complex ways by intent (homicide or suicide), mechanism (specific type of firearm) and victim characteristics (gender, race/ethnicity, and age). The other is the relative influence of contextual variables that modify those effects, including population demographics, social behavior or values, and firearms regulatory environments.
All studies that attempt to determine the relationship between gun violence, gun ownership, and gun control laws face multiple challenges to validity, stemming from limitations of data and method [12,13]. Important older studies [14,15,16] that continue to be cited may no longer be relevant, because they are based on mortality data from the 1980s and 1990s, when gun homicide rates were steeply escalating and even suicide was on the rise. It is entirely possible that the dynamics of violent death have changed since 2000 as the tide of murder has receded, and more recently since suicide has again begun to trend upward [5]. These earlier studies also date to a period when household gun ownership was already falling but the number of guns in private hands was far lower than it is today and much less concentrated.
No matter how current or comprehensive their outcome data, no current studies can overcome the lack of information that is both timely and detailed on household and individual gun ownership. The most current survey data on gun ownership, which is found in the National Opinion Research Center’s 2012 General Social Survey (GSS), is derived from samples too small to be useful for areas smaller than the nine multi-state Census divisions [17]. The most recent survey large enough to estimate ownership at the state level, the 2004 Behavioral Risk Factor Surveillance Survey (BRFSS), is now a decade old [18].
1.2.2 Advancing the debate Our study does not purport to overcome any of these limitations, but it does provide a new perspective on the patterns we and others observe in the available data. Previous research, we believe, has paid insufficient attention to the relative social burden of suicide and homicide and to the sharply contrasting patterns of risk for each type of violent death. As a consequence, the research literature has contributed less than it might have to public understanding of the true shape and dimensions of America’s gun violence problem. Public concern remains singularly focused on interpersonal violence to the neglect of violence turned against the self, which not only claims twice as many lives each year but also is rising not falling in frequency, as homicide has so remarkably. The debate over gun control policy continues to be driven almost exclusively by horrific but still rare mass shootings committed by the mentally unstable and by regularly reported gun violence among youth in urban minority communities. Little is said of the other kind of gun violence that disproportionately affects residents of states with older, whiter, and more rural populations—the very states where gun ownership is most prevalent and resistance to gun control strongest.
2. MATERIALS AND METHODS The present study is exploratory in approach, and the analysis is primarily descriptive. We address two fundamental questions: (1) How is the risk of fatal violence from self or others by firearms or other means distributed across states? (2) How is this pattern of risk related to differences in ownership and access to firearms and to the relative strictness or permissiveness of state gun laws? To answer these questions, we first examine the pattern of lethal violence over a period of five years in 16 states, using age-adjusted mortality rates per 100,000 population of all violent deaths by intent (homicide or suicide) and mechanism (all means or by firearm) available from the Center for Disease Control and Prevention’s National Violent Death Reporting System (NVDRS) [19]. NVDRS is “incident-based,” unlike other public health surveillance systems that are victim-based. In NVDRS, a “violent death” is one that results from the intentional use of physical force or power, threatened or actual, against oneself,
Hamilton and Kposowa; BJESBS, 7(2): xxx-xxx, 2015; Article no.BJESBS.2015.073
87
another person, or a group or community.” The person using the force or power need only have intended to use force or power; they need not have intended to produce the consequence that actually occurred.” NVDRS defines homicide as “death resulting from the intentional use of force or power, threatened or actual, against another person, group, or community.” Suicides are “death [s] resulting from the intentional use of force against oneself [20].” Eighteen states now participate in the NVDRS, but multi-year data for the years examined here (2005-2009) are available for only 16: Alaska, Colorado, Georgia, Kentucky, Maryland, Massachusetts, New Jersey, New Mexico, North Carolina, Oklahoma, Oregon, Rhode Island, South Carolina, Utah, Virginia, and Wisconsin. Together, these states account for less than 15% of the U.S. population but one-fourth of homicides in recent years [7,21]. While not strictly speaking representative of the entire country, these 16 states are distributed across all regions—Northeast (2), Middle Atlantic (2), Middle South (3), Deep South (2), Midwest (1), West (3), Southwest (1) and Northwest (1). As a group, they are quite similar to the rest of the country in most demographic characteristics commonly thought to influence levels of violence in populations. In median age and income, educational attainment, and race/ethnic composition they are similar, differing markedly only in having more rural and fewer foreign-born residents. For all but two of the 16 NVDRS states, approximately 85% of violent deaths are classified as homicides or suicides. We next estimate the bivariate strength and statistical significance of potentially influential factors, not least the prevalence of gun ownership and the degree of regulation on their possession and use in each state, using the Spearman rho statistic in preference to Pearson r, because the data are not normally distributed [22]. Our data on gun ownership derives primarily from the 2004 Behavioral Risk Factor Surveillance Survey (BRFSS), supplemented by responses to the biennial General Social Survey, 2000 to 2010 [17,18]. Our measure of state gun control laws is borrowed from separate but similar rankings produced by the Brady
Campaign and the Law Center to Prevent Gun Violence (LCPGV) in 2013 [23,24]. Information on state population characteristics we take from the American Community Survey, 2007-2009 [25] and the 2010 U.S. Census [21,26].
3. RESULTS
In the five-year period under review, nearly 80,000 people died from intentional violence in the 16 NVDRS states, representing an average of almost 16,000 per year, close to one-third of estimated annual deaths from violence in the entire United States. 21,000 of those who died by violence—over one-fourth (26.3%)—were homicide victims. More than twice that number (45,944) were suicides. The annual death toll averaged 4,200 from homicide and 9,200 from suicide. Together, murders and suicides accounted for close to 85% of reported deaths from violence-related injuries. Almost all the rest (14.6%) were of undetermined intent. Deaths at the hands of police accounted for just under 1% (0.95), and accidental shooting deaths were even fewer (0.65%). Just under half (49.1%) of all violent deaths were caused by firearms, including nearly two-thirds (65.9%) of homicides and over half (51.8%) of suicides. Despite this difference, suicides with a firearm (23,785) still outnumbered homicides by whatever means (20,997) over five years. Only 1,769 of 77,762 fatal incidents (2.3%) had more than a single victim, but 1,422 of 37,550 such incidents involving firearms (3.8%) claimed two or more lives. Guns accounted for 80 per cent of multiple killings.
3.1 Five-year Mortality Rates by Intent and Mechanism
The violent death rate per 100,000 population was 19.8 in NVDRS states, but varied widely among them, ranging from a low of 11.5 in Massachusetts to nearly three times that number in Utah (33.2) and Alaska (32.7). In addition to Alaska and Utah, the most violent states during the years examined were New Mexico (29.7) and Maryland (29.1). The least violent, besides Massachusetts, were New Jersey (12.8), Rhode Island (16.4) and Wisconsin (16.7).
Hamilton and Kposowa; BJESBS, 7(2): xxx-xxx, 2015; Article no.BJESBS.2015.073
88
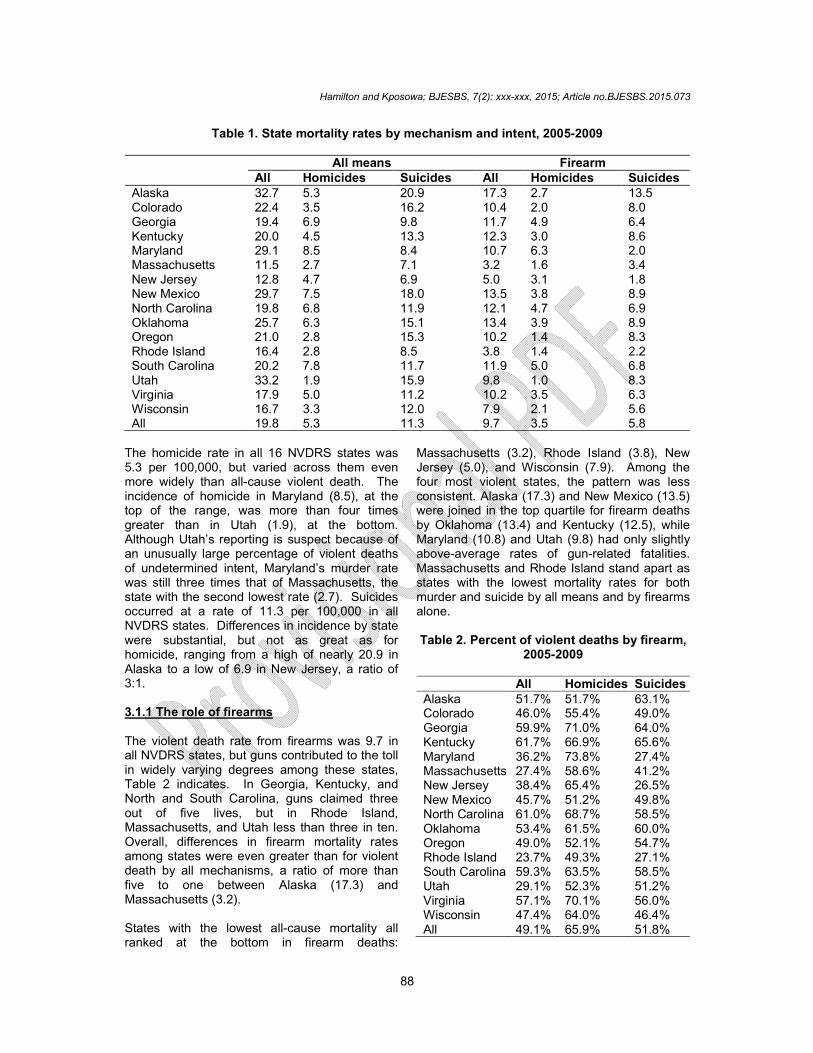
Table 1. State mortality rates by mechanism and intent, 2005-2009
All means Firearm All Homicides Suicides All Homicides Suicides
Alaska 32.7 5.3 20.9 17.3 2.7 13.5 Colorado 22.4 3.5 16.2 10.4 2.0 8.0 Georgia 19.4 6.9 9.8 11.7 4.9 6.4 Kentucky 20.0 4.5 13.3 12.3 3.0 8.6 Maryland 29.1 8.5 8.4 10.7 6.3 2.0 Massachusetts 11.5 2.7 7.1 3.2 1.6 3.4 New Jersey 12.8 4.7 6.9 5.0 3.1 1.8 New Mexico 29.7 7.5 18.0 13.5 3.8 8.9 North Carolina 19.8 6.8 11.9 12.1 4.7 6.9 Oklahoma 25.7 6.3 15.1 13.4 3.9 8.9 Oregon 21.0 2.8 15.3 10.2 1.4 8.3 Rhode Island 16.4 2.8 8.5 3.8 1.4 2.2 South Carolina 20.2 7.8 11.7 11.9 5.0 6.8 Utah 33.2 1.9 15.9 9.8 1.0 8.3 Virginia 17.9 5.0 11.2 10.2 3.5 6.3 Wisconsin 16.7 3.3 12.0 7.9 2.1 5.6 All 19.8 5.3 11.3 9.7 3.5 5.8
The homicide rate in all 16 NVDRS states was 5.3 per 100,000, but varied across them even more widely than all-cause violent death. The incidence of homicide in Maryland (8.5), at the top of the range, was more than four times greater than in Utah (1.9), at the bottom. Although Utah’s reporting is suspect because of an unusually large percentage of violent deaths of undetermined intent, Maryland’s murder rate was still three times that of Massachusetts, the state with the second lowest rate (2.7). Suicides occurred at a rate of 11.3 per 100,000 in all NVDRS states. Differences in incidence by state were substantial, but not as great as for homicide, ranging from a high of nearly 20.9 in Alaska to a low of 6.9 in New Jersey, a ratio of 3:1. 3.1.1 The role of firearms The violent death rate from firearms was 9.7 in all NVDRS states, but guns contributed to the toll in widely varying degrees among these states, Table 2 indicates. In Georgia, Kentucky, and North and South Carolina, guns claimed three out of five lives, but in Rhode Island, Massachusetts, and Utah less than three in ten. Overall, differences in firearm mortality rates among states were even greater than for violent death by all mechanisms, a ratio of more than five to one between Alaska (17.3) and Massachusetts (3.2). States with the lowest all-cause mortality all ranked at the bottom in firearm deaths:
Massachusetts (3.2), Rhode Island (3.8), New Jersey (5.0), and Wisconsin (7.9). Among the four most violent states, the pattern was less consistent. Alaska (17.3) and New Mexico (13.5) were joined in the top quartile for firearm deaths by Oklahoma (13.4) and Kentucky (12.5), while Maryland (10.8) and Utah (9.8) had only slightly above-average rates of gun-related fatalities. Massachusetts and Rhode Island stand apart as states with the lowest mortality rates for both murder and suicide by all means and by firearms alone. Table 2. Percent of violent deaths by firearm,
2005-2009 All Homicides Suicides Alaska 51.7% 51.7% 63.1% Colorado 46.0% 55.4% 49.0% Georgia 59.9% 71.0% 64.0% Kentucky 61.7% 66.9% 65.6% Maryland 36.2% 73.8% 27.4% Massachusetts 27.4% 58.6% 41.2% New Jersey 38.4% 65.4% 26.5% New Mexico 45.7% 51.2% 49.8% North Carolina 61.0% 68.7% 58.5% Oklahoma 53.4% 61.5% 60.0% Oregon 49.0% 52.1% 54.7% Rhode Island 23.7% 49.3% 27.1% South Carolina 59.3% 63.5% 58.5% Utah 29.1% 52.3% 51.2% Virginia 57.1% 70.1% 56.0% Wisconsin 47.4% 64.0% 46.4% All 49.1% 65.9% 51.8%
Hamilton and Kposowa; BJESBS, 7(2): xxx-xxx, 2015; Article no.BJESBS.2015.073
89
As seen in Table 1, the firearm homicide rate was 3.5 in these 16 states. Reflecting state differences in overall homicide rates, but diverging even more widely, gun murder rates ranged from a high of 6.3 in Maryland to lows of 1.0 in Utah and 1.4 in Rhode Island, a multiple of better than 6:1, even disregarding Utah as a doubtful outlier. As was the case with all violent deaths, states with the lowest incidence of homicide (Utah, Massachusetts, Rhode Island, Oregon, and Wisconsin) also had the lowest rates of firearm-related homicide. In the most violent states, murder rates were even more closely linked to the use of guns: Maryland, Georgia, and South Carolina were in the top quartile in both categories, and North Carolina ranked next highest in both. Only New Mexico diverged, ranking third in homicides while recording only a somewhat above-average incidence of gun-related murder. The proportion of gun homicides was not more than fractionally below 50% in any state, and in three (Maryland, North Carolina, and Virginia) reached 70% or more. Findings in Table 1 reveal that NVDRS states had an overall firearm suicide rate of 5.8 in these years, ranging from 13.5 in Alaska to only 1.8 in New Jersey, a more than seven-fold disparity, greater than the ratio of maximum to minimum for gun homicides or for suicides and homicides by all other means. The four states with the lowest firearm suicide rates (Maryland, Massachusetts, and Rhode Island, along with New Jersey) were also the four with the lowest overall incidence of intentional self-harm. The
pattern at the other end of the range was less consistent: Alaska and New Mexico were in the top four in both total suicides and those involving firearms; Oklahoma and Kentucky, also in the top quartile for gun suicide, both had above-average overall suicide rates but were not among the leaders in that category.
As shown in Table 2, guns accounted for 65.6% of all suicides in Kentucky, exceeding that state’s percentage of murders involving guns (61.1). In Colorado, Alaska, and Georgia, the other top quartile states, gun use was almost as frequent. In New Jersey and Rhode Island, on the other hand, the proportion was just over 25%, far below the proportion of shooting homicides in those states.
3.2 Five-year Trends, 2005-2009 The total number of violent deaths in 2009 (16,418) was higher than in any of the four previous years, but the all-cause mortality rate changed little. As Table 3 shows, across states there were wide differences in the amount and direction of change: Alaska and Colorado experienced the most rapid rise in fatal violence; Rhode Island and Utah the steepest decline. At the top and bottom of the range, death rates were remarkably consistent: Four states (Alaska, Utah, New Mexico, and Maryland) were in the highest quartile all five years. Two states (Massachusetts and New Jersey) were in the lowest quartile every year, and two others (Rhode Island and Wisconsin ranked there four out of five years.
Table 3. Percent change in mortality rates, 2005-2009
All means Firearm All Homicides Suicides All Homicides Suicides
Alaska 12.2% -30.5% -6.2% -16.9% -14.2% -22.2% Colorado 6.4% -4.1% 6.8% -1.6% -13.0% 1.6% Georgia 12.0% -6.4% 16.7% 8.4% -3.1% 18.7% Kentucky -3.2% -14.1% -6.2% -8.1% -18.2% -1.6% Maryland 0.5% -20.6% 12.5% -8.9% -23.1% 178.1% Massachusetts 0.9% -5.7% 2.5% -5.0% -0.6% -64.9% New Jersey -4.1% -21.3% 12.9% -9.7% -20.3% 20.0% New Mexico 3.7% -1.7% 2.0% 9.5% 11.7% 2.4% North Carolina -3.8% -22.5% 5.4% -10.4% -16.8% -5.4% Oklahoma 0.1% 9.4% 6.1% 10.0% -1.1% 18.0% Oregon 1.5% -6.3% 6.9% -4.2% -8.1% 0.4% Rhode Island -35.5% -10.3% 67.4% 27.4% -27.3% 87.1% South Carolina -9.3% -11.2% 0.1% -6.6% -10.1% -2.8% Utah -6.1% -19.2% 19.7% 7.6% -6.4% 5.4% Virginia 1.3% -21.9% 5.8% -9.9% -24.4% -2.8% Wisconsin -1.8% -27.8% 8.7% -5.2% -32.2% 13.3% All 0.4% -14.4% 8.2% -2.8% -14.5% 5.3%
Hamilton and Kposowa; BJESBS, 7(2): xxx-xxx, 2015; Article no.BJESBS.2015.073
90
While the level of fatal violence changed little from 2005 to 2009, the incidence of homicide dropped almost 15 per cent in NVDRS states, declining in all but one year (2007) and in 12 of 16 states. Steeper than average declines occurred in states across the range of murder rates—in Alaska (-30.5%), North Carolina (-22.5%), and Maryland (-20.6%) where killings were more frequent to begin with, but also in Wisconsin (-27.8%), and Utah (-19.2%), where they were relatively less so. Firearm homicides declined by almost exactly the same percentage (14.5) as all homicides in these years. In no state was there an increase. The largest decreases occurred in Wisconsin (-32.2%), Rhode Island (-27.3%), Virginia (-24.4%), and Maryland (23.1%), states with quite disparate five-year homicide rates. The smallest gains were likewise among states of varying rank for interpersonal violence: Massachusetts, (-0.6%), Oklahoma (-1.1%), Georgia (-3.1%), and Utah (-6.4%). Despite these divergent rates of change, the same states quite consistently ranked at the top and bottom in both overall and firearm-related homicide: Maryland and South Carolina were in the top quartile in both total and gun-related homicide rates throughout the period. New Mexico was in the top group for total homicides in four of five years, while Georgia and North Carolina ranked with Maryland and South Carolina for gun homicides in all five years. At the opposite end of the scale, Utah and Massachusetts consistently appeared in the lowest quartile for all murders, joined by Rhode Island and Oregon in four of five years. Gun homicide rates were low in both Utah and Oregon in every year and in Massachusetts and Rhode Island in all but one. The number of suicide incidence rose every year from 2006 through 2009, after falling slightly from 2005 to 2006. During this period, the suicide rate for all NVDRS states moved in the opposite direction from homicide, rising 8.2% to 11.9 from 11.0 per 100,000. In only two states (Alaska and Kentucky) did suicides decline; in one other (South Carolina) their number remained essentially unchanged. The largest increases were in two states (Colorado and Utah) where rates were relatively high at the start of the period and two (Rhode Island and Georgia) where they were not. The number of firearm suicides likewise increased in these years, but by only 5.3% as the percentage of shooting deaths diminished slightly. Variation in the direction and extent of change among states was far more
extreme than for all suicides. Half the states experienced a rise in rates, half a decline. In Maryland, gun suicides nearly tripled, but as previously noted, this extreme change is very likely an artifact of reporting deficiencies. In Rhode Island incidence almost doubled in five years; while falling in Massachusetts by close to two-thirds. In all three cases, the entire change occurred in a single year—2009. Such sudden swings are difficult to account for, as nothing like them occurred in suicide deaths from all causes in any of the states in any other year. As with homicide, differences in suicide levels among the states were notably consistent from year to year: Alaska and New Mexico, for example, were in the top quartile in both total and firearm suicides, as was Colorado in all but one. Similarly, Massachusetts, New Jersey, and Rhode Island were regularly in the bottom quartile on both measures. 3.3 Correlates of Violence Although insufficient to support firm conclusions about cause and effect, simple correlations begin to show more precisely how the forms of fatal violence relate to each other. They also indicate the extent to which each may be influenced by population characteristics, firearms availability, and gun control policies, all of which vary considerably among states. This analysis confirms that homicide and suicide rates vary independently but that the use of firearms relates strongly to both. It further reveals that most of the demographic factors commonly thought relevant to the incidence of violence are more closely associated with suicide than homicide, some in surprising ways. The same is true for rates of firearm possession and for strength of gun controls in a state, factors that are themselves closely related. Both are much more predictive of state suicide than homicide rates. 3.3.1 Intent and mechanisms Findings displayed in Table 4 show that the incidence of violent death in states varies quite closely with their rates of suicide (rho = 0.759, P< 0.001) but not homicide (rho = 0.094). This is true for all suicides and homicides as well as those carried out with a gun. Regardless of means, murder and suicide vary independently across states; neither affects the other. The use of firearms, however, is linked to a state’s level of violent death (rho = 0.641, P = 0.01), including both homicide (rho = 0.688, P = 0.01) and
Hamilton and Kposowa; BJESBS, 7(2): xxx-xxx, 2015; Article no.BJESBS.2015.073
91
suicide (rho = 0.585, P = 0.05). Firearm use correlates almost perfectly and in like degree with all-cause homicide and suicide mortality (rho = 0.953 and 0.903, P< 0.001), respectively. Guns do make a difference, whether they are turned on the self or others. 3.3.2 Demographics Several population characteristics have a strong and significant relationship to state levels of violence, but the pattern of relationships is complex, varying by the particular combination of intent and mechanism, Table 5 reveals. Median age stands out as the only demographic factor significantly related to all-cause violent death; it is also the one associated with the widest range of fatal outcomes by intent and mechanism, homicide alone excepted. The race variables—percent white and black—confirm the starkly contrasting patterns of risk already observed. Rural population is surprising for the strength of its positive association with total firearm mortality (0.785, P< 0.001)—suicide (0.621, P = 0.01) more than homicide (0.403, ns), but the sum of both most powerfully of all (0.794, P< 0.001). More rural states are not, it seems the safe havens they are presumed to be. The risk of violence is not confined to more urban environments but more widely dispersed across American society. The consistently negative, if not always significant relationship between more educated populations that are concentrated in metropolitan areas and all measures of fatal violence supports this inference. Median income and poverty as well as income inequality and residential stability (not shown) are notable for their relative unimportance as correlates of violence. 3.3.3 Gun ownership Although the strength of association with various forms of lethal violence differs somewhat between the direct but dated and the more current but extrapolated ownership estimates, the overall pattern is much the same, as seen in Table 6. Both estimates support what advocates of stricter gun control have always argued—that more guns mean more violent death—but not in the way they typically claim. States where guns are more widely owned indeed tend to suffer higher rates of violent death, including higher rates of homicide and suicide combined, by all
means and by firearms in particular. But this is not at all because murders are more frequent, but because suicides, especially gun suicides, are. Among these sixteen states, the availability of reported and presumably legally owned firearms appears to have no statistically significant relationship to their homicide rates, only to their suicide rates, which appear to explain all of the difference in their fatality rates for all gun deaths as well as total homicides and suicides involving guns. Several demographic factors, Table 7 shows, are negatively related to gun ownership, whichever measure is used: Older, more educated populations with higher income and more foreign born persons less frequently acquire firearms. The more highly educated, and immigrants are particularly averse to arming themselves. Only one population characteristic—rural population—is positively associated with having a gun of some sort, and the connection is a very close one. 3.3.4 Gun laws State gun laws “matter,” as the Law Center to Prevent Gun Violence (LCPGV) asserts, and they matter precisely because federal controls are so weak [26]. However, they may not matter—or may not matter only, or even primarily—for the reason gun control advocates usually emphasize. While much of the debate about gun control focuses on interpersonal violence—homicide and non-fatal armed assaults—NVDRS data indicate instead that gun laws may have their most direct and powerful influence on self-inflicted gun violence, on deaths from suicide. Without necessarily contradicting what others purport to demonstrate, this analysis adds another dimension, revealing an even larger but often unconsidered consequence of the failure by most states to regulate a uniquely deadly instrument of violence. Relating state-by-state differences in gun laws to variations in their death rates from suicide as well as homicide, by firearm and all other means, shows that what gun rights advocates insist is a necessary means of self-defense may instead more often be an especially efficient instrument of self-destruction. The analysis further suggests that lax state regulation may contribute to heightened suicide risk to the extent that it encourages wider gun ownership.
Hamilton and Kposowa; BJESBS, 7(2): xxx-xxx, 2015; Article no.BJESBS.2015.073
92
Table 4. Correlation of types and means of violence, 2005-2009
All violent All homicide All suicide All gun Gun homicide Gun suicide All violent 0.285 ***0.759 **0.641 0.094 ***0.759 All homicides -0.038 **0.688 ***0.953 0.097 All suicides *0.585 -0.241 ***0.903 All gun-related *0.559 ***0.753 Gun homicides -0.065 Gun suicides
*P = 0.05, **P = 0.01, ***P< 0.001
Table 5. Correlation of population characteristics and violent death % % Median % Median Foreign %
White Black Age BA+ Income Poverty Born Rural All deaths -0.015 -0.385 ***-0.743 -0.276 -0.212 0.104 -0.350 0.288 All homicides ***-0.821 **0.626 -0.296 -0.347 -0.209 0.233 -0.174 0.424 All suicides 0.356 **-0.671 **-0.667 -0.432 -0.350 0.334 *-0.526 0.465 All gun deaths -0.353 0.106 **-0.633 **-0.668 *-0.500 0.483 *-0.574 ***0.785 Gun homicides ***-0.803 ***0.803 -0.182 -0.315 -0.203 0.228 -0.174 0.403 Gun suicides 0.226 *-0.491 **-0.652 **-0.606 *-0.538 *0.517 *-0.594 **0.621 All H + S -0.282 -0.276 **-0.714 -0.494 -0.412 **0.692 -0.012 *0.562 Gun H + S -0.132 0.026 **-0.689 -0.668 *-0.529 ***0.803 -0.192 ***0.794
*P= 0.05, **P = 0.01,***P< 0.001
Table 6. Correlation of household gun ownership and violence
BRFSS Estimated
2004 2004-2010 All violent deaths *0.588 **0.621 All homicides 0.121 -0.006 All suicides **0.696 ***0.794 All gun deaths **0.654 *0.585 Gun homicides 0.047 -0.088 Gun suicides ***0.777 ***0.765 All H + S **0.614 *0.612 Gun H + S **0.600 *0.606
P = 0.05, P = 0.01,P< 0.001
Table 7. Correlation of state demographics and gun ownership
BRFSS Estimated
2004 2004-2010 % White 0.199 0.397 % Black -0.230 -0.365 Median Age *-0.550 *-0.603 % BA+ ***-0.793 **-0.676 Median Income -0.444 -0.491 Poverty **0.667 0.412 Foreign Born ***-0.898 ***-0.841 % Rural **0.724 **0.671
P = 0.05, P = 0.01, P< 0.001 The Law Center to Prevent Gun Violence (LCPGV) and the more widely known Brady
Campaign have developed scales by which to measure the relative strength of state gun control laws. Each awards points for whatever regulatory measures a state has adopted and then ranks the 50 states in order from most restrictive to least. In scope and content, the two methods are similar, but they differ somewhat in how they categorize the pieces of legislation they recognize and reward, and rather more in the relative weight they place on their categories [22,23]. Across all 50 states, the correlation between the LCPGV and Brady rankings is nonetheless very robust (rho = 0.827, P< 0.001). Applied to the 16 NVDR states, their ratings are mostly congruent but in a few instances (North Carolina, Utah, and Wisconsin) quite divergent. Both ranking systems agree: Four NVDRS states (Alaska, Kentucky, New Mexico, and North Carolina) have the weakest and four (Maryland, Massachusetts New Jersey, and Rhode Island) the strongest controls in the nation. The Center for American Progress (CAP) has matched states’ LCPGV gun control rankings with their ranks on its own composite measure of gun violence, based on data for all 50 states from the Centers for Disease Control and other sources. CAP concludes that there is “a clear link between high levels of gun violence and weak state gun laws,” pointing out that “The 10 states with the weakest gun laws collectively have an aggregate level of gun violence that is
Hamilton and Kposowa; BJESBS, 7(2): xxx-xxx, 2015; Article no.BJESBS.2015.073
93
more than twice as high—104 percent, in fact—[as] the ten states with the strongest gun laws.” Eight of the 10 states with the weakest laws have above average gun violence rates; nine of the 10 with the strongest, have below average rates, and differences in gun controls alone account for 42 percent of the differences in overall gun violence, including non-fatal assaults, according to the authors of the CAP report [27:1, 29]. Using a simpler measure of gun violence levels, LCPGV similarly concludes that “many of the states with the strongest laws also have the lowest gun death rates. Conversely, many states with strongest gun laws have the lowest gun death rates [28: np].” Of the 10 states with the most stringent controls, seven are also among the 10 least violent on their scale [23]. When applied to the 16 NVDRS states, this mode of analysis yields less clear-cut results. Some states conform to the pattern described by CAP and LCPGV, but many do not, falling instead in the less determinate middle, either in strictness of regulation or level of violence. How they match up sometimes depends on the measures chosen. Alaska and New Mexico exemplify states with very weak gun control laws, according to LCPGV, and very high levels of violence on the CAP scale; Massachusetts, New Jersey and Rhode Island are their opposites—states with strong controls and low violence. Oklahoma and Kentucky are similar in pattern to Alaska and New Mexico; Oregon is more like the three Eastern states. Colorado and Virginia are consistent in a different way, matching moderate rankings on both controls and violence. Maryland stands apart as a state with among the strictest controls but above average gun violence; Utah, contrastingly, combines little regulation with below average violence. Other states that depart from expectations in different directions and degrees are Georgia and South Carolina, both very violent states with regulatory ranks in the middle of a distribution heavily skewed toward few restrictions. North Carolina and Wisconsin, one high- the other low-ranking for gun violence, are hard to classify because their guns laws are so disparately rated by LCPGV and the Brady Campaign. Correlating the rank order of state gun law regimes with the several categories of fatal violence distinguished in the NVDRS data
eliminates some of the uncertainty, more precisely quantifying the relationship between gun laws and gun violence in participating states. Linking both sets of numbers with the best available data on gun ownership takes the analysis a step farther. As indicated, the higher a state’s rank, which is to say the more stringent its gun laws, the lower its rate of violent death. This relationship is strong and in most instances statistically significant at a very high probability level, regardless of which ranking system is applied and for all but one class of fatalities—homicides. Gun laws appear to have no relationship, positive or negative, to murder rates in these states, but they do have a close connection with suicide rates, especially when firearms are involved. This relationship is by itself strong enough to influence the incidence of total gun deaths and indeed all violent deaths, as shown in Table 8.
Table 8. Correlation of gun law ranks and
violent death in NVDRS states
Ranking
LCPGV Brady
All violent deaths **0.603 ***0.606 All homicides 0.297 0.019
All suicides ***0.712 ***0.740 All gun deaths ***0.847 *0.571 Gun homicides 0.209 -0.069
Gun suicides ***0.876 ***0.760 All H + S ***0.759 *0.563 Gun H + S ***0.871 **0.624
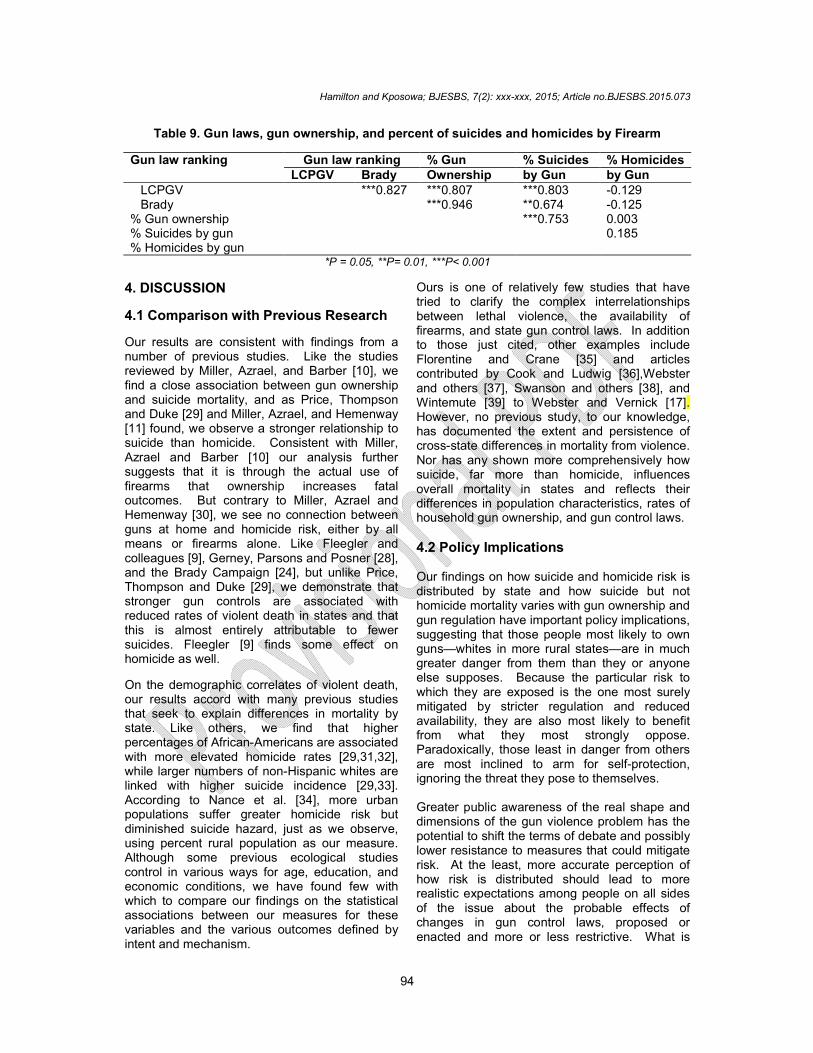
P = 0.05, P = 0.01, P< 0.001 Adding gun ownership to a correlation matrix with the LCPGV and Brady gun law rankings but using a different outcome measure than CAP or LCPGV, one that isolates the role of guns, reveals a strong three-way relationship between gun laws, gun ownership, and the number of suicides carried out with a gun (See Table 9). The direction of cause and effect remains unknown: Strict controls may limit firearms availability in a state, or they may merely reflect the preferences of populations already less inclined to acquire guns. Either way, it is clear that the more people own guns, the more likely they are to use them against themselves, if not necessarily against others.
Hamilton and Kposowa; BJESBS, 7(2): xxx-xxx, 2015; Article no.BJESBS.2015.073
94
Table 9. Gun laws, gun ownership, and percent of suicides and homicides by Firearm
Gun law ranking Gun law ranking % Gun % Suicides % Homicides LCPGV Brady Ownership by Gun by Gun
LCPGV ***0.827 ***0.807 ***0.803 -0.129 Brady ***0.946 **0.674 -0.125 % Gun ownership ***0.753 0.003 % Suicides by gun 0.185 % Homicides by gun
*P = 0.05, **P= 0.01, ***P< 0.001
4. DISCUSSION
4.1 Comparison with Previous Research
Our results are consistent with findings from a number of previous studies. Like the studies reviewed by Miller, Azrael, and Barber [10], we find a close association between gun ownership and suicide mortality, and as Price, Thompson and Duke [29] and Miller, Azrael, and Hemenway [11] found, we observe a stronger relationship to suicide than homicide. Consistent with Miller, Azrael and Barber [10] our analysis further suggests that it is through the actual use of firearms that ownership increases fatal outcomes. But contrary to Miller, Azrael and Hemenway [30], we see no connection between guns at home and homicide risk, either by all means or firearms alone. Like Fleegler and colleagues [9], Gerney, Parsons and Posner [28], and the Brady Campaign [24], but unlike Price, Thompson and Duke [29], we demonstrate that stronger gun controls are associated with reduced rates of violent death in states and that this is almost entirely attributable to fewer suicides. Fleegler [9] finds some effect on homicide as well.
On the demographic correlates of violent death, our results accord with many previous studies that seek to explain differences in mortality by state. Like others, we find that higher percentages of African-Americans are associated with more elevated homicide rates [29,31,32], while larger numbers of non-Hispanic whites are linked with higher suicide incidence [29,33]. According to Nance et al. [34], more urban populations suffer greater homicide risk but diminished suicide hazard, just as we observe, using percent rural population as our measure. Although some previous ecological studies control in various ways for age, education, and economic conditions, we have found few with which to compare our findings on the statistical associations between our measures for these variables and the various outcomes defined by intent and mechanism.
Ours is one of relatively few studies that have tried to clarify the complex interrelationships between lethal violence, the availability of firearms, and state gun control laws. In addition to those just cited, other examples include Florentine and Crane [35] and articles contributed by Cook and Ludwig [36],Webster and others [37], Swanson and others [38], and Wintemute [39] to Webster and Vernick [17]. However, no previous study, to our knowledge, has documented the extent and persistence of cross-state differences in mortality from violence. Nor has any shown more comprehensively how suicide, far more than homicide, influences overall mortality in states and reflects their differences in population characteristics, rates of household gun ownership, and gun control laws.
4.2 Policy Implications Our findings on how suicide and homicide risk is distributed by state and how suicide but not homicide mortality varies with gun ownership and gun regulation have important policy implications, suggesting that those people most likely to own guns—whites in more rural states—are in much greater danger from them than they or anyone else supposes. Because the particular risk to which they are exposed is the one most surely mitigated by stricter regulation and reduced availability, they are also most likely to benefit from what they most strongly oppose. Paradoxically, those least in danger from others are most inclined to arm for self-protection, ignoring the threat they pose to themselves.
Greater public awareness of the real shape and dimensions of the gun violence problem has the potential to shift the terms of debate and possibly lower resistance to measures that could mitigate risk. At the least, more accurate perception of how risk is distributed should lead to more realistic expectations among people on all sides of the issue about the probable effects of changes in gun control laws, proposed or enacted and more or less restrictive. What is
Hamilton and Kposowa; BJESBS, 7(2): xxx-xxx, 2015; Article no.BJESBS.2015.073
95
most acceptable may not be most effective. For example, universal background checks aimed at preventing persons deemed at special risk of violence, the most widely supported gun control measure, may do less than hoped to reduce suicide. The guns that our data show elevate suicide risk were freely reported, thus no doubt legally owned by people not barred from acquiring them. Other research shows that few of the firearms people turn on themselves were purchased close to the event or for that purpose. [40]. Identifying by mental state those individuals truly likely to harm themselves is more problematic than commonly thought, given how few of the similarly afflicted actually become dangers on the one hand, and how negative the consequences when too many are stigmatized. Of course, the debate over gun violence and what to do about it is not just a dispute over facts and practicalities but more intractably a conflict of values, some of them having nothing to do with guns themselves. Suicide may claim twice as many lives as homicide but still not be half as frightening or morally abhorrent. Taking one’s own life can be seen as a matter of personal choice, whether reasonable or not; taking another’s is the ultimate denial of their choice. Belief in the virtue, necessity, and efficacy of self-protection may seem misplaced when applied to deadly weapons, but self-help, personal liberty and mistrust of government are not just the rallying cry of the gun lobby; they are values deeply rooted in American culture, widely shared, and impossible to argue against. If discussion of gun control policy on the street and in legislative chambers is distorted by misperceptions of risk and stalemated by cultural and ideological conflict, it is also influenced by a perfectly reasonable calculation. Although a strong case is made here and by others that guns, legally acquired for legitimate use by ordinary people, do kill by their very availability, the fact remains that murder and even suicide are rare events, easier to imagine befalling unknown others than ourselves. However distributed, the risk is still small. Relatively few of the many million guns owned by many million Americans will ever do harm, arithmetic easily exploited by gun rights advocates and hard to overcome by gun control proponents. Still, the number of lives at stake is not trivial. If the eight NVDRS states with higher than average rates of suicide and homicide combined reduced fatalities to the level of all 16, over 900 lives would be spared every year. If they achieved the average
of the four least violent, the number would reach 3,000 in these few states alone.
4.3 Limitations While presenting a clearer, more detailed picture of the pattern of variation in risk of violent death by specific intent and mechanism across space and time, the present study in no way transcends the limits of previous efforts to determine the influence of ownership, regulation, and population characteristics on these outcomes. These limitations pertain to both the data used and the method of analysis employed. Our data covers only 16 states over a period of five years, and all of it is aggregated at the state level. As a consequence, the analysis is mainly descriptive, supplemented by bivariate measures of association, which undoubtedly overstate the apparent effects of ownership and regulation considered in isolation from other influences.
5. CONCLUSION Examining 16 of 18 states that so far have opted to participate in the National Violent Death Reporting System (NVDRS) over the years 2005-2009, we have found wide disparities in the incidence of violent death by all intents and mechanisms. The differences among these demographically representative states located in all regions of the United States, are particularly great when firearms are used, whether to kill others, or even more, oneself. As we have seen , people living in the most violent state for each type of outcome are exposed to many times the risk of death than those in the least— six times the risk of being murdered with a gun, and between seven and eight times the risk of shooting themselves. At the extremes, these differences persist from year-to-year, despite marked changes in suicide and especially homicide rates, both nationally and in this particular group of states. Over the five-year period examined. The most and least violent states in each category were consistently in the top and bottom incidence quartiles. Through bivariate analysis, we have shown how the forms of lethal violence relate to each other and how differences in levels of violent death among NVDRS states are related to variations in their population characteristics, rates of reported gun ownership, and relative strength of gun controls, factors that are all inter-related. Cross-state differences in mortality from violence correlate with suicide but not homicide rates,
Hamilton and Kposowa; BJESBS, 7(2): xxx-xxx, 2015; Article no.BJESBS.2015.073
96
which vary independently. But where guns are more often the cause of death, both homicide and suicide rates are higher, which is reflected in higher rates of total violent mortality. Several demographic factors emerged in our analysis as correlates of one form or another of violent death. Percent white and black population have the expected relationships to homicide—negative for whites, positive for blacks—and to suicide, the opposite but significant only for blacks. A higher percentage of whites is also associated with more prevalent gun ownership, the opposite for percentage of blacks, but neither relationship is significant. Median age is negatively associated with all fatal outcomes and strongly so, except for homicide by firearm or other means, possibly because age in our data is also inversely related to household gun ownership. Percent of college-educated population is likewise negatively associated with mortality, but significantly only with all firearm deaths and firearm suicide. Particularly relevant to our focus on risk distribution is the finding that rural population is significantly associated with total gun fatalities—suicide more than homicide—and also to gun ownership, as expected. Finally, our analysis reveals household gun ownership to be a powerful correlate of fatal violence in every dimension except homicide, an association that is strongest of all for firearm suicide. The often overlooked importance of suicide risk again stands out in the correlations between the comprehensiveness of state gun control laws and violent death from all causes, save homicide, and the links between firearm regulation, ownership, and suicide.
COMPETING INTERESTS Authors have declared that no competing interests exist.
REFERENCES 1. Parks SE, Johnson LL, McDaniel DD,
Gladden M. Surveillance for violent deaths—National Violent Death Reporting System, 16 states, 2014. Morbidity and Mortality Weekly Report, Surveillance Summaries. 2014;63:1.
2. Organization for Economic Cooperation and Development. Health at a glance OECD indicators. 2011;1(6):34-35 Accessed: August 11, 2014. Available:www.oecd.org/els/health-systems/Health-at-a-Glance-2011.pdf39
3. United Nations Office on Drugs and Crime, UNODC Homicide Statistics: Homicide statistics and Homicides by firearms; 2012. Accessed: August 11, 2014. Available:www.unodc.org/unodc/-en/data-and-analysis/homicide.html
4. Organization for Economic Cooperation and development health at a glance, OECD indicators. 2013;1(6):35-36. Accessed: July 31, 2014. Available:www.oecd.org/els/health-OECDsystems/Health-at-a-Glance-2013.pdf
5. Centers for Disease Control and prevention deaths: final data for 2010. National Vital Statistics Reports. 2013;61:4.
6. Small Arms Survey. Small arms survey, guns and the city. Cambridge: Cambridge University Press; 2007.
7. Federal Bureau of Investigation. Crime in the United States, Uniform Crime Report, Table 20: Murder by state and type of weapon, 2009-2011; 2012. Accessed: February 23, 2013. Available: www.fbi.gov/about-us/cjis/ucr-publications#Crime
8. Centers for Disease Prevention and Control. Fatal Injury Reports; 2014. Accessed: November 3, 2014. Available:www.cdc.gov/injury/wisqars/fatal.html
9. Hepburn LM, Hemenway D Firearm availability and homicide: A review of the literature. Aggression and Violent Behavior. 2004;9:417-440.
10. Miller M, Azrael D, Barber C. Suicide mortality in the United States: The importance of attending to method in understanding population-level disparities in the burden of suicide, Annual Review of Public Health. 2012;33:393-408.
11. Miller M, Azrael D, Hemenway D. Firearms and violent death in the United States. In: Webster DW, Vernick, JS, editors, Reducing gun violence in America: Informing policy with evidence and analysis. Baltimore: Johns Hopkins University Press. 2013;3-20.
12. Fleegler EW, Lee LK, Momuteaux MC, Hemenway D, Mannix R. Firearm legislation and firearm-related fatalities in the United States. JAMA Internal Medicine. 2013;173:732-40.
13. Wintemute GJ. Responding to the crisis of firearm violence in the United States: Comment on “Firearm legislation and
Hamilton and Kposowa; BJESBS, 7(2): xxx-xxx, 2015; Article no.BJESBS.2015.073
97
firearm-related fatalities in the United States,” JAMA Internal Medicine. 2013; 173(9):740-744.
14. Miller M, Azrael D, Hemenway D. Rates of household firearm ownership and homicide across US regions and states. American Journal of Public Health. 2002a;92(12): 1988-1993.
15. Miller M, Azrael D, Hemenway D. Household firearm ownership and suicide rates in the United States. Epidemiology. 2002b;13.5:517-524.
16. Miller M, Azrael C, Hepburn LM, Hemenway D, Lippman S. The associations between changes in household firearm ownership and rates of suicide in the United States, 1981-2002. Injury Prevention. 2006;12:178-182.
17. National Opinion Research Center. General social survey (GSS); 2012. Accessed: January 14, 2014. Available:www.sda.-berkeley.edu/cgibin/hsda3
18. Centers for Disease Prevention and Control. Behavioral risk factor surveillance system (BRFSS); 2004. Accessed: September 19, 2014.
Available:www.cdc.gov/brfss/annual_data/annual_2004.htm
19. Centers for Disease Prevention and Control, National Violent Death Reporting System (NVDRS). Accessed: December 14, 2013. Available:www.cdc.gov/injury/wisqars/nvdrs.html, http://wisqars.cdc.gov:8080/-nvdrs/-nvdrsDisplay.jsp
20. Centers for Disease Prevention and Control. National Violent Death Reporting System Coding manual. 2008;3:2-3.
21. US Census. American Fac tFinder, Table DP-1 Profile of general population and housing characteristics; 2010. Accessed: March 9, 2013. Available: http://factfinder2.census.gov
22. Hanneman RA, Kposowa AJ, Riddle MD. Basic statistics in social research, Ch. 2013;13:425-452. Wiley. Accessed: May 6, 2014. Available:www.wiley.com/-wileyCDA/WileyTitle/productCD-1118234154.html
23. Law Center to Prevent Gun Violence. State law summaries; 2013. Accessed: July 25, 2013. Available: www.smartgunlaws.org/-search-gun-law-by-state
24. Brady, Brady Campaign to Prevent Gun Violence, 2011 State Rankings; 2013. Accessed: August 13, 2013. Available:www.brady-campaign.org/?q=programs/million-mom-march/state-gun-laws/
25. American Community Survey. American Factfinder, Table S0201: Selected population profile in the United States, American Community Survey 3-year estimates; 2013. Accessed: February 4, 2013. Available: http://factfinder2.census.gov
26. US Census, Table 29. Urban and Rural Population by State; 2010. Accessed: February 4, 2013. Available: www.census.gov/-geo/www/ua/-2010urbanruralclass.html
27. Gerney A, Parson C, Posner C. America under the gun: A 50-state analysis of gun violence and its link to weak state gun laws. Washington, DC: Center for American Progress; 2013.
28. Law Center to Prevent Gun Violence. Gun laws matter, 2012: Understanding the link between weak gun laws and gun violence; 2012. Accessed: August 10, 2013. Available: www.smart-gunlaws.org/gun-laws-matter-2012-understanding-the-link-between-weak-gun-laws-and-gun-violence/
29. Price JH, Thompson AJ, Duke JA. Factors associated with state variations in homicide, suicide, and unintentional firearm deaths. Journal of Community Health. 2004;29(4):271-283.
30. Miller M, Azrael D, Hemenway D. State-level homicide victimization rates in the U. S. in relation to survey measures of household firearm ownership, 2001-2003, Social Science and Medicine. 2007;64(3): 646-654.
31. Kposowa AJ. The effects of occupation and industry on the risk of homicide victimization in the United States. Homicide Studies 3:47. Sage Publications; 1999. Accessed: December 16, 2013. Available: http://hsx.sagepub.com/
32. Siegel M, Ross CS and King C. The relationship between gun ownership and firearm homicide rates in the United States, 1981-2010. American Journal of Public Health. 2013;103.11:2098-2105.
33. Andres AR, Hempstead K. Gun control and suicide: The impact of state firearm regulations in the United States, 1995-2004, Health Policy. 2011;101:95-103.
Hamilton and Kposowa; BJESBS, 7(2): xxx-xxx, 2015; Article no.BJESBS.2015.073
98
34. Nance ML, Carr BG, Kallan MJ, Branas CC, Wiebe DJ. Variations in pediatric and adolescent firearm mortality rates in rural and urban U.S. counties. Pediatrics. 2010;125(6):1112-1118.
35. Florentine JB, Crane C. Suicide prevention by limiting access to methods: A review of theory and practice, Social Science and Medicine. 2011;70:1626-1632.
36. Cook PJ, Ludwig J. The limited impact of the Brady Act: an evaluation. In: Webster DW, Vernick, JS, editors, Reducing gun violence in America: informing policy with evidence and analysis. Baltimore: Johns Hopkins University Press. 2013;21-32.
37. Webster DW, Vernick JS, Mc Ginty EE, Alcorn T. Preventing the diversion of guns to criminals through effective firearm sales laws. In: Webster DW, Vernick, JS, editors, Reducing gun violence in America: informing policy with evidence and analysis. Baltimore: Johns Hopkins University Press. 2013;109-122.
38. Swanson JW, Robinson AG, Frisman LK, Norko MA, Lin HJ et al. Preventing gun violence involving people with serious mental illness. In: Webster DW, Vernick, JS, editors, Reducing gun violence in America: informing policy with evidence and analysis. Baltimore: Johns Hopkins University Press. 2013;32-52.
39. Wintemute GJ. Broadening denial criteria for the purchase and possession of firearms: Need, feasibility, and effectiveness. In: Webster DW, Vernick, JS, editors, Reducing gun violence in America: informing policy with evidence and analysis. Baltimore: Johns Hopkins University Press. 2013;77-94.
40. Betz ME, Barber C, Miller M. Suicidal behavior and firearm access: Results from the Second Injury Control and Risk Survey. Suicide and Life-Threatening Behavior. 2011;41(4):384-391.
_________________________________________________________________________________ © 2015 Hamilton and Kposowa; This is an Open Access article distributed under the terms of the Creative Commons Attribution License (http://creativecommons.org/licenses/by/4.0), which permits unrestricted use, distribution, and reproduction in any medium, provided the original work is properly cited.
Peer-review history: The peer review history for this paper can be accessed here:
http://www.sciencedomain.org/review-history.php?iid=823&id=21&aid=8157

![Firearms] - Construction Guide - Russian PPSH41 Sub Machine Gun - Complete Machinist Drawings](https://img.pdfslide.net/doc/110x75/5571f7be49795991698be8c1/firearms-construction-guide-russian-ppsh41-sub-machine-gun-complete-machinist-drawings.jpg)