Embed Size (px)
Citation preview
Fires and the Contemporary Global Carbon Cycle
Guido van der Werf (Free University, Amsterdam, Netherlands)
In collaboration with:
Jim Randerson (UCI, CA, USA)
Louis Giglio (SSAI, MD, USA)
Prasad Kasibhatla (Duke University, NC, USA)
Jim Collatz (NASA GSFC, MD, USA)
Main Objectives
1. Quantify the contemporary amount of biomass burned on a global scale
2. Assess the role of biomass burning in the global CO2 and CH4 cycle
3. Determine the climate sensitivity of biomass burning
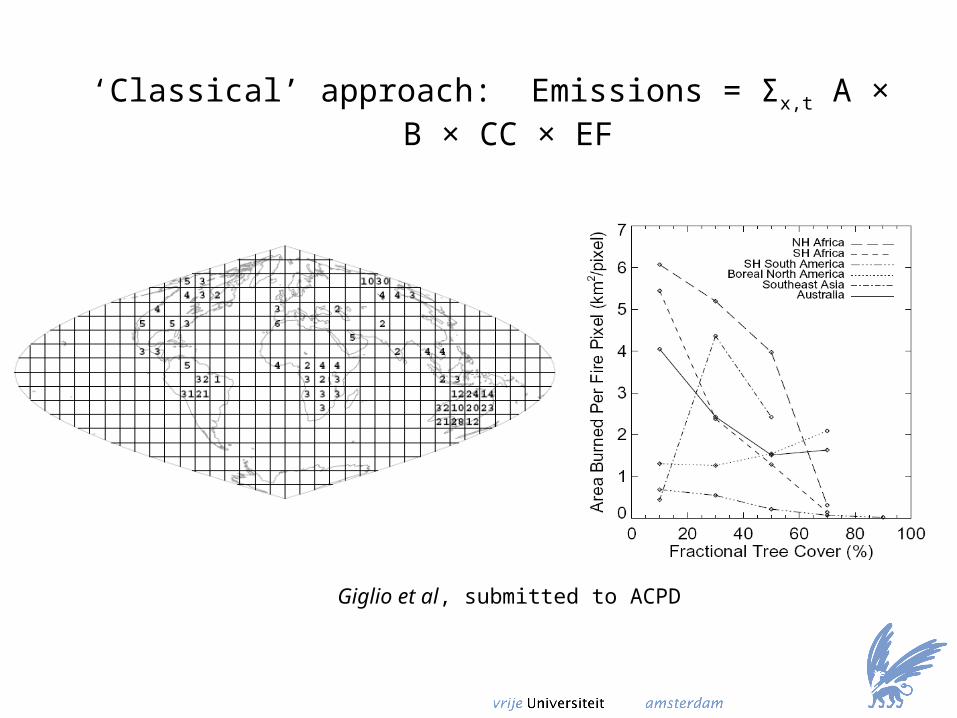
‘Classical’ approach: Emissions = Σx,t A × B × CC × EF
Giglio et al, submitted to ACPD
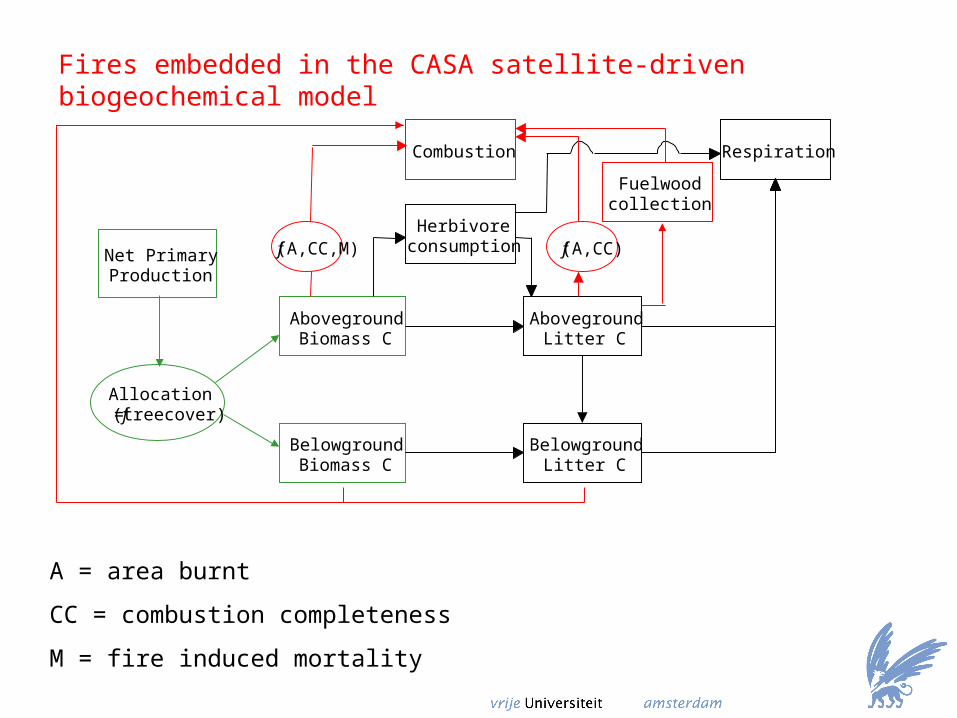
Net PrimaryProduction
Allocation=f (treecover)
AbovegroundBiomass C
BelowgroundBiomass C
Combustion
BelowgroundLitter C
AbovegroundLitter C
f(A,CC,M) f(A,CC)
Respiration
Fuelwoodcollection
Herbivoreconsumption
A = area burnt
CC = combustion completeness
M = fire induced mortality
Fires embedded in the CASA satellite-driven biogeochemical model
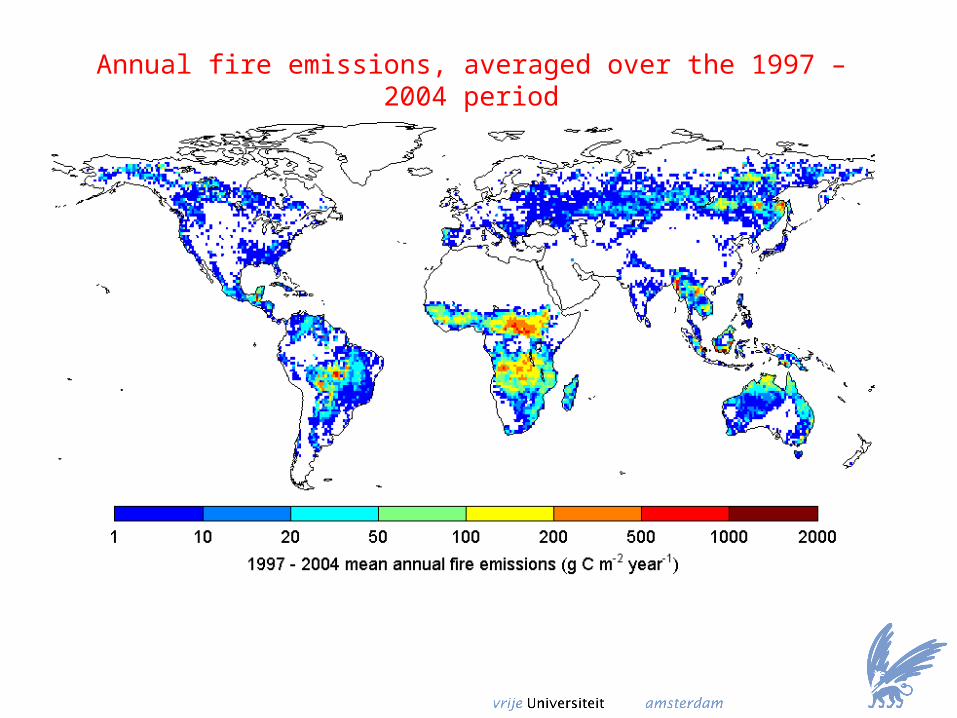
Annual fire emissions, averaged over the 1997 – 2004 period
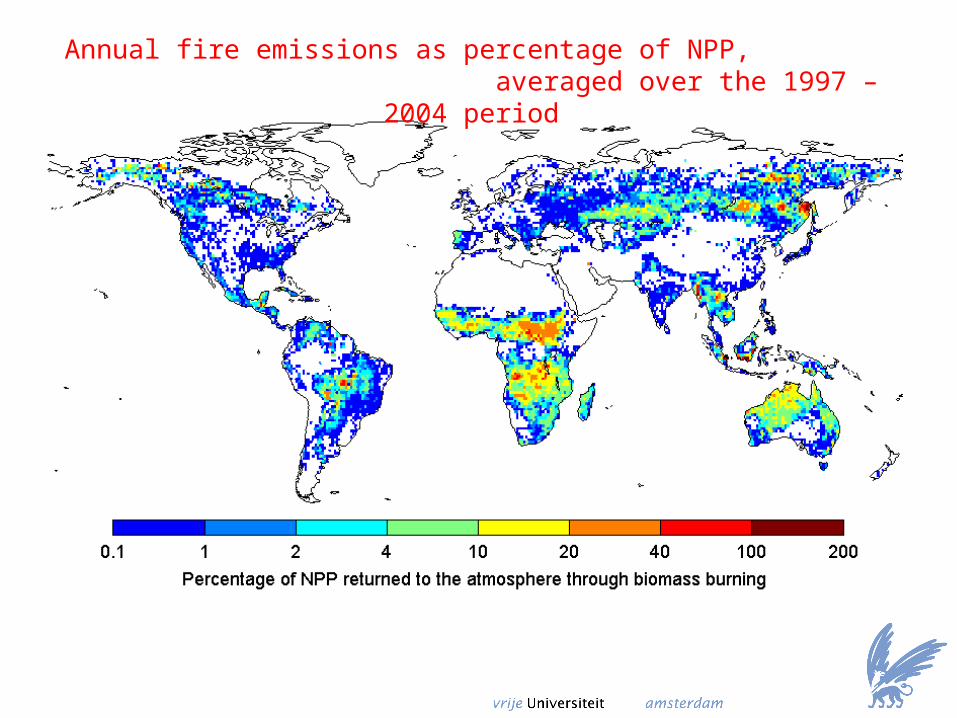
Annual fire emissions as percentage of NPP, averaged over the 1997 – 2004 period
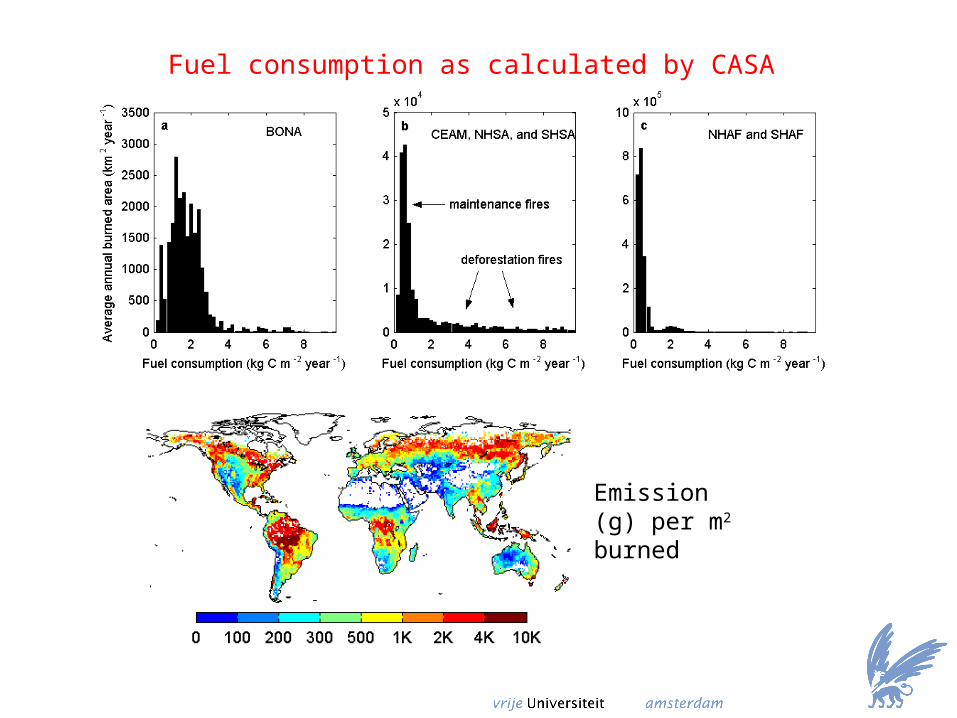
Fuel consumption as calculated by CASA
Emission (g) per m2 burned
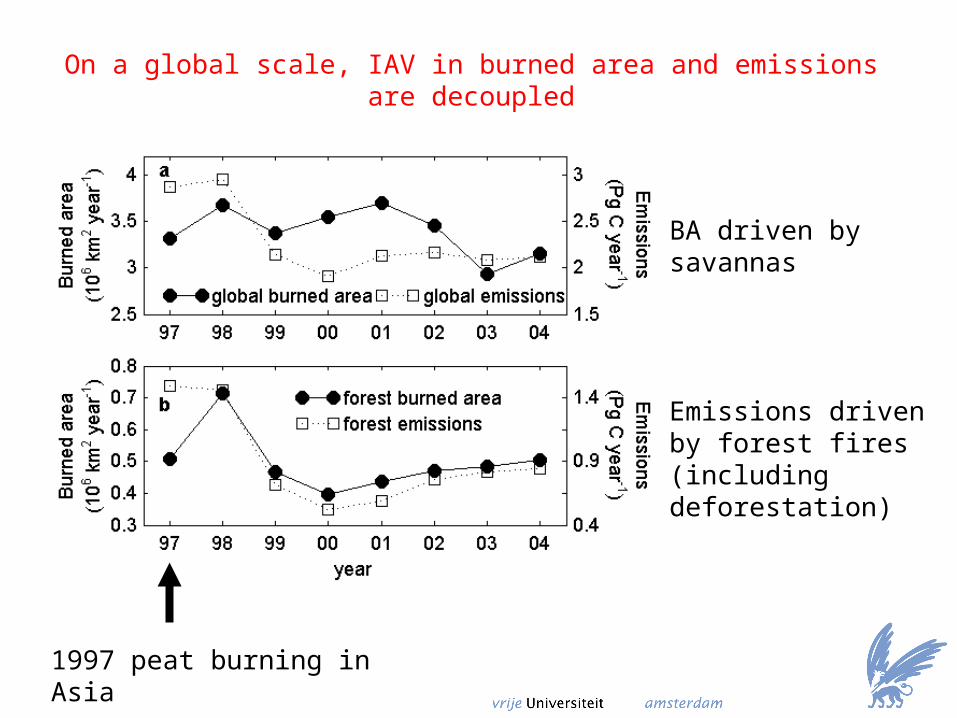
On a global scale, IAV in burned area and emissions are decoupled
BA driven by savannas
Emissions driven by forest fires (including deforestation)
1997 peat burning in Asia
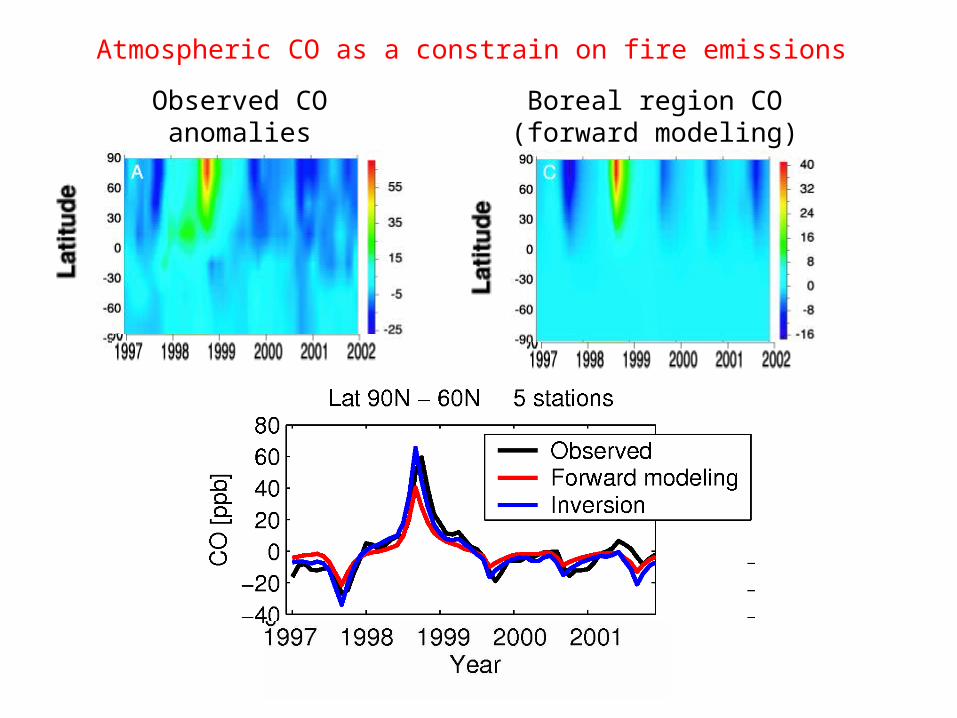
Observed CO anomalies
Boreal region CO (forward modeling)
Atmospheric CO as a constrain on fire emissions
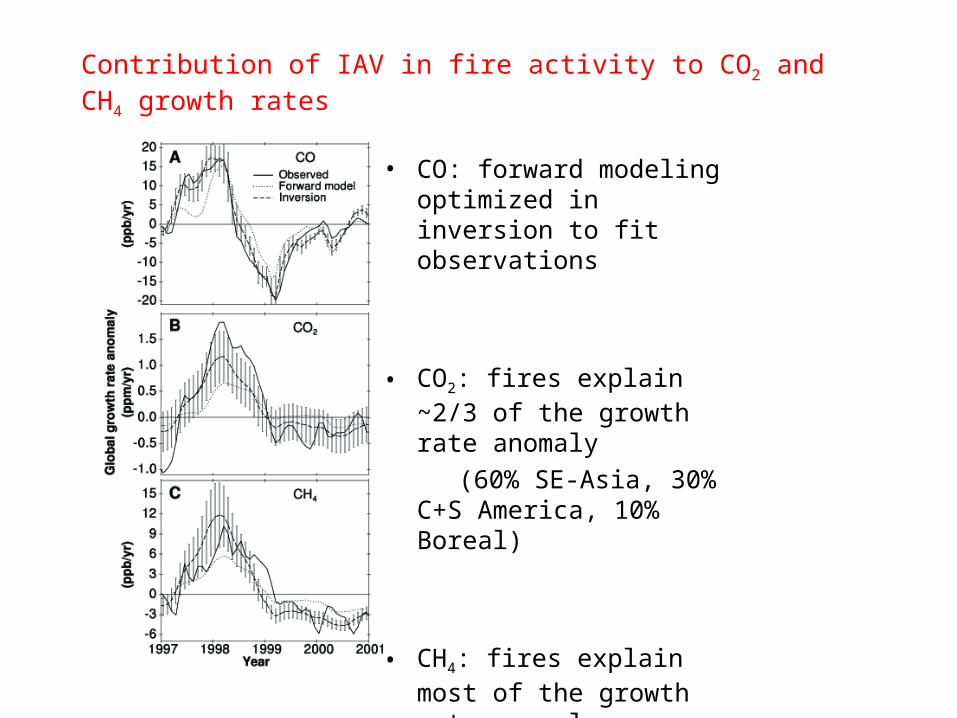
• CO: forward modeling optimized in inversion to fit observations
• CO2: fires explain ~2/3 of the growth rate anomaly
(60% SE-Asia, 30% C+S America, 10% Boreal)
• CH4: fires explain most of the growth rate anomaly.
Contribution of IAV in fire activity to CO2 and CH4 growth rates
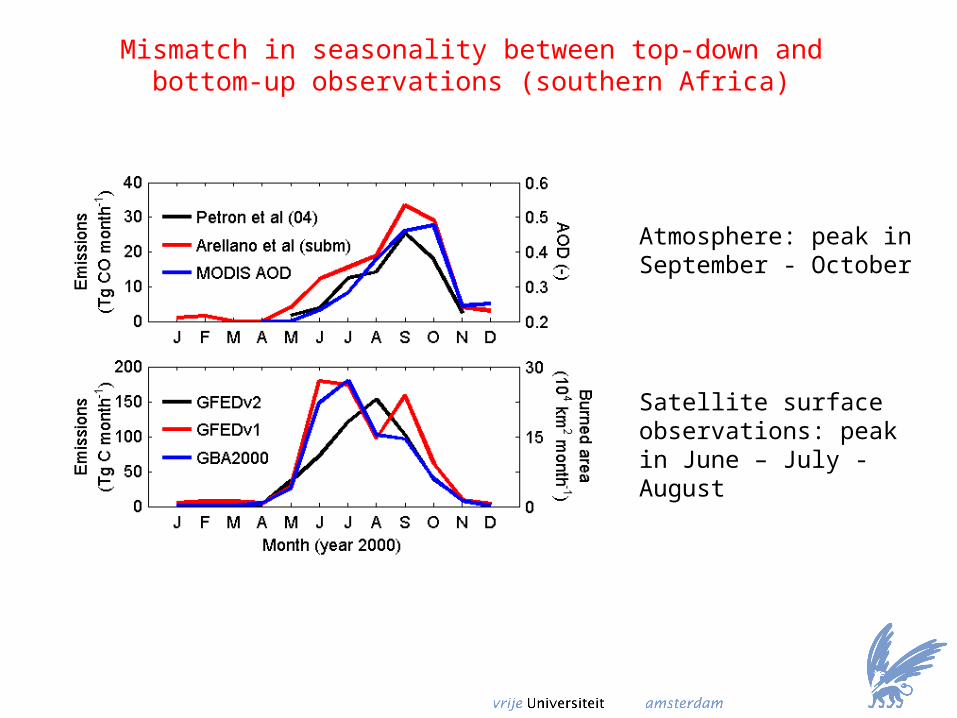
Mismatch in seasonality between top-down and bottom-up observations (southern Africa)
Atmosphere: peak in September - October
Satellite surface observations: peak in June – July - August
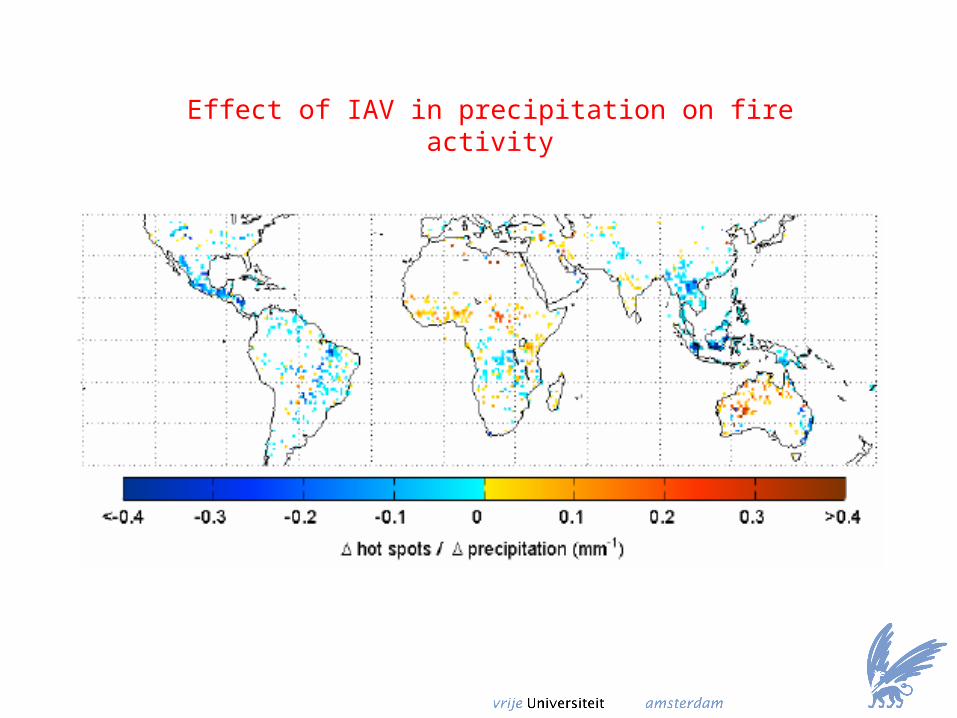
Effect of IAV in precipitation on fire activity
Concluding remarks
1. Global (vegetation) fire emissions as calculated by our modeling framework is ~2.5 Pg C / year, largest uncertainties in deforestation regions
2. IAV in fire emissions contributed significantly to variability in the 1997-2001 growth rate of CO2 and CH4.
3. IAV in fire emissions is dominated by IAV in forest fires. Implications:
• IAV in burned area and emissions are decoupled
• IAV in CO and CH4 is larger than IAV in C or CO2
4. (Multi-specie) inversions and high resolution (deforestation) fire modelling ideally employed to further improve estimates