Embed Size (px)
DESCRIPTION
Vail Valley area reports for first quarter of 2014
Citation preview
www.TeamBlackBear.com [email protected] 970.337.7777
Vail Valley / Eagle County
Market Repor t
March 2014 – 1 st Quar t er
Key Metrics 2013 2014Percent Change
from Previous Year Thru Q1-2013 Thru Q1-2014Percent Change
from Previous Year
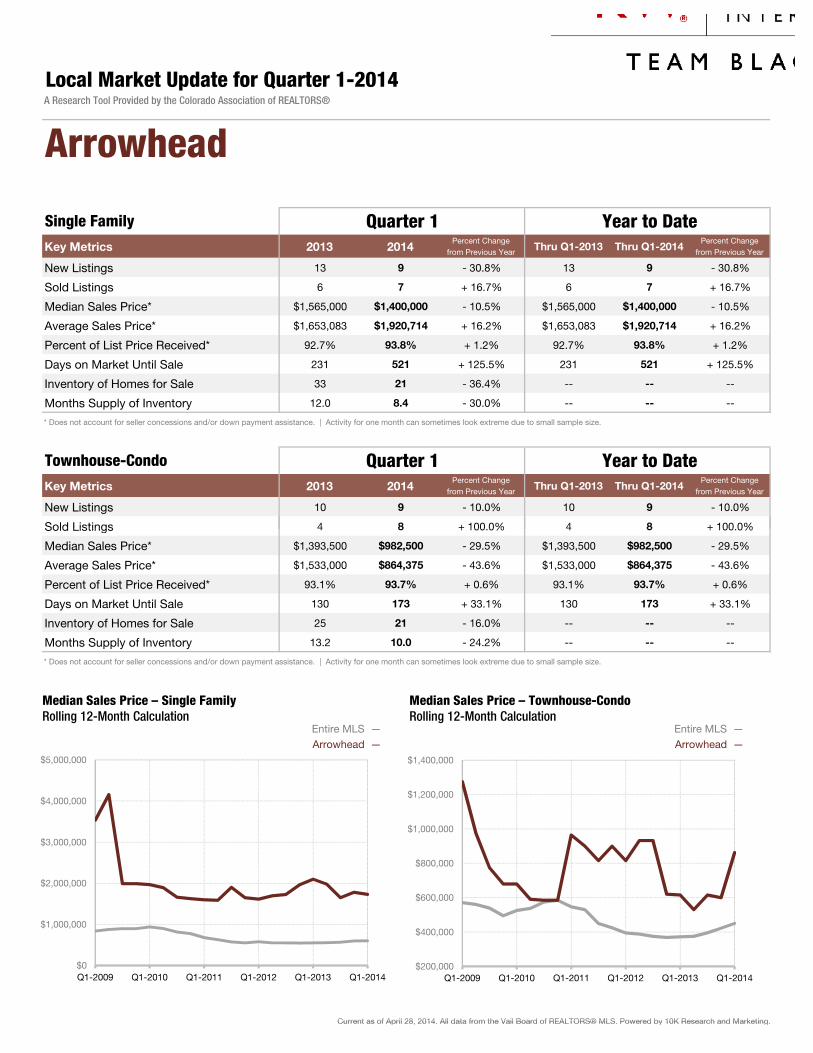
New Listings 13 9 - 30.8% 13 9 - 30.8%
Sold Listings 6 7 + 16.7% 6 7 + 16.7%
Median Sales Price* $1,565,000 $1,400,000 - 10.5% $1,565,000 $1,400,000 - 10.5%
Average Sales Price* $1,653,083 $1,920,714 + 16.2% $1,653,083 $1,920,714 + 16.2%
Percent of List Price Received* 92.7% 93.8% + 1.2% 92.7% 93.8% + 1.2%
Days on Market Until Sale 231 521 + 125.5% 231 521 + 125.5%
Inventory of Homes for Sale 33 21 - 36.4% -- -- --
Months Supply of Inventory 12.0 8.4 - 30.0% -- -- --
* Does not account for seller concessions and/or down payment assistance. | Activity for one month can sometimes look extreme due to small sample size.
Key Metrics 2013 2014Percent Change
from Previous Year Thru Q1-2013 Thru Q1-2014Percent Change
from Previous Year
New Listings 10 9 - 10.0% 10 9 - 10.0%
Sold Listings 4 8 + 100.0% 4 8 + 100.0%
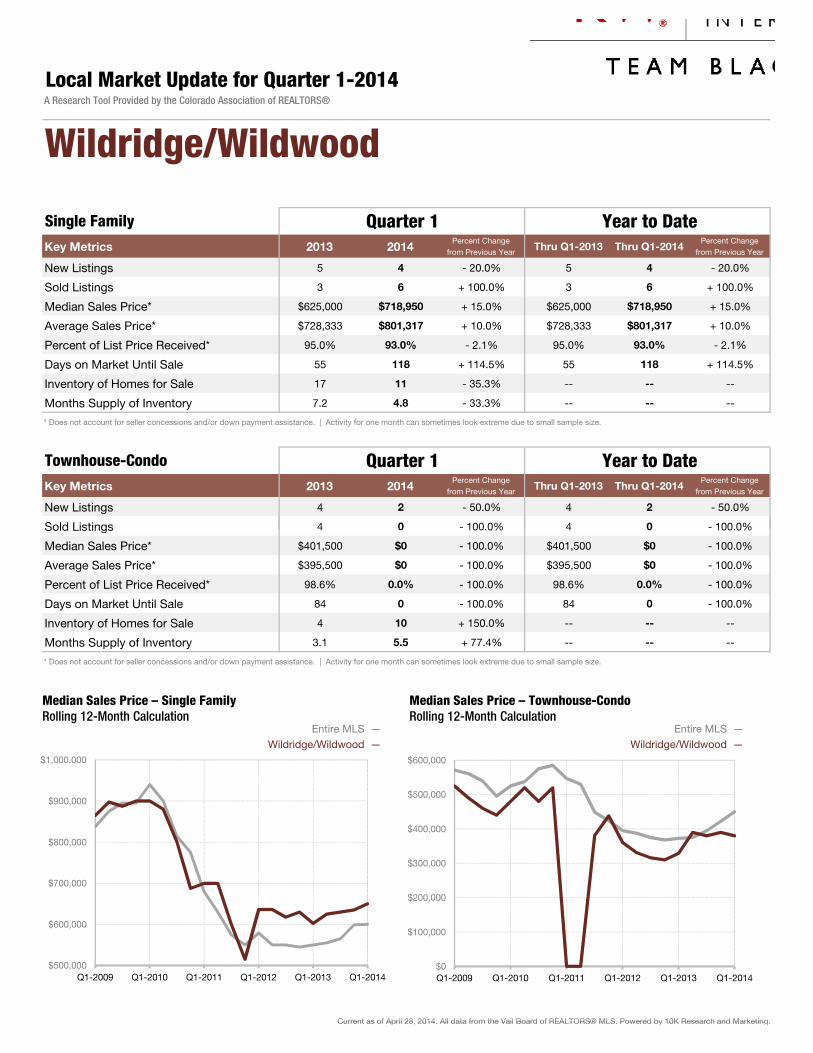
Local Market Update for Quarter 1-2014A Research Tool Provided by the Colorado Association of REALTORS®
Arrowhead
Quarter 1 Year to Date
Quarter 1 Year to DateSingle Family
Townhouse-Condo
Sold Listings 4 8 + 100.0% 4 8 + 100.0%
Median Sales Price* $1,393,500 $982,500 - 29.5% $1,393,500 $982,500 - 29.5%
Average Sales Price* $1,533,000 $864,375 - 43.6% $1,533,000 $864,375 - 43.6%
Percent of List Price Received* 93.1% 93.7% + 0.6% 93.1% 93.7% + 0.6%
Days on Market Until Sale 130 173 + 33.1% 130 173 + 33.1%
Inventory of Homes for Sale 25 21 - 16.0% -- -- --
Months Supply of Inventory 13.2 10.0 - 24.2% -- -- --
* Does not account for seller concessions and/or down payment assistance. | Activity for one month can sometimes look extreme due to small sample size.
Current as of April 28, 2014. All data from the Vail Board of REALTORS® MLS. Powered by 10K Research and Marketing.
Arrowhead — Entire MLS — Entire MLS —
Arrowhead —
$0
$1,000,000
$2,000,000
$3,000,000
$4,000,000
$5,000,000
Q1-2009 Q1-2010 Q1-2011 Q1-2012 Q1-2013 Q1-2014
Median Sales Price – Single FamilyRolling 12-Month Calculation
$200,000
$400,000
$600,000
$800,000
$1,000,000
$1,200,000
$1,400,000
Q1-2009 Q1-2010 Q1-2011 Q1-2012 Q1-2013 Q1-2014
Median Sales Price – Townhouse-Condo Rolling 12-Month Calculation
Current as of April 28, 2014. All data from the Vail Board of REALTORS® MLS. Powered by 10K Research and Marketing.
Key Metrics 2013 2014Percent Change
from Previous Year Thru Q1-2013 Thru Q1-2014Percent Change
from Previous Year
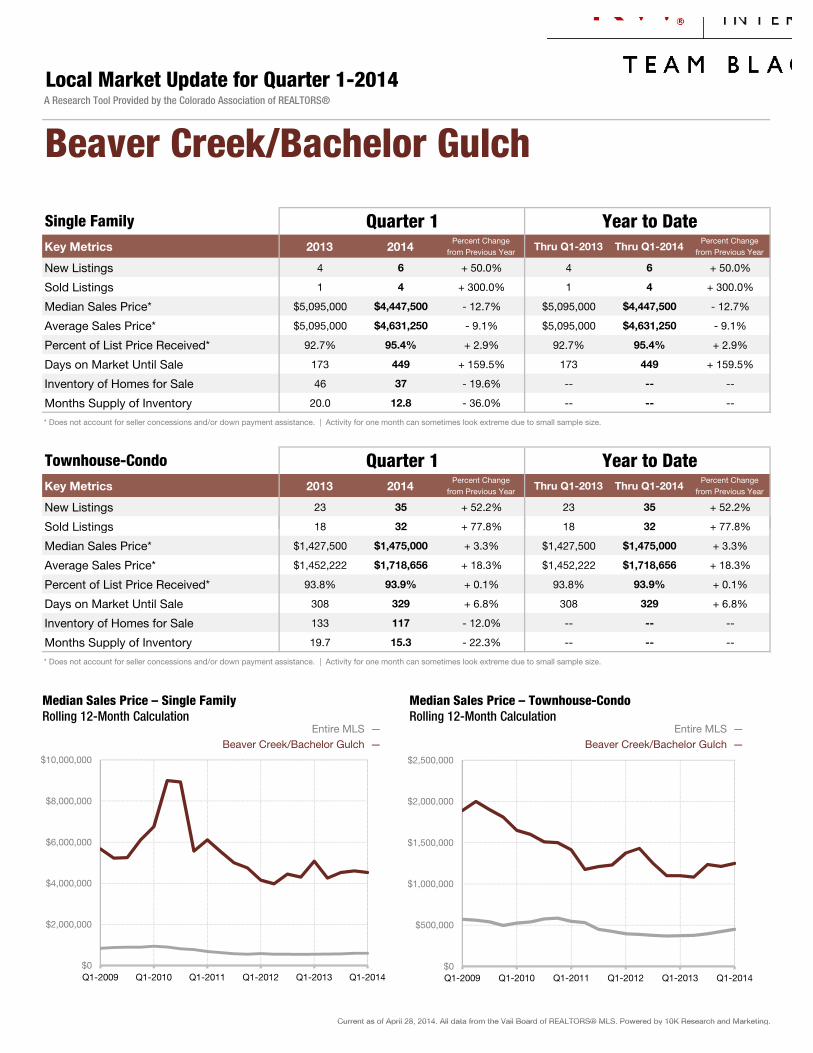
New Listings 4 6 + 50.0% 4 6 + 50.0%
Sold Listings 1 4 + 300.0% 1 4 + 300.0%
Median Sales Price* $5,095,000 $4,447,500 - 12.7% $5,095,000 $4,447,500 - 12.7%
Average Sales Price* $5,095,000 $4,631,250 - 9.1% $5,095,000 $4,631,250 - 9.1%
Percent of List Price Received* 92.7% 95.4% + 2.9% 92.7% 95.4% + 2.9%
Days on Market Until Sale 173 449 + 159.5% 173 449 + 159.5%
Inventory of Homes for Sale 46 37 - 19.6% -- -- --
Months Supply of Inventory 20.0 12.8 - 36.0% -- -- --
* Does not account for seller concessions and/or down payment assistance. | Activity for one month can sometimes look extreme due to small sample size.
Key Metrics 2013 2014Percent Change
from Previous Year Thru Q1-2013 Thru Q1-2014Percent Change
from Previous Year
New Listings 23 35 + 52.2% 23 35 + 52.2%
Sold Listings 18 32 + 77.8% 18 32 + 77.8%
Local Market Update for Quarter 1-2014A Research Tool Provided by the Colorado Association of REALTORS®
Beaver Creek/Bachelor Gulch
Quarter 1 Year to Date
Quarter 1 Year to DateSingle Family
Townhouse-Condo
Sold Listings 18 32 + 77.8% 18 32 + 77.8%
Median Sales Price* $1,427,500 $1,475,000 + 3.3% $1,427,500 $1,475,000 + 3.3%
Average Sales Price* $1,452,222 $1,718,656 + 18.3% $1,452,222 $1,718,656 + 18.3%
Percent of List Price Received* 93.8% 93.9% + 0.1% 93.8% 93.9% + 0.1%
Days on Market Until Sale 308 329 + 6.8% 308 329 + 6.8%
Inventory of Homes for Sale 133 117 - 12.0% -- -- --
Months Supply of Inventory 19.7 15.3 - 22.3% -- -- --
* Does not account for seller concessions and/or down payment assistance. | Activity for one month can sometimes look extreme due to small sample size.
Current as of April 28, 2014. All data from the Vail Board of REALTORS® MLS. Powered by 10K Research and Marketing.
Beaver Creek/Bachelor Gulch — Entire MLS — Entire MLS —
Beaver Creek/Bachelor Gulch —
$0
$2,000,000
$4,000,000
$6,000,000
$8,000,000
$10,000,000
Q1-2009 Q1-2010 Q1-2011 Q1-2012 Q1-2013 Q1-2014
Median Sales Price – Single FamilyRolling 12-Month Calculation
$0
$500,000
$1,000,000
$1,500,000
$2,000,000
$2,500,000
Q1-2009 Q1-2010 Q1-2011 Q1-2012 Q1-2013 Q1-2014
Median Sales Price – Townhouse-Condo Rolling 12-Month Calculation
Current as of April 28, 2014. All data from the Vail Board of REALTORS® MLS. Powered by 10K Research and Marketing.
Key Metrics 2013 2014Percent Change
from Previous Year Thru Q1-2013 Thru Q1-2014Percent Change
from Previous Year
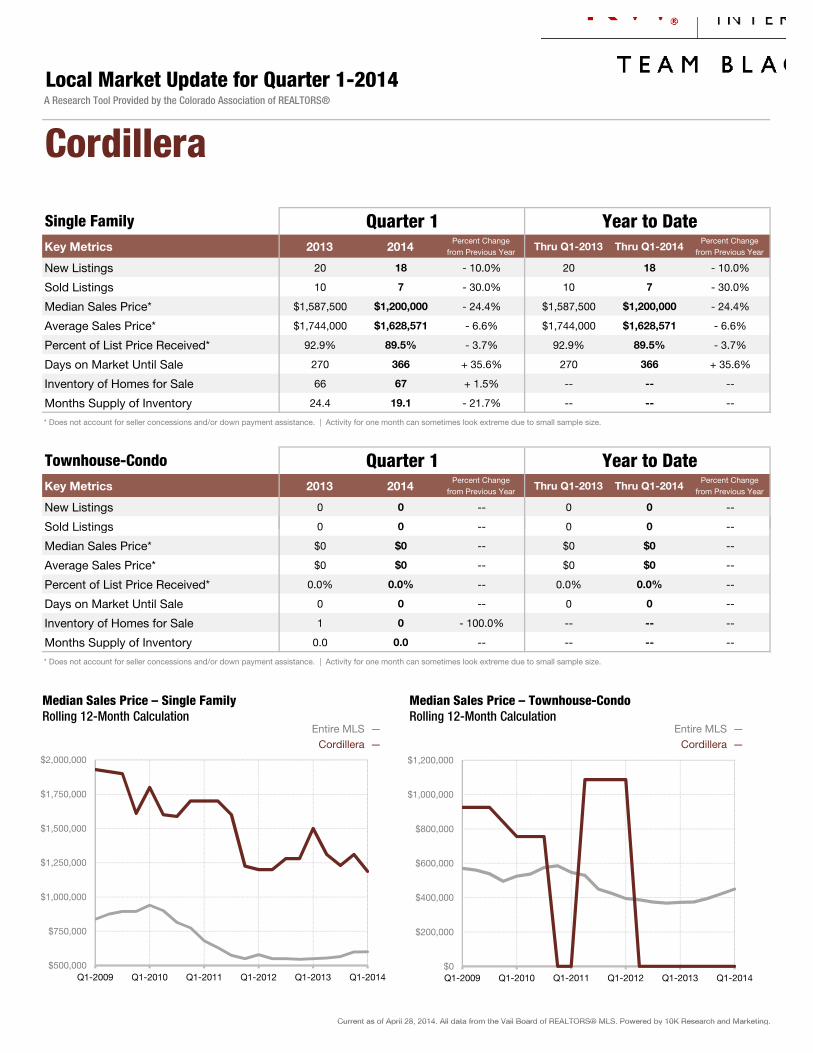
New Listings 20 18 - 10.0% 20 18 - 10.0%
Sold Listings 10 7 - 30.0% 10 7 - 30.0%
Median Sales Price* $1,587,500 $1,200,000 - 24.4% $1,587,500 $1,200,000 - 24.4%
Average Sales Price* $1,744,000 $1,628,571 - 6.6% $1,744,000 $1,628,571 - 6.6%
Percent of List Price Received* 92.9% 89.5% - 3.7% 92.9% 89.5% - 3.7%
Days on Market Until Sale 270 366 + 35.6% 270 366 + 35.6%
Inventory of Homes for Sale 66 67 + 1.5% -- -- --
Months Supply of Inventory 24.4 19.1 - 21.7% -- -- --
* Does not account for seller concessions and/or down payment assistance. | Activity for one month can sometimes look extreme due to small sample size.
Key Metrics 2013 2014Percent Change
from Previous Year Thru Q1-2013 Thru Q1-2014Percent Change
from Previous Year
New Listings 0 0 -- 0 0 --
Sold Listings 0 0 -- 0 0 --
Local Market Update for Quarter 1-2014A Research Tool Provided by the Colorado Association of REALTORS®
Cordillera
Quarter 1 Year to Date
Quarter 1 Year to DateSingle Family
Townhouse-Condo
Sold Listings 0 0 0 0
Median Sales Price* $0 $0 -- $0 $0 --
Average Sales Price* $0 $0 -- $0 $0 --
Percent of List Price Received* 0.0% 0.0% -- 0.0% 0.0% --
Days on Market Until Sale 0 0 -- 0 0 --
Inventory of Homes for Sale 1 0 - 100.0% -- -- --
Months Supply of Inventory 0.0 0.0 -- -- -- --
* Does not account for seller concessions and/or down payment assistance. | Activity for one month can sometimes look extreme due to small sample size.
Current as of April 28, 2014. All data from the Vail Board of REALTORS® MLS. Powered by 10K Research and Marketing.
Cordillera — Entire MLS — Entire MLS —
Cordillera —
$500,000
$750,000
$1,000,000
$1,250,000
$1,500,000
$1,750,000
$2,000,000
Q1-2009 Q1-2010 Q1-2011 Q1-2012 Q1-2013 Q1-2014
Median Sales Price – Single FamilyRolling 12-Month Calculation
$0
$200,000
$400,000
$600,000
$800,000
$1,000,000
$1,200,000
Q1-2009 Q1-2010 Q1-2011 Q1-2012 Q1-2013 Q1-2014
Median Sales Price – Townhouse-Condo Rolling 12-Month Calculation
Current as of April 28, 2014. All data from the Vail Board of REALTORS® MLS. Powered by 10K Research and Marketing.
Key Metrics 2013 2014Percent Change
from Previous Year Thru Q1-2013 Thru Q1-2014Percent Change
from Previous Year
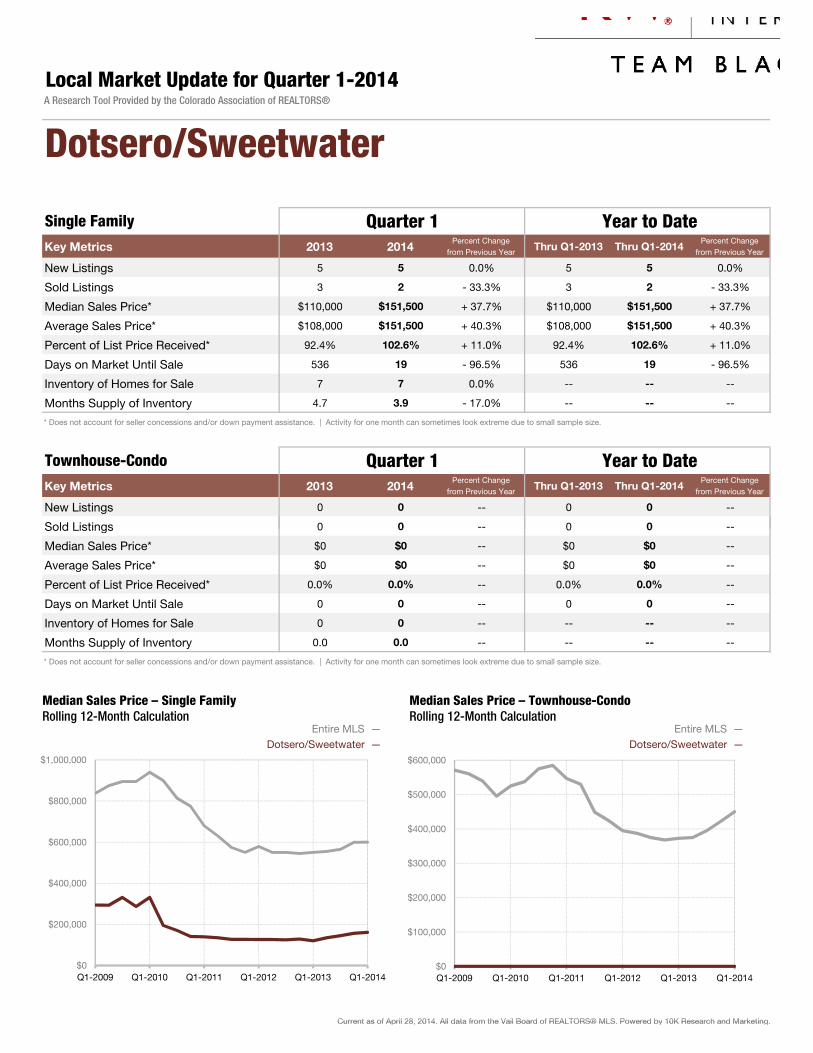
New Listings 5 5 0.0% 5 5 0.0%
Sold Listings 3 2 - 33.3% 3 2 - 33.3%
Median Sales Price* $110,000 $151,500 + 37.7% $110,000 $151,500 + 37.7%
Average Sales Price* $108,000 $151,500 + 40.3% $108,000 $151,500 + 40.3%
Percent of List Price Received* 92.4% 102.6% + 11.0% 92.4% 102.6% + 11.0%
Days on Market Until Sale 536 19 - 96.5% 536 19 - 96.5%
Inventory of Homes for Sale 7 7 0.0% -- -- --
Months Supply of Inventory 4.7 3.9 - 17.0% -- -- --
* Does not account for seller concessions and/or down payment assistance. | Activity for one month can sometimes look extreme due to small sample size.
Key Metrics 2013 2014Percent Change
from Previous Year Thru Q1-2013 Thru Q1-2014Percent Change
from Previous Year
New Listings 0 0 -- 0 0 --
Sold Listings 0 0 -- 0 0 --
Local Market Update for Quarter 1-2014A Research Tool Provided by the Colorado Association of REALTORS®
Dotsero/Sweetwater
Quarter 1 Year to Date
Quarter 1 Year to DateSingle Family
Townhouse-Condo
Sold Listings 0 0 0 0
Median Sales Price* $0 $0 -- $0 $0 --
Average Sales Price* $0 $0 -- $0 $0 --
Percent of List Price Received* 0.0% 0.0% -- 0.0% 0.0% --
Days on Market Until Sale 0 0 -- 0 0 --
Inventory of Homes for Sale 0 0 -- -- -- --
Months Supply of Inventory 0.0 0.0 -- -- -- --
* Does not account for seller concessions and/or down payment assistance. | Activity for one month can sometimes look extreme due to small sample size.
Current as of April 28, 2014. All data from the Vail Board of REALTORS® MLS. Powered by 10K Research and Marketing.
Dotsero/Sweetwater — Entire MLS — Entire MLS —
Dotsero/Sweetwater —
$0
$200,000
$400,000
$600,000
$800,000
$1,000,000
Q1-2009 Q1-2010 Q1-2011 Q1-2012 Q1-2013 Q1-2014
Median Sales Price – Single FamilyRolling 12-Month Calculation
$0
$100,000
$200,000
$300,000
$400,000
$500,000
$600,000
Q1-2009 Q1-2010 Q1-2011 Q1-2012 Q1-2013 Q1-2014
Median Sales Price – Townhouse-Condo Rolling 12-Month Calculation
Current as of April 28, 2014. All data from the Vail Board of REALTORS® MLS. Powered by 10K Research and Marketing.
Key Metrics 2013 2014Percent Change
from Previous Year Thru Q1-2013 Thru Q1-2014Percent Change
from Previous Year
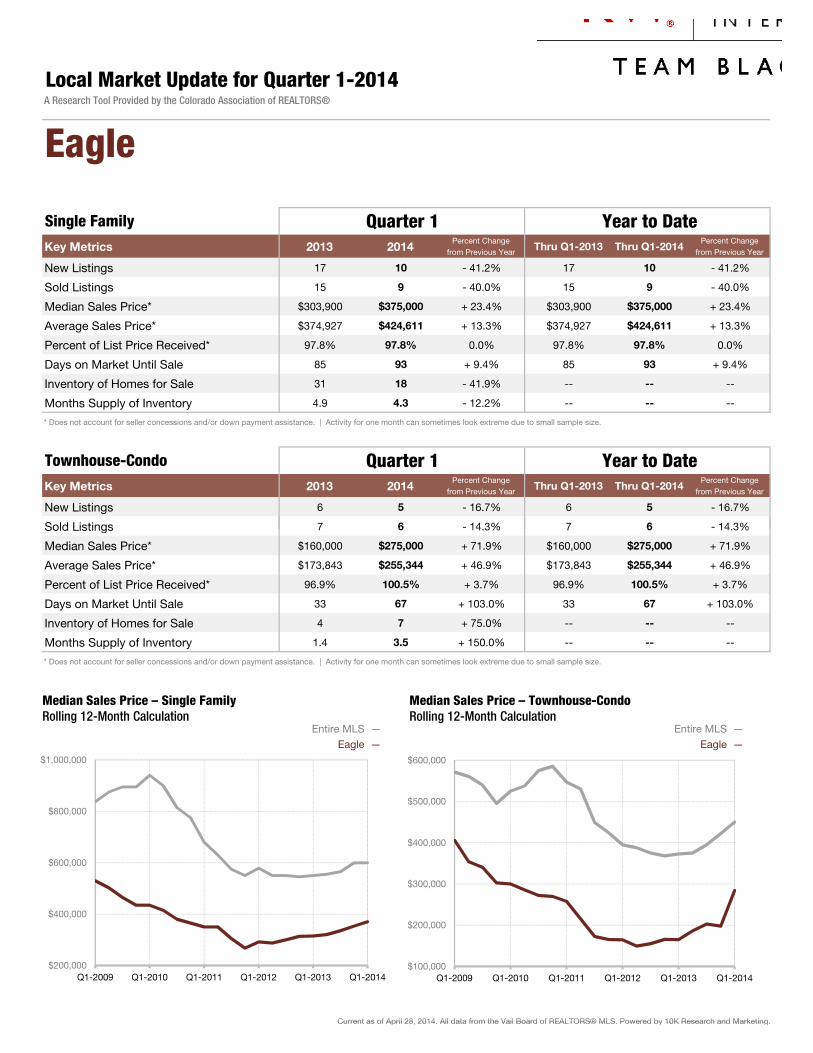
New Listings 17 10 - 41.2% 17 10 - 41.2%
Sold Listings 15 9 - 40.0% 15 9 - 40.0%
Median Sales Price* $303,900 $375,000 + 23.4% $303,900 $375,000 + 23.4%
Average Sales Price* $374,927 $424,611 + 13.3% $374,927 $424,611 + 13.3%
Percent of List Price Received* 97.8% 97.8% 0.0% 97.8% 97.8% 0.0%
Days on Market Until Sale 85 93 + 9.4% 85 93 + 9.4%
Inventory of Homes for Sale 31 18 - 41.9% -- -- --
Months Supply of Inventory 4.9 4.3 - 12.2% -- -- --
* Does not account for seller concessions and/or down payment assistance. | Activity for one month can sometimes look extreme due to small sample size.
Key Metrics 2013 2014Percent Change
from Previous Year Thru Q1-2013 Thru Q1-2014Percent Change
from Previous Year
New Listings 6 5 - 16.7% 6 5 - 16.7%
Sold Listings 7 6 - 14.3% 7 6 - 14.3%
Local Market Update for Quarter 1-2014A Research Tool Provided by the Colorado Association of REALTORS®
Eagle
Quarter 1 Year to Date
Quarter 1 Year to DateSingle Family
Townhouse-Condo
Sold Listings 7 6 14.3% 7 6 14.3%
Median Sales Price* $160,000 $275,000 + 71.9% $160,000 $275,000 + 71.9%
Average Sales Price* $173,843 $255,344 + 46.9% $173,843 $255,344 + 46.9%
Percent of List Price Received* 96.9% 100.5% + 3.7% 96.9% 100.5% + 3.7%
Days on Market Until Sale 33 67 + 103.0% 33 67 + 103.0%
Inventory of Homes for Sale 4 7 + 75.0% -- -- --
Months Supply of Inventory 1.4 3.5 + 150.0% -- -- --
* Does not account for seller concessions and/or down payment assistance. | Activity for one month can sometimes look extreme due to small sample size.
Current as of April 28, 2014. All data from the Vail Board of REALTORS® MLS. Powered by 10K Research and Marketing.
Eagle — Entire MLS — Entire MLS —
Eagle —
$200,000
$400,000
$600,000
$800,000
$1,000,000
Q1-2009 Q1-2010 Q1-2011 Q1-2012 Q1-2013 Q1-2014
Median Sales Price – Single FamilyRolling 12-Month Calculation
$100,000
$200,000
$300,000
$400,000
$500,000
$600,000
Q1-2009 Q1-2010 Q1-2011 Q1-2012 Q1-2013 Q1-2014
Median Sales Price – Townhouse-Condo Rolling 12-Month Calculation
Current as of April 28, 2014. All data from the Vail Board of REALTORS® MLS. Powered by 10K Research and Marketing.

Key Metrics 2013 2014Percent Change
from Previous Year Thru Q1-2013 Thru Q1-2014Percent Change
from Previous Year
New Listings 17 12 - 29.4% 17 12 - 29.4%
Sold Listings 9 5 - 44.4% 9 5 - 44.4%
Median Sales Price* $825,000 $561,000 - 32.0% $825,000 $561,000 - 32.0%
Average Sales Price* $761,222 $599,000 - 21.3% $761,222 $599,000 - 21.3%
Percent of List Price Received* 94.1% 97.8% + 3.9% 94.1% 97.8% + 3.9%
Days on Market Until Sale 317 203 - 36.0% 317 203 - 36.0%
Inventory of Homes for Sale 26 37 + 42.3% -- -- --
Months Supply of Inventory 5.8 8.0 + 37.9% -- -- --
* Does not account for seller concessions and/or down payment assistance. | Activity for one month can sometimes look extreme due to small sample size.
Key Metrics 2013 2014Percent Change
from Previous Year Thru Q1-2013 Thru Q1-2014Percent Change
from Previous Year
New Listings 1 1 0.0% 1 1 0.0%
Sold Listings 3 7 + 133.3% 3 7 + 133.3%
Local Market Update for Quarter 1-2014A Research Tool Provided by the Colorado Association of REALTORS®
Eagle Ranch
Quarter 1 Year to Date
Quarter 1 Year to DateSingle Family
Townhouse-Condo
Sold Listings 3 7 + 133.3% 3 7 + 133.3%
Median Sales Price* $255,000 $245,000 - 3.9% $255,000 $245,000 - 3.9%
Average Sales Price* $244,667 $285,821 + 16.8% $244,667 $285,821 + 16.8%
Percent of List Price Received* 91.0% 97.9% + 7.6% 91.0% 97.9% + 7.6%
Days on Market Until Sale 53 104 + 96.2% 53 104 + 96.2%
Inventory of Homes for Sale 1 2 + 100.0% -- -- --
Months Supply of Inventory 0.5 1.1 + 120.0% -- -- --
* Does not account for seller concessions and/or down payment assistance. | Activity for one month can sometimes look extreme due to small sample size.
Current as of April 28, 2014. All data from the Vail Board of REALTORS® MLS. Powered by 10K Research and Marketing.
Eagle Ranch — Entire MLS — Entire MLS —
Eagle Ranch —
$400,000
$500,000
$600,000
$700,000
$800,000
$900,000
$1,000,000
Q1-2009 Q1-2010 Q1-2011 Q1-2012 Q1-2013 Q1-2014
Median Sales Price – Single FamilyRolling 12-Month Calculation
$100,000
$200,000
$300,000
$400,000
$500,000
$600,000
Q1-2009 Q1-2010 Q1-2011 Q1-2012 Q1-2013 Q1-2014
Median Sales Price – Townhouse-Condo Rolling 12-Month Calculation
Current as of April 28, 2014. All data from the Vail Board of REALTORS® MLS. Powered by 10K Research and Marketing.
Key Metrics 2013 2014Percent Change
from Previous Year Thru Q1-2013 Thru Q1-2014Percent Change
from Previous Year
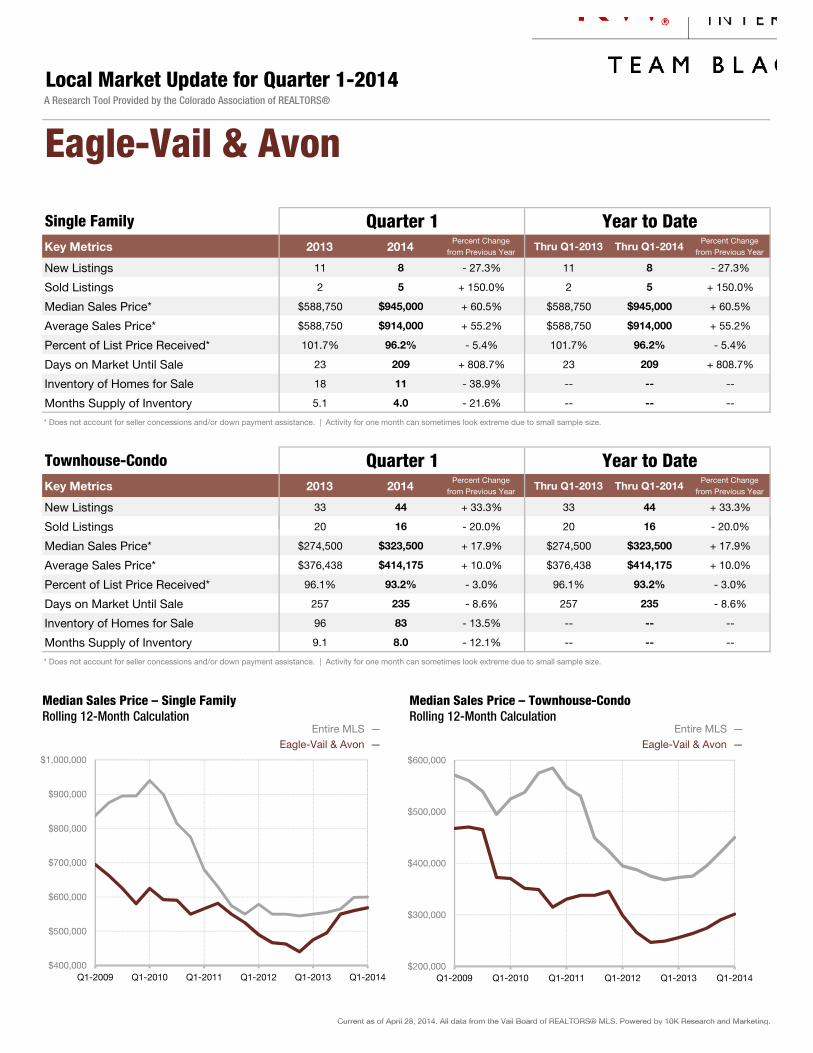
New Listings 11 8 - 27.3% 11 8 - 27.3%
Sold Listings 2 5 + 150.0% 2 5 + 150.0%
Median Sales Price* $588,750 $945,000 + 60.5% $588,750 $945,000 + 60.5%
Average Sales Price* $588,750 $914,000 + 55.2% $588,750 $914,000 + 55.2%
Percent of List Price Received* 101.7% 96.2% - 5.4% 101.7% 96.2% - 5.4%
Days on Market Until Sale 23 209 + 808.7% 23 209 + 808.7%
Inventory of Homes for Sale 18 11 - 38.9% -- -- --
Months Supply of Inventory 5.1 4.0 - 21.6% -- -- --
* Does not account for seller concessions and/or down payment assistance. | Activity for one month can sometimes look extreme due to small sample size.
Key Metrics 2013 2014Percent Change
from Previous Year Thru Q1-2013 Thru Q1-2014Percent Change
from Previous Year
New Listings 33 44 + 33.3% 33 44 + 33.3%
Sold Listings 20 16 - 20.0% 20 16 - 20.0%
Local Market Update for Quarter 1-2014A Research Tool Provided by the Colorado Association of REALTORS®
Eagle-Vail & Avon
Quarter 1 Year to Date
Quarter 1 Year to DateSingle Family
Townhouse-Condo
Sold Listings 20 16 20.0% 20 16 20.0%
Median Sales Price* $274,500 $323,500 + 17.9% $274,500 $323,500 + 17.9%
Average Sales Price* $376,438 $414,175 + 10.0% $376,438 $414,175 + 10.0%
Percent of List Price Received* 96.1% 93.2% - 3.0% 96.1% 93.2% - 3.0%
Days on Market Until Sale 257 235 - 8.6% 257 235 - 8.6%
Inventory of Homes for Sale 96 83 - 13.5% -- -- --
Months Supply of Inventory 9.1 8.0 - 12.1% -- -- --
* Does not account for seller concessions and/or down payment assistance. | Activity for one month can sometimes look extreme due to small sample size.
Current as of April 28, 2014. All data from the Vail Board of REALTORS® MLS. Powered by 10K Research and Marketing.
Eagle-Vail & Avon — Entire MLS — Entire MLS —
Eagle-Vail & Avon —
$400,000
$500,000
$600,000
$700,000
$800,000
$900,000
$1,000,000
Q1-2009 Q1-2010 Q1-2011 Q1-2012 Q1-2013 Q1-2014
Median Sales Price – Single FamilyRolling 12-Month Calculation
$200,000
$300,000
$400,000
$500,000
$600,000
Q1-2009 Q1-2010 Q1-2011 Q1-2012 Q1-2013 Q1-2014
Median Sales Price – Townhouse-Condo Rolling 12-Month Calculation
Current as of April 28, 2014. All data from the Vail Board of REALTORS® MLS. Powered by 10K Research and Marketing.
Key Metrics 2013 2014Percent Change
from Previous Year Thru Q1-2013 Thru Q1-2014Percent Change
from Previous Year
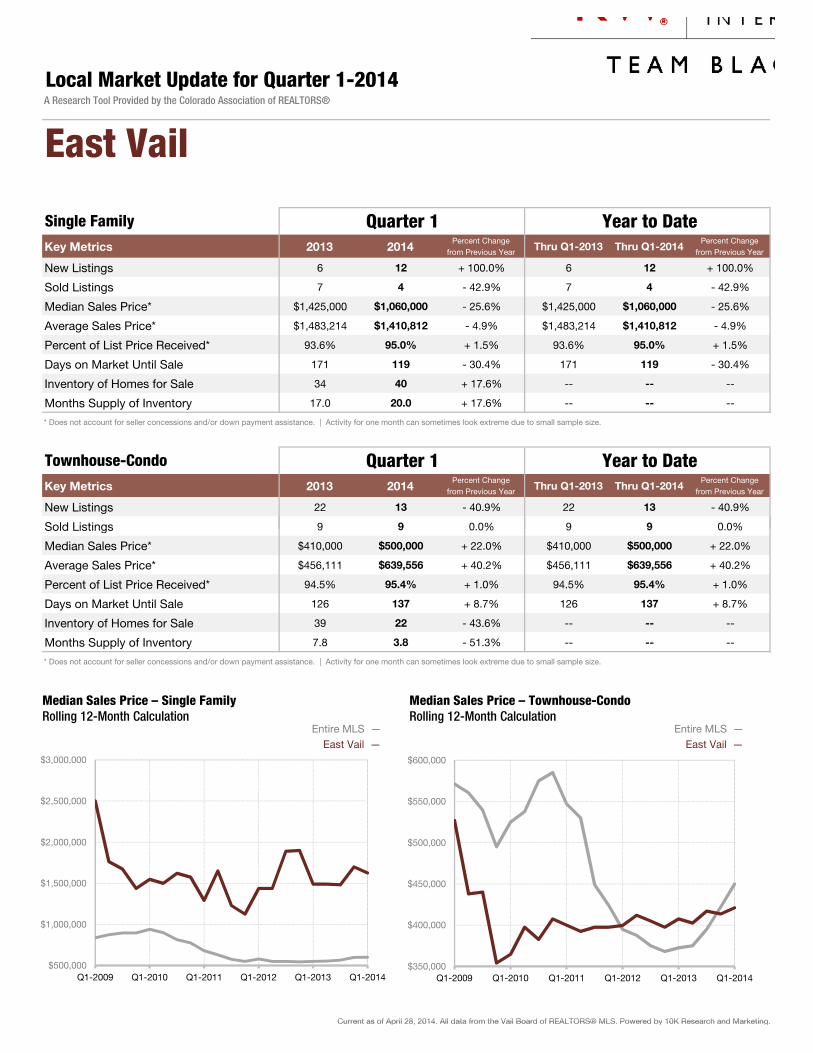
New Listings 6 12 + 100.0% 6 12 + 100.0%
Sold Listings 7 4 - 42.9% 7 4 - 42.9%
Median Sales Price* $1,425,000 $1,060,000 - 25.6% $1,425,000 $1,060,000 - 25.6%
Average Sales Price* $1,483,214 $1,410,812 - 4.9% $1,483,214 $1,410,812 - 4.9%
Percent of List Price Received* 93.6% 95.0% + 1.5% 93.6% 95.0% + 1.5%
Days on Market Until Sale 171 119 - 30.4% 171 119 - 30.4%
Inventory of Homes for Sale 34 40 + 17.6% -- -- --
Months Supply of Inventory 17.0 20.0 + 17.6% -- -- --
* Does not account for seller concessions and/or down payment assistance. | Activity for one month can sometimes look extreme due to small sample size.
Key Metrics 2013 2014Percent Change
from Previous Year Thru Q1-2013 Thru Q1-2014Percent Change
from Previous Year
New Listings 22 13 - 40.9% 22 13 - 40.9%
Sold Listings 9 9 0.0% 9 9 0.0%
Local Market Update for Quarter 1-2014A Research Tool Provided by the Colorado Association of REALTORS®
East Vail
Quarter 1 Year to Date
Quarter 1 Year to DateSingle Family
Townhouse-Condo
Sold Listings 9 9 0.0% 9 9 0.0%
Median Sales Price* $410,000 $500,000 + 22.0% $410,000 $500,000 + 22.0%
Average Sales Price* $456,111 $639,556 + 40.2% $456,111 $639,556 + 40.2%
Percent of List Price Received* 94.5% 95.4% + 1.0% 94.5% 95.4% + 1.0%
Days on Market Until Sale 126 137 + 8.7% 126 137 + 8.7%
Inventory of Homes for Sale 39 22 - 43.6% -- -- --
Months Supply of Inventory 7.8 3.8 - 51.3% -- -- --
* Does not account for seller concessions and/or down payment assistance. | Activity for one month can sometimes look extreme due to small sample size.
Current as of April 28, 2014. All data from the Vail Board of REALTORS® MLS. Powered by 10K Research and Marketing.
East Vail — Entire MLS — Entire MLS —
East Vail —
$500,000
$1,000,000
$1,500,000
$2,000,000
$2,500,000
$3,000,000
Q1-2009 Q1-2010 Q1-2011 Q1-2012 Q1-2013 Q1-2014
Median Sales Price – Single FamilyRolling 12-Month Calculation
$350,000
$400,000
$450,000
$500,000
$550,000
$600,000
Q1-2009 Q1-2010 Q1-2011 Q1-2012 Q1-2013 Q1-2014
Median Sales Price – Townhouse-Condo Rolling 12-Month Calculation
Current as of April 28, 2014. All data from the Vail Board of REALTORS® MLS. Powered by 10K Research and Marketing.
Key Metrics 2013 2014Percent Change
from Previous Year Thru Q1-2013 Thru Q1-2014Percent Change
from Previous Year
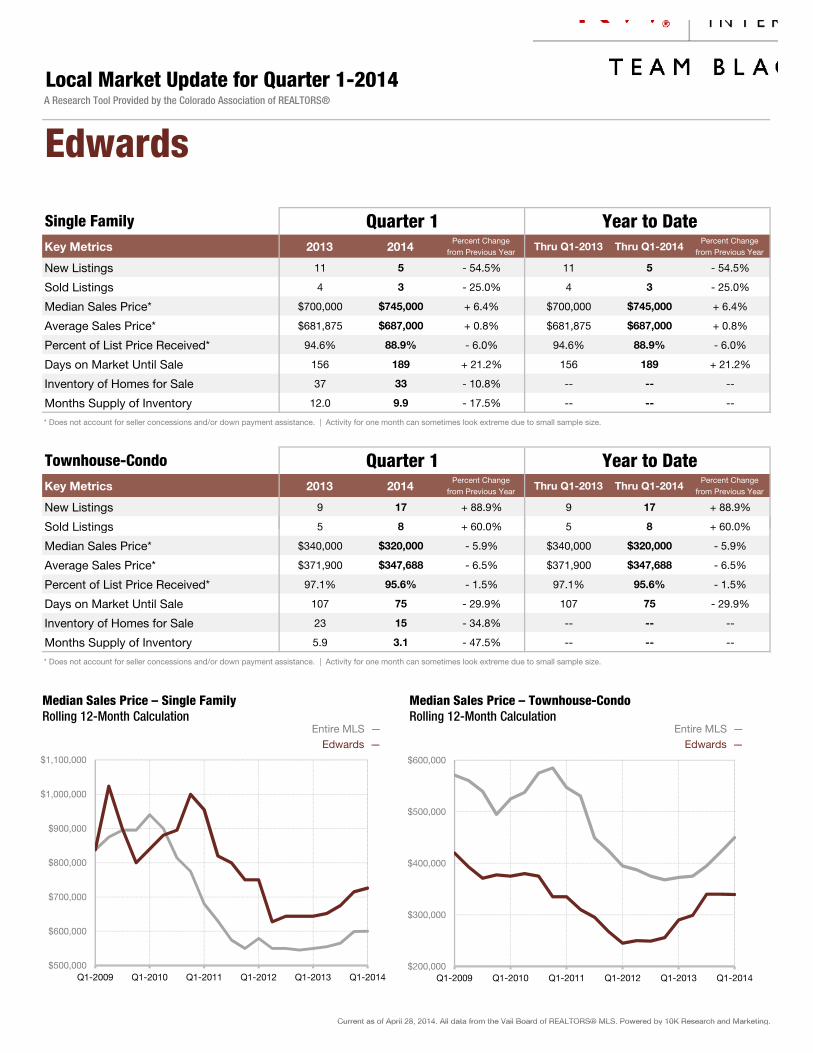
New Listings 11 5 - 54.5% 11 5 - 54.5%
Sold Listings 4 3 - 25.0% 4 3 - 25.0%
Median Sales Price* $700,000 $745,000 + 6.4% $700,000 $745,000 + 6.4%
Average Sales Price* $681,875 $687,000 + 0.8% $681,875 $687,000 + 0.8%
Percent of List Price Received* 94.6% 88.9% - 6.0% 94.6% 88.9% - 6.0%
Days on Market Until Sale 156 189 + 21.2% 156 189 + 21.2%
Inventory of Homes for Sale 37 33 - 10.8% -- -- --
Months Supply of Inventory 12.0 9.9 - 17.5% -- -- --
* Does not account for seller concessions and/or down payment assistance. | Activity for one month can sometimes look extreme due to small sample size.
Key Metrics 2013 2014Percent Change
from Previous Year Thru Q1-2013 Thru Q1-2014Percent Change
from Previous Year
New Listings 9 17 + 88.9% 9 17 + 88.9%
Sold Listings 5 8 + 60.0% 5 8 + 60.0%
Local Market Update for Quarter 1-2014A Research Tool Provided by the Colorado Association of REALTORS®
Edwards
Quarter 1 Year to Date
Quarter 1 Year to DateSingle Family
Townhouse-Condo
Sold Listings 5 8 + 60.0% 5 8 + 60.0%
Median Sales Price* $340,000 $320,000 - 5.9% $340,000 $320,000 - 5.9%
Average Sales Price* $371,900 $347,688 - 6.5% $371,900 $347,688 - 6.5%
Percent of List Price Received* 97.1% 95.6% - 1.5% 97.1% 95.6% - 1.5%
Days on Market Until Sale 107 75 - 29.9% 107 75 - 29.9%
Inventory of Homes for Sale 23 15 - 34.8% -- -- --
Months Supply of Inventory 5.9 3.1 - 47.5% -- -- --
* Does not account for seller concessions and/or down payment assistance. | Activity for one month can sometimes look extreme due to small sample size.
Current as of April 28, 2014. All data from the Vail Board of REALTORS® MLS. Powered by 10K Research and Marketing.
Edwards — Entire MLS — Entire MLS —
Edwards —
$500,000
$600,000
$700,000
$800,000
$900,000
$1,000,000
$1,100,000
Q1-2009 Q1-2010 Q1-2011 Q1-2012 Q1-2013 Q1-2014
Median Sales Price – Single FamilyRolling 12-Month Calculation
$200,000
$300,000
$400,000
$500,000
$600,000
Q1-2009 Q1-2010 Q1-2011 Q1-2012 Q1-2013 Q1-2014
Median Sales Price – Townhouse-Condo Rolling 12-Month Calculation
Current as of April 28, 2014. All data from the Vail Board of REALTORS® MLS. Powered by 10K Research and Marketing.
Key Metrics 2013 2014Percent Change
from Previous Year Thru Q1-2013 Thru Q1-2014Percent Change
from Previous Year
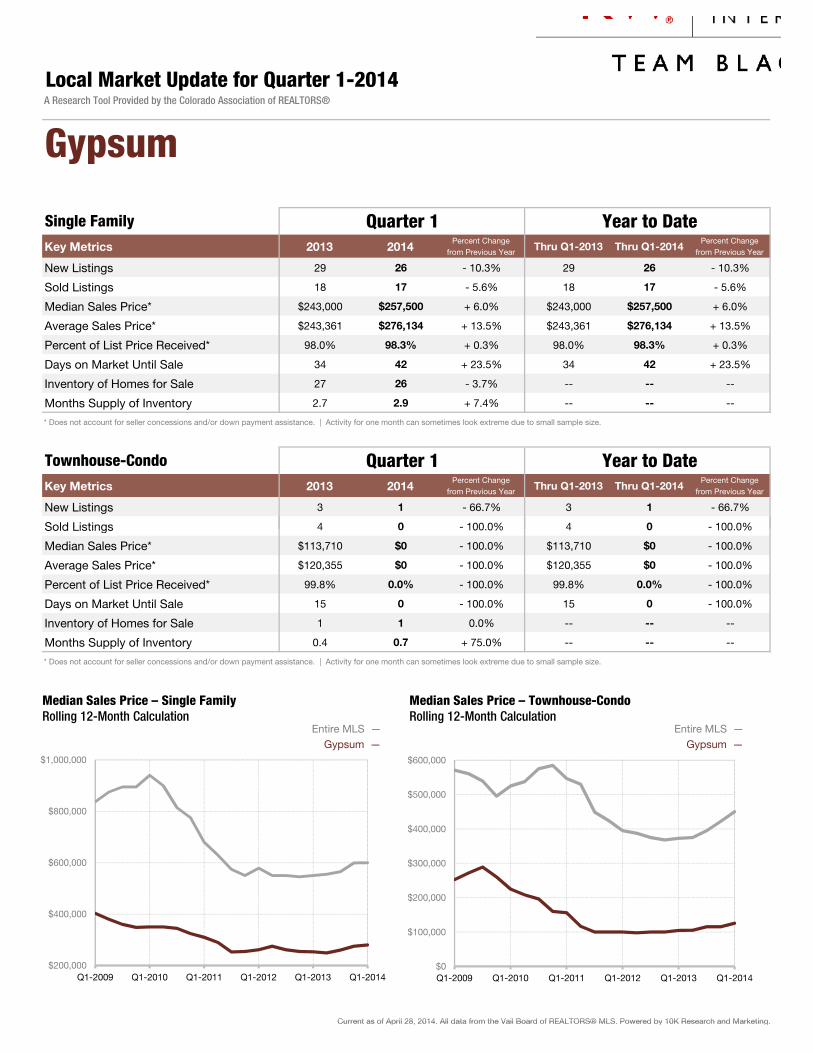
New Listings 29 26 - 10.3% 29 26 - 10.3%
Sold Listings 18 17 - 5.6% 18 17 - 5.6%
Median Sales Price* $243,000 $257,500 + 6.0% $243,000 $257,500 + 6.0%
Average Sales Price* $243,361 $276,134 + 13.5% $243,361 $276,134 + 13.5%
Percent of List Price Received* 98.0% 98.3% + 0.3% 98.0% 98.3% + 0.3%
Days on Market Until Sale 34 42 + 23.5% 34 42 + 23.5%
Inventory of Homes for Sale 27 26 - 3.7% -- -- --
Months Supply of Inventory 2.7 2.9 + 7.4% -- -- --
* Does not account for seller concessions and/or down payment assistance. | Activity for one month can sometimes look extreme due to small sample size.
Key Metrics 2013 2014Percent Change
from Previous Year Thru Q1-2013 Thru Q1-2014Percent Change
from Previous Year
New Listings 3 1 - 66.7% 3 1 - 66.7%
Sold Listings 4 0 - 100.0% 4 0 - 100.0%
Local Market Update for Quarter 1-2014A Research Tool Provided by the Colorado Association of REALTORS®
Gypsum
Quarter 1 Year to Date
Quarter 1 Year to DateSingle Family
Townhouse-Condo
Sold Listings 4 0 100.0% 4 0 100.0%
Median Sales Price* $113,710 $0 - 100.0% $113,710 $0 - 100.0%
Average Sales Price* $120,355 $0 - 100.0% $120,355 $0 - 100.0%
Percent of List Price Received* 99.8% 0.0% - 100.0% 99.8% 0.0% - 100.0%
Days on Market Until Sale 15 0 - 100.0% 15 0 - 100.0%
Inventory of Homes for Sale 1 1 0.0% -- -- --
Months Supply of Inventory 0.4 0.7 + 75.0% -- -- --
* Does not account for seller concessions and/or down payment assistance. | Activity for one month can sometimes look extreme due to small sample size.
Current as of April 28, 2014. All data from the Vail Board of REALTORS® MLS. Powered by 10K Research and Marketing.
Gypsum — Entire MLS — Entire MLS —
Gypsum —
$200,000
$400,000
$600,000
$800,000
$1,000,000
Q1-2009 Q1-2010 Q1-2011 Q1-2012 Q1-2013 Q1-2014
Median Sales Price – Single FamilyRolling 12-Month Calculation
$0
$100,000
$200,000
$300,000
$400,000
$500,000
$600,000
Q1-2009 Q1-2010 Q1-2011 Q1-2012 Q1-2013 Q1-2014
Median Sales Price – Townhouse-Condo Rolling 12-Month Calculation
Current as of April 28, 2014. All data from the Vail Board of REALTORS® MLS. Powered by 10K Research and Marketing.
Key Metrics 2013 2014Percent Change
from Previous Year Thru Q1-2013 Thru Q1-2014Percent Change
from Previous Year
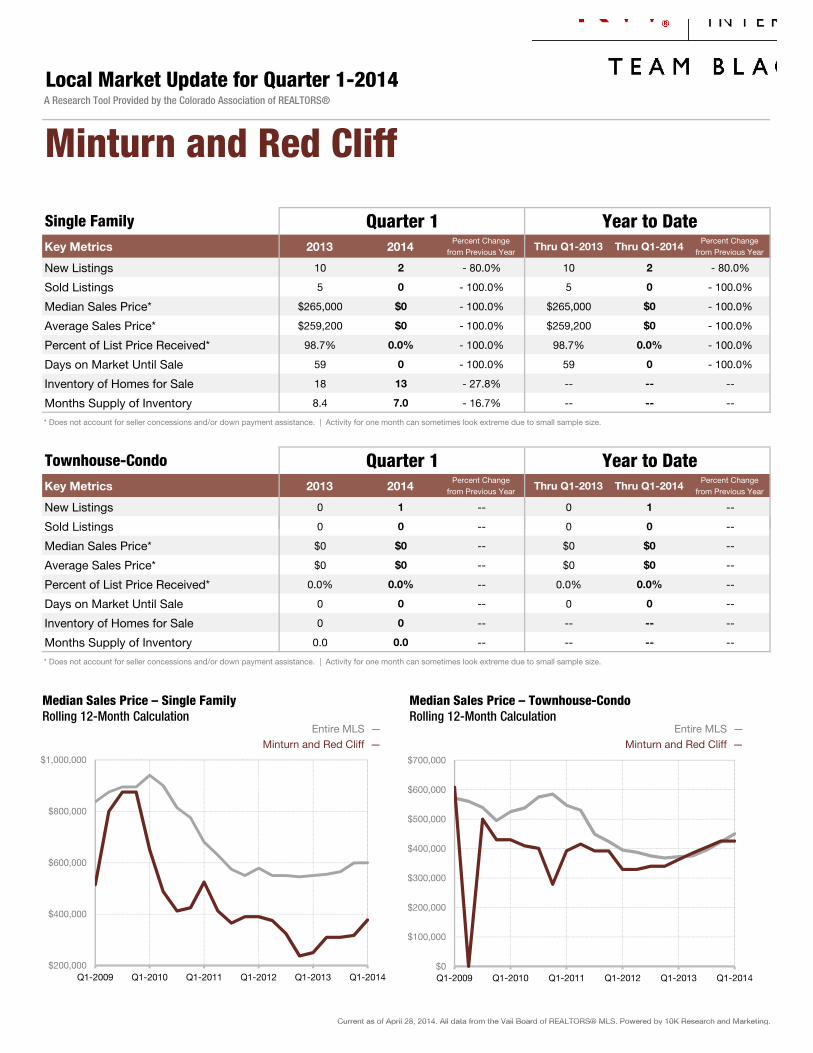
New Listings 10 2 - 80.0% 10 2 - 80.0%
Sold Listings 5 0 - 100.0% 5 0 - 100.0%
Median Sales Price* $265,000 $0 - 100.0% $265,000 $0 - 100.0%
Average Sales Price* $259,200 $0 - 100.0% $259,200 $0 - 100.0%
Percent of List Price Received* 98.7% 0.0% - 100.0% 98.7% 0.0% - 100.0%
Days on Market Until Sale 59 0 - 100.0% 59 0 - 100.0%
Inventory of Homes for Sale 18 13 - 27.8% -- -- --
Months Supply of Inventory 8.4 7.0 - 16.7% -- -- --
* Does not account for seller concessions and/or down payment assistance. | Activity for one month can sometimes look extreme due to small sample size.
Key Metrics 2013 2014Percent Change
from Previous Year Thru Q1-2013 Thru Q1-2014Percent Change
from Previous Year
New Listings 0 1 -- 0 1 --
Sold Listings 0 0 -- 0 0 --
Local Market Update for Quarter 1-2014A Research Tool Provided by the Colorado Association of REALTORS®
Minturn and Red Cliff#N/A
Quarter 1 Year to Date
Quarter 1 Year to DateSingle Family
Townhouse-Condo
Sold Listings 0 0 0 0
Median Sales Price* $0 $0 -- $0 $0 --
Average Sales Price* $0 $0 -- $0 $0 --
Percent of List Price Received* 0.0% 0.0% -- 0.0% 0.0% --
Days on Market Until Sale 0 0 -- 0 0 --
Inventory of Homes for Sale 0 0 -- -- -- --
Months Supply of Inventory 0.0 0.0 -- -- -- --
* Does not account for seller concessions and/or down payment assistance. | Activity for one month can sometimes look extreme due to small sample size.
Current as of April 28, 2014. All data from the Vail Board of REALTORS® MLS. Powered by 10K Research and Marketing.
Minturn and Red Cliff — Entire MLS — Entire MLS —
Minturn and Red Cliff —
$200,000
$400,000
$600,000
$800,000
$1,000,000
Q1-2009 Q1-2010 Q1-2011 Q1-2012 Q1-2013 Q1-2014
Median Sales Price – Single FamilyRolling 12-Month Calculation
$0
$100,000
$200,000
$300,000
$400,000
$500,000
$600,000
$700,000
Q1-2009 Q1-2010 Q1-2011 Q1-2012 Q1-2013 Q1-2014
Median Sales Price – Townhouse-Condo Rolling 12-Month Calculation
Current as of April 28, 2014. All data from the Vail Board of REALTORS® MLS. Powered by 10K Research and Marketing.
Key Metrics 2013 2014Percent Change
from Previous Year Thru Q1-2013 Thru Q1-2014Percent Change
from Previous Year
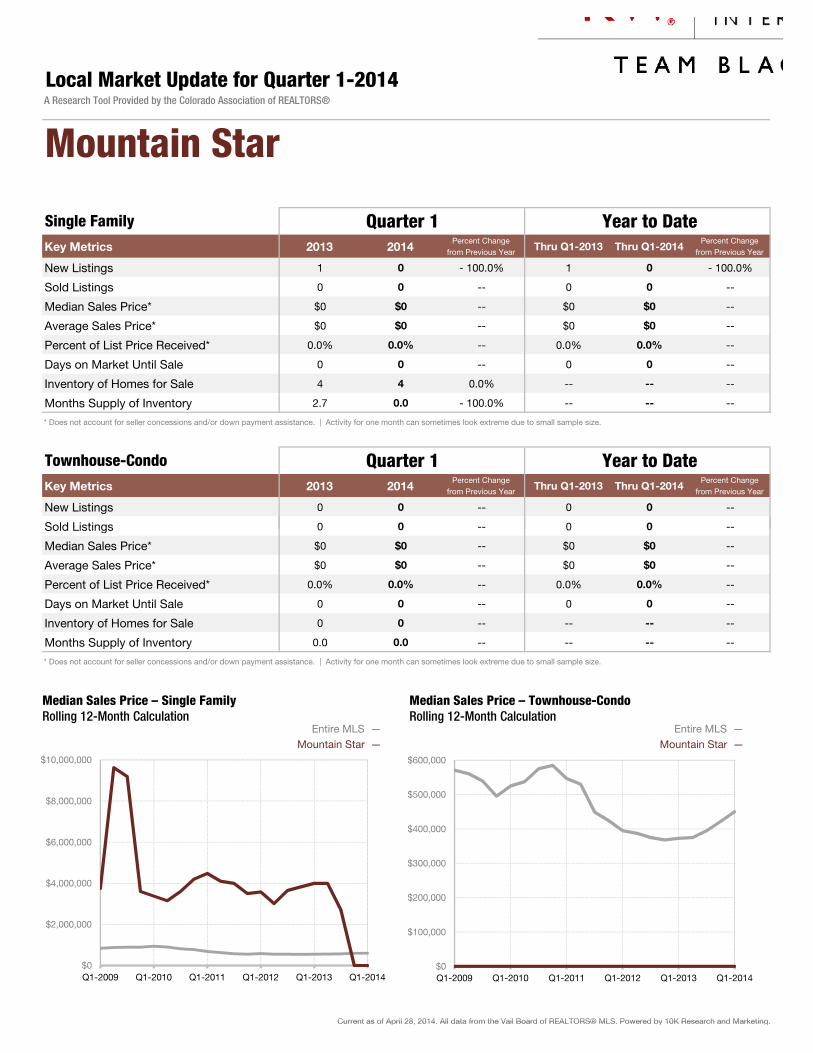
New Listings 1 0 - 100.0% 1 0 - 100.0%
Sold Listings 0 0 -- 0 0 --
Median Sales Price* $0 $0 -- $0 $0 --
Average Sales Price* $0 $0 -- $0 $0 --
Percent of List Price Received* 0.0% 0.0% -- 0.0% 0.0% --
Days on Market Until Sale 0 0 -- 0 0 --
Inventory of Homes for Sale 4 4 0.0% -- -- --
Months Supply of Inventory 2.7 0.0 - 100.0% -- -- --
* Does not account for seller concessions and/or down payment assistance. | Activity for one month can sometimes look extreme due to small sample size.
Key Metrics 2013 2014Percent Change
from Previous Year Thru Q1-2013 Thru Q1-2014Percent Change
from Previous Year
New Listings 0 0 -- 0 0 --
Sold Listings 0 0 -- 0 0 --
Local Market Update for Quarter 1-2014A Research Tool Provided by the Colorado Association of REALTORS®
Mountain Star
Quarter 1 Year to Date
Quarter 1 Year to DateSingle Family
Townhouse-Condo
Sold Listings 0 0 0 0
Median Sales Price* $0 $0 -- $0 $0 --
Average Sales Price* $0 $0 -- $0 $0 --
Percent of List Price Received* 0.0% 0.0% -- 0.0% 0.0% --
Days on Market Until Sale 0 0 -- 0 0 --
Inventory of Homes for Sale 0 0 -- -- -- --
Months Supply of Inventory 0.0 0.0 -- -- -- --
* Does not account for seller concessions and/or down payment assistance. | Activity for one month can sometimes look extreme due to small sample size.
Current as of April 28, 2014. All data from the Vail Board of REALTORS® MLS. Powered by 10K Research and Marketing.
Mountain Star — Entire MLS — Entire MLS —
Mountain Star —
$0
$2,000,000
$4,000,000
$6,000,000
$8,000,000
$10,000,000
Q1-2009 Q1-2010 Q1-2011 Q1-2012 Q1-2013 Q1-2014
Median Sales Price – Single FamilyRolling 12-Month Calculation
$0
$100,000
$200,000
$300,000
$400,000
$500,000
$600,000
Q1-2009 Q1-2010 Q1-2011 Q1-2012 Q1-2013 Q1-2014
Median Sales Price – Townhouse-Condo Rolling 12-Month Calculation
Current as of April 28, 2014. All data from the Vail Board of REALTORS® MLS. Powered by 10K Research and Marketing.
Key Metrics 2013 2014Percent Change
from Previous Year Thru Q1-2013 Thru Q1-2014Percent Change
from Previous Year
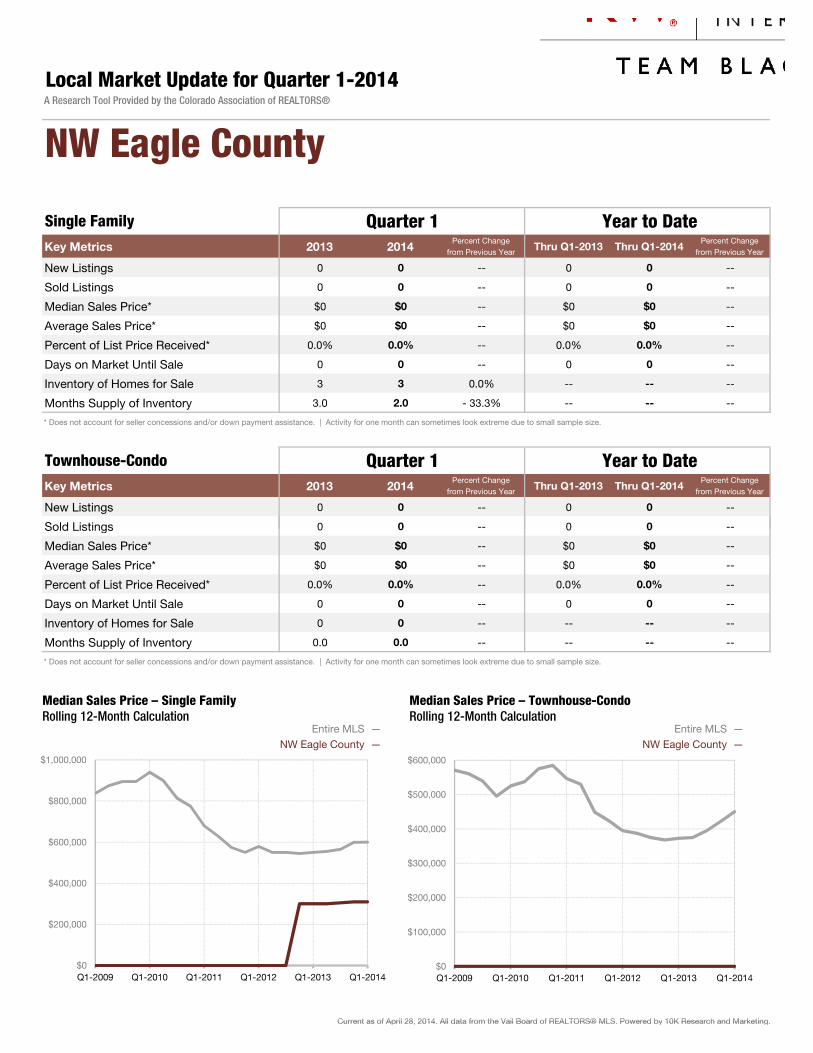
New Listings 0 0 -- 0 0 --
Sold Listings 0 0 -- 0 0 --
Median Sales Price* $0 $0 -- $0 $0 --
Average Sales Price* $0 $0 -- $0 $0 --
Percent of List Price Received* 0.0% 0.0% -- 0.0% 0.0% --
Days on Market Until Sale 0 0 -- 0 0 --
Inventory of Homes for Sale 3 3 0.0% -- -- --
Months Supply of Inventory 3.0 2.0 - 33.3% -- -- --
* Does not account for seller concessions and/or down payment assistance. | Activity for one month can sometimes look extreme due to small sample size.
Key Metrics 2013 2014Percent Change
from Previous Year Thru Q1-2013 Thru Q1-2014Percent Change
from Previous Year
New Listings 0 0 -- 0 0 --
Sold Listings 0 0 -- 0 0 --
Local Market Update for Quarter 1-2014A Research Tool Provided by the Colorado Association of REALTORS®
NW Eagle County
Quarter 1 Year to Date
Quarter 1 Year to DateSingle Family
Townhouse-Condo
Sold Listings 0 0 0 0
Median Sales Price* $0 $0 -- $0 $0 --
Average Sales Price* $0 $0 -- $0 $0 --
Percent of List Price Received* 0.0% 0.0% -- 0.0% 0.0% --
Days on Market Until Sale 0 0 -- 0 0 --
Inventory of Homes for Sale 0 0 -- -- -- --
Months Supply of Inventory 0.0 0.0 -- -- -- --
* Does not account for seller concessions and/or down payment assistance. | Activity for one month can sometimes look extreme due to small sample size.
Current as of April 28, 2014. All data from the Vail Board of REALTORS® MLS. Powered by 10K Research and Marketing.
NW Eagle County — Entire MLS — Entire MLS —
NW Eagle County —
$0
$200,000
$400,000
$600,000
$800,000
$1,000,000
Q1-2009 Q1-2010 Q1-2011 Q1-2012 Q1-2013 Q1-2014
Median Sales Price – Single FamilyRolling 12-Month Calculation
$0
$100,000
$200,000
$300,000
$400,000
$500,000
$600,000
Q1-2009 Q1-2010 Q1-2011 Q1-2012 Q1-2013 Q1-2014
Median Sales Price – Townhouse-Condo Rolling 12-Month Calculation
Current as of April 28, 2014. All data from the Vail Board of REALTORS® MLS. Powered by 10K Research and Marketing.
Key Metrics 2013 2014Percent Change
from Previous Year Thru Q1-2013 Thru Q1-2014Percent Change
from Previous Year
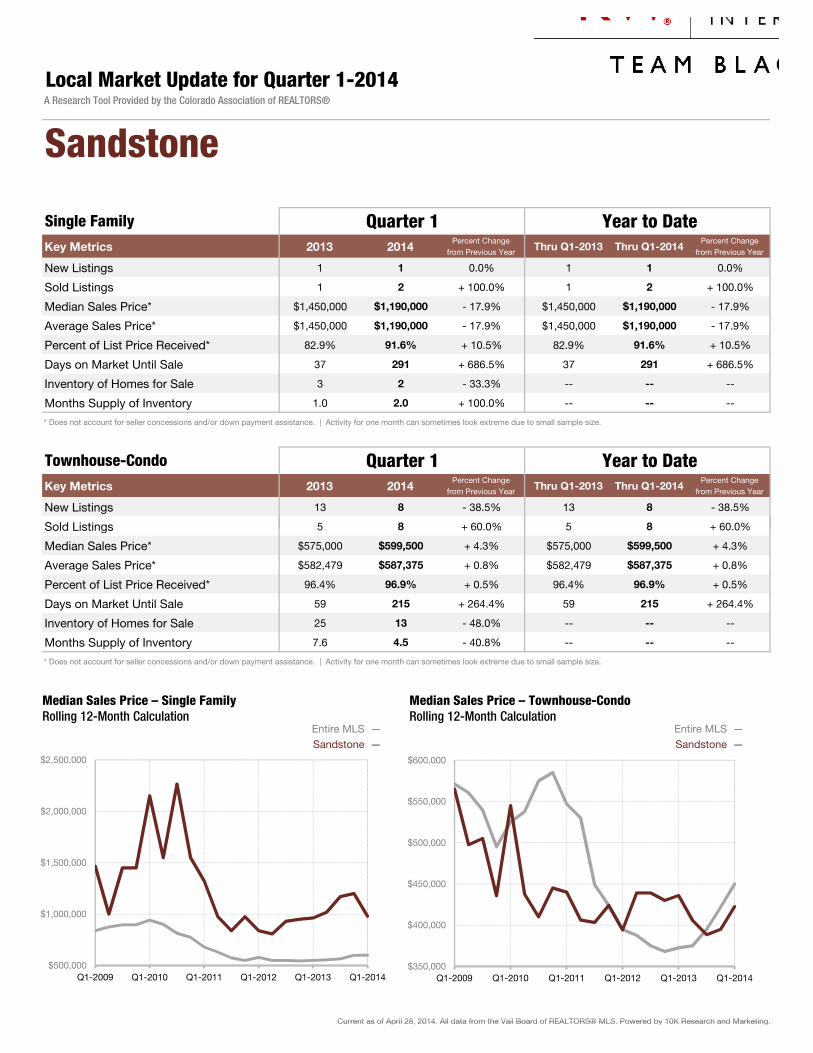
New Listings 1 1 0.0% 1 1 0.0%
Sold Listings 1 2 + 100.0% 1 2 + 100.0%
Median Sales Price* $1,450,000 $1,190,000 - 17.9% $1,450,000 $1,190,000 - 17.9%
Average Sales Price* $1,450,000 $1,190,000 - 17.9% $1,450,000 $1,190,000 - 17.9%
Percent of List Price Received* 82.9% 91.6% + 10.5% 82.9% 91.6% + 10.5%
Days on Market Until Sale 37 291 + 686.5% 37 291 + 686.5%
Inventory of Homes for Sale 3 2 - 33.3% -- -- --
Months Supply of Inventory 1.0 2.0 + 100.0% -- -- --
* Does not account for seller concessions and/or down payment assistance. | Activity for one month can sometimes look extreme due to small sample size.
Key Metrics 2013 2014Percent Change
from Previous Year Thru Q1-2013 Thru Q1-2014Percent Change
from Previous Year
New Listings 13 8 - 38.5% 13 8 - 38.5%
Sold Listings 5 8 + 60.0% 5 8 + 60.0%
Local Market Update for Quarter 1-2014A Research Tool Provided by the Colorado Association of REALTORS®
Sandstone
Quarter 1 Year to Date
Quarter 1 Year to DateSingle Family
Townhouse-Condo
Sold Listings 5 8 + 60.0% 5 8 + 60.0%
Median Sales Price* $575,000 $599,500 + 4.3% $575,000 $599,500 + 4.3%
Average Sales Price* $582,479 $587,375 + 0.8% $582,479 $587,375 + 0.8%
Percent of List Price Received* 96.4% 96.9% + 0.5% 96.4% 96.9% + 0.5%
Days on Market Until Sale 59 215 + 264.4% 59 215 + 264.4%
Inventory of Homes for Sale 25 13 - 48.0% -- -- --
Months Supply of Inventory 7.6 4.5 - 40.8% -- -- --
* Does not account for seller concessions and/or down payment assistance. | Activity for one month can sometimes look extreme due to small sample size.
Current as of April 28, 2014. All data from the Vail Board of REALTORS® MLS. Powered by 10K Research and Marketing.
Sandstone — Entire MLS — Entire MLS —
Sandstone —
$500,000
$1,000,000
$1,500,000
$2,000,000
$2,500,000
Q1-2009 Q1-2010 Q1-2011 Q1-2012 Q1-2013 Q1-2014
Median Sales Price – Single FamilyRolling 12-Month Calculation
$350,000
$400,000
$450,000
$500,000
$550,000
$600,000
Q1-2009 Q1-2010 Q1-2011 Q1-2012 Q1-2013 Q1-2014
Median Sales Price – Townhouse-Condo Rolling 12-Month Calculation
Current as of April 28, 2014. All data from the Vail Board of REALTORS® MLS. Powered by 10K Research and Marketing.
Key Metrics 2013 2014Percent Change
from Previous Year Thru Q1-2013 Thru Q1-2014Percent Change
from Previous Year
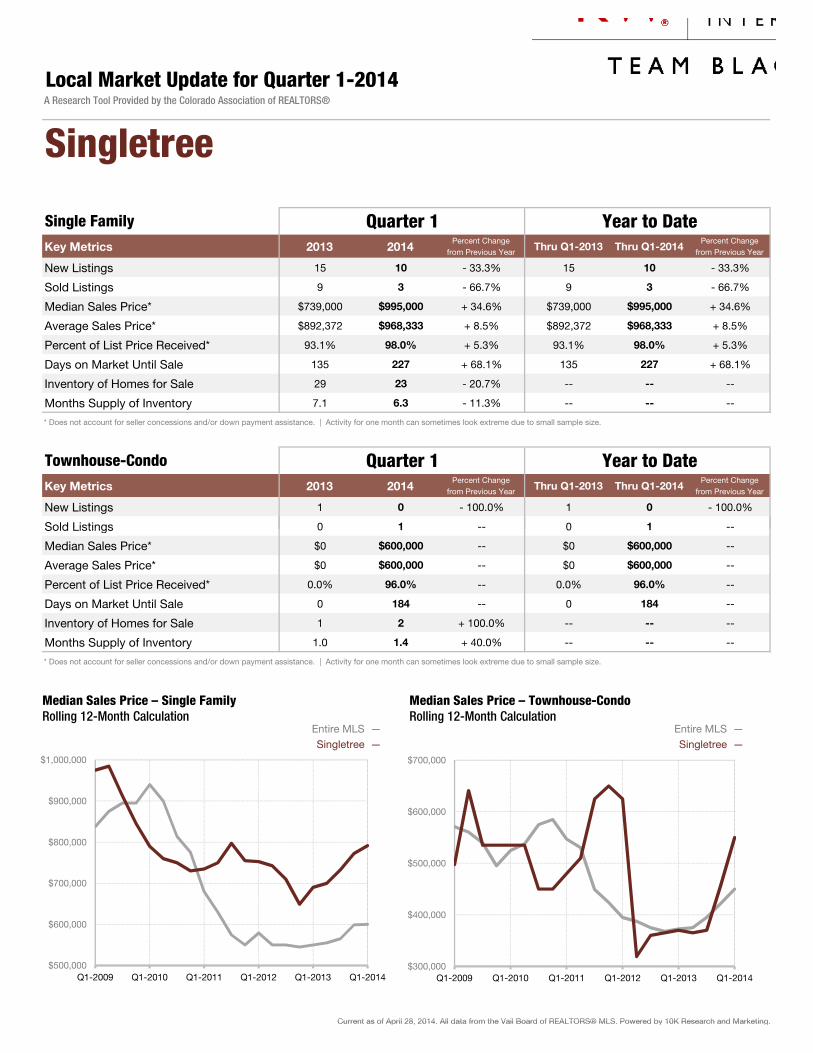
New Listings 15 10 - 33.3% 15 10 - 33.3%
Sold Listings 9 3 - 66.7% 9 3 - 66.7%
Median Sales Price* $739,000 $995,000 + 34.6% $739,000 $995,000 + 34.6%
Average Sales Price* $892,372 $968,333 + 8.5% $892,372 $968,333 + 8.5%
Percent of List Price Received* 93.1% 98.0% + 5.3% 93.1% 98.0% + 5.3%
Days on Market Until Sale 135 227 + 68.1% 135 227 + 68.1%
Inventory of Homes for Sale 29 23 - 20.7% -- -- --
Months Supply of Inventory 7.1 6.3 - 11.3% -- -- --
* Does not account for seller concessions and/or down payment assistance. | Activity for one month can sometimes look extreme due to small sample size.
Key Metrics 2013 2014Percent Change
from Previous Year Thru Q1-2013 Thru Q1-2014Percent Change
from Previous Year
New Listings 1 0 - 100.0% 1 0 - 100.0%
Sold Listings 0 1 -- 0 1 --
Local Market Update for Quarter 1-2014A Research Tool Provided by the Colorado Association of REALTORS®
Singletree
Quarter 1 Year to Date
Quarter 1 Year to DateSingle Family
Townhouse-Condo
Sold Listings 0 1 0 1
Median Sales Price* $0 $600,000 -- $0 $600,000 --
Average Sales Price* $0 $600,000 -- $0 $600,000 --
Percent of List Price Received* 0.0% 96.0% -- 0.0% 96.0% --
Days on Market Until Sale 0 184 -- 0 184 --
Inventory of Homes for Sale 1 2 + 100.0% -- -- --
Months Supply of Inventory 1.0 1.4 + 40.0% -- -- --
* Does not account for seller concessions and/or down payment assistance. | Activity for one month can sometimes look extreme due to small sample size.
Current as of April 28, 2014. All data from the Vail Board of REALTORS® MLS. Powered by 10K Research and Marketing.
Singletree — Entire MLS — Entire MLS —
Singletree —
$500,000
$600,000
$700,000
$800,000
$900,000
$1,000,000
Q1-2009 Q1-2010 Q1-2011 Q1-2012 Q1-2013 Q1-2014
Median Sales Price – Single FamilyRolling 12-Month Calculation
$300,000
$400,000
$500,000
$600,000
$700,000
Q1-2009 Q1-2010 Q1-2011 Q1-2012 Q1-2013 Q1-2014
Median Sales Price – Townhouse-Condo Rolling 12-Month Calculation
Current as of April 28, 2014. All data from the Vail Board of REALTORS® MLS. Powered by 10K Research and Marketing.
Key Metrics 2013 2014Percent Change
from Previous Year Thru Q1-2013 Thru Q1-2014Percent Change
from Previous Year
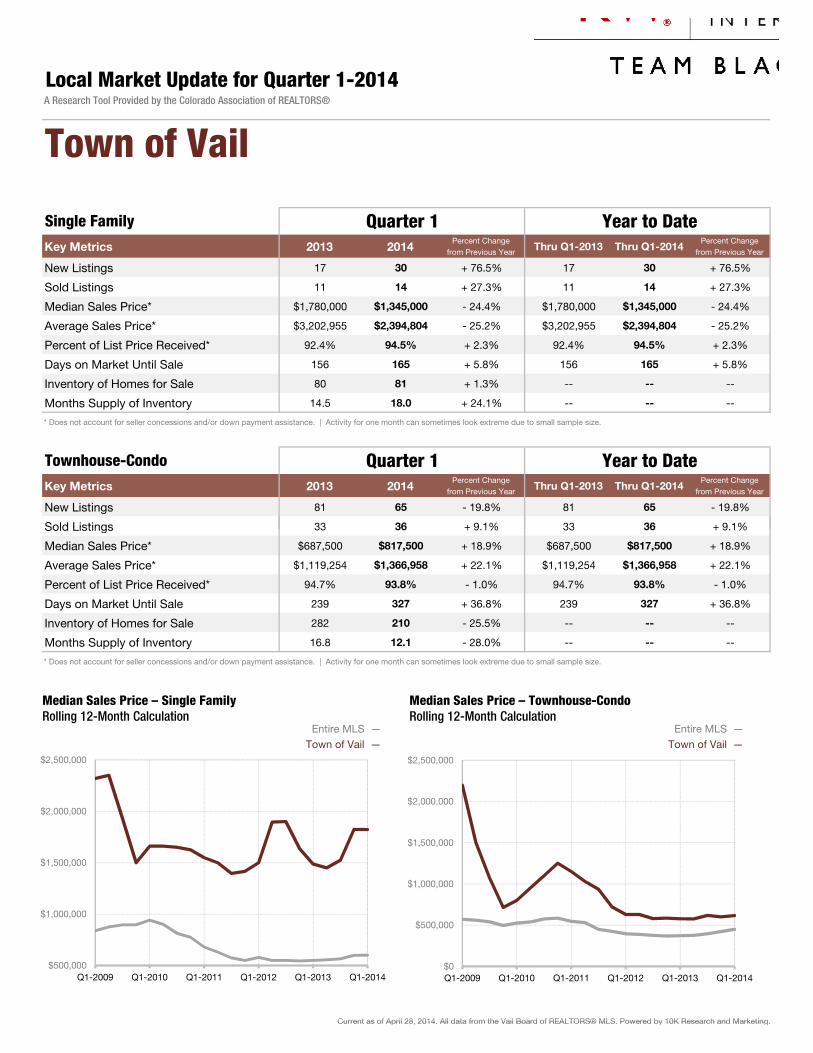
New Listings 17 30 + 76.5% 17 30 + 76.5%
Sold Listings 11 14 + 27.3% 11 14 + 27.3%
Median Sales Price* $1,780,000 $1,345,000 - 24.4% $1,780,000 $1,345,000 - 24.4%
Average Sales Price* $3,202,955 $2,394,804 - 25.2% $3,202,955 $2,394,804 - 25.2%
Percent of List Price Received* 92.4% 94.5% + 2.3% 92.4% 94.5% + 2.3%
Days on Market Until Sale 156 165 + 5.8% 156 165 + 5.8%
Inventory of Homes for Sale 80 81 + 1.3% -- -- --
Months Supply of Inventory 14.5 18.0 + 24.1% -- -- --
* Does not account for seller concessions and/or down payment assistance. | Activity for one month can sometimes look extreme due to small sample size.
Key Metrics 2013 2014Percent Change
from Previous Year Thru Q1-2013 Thru Q1-2014Percent Change
from Previous Year
New Listings 81 65 - 19.8% 81 65 - 19.8%
Sold Listings 33 36 + 9.1% 33 36 + 9.1%
Local Market Update for Quarter 1-2014A Research Tool Provided by the Colorado Association of REALTORS®
Town of Vail
Quarter 1 Year to Date
Quarter 1 Year to DateSingle Family
Townhouse-Condo
Sold Listings 33 36 + 9.1% 33 36 + 9.1%
Median Sales Price* $687,500 $817,500 + 18.9% $687,500 $817,500 + 18.9%
Average Sales Price* $1,119,254 $1,366,958 + 22.1% $1,119,254 $1,366,958 + 22.1%
Percent of List Price Received* 94.7% 93.8% - 1.0% 94.7% 93.8% - 1.0%
Days on Market Until Sale 239 327 + 36.8% 239 327 + 36.8%
Inventory of Homes for Sale 282 210 - 25.5% -- -- --
Months Supply of Inventory 16.8 12.1 - 28.0% -- -- --
* Does not account for seller concessions and/or down payment assistance. | Activity for one month can sometimes look extreme due to small sample size.
Current as of April 28, 2014. All data from the Vail Board of REALTORS® MLS. Powered by 10K Research and Marketing.
Town of Vail — Entire MLS — Entire MLS —
Town of Vail —
$500,000
$1,000,000
$1,500,000
$2,000,000
$2,500,000
Q1-2009 Q1-2010 Q1-2011 Q1-2012 Q1-2013 Q1-2014
Median Sales Price – Single FamilyRolling 12-Month Calculation
$0
$500,000
$1,000,000
$1,500,000
$2,000,000
$2,500,000
Q1-2009 Q1-2010 Q1-2011 Q1-2012 Q1-2013 Q1-2014
Median Sales Price – Townhouse-Condo Rolling 12-Month Calculation
Current as of April 28, 2014. All data from the Vail Board of REALTORS® MLS. Powered by 10K Research and Marketing.
Key Metrics 2013 2014Percent Change
from Previous Year Thru Q1-2013 Thru Q1-2014Percent Change
from Previous Year
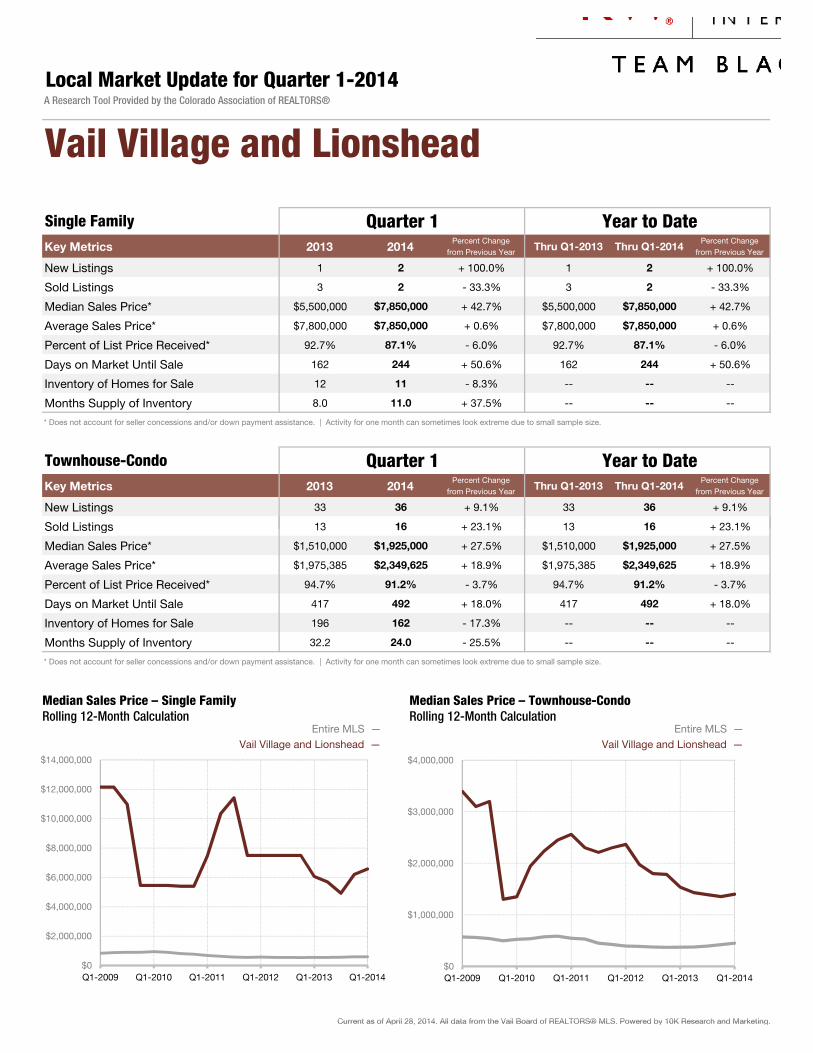
New Listings 1 2 + 100.0% 1 2 + 100.0%
Sold Listings 3 2 - 33.3% 3 2 - 33.3%
Median Sales Price* $5,500,000 $7,850,000 + 42.7% $5,500,000 $7,850,000 + 42.7%
Average Sales Price* $7,800,000 $7,850,000 + 0.6% $7,800,000 $7,850,000 + 0.6%
Percent of List Price Received* 92.7% 87.1% - 6.0% 92.7% 87.1% - 6.0%
Days on Market Until Sale 162 244 + 50.6% 162 244 + 50.6%
Inventory of Homes for Sale 12 11 - 8.3% -- -- --
Months Supply of Inventory 8.0 11.0 + 37.5% -- -- --
* Does not account for seller concessions and/or down payment assistance. | Activity for one month can sometimes look extreme due to small sample size.
Key Metrics 2013 2014Percent Change
from Previous Year Thru Q1-2013 Thru Q1-2014Percent Change
from Previous Year
New Listings 33 36 + 9.1% 33 36 + 9.1%
Sold Listings 13 16 + 23.1% 13 16 + 23.1%
Local Market Update for Quarter 1-2014A Research Tool Provided by the Colorado Association of REALTORS®
Vail Village and Lionshead#N/A
Quarter 1 Year to Date
Quarter 1 Year to DateSingle Family
Townhouse-Condo
Sold Listings 13 16 + 23.1% 13 16 + 23.1%
Median Sales Price* $1,510,000 $1,925,000 + 27.5% $1,510,000 $1,925,000 + 27.5%
Average Sales Price* $1,975,385 $2,349,625 + 18.9% $1,975,385 $2,349,625 + 18.9%
Percent of List Price Received* 94.7% 91.2% - 3.7% 94.7% 91.2% - 3.7%
Days on Market Until Sale 417 492 + 18.0% 417 492 + 18.0%
Inventory of Homes for Sale 196 162 - 17.3% -- -- --
Months Supply of Inventory 32.2 24.0 - 25.5% -- -- --
* Does not account for seller concessions and/or down payment assistance. | Activity for one month can sometimes look extreme due to small sample size.
Current as of April 28, 2014. All data from the Vail Board of REALTORS® MLS. Powered by 10K Research and Marketing.
Vail Village and Lionshead — Entire MLS — Entire MLS —
Vail Village and Lionshead —
$0
$2,000,000
$4,000,000
$6,000,000
$8,000,000
$10,000,000
$12,000,000
$14,000,000
Q1-2009 Q1-2010 Q1-2011 Q1-2012 Q1-2013 Q1-2014
Median Sales Price – Single FamilyRolling 12-Month Calculation
$0
$1,000,000
$2,000,000
$3,000,000
$4,000,000
Q1-2009 Q1-2010 Q1-2011 Q1-2012 Q1-2013 Q1-2014
Median Sales Price – Townhouse-Condo Rolling 12-Month Calculation
Current as of April 28, 2014. All data from the Vail Board of REALTORS® MLS. Powered by 10K Research and Marketing.
Key Metrics 2013 2014Percent Change
from Previous Year Thru Q1-2013 Thru Q1-2014Percent Change
from Previous Year
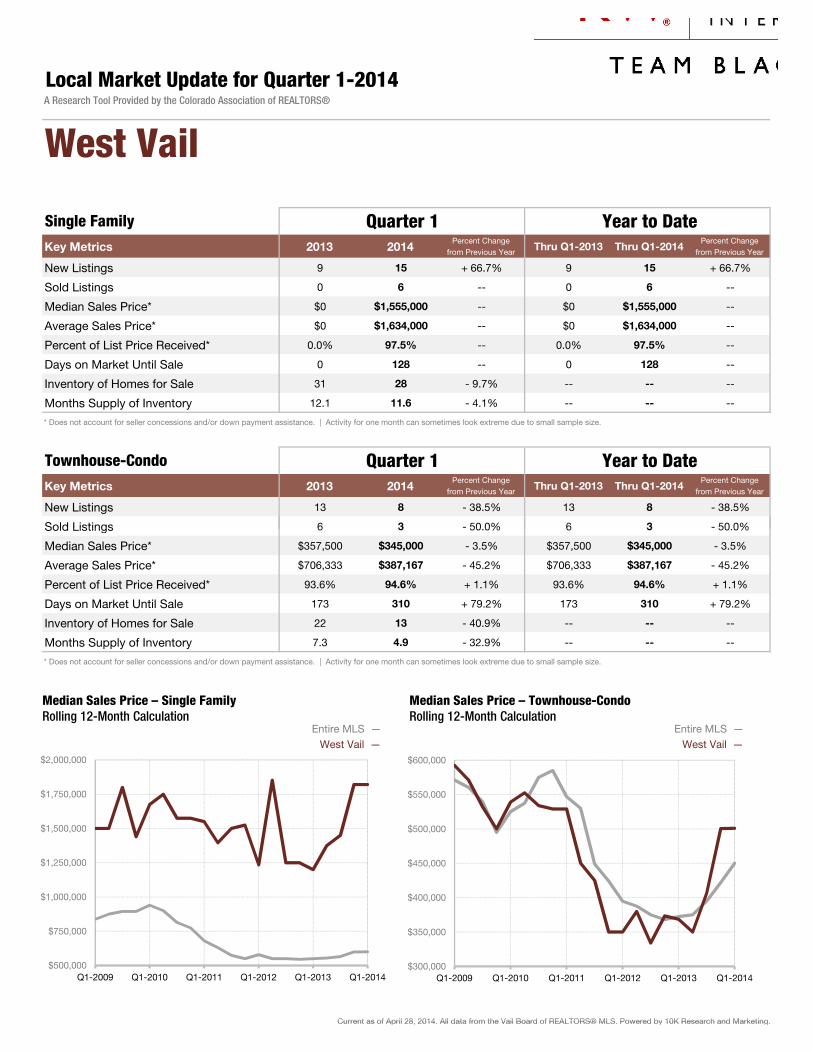
New Listings 9 15 + 66.7% 9 15 + 66.7%
Sold Listings 0 6 -- 0 6 --
Median Sales Price* $0 $1,555,000 -- $0 $1,555,000 --
Average Sales Price* $0 $1,634,000 -- $0 $1,634,000 --
Percent of List Price Received* 0.0% 97.5% -- 0.0% 97.5% --
Days on Market Until Sale 0 128 -- 0 128 --
Inventory of Homes for Sale 31 28 - 9.7% -- -- --
Months Supply of Inventory 12.1 11.6 - 4.1% -- -- --
* Does not account for seller concessions and/or down payment assistance. | Activity for one month can sometimes look extreme due to small sample size.
Key Metrics 2013 2014Percent Change
from Previous Year Thru Q1-2013 Thru Q1-2014Percent Change
from Previous Year
New Listings 13 8 - 38.5% 13 8 - 38.5%
Sold Listings 6 3 - 50.0% 6 3 - 50.0%
Local Market Update for Quarter 1-2014A Research Tool Provided by the Colorado Association of REALTORS®
West Vail
Quarter 1 Year to Date
Quarter 1 Year to DateSingle Family
Townhouse-Condo
Sold Listings 6 3 50.0% 6 3 50.0%
Median Sales Price* $357,500 $345,000 - 3.5% $357,500 $345,000 - 3.5%
Average Sales Price* $706,333 $387,167 - 45.2% $706,333 $387,167 - 45.2%
Percent of List Price Received* 93.6% 94.6% + 1.1% 93.6% 94.6% + 1.1%
Days on Market Until Sale 173 310 + 79.2% 173 310 + 79.2%
Inventory of Homes for Sale 22 13 - 40.9% -- -- --
Months Supply of Inventory 7.3 4.9 - 32.9% -- -- --
* Does not account for seller concessions and/or down payment assistance. | Activity for one month can sometimes look extreme due to small sample size.
Current as of April 28, 2014. All data from the Vail Board of REALTORS® MLS. Powered by 10K Research and Marketing.
West Vail — Entire MLS — Entire MLS —
West Vail —
$500,000
$750,000
$1,000,000
$1,250,000
$1,500,000
$1,750,000
$2,000,000
Q1-2009 Q1-2010 Q1-2011 Q1-2012 Q1-2013 Q1-2014
Median Sales Price – Single FamilyRolling 12-Month Calculation
$300,000
$350,000
$400,000
$450,000
$500,000
$550,000
$600,000
Q1-2009 Q1-2010 Q1-2011 Q1-2012 Q1-2013 Q1-2014
Median Sales Price – Townhouse-Condo Rolling 12-Month Calculation
Current as of April 28, 2014. All data from the Vail Board of REALTORS® MLS. Powered by 10K Research and Marketing.
Key Metrics 2013 2014Percent Change
from Previous Year Thru Q1-2013 Thru Q1-2014Percent Change
from Previous Year
New Listings 5 4 - 20.0% 5 4 - 20.0%
Sold Listings 3 6 + 100.0% 3 6 + 100.0%
Median Sales Price* $625,000 $718,950 + 15.0% $625,000 $718,950 + 15.0%
Average Sales Price* $728,333 $801,317 + 10.0% $728,333 $801,317 + 10.0%
Percent of List Price Received* 95.0% 93.0% - 2.1% 95.0% 93.0% - 2.1%
Days on Market Until Sale 55 118 + 114.5% 55 118 + 114.5%
Inventory of Homes for Sale 17 11 - 35.3% -- -- --
Months Supply of Inventory 7.2 4.8 - 33.3% -- -- --
* Does not account for seller concessions and/or down payment assistance. | Activity for one month can sometimes look extreme due to small sample size.
Key Metrics 2013 2014Percent Change
from Previous Year Thru Q1-2013 Thru Q1-2014Percent Change
from Previous Year
New Listings 4 2 - 50.0% 4 2 - 50.0%
Sold Listings 4 0 - 100.0% 4 0 - 100.0%
Local Market Update for Quarter 1-2014A Research Tool Provided by the Colorado Association of REALTORS®
Wildridge/Wildwood
Quarter 1 Year to Date
Quarter 1 Year to DateSingle Family
Townhouse-Condo
Sold Listings 4 0 100.0% 4 0 100.0%
Median Sales Price* $401,500 $0 - 100.0% $401,500 $0 - 100.0%
Average Sales Price* $395,500 $0 - 100.0% $395,500 $0 - 100.0%
Percent of List Price Received* 98.6% 0.0% - 100.0% 98.6% 0.0% - 100.0%
Days on Market Until Sale 84 0 - 100.0% 84 0 - 100.0%
Inventory of Homes for Sale 4 10 + 150.0% -- -- --
Months Supply of Inventory 3.1 5.5 + 77.4% -- -- --
* Does not account for seller concessions and/or down payment assistance. | Activity for one month can sometimes look extreme due to small sample size.
Current as of April 28, 2014. All data from the Vail Board of REALTORS® MLS. Powered by 10K Research and Marketing.
Wildridge/Wildwood — Entire MLS — Entire MLS —
Wildridge/Wildwood —
$500,000
$600,000
$700,000
$800,000
$900,000
$1,000,000
Q1-2009 Q1-2010 Q1-2011 Q1-2012 Q1-2013 Q1-2014
Median Sales Price – Single FamilyRolling 12-Month Calculation
$0
$100,000
$200,000
$300,000
$400,000
$500,000
$600,000
Q1-2009 Q1-2010 Q1-2011 Q1-2012 Q1-2013 Q1-2014
Median Sales Price – Townhouse-Condo Rolling 12-Month Calculation
Current as of April 28, 2014. All data from the Vail Board of REALTORS® MLS. Powered by 10K Research and Marketing.