Embed Size (px)
Citation preview
RG FCDQ – SECTION 1 – V4R1
1
Financial Report
First Quarter 2012 March 31, 2012
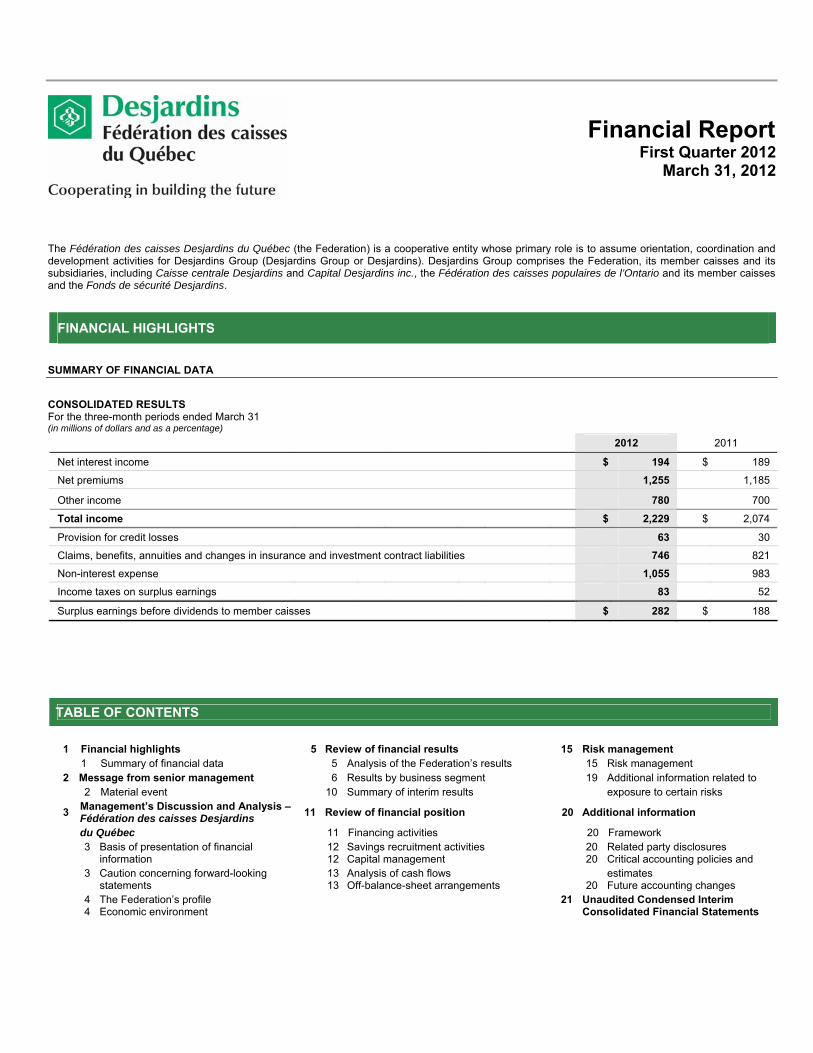
The Fédération des caisses Desjardins du Québec (the Federation) is a cooperative entity whose primary role is to assume orientation, coordination and development activities for Desjardins Group (Desjardins Group or Desjardins). Desjardins Group comprises the Federation, its member caisses and its subsidiaries, including Caisse centrale Desjardins and Capital Desjardins inc., the Fédération des caisses populaires de l’Ontario and its member caisses and the Fonds de sécurité Desjardins.
FINANCIAL HIGHLIGHTS
SUMMARY OF FINANCIAL DATA
CONSOLIDATED RESULTS For the three-month periods ended March 31 (in millions of dollars and as a percentage)
2012 2011
Net interest income $ 194 $ 189
Net premiums 1,255 1,185
Other income 780 700
Total income $ 2,229 $ 2,074
Provision for credit losses 63 30
Claims, benefits, annuities and changes in insurance and investment contract liabilities 746 821
Non-interest expense 1,055 983
Income taxes on surplus earnings 83 52
Surplus earnings before dividends to member caisses $ 282 $ 188
T
TABLE OF CONTENTS
1 Financial highlights 5 Review of financial results 15 Risk management 1 Summary of financial data 5 Analysis of the Federation’s results 15 Risk management
2 Message from senior management 6 Results by business segment 19 Additional information related to 2 Material event 10 Summary of interim results exposure to certain risks
3 Management’s Discussion and Analysis – Fédération des caisses Desjardins 11 Review of financial position 20 Additional information
du Québec 11 Financing activities 20 Framework
3 Basis of presentation of financial information 12
12Savings recruitment activities Capital management 20
20 Related party disclosures Critical accounting policies and
3 Caution concerning forward-looking statements 13
13Analysis of cash flows Off-balance-sheet arrangements
20 estimates Future accounting changes
4 4
The Federation’s profile Economic environment 21 Unaudited Condensed Interim
Consolidated Financial Statements
RG FCDQ – SECTION 1 – V4R1
2
MESSAGE FROM SENIOR MANAGEMENT
Lévis, May 11, 2012 – For the first quarter of 2012, the Fédération des caisses Desjardins du Québec recorded surplus earnings before dividends to member caisses of $282 million, compared to $188 million for the year-earlier quarter, an increase of 50.0%. Desjardins Card Services and particularly the Property and Casualty Insurance segment recorded growth in their business volumes, allowing Desjardins to pursue its development in various market segments. The first quarter was also characterized by an increase in other income because of the positive change in the fair value of certain investments and by a lower loss ratio than in the same quarter of 2011, particularly in the Property and Casualty Insurance segment.
“We are very satisfied with the growth in our assets and our surplus earnings,” said Monique F. Leroux, Chair of the Board, President and Chief Executive Officer of Desjardins Group. “The Property and Casualty Insurance segment performed particularly well, with 16.4% growth in net premiums and a 70.7% increase in its contribution to surplus earnings, as a result of our growth initiatives, recent acquisitions and a lower loss ratio.”
The Personal Services and Business and Institutional Services segment contributed $50 million to results in the first quarter of 2012, compared to $60 million in the corresponding quarter of 2011. This decrease chiefly was due to the increase in the provision for credit losses. For the same quarters, the Wealth Management and Life and Health Insurance segment posted surplus earnings of $61 million in 2012, down $2 million from 2011, while the Property and Casualty Insurance segment recorded an increase of $29 million in its surplus earnings, for a $70 million contribution in 2012.
Return on equity was 20.8% for the first three months of 2012, compared to 17.1% in 2011.
The Federation actively pursues development opportunities across Canada and elsewhere in the world, with promising results. This can be seen in the various agreements that have been signed by the Group over the last few months and as part of its strategic plan. For example, the Group opened a representation office in Paris as part of a cooperation agreement with Crédit Mutuel de France; entered into an agreement with Coast Capital Savings, one of the largest financial cooperatives in Western Canada, for card services; implemented a service offer to support the development of cooperatives and mutuals; and, finally, launched an investment program to improve the Group’s technological infrastructure and accelerate the digital transition underway in its caisse and subsidiary network.
The Federation is a component of Desjardins Group, which is one of the best capitalized financial institutions in Canada: its Tier 1 and total capital ratios, measured under the Basel II regulatory framework, stood at 16.0% and 19.2%, respectively, as at March 31, 2012. These ratios were 17.3% and 19.3%, respectively, as at December 31, 2011. Since the implementation of Basel II, Desjardins Group has applied the deferred treatment prescribed by the Autorité des marchés financiers (AMF), under which equity related to investments in its insurance subsidiaries made before January 1, 2007, was fully deducted from Tier 2 capital until fiscal 2012. Effective 2012, this equity must be deducted in equal shares of 50% from Tier 1 capital and Tier 2 capital. The end of the application of this deferred treatment had an unfavourable impact of 147 basis points on the Tier 1 capital ratio in the first quarter of 2012, but the total capital ratio remained the same. Initiatives are underway to improve the Tier 1 capital ratio in 2012, including a new issue of capital shares by the Federation, scheduled for fiscal 2012. Accordingly, the Fédération des caisses Desjardins du Québec obtained reporting issuer status on May 1, 2012.
MATERIAL EVENT Changes to Senior Management
On March 28, 2012, Monique F. Leroux, Chair of the Board, President and CEO, announced several changes to Desjardins Group’s senior management. As Ms. Leroux begins her second term at the head of Desjardins Group, these changes will allow her to focus more on the major strategic issues facing Desjardins Group as well as on promoting the cooperative movement.
As a result, changes have been made to the duties of Marc Laplante, Senior Executive Vice-President, Desjardins Group and the Federation. Mr. Laplante has been appointed Senior Executive Vice-President, Desjardins Group, and General Manager of the Federation. This new designation specifies and confirms Mr. Laplante’s role and responsibilities at the Federation, while reflecting his various responsibilities at the Desjardins Group level.
As part of his duties, Mr. Laplante will assume line authority over the Desjardins Group functions, as well as the Cooperative Network Support function and the Cooperative Development and Democratic Governance Support function. He will also play a supervisory and coordinating role with the business sectors in order to promote a greater sense of cohesion and enhanced synergy in Desjardins Group’s growth and development-related operations.
Ms. Leroux also announced the retirement of Raymond Laurin, Senior Vice-President, Finance and Treasury and Chief Financial Officer, Desjardins Group, who would relinquish his current duties on May 14, 2012, while continuing to act as strategic consultant to Desjardins Group management until the end of 2012. At the same time, Ms. Leroux announced the appointment of Daniel Dupuis, effective May 14, 2012, to the position of Senior Vice-President, Finance, and Chief Financial Officer, Desjardins Group. Mr. Dupuis had held until now the position of Senior Vice-President, Cooperative Network Support.
Following this change, the Treasury department, which was under the Finance and Treasury Executive Division and Office of the Chief Financial Officer, Desjardins Group, has been transferred to Louis-Daniel Gauvin, Senior Vice-President and General Manager of Caisse centrale Desjardins and Capital Desjardins inc.
Other changes made to Desjardins Group senior management include the following: Réal Bellemare, previously Executive Vice-President, Risk Management, Desjardins Group, is now Senior Vice-President, Risk Management, Desjardins Group; Guy Cormier, who was Vice-President, Cooperative Network Finance, has been promoted to the position left open by Daniel Dupuis, namely, Senior Vice-President, Cooperative Network Support; and Normand Desautels, who was Senior Vice-President and General Manager, Personal Services, has been appointed Senior Vice-President and General Manager, Personal Services and Human Capital following the retirement on March 31, 2012 of Jacques Dignard, Senior Vice-President, People and Culture.
FEDERATION DES CAISSES DESJARDINS DU QUEBEC INTERIM FINANCIAL STATEMENT
First quarter - March 31, 2012 2
RG FCDQ – SECTION 1 – V4R1
3
MANAGEMENT’S DISCUSSION AND ANALYSIS
This Management’s Discussion and Analysis (MD&A), dated May 11, 2012, presents the results of the analysis of the key elements of and changes in the Federation’s financial position for the quarter ended March 31, 2012, in comparison with the corresponding quarter in 2011. This MD&A should be read in conjunction with the unaudited Condensed Interim Consolidated Financial Statements (the Interim Consolidated Financial Statements), including the notes thereto, as at March 31, 2012, and the final long form non-offering Prospectus issued on April 30, 2012 (the Prospectus), containing the annual MD&A for 2011 and the annual Consolidated Financial Statements as at December 31, 2011.
Additional information about the Federation, including the Prospectus, is available on the SEDAR website at www.sedar.com (under the Fédération des caisses Desjardins du Québec profile), as well as information on Desjardins Group and the Annual Information Form of Capital Desjardins inc. (under the Capital Desjardins inc. profile) and of Caisse centrale Desjardins (under the Caisse centrale profile). More information is also available on the Desjardins website at www.desjardins.com/en/a_propos/investisseurs; however, none of the information presented on these sites is incorporated by reference into this report.
BASIS OF PRESENTATION OF FINANCIAL INFORMATION
The Federation’s Interim Consolidated Financial Statements are presented in accordance with International Financial Reporting Standards (IFRS), which constitute Canadian generally accepted accounting principles (GAAP), and the AMF’s accounting requirements, which do not differ from GAAP. For further information about accounting policies, see the interim and annual Consolidated Financial Statements.
This MD&A was prepared in accordance with the National Instruments in force on continuous disclosure obligations issued by the Canadian Securities Administrators. Unless otherwise indicated, all the amounts are unaudited and are presented in Canadian dollars. In order to assess its performance, the Federation uses and presents both IFRS measures and one non-IFRS financial measure. This non-IFRS financial measure is not directly comparable to similar measures used by other companies, and may not be directly comparable to any prescribed IFRS measures. Investors may find this non-IFRS measure is useful in analyzing financial performance, among other things. This measure is defined below:
Return on equity
Return on equity, which is expressed as a percentage, is equal to surplus earnings before dividends to member caisses, excluding the non-controlling interests’ share and interest paid to holders of PL and PL-2 investment shares (which are not eligible for the distribution of surplus earnings), divided by average equity before non-controlling interests and PL and PL-2 investment shares.
CAUTION CONCERNING FORWARD-LOOKING STATEMENTS
The Federation’s public communications often include oral or written forward-looking statements. Such forward-looking statements are contained in this MD&A, and may be incorporated in other filings with Canadian regulators or in any other communications. Forward-looking statements in this MD&A include, but are not limited to, comments with respect to the Federation’s objectives, regarding financial performance, its priorities, its operations, the review of economic conditions and markets, as well as the outlook for the Canadian, U.S., European and other international economies. Such statements are typically identified by words or phrases such as “believe”, “expect”, “anticipate”, “intend”, “estimate”, “plan”, and “may”; words and expressions of similar import, and future and conditional verbs.
By their very nature, such statements involve assumptions, uncertainties and inherent risks, both general and specific. It is therefore possible that the predictions, projections or other forward-looking statements as well as the Federation’s objectives and priorities may not materialize or may prove to be inaccurate because of a number of factors and that actual results differ materially. A number of factors beyond the Federation’s control could influence the accuracy of the forward-looking statements in this MD&A. These factors include those discussed in the “Risk management” section, such as credit, liquidity, market, operational, insurance, strategic and reputation risk. Additional risk factors include legislative or regulatory developments in Quebec, Canada or globally, such as changes in fiscal and monetary policies; new liquidity reporting and regulatory guidance, or interpretations thereof; and amendments to and new interpretations of capital guidelines. There are also factors related to changes in economic and financial conditions in Quebec, Canada or globally, including the unemployment rate; the geographic concentration of operations; changes in interest rates and exchange rates; trade between Quebec and the United States; the ability of third parties to comply with their obligations to the Federation; consumer spending; credit demand; the effects of increased competition in a market open to globalization; the presence of new and established competitors; fraud, including the use of new technologies in unprecedented ways against the Federation, its members or its clients; legal or regulatory procedures and lawsuits; consumer saving habits; the effect of possible international conflicts, including terrorism, or natural disasters; and new developments.
Lastly, there are also operational risk factors, including the inherent limits of risk management models; changes to technology; disruption of service for the Internet and other technologies; the ability to design new products and services and bring them to market in a timely fashion; the ability to collect complete and accurate information about our clients and their counterparties; the ability to perform and integrate strategic acquisitions and alliances; changes to the accounting policies and methods the Federation uses to present its financial position and operating results, including the uncertainties involving main accounting assumptions and estimates, as well as changes in estimates; the impact of future accounting changes; the ability to recruit and retain key officers; and management’s ability to foresee and manage risk factors.
It is important to note that the above-mentioned list of factors that could influence future results is not exhaustive. Other factors could have an adverse effect on results. Additional information on these and other factors is found in section 4.0, “Risk management”, of the 2011 Annual Report. Although the Federation believes that the expectations expressed in these forward-looking statements are reasonable, it can give no assurance or guarantee that these expectations will prove to be correct. The Federation cautions readers against placing undue reliance on forward-looking statements when making decisions.
Any forward-looking statements contained in this report represent the views of management only as at the date hereof, and are presented to help members and analysts understand the Federation’s financial position as at the dates indicated or for the periods ended on such dates, as well as its strategic priorities and objectives, and these statements may not be appropriate for other purposes. The Federation does not undertake to update any oral or written forward-looking statements that could be made from time to time by or on behalf of the Federation, except as required under applicable securities legislation.
FEDERATION DES CAISSES DESJARDINS DU QUEBEC INTERIM FINANCIAL STATEMENT
First quarter - March 31, 2012 3
RG FCDQ – SECTION 1 – V4R1
4
THE FEDERATION’S PROFILE
In addition to being responsible for assuming orientation, coordination and development activities for Desjardins Group, the Federation provides its member caisses with a variety of services, including certain technical, financial and administrative services, including through its subsidiaries. The Federation also holds the rights and privileges to use and participate in the Visa payment system in Canada for Desjardins Group, and, through holding companies, manages controlling interests in business corporations. The Federation enables the caisses and other Desjardins Group components to accelerate their development and better respond to the needs of their members and clients. The Federation’s structure has been designed to take into account the needs of Desjardins Group’s members and clients, as well as those of the markets in which it operates. The caisse network in Quebec and Ontario therefore has the support of the four main business segments to reinforce their ability to build on products and services, namely, the “Personal Services”, “Business and Institutional Services”, “Wealth Management and Life and Health Insurance” and “Property and Casualty Insurance” segments.
The Federation’s main subsidiaries are Caisse centrale Desjardins, Desjardins Financial Corporation Inc., Desjardins Financial Security Life Assurance Company, Desjardins Asset Management Inc., Desjardins General Insurance Group Inc., Western Financial Group Inc., Desjardins Securities Inc., Desjardins Trust Inc., Capital Desjardins inc. and Desjardins Technology Group Inc. The roles of treasurer and official representative with the Bank of Canada and the Canadian banking system are assumed by Caisse centrale Desjardins, also a cooperative financial institution, which is an integral part of Desjardins Group.
In addition to the Federation and its subsidiaries, Desjardins Group’s components and subsidiaries include the caisses in Quebec and Ontario, the Fédération des caisses populaires de l’Ontario and the Fonds de sécurité Desjardins. ECONOMIC ENVIRONMENT
The most recent developments in the European sovereign debt crisis have negatively affected the global economy by creating a highly uncertain economic environment and imposing major risks on the global financial system. However, the unprecedented support provided by the European Central Bank to the banking industry in the euro zone has relieved the pressure on financial markets. The problems relating to public debt in the euro zone are nevertheless far from resolved, and countries like Greece, Spain, Italy and Portugal remain in a very uncomfortable position.
The global economic situation is showing obvious signs of weakness. According to the most recent data, real GDP for the euro zone shrank at the end of 2011. Meanwhile, at the beginning of the year there were slight increases in Euroland consumer confidence and business climate indices. In emerging countries, growth generally remains solid although they are feeling the repercussions of the global turbulence. China saw its annual real GDP growth slow more than expected, to 8.1% in the first quarter of 2012.
Economic and financial indicators were rather encouraging in the United States during the first few months of 2012. Real GDP grew at an annualized 2.2%. Real consumption rose 2.9%, the strongest increase since the fall of 2011. Consumer confidence indices have picked up, as reflected in retail sales. The manufacturing and non-manufacturing ISM indices also clearly point to continued growth. Caution is nevertheless necessary since the economy has already experienced a number of false starts. It should be remembered that during the same period last year, the U.S. economy had experienced an upturn that seemed to promise a more vigorous recovery. In the end, this upturn proved to be short-lived. Similar to last year, oil and gas prices have soared since early 2012, and this increase is a significant risk in our economic and financial scenario for the current year.
The most recent figures show weak growth in Canada. After rising 0.1% in January, real GDP by industry declined 0.2% in February. However, this unexpected drop reflected temporary closings in the energy and resources sectors and should not be seen as the start of a long period of weakness. The creation of 82,300 jobs in March 2012 calmed concerns that household consumption would be affected by a labour market that has stagnated since the summer of 2011. Residential construction was still on a roll in Canada in the first quarter of 2012, especially in Ontario, where there are fears of an imbalance in certain market segments, particularly in condominiums.
Quebec ended 2011 with moderate growth of 0.8% in the fourth quarter, partly as a result of the solid performance of residential investments and consumer spending. For the full year, real GDP increased by 1.7%, and the first few months of 2012 should continue at a similar pace. Retail sales were up 0.7% in February after slipping 1.4% in January. The increase in the provincial sales tax (QST) on January 1, 2012 therefore temporarily weakened consumer spending at the start of the year. A gain in the first quarter is therefore not assured, but the recent rise in employment should lead to renewed growth in retail sales.
The expected slowdown in Quebec’s residential construction was confirmed in the first quarter of 2012. Housing starts were down compared to the previous quarter. Home resale transactions were up slightly from the previous year. Even if growth in property sales continued to exceed expectations, price increases slowed. Price growth was 3.3% in the first quarter of 2012, which was closer to the inflation rate for the period (2.7%).
Quebec’s foreign exports (in real terms) rose 1.5% in February after dropping 18.7% in January. This slight increase in international exports is not very convincing; several months of stronger growth will be needed for a truly positive signal. Foreign trade is still on shaky foundations, since the U.S. economy is growing at a moderate pace, the economy of the euro zone is still struggling, and China’s economy is losing momentum.
The Federal Reserve (the “Fed”) was quite busy in early 2012. At its January meeting, its leaders set off a shock wave by postponing any hike in key interest rates “until at least late 2014”. The Fed also started to explicitly target a 2% inflation rate, together with a less precise target unemployment rate. Worried about global risks, the Bank of Canada did not modify its overnight rate. However, the concerns of major central banks diminished in the first quarter of 2012, and they have adopted a more positive tone as a result of the reduced financial tension and improved economic figures, particularly in the United States. The need for new monetary easing has therefore become less pressing.
Reduced financial stress in Europe had a favourable impact on international capital markets. While financing conditions improved in most European countries, North American rates started moving up from their trough. Stock markets turned in an enviable performance in the first three months of the year. The S&P/TSX index was up 3.7% while the S&P 500 advanced 12%. Oil prices benefited from the improved economic performance and the continued major geopolitical risk premium resulting from a possible conflict with Iran. The Western Texas Intermediate (WTI) crude oil price rose to about US$105 a barrel in the first quarter. The Canadian dollar has remained quite stable, hovering slightly above parity with the U.S. dollar.
.
FEDERATION DES CAISSES DESJARDINS DU QUEBEC INTERIM FINANCIAL STATEMENT
First quarter - March 31, 2012 4
RG FCDQ – SECTION 2 – V4R1
5
REVIEW OF FINANCIAL RESULTS
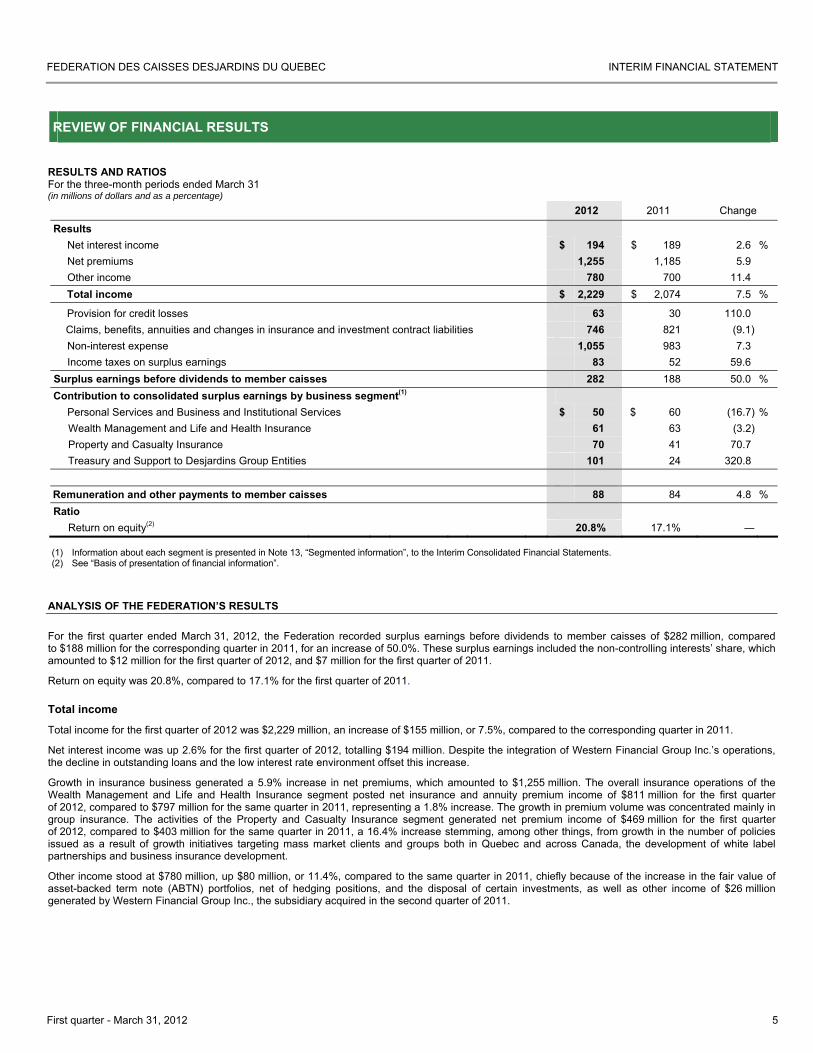
RESULTS AND RATIOS For the three-month periods ended March 31 (in millions of dollars and as a percentage)
2012 2011 Change
Results Net interest income $ 194 $ 189 2.6 % Net premiums 1,255 1,185 5.9 Other income 780 700 11.4 Total income $ 2,229 $ 2,074 7.5 %
Provision for credit losses 63 30 110.0 Claims, benefits, annuities and changes in insurance and investment contract liabilities 746 821 (9.1) Non-interest expense 1,055 983 7.3 Income taxes on surplus earnings 83 52 59.6
Surplus earnings before dividends to member caisses 282 188 50.0 % Contribution to consolidated surplus earnings by business segment(1)
Personal Services and Business and Institutional Services $ 50 $ 60 (16.7) % Wealth Management and Life and Health Insurance 61 63 (3.2) Property and Casualty Insurance 70 41 70.7 Treasury and Support to Desjardins Group Entities 101 24 320.8
Remuneration and other payments to member caisses 88 84 4.8 % Ratio
Return on equity(2) 20.8% 17.1% ―
(1) Information about each segment is presented in Note 13, “Segmented information”, to the Interim Consolidated Financial Statements. (2) See “Basis of presentation of financial information”.
ANALYSIS OF THE FEDERATION’S RESULTS
For the first quarter ended March 31, 2012, the Federation recorded surplus earnings before dividends to member caisses of $282 million, compared to $188 million for the corresponding quarter in 2011, for an increase of 50.0%. These surplus earnings included the non-controlling interests’ share, which amounted to $12 million for the first quarter of 2012, and $7 million for the first quarter of 2011.
Return on equity was 20.8%, compared to 17.1% for the first quarter of 2011.
Total income
Total income for the first quarter of 2012 was $2,229 million, an increase of $155 million, or 7.5%, compared to the corresponding quarter in 2011.
Net interest income was up 2.6% for the first quarter of 2012, totalling $194 million. Despite the integration of Western Financial Group Inc.’s operations, the decline in outstanding loans and the low interest rate environment offset this increase.
Growth in insurance business generated a 5.9% increase in net premiums, which amounted to $1,255 million. The overall insurance operations of the Wealth Management and Life and Health Insurance segment posted net insurance and annuity premium income of $811 million for the first quarter of 2012, compared to $797 million for the same quarter in 2011, representing a 1.8% increase. The growth in premium volume was concentrated mainly in group insurance. The activities of the Property and Casualty Insurance segment generated net premium income of $469 million for the first quarter of 2012, compared to $403 million for the same quarter in 2011, a 16.4% increase stemming, among other things, from growth in the number of policies issued as a result of growth initiatives targeting mass market clients and groups both in Quebec and across Canada, the development of white label partnerships and business insurance development.
Other income stood at $780 million, up $80 million, or 11.4%, compared to the same quarter in 2011, chiefly because of the increase in the fair value of asset-backed term note (ABTN) portfolios, net of hedging positions, and the disposal of certain investments, as well as other income of $26 million generated by Western Financial Group Inc., the subsidiary acquired in the second quarter of 2011.
FEDERATION DES CAISSES DESJARDINS DU QUEBEC INTERIM FINANCIAL STATEMENT
First quarter - March 31, 2012 5
RG FCDQ – SECTION 2 – V4R1
6
Provision for credit losses
The provision for credit losses totalled $63 million for the first quarter of 2012, up $33 million compared to the corresponding quarter in 2011, primarily as a result of a collective allowance adjustment due to changes in credit risk, an increase in loans outstanding, and recoveries made in the first quarter of 2011.
Claims, benefits, annuities and changes in insurance and investment contract liabilities
Expenses related to claims, benefits, annuities and changes in insurance and investment contract liabilities totalled $746 million, down $75 million, or 9.1%, compared to the same quarter in 2011. For the Wealth Management and Life and Health Insurance segment, these expenses were $455 million, down $102 million, or 18.3%, compared to the same quarter in 2011. The change was basically the result of a $113 million reduction in actuarial liabilities included under “Insurance and investment contract liabilities”, including the decrease in the fair value of investments. Disability insurance benefits, however, rose by $30 million.
Expenses for the Property and Casualty Insurance segment were $291 million, compared to $269 million for the same quarter in 2011, representing an increase of $22 million, or 8.2%, essentially due to growth in the Ontario automobile insurance policy portfolio. Furthermore, the loss ratio was 62.0% for the first quarter of 2012, compared to 66.7% for the same quarter in 2011.
Non-interest expense and other items
Non-interest expense grew by $72 million to total $1,055 million, up 7.3%, compared to the first quarter of 2011. This increase came chiefly as a result of the integration of the operations of Western Financial Group Inc., which accounted for $43 million and the annual increase in salaries and fringe benefits due to indexing.
Remuneration and other payments to member caisses totalled $88 million, up $4 million, or 4.8%, compared to the same quarter in 2011.
RESULTS BY BUSINESS SEGMENT The Federation’s financial reporting is based on accounting by operations structured according to the needs of members and clients, as well as the markets in which it operates, thereby reflecting its internal management method. The Federation’s financial results are therefore divided into the following three business segments: Personal Services and Business and Institutional Services, Wealth Management and Life and Health Insurance, and Property and Casualty Insurance. This section includes the profile, operations, industry description, 2011 highlights, the strategy and priorities for 2012, as well as an analysis of the results of each segment. The Treasury and Support to Desjardins Group Entities category is also added to these three business segments. During the second quarter of 2011, the Federation discontinued allocating the results of its support functions to the various business segments. The Federation’s support functions are now presented in the Treasury and Support to Desjardins Group Entities category. This new basis of presentation allows the Federation to provide disclosures that are more representative of the operating results of each business segment. Segmented information for 2010 presented for comparison has been restated to conform to this new basis of presentation. Intersegment transactions are carried out in the normal course of business and are measured at the exchange amount, which corresponds to the amount of consideration established and agreed to by each of the legal entities and business units.
FEDERATION DES CAISSES DESJARDINS DU QUEBEC INTERIM FINANCIAL STATEMENT
First quarter - March 31, 2012 6
RG FCDQ – SECTION 2 – V4R1
7
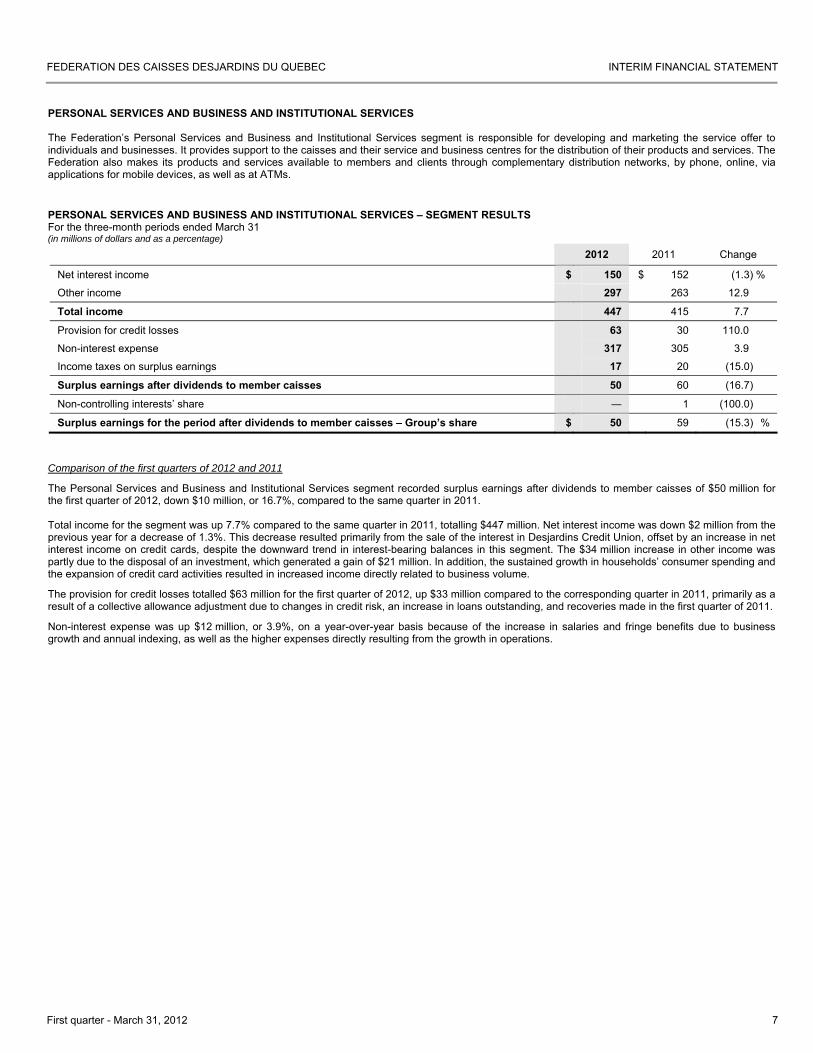
PERSONAL SERVICES AND BUSINESS AND INSTITUTIONAL SERVICES The Federation’s Personal Services and Business and Institutional Services segment is responsible for developing and marketing the service offer to individuals and businesses. It provides support to the caisses and their service and business centres for the distribution of their products and services. The Federation also makes its products and services available to members and clients through complementary distribution networks, by phone, online, via applications for mobile devices, as well as at ATMs.
PERSONAL SERVICES AND BUSINESS AND INSTITUTIONAL SERVICES – SEGMENT RESULTS For the three-month periods ended March 31 (in millions of dollars and as a percentage)
2012 2011 Change
Net interest income $ 150 $ 152 (1.3) %
Other income 297 263 12.9
Total income 447 415 7.7
Provision for credit losses 63 30 110.0
Non-interest expense 317 305 3.9
Income taxes on surplus earnings 17 20 (15.0)
Surplus earnings after dividends to member caisses 50 60 (16.7)
Non-controlling interests’ share ― 1 (100.0)
Surplus earnings for the period after dividends to member caisses – Group’s share $ 50 59 (15.3) %
Comparison of the first quarters of 2012 and 2011
The Personal Services and Business and Institutional Services segment recorded surplus earnings after dividends to member caisses of $50 million for the first quarter of 2012, down $10 million, or 16.7%, compared to the same quarter in 2011. Total income for the segment was up 7.7% compared to the same quarter in 2011, totalling $447 million. Net interest income was down $2 million from the previous year for a decrease of 1.3%. This decrease resulted primarily from the sale of the interest in Desjardins Credit Union, offset by an increase in net interest income on credit cards, despite the downward trend in interest-bearing balances in this segment. The $34 million increase in other income was partly due to the disposal of an investment, which generated a gain of $21 million. In addition, the sustained growth in households’ consumer spending and the expansion of credit card activities resulted in increased income directly related to business volume.
The provision for credit losses totalled $63 million for the first quarter of 2012, up $33 million compared to the corresponding quarter in 2011, primarily as a result of a collective allowance adjustment due to changes in credit risk, an increase in loans outstanding, and recoveries made in the first quarter of 2011.
Non-interest expense was up $12 million, or 3.9%, on a year-over-year basis because of the increase in salaries and fringe benefits due to business growth and annual indexing, as well as the higher expenses directly resulting from the growth in operations.
FEDERATION DES CAISSES DESJARDINS DU QUEBEC INTERIM FINANCIAL STATEMENT
First quarter - March 31, 2012 7
RG FCDQ – SECTION 2 – V4R1
8
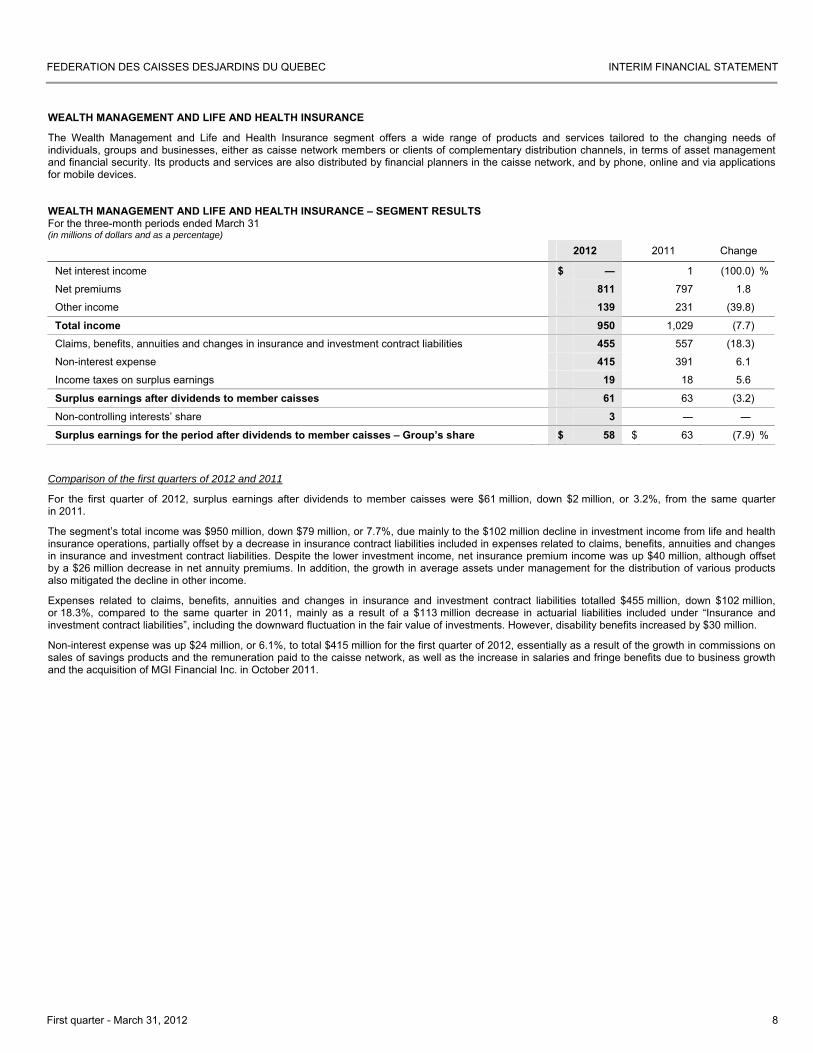
WEALTH MANAGEMENT AND LIFE AND HEALTH INSURANCE
The Wealth Management and Life and Health Insurance segment offers a wide range of products and services tailored to the changing needs of individuals, groups and businesses, either as caisse network members or clients of complementary distribution channels, in terms of asset management and financial security. Its products and services are also distributed by financial planners in the caisse network, and by phone, online and via applications for mobile devices. WEALTH MANAGEMENT AND LIFE AND HEALTH INSURANCE – SEGMENT RESULTS For the three-month periods ended March 31 (in millions of dollars and as a percentage)
2012 2011 Change
Net interest income $ ― 1 (100.0) %
Net premiums 811 797 1.8
Other income 139 231 (39.8)
Total income 950 1,029 (7.7)
Claims, benefits, annuities and changes in insurance and investment contract liabilities 455 557 (18.3)
Non-interest expense 415 391 6.1
Income taxes on surplus earnings 19 18 5.6
Surplus earnings after dividends to member caisses 61 63 (3.2)
Non-controlling interests’ share 3 ― ―
Surplus earnings for the period after dividends to member caisses – Group’s share $ 58 $ 63 (7.9) %
Comparison of the first quarters of 2012 and 2011
For the first quarter of 2012, surplus earnings after dividends to member caisses were $61 million, down $2 million, or 3.2%, from the same quarter in 2011.
The segment’s total income was $950 million, down $79 million, or 7.7%, due mainly to the $102 million decline in investment income from life and health insurance operations, partially offset by a decrease in insurance contract liabilities included in expenses related to claims, benefits, annuities and changes in insurance and investment contract liabilities. Despite the lower investment income, net insurance premium income was up $40 million, although offset by a $26 million decrease in net annuity premiums. In addition, the growth in average assets under management for the distribution of various products also mitigated the decline in other income.
Expenses related to claims, benefits, annuities and changes in insurance and investment contract liabilities totalled $455 million, down $102 million, or 18.3%, compared to the same quarter in 2011, mainly as a result of a $113 million decrease in actuarial liabilities included under “Insurance and investment contract liabilities”, including the downward fluctuation in the fair value of investments. However, disability benefits increased by $30 million.
Non-interest expense was up $24 million, or 6.1%, to total $415 million for the first quarter of 2012, essentially as a result of the growth in commissions on sales of savings products and the remuneration paid to the caisse network, as well as the increase in salaries and fringe benefits due to business growth and the acquisition of MGI Financial Inc. in October 2011.
FEDERATION DES CAISSES DESJARDINS DU QUEBEC INTERIM FINANCIAL STATEMENT
First quarter - March 31, 2012 8
RG FCDQ – SECTION 2 – V4R1
9
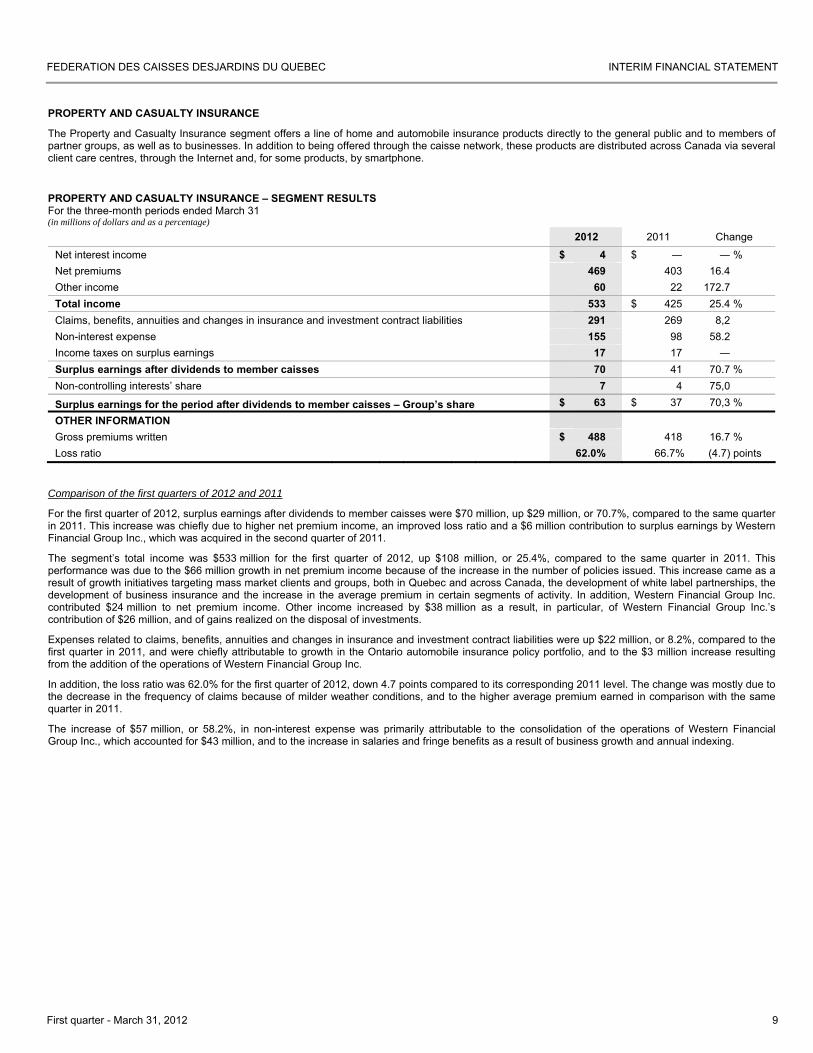
PROPERTY AND CASUALTY INSURANCE
The Property and Casualty Insurance segment offers a line of home and automobile insurance products directly to the general public and to members of partner groups, as well as to businesses. In addition to being offered through the caisse network, these products are distributed across Canada via several client care centres, through the Internet and, for some products, by smartphone.
PROPERTY AND CASUALTY INSURANCE – SEGMENT RESULTS For the three-month periods ended March 31 (in millions of dollars and as a percentage)
2012 2011 Change
Net interest income $ 4 $ ― ― % Net premiums 469 403 16.4 Other income 60 22 172.7 Total income 533 $ 425 25.4 % Claims, benefits, annuities and changes in insurance and investment contract liabilities 291 269 8,2 Non-interest expense 155 98 58.2 Income taxes on surplus earnings 17 17 ― Surplus earnings after dividends to member caisses 70 41 70.7 % Non-controlling interests’ share 7 4 75,0
Surplus earnings for the period after dividends to member caisses – Group’s share $ 63 $ 37 70,3 %
OTHER INFORMATION Gross premiums written $ 488 418 16.7 % Loss ratio 62.0% 66.7% (4.7) points
Comparison of the first quarters of 2012 and 2011
For the first quarter of 2012, surplus earnings after dividends to member caisses were $70 million, up $29 million, or 70.7%, compared to the same quarter in 2011. This increase was chiefly due to higher net premium income, an improved loss ratio and a $6 million contribution to surplus earnings by Western Financial Group Inc., which was acquired in the second quarter of 2011.
The segment’s total income was $533 million for the first quarter of 2012, up $108 million, or 25.4%, compared to the same quarter in 2011. This performance was due to the $66 million growth in net premium income because of the increase in the number of policies issued. This increase came as a result of growth initiatives targeting mass market clients and groups, both in Quebec and across Canada, the development of white label partnerships, the development of business insurance and the increase in the average premium in certain segments of activity. In addition, Western Financial Group Inc. contributed $24 million to net premium income. Other income increased by $38 million as a result, in particular, of Western Financial Group Inc.’s contribution of $26 million, and of gains realized on the disposal of investments.
Expenses related to claims, benefits, annuities and changes in insurance and investment contract liabilities were up $22 million, or 8.2%, compared to the first quarter in 2011, and were chiefly attributable to growth in the Ontario automobile insurance policy portfolio, and to the $3 million increase resulting from the addition of the operations of Western Financial Group Inc.
In addition, the loss ratio was 62.0% for the first quarter of 2012, down 4.7 points compared to its corresponding 2011 level. The change was mostly due to the decrease in the frequency of claims because of milder weather conditions, and to the higher average premium earned in comparison with the same quarter in 2011.
The increase of $57 million, or 58.2%, in non-interest expense was primarily attributable to the consolidation of the operations of Western Financial Group Inc., which accounted for $43 million, and to the increase in salaries and fringe benefits as a result of business growth and annual indexing.
FEDERATION DES CAISSES DESJARDINS DU QUEBEC INTERIM FINANCIAL STATEMENT
First quarter - March 31, 2012 9
RG FCDQ – SECTION 2 – V4R1
10
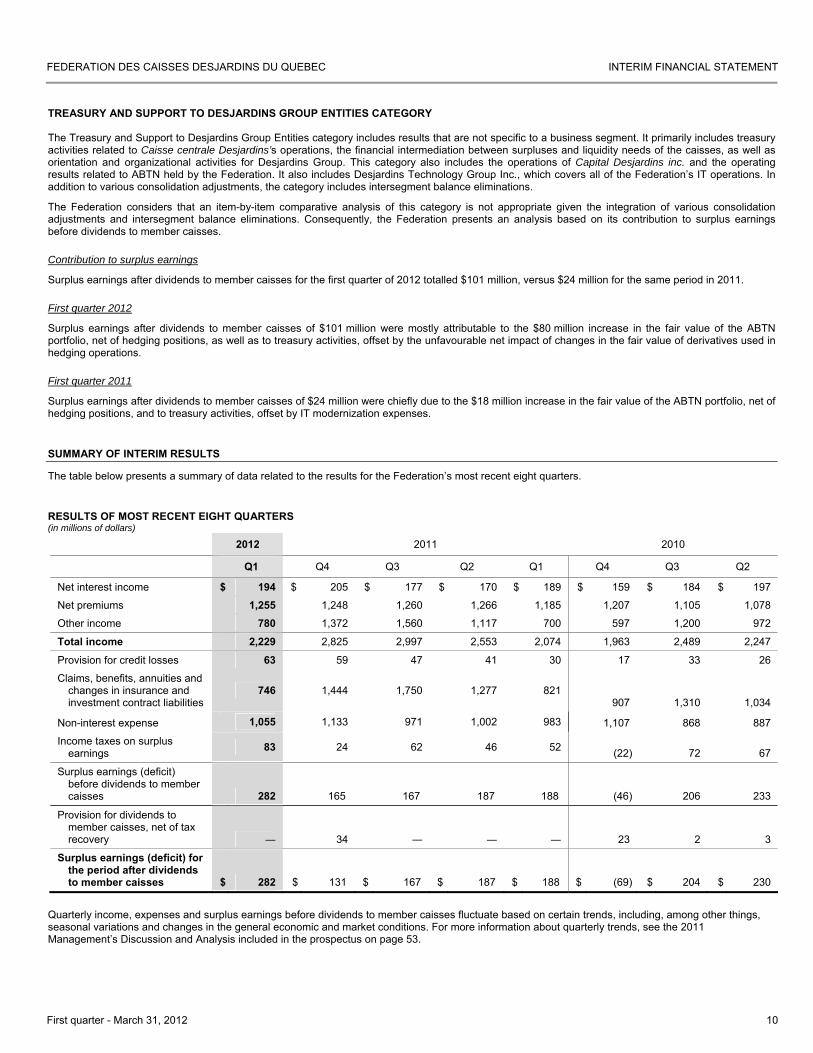
TREASURY AND SUPPORT TO DESJARDINS GROUP ENTITIES CATEGORY The Treasury and Support to Desjardins Group Entities category includes results that are not specific to a business segment. It primarily includes treasury activities related to Caisse centrale Desjardins’s operations, the financial intermediation between surpluses and liquidity needs of the caisses, as well as orientation and organizational activities for Desjardins Group. This category also includes the operations of Capital Desjardins inc. and the operating results related to ABTN held by the Federation. It also includes Desjardins Technology Group Inc., which covers all of the Federation’s IT operations. In addition to various consolidation adjustments, the category includes intersegment balance eliminations.
The Federation considers that an item-by-item comparative analysis of this category is not appropriate given the integration of various consolidation adjustments and intersegment balance eliminations. Consequently, the Federation presents an analysis based on its contribution to surplus earnings before dividends to member caisses.
Contribution to surplus earnings
Surplus earnings after dividends to member caisses for the first quarter of 2012 totalled $101 million, versus $24 million for the same period in 2011.
First quarter 2012
Surplus earnings after dividends to member caisses of $101 million were mostly attributable to the $80 million increase in the fair value of the ABTN portfolio, net of hedging positions, as well as to treasury activities, offset by the unfavourable net impact of changes in the fair value of derivatives used in hedging operations.
First quarter 2011
Surplus earnings after dividends to member caisses of $24 million were chiefly due to the $18 million increase in the fair value of the ABTN portfolio, net of hedging positions, and to treasury activities, offset by IT modernization expenses.
SUMMARY OF INTERIM RESULTS
The table below presents a summary of data related to the results for the Federation’s most recent eight quarters.
RESULTS OF MOST RECENT EIGHT QUARTERS (in millions of dollars)
2012 2011 2010
Q1 Q4 Q3 Q2 Q1 Q4 Q3 Q2
Net interest income $ 194 $ 205 $ 177 $ 170 $ 189 $ 159 $ 184 $ 197
Net premiums 1,255 1,248 1,260 1,266 1,185 1,207 1,105 1,078
Other income 780 1,372 1,560 1,117 700 597 1,200 972
Total income 2,229 2,825 2,997 2,553 2,074 1,963 2,489 2,247
Provision for credit losses 63 59 47 41 30 17 33 26
Claims, benefits, annuities and changes in insurance and investment contract liabilities
746 1,444 1,750 1,277 821
907 1,310 1,034
Non-interest expense 1,055 1,133 971 1,002 983 1,107 868 887
Income taxes on surplus earnings 83 24 62 46 52 (22) 72 67
Surplus earnings (deficit) before dividends to member caisses 282 165 167 187 188 (46) 206 233
Provision for dividends to member caisses, net of tax recovery ― 34 ― ― ― 23 2 3
Surplus earnings (deficit) for the period after dividends to member caisses $ 282 $ 131 $ 167 $ 187 $ 188 $ (69) $ 204 $ 230
Quarterly income, expenses and surplus earnings before dividends to member caisses fluctuate based on certain trends, including, among other things, seasonal variations and changes in the general economic and market conditions. For more information about quarterly trends, see the 2011 Management’s Discussion and Analysis included in the prospectus on page 53.
FEDERATION DES CAISSES DESJARDINS DU QUEBEC INTERIM FINANCIAL STATEMENT
First quarter - March 31, 2012 10
RG FCDQ – SECTION 3 – V4R1
11
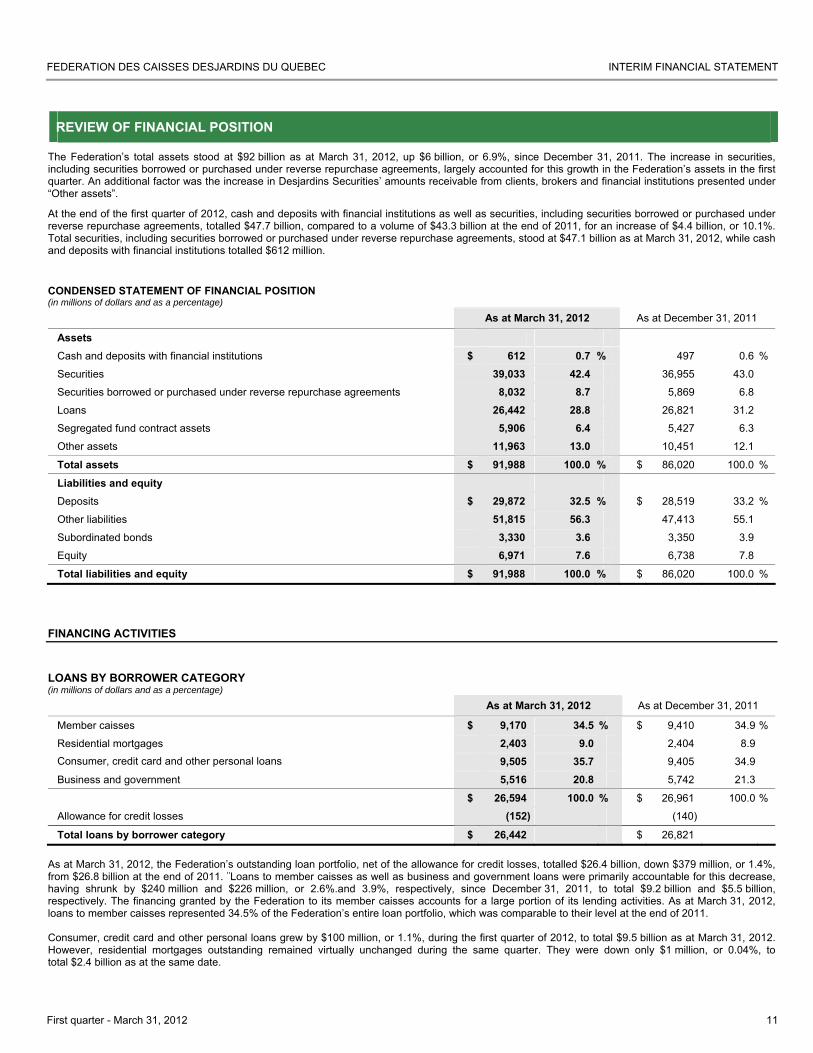
REVIEW OF FINANCIAL POSITION
The Federation’s total assets stood at $92 billion as at March 31, 2012, up $6 billion, or 6.9%, since December 31, 2011. The increase in securities, including securities borrowed or purchased under reverse repurchase agreements, largely accounted for this growth in the Federation’s assets in the first quarter. An additional factor was the increase in Desjardins Securities’ amounts receivable from clients, brokers and financial institutions presented under “Other assets”.
At the end of the first quarter of 2012, cash and deposits with financial institutions as well as securities, including securities borrowed or purchased under reverse repurchase agreements, totalled $47.7 billion, compared to a volume of $43.3 billion at the end of 2011, for an increase of $4.4 billion, or 10.1%. Total securities, including securities borrowed or purchased under reverse repurchase agreements, stood at $47.1 billion as at March 31, 2012, while cash and deposits with financial institutions totalled $612 million.
CONDENSED STATEMENT OF FINANCIAL POSITION (in millions of dollars and as a percentage)
As at March 31, 2012 As at December 31, 2011
Assets
Cash and deposits with financial institutions $ 612 0.7 % 497 0.6 %
Securities 39,033 42.4 36,955 43.0
Securities borrowed or purchased under reverse repurchase agreements 8,032 8.7 5,869 6.8
Loans 26,442 28.8 26,821 31.2
Segregated fund contract assets 5,906 6.4 5,427 6.3
Other assets 11,963 13.0 10,451 12.1
Total assets $ 91,988 100.0 % $ 86,020 100.0 %
Liabilities and equity
Deposits $ 29,872 32.5 % $ 28,519 33.2 %
Other liabilities 51,815 56.3 47,413 55.1
Subordinated bonds 3,330 3.6 3,350 3.9
Equity 6,971 7.6 6,738 7.8
Total liabilities and equity $ 91,988 100.0 % $ 86,020 100.0 %
FINANCING ACTIVITIES
LOANS BY BORROWER CATEGORY (in millions of dollars and as a percentage)
As at March 31, 2012 As at December 31, 2011
Member caisses $ 9,170 34.5 % $ 9,410 34.9 %
Residential mortgages 2,403 9.0 2,404 8.9 Consumer, credit card and other personal loans 9,505 35.7 9,405 34.9
Business and government 5,516 20.8 5,742 21.3
$ 26,594 100.0 % $ 26,961 100.0 %
Allowance for credit losses (152) (140)
Total loans by borrower category $ 26,442 $ 26,821 As at March 31, 2012, the Federation’s outstanding loan portfolio, net of the allowance for credit losses, totalled $26.4 billion, down $379 million, or 1.4%, from $26.8 billion at the end of 2011. ¨Loans to member caisses as well as business and government loans were primarily accountable for this decrease, having shrunk by $240 million and $226 million, or 2.6%.and 3.9%, respectively, since December 31, 2011, to total $9.2 billion and $5.5 billion, respectively. The financing granted by the Federation to its member caisses accounts for a large portion of its lending activities. As at March 31, 2012, loans to member caisses represented 34.5% of the Federation’s entire loan portfolio, which was comparable to their level at the end of 2011. Consumer, credit card and other personal loans grew by $100 million, or 1.1%, during the first quarter of 2012, to total $9.5 billion as at March 31, 2012. However, residential mortgages outstanding remained virtually unchanged during the same quarter. They were down only $1 million, or 0.04%, to total $2.4 billion as at the same date.
FEDERATION DES CAISSES DESJARDINS DU QUEBEC INTERIM FINANCIAL STATEMENT
First quarter - March 31, 2012 11
RG FCDQ – SECTION 3 – V4R1
12
Credit quality Information about the quality of the Federation’s credit portfolio is presented under “Risk management”, on pages 15 and 16 of this MD&A.
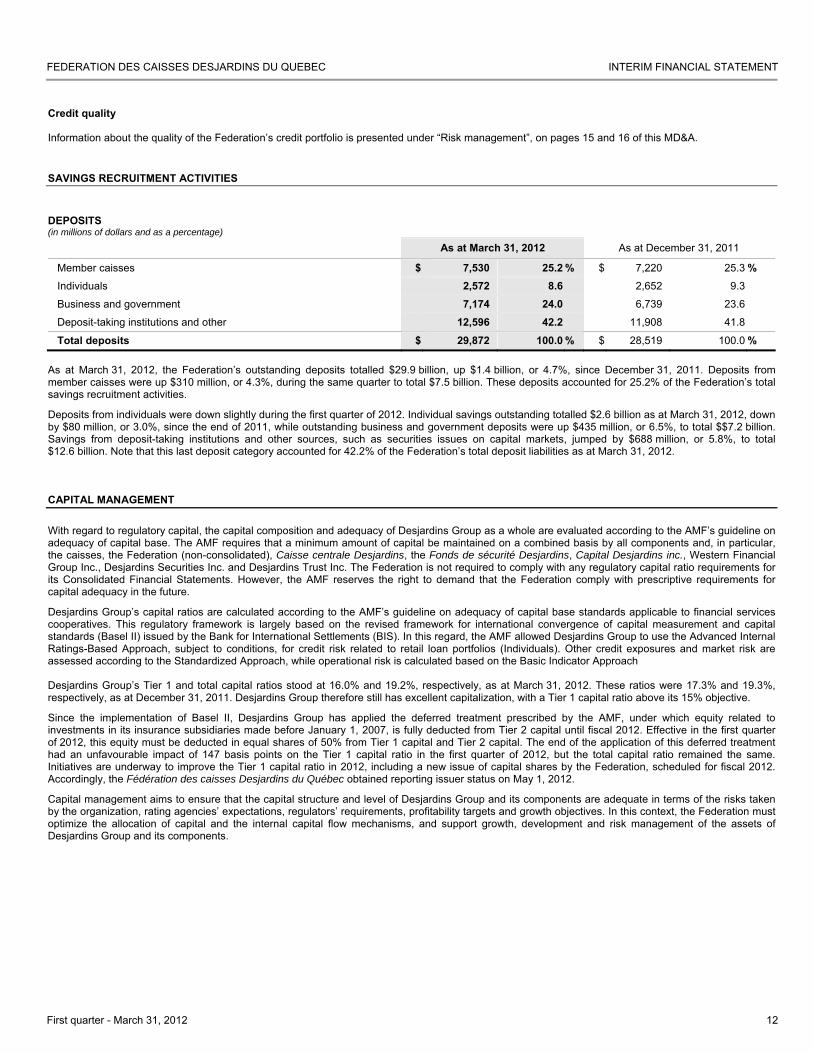
SAVINGS RECRUITMENT ACTIVITIES
DEPOSITS (in millions of dollars and as a percentage)
As at March 31, 2012 As at December 31, 2011
Member caisses $ 7,530 25.2 % $ 7,220 25.3 % Individuals 2,572 8.6 2,652 9.3 Business and government 7,174 24.0 6,739 23.6 Deposit-taking institutions and other 12,596 42.2 11,908 41.8 Total deposits $ 29,872 100.0 % $ 28,519 100.0 %
As at March 31, 2012, the Federation’s outstanding deposits totalled $29.9 billion, up $1.4 billion, or 4.7%, since December 31, 2011. Deposits from member caisses were up $310 million, or 4.3%, during the same quarter to total $7.5 billion. These deposits accounted for 25.2% of the Federation’s total savings recruitment activities.
Deposits from individuals were down slightly during the first quarter of 2012. Individual savings outstanding totalled $2.6 billion as at March 31, 2012, down by $80 million, or 3.0%, since the end of 2011, while outstanding business and government deposits were up $435 million, or 6.5%, to total $$7.2 billion. Savings from deposit-taking institutions and other sources, such as securities issues on capital markets, jumped by $688 million, or 5.8%, to total $12.6 billion. Note that this last deposit category accounted for 42.2% of the Federation’s total deposit liabilities as at March 31, 2012.
CAPITAL MANAGEMENT
With regard to regulatory capital, the capital composition and adequacy of Desjardins Group as a whole are evaluated according to the AMF’s guideline on adequacy of capital base. The AMF requires that a minimum amount of capital be maintained on a combined basis by all components and, in particular, the caisses, the Federation (non-consolidated), Caisse centrale Desjardins, the Fonds de sécurité Desjardins, Capital Desjardins inc., Western Financial Group Inc., Desjardins Securities Inc. and Desjardins Trust Inc. The Federation is not required to comply with any regulatory capital ratio requirements for its Consolidated Financial Statements. However, the AMF reserves the right to demand that the Federation comply with prescriptive requirements for capital adequacy in the future.
Desjardins Group’s capital ratios are calculated according to the AMF’s guideline on adequacy of capital base standards applicable to financial services cooperatives. This regulatory framework is largely based on the revised framework for international convergence of capital measurement and capital standards (Basel II) issued by the Bank for International Settlements (BIS). In this regard, the AMF allowed Desjardins Group to use the Advanced Internal Ratings-Based Approach, subject to conditions, for credit risk related to retail loan portfolios (Individuals). Other credit exposures and market risk are assessed according to the Standardized Approach, while operational risk is calculated based on the Basic Indicator Approach Desjardins Group’s Tier 1 and total capital ratios stood at 16.0% and 19.2%, respectively, as at March 31, 2012. These ratios were 17.3% and 19.3%, respectively, as at December 31, 2011. Desjardins Group therefore still has excellent capitalization, with a Tier 1 capital ratio above its 15% objective.
Since the implementation of Basel II, Desjardins Group has applied the deferred treatment prescribed by the AMF, under which equity related to investments in its insurance subsidiaries made before January 1, 2007, is fully deducted from Tier 2 capital until fiscal 2012. Effective in the first quarter of 2012, this equity must be deducted in equal shares of 50% from Tier 1 capital and Tier 2 capital. The end of the application of this deferred treatment had an unfavourable impact of 147 basis points on the Tier 1 capital ratio in the first quarter of 2012, but the total capital ratio remained the same. Initiatives are underway to improve the Tier 1 capital ratio in 2012, including a new issue of capital shares by the Federation, scheduled for fiscal 2012. Accordingly, the Fédération des caisses Desjardins du Québec obtained reporting issuer status on May 1, 2012.
Capital management aims to ensure that the capital structure and level of Desjardins Group and its components are adequate in terms of the risks taken by the organization, rating agencies’ expectations, regulators’ requirements, profitability targets and growth objectives. In this context, the Federation must optimize the allocation of capital and the internal capital flow mechanisms, and support growth, development and risk management of the assets of Desjardins Group and its components.
FEDERATION DES CAISSES DESJARDINS DU QUEBEC INTERIM FINANCIAL STATEMENT
First quarter - March 31, 2012 12
RG FCDQ – SECTION 3 – V4R1
13
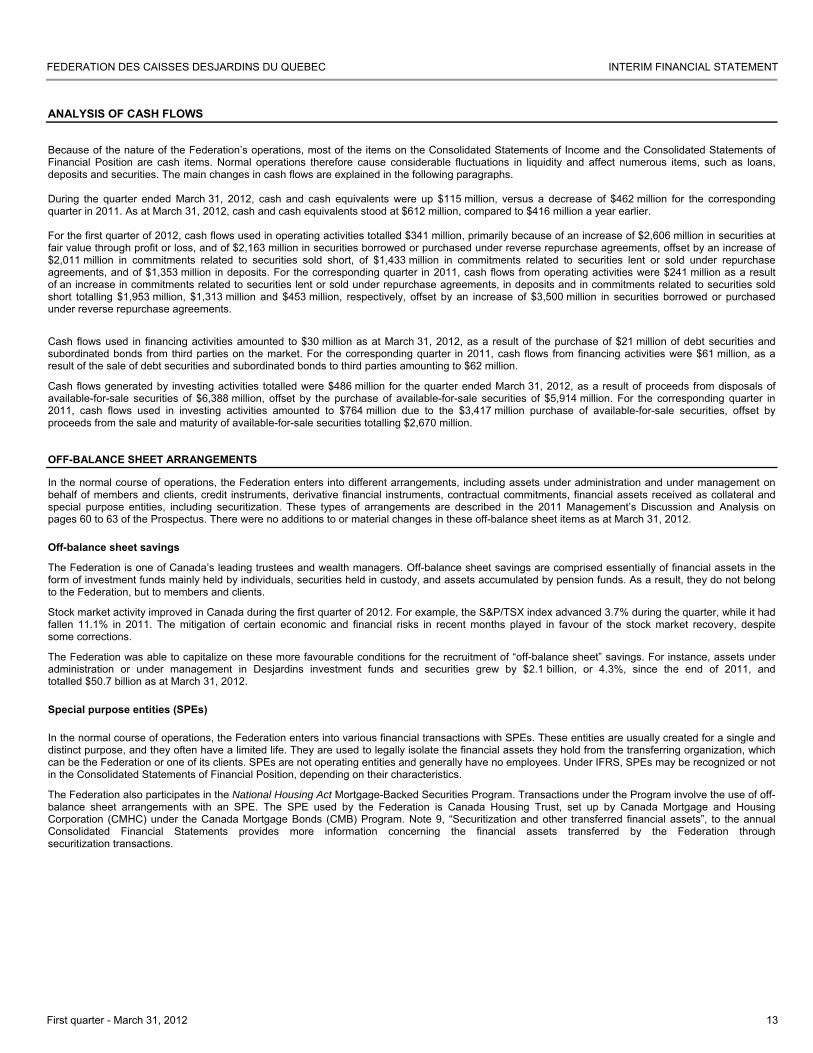
ANALYSIS OF CASH FLOWS
Because of the nature of the Federation’s operations, most of the items on the Consolidated Statements of Income and the Consolidated Statements of Financial Position are cash items. Normal operations therefore cause considerable fluctuations in liquidity and affect numerous items, such as loans, deposits and securities. The main changes in cash flows are explained in the following paragraphs. During the quarter ended March 31, 2012, cash and cash equivalents were up $115 million, versus a decrease of $462 million for the corresponding quarter in 2011. As at March 31, 2012, cash and cash equivalents stood at $612 million, compared to $416 million a year earlier. For the first quarter of 2012, cash flows used in operating activities totalled $341 million, primarily because of an increase of $2,606 million in securities at fair value through profit or loss, and of $2,163 million in securities borrowed or purchased under reverse repurchase agreements, offset by an increase of $2,011 million in commitments related to securities sold short, of $1,433 million in commitments related to securities lent or sold under repurchase agreements, and of $1,353 million in deposits. For the corresponding quarter in 2011, cash flows from operating activities were $241 million as a result of an increase in commitments related to securities lent or sold under repurchase agreements, in deposits and in commitments related to securities sold short totalling $1,953 million, $1,313 million and $453 million, respectively, offset by an increase of $3,500 million in securities borrowed or purchased under reverse repurchase agreements.
Cash flows used in financing activities amounted to $30 million as at March 31, 2012, as a result of the purchase of $21 million of debt securities and subordinated bonds from third parties on the market. For the corresponding quarter in 2011, cash flows from financing activities were $61 million, as a result of the sale of debt securities and subordinated bonds to third parties amounting to $62 million.
Cash flows generated by investing activities totalled were $486 million for the quarter ended March 31, 2012, as a result of proceeds from disposals of available-for-sale securities of $6,388 million, offset by the purchase of available-for-sale securities of $5,914 million. For the corresponding quarter in 2011, cash flows used in investing activities amounted to $764 million due to the $3,417 million purchase of available-for-sale securities, offset by proceeds from the sale and maturity of available-for-sale securities totalling $2,670 million. OFF-BALANCE SHEET ARRANGEMENTS
In the normal course of operations, the Federation enters into different arrangements, including assets under administration and under management on behalf of members and clients, credit instruments, derivative financial instruments, contractual commitments, financial assets received as collateral and special purpose entities, including securitization. These types of arrangements are described in the 2011 Management’s Discussion and Analysis on pages 60 to 63 of the Prospectus. There were no additions to or material changes in these off-balance sheet items as at March 31, 2012.
Off-balance sheet savings
The Federation is one of Canada’s leading trustees and wealth managers. Off-balance sheet savings are comprised essentially of financial assets in the form of investment funds mainly held by individuals, securities held in custody, and assets accumulated by pension funds. As a result, they do not belong to the Federation, but to members and clients.
Stock market activity improved in Canada during the first quarter of 2012. For example, the S&P/TSX index advanced 3.7% during the quarter, while it had fallen 11.1% in 2011. The mitigation of certain economic and financial risks in recent months played in favour of the stock market recovery, despite some corrections.
The Federation was able to capitalize on these more favourable conditions for the recruitment of “off-balance sheet” savings. For instance, assets under administration or under management in Desjardins investment funds and securities grew by $2.1 billion, or 4.3%, since the end of 2011, and totalled $50.7 billion as at March 31, 2012.
Special purpose entities (SPEs)
In the normal course of operations, the Federation enters into various financial transactions with SPEs. These entities are usually created for a single and distinct purpose, and they often have a limited life. They are used to legally isolate the financial assets they hold from the transferring organization, which can be the Federation or one of its clients. SPEs are not operating entities and generally have no employees. Under IFRS, SPEs may be recognized or not in the Consolidated Statements of Financial Position, depending on their characteristics.
The Federation also participates in the National Housing Act Mortgage-Backed Securities Program. Transactions under the Program involve the use of off-balance sheet arrangements with an SPE. The SPE used by the Federation is Canada Housing Trust, set up by Canada Mortgage and Housing Corporation (CMHC) under the Canada Mortgage Bonds (CMB) Program. Note 9, “Securitization and other transferred financial assets”, to the annual Consolidated Financial Statements provides more information concerning the financial assets transferred by the Federation through securitization transactions.
FEDERATION DES CAISSES DESJARDINS DU QUEBEC INTERIM FINANCIAL STATEMENT
First quarter - March 31, 2012 13
RG FCDQ – SECTION 3 – V4R1
14
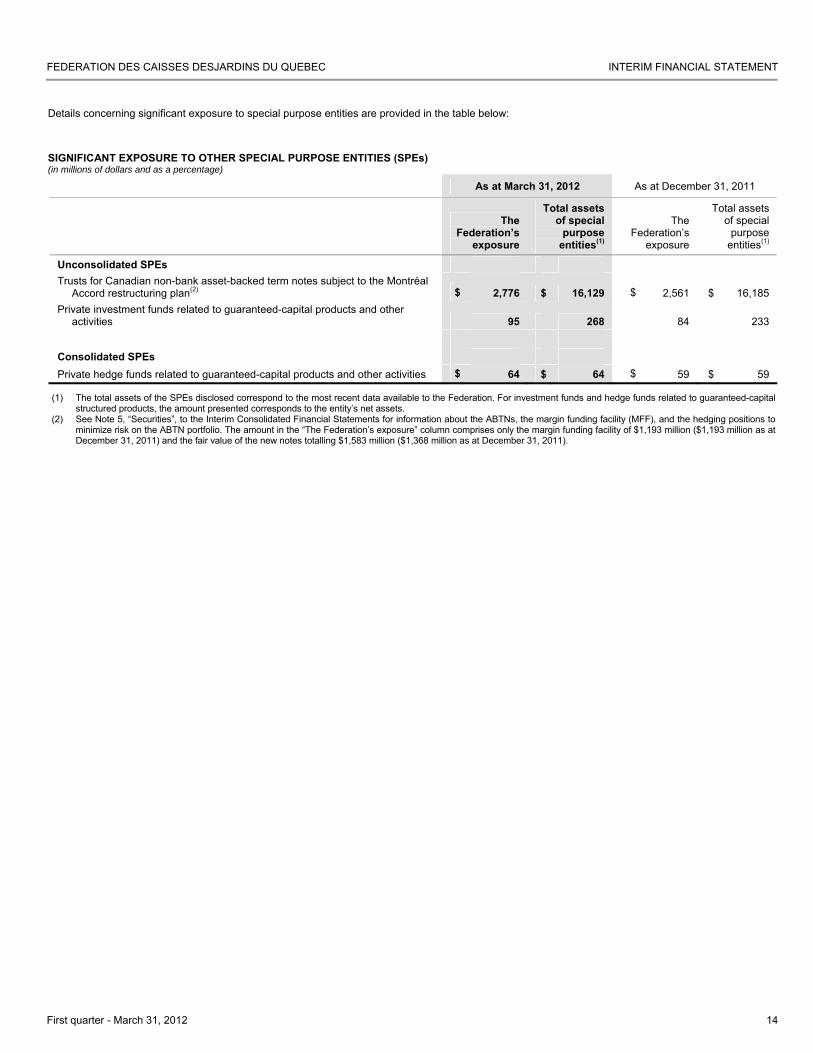
Details concerning significant exposure to special purpose entities are provided in the table below: SIGNIFICANT EXPOSURE TO OTHER SPECIAL PURPOSE ENTITIES (SPEs) (in millions of dollars and as a percentage)
As at March 31, 2012 As at December 31, 2011
The Federation’s
exposure
Total assets of special
purpose entities(1)
The Federation’s
exposure
Total assets of special
purpose entities(1)
Unconsolidated SPEs Trusts for Canadian non-bank asset-backed term notes subject to the Montréal
Accord restructuring plan(2) $ 2,776 $ 16,129 $ 2,561 $ 16,185 Private investment funds related to guaranteed-capital products and other
activities 95 268 84 233 Consolidated SPEs Private hedge funds related to guaranteed-capital products and other activities $ 64 $ 64 $ 59 $ 59
(1) The total assets of the SPEs disclosed correspond to the most recent data available to the Federation. For investment funds and hedge funds related to guaranteed-capital structured products, the amount presented corresponds to the entity’s net assets.
(2) See Note 5, “Securities”, to the Interim Consolidated Financial Statements for information about the ABTNs, the margin funding facility (MFF), and the hedging positions to minimize risk on the ABTN portfolio. The amount in the “The Federation’s exposure” column comprises only the margin funding facility of $1,193 million ($1,193 million as at December 31, 2011) and the fair value of the new notes totalling $1,583 million ($1,368 million as at December 31, 2011).
FEDERATION DES CAISSES DESJARDINS DU QUEBEC INTERIM FINANCIAL STATEMENT
First quarter - March 31, 2012 14
RG FCDQ – SECTION 4 – V4R1
15
RISK MANAGEMENT
RISK MANAGEMENT
The Federation is exposed to different types of risk in the normal course of operations, including credit risk, market risk, liquidity risk, operational risk, insurance risk, strategic risk and reputation risk. Strict and effective management of these risks is a priority for the Federation, its purpose being to support its major orientations, particularly regarding financial stability, compliance with Basel requirements and sustained and profitable growth.
The Federation’s objective in risk management is to optimize the risk-return trade-off, within tolerance limits set for the Federation, by applying integrated risk management and control strategies, policies and procedures to all its activities. It also aims to provide a prudent and appropriate management framework that complies with accepted accountability and independence principles.
In this regard, the Federation has an integrated risk management framework. The purpose of the framework is to provide the organization with reasonable assurance with respect to the understanding and management of the full spectrum of major risks to which the Federation is exposed.
During the first three months of 2012, the Federation’s risk management policies and practices did not change from those stated in the 2011 Management’s Discussion and Analysis on pages 68 to 87 of the Prospectus.
In March 2012, with a view to continuous improvement and realizing the Federation’s full potential, some adjustments were made to its structure. The Risk Management Corporate Division has become the Risk Management Executive Division, and reports to the Desjardins Group Corporate Executive Division.
The Federation’s risk management approach is based on principles promoting the accountability of business segments and entities with respect to consolidated results and risk management quality as well as the leading role played by the Board of Directors of all the subsidiaries in risk and result monitoring. A number of committees support the Board of Directors and management of each subsidiary in discharging their risk management responsibilities.
CREDIT RISK
Credit risk is the risk of losses resulting from a borrower’s or counterparty’s failure to honour its contractual obligations, whether or not such obligations appear on the Consolidated Statements of Financial Position.
The Federation is exposed to credit risk first through its direct loans to member caisses and its direct personal, business and government loans. It is also exposed through its various other commitments, including letters of credit, foreign exchange lines and transactions involving derivative financial instruments and securities.
Counterparty and issuer risk
A large proportion of the securities in all the securities portfolios held by the Federation are issued or guaranteed by public or parapublic entities. The portfolios are concentrated with Canadian issuers and counterparties having a credit rating of A- or higher.
The Risk Management Executive Division sets the maximum exposure for each counterparty and issuer based on quantitative and qualitative criteria. The amounts are then allocated to the various components based on their needs and their risk appetite and tolerance levels.
Exposure to sovereign borrowers
The Federation is not directly exposed to the sovereign debt of the European countries most affected by the recent financial upheaval, namely Greece, Portugal, Italy, Ireland and Spain. Its exposure to U.S. and European financial institutions is marginal.
Quality of loan portfolio
As at March 31, 2012, gross impaired loans outstanding were $101 million, up $12 million from December 31, 2011. The gross impaired loans ratio, as a percentage of the total gross loan portfolio, was 0.38% at the end of the first quarter, up slightly over the ratio of 0.33% as at December 31, 2011, but is still one of the best in the Canadian banking industry.
Individual allowances for credit losses totalled $16 million, resulting in a total coverage ratio of 15.8% as at March 31, 2012, down 4.4 basis points from the ratio as at December 31, 2011. The collective allowance amounted to $136 million as at March 31, 2012, up from $122 million as at December 31, 2011. An allowance for off-balance sheet exposures of $66 million as at March 31, 2012, compared to $63 million as at year-end 2011, was recognized under “Other liabilities – Other” in the Consolidated Statements of Financial Position.
FEDERATION DES CAISSES DESJARDINS DU QUEBEC INTERIM FINANCIAL STATEMENT
First quarter - March 31, 2012 15
RG FCDQ – SECTION 4 – V4R1
16
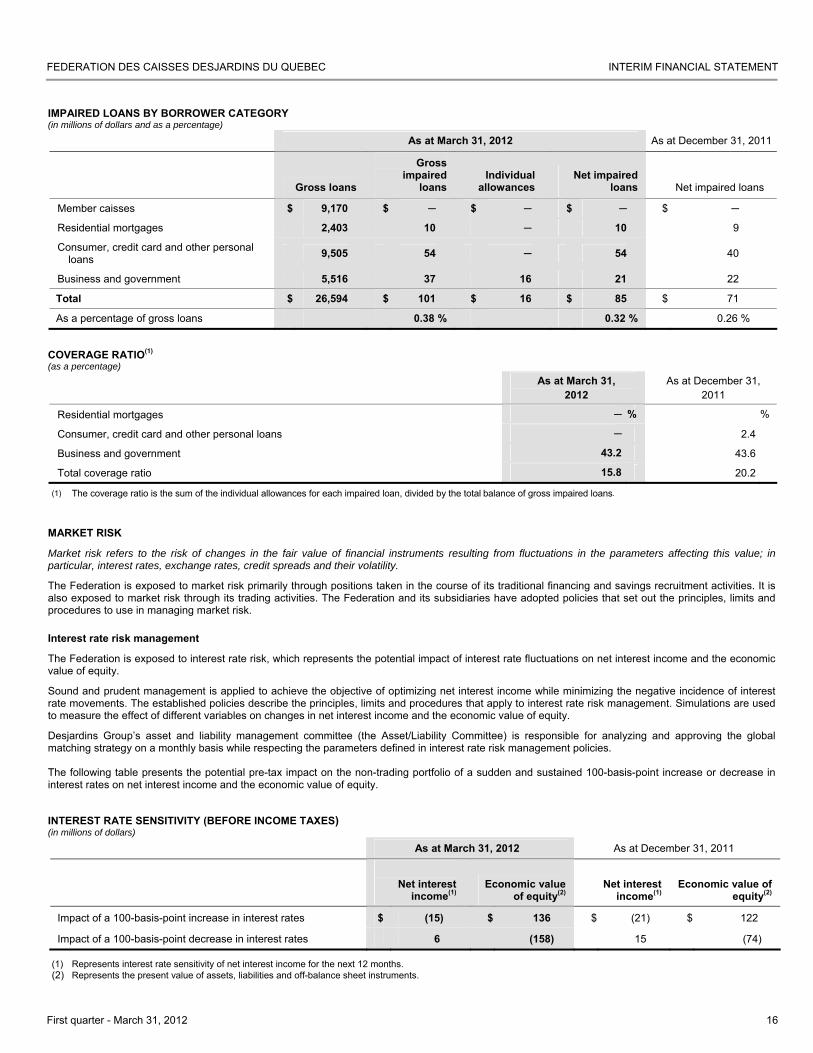
IMPAIRED LOANS BY BORROWER CATEGORY (in millions of dollars and as a percentage)
As at March 31, 2012 As at December 31, 2011
Gross loans
Gross impaired
loans Individual
allowances Net impaired
loans Net impaired loans
Member caisses $ 9,170 $ ─ $ ─ $ ─ $ ─
Residential mortgages 2,403 10 ─ 10 9
Consumer, credit card and other personal loans 9,505 54 ─ 54 40
Business and government 5,516 37 16 21 22
Total $ 26,594 $ 101 $ 16 $ 85 $ 71
As a percentage of gross loans 0.38 % 0.32 % 0.26 %
COVERAGE RATIO(1)
(as a percentage)
As at March 31,
2012 As at December 31,
2011
Residential mortgages ─ % %
Consumer, credit card and other personal loans ─ 2.4
Business and government 43.2 43.6
Total coverage ratio 15.8 20.2
(1) The coverage ratio is the sum of the individual allowances for each impaired loan, divided by the total balance of gross impaired loans.
MARKET RISK
Market risk refers to the risk of changes in the fair value of financial instruments resulting from fluctuations in the parameters affecting this value; in particular, interest rates, exchange rates, credit spreads and their volatility.
The Federation is exposed to market risk primarily through positions taken in the course of its traditional financing and savings recruitment activities. It is also exposed to market risk through its trading activities. The Federation and its subsidiaries have adopted policies that set out the principles, limits and procedures to use in managing market risk.
Interest rate risk management
The Federation is exposed to interest rate risk, which represents the potential impact of interest rate fluctuations on net interest income and the economic value of equity.
Sound and prudent management is applied to achieve the objective of optimizing net interest income while minimizing the negative incidence of interest rate movements. The established policies describe the principles, limits and procedures that apply to interest rate risk management. Simulations are used to measure the effect of different variables on changes in net interest income and the economic value of equity.
Desjardins Group’s asset and liability management committee (the Asset/Liability Committee) is responsible for analyzing and approving the global matching strategy on a monthly basis while respecting the parameters defined in interest rate risk management policies. The following table presents the potential pre-tax impact on the non-trading portfolio of a sudden and sustained 100-basis-point increase or decrease in interest rates on net interest income and the economic value of equity.
INTEREST RATE SENSITIVITY (BEFORE INCOME TAXES) (in millions of dollars)
As at March 31, 2012 As at December 31, 2011
Net interest
income(1) Economic value
of equity(2) Net interest
income(1) Economic value of
equity(2)
Impact of a 100-basis-point increase in interest rates $ (15) $ 136 $ (21) $ 122
Impact of a 100-basis-point decrease in interest rates 6 (158) 15 (74)
(1) Represents interest rate sensitivity of net interest income for the next 12 months. (2) Represents the present value of assets, liabilities and off-balance sheet instruments.
FEDERATION DES CAISSES DESJARDINS DU QUEBEC INTERIM FINANCIAL STATEMENT
First quarter - March 31, 2012 16
RG FCDQ – SECTION 4 – V4R1
17
Interest rate sensitivity is based on the earlier of the repricing or maturity date of the assets, liabilities and derivative financial instruments used to manage interest rate risk. The situation presented reflects the position on that date only and can change significantly in subsequent quarters depending on the preferences of members and clients, and the application of policies on interest rate risk management.
Some items in the Consolidated Statements of Financial Position are considered non interest rate-sensitive instruments, such as investments in equities, non-performing loans, non-interest-bearing deposits, non-maturity deposits with an interest rate not indexed according to a specific rate such as the prime rate, and equity. As required in our policies, our management practices are based on conservative assumptions regarding the maturity profile used in our models in order to determine the interest rate sensitivity of products.
Management of market risk related to trading activities – Value at risk
The management of market risk on trading portfolios is handled on a daily basis and outlined in a specific policy. The main tool used to measure the market risk of trading portfolios is “Value-at-Risk” (VaR), which represents an estimate of the potential loss for a certain period of time at a given confidence level.
A Monte Carlo VaR is calculated daily, using a 99.0% confidence level, on the trading portfolios for a holding horizon of one day. It is therefore reasonable to expect a loss exceeding the VaR figure once every 100 days. The calculation of VaR is based on historical data for a one-year interval.
The following table presents the aggregate VaR of the trading activities by risk category as well as the diversification effect, which represents the difference between aggregate VaR and the sum of the VaR for different risk categories. Equity, interest rate and foreign exchange risks are the three risk categories. The definition of a trading portfolio meets the criteria defined in the Basel Capital Accord.
VaR BY RISK CATEGORY (TRADING PORTFOLIO) (in millions of dollars)
As at
March 31, 2012
For the quarter ended March 31, 2012
As at December 31,
2011
For the quarter ended December 31, 2011
Average High Low Average High Low
Equities $ 0.3 $ 0.3 $ 0.5 $ 0.2 $ 0.4 $ 0.4 $ 1.1 $ 0.2
Foreign exchange 0.1 0.1 0.2 ─ 0.1 0.1 0.6 __
Interest rate 3.6 3.9 7.9 2.3 3.5 4.0 6.7 2.2
Diversification effect(1) (0.3) (0.4) N/A(2) N/A(2) (0.3) (0.5) N/A(2) N/A(2)
Aggregate VaR $ 3.7 $ 3.9 $ 7.8 $ 2.4 $ 3.7 $ 4.0 $ 6.6 $ 2.2
(1) Risk reduction related to diversification, namely the difference between the sum of the VaR for the various market risks and the aggregate VaR. (2) Not applicable: The highs and lows of the various market risk categories can refer to different dates.
As at March 31, 2012, the aggregate VaR was $3.7 million, the interest rate VaR being the largest component. This aggregate VaR was lower than its quarterly average of $3.9 million. Risk mitigation related to diversification amounted to $0.3 million as at March 31, 2012.
Back testing
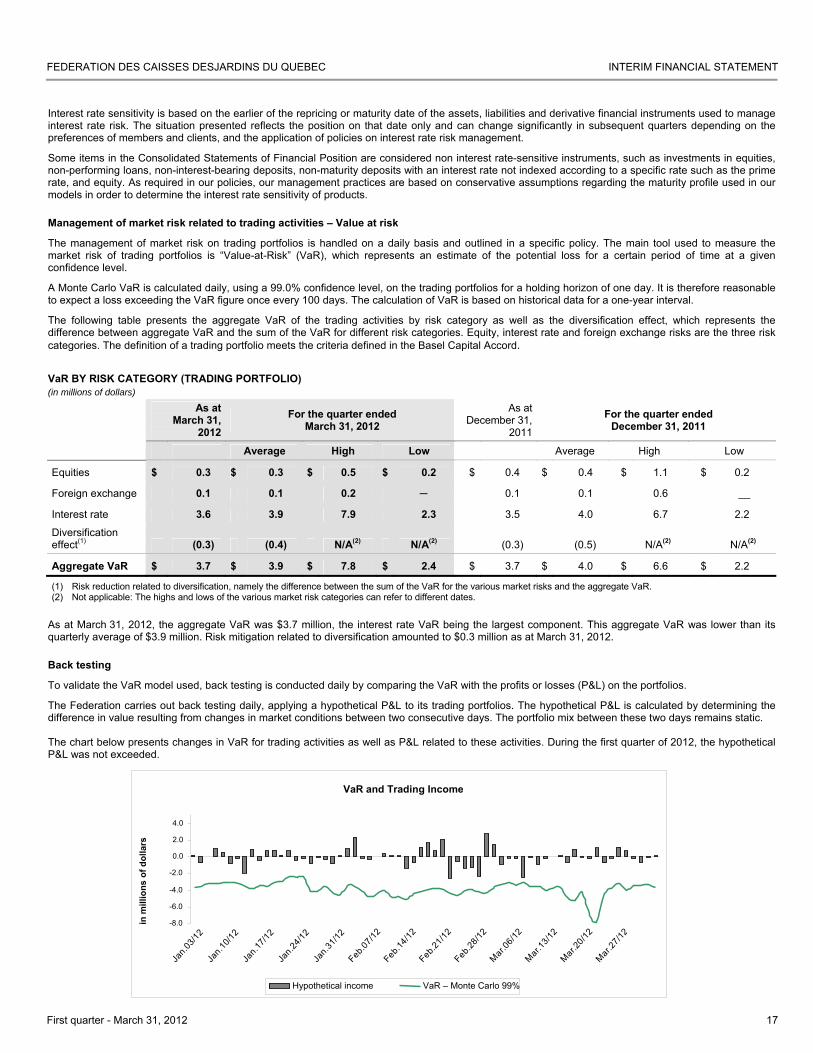
To validate the VaR model used, back testing is conducted daily by comparing the VaR with the profits or losses (P&L) on the portfolios.
The Federation carries out back testing daily, applying a hypothetical P&L to its trading portfolios. The hypothetical P&L is calculated by determining the difference in value resulting from changes in market conditions between two consecutive days. The portfolio mix between these two days remains static. The chart below presents changes in VaR for trading activities as well as P&L related to these activities. During the first quarter of 2012, the hypothetical P&L was not exceeded.
VaR and Trading Income
-8.0 -6.0 -4.0 -2.0 0.0 2.0 4.0
in m
illio
ns o
f dol
lars
Hypothetical income VaR – Monte Carlo 99%
Jan.0
3/12
Jan.1
0/12
Jan.1
7/12
Jan.2
4/12
Jan.3
1/12
Feb.07
/12Feb
.14/12
Feb.21
/12Feb
.28/12
Mar.06
/12Mar
.13/12
Mar.20
/12Mar
.27/12
FEDERATION DES CAISSES DESJARDINS DU QUEBEC INTERIM FINANCIAL STATEMENT
First quarter - March 31, 2012 17
RG FCDQ – SECTION 4 – V4R1
18
LIQUIDITY RISK
Liquidity risk refers to the Federation’s capacity to raise the necessary funds (by increasing liabilities or converting assets) to meet a financial obligation, whether or not it appears on the Consolidated Statements of Financial Position.
Managing liquidity risk involves maintaining a sufficient level of liquid securities, ensuring stable and diversified sources of funding, monitoring indicators and adopting a contingency plan to implement in the event of a liquidity crisis. The Federation and its subsidiaries have established policies describing the principles, limits, risk appetite and tolerance levels as well as the procedures that apply to liquidity risk management.
Policies and standards are reviewed on a regular basis to ensure that they are appropriate for the operating environment and prevailing market conditions. They are also updated according to regulatory requirements and sound liquidity risk management practices. Sources of financing
Core funding, which includes capital, long-term liabilities and a diversified deposit portfolio, is the foundation upon which the Federation’s liquidity position depends. As at March 31, 2012, the Federation’s deposits outstanding totalled $29.9 billion, an increase of $1.4 billion, or 4.7%, since December 31, 2011. This growth was primarily the result of deposits from business, government, deposit-taking institutions and other sources. Aggregate deposits represented 35.1% of the Federation’s total liabilities as at March 31, 2012.
In order to maintain stable and diversified funding, the Federation diversifies its sources of financing from institutional capital markets. The Federation also raises financing on institutional capital markets through Capital Desjardins inc. for subordinated bonds, and through Caisse centrale Desjardins for money market instruments, commercial paper, medium-term deposit notes, covered bonds and securitization of the caisse network’s mortgage loans. In keeping with its extension strategy for institutional funding and its mission as Desjardins Group’s treasurer, Caisse centrale Desjardins issued debt securities in the first quarter of 2012 on the U.S. market, namely US$1.5 billion of covered bonds. Desjardins Group’s presence on the U.S. market helps expand its pool of institutional investors.
Caisse centrale Desjardins also took part in the federally guaranteed mortgage loan securitization market through the Canada Mortgage Bonds Program. Caisse centrale Desjardins has been active in this area and its participation in new issues during the first quarter of 2012 totalled $357 million. The main objective of the program is to obtain a source of long-term financing at the lowest price on the market.
These issuances as a whole made it possible to adequately meet the liquidity needs of the Desjardins network, to better diversify the Federation’s sources of financing and to further extend their average term.
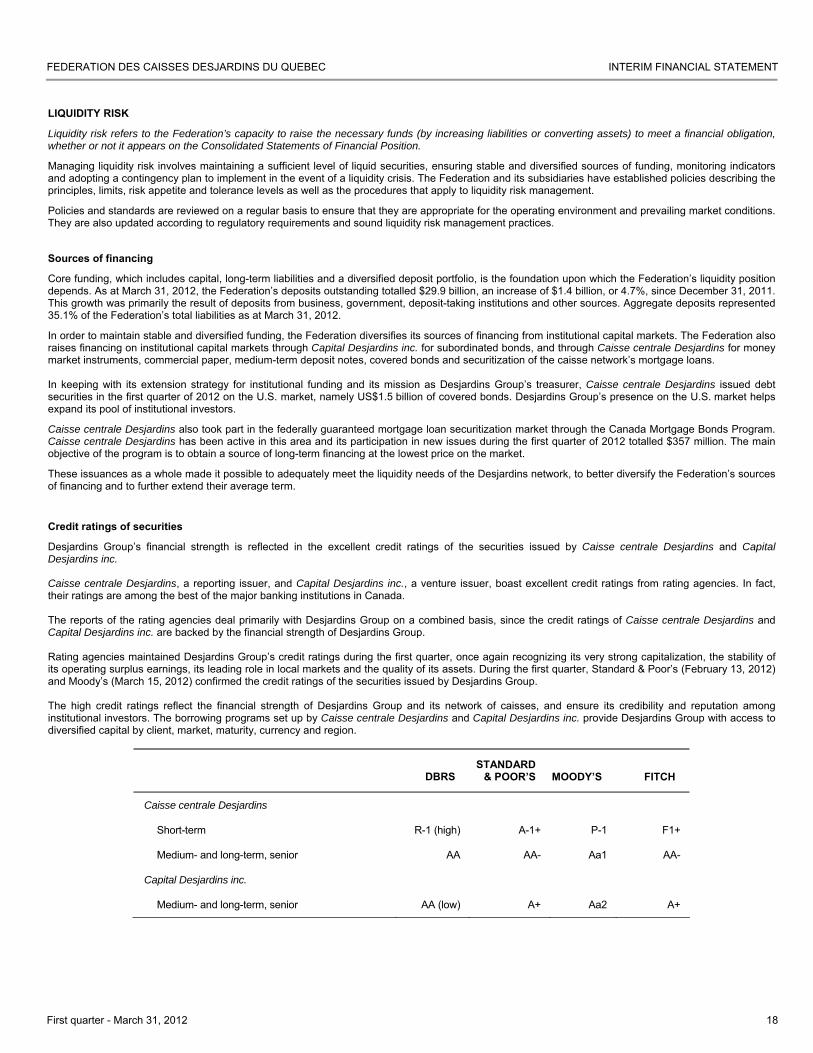
Credit ratings of securities
Desjardins Group’s financial strength is reflected in the excellent credit ratings of the securities issued by Caisse centrale Desjardins and Capital Desjardins inc. Caisse centrale Desjardins, a reporting issuer, and Capital Desjardins inc., a venture issuer, boast excellent credit ratings from rating agencies. In fact, their ratings are among the best of the major banking institutions in Canada. The reports of the rating agencies deal primarily with Desjardins Group on a combined basis, since the credit ratings of Caisse centrale Desjardins and Capital Desjardins inc. are backed by the financial strength of Desjardins Group. Rating agencies maintained Desjardins Group’s credit ratings during the first quarter, once again recognizing its very strong capitalization, the stability of its operating surplus earnings, its leading role in local markets and the quality of its assets. During the first quarter, Standard & Poor’s (February 13, 2012) and Moody’s (March 15, 2012) confirmed the credit ratings of the securities issued by Desjardins Group. The high credit ratings reflect the financial strength of Desjardins Group and its network of caisses, and ensure its credibility and reputation among institutional investors. The borrowing programs set up by Caisse centrale Desjardins and Capital Desjardins inc. provide Desjardins Group with access to diversified capital by client, market, maturity, currency and region.
DBRS
STANDARD & POOR’S
MOODY’S
FITCH
Caisse centrale Desjardins
Short-term R-1 (high) A-1+ P-1 F1+
Medium- and long-term, senior AA AA- Aa1 AA-
Capital Desjardins inc.
Medium- and long-term, senior AA (low) A+ Aa2 A+
FEDERATION DES CAISSES DESJARDINS DU QUEBEC INTERIM FINANCIAL STATEMENT
First quarter - March 31, 2012 18
RG FCDQ – SECTION 4 – V4R1
19
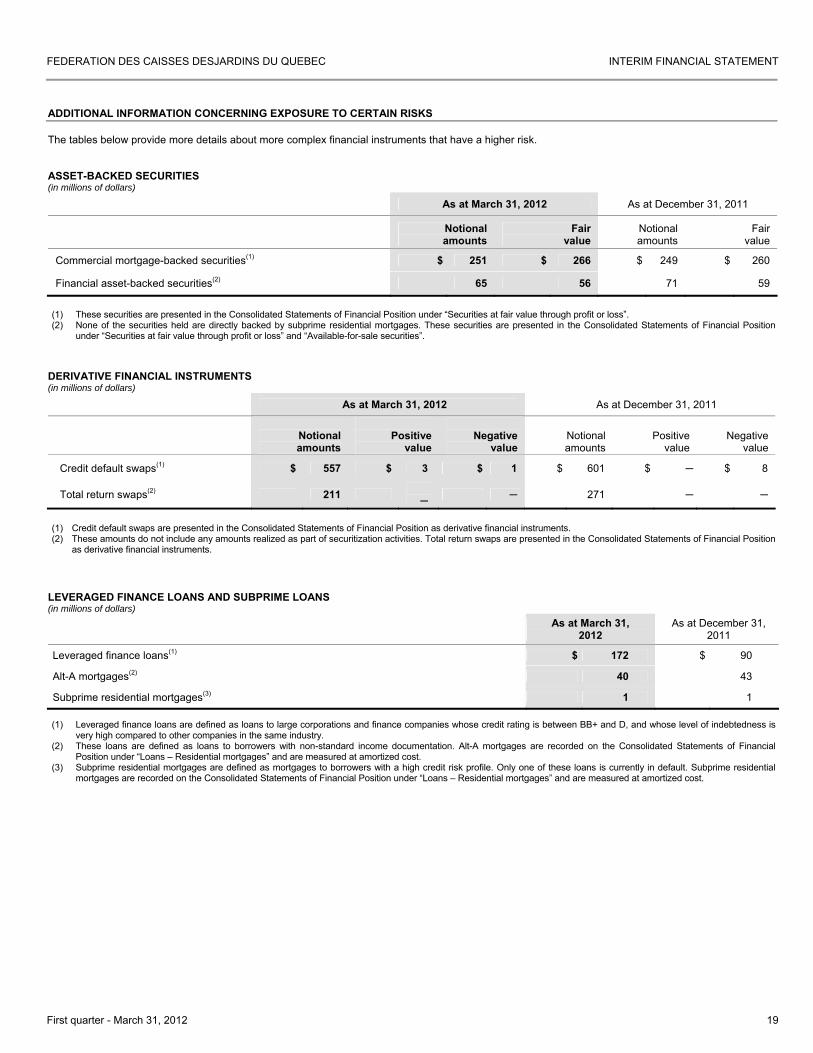
ADDITIONAL INFORMATION CONCERNING EXPOSURE TO CERTAIN RISKS The tables below provide more details about more complex financial instruments that have a higher risk.
ASSET-BACKED SECURITIES (in millions of dollars)
As at March 31, 2012 As at December 31, 2011
Notional amounts
Fair value
Notional amounts
Fair value
Commercial mortgage-backed securities(1) $ 251 $ 266 $ 249 $ 260
Financial asset-backed securities(2) 65 56 71 59
(1) These securities are presented in the Consolidated Statements of Financial Position under “Securities at fair value through profit or loss”. (2) None of the securities held are directly backed by subprime residential mortgages. These securities are presented in the Consolidated Statements of Financial Position
under “Securities at fair value through profit or loss” and “Available-for-sale securities”.
DERIVATIVE FINANCIAL INSTRUMENTS (in millions of dollars)
As at March 31, 2012 As at December 31, 2011
Notional amounts
Positive
value
Negative
value Notional amounts
Positive
value
Negative
value
Credit default swaps(1) $ 557 $ 3 $ 1 $ 601 $ ─ $ 8
Total return swaps(2) 211 ─ ─ 271 ─ ─
(1) Credit default swaps are presented in the Consolidated Statements of Financial Position as derivative financial instruments. (2) These amounts do not include any amounts realized as part of securitization activities. Total return swaps are presented in the Consolidated Statements of Financial Position
as derivative financial instruments.
LEVERAGED FINANCE LOANS AND SUBPRIME LOANS (in millions of dollars)
As at March 31, 2012
As at December 31, 2011
Leveraged finance loans(1) $ 172 $ 90
Alt-A mortgages(2) 40 43
Subprime residential mortgages(3) 1 1 (1) Leveraged finance loans are defined as loans to large corporations and finance companies whose credit rating is between BB+ and D, and whose level of indebtedness is
very high compared to other companies in the same industry. (2) These loans are defined as loans to borrowers with non-standard income documentation. Alt-A mortgages are recorded on the Consolidated Statements of Financial
Position under “Loans – Residential mortgages” and are measured at amortized cost. (3) Subprime residential mortgages are defined as mortgages to borrowers with a high credit risk profile. Only one of these loans is currently in default. Subprime residential
mortgages are recorded on the Consolidated Statements of Financial Position under “Loans – Residential mortgages” and are measured at amortized cost.
FEDERATION DES CAISSES DESJARDINS DU QUEBEC INTERIM FINANCIAL STATEMENT
First quarter - March 31, 2012 19
RG FCDQ – SECTION 5 – V4R1
23
ADDITIONAL INFORMATION
FRAMEWORK
During the interim period ended March 31, 2012, the Federation did not make any changes to its financial reporting framework that materially affected, or are likely to materially affect, its activities. The parties involved in this framework and their responsibilities are described on page 89 of the 2011 Management’s Discussion and Analysis presented in the Prospectus.
RELATED PARTY DISCLOSURES In the normal course of business, the Federation offers financial services, enters into agreements for operating services and pays key management personnel compensation. Such related party transactions, including transactions with other Desjardins entities, are explained in Note 32, “Related party disclosures”, to the Federation’s annual Consolidated Financial Statements, on pages F-165 and F-166 of the Prospectus.
CRITICAL ACCOUNTING POLICIES AND ESTIMATES
The Federation’s unaudited Condensed Interim Consolidated Financial Statements were prepared in accordance with International Financial Reporting Standards (IFRS), which constitute Canadian generally accepted accounting principles (GAAP). The significant accounting policies are described in Note 2, “Significant accounting policies”, to the Federation’s Consolidated Financial Statements, on pages F-82 to F-99 of the Prospectus. Some of these policies are of particular importance in presenting the Federation’s financial position and results of operations since they require management to make assumptions and estimates that may involve uncertainties and since any change to these assumptions and estimates could have a significant impact on the Federation’s Interim Consolidated Financial Statements. Pages 90 to 94 of the 2011 Management’s Discussion and Analysis included in the Prospectus provide explanations for such accounting policies. No material change was made to these accounting policies, estimates and assumptions during the first three months of 2012. FUTURE ACCOUNTING CHANGES
Future accounting changes are described in Note 3, “Future accounting changes”, to the Federation’s annual Consolidated Financial Statements on pages F-100 and F-101 of the Prospectus. No new accounting standard was issued by the IASB during the first three months of 2012.
FEDERATION DES CAISSES DESJARDINS DU QUEBEC INTERIM FINANCIAL STATEMENT
First quarter - March 31, 2012 20
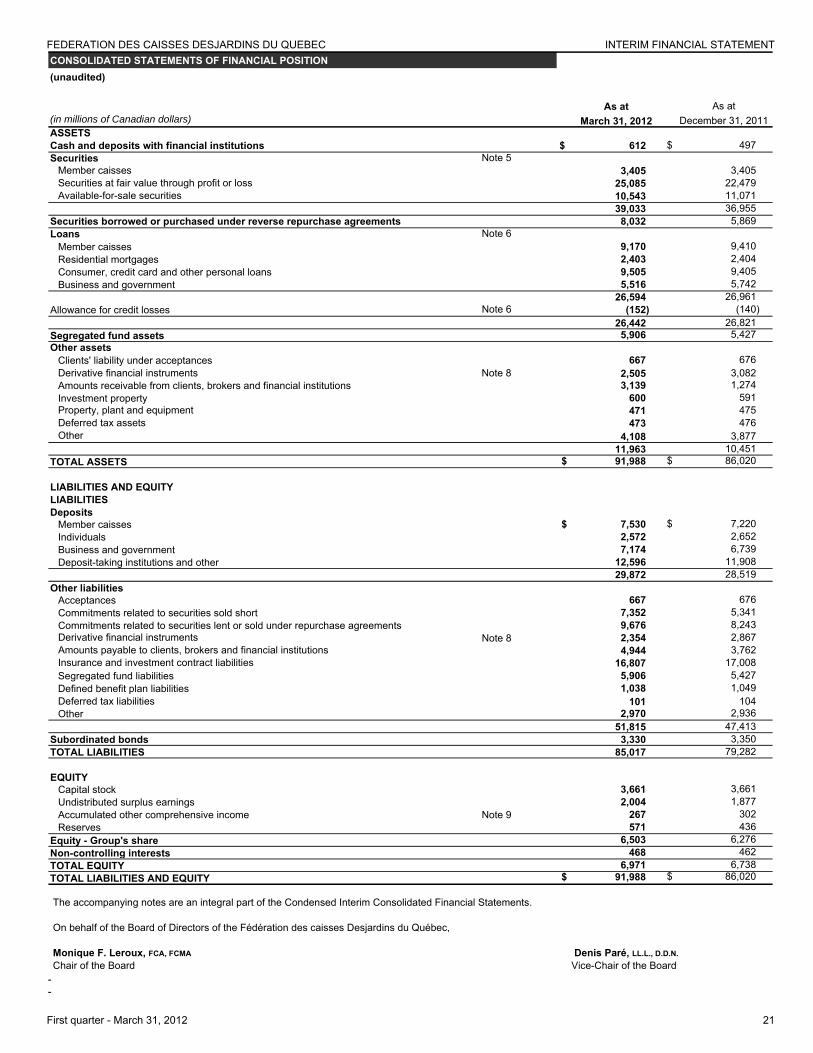
07.05.2012
Fédération des caisses Desjardins du Québec 2
- -
CONSOLIDATED STATEMENTS OF FINANCIAL POSITION(unaudited)
As at As at(in millions of Canadian dollars) March 31, 2012 December 31, 2011ASSETSCash and deposits with financial institutions $ 612 $ 497 Securities Note 5
Member caisses 3,405 3,405 Securities at fair value through profit or loss 25,085 22,479 Available-for-sale securities 10,543 11,071
39,033 36,955 Securities borrowed or purchased under reverse repurchase agreements 8,032 5,869 Loans Note 6
Member caisses 9,170 9,410 Residential mortgages 2,403 2,404 Consumer, credit card and other personal loans 9,505 9,405 Business and government 5,516 5,742
26,594 26,961 Allowance for credit losses Note 6 (152) (140)
26,442 26,821 Segregated fund assets 5,906 5,427 Other assets
Clients' liability under acceptances 667 676 Derivative financial instruments Note 8 2,505 3,082 Amounts receivable from clients, brokers and financial institutions 3,139 1,274 Investment property 600 591 Property, plant and equipment 471 475 Deferred tax assets 473 476 Other 4,108 3,877
11,963 10,451 TOTAL ASSETS $ 91,988 $ 86,020
LIABILITIES AND EQUITYLIABILITIESDeposits
Member caisses $ 7,530 $ 7,220 Individuals 2,572 2,652 Business and government 7,174 6,739 Deposit-taking institutions and other 12,596 11,908
29,872 28,519 Other liabilities
Acceptances 667 676 Commitments related to securities sold short 7,352 5,341 Commitments related to securities lent or sold under repurchase agreements 9,676 8,243 Derivative financial instruments Note 8 2,354 2,867 Amounts payable to clients, brokers and financial institutions 4,944 3,762 Insurance and investment contract liabilities 16,807 17,008 Segregated fund liabilities 5,906 5,427 Defined benefit plan liabilities 1,038 1,049 Deferred tax liabilities 101 104 Other 2,970 2,936
51,815 47,413 Subordinated bonds 3,330 3,350 TOTAL LIABILITIES 85,017 79,282
EQUITYCapital stock 3,661 3,661 Undistributed surplus earnings 2,004 1,877 Accumulated other comprehensive income Note 9 267 302 Reserves 571 436
Equity - Group's share 6,503 6,276 Non-controlling interests 468 462 TOTAL EQUITY 6,971 6,738 TOTAL LIABILITIES AND EQUITY $ 91,988 $ 86,020
The accompanying notes are an integral part of the Condensed Interim Consolidated Financial Statements.
On behalf of the Board of Directors of the Fédération des caisses Desjardins du Québec,
Monique F. Leroux, FCA, FCMA Denis Paré, LL.L., D.D.N.Chair of the Board Vice-Chair of the Board
FEDERATION DES CAISSES DESJARDINS DU QUEBEC INTERIM FINANCIAL STATEMENT
First quarter - March 31, 2012 21
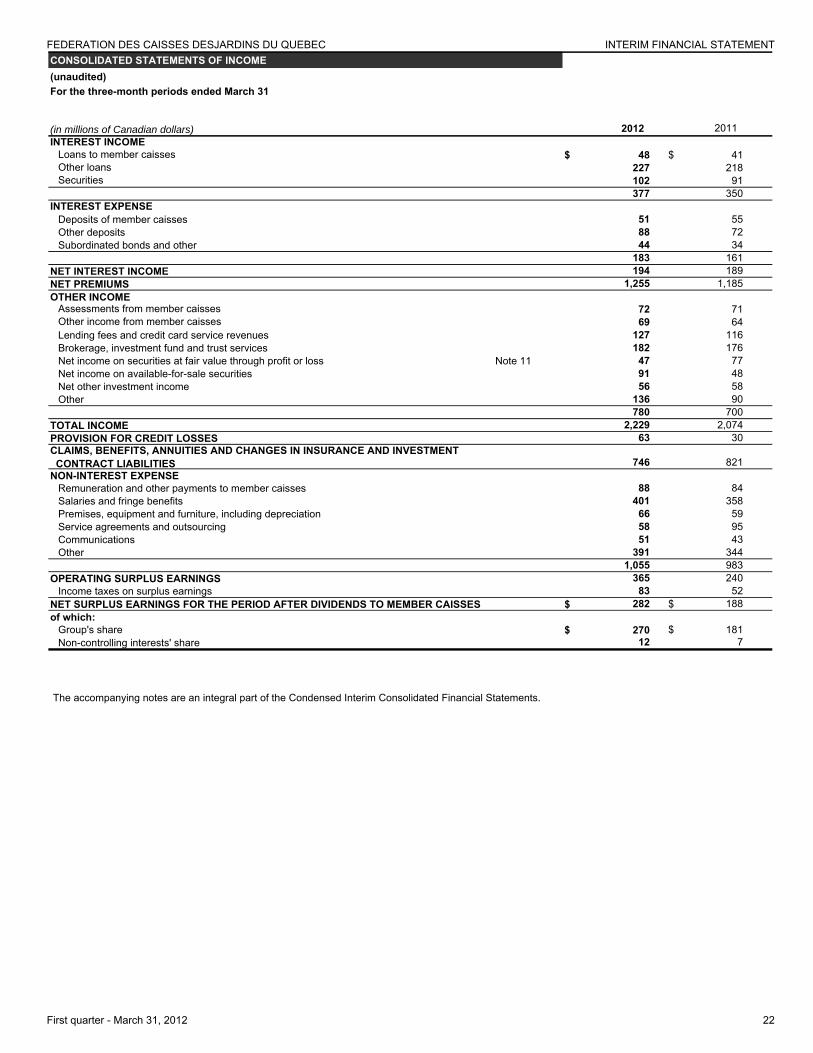
07.05.2012
Fédération des caisses Desjardins du Québec 3
CONSOLIDATED STATEMENTS OF INCOME(unaudited)For the three-month periods ended March 31
(in millions of Canadian dollars)INTEREST INCOME
Loans to member caisses $ 48 $ 41 Other loans 227 218 Securities 102 91
377 350 INTEREST EXPENSE
Deposits of member caisses 51 55 Other deposits 88 72 Subordinated bonds and other 44 34
183 161 NET INTEREST INCOME 194 189 NET PREMIUMS 1,255 1,185 OTHER INCOME
Assessments from member caisses 72 71 Other income from member caisses 69 64 Lending fees and credit card service revenues 127 116 Brokerage, investment fund and trust services 182 176 Net income on securities at fair value through profit or loss Note 11 47 77 Net income on available-for-sale securities 91 48 Net other investment income 56 58 Other 136 90
780 700 TOTAL INCOME 2,229 2,074 PROVISION FOR CREDIT LOSSES 63 30 CLAIMS, BENEFITS, ANNUITIES AND CHANGES IN INSURANCE AND INVESTMENT CONTRACT LIABILITIES 746 821 NON-INTEREST EXPENSE
Remuneration and other payments to member caisses 88 84 Salaries and fringe benefits 401 358 Premises, equipment and furniture, including depreciation 66 59 Service agreements and outsourcing 58 95 Communications 51 43 Other 391 344
1,055 983 OPERATING SURPLUS EARNINGS 365 240
Income taxes on surplus earnings 83 52 NET SURPLUS EARNINGS FOR THE PERIOD AFTER DIVIDENDS TO MEMBER CAISSES $ 282 $ 188 of which:
Group's share $ 270 $ 181 Non-controlling interests' share 12 7
The accompanying notes are an integral part of the Condensed Interim Consolidated Financial Statements.
20112012
FEDERATION DES CAISSES DESJARDINS DU QUEBEC INTERIM FINANCIAL STATEMENT
First quarter - March 31, 2012 22
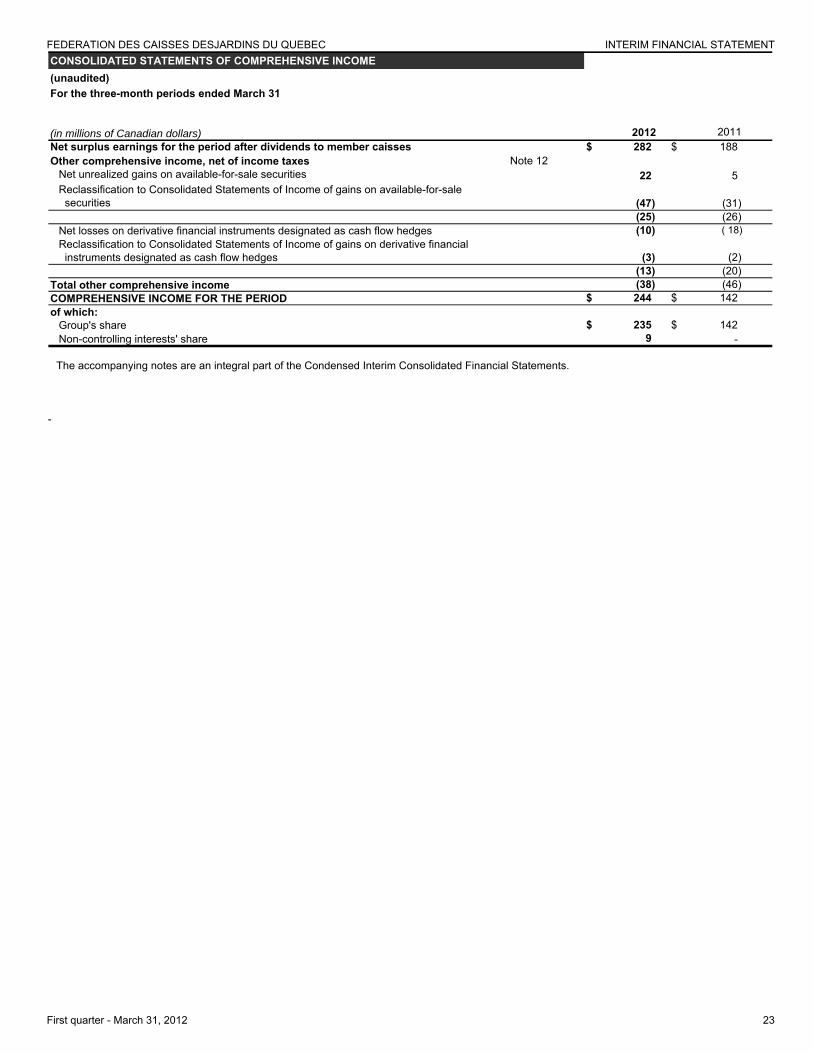
07.05.2012
Fédération des caisses Desjardins du Québec 4
-
CONSOLIDATED STATEMENTS OF COMPREHENSIVE INCOME(unaudited)For the three-month periods ended March 31
(in millions of Canadian dollars)Net surplus earnings for the period after dividends to member caisses $ 282 $ 188 Other comprehensive income, net of income taxes Note 12
Net unrealized gains on available-for-sale securities 22 5 Reclassification to Consolidated Statements of Income of gains on available-for-sale securities (47) (31)
(25) (26) Net losses on derivative financial instruments designated as cash flow hedges (10) ( 18) Reclassification to Consolidated Statements of Income of gains on derivative financial instruments designated as cash flow hedges (3) (2)
(13) (20) Total other comprehensive income (38) (46) COMPREHENSIVE INCOME FOR THE PERIOD $ 244 $ 142 of which:
Group's share $ 235 $ 142 Non-controlling interests' share 9 -
The accompanying notes are an integral part of the Condensed Interim Consolidated Financial Statements.
20112012
FEDERATION DES CAISSES DESJARDINS DU QUEBEC INTERIM FINANCIAL STATEMENT
First quarter - March 31, 2012 23
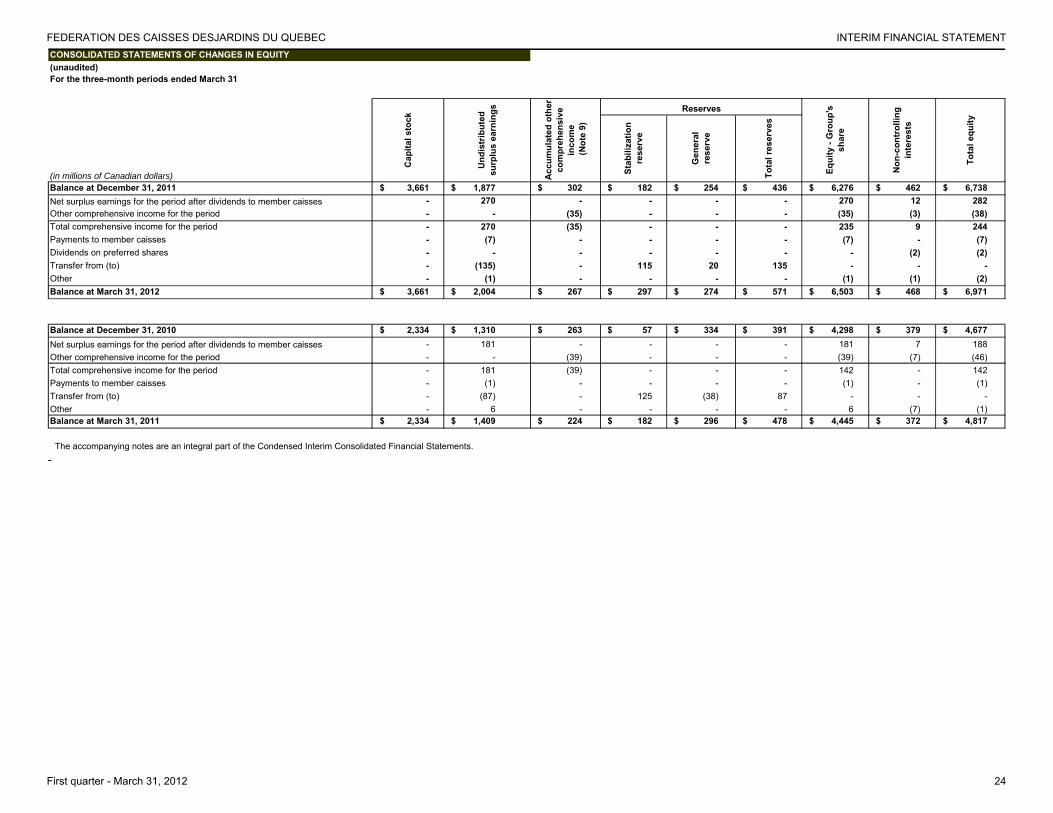
07.05.2012
Fédération des caisses Desjardins du Québec 5
-
CONSOLIDATED STATEMENTS OF CHANGES IN EQUITY(unaudited)
(in millions of Canadian dollars)Balance at December 31, 2011 $ 3,661 $ 1,877 $ 302 $ 182 $ 254 $ 436 $ 6,276 $ 462 $ 6,738 Net surplus earnings for the period after dividends to member caisses - 270 - - - - 270 12 282 Other comprehensive income for the period - - (35) - - - (35) (3) (38) Total comprehensive income for the period - 270 (35) - - - 235 9 244 Payments to member caisses - (7) - - - - (7) - (7) Dividends on preferred shares - - - - - - - (2) (2) Transfer from (to) - (135) - 115 20 135 - - - Other - (1) - - - - (1) (1) (2) Balance at March 31, 2012 $ 3,661 $ 2,004 $ 267 $ 297 $ 274 $ 571 $ 6,503 $ 468 $ 6,971
Balance at December 31, 2010 $ 2,334 $ 1,310 $ 263 $ 57 $ 334 $ 391 $ 4,298 $ 379 $ 4,677 Net surplus earnings for the period after dividends to member caisses - 181 - - - - 181 7 188 Other comprehensive income for the period - - (39) - - - (39) (7) (46) Total comprehensive income for the period - 181 (39) - - - 142 - 142 Payments to member caisses - (1) - - - - (1) - (1) Transfer from (to) - (87) - 125 (38) 87 - - - Other - 6 - - - - 6 (7) (1) Balance at March 31, 2011 $ 2,334 $ 1,409 $ 224 $ 182 $ 296 $ 478 $ 4,445 $ 372 $ 4,817
The accompanying notes are an integral part of the Condensed Interim Consolidated Financial Statements.
Cap
ital s
tock
Und
istr
ibut
ed
surp
lus
earn
ings
Stab
iliza
tion
rese
rve
For the three-month periods ended March 31
Tota
l equ
ity
Acc
umul
ated
oth
er
com
preh
ensi
ve
inco
me
(Not
e 9)
Reserves
Gen
eral
re
serv
e
Tota
l res
erve
s
Equi
ty -
Gro
up's
sh
are
Non
-con
trol
ling
inte
rest
s
FEDERATION DES CAISSES DESJARDINS DU QUEBEC INTERIM FINANCIAL STATEMENT
First quarter - March 31, 2012 24
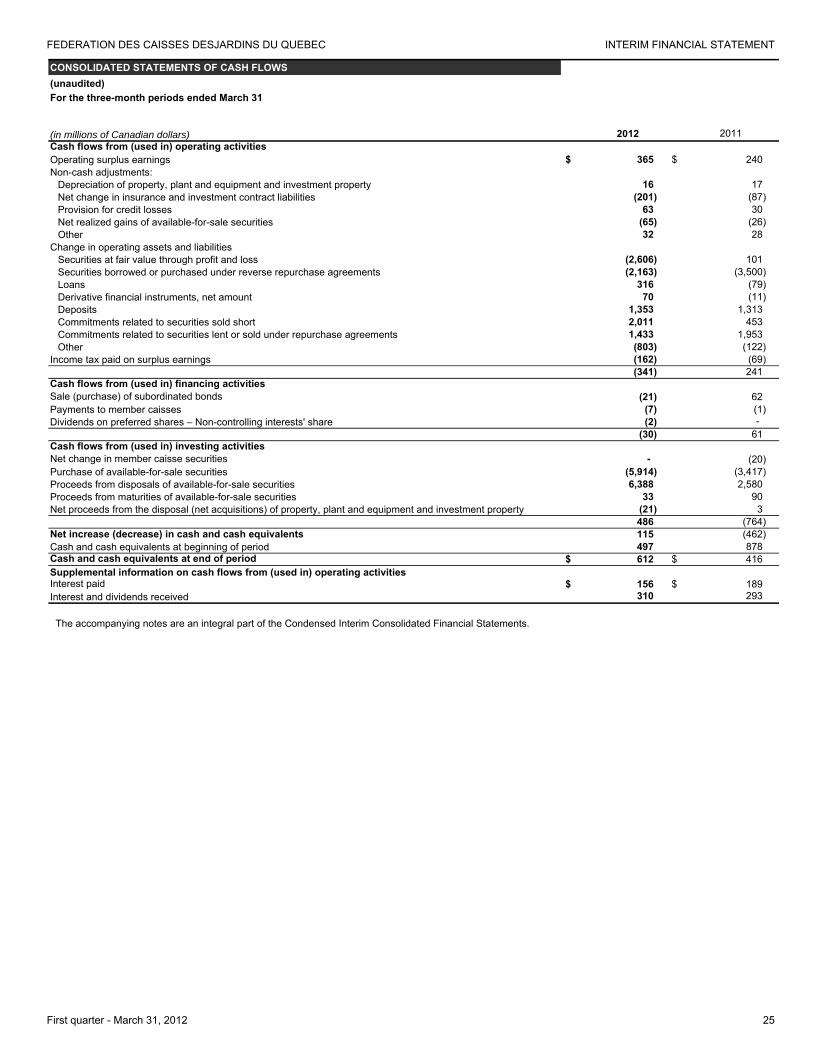
07.05.2012
Fédération des caisses Desjardins du Québec 6
- CONSOLIDATED STATEMENTS OF CASH FLOWS(unaudited)For the three-month periods ended March 31
(in millions of Canadian dollars) 2011Cash flows from (used in) operating activitiesOperating surplus earnings $ 365 $ 240 Non-cash adjustments:
Depreciation of property, plant and equipment and investment property 16 17 Net change in insurance and investment contract liabilities (201) (87) Provision for credit losses 63 30 Net realized gains of available-for-sale securities (65) (26) Other 32 28
Change in operating assets and liabilitiesSecurities at fair value through profit and loss (2,606) 101 Securities borrowed or purchased under reverse repurchase agreements (2,163) (3,500) Loans 316 (79) Derivative financial instruments, net amount 70 (11) Deposits 1,353 1,313 Commitments related to securities sold short 2,011 453 Commitments related to securities lent or sold under repurchase agreements 1,433 1,953 Other (803) (122)
Income tax paid on surplus earnings (162) (69) (341) 241
Cash flows from (used in) financing activitiesSale (purchase) of subordinated bonds (21) 62 Payments to member caisses (7) (1) Dividends on preferred shares – Non-controlling interests' share (2) -
(30) 61 Cash flows from (used in) investing activitiesNet change in member caisse securities - (20) Purchase of available-for-sale securities (5,914) (3,417) Proceeds from disposals of available-for-sale securities 6,388 2,580 Proceeds from maturities of available-for-sale securities 33 90 Net proceeds from the disposal (net acquisitions) of property, plant and equipment and investment property (21) 3
486 (764) Net increase (decrease) in cash and cash equivalents 115 (462) Cash and cash equivalents at beginning of period 497 878 Cash and cash equivalents at end of period $ 612 $ 416 Supplemental information on cash flows from (used in) operating activitiesInterest paid $ 156 $ 189 Interest and dividends received 310 293
The accompanying notes are an integral part of the Condensed Interim Consolidated Financial Statements.
2012
FEDERATION DES CAISSES DESJARDINS DU QUEBEC INTERIM FINANCIAL STATEMENT
First quarter - March 31, 2012 25
07.05.2012
Fédération des caisses Desjardins du Québec 7
NOTES TO THE CONDENSED
INTERIM CONSOLIDATED FINANCIAL STATEMENTS (unaudited)
NOTE 1 – INFORMATION ON THE FÉDÉRATION DES CAISSES DESJARDINS DU QUÉBEC
NATURE OF OPERATIONS
The Fédération des caisses Desjardins du Québec (Federation) is the cooperative entity responsible for providing direction, coordination, and development support to Desjardins Group. It provides its member caisses with a variety of services, including certain technical, financial and administrative services. The member caisses collectively control the Federation. Each member caisse has a significant influence on the Federation.
The Federation is responsible for inspecting and auditing the caisses as well as for designing and developing all caisse network systems. It holds the rights and privileges to use and to participate in the VISA payment system in Canada, and, through holding companies, manages controlling interests in business corporations. The address of the head office is 100 Des Commandeurs Street, Lévis, Quebec, Canada.
NOTE 2 – SIGNIFICANT ACCOUNTING POLICIES
GENERAL INFORMATION
STATEMENT OF COMPLIANCE
Pursuant to An Act respecting financial services cooperatives, these unaudited Condensed Interim Consolidated Financial Statements (the Interim Consolidated Financial Statements) have been prepared by the Federation’s management in accordance with Canadian generally accepted accounting principles (GAAP) and the accounting requirements of the Autorité des marchés financiers in Quebec (AMF), which do not differ from GAAP.
The International Financial Reporting Standards (IFRS) constitute Canadian GAAP. These Interim Consolidated Financial Statements of the Federation have been prepared in accordance with IFRS, as issued by the International Accounting Standards Board (IASB), and more specifically in accordance with IAS 34, "Interim Financial Reporting". These Interim Consolidated Financial Statements should be read in conjunction with the audited consolidated financial statements for the year ended December 31, 2011. All accounting policies were applied on a basis consistent with that mentioned in Note 2, “Significant accounting policies”, to these audited annual financial statements. No new accounting standard has been issued by the IASB during the three-month period ended March 31, 2012. For more information, see Note 3, “Future accounting standards”, to the audited annual financial statements.
These Interim Consolidated Financial Statements were approved by the Board of Directors on May 11, 2012.
SIGNIFICANT JUDGMENTS, ESTIMATES AND ASSUMPTIONS
The preparation of interim consolidated financial statements in accordance with IFRS requires management to make judgments, estimates and assumptions with respect to fair value measurement of financial instruments, allowance for credit losses, objective evidence of impairment of available-for-sale securities, insurance and investment contract liabilities, goodwill, provision for dividends to member caisses, impairment of non-financial assets, income taxes on surplus earnings and employee benefits.
Actual results could differ from those estimates and assumptions, and the results of the interim periods presented are not necessarily representative of anticipated results for the full year. In the opinion of management, the necessary adjustments have been made to these Interim Consolidated Financial Statements to ensure that they present fairly the results of the periods presented.
FUNCTIONAL CURRENCY AND REPORTING CURRENCY
These Interim Consolidated Financial Statements are expressed in Canadian dollars, which is also the functional currency of the Federation. Dollar amounts presented in the tables of the Notes to the Interim Consolidated Financial Statements are in millions of dollars, unless otherwise stated.
FEDERATION DES CAISSES DESJARDINS DU QUEBEC INTERIM FINANCIAL STATEMENT
First quarter - March 31, 2012 26
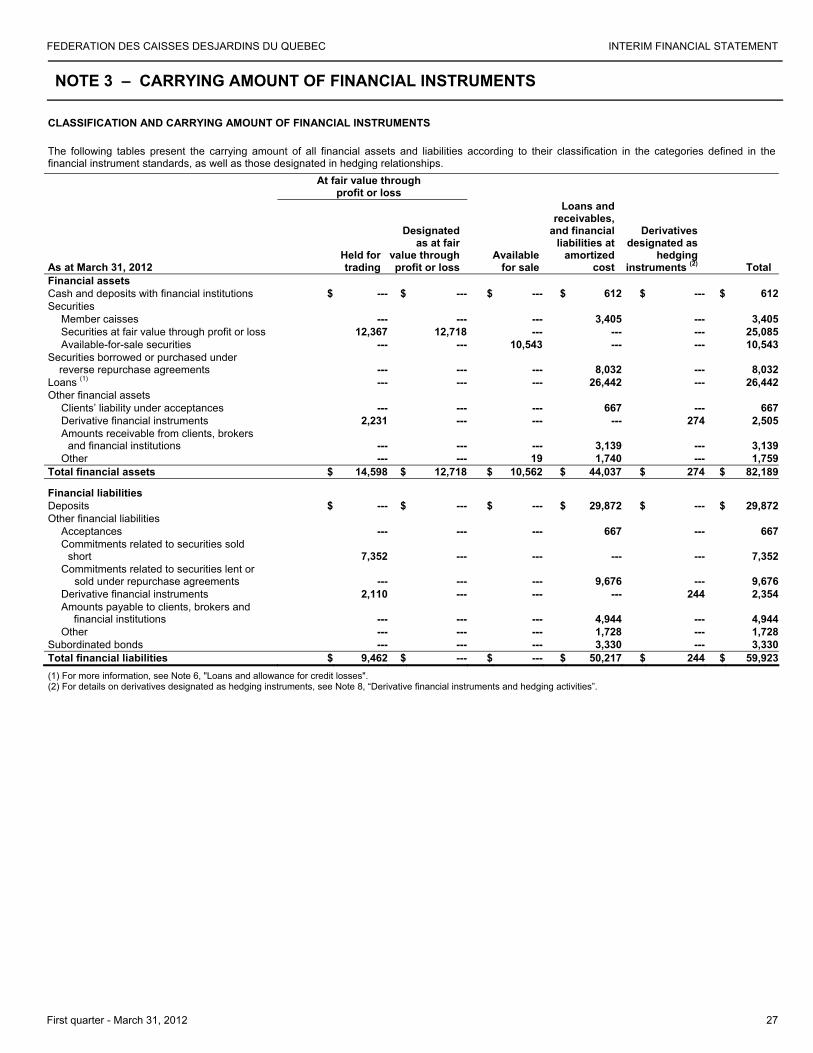
07.05.2012
Fédération des caisses Desjardins du Québec 8
NOTE 3 – CARRYING AMOUNT OF FINANCIAL INSTRUMENTS
CLASSIFICATION AND CARRYING AMOUNT OF FINANCIAL INSTRUMENTS
The following tables present the carrying amount of all financial assets and liabilities according to their classification in the categories defined in the financial instrument standards, as well as those designated in hedging relationships.
At fair value through
profit or loss
As at March 31, 2012 Held fortrading
Designated as at fair
value through profit or loss
Available for sale
Loans and receivables,
and financial liabilities at
amortized cost
Derivatives designated as
hedging instruments (2) Total
Financial assets Cash and deposits with financial institutions $ --- $ --- $ --- $ 612 $ --- $ 612Securities
Member caisses --- --- --- 3,405 --- 3,405Securities at fair value through profit or loss 12,367 12,718 --- --- --- 25,085Available-for-sale securities --- --- 10,543 --- --- 10,543
Securities borrowed or purchased under reverse repurchase agreements --- --- --- 8,032 --- 8,032
Loans (1) --- --- --- 26,442 --- 26,442Other financial assets
Clients’ liability under acceptances --- --- --- 667 --- 667Derivative financial instruments 2,231 --- --- --- 274 2,505Amounts receivable from clients, brokers
and financial institutions --- --- --- 3,139 --- 3,139Other --- --- 19 1,740 --- 1,759
Total financial assets $ 14,598 $ 12,718 $ 10,562 $ 44,037 $ 274 $ 82,189
Financial liabilities Deposits $ --- $ --- $ --- $ 29,872 $ --- $ 29,872Other financial liabilities
Acceptances --- --- --- 667 --- 667Commitments related to securities sold
short 7,352 --- --- --- --- 7,352Commitments related to securities lent or
sold under repurchase agreements --- --- --- 9,676 --- 9,676Derivative financial instruments 2,110 --- --- --- 244 2,354Amounts payable to clients, brokers and
financial institutions --- --- --- 4,944 --- 4,944Other --- --- --- 1,728 --- 1,728
Subordinated bonds --- --- --- 3,330 --- 3,330Total financial liabilities $ 9,462 $ --- $ --- $ 50,217 $ 244 $ 59,923(1) For more information, see Note 6, "Loans and allowance for credit losses". (2) For details on derivatives designated as hedging instruments, see Note 8, “Derivative financial instruments and hedging activities”.
FEDERATION DES CAISSES DESJARDINS DU QUEBEC INTERIM FINANCIAL STATEMENT
First quarter - March 31, 2012 27
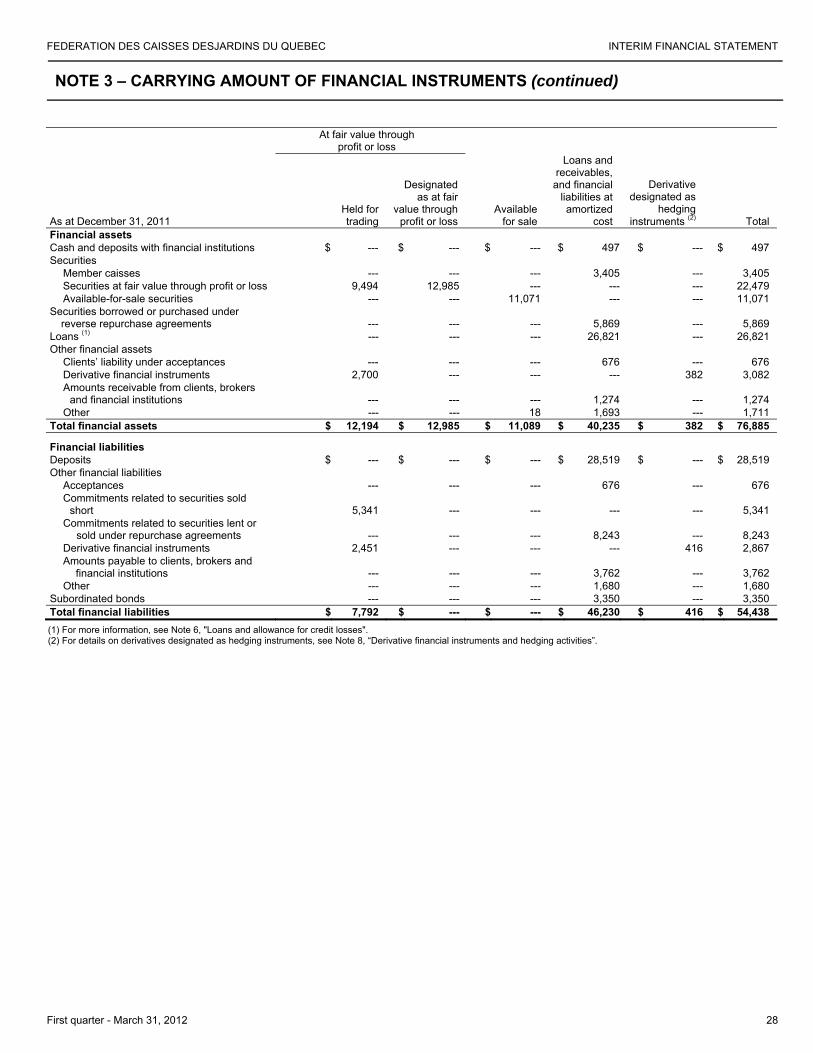
07.05.2012
Fédération des caisses Desjardins du Québec 9
NOTE 3 – CARRYING AMOUNT OF FINANCIAL INSTRUMENTS (continued)
At fair value through
profit or loss
As at December 31, 2011 Held fortrading
Designated as at fair
value through profit or loss
Available for sale
Loans and receivables,
and financial liabilities at amortized
cost
Derivative designated as
hedging instruments (2) Total
Financial assets Cash and deposits with financial institutions $ --- $ --- $ --- $ 497 $ --- $ 497 Securities
Member caisses --- --- --- 3,405 --- 3,405 Securities at fair value through profit or loss 9,494 12,985 --- --- --- 22,479 Available-for-sale securities --- --- 11,071 --- --- 11,071
Securities borrowed or purchased under reverse repurchase agreements --- --- --- 5,869 --- 5,869
Loans (1) --- --- --- 26,821 --- 26,821 Other financial assets
Clients’ liability under acceptances --- --- --- 676 --- 676 Derivative financial instruments 2,700 --- --- --- 382 3,082 Amounts receivable from clients, brokers
and financial institutions --- --- --- 1,274 --- 1,274 Other --- --- 18 1,693 --- 1,711
Total financial assets $ 12,194 $ 12,985 $ 11,089 $ 40,235 $ 382 $ 76,885
Financial liabilities Deposits $ --- $ --- $ --- $ 28,519 $ --- $ 28,519 Other financial liabilities
Acceptances --- --- --- 676 --- 676 Commitments related to securities sold
short 5,341 --- --- --- --- 5,341 Commitments related to securities lent or
sold under repurchase agreements --- --- --- 8,243 --- 8,243 Derivative financial instruments 2,451 --- --- --- 416 2,867 Amounts payable to clients, brokers and
financial institutions --- --- --- 3,762 --- 3,762 Other --- --- --- 1,680 --- 1,680
Subordinated bonds --- --- --- 3,350 --- 3,350 Total financial liabilities $ 7,792 $ --- $ --- $ 46,230 $ 416 $ 54,438 (1) For more information, see Note 6, "Loans and allowance for credit losses". (2) For details on derivatives designated as hedging instruments, see Note 8, “Derivative financial instruments and hedging activities”.
FEDERATION DES CAISSES DESJARDINS DU QUEBEC INTERIM FINANCIAL STATEMENT
First quarter - March 31, 2012 28
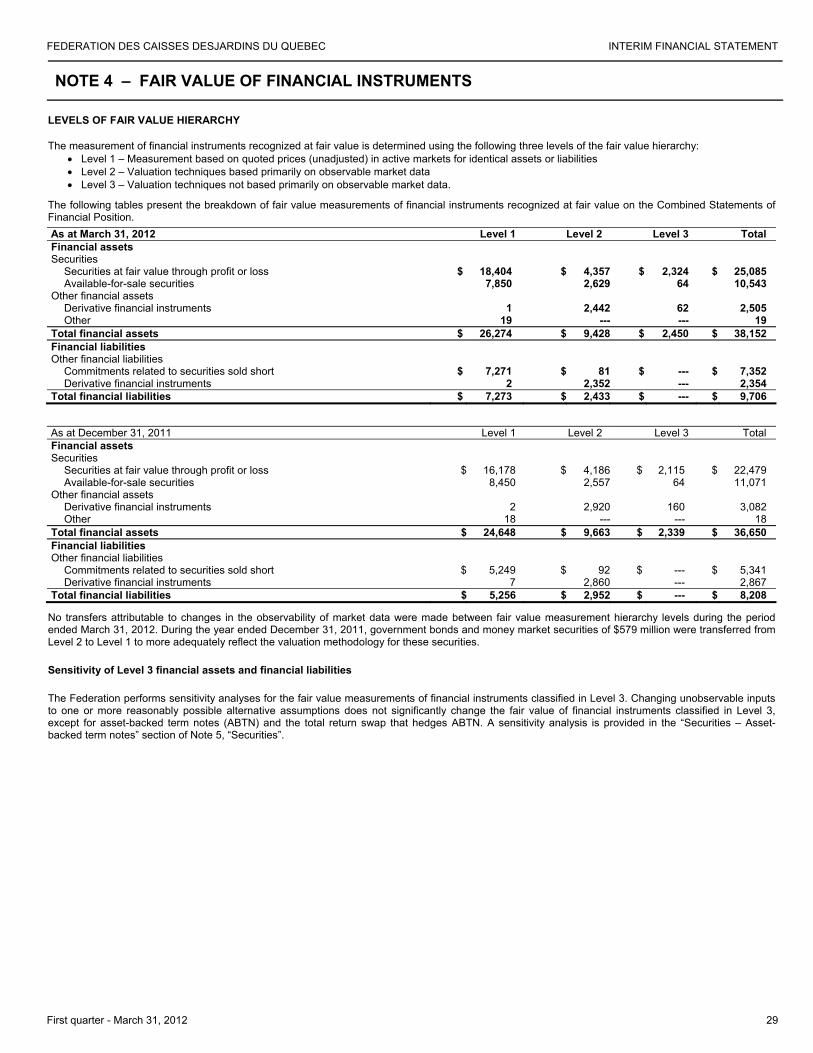
07.05.2012
Fédération des caisses Desjardins du Québec 10
NOTE 4 – FAIR VALUE OF FINANCIAL INSTRUMENTS
LEVELS OF FAIR VALUE HIERARCHY
The measurement of financial instruments recognized at fair value is determined using the following three levels of the fair value hierarchy: • Level 1 – Measurement based on quoted prices (unadjusted) in active markets for identical assets or liabilities • Level 2 – Valuation techniques based primarily on observable market data • Level 3 – Valuation techniques not based primarily on observable market data.
The following tables present the breakdown of fair value measurements of financial instruments recognized at fair value on the Combined Statements of Financial Position. As at March 31, 2012 Level 1 Level 2 Level 3 Total Financial assets Securities
Securities at fair value through profit or loss $ 18,404 $ 4,357 $ 2,324 $ 25,085 Available-for-sale securities 7,850 2,629 64 10,543
Other financial assets Derivative financial instruments 1 2,442 62 2,505 Other 19 --- --- 19
Total financial assets $ 26,274 $ 9,428 $ 2,450 $ 38,152 Financial liabilities Other financial liabilities
Commitments related to securities sold short $ 7,271 $ 81 $ --- $ 7,352 Derivative financial instruments 2 2,352 --- 2,354
Total financial liabilities $ 7,273 $ 2,433 $ --- $ 9,706
As at December 31, 2011 Level 1 Level 2 Level 3 Total Financial assets Securities
Securities at fair value through profit or loss $ 16,178 $ 4,186 $ 2,115 $ 22,479 Available-for-sale securities 8,450 2,557 64 11,071
Other financial assets Derivative financial instruments 2 2,920 160 3,082 Other 18 --- --- 18
Total financial assets $ 24,648 $ 9,663 $ 2,339 $ 36,650 Financial liabilities Other financial liabilities
Commitments related to securities sold short $ 5,249 $ 92 $ --- $ 5,341 Derivative financial instruments 7 2,860 --- 2,867
Total financial liabilities $ 5,256 $ 2,952 $ --- $ 8,208
No transfers attributable to changes in the observability of market data were made between fair value measurement hierarchy levels during the period ended March 31, 2012. During the year ended December 31, 2011, government bonds and money market securities of $579 million were transferred from Level 2 to Level 1 to more adequately reflect the valuation methodology for these securities.
Sensitivity of Level 3 financial assets and financial liabilities
The Federation performs sensitivity analyses for the fair value measurements of financial instruments classified in Level 3. Changing unobservable inputs to one or more reasonably possible alternative assumptions does not significantly change the fair value of financial instruments classified in Level 3, except for asset-backed term notes (ABTN) and the total return swap that hedges ABTN. A sensitivity analysis is provided in the “Securities – Asset-backed term notes” section of Note 5, “Securities”.
FEDERATION DES CAISSES DESJARDINS DU QUEBEC INTERIM FINANCIAL STATEMENT
First quarter - March 31, 2012 29
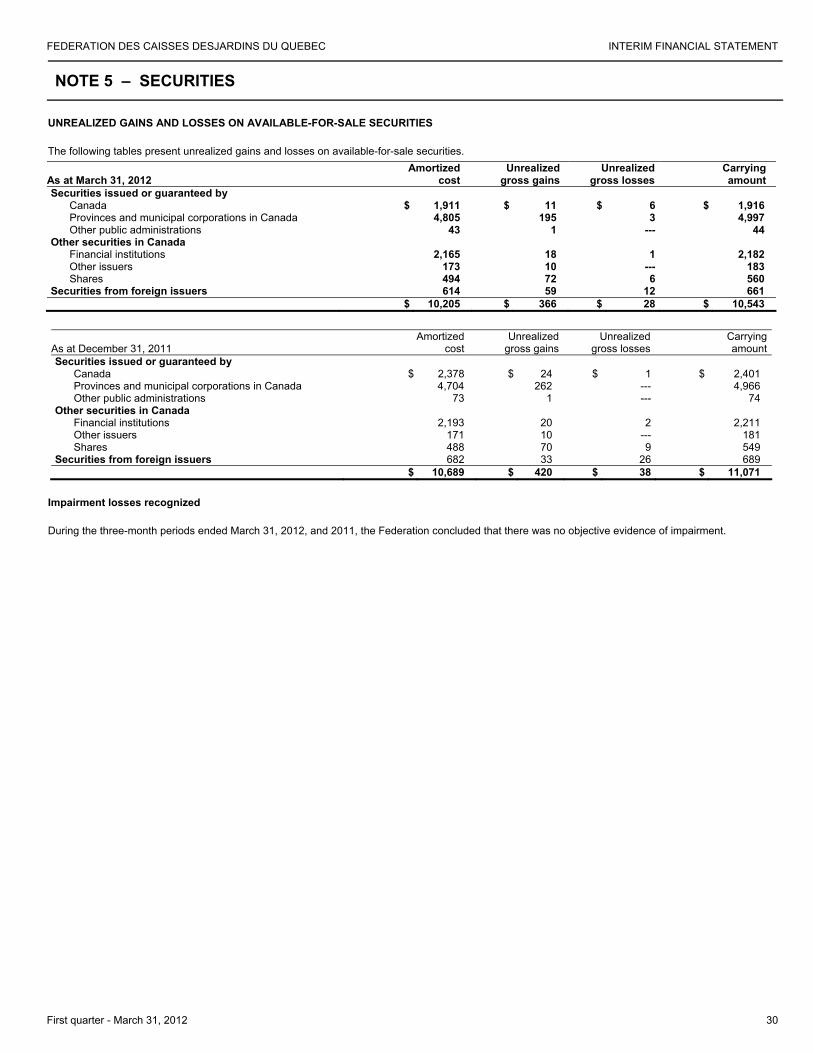
07.05.2012
Fédération des caisses Desjardins du Québec 11
NOTE 5 – SECURITIES
UNREALIZED GAINS AND LOSSES ON AVAILABLE-FOR-SALE SECURITIES
The following tables present unrealized gains and losses on available-for-sale securities.
As at March 31, 2012 Amortized
cost Unrealized
gross gains Unrealized
gross lossesCarryingamount
Securities issued or guaranteed by Canada $ 1,911 $ 11 $ 6 $ 1,916 Provinces and municipal corporations in Canada 4,805 195 3 4,997 Other public administrations 43 1 --- 44
Other securities in Canada Financial institutions 2,165 18 1 2,182 Other issuers 173 10 --- 183 Shares 494 72 6 560
Securities from foreign issuers 614 59 12 661 $ 10,205 $ 366 $ 28 $ 10,543
As at December 31, 2011 Amortized
cost Unrealized
gross gainsUnrealized
gross losses Carryingamount
Securities issued or guaranteed by Canada $ 2,378 $ 24 $ 1 $ 2,401 Provinces and municipal corporations in Canada 4,704 262 --- 4,966 Other public administrations 73 1 --- 74
Other securities in Canada Financial institutions 2,193 20 2 2,211 Other issuers 171 10 --- 181 Shares 488 70 9 549
Securities from foreign issuers 682 33 26 689 $ 10,689 $ 420 $ 38 $ 11,071
Impairment losses recognized
During the three-month periods ended March 31, 2012, and 2011, the Federation concluded that there was no objective evidence of impairment.
FEDERATION DES CAISSES DESJARDINS DU QUEBEC INTERIM FINANCIAL STATEMENT
First quarter - March 31, 2012 30
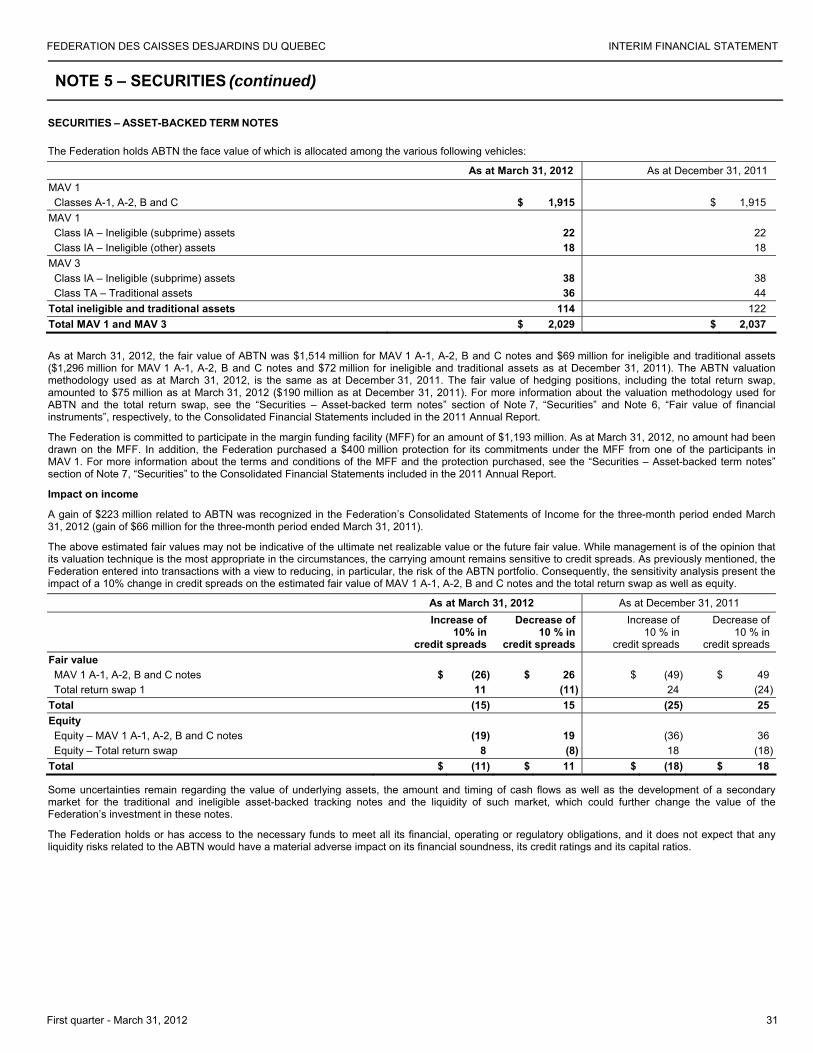
07.05.2012
Fédération des caisses Desjardins du Québec 12
NOTE 5 – SECURITIES (continued)
SECURITIES – ASSET-BACKED TERM NOTES
The Federation holds ABTN the face value of which is allocated among the various following vehicles:
As at March 31, 2012 As at December 31, 2011 MAV 1 Classes A-1, A-2, B and C $ 1,915 $ 1,915
MAV 1 Class IA – Ineligible (subprime) assets 22 22 Class IA – Ineligible (other) assets 18 18
MAV 3 Class IA – Ineligible (subprime) assets 38 38 Class TA – Traditional assets 36 44
Total ineligible and traditional assets 114 122 Total MAV 1 and MAV 3 $ 2,029 $ 2,037
As at March 31, 2012, the fair value of ABTN was $1,514 million for MAV 1 A-1, A-2, B and C notes and $69 million for ineligible and traditional assets ($1,296 million for MAV 1 A-1, A-2, B and C notes and $72 million for ineligible and traditional assets as at December 31, 2011). The ABTN valuation methodology used as at March 31, 2012, is the same as at December 31, 2011. The fair value of hedging positions, including the total return swap, amounted to $75 million as at March 31, 2012 ($190 million as at December 31, 2011). For more information about the valuation methodology used for ABTN and the total return swap, see the “Securities – Asset-backed term notes” section of Note 7, “Securities” and Note 6, “Fair value of financial instruments”, respectively, to the Consolidated Financial Statements included in the 2011 Annual Report.
The Federation is committed to participate in the margin funding facility (MFF) for an amount of $1,193 million. As at March 31, 2012, no amount had been drawn on the MFF. In addition, the Federation purchased a $400 million protection for its commitments under the MFF from one of the participants in MAV 1. For more information about the terms and conditions of the MFF and the protection purchased, see the “Securities – Asset-backed term notes” section of Note 7, “Securities” to the Consolidated Financial Statements included in the 2011 Annual Report.
Impact on income
A gain of $223 million related to ABTN was recognized in the Federation’s Consolidated Statements of Income for the three-month period ended March 31, 2012 (gain of $66 million for the three-month period ended March 31, 2011).
The above estimated fair values may not be indicative of the ultimate net realizable value or the future fair value. While management is of the opinion that its valuation technique is the most appropriate in the circumstances, the carrying amount remains sensitive to credit spreads. As previously mentioned, the Federation entered into transactions with a view to reducing, in particular, the risk of the ABTN portfolio. Consequently, the sensitivity analysis present the impact of a 10% change in credit spreads on the estimated fair value of MAV 1 A-1, A-2, B and C notes and the total return swap as well as equity.
As at March 31, 2012 As at December 31, 2011
Increase of10% in
credit spreads
Decrease of 10 % in
credit spreads
Increase of 10 % in
credit spreads
Decrease of 10 % in
credit spreads Fair value MAV 1 A-1, A-2, B and C notes $ (26) $ 26 $ (49) $ 49 Total return swap 1 11 (11) 24 (24)
Total (15) 15 (25) 25 Equity Equity – MAV 1 A-1, A-2, B and C notes (19) 19 (36) 36 Equity – Total return swap 8 (8) 18 (18)
Total $ (11) $ 11 $ (18) $ 18
Some uncertainties remain regarding the value of underlying assets, the amount and timing of cash flows as well as the development of a secondary market for the traditional and ineligible asset-backed tracking notes and the liquidity of such market, which could further change the value of the Federation’s investment in these notes.
The Federation holds or has access to the necessary funds to meet all its financial, operating or regulatory obligations, and it does not expect that any liquidity risks related to the ABTN would have a material adverse impact on its financial soundness, its credit ratings and its capital ratios.
FEDERATION DES CAISSES DESJARDINS DU QUEBEC INTERIM FINANCIAL STATEMENT
First quarter - March 31, 2012 31
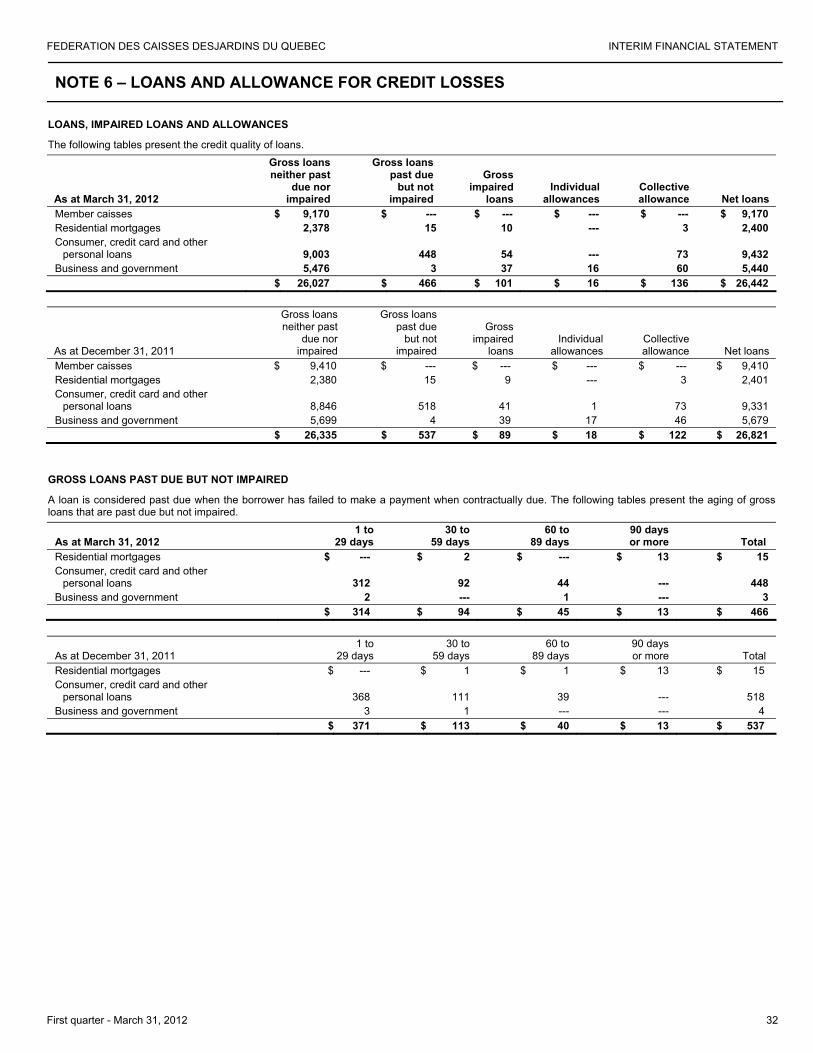
07.05.2012
Fédération des caisses Desjardins du Québec 13
NOTE 6 – LOANS AND ALLOWANCE FOR CREDIT LOSSES
LOANS, IMPAIRED LOANS AND ALLOWANCES
The following tables present the credit quality of loans.
As at March 31, 2012
Gross loans neither past
due nor impaired
Gross loans past due
but not impaired
Gross impaired
loans Individual
allowances Collective allowance Net loans
Member caisses $ 9,170 $ --- $ --- $ --- $ --- $ 9,170 Residential mortgages 2,378 15 10 --- 3 2,400 Consumer, credit card and other
personal loans 9,003 448 54 --- 73 9,432 Business and government 5,476 3 37 16 60 5,440 $ 26,027 $ 466 $ 101 $ 16 $ 136 $ 26,442
As at December 31, 2011
Gross loans neither past
due nor impaired
Gross loans past due
but not impaired
Gross impaired
loans Individual
allowances Collective allowance Net loans
Member caisses $ 9,410 $ --- $ --- $ --- $ --- $ 9,410 Residential mortgages 2,380 15 9 --- 3 2,401 Consumer, credit card and other
personal loans 8,846 518 41 1 73 9,331 Business and government 5,699 4 39 17 46 5,679 $ 26,335 $ 537 $ 89 $ 18 $ 122 $ 26,821
GROSS LOANS PAST DUE BUT NOT IMPAIRED
A loan is considered past due when the borrower has failed to make a payment when contractually due. The following tables present the aging of gross loans that are past due but not impaired.
As at March 31, 2012 1 to
29 days30 to
59 days 60 to
89 days 90 daysor more Total
Residential mortgages $ --- $ 2 $ --- $ 13 $ 15 Consumer, credit card and other
personal loans 312 92 44 --- 448 Business and government 2 --- 1 --- 3
$ 314 $ 94 $ 45 $ 13 $ 466
As at December 31, 2011 1 to
29 days30 to
59 days 60 to
89 days 90 daysor more Total
Residential mortgages $ --- $ 1 $ 1 $ 13 $ 15 Consumer, credit card and other
personal loans 368 111 39 --- 518 Business and government 3 1 --- --- 4
$ 371 $ 113 $ 40 $ 13 $ 537
FEDERATION DES CAISSES DESJARDINS DU QUEBEC INTERIM FINANCIAL STATEMENT
First quarter - March 31, 2012 32
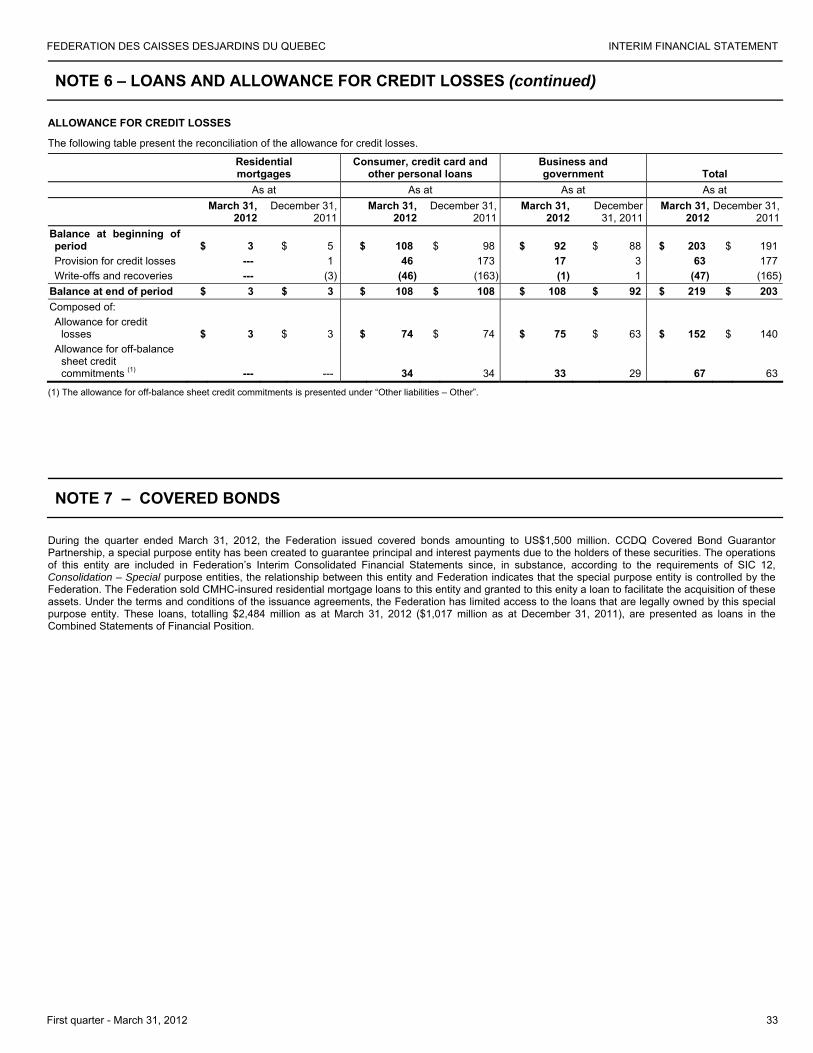
07.05.2012
Fédération des caisses Desjardins du Québec 14
NOTE 6 – LOANS AND ALLOWANCE FOR CREDIT LOSSES (continued)
ALLOWANCE FOR CREDIT LOSSES
The following table present the reconciliation of the allowance for credit losses.
Residential mortgages
Consumer, credit card and other personal loans
Business and government Total
As at As at As at As at
March 31,
2012 December 31,
2011March 31,
2012December 31,
2011March 31,
2012December
31, 2011 March 31,
2012December 31,
2011Balance at beginning of period $ 3 $ 5 $ 108 $ 98 $ 92 $ 88 $ 203 $ 191Provision for credit losses --- 1 46 173 17 3 63 177Write-offs and recoveries --- (3) (46) (163) (1) 1 (47) (165)
Balance at end of period $ 3 $ 3 $ 108 $ 108 $ 108 $ 92 $ 219 $ 203Composed of: Allowance for credit
losses $ 3 $ 3 $ 74 $ 74 $ 75 $ 63 $ 152 $ 140Allowance for off-balance
sheet credit commitments (1) --- --- 34 34 33 29 67 63
(1) The allowance for off-balance sheet credit commitments is presented under “Other liabilities – Other”.
NOTE 7 – COVERED BONDS
During the quarter ended March 31, 2012, the Federation issued covered bonds amounting to US$1,500 million. CCDQ Covered Bond Guarantor Partnership, a special purpose entity has been created to guarantee principal and interest payments due to the holders of these securities. The operations of this entity are included in Federation’s Interim Consolidated Financial Statements since, in substance, according to the requirements of SIC 12, Consolidation – Special purpose entities, the relationship between this entity and Federation indicates that the special purpose entity is controlled by the Federation. The Federation sold CMHC-insured residential mortgage loans to this entity and granted to this enity a loan to facilitate the acquisition of these assets. Under the terms and conditions of the issuance agreements, the Federation has limited access to the loans that are legally owned by this special purpose entity. These loans, totalling $2,484 million as at March 31, 2012 ($1,017 million as at December 31, 2011), are presented as loans in the Combined Statements of Financial Position.
FEDERATION DES CAISSES DESJARDINS DU QUEBEC INTERIM FINANCIAL STATEMENT
First quarter - March 31, 2012 33

07.05.2012
Fédération des caisses Desjardins du Québec 15
NOTE 8 – DERIVATIVE FINANCIAL INSTRUMENTS AND HEDGING ACTIVITIES
The following table presents the derivative financial instruments recognized in the Consolidated Statements of Financial Position. As at March 31, 2012 As at December 31, 2011
Notional amount Assets Liabilities
Notional amount Assets Liabilities
Designated as hedging instruments Fair value hedges $ 13,053 $ 238 $ 108 $ 13,397 $ 326 $ 289Cash flow hedges 3,125 36 136 3,099 56 127
Total – Designated as hedging instruments 16,178 274 244 16,496 382 416Trading purposes 146,940 2,231 2,110 145,154 2,700 2,451Total derivative financial instruments before impact of master netting agreements $ 163,118 $ 2,505 $ 2,354 $ 161,650 $ 3,082 $ 2,867
Less impact of master netting agreements (1) $ --- $ 560 $ 560 $ --- $ 780 $ 780Total derivative financial instruments after impact of master netting agreements $ 163,118 $ 1,945 $ 1,794 $ 161,650 $ 2,302 $ 2,087
(1) Impact of offsetting credit exposure when the Federation holds master netting agreements without the intent of settling on a net basis or simultaneously.
Fair value hedges
For the three-month period ended March 31, 2012, a non significant net gain (net loss of $3 million for the three-month period ended March 31, 2011) related to the ineffectiveness of fair value hedging activities was recognized under “Net income on securities at fair value through profit or loss” in the Consolidated Statements of Income.
Cash flow hedges
For the three-month period ended March 31, 2012, a non significant net gain (not significant for the three-month period ended March 31, 2011) related to the ineffectiveness of cash flow hedging activities was recognized under “Net income on securities at fair value through profit or loss” in the Consolidated Statements of Income.
NOTE 9 – ACCUMULATED OTHER COMPREHENSIVE INCOME
The following table presents the main components of accumulated other comprehensive income (net of taxes). As at March 31, 2012 As at December 31, 2011
Group’s share Non-controlling interests’ share Group’s share
Non-controlling interests’ share
Net unrealized gains on available-for-sale securities $ 235 $ 28 $ 257 $ 31
Net gains on derivative financial instruments designated as cash flow hedges 32 1 45 1
Accumulated other comprehensive income $ 267 $ 29 $ 302 $ 32
FEDERATION DES CAISSES DESJARDINS DU QUEBEC INTERIM FINANCIAL STATEMENT
First quarter - March 31, 2012 34
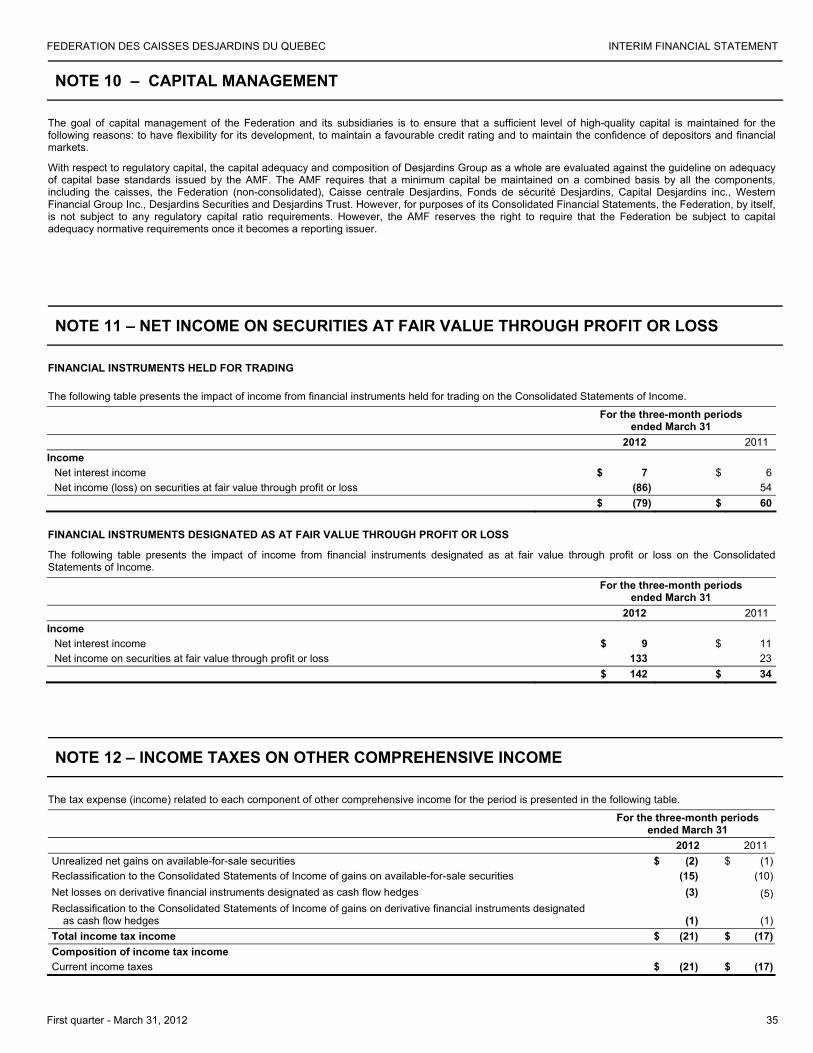
07.05.2012
Fédération des caisses Desjardins du Québec 16
NOTE 10 – CAPITAL MANAGEMENT
The goal of capital management of the Federation and its subsidiaries is to ensure that a sufficient level of high-quality capital is maintained for the following reasons: to have flexibility for its development, to maintain a favourable credit rating and to maintain the confidence of depositors and financial markets.
With respect to regulatory capital, the capital adequacy and composition of Desjardins Group as a whole are evaluated against the guideline on adequacy of capital base standards issued by the AMF. The AMF requires that a minimum capital be maintained on a combined basis by all the components, including the caisses, the Federation (non-consolidated), Caisse centrale Desjardins, Fonds de sécurité Desjardins, Capital Desjardins inc., Western Financial Group Inc., Desjardins Securities and Desjardins Trust. However, for purposes of its Consolidated Financial Statements, the Federation, by itself, is not subject to any regulatory capital ratio requirements. However, the AMF reserves the right to require that the Federation be subject to capital adequacy normative requirements once it becomes a reporting issuer.
NOTE 11 – NET INCOME ON SECURITIES AT FAIR VALUE THROUGH PROFIT OR LOSS
FINANCIAL INSTRUMENTS HELD FOR TRADING
The following table presents the impact of income from financial instruments held for trading on the Consolidated Statements of Income.
For the three-month periods
ended March 31 2012 2011
Income Net interest income $ 7 $ 6Net income (loss) on securities at fair value through profit or loss (86) 54
$ (79) $ 60
FINANCIAL INSTRUMENTS DESIGNATED AS AT FAIR VALUE THROUGH PROFIT OR LOSS
The following table presents the impact of income from financial instruments designated as at fair value through profit or loss on the Consolidated Statements of Income.
For the three-month periods
ended March 31 2012 2011
Income Net interest income $ 9 $ 11Net income on securities at fair value through profit or loss 133 23
$ 142 $ 34
NOTE 12 – INCOME TAXES ON OTHER COMPREHENSIVE INCOME
The tax expense (income) related to each component of other comprehensive income for the period is presented in the following table.
For the three-month periods
ended March 31 2012 2011 Unrealized net gains on available-for-sale securities $ (2) $ (1)Reclassification to the Consolidated Statements of Income of gains on available-for-sale securities (15) (10)Net losses on derivative financial instruments designated as cash flow hedges (3) (5)Reclassification to the Consolidated Statements of Income of gains on derivative financial instruments designated
as cash flow hedges (1) (1)Total income tax income $ (21) $ (17)Composition of income tax income Current income taxes $ (21) $ (17)
FEDERATION DES CAISSES DESJARDINS DU QUEBEC INTERIM FINANCIAL STATEMENT
First quarter - March 31, 2012 35
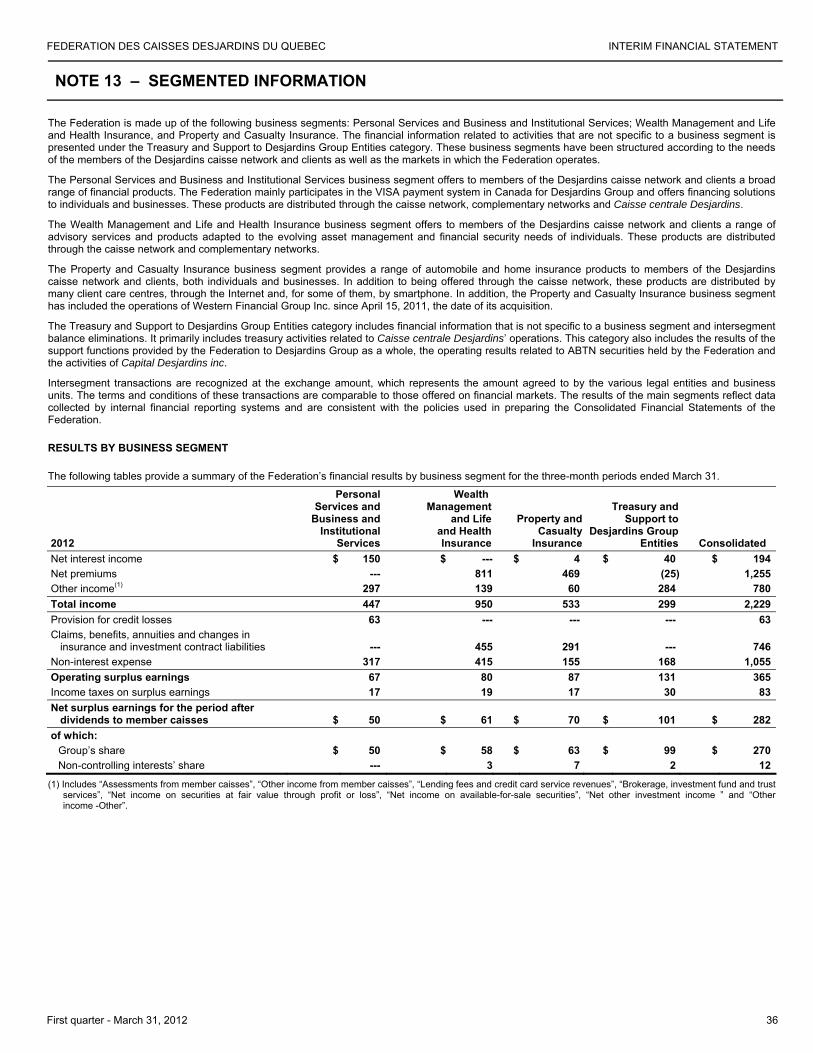
07.05.2012
Fédération des caisses Desjardins du Québec 17
NOTE 13 – SEGMENTED INFORMATION
The Federation is made up of the following business segments: Personal Services and Business and Institutional Services; Wealth Management and Life and Health Insurance, and Property and Casualty Insurance. The financial information related to activities that are not specific to a business segment is presented under the Treasury and Support to Desjardins Group Entities category. These business segments have been structured according to the needs of the members of the Desjardins caisse network and clients as well as the markets in which the Federation operates.
The Personal Services and Business and Institutional Services business segment offers to members of the Desjardins caisse network and clients a broad range of financial products. The Federation mainly participates in the VISA payment system in Canada for Desjardins Group and offers financing solutions to individuals and businesses. These products are distributed through the caisse network, complementary networks and Caisse centrale Desjardins.
The Wealth Management and Life and Health Insurance business segment offers to members of the Desjardins caisse network and clients a range of advisory services and products adapted to the evolving asset management and financial security needs of individuals. These products are distributed through the caisse network and complementary networks.
The Property and Casualty Insurance business segment provides a range of automobile and home insurance products to members of the Desjardins caisse network and clients, both individuals and businesses. In addition to being offered through the caisse network, these products are distributed by many client care centres, through the Internet and, for some of them, by smartphone. In addition, the Property and Casualty Insurance business segment has included the operations of Western Financial Group Inc. since April 15, 2011, the date of its acquisition.
The Treasury and Support to Desjardins Group Entities category includes financial information that is not specific to a business segment and intersegment balance eliminations. It primarily includes treasury activities related to Caisse centrale Desjardins’ operations. This category also includes the results of the support functions provided by the Federation to Desjardins Group as a whole, the operating results related to ABTN securities held by the Federation and the activities of Capital Desjardins inc.
Intersegment transactions are recognized at the exchange amount, which represents the amount agreed to by the various legal entities and business units. The terms and conditions of these transactions are comparable to those offered on financial markets. The results of the main segments reflect data collected by internal financial reporting systems and are consistent with the policies used in preparing the Consolidated Financial Statements of the Federation.
RESULTS BY BUSINESS SEGMENT
The following tables provide a summary of the Federation’s financial results by business segment for the three-month periods ended March 31.
2012
Personal Services and
Business and Institutional
Services
Wealth Management
and Life and Health Insurance
Property and Casualty
Insurance
Treasury and Support to
Desjardins Group Entities Consolidated
Net interest income $ 150 $ --- $ 4 $ 40 $ 194Net premiums --- 811 469 (25) 1,255Other income(1) 297 139 60 284 780Total income 447 950 533 299 2,229Provision for credit losses 63 --- --- --- 63Claims, benefits, annuities and changes in
insurance and investment contract liabilities --- 455 291 --- 746Non-interest expense 317 415 155 168 1,055Operating surplus earnings 67 80 87 131 365Income taxes on surplus earnings 17 19 17 30 83Net surplus earnings for the period after
dividends to member caisses $ 50 $ 61 $ 70 $ 101 $ 282of which:
Group’s share $ 50 $ 58 $ 63 $ 99 $ 270Non-controlling interests’ share --- 3 7 2 12
(1) Includes “Assessments from member caisses”, “Other income from member caisses”, “Lending fees and credit card service revenues”, “Brokerage, investment fund and trust services”, “Net income on securities at fair value through profit or loss”, “Net income on available-for-sale securities”, “Net other investment income ” and “Other income -Other”.
FEDERATION DES CAISSES DESJARDINS DU QUEBEC INTERIM FINANCIAL STATEMENT
First quarter - March 31, 2012 36
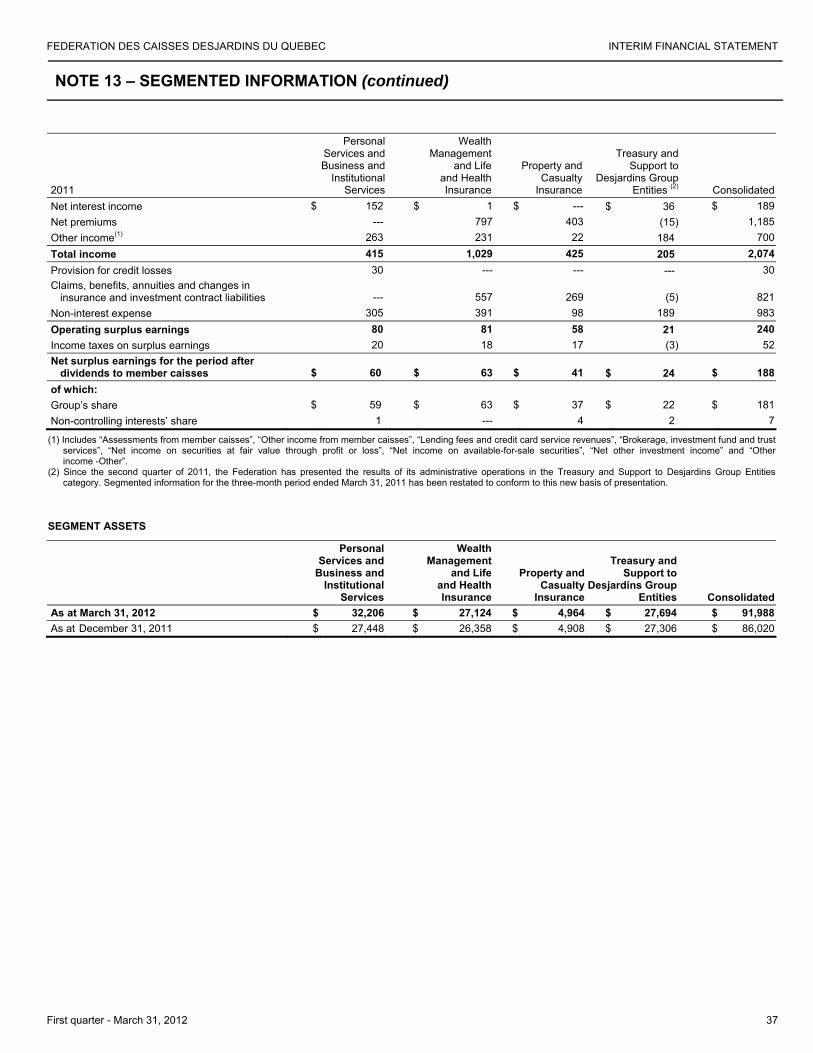
07.05.2012
Fédération des caisses Desjardins du Québec 18
NOTE 13 – SEGMENTED INFORMATION (continued)
2011
Personal Services and Business and
Institutional Services
Wealth Management
and Life and Health Insurance
Property and Casualty
Insurance
Treasury and Support to
Desjardins Group Entities (2) Consolidated
Net interest income $ 152 $ 1 $ --- $ 36 $ 189Net premiums --- 797 403 (15) 1,185Other income(1) 263 231 22 184 700Total income 415 1,029 425 205 2,074Provision for credit losses 30 --- --- --- 30Claims, benefits, annuities and changes in
insurance and investment contract liabilities --- 557 269 (5) 821Non-interest expense 305 391 98 189 983Operating surplus earnings 80 81 58 21 240Income taxes on surplus earnings 20 18 17 (3) 52Net surplus earnings for the period after
dividends to member caisses $ 60 $ 63 $ 41 $ 24 $ 188of which: Group’s share $ 59 $ 63 $ 37 $ 22 $ 181Non-controlling interests’ share 1 --- 4 2 7
(1) Includes “Assessments from member caisses”, “Other income from member caisses”, “Lending fees and credit card service revenues”, “Brokerage, investment fund and trust services”, “Net income on securities at fair value through profit or loss”, “Net income on available-for-sale securities”, “Net other investment income” and “Other income -Other”.
(2) Since the second quarter of 2011, the Federation has presented the results of its administrative operations in the Treasury and Support to Desjardins Group Entities category. Segmented information for the three-month period ended March 31, 2011 has been restated to conform to this new basis of presentation.
SEGMENT ASSETS
Personal Services and
Business and Institutional
Services
Wealth Management
and Life and Health Insurance
Property and Casualty
Insurance
Treasury and Support to
Desjardins Group Entities Consolidated
As at March 31, 2012 $ 32,206 $ 27,124 $ 4,964 $ 27,694 $ 91,988As at December 31, 2011 $ 27,448 $ 26,358 $ 4,908 $ 27,306 $ 86,020
FEDERATION DES CAISSES DESJARDINS DU QUEBEC INTERIM FINANCIAL STATEMENT
First quarter - March 31, 2012 37