Embed Size (px)
Citation preview
First Things First
WHAT THE HECK IS AIR POLLUTION
ANYWAY?!
It is a waste—gasoline or coalthat’s incompletely burned, heat that is setloose in the air instead of being used, orpoisons like lead or mercury that shouldn’t have been there in the first place.
SO WHY SHOULD WE WORRY?
Because it kills us—not just us, buttrees and lakes, forests and streams, kidsand grandparents alike. If it is notpoisonous enough to kill us outright, ithurts us—kids miss school—which meanstheir parents must stay home from work
and lose money. People must visit doctors, emergency rooms, and stay in hospitals.
If there’s not enough to cause immediate sickness, it changes you in many smallerways—lungs start to look like those of people who smoke, arteries harden, blood pressureincreases. Some pollutants are so poisonous that they cause children to be less intelligent, maketrouble at school and home—even kill people.
As hard as it is to believe, pollution even makes the world hotter—and if gets too hot, itmay be impossible for all of us to live. Millions, even billions of people could be killed by forestfires, floods, diseases and simplythe heat itself.
WHERE IS ALL THIS
POLLUTION?
The pollution iseverywhere—in schools andschool buses, at home, in factoriesand hospitals, on desert islands,the North and South Poles, andeven mountaintops. There is somuch pollution and it movesaround so easily that avoiding it is
Figure 1 This is a picture of the Earth’s air. Nitrogen
and oxygen, make up 99 percent of the air. The other
one percent contains pollutants that make people sick,
kill forests and lakes and cause global warming.
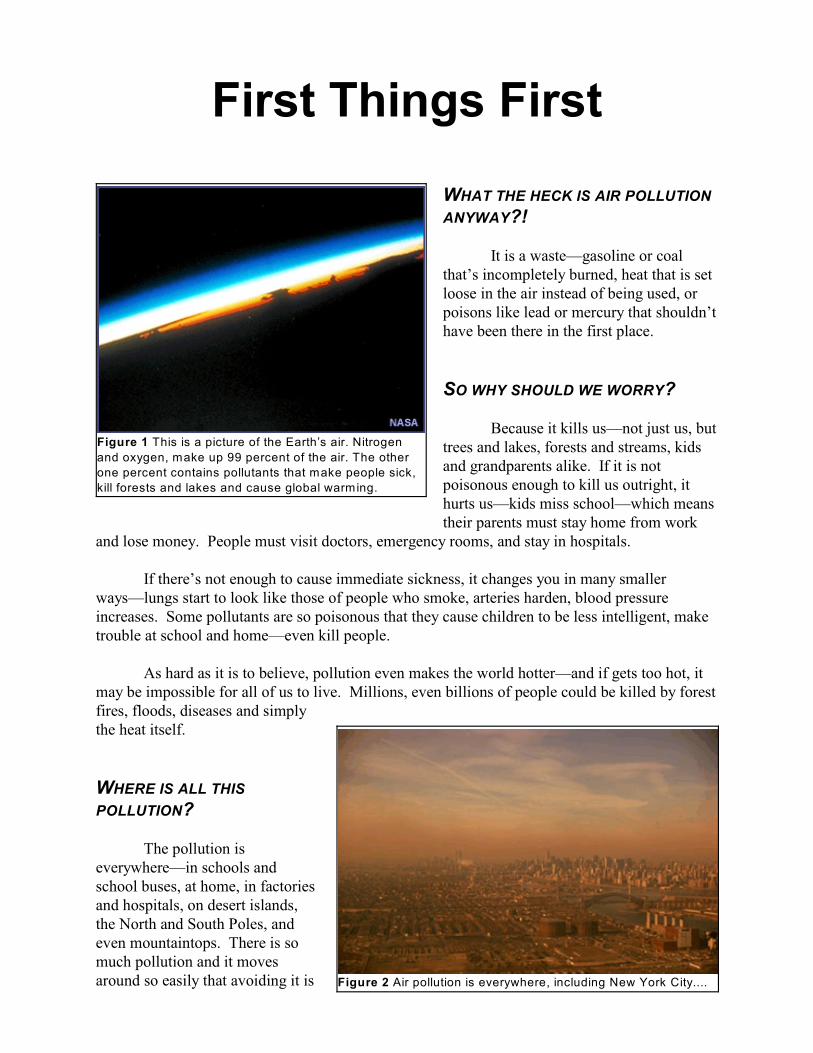
Figure 2 Air pollution is everywhere, including New York City....
impossible. Every living thing on Earth—humanbeings, plants and animals—must breathe, andwhen they do pollution enters the body. Somepollutants will burn holes in your lungs. Some passthrough the lungs, into blood, hardening arteriesand causing stroke and heart attack. Some lands onthe nerves that transmit the sense of smell to thebrain and move through them into the brain itself. This can happen within seconds in some cases,within minutes in others, but some injuries last foran entire lifetime, or end life altogether.
ARE THERE SOLUTIONS?
Yes, hundreds, even thousands of them. And since we can’t very well stop breathing, and
neither can trees or animals, the only way to protect ourselves is to stop the pollution from everbeing created.
IS THIS ABOUT STOPPING POLLUTION?
Yes. This will explain what air pollution is, where it comes from, how it hurts us, andhow to stop it. It will tell you about ways to make electricity for our homes, schools, offices andstores without any pollution, show pictures of cars and trucks that can us take us places with zeroair pollution, and ways to live without making pollution.
WHAT ARE THE AIR POLLUTANTS
AND WHERE DO THEY COME FROM?
There are three sources of airpollution:
! The air we breathe, whichtransformed by heat into pollutants.
! Heat, whether from burning fuels orfrom sunlight.
! The thing that is burned, such asgasoline or coal, together with theirimpurities.
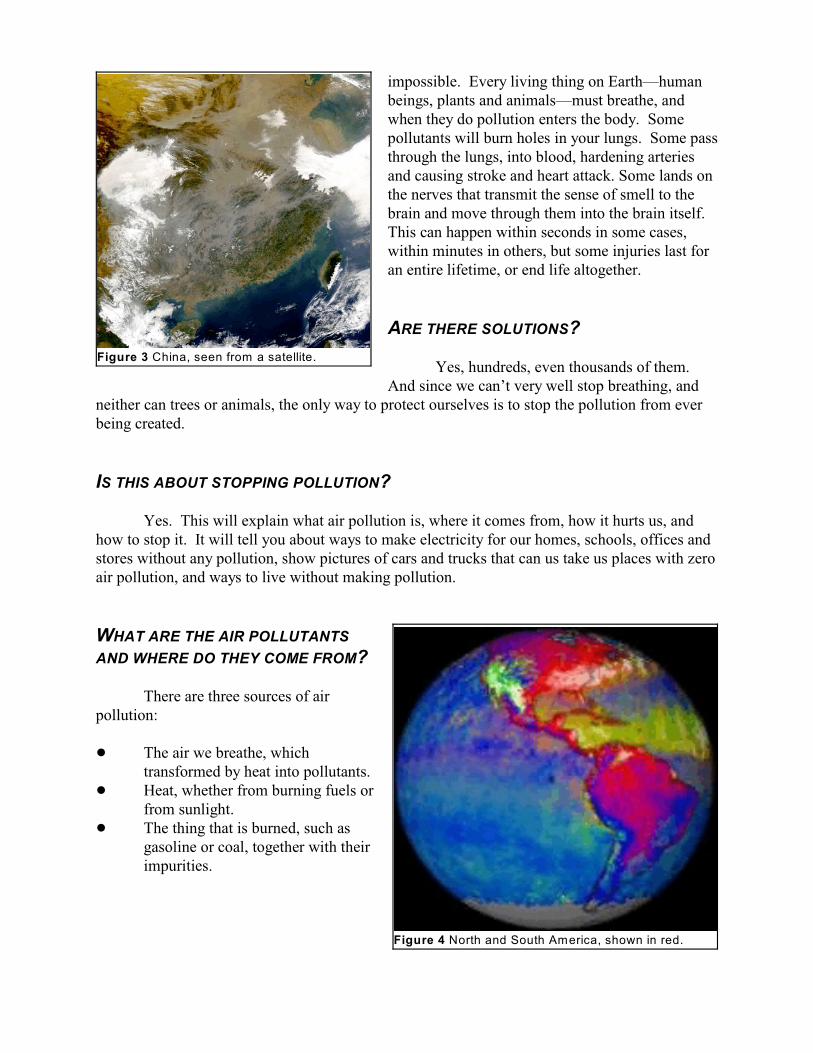
Figure 3 China, seen from a satellite.
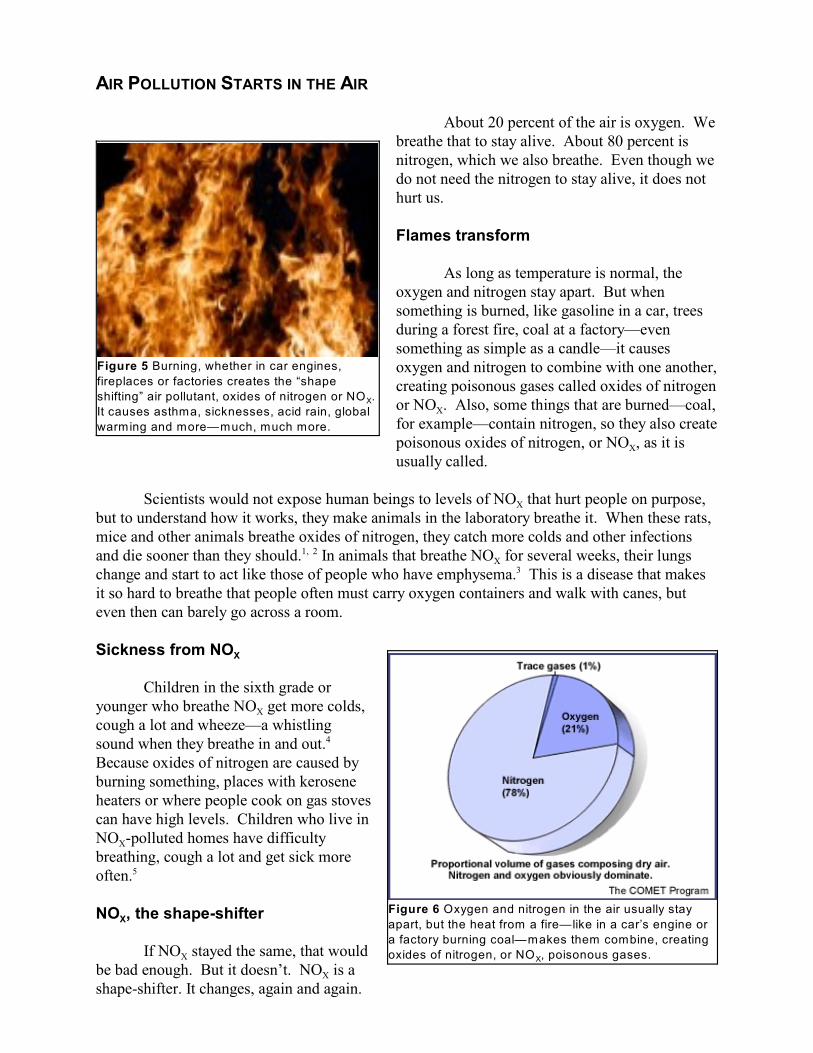
Figure 4 North and South America, shown in red.
AIR POLLUTION STARTS IN THE AIR
About 20 percent of the air is oxygen. Webreathe that to stay alive. About 80 percent isnitrogen, which we also breathe. Even though wedo not need the nitrogen to stay alive, it does nothurt us.
Flames transform
As long as temperature is normal, theoxygen and nitrogen stay apart. But whensomething is burned, like gasoline in a car, treesduring a forest fire, coal at a factory—evensomething as simple as a candle—it causesoxygen and nitrogen to combine with one another,creating poisonous gases called oxides of nitrogen
Xor NO . Also, some things that are burned—coal,for example—contain nitrogen, so they also create
Xpoisonous oxides of nitrogen, or NO , as it isusually called.
XScientists would not expose human beings to levels of NO that hurt people on purpose,but to understand how it works, they make animals in the laboratory breathe it. When these rats,mice and other animals breathe oxides of nitrogen, they catch more colds and other infections
Xand die sooner than they should. In animals that breathe NO for several weeks, their lungs1, 2
change and start to act like those of people who have emphysema. This is a disease that makes3
it so hard to breathe that people often must carry oxygen containers and walk with canes, buteven then can barely go across a room.
XSickness from NO
Children in the sixth grade or
Xyounger who breathe NO get more colds,cough a lot and wheeze—a whistlingsound when they breathe in and out.4
Because oxides of nitrogen are caused byburning something, places with keroseneheaters or where people cook on gas stovescan have high levels. Children who live in
XNO -polluted homes have difficultybreathing, cough a lot and get sick moreoften.5
XNO , the shape-shifter
XIf NO stayed the same, that would
Xbe bad enough. But it doesn’t. NO is ashape-shifter. It changes, again and again.
Figure 5 Burning, whether in car engines,
fireplaces or factories creates the “shape
Xshifting” air pollutant, oxides of nitrogen or NO .
It causes asthma, sicknesses, acid rain, global
warming and more—much, much more.
Figure 6 Oxygen and nitrogen in the air usually stay
apart, but the heat from a fire—like in a car’s engine or
a factory burning coal—makes them combine, creating
Xoxides of nitrogen, or NO , poisonous gases.
First, it turns into acids, then microscopically fine particles and finally ozone, or smog. By the
Xtime this chain of reactions halts, NO and its progeny have injured and killed humans,devastated forests and lakes, artificially enhanced plant growth—and subsequent death—in bays
Xand sounds, destroyed stratospheric ozone, and warmed the Earth. NO is truly, in the words of6 7
Dr. Bert Brunekreef of Utrecht University, “The gas that won’t go away.” For this, humanity isvastly worse off—and matters are getting worse.
XAs illness caused by NO rises, children and their parents increase visits to the first lineof defense in the medical community, general practice doctors; hospital visits for asthma,8
bronchitis, pneumonia, angina—that is the chest pain that men and women with heart problemsfeel—and heart attack all increase. So do visits to hospital emergency rooms by those aged 61 or9
older.10
New cases of asthma
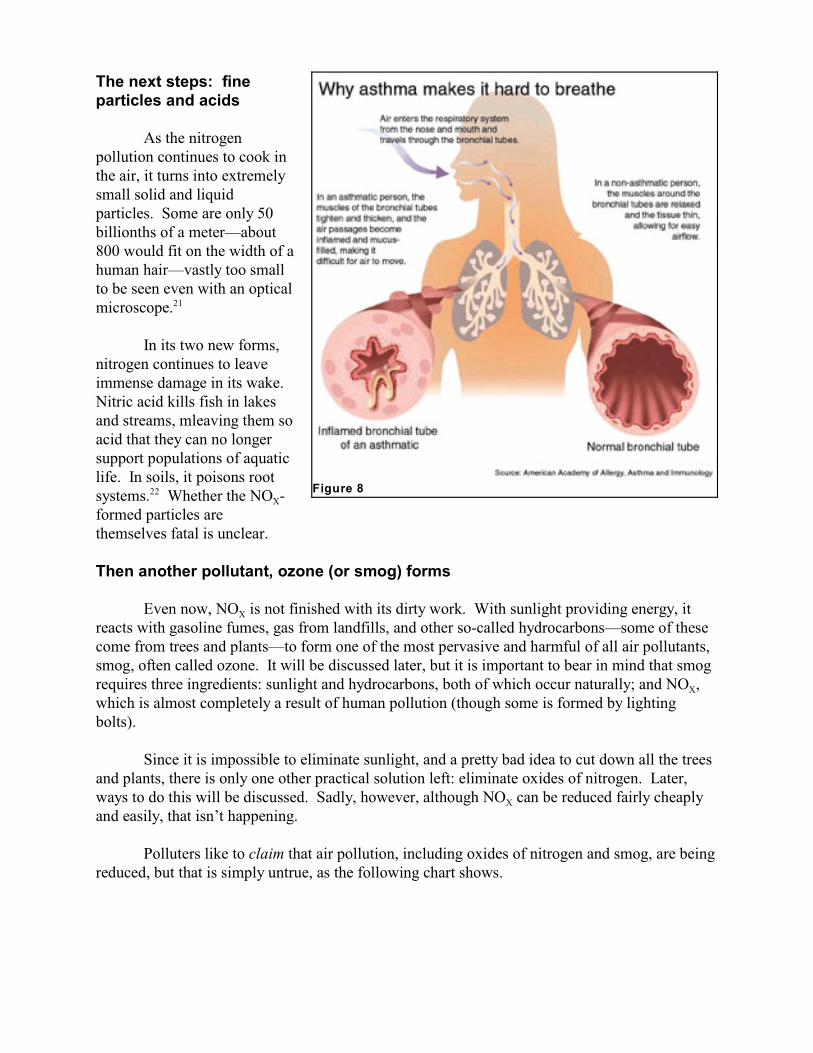
One of the most frightening developments in the past twenty or so years has been theglobal rise in asthma among children. It is described as like trying to breathe through a straw,and some studies show that oxides of nitrogen can cause asthma.
Two studies were in Taiwan, where asthma rates have more than tripled since 1973. The
Xscientists found that as NO levels increased there—and they were only about one-third of thosein Los Angeles—so did asthma rates. A third study, this one of 3- and 4-year-old children in11, 12
XMontreal, Canada showed that if mothers were heavy smokers or if NO increased, the childrenhad higher rates of asthma.13
XOnce people have developed asthma, NO triggers both day and night asthma attacks, aswell as other illnesses, such as chest tightness and breathlessness. In London at a dozen14
Xdifferent hospitals, when NO went up, so did asthma visits by children. Different researchers15
Xexamined the records of nearly 300,000 children, and again, when NO levels rose so did asthmavisits—up 13.2 percent in summer and in winter, for emphysema, bronchitis and other lowerrespiratory disease, visits jumped 27.2 percent.16
The cascade of injuries continues, bringing
2deaths. In London, when levels of NO rose, so, too, didheart-related deaths, as well as death from pneumonia inthe older people. This was also true in Rouen and Le17
2Havre, France: when NO increased, there was a 6.1percent jump in heart-related deaths, and the same was18
true in Korea where some died of heart failure and19
others from stroke.20
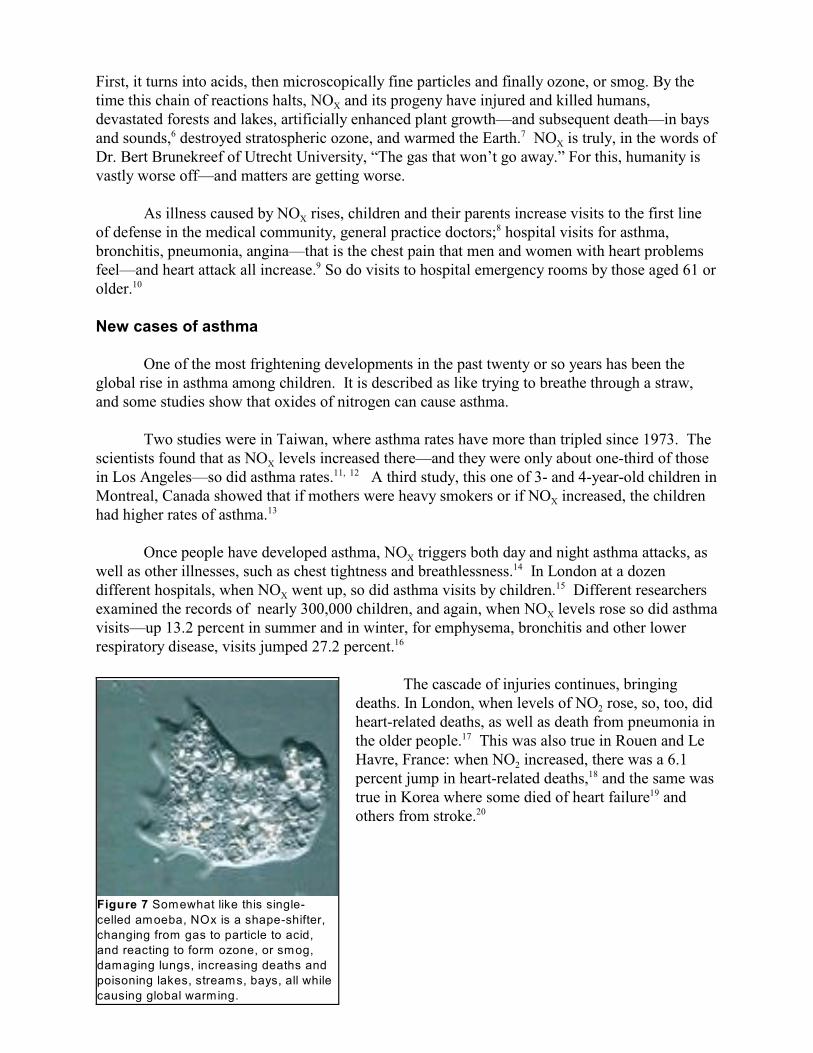
Figure 7 Somewhat like this single-
celled amoeba, NOx is a shape-shifter,
changing from gas to particle to acid,
and reacting to form ozone, or smog,
damaging lungs, increasing deaths and
poisoning lakes, streams, bays, all while
causing global warming.
The next steps: fineparticles and acids
As the nitrogenpollution continues to cook inthe air, it turns into extremelysmall solid and liquid particles. Some are only 50billionths of a meter—about800 would fit on the width of ahuman hair—vastly too smallto be seen even with an opticalmicroscope.21
In its two new forms,nitrogen continues to leaveimmense damage in its wake. Nitric acid kills fish in lakesand streams, mleaving them soacid that they can no longersupport populations of aquaticlife. In soils, it poisons root
Xsystems. Whether the NO -22
formed particles arethemselves fatal is unclear.
Then another pollutant, ozone (or smog) forms
XEven now, NO is not finished with its dirty work. With sunlight providing energy, itreacts with gasoline fumes, gas from landfills, and other so-called hydrocarbons—some of thesecome from trees and plants—to form one of the most pervasive and harmful of all air pollutants,smog, often called ozone. It will be discussed later, but it is important to bear in mind that smog
Xrequires three ingredients: sunlight and hydrocarbons, both of which occur naturally; and NO ,which is almost completely a result of human pollution (though some is formed by lightingbolts).
Since it is impossible to eliminate sunlight, and a pretty bad idea to cut down all the treesand plants, there is only one other practical solution left: eliminate oxides of nitrogen. Later,
Xways to do this will be discussed. Sadly, however, although NO can be reduced fairly cheaplyand easily, that isn’t happening.
Polluters like to claim that air pollution, including oxides of nitrogen and smog, are beingreduced, but that is simply untrue, as the following chart shows.
Figure 8
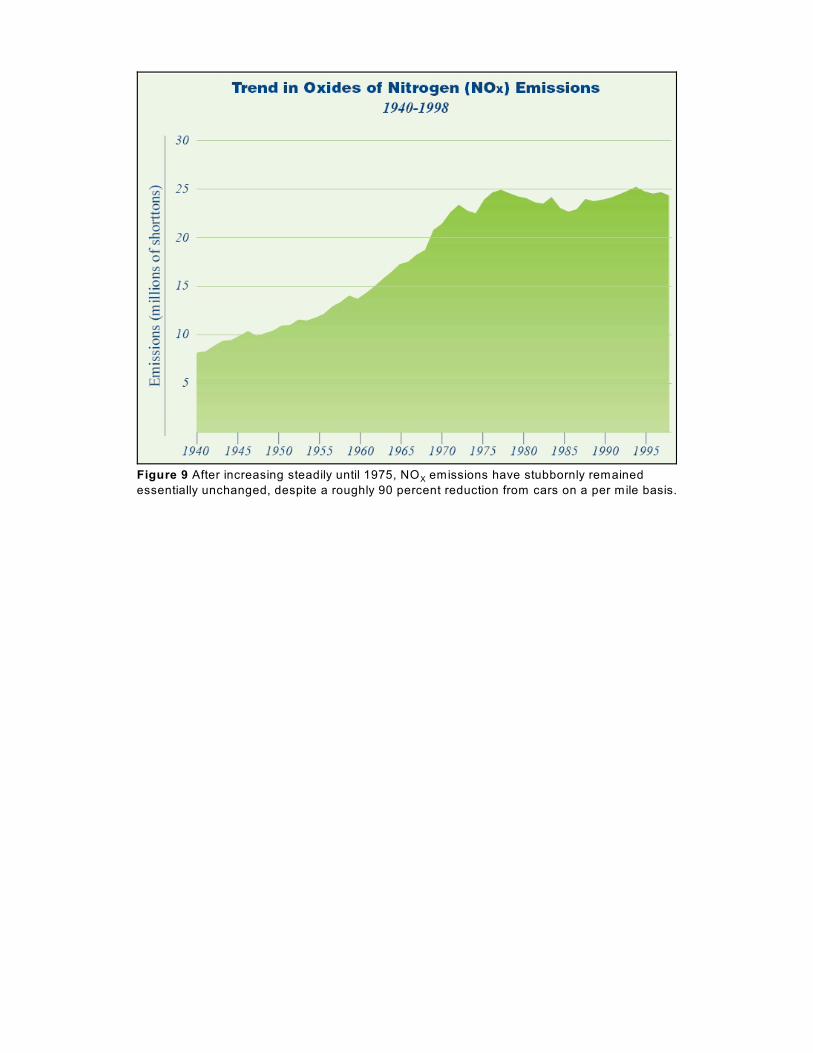
XFigure 9 After increasing steadily until 1975, NO emissions have stubbornly remained
essentially unchanged, despite a roughly 90 percent reduction from cars on a per mile basis.
1. D.E. Gardner, “Oxidant-induced Enhanced Sensitivity to Infection in Animal Models and their Extrapolations to
Man, Journal of Toxicology and Environmental Health 13 (1984): 423–39; D.E. Gardner, et al., “Influence of
2Exposure Mode on the Toxicity of NO ,” Environmental Health Perspectives 30 (1979): 23–29.
2. R.M. Rose, et al., “The Pathophysiology of Enhanced Susceptibility to Murine Cytomegalovirus Respiratory
Infection During Short-term Exposure to 5 PPM Nitrogen Dioxide,” American Review of Respiratory Disease 137
(1988): 912–17.
23. M.J. Evans, et al., “Renewal of the Terminal Bronchiolar Epithelium in the Rat Following Exposure to NO or
3O ,” Laboratory Investigation. 35 (1976): 246–57.
4. W. Harrington, et al., “Short-term Nitrogen Dioxide Exposure and Acute Respiratory Disease in Children,”
Journal of the Air Pollution Control Association 35 (1985): 1061–67.
5. L.M. Neas, et al., “Association of Indoor Nitrogen Dioxide with Respiratory Symptoms and Pulmonary Function
in Children,” American Journal of Epidemiology 135 (1991): 204–9.
6. Roughly 32 percent of the total nitrogen entering the Chesapeake Bay, the nation’s largest estuary, is from
atmospheric sources, for example. Chesapeake Bay Program, “Bay Trends and Indicators,”
http://www.chesapeakebay.net/status.cfm?sid=126. Also, Lewis Linker, Robert Thomann, “The Cross-Media Models
of the Chesapeake Bay: Defining the Boundaries of the Problem,”
http://www.epa.gov/owow/watershed/Proceed/linker.html.
X 27. Nitrogen oxides (NO = NO + NO ) do not directly affect Earth’s radiative balance, but they catalyze
tropospheric formation of ozone, which is a powerful greenhouse gas, through a sequence of reactions. United
Nations Environment Program, Intergovernmental Panel on Climate Change, Climate Change 2001:Working Group
I: The Scientific Basis, p. 4.2.3.3, http://www.grida.no/climate/ipcc_tar/wg1/141.htm.
8. [305]
Hajat, S., Anderson, H.R., Atkinson, R.W., & Haines, A.
Effects of air pollution on general practitioner consultations for upper respiratory diseases in London
Occup Environ Med 2002: 59: 294–299
Non-parametric methods of analysis of time-series data, adjusting for seasonal factors, day of the week, holiday
effects, influenza, weather, pollen concentrations and serial correlation. Data collected from London practices
2between January 1992 and December 1994. Two-day lag showed greatest effects. 10 –90 percentile change in SOth th
(13–31 micrograms/m ) resulted in 3.5 percent increase in childhood consultations. For the 10 –90 percentile3 th th
10change (16–47 micrograms/m ) in PM in adults aged 15–64, there was a 5.7 percent increase, and in adults over 653
2 10years, there was a 10.2 percent increase. Effects of NO closely followed the effects for PM . Authors point out that
although the effects are relatively small, the impact on demand for services could be considerable.
9. [50, 317]
Ye, F., Piver, W.T., Ando, M., & Portier, C.J.
Effects of temperature and air pollutants on cardiovascular and respiratory diseases for males and females older than
65 years of age in Tokyo, July and August 1980–1995
Environmental Health Perspectives 109; 355–359 (2001)
10. [485]
Bates, D.V., Baker--Anderson, M., & Sizto, R.
Asthma attack periodicity: a study of hospital emergency visits in Vancouver
Environmental Research 51; 51–70; 1990
All visits to the Emergency Departments of nine hospitals serving just under 1 million people in Greater Vancouver,
were logged from July 1 1984 to October 31 1996. There were about 25,000 visits a month in all age groups; 2.7st st
percent were for respiratory conditions and of these, 41.3 percent were for asthma. Data from 11 continuously
2 2 3operating monitoring stations also tabulated on a daily basis, giving mean hourly values for SO , NO , and O . Daily
aerosol sulphate recorded at one station. Principal findings were:
1. There was a peak in asthma visits affecting children and the 15–60 age group but not those over 60, which
occurred in the third week of September each year, causing at least a doubling of weekly visits for a three-week
period. This was not related to temperature changes or to peaks in air pollutants. No cause could be identified.
2 42. In summer, asthma visits in the 15–60 age group are associated with SO and SO levels.
23. In winter, all respiratory visits but not asthma alone, are correlated with SO levels on the same day, and lagged
24 hours and 48 hours.
24. In the 61+ age group, NO levels were related to respiratory visits on the same day, and lagged 24 and 48 hours
2in the winter; asthma visits were also related to SO .
5. Respiratory visits were unrelated to temperature changes, but varied seasonally.
2 26. The correlation coefficients between SO and NO levels were 0.67 in May–October, and 0.61 in
November–April.
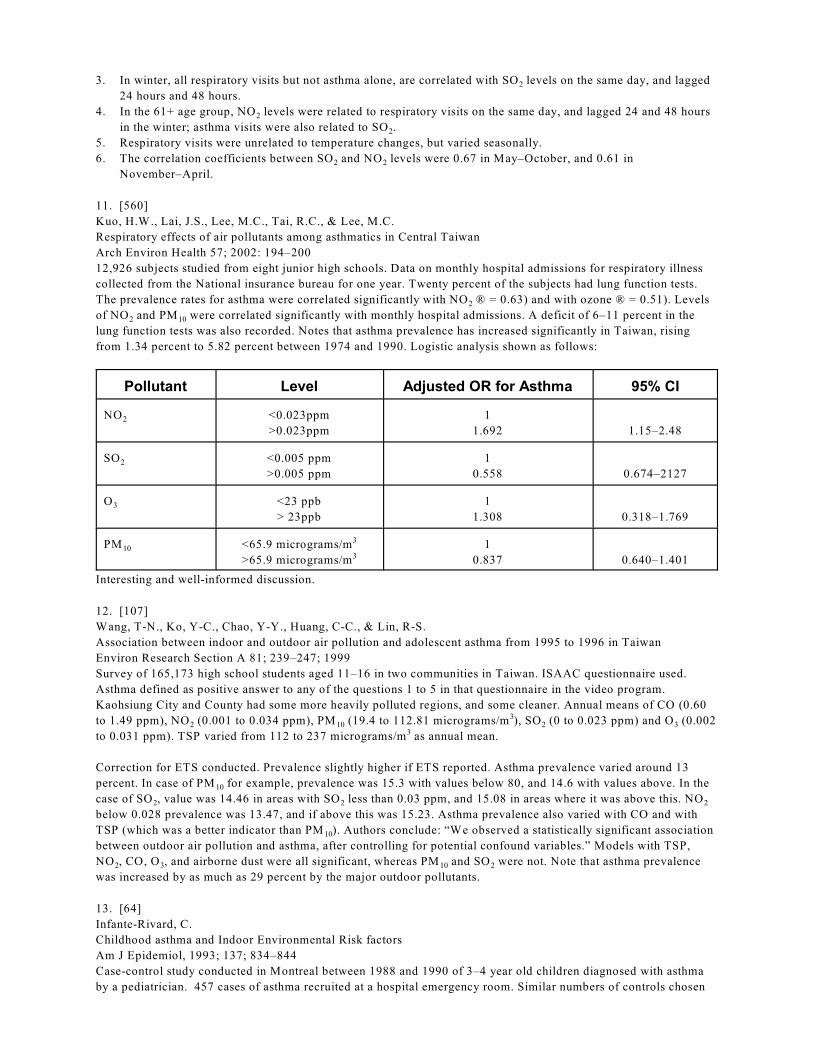
11. [560]
Kuo, H.W., Lai, J.S., Lee, M.C., Tai, R.C., & Lee, M.C.
Respiratory effects of air pollutants among asthmatics in Central Taiwan
Arch Environ Health 57; 2002: 194–200
12,926 subjects studied from eight junior high schools. Data on monthly hospital admissions for respiratory illness
collected from the National insurance bureau for one year. Twenty percent of the subjects had lung function tests.
2The prevalence rates for asthma were correlated significantly with NO ® = 0.63) and with ozone ® = 0.51). Levels
2 10of NO and PM were correlated significantly with monthly hospital admissions. A deficit of 6–11 percent in the
lung function tests was also recorded. Notes that asthma prevalence has increased significantly in Taiwan, rising
from 1.34 percent to 5.82 percent between 1974 and 1990. Logistic analysis shown as follows:
Pollutant Level Adjusted OR for Asthma 95% CI
2NO <0.023ppm
>0.023ppm
1
1.692 1.15–2.48
2SO <0.005 ppm
>0.005 ppm
1
0.558 0.674–2127
3O <23 ppb
> 23ppb
1
1.308 0.318–1.769
10PM <65.9 micrograms/m3
>65.9 micrograms/m3
1
0.837 0.640–1.401
Interesting and well-informed discussion.
12. [107]
Wang, T-N., Ko, Y-C., Chao, Y-Y., Huang, C-C., & Lin, R-S.
Association between indoor and outdoor air pollution and adolescent asthma from 1995 to 1996 in Taiwan
Environ Research Section A 81; 239–247; 1999
Survey of 165,173 high school students aged 11–16 in two communities in Taiwan. ISAAC questionnaire used.
Asthma defined as positive answer to any of the questions 1 to 5 in that questionnaire in the video program.
Kaohsiung City and County had some more heavily polluted regions, and some cleaner. Annual means of CO (0.60
2 10 2 3to 1.49 ppm), NO (0.001 to 0.034 ppm), PM (19.4 to 112.81 micrograms/m ), SO (0 to 0.023 ppm) and O (0.0023
to 0.031 ppm). TSP varied from 112 to 237 micrograms/m as annual mean.3
Correction for ETS conducted. Prevalence slightly higher if ETS reported. Asthma prevalence varied around 13
10percent. In case of PM for example, prevalence was 15.3 with values below 80, and 14.6 with values above. In the
2 2 2case of SO , value was 14.46 in areas with SO less than 0.03 ppm, and 15.08 in areas where it was above this. NO
below 0.028 prevalence was 13.47, and if above this was 15.23. Asthma prevalence also varied with CO and with
10TSP (which was a better indicator than PM ). Authors conclude: “We observed a statistically significant association
between outdoor air pollution and asthma, after controlling for potential confound variables.” Models with TSP,
2 3 10 2NO , CO, O , and airborne dust were all significant, whereas PM and SO were not. Note that asthma prevalence
was increased by as much as 29 percent by the major outdoor pollutants.
13. [64]
Infante-Rivard, C.
Childhood asthma and Indoor Environmental Risk factors
Am J Epidemiol, 1993; 137; 834–844
Case-control study conducted in Montreal between 1988 and 1990 of 3–4 year old children diagnosed with asthma
by a pediatrician. 457 cases of asthma recruited at a hospital emergency room. Similar numbers of controls chosen
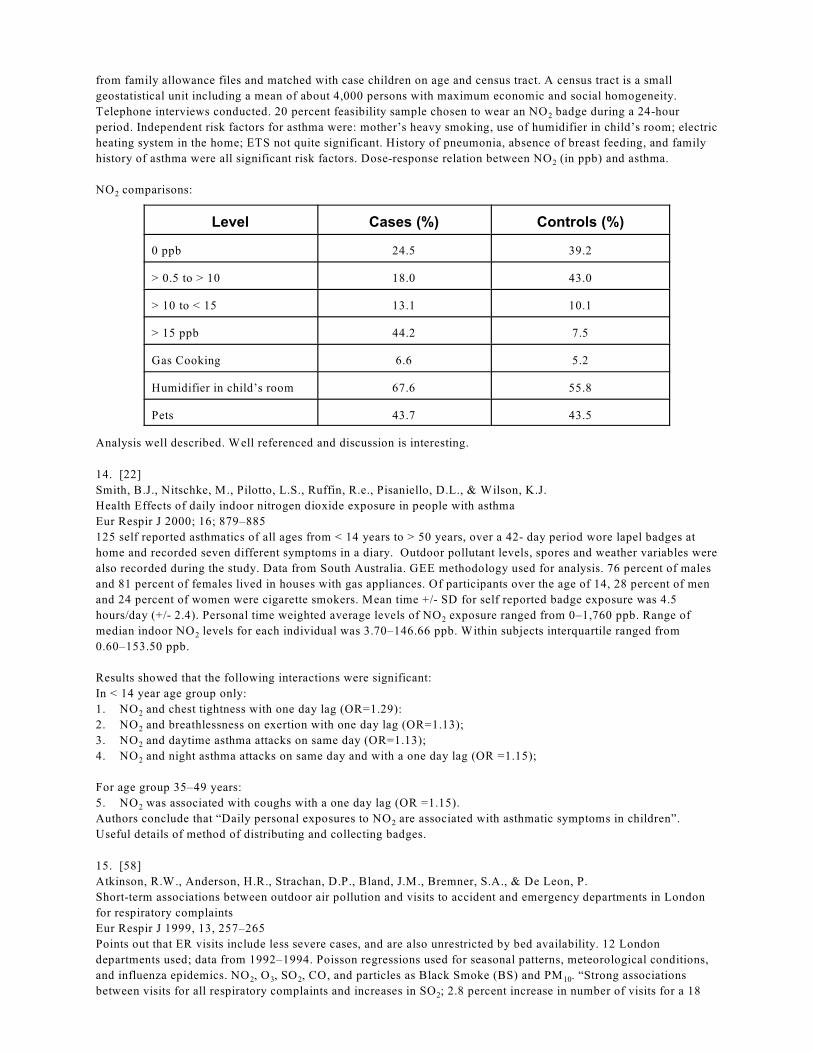
from family allowance files and matched with case children on age and census tract. A census tract is a small
geostatistical unit including a mean of about 4,000 persons with maximum economic and social homogeneity.
2Telephone interviews conducted. 20 percent feasibility sample chosen to wear an NO badge during a 24-hour
period. Independent risk factors for asthma were: mother’s heavy smoking, use of humidifier in child’s room; electric
heating system in the home; ETS not quite significant. History of pneumonia, absence of breast feeding, and family
2history of asthma were all significant risk factors. Dose-response relation between NO (in ppb) and asthma.
2NO comparisons:
Level Cases (%) Controls (%)
0 ppb 24.5 39.2
> 0.5 to > 10 18.0 43.0
> 10 to < 15 13.1 10.1
> 15 ppb 44.2 7.5
Gas Cooking 6.6 5.2
Humidifier in child’s room 67.6 55.8
Pets 43.7 43.5
Analysis well described. Well referenced and discussion is interesting.
14. [22]
Smith, B.J., Nitschke, M., Pilotto, L.S., Ruffin, R.e., Pisaniello, D.L., & Wilson, K.J.
Health Effects of daily indoor nitrogen dioxide exposure in people with asthma
Eur Respir J 2000; 16; 879–885
125 self reported asthmatics of all ages from < 14 years to > 50 years, over a 42- day period wore lapel badges at
home and recorded seven different symptoms in a diary. Outdoor pollutant levels, spores and weather variables were
also recorded during the study. Data from South Australia. GEE methodology used for analysis. 76 percent of males
and 81 percent of females lived in houses with gas appliances. Of participants over the age of 14, 28 percent of men
and 24 percent of women were cigarette smokers. Mean time +/- SD for self reported badge exposure was 4.5
2hours/day (+/- 2.4). Personal time weighted average levels of NO exposure ranged from 0–1,760 ppb. Range of
2median indoor NO levels for each individual was 3.70–146.66 ppb. Within subjects interquartile ranged from
0.60–153.50 ppb.
Results showed that the following interactions were significant:
In < 14 year age group only:
21. NO and chest tightness with one day lag (OR=1.29):
22. NO and breathlessness on exertion with one day lag (OR=1.13);
23. NO and daytime asthma attacks on same day (OR=1.13);
24. NO and night asthma attacks on same day and with a one day lag (OR =1.15);
For age group 35–49 years:
25. NO was associated with coughs with a one day lag (OR =1.15).
2Authors conclude that “Daily personal exposures to NO are associated with asthmatic symptoms in children”.
Useful details of method of distributing and collecting badges.
15. [58]
Atkinson, R.W., Anderson, H.R., Strachan, D.P., Bland, J.M., Bremner, S.A., & De Leon, P.
Short-term associations between outdoor air pollution and visits to accident and emergency departments in London
for respiratory complaints
Eur Respir J 1999, 13, 257–265
Points out that ER visits include less severe cases, and are also unrestricted by bed availability. 12 London
departments used; data from 1992–1994. Poisson regressions used for seasonal patterns, meteorological conditions,
2 3 2 10and influenza epidemics. NO , O , SO , CO, and particles as Black Smoke (BS) and PM . “Strong associations
2between visits for all respiratory complaints and increases in SO ; 2.8 percent increase in number of visits for a 18
10microgram increases, and a 3.0 percent increase for a 31 microgram/m increase in PM . Also significant3
2 2 10 3associations between asthma and SO , NO and PM . No associations with O . Authors conclude there is a linkage.
Map of hospital locations given. Daily visits hover between about 50 and 150; asthma visits are between 10 & 30,
2half of which are for age group 0–14. SO level mean was 21.2 micrograms/m for a 24-hour average (8.05 ppb).3
2Unexpectedly strong association between asthma visits for children and NO , this being very strong for the warm
season. Detailed tabulated data presented. Emphasize that the sample was larger than in most studies; that the
complaint used in the study was that stated by the subject on presentation and did not represent the clinical diagnosis
2 2after assessment in the ER; also note that “The associations with NO and SO in children presenting with asthma are
particularly strong”.
2Authors conclude that SO associations for asthma are surrogates for associations with fine sulphate particles are
incorrect. Note that CO might have been associated with cardiovascular events in the elderly as the majority of visits
by them were for the nonspecific complaint of difficulty in breathing” (68 percent).
NOTE: The strong associations with asthma would seem to “correct” the Anderson conclusion on hospital
admissions in earlier paper in Thorax.
16. [95]
Hajat, S., Haines, A., Goubet, S.a., Atkinson, R.W., & Anderson, H.R.
Association of air pollution with daily GP consultations for asthma and other lower respiratory conditions in London
Thorax 54; 597–605; 1999
Time series analysis. Between 268,718 and 295,740 registered patients in London using 45–47 practices contributing
2 10to the General Practice Research database during 1992–94. Associations found with NO , CO, and PM for asthma
2in children. In summer, for a 10 –90 percentile increase in NO lagged by one day, asthma consultations increasedth th
2 213.2 percent with NO , 11.4 percent with CO, and 9.0 percent with SO . In winter for lower respiratory disease,
2 2these percentages became NO , 7.2 percent; CO, 6.2 percent; and SO , 5.8 percent. Negative associations with ozone
noted.
10In adults, only consistent association was with PM (increase of 9.2 percent).
2 2Detailed air pollution data for different seasons. Correlation between SO and NO about 0.6 year round, and about
10 2 10 2the same between PM and SO . Correlation coefficient between PM and NO was 0.73 all year; 0.78 in summer;
and 0.69 in winter. Significant associations also noted for pollutants and consultations for patients over the age of 65.
2In summer for NO , the increase was 20 percent for asthma for the percentile gap. Note that results are likely to be
underestimates.
Important data.
17. [67]
Bremner, S.A., Anderson, H.R., Atkinson, R.W., McMichael, A.J., Strachan, D.P., Bland, & Bower, J.S.
Short term associations between outdoor air pollution and mortality in London 1992–1994
Occup Environ Med 1999; 56; 237–44
10This analysis includes PM and CO. “No significant associations were found between any pollutant and all cause
10mortality, but, with the exception of ozone, all estimates were positive.” PM had the largest effect on respiratory
2 3mortality (4 percent increase in deaths of all ages for a 10 –90 percentile increment). NO , O and black smoketh th
10 2were associated with cardiovascular deaths, but there was no evidence of a PM association. SO effect very close to
significance. Notes that the effects of ozone in the earlier study were not replicated. Pollution variables were
interesting: brackets indicate 10 –90th percentiles and max value)th
2N0 24 hour mean 33.7 ppb (22.3–46.3; 133.7)
2NO 1 hour mean 50.3 ppb (34.3–70.3; 224.3)
30 8 hr mean 17.5 (4.4–30.1; 79.9)
3O 1 hr. ppb mean 22.6 (6.0–36.5; 98.5)
2SO 24 hr. uG/m mean 21.2 (13.0–31.0; 82.2)3
CO 24 hr. ppm mean 0.8 (0.5–1.3; 5.6)
10PM 24 hr. uG/m mean 28.5; (15.8–46.5; 99.8)3
BS 24 hr uG/m mean 12.7; (5.5–21.6; 69.8)3
Xpneumonia mortality in the elderly associated with NO .
18. [210]
Zeghnoun, A., Czernichow, P., Beaudeau, P., Hautemaniere, A., Froment, L., Le Tertre, a., & Quenel, P.
Short-term effects of air pollution on mortality in the cities of Rouen and Le Havre, France, 1990–1995
Arch Environ Health 56; 327–35,2001
In Rouen, interquartile range increase of 60.5–94.1 micrograms/m of ozone was associated with a 4.1 percent3
2increase in total mortality; SO (interquartile range17.6–36.4 microgram/m ) associated with an 8.2 percent increase3
2in respiratory mortality; NO ( interquartile range 25.3–42.2 micrograms/m ) associated with a 6.1 percent increase3
2in cardiovascular mortality. In Le Havre, SO (interquartile range 11.3–35.6 micrograms/m ) was associated with a 33
percent increase in cardiovascular mortality. Also an increase in cardiovascular mortality was associated with
particulate pollution (PM less than or equal to 13 microns). Analysis used two pollutant models. Note problems of
high collinearity between pollutants. Note that the region of Haute-Normandie where these cities are, is one of the
most highly industrialized areas in France. Daily mortality in Rouen in summer averaged 9.58 and in winter 10.37; in
Le Havre the figures were 6.00 and 6.67. Cardiovascular mortality was 4 times greater than respiratory in both cities.
13 2 2PM and NO correlation coefficients were 0.58; and with SO 0.68; ozone was not correlated with any other
pollutant. Note that the degree of temporal smoothing had a considerable influence on the indices.
19. [130]
Kwon, H-J., Cho, S-H., Nyberg, F., & Pershagen, G.
Effects of ambient air pollution on daily mortality in a cohort of patients with congestive heart failure
Epidemiology 2001: 12; 413–19
Comparison between the general population and a cohort of patients with congestive heart failure. These were
hospital admissions with a primary discharge diagnosis of congestive heart failure from a medical insurance file in
Seoul for the period 1994 to 1996. This program covers 96 percent of the population. Daily number of deaths
averaged 90.4 per day, and of patients with congestive heart failure averaged 1.0 per day. 694 male and 1,113 female
patients with congestive heart failure.
10 2Pollutant data :24 hour averages were PM mean 68.7 with 90 percentile of 109.6; C0 (100 ppb) mean12.4; NOth
2ppb 24 hour mean 31.7 with 90 percentile of 46.0; SO ppb mean 13.4 with 90 percentile of 25.1. One hour ozoneth th
in ppb as maximal hourly mean was 31.8 with 90 percentile of 55.0.th
2 10 2 2 10Correlation coefficients showed NO & PM = 0.775; CO and NO 0.744; and SO and PM was 0.699.
Effects of pollutants were 2.5 to 4.1 times higher (depending on the pollutant) in the congestive heart failure cases
than in the general population. Odds ratios for the general population were:
10 2For 42.1 micrograms/m of PM = 1.014; for 0.59 ppm of CO = 1.022; for 14.6 ppb of NO = 1.021; for 9.9 ppb of3
2SO = 1.020; and for 20.5 ppb of ozone = 1.010.
The authors conclude: “The finding of a stronger association in the patients with congestive heart failure reinforces
the evidence that a harmful effect of air pollution is mediated by cardiovascular mechanisms.” Odds ratios for the
10 2 2 3cases were PM =1.058; CO = 1.054; NO = 1.065; SO = 1.070; and O = 1.034.
20. [282]
Hong, Y-C., Lee, J-T., Kim, H., Ha, E-H., Schwartz, J., & Christiani, D.C.
Effects of air pollutants on acute stroke mortality
Environ Health Perspectives 110; 187–91 (2002)
Data from Seoul, Korea over a 4-year period. 20 automated sampling stations. Daily 24-hour mean values calculated
of all pollutants, but 8-hour average used for ozone. Time-series with generalized additive model. Increase of 1.5
10percent in stroke mortality associated with PM interquartile range; also increase of 2.9 percent associated with
2 2increase in ozone concentrations on the same day. Associations also with NO (3.1 percent), SO (2.9 percent), and
CO (4.1 percent) for each interquartile range of pollutant. Analysis showed that the pollutants were interactive with
10respect to their effects on stroke mortality. Stronger associations for PM in the elderly and in women than in other
groups. Occurrence of “harvesting” considered possible.
21. Tolocka, M.P. et. al. Ultrafine nitrate particle events in Baltimore observed by real-time single particle mass
spectrometry. Atmos. Env. Volume 38, Issue 20, June 2004.
Ambient particles in Baltimore, Maryland were characterized from April through November 2002 using the real-time
single particle mass spectrometer, RSMS III. When particles containing nitrate were examined, two types of ultrafine
particle events were revealed: a large burst of nominally “pure” nitrate particles in the 50–90 nm size range, and a
smaller (and less frequent) burst of “pure” particles in the 50–90 nm size range that grew to 110–220 nm with time.
Coincident with both of these events was an increase in the number of mixed composition particles containing
nitrate, suggesting that they were formed by condensation of ammonium nitrate onto pre-existing particles.
Meteorological variables, particle number concentrations and continuous nitrate mass measurements were compared
to the single particle data. Number and mass concentrations estimated from RSMS III correlated well with similar
measurements with other techniques. Ultrafine nitrate particle events were observed during periods of low
temperature and high relative humidity as expected from ammonium nitrate equilibrium considerations. During these
events, the partitioning of ammonium nitrate to the particle phase strongly influenced the particle number
concentration as well as the chemical composition.
22. Cronan, C.S & Schofield, C.L.
Aluminum Leaching Response to Acid Precipitation: Effects on High-Elevation Watersheds in the Northeast.
Science 20 April 1979: Vol. 204. no. 4390, pp. 304–306.
Atmospheric inputs of sulfuric acid and nitric acid to noncalcareous higher-elevation watersheds in the White
Mountain and Adirondack regions lead to comparatively high concentrations of dissolved aluminum in surface and
ground waters. This phenomenon appears to result from modern increases in soil aluminum leaching. Transport of
this aluminum to acidified lakes can lead to fish mortality. Combined results from areas of silicate bedrock in the
United States and Europe suggest that aluminum represents an important biogeochemical linkage between terrestrial
and aquatic environments exposed to acid precipitation.