Embed Size (px)
Citation preview
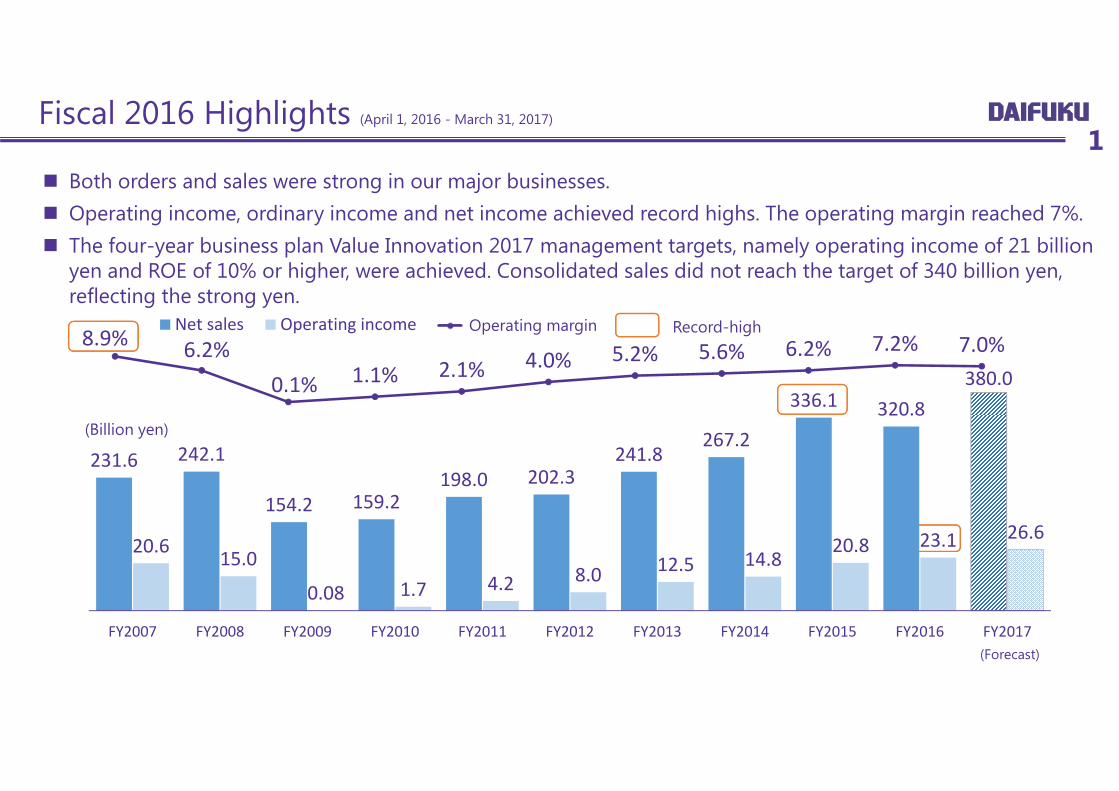
Fiscal 2016 Highlights (April 1, 2016 - March 31, 2017)
Both orders and sales were strong in our major businesses. Operating income, ordinary income and net income achieved record highs. The operating margin reached 7%. The four-year business plan Value Innovation 2017 management targets, namely operating income of 21 billion
yen and ROE of 10% or higher, were achieved. Consolidated sales did not reach the target of 340 billion yen, reflecting the strong yen.
1
8.9% 6.2%0.1% 1.1% 2.1% 4.0% 5.2% 5.6% 6.2% 7.2% 7.0%
Operating margin Record-high
(Forecast)
(Billion yen)
231.6 242.1
154.2 159.2 198.0 202.3
241.8 267.2
336.1 320.8380.0
20.6 15.0
0.08 1.7 4.2 8.0 12.5 14.8 20.8 23.1 26.6
FY2007 FY2008 FY2009 FY2010 FY2011 FY2012 FY2013 FY2014 FY2015 FY2016 FY2017
Net sales Operating income
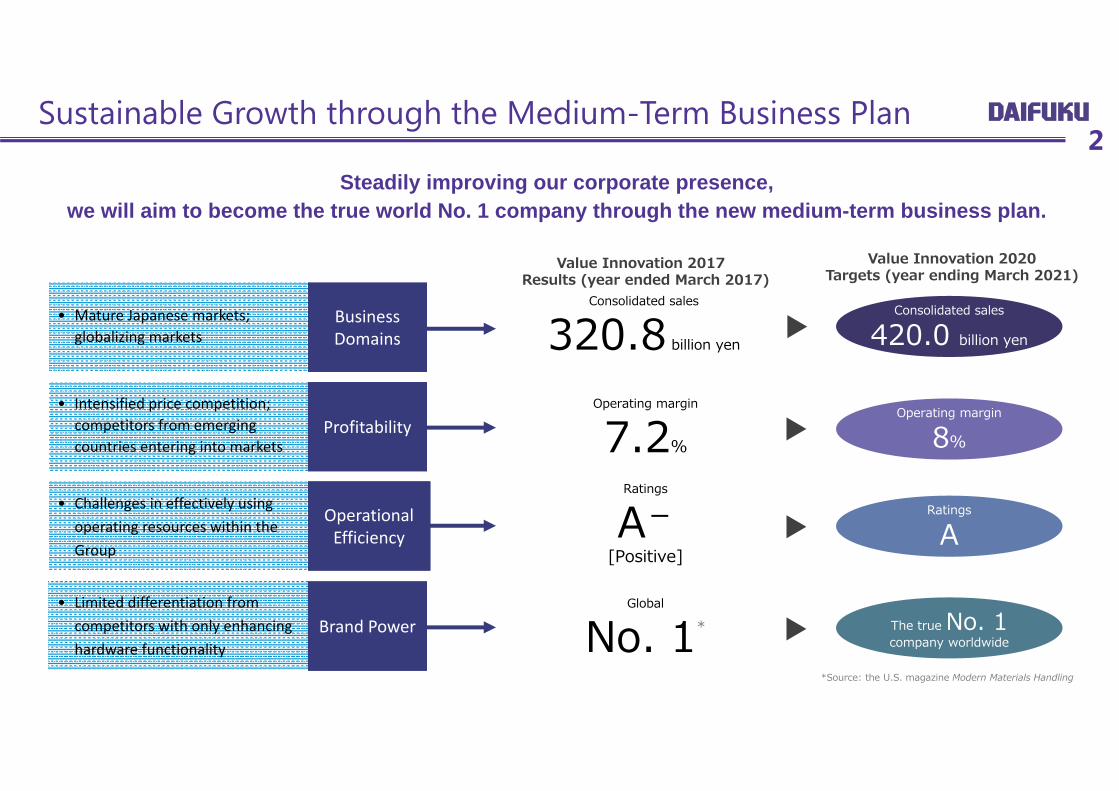
Sustainable Growth through the Medium-Term Business Plan2
Steadily improving our corporate presence, we will aim to become the true world No. 1 company through the new medium-term business plan.
Global
No. 1*
Operating margin
7.2%
Consolidated sales
320.8 billion yen
Ratings
A-[Positive]
Business DomainsBusiness Domains
ProfitabilityProfitability
Brand PowerBrand Power
Operational EfficiencyOperational Efficiency
Consolidated sales
420.0 billion yen
Operating margin
8%
The true No. 1 company worldwide
Ratings
A
Value Innovation 2020Targets (year ending March 2021)
Value Innovation 2017Results (year ended March 2017)
*Source: the U.S. magazine Modern Materials Handling
• Intensified price competition; competitors from emerging countries entering into markets
• Mature Japanese markets; globalizing markets
• Limited differentiation from competitors with only enhancing hardware functionality
• Challenges in effectively using operating resources within the Group
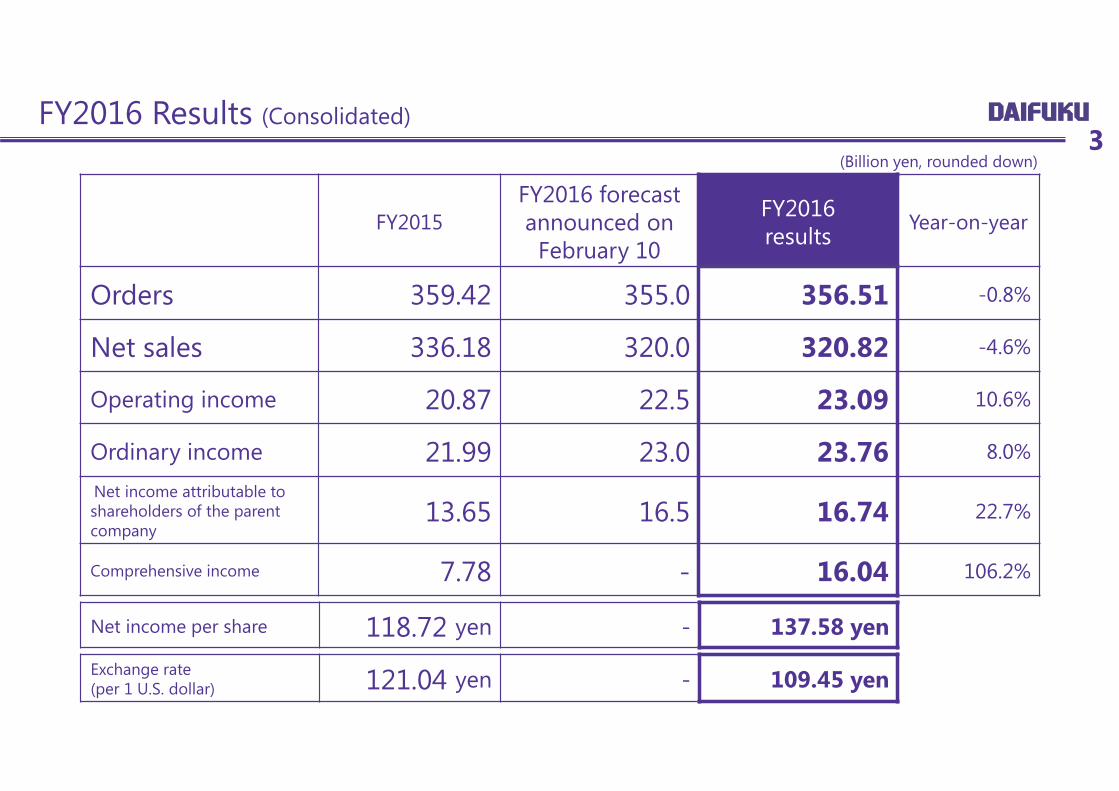
FY2015FY2016 forecastannounced on
February 10
FY2016results Year-on-year
Orders 359.42 355.0 356.51 -0.8%
Net sales 336.18 320.0 320.82 -4.6%
Operating income 20.87 22.5 23.09 10.6%
Ordinary income 21.99 23.0 23.76 8.0%
Net income attributable to shareholders of the parent company
13.65 16.5 16.74 22.7%
Comprehensive income 7.78 - 16.04 106.2%
FY2016 Results (Consolidated)
Exchange rate(per 1 U.S. dollar) 121.04 yen - 109.45 yen
3(Billion yen, rounded down)
Net income per share 118.72 yen - 137.58 yen

Orders Net sales Net incomeFY2015 FY2016 FY2015 FY2016 FY2015 FY2016
Daifuku 142.13 171.17 144.98 145.86 8.46 13.31
Contec 14.76 15.62 15.15 15.45 0.58 0.72Daifuku North America *1 95.71 88.81 77.06 79.06 1.50 3.53Daifuku Plusmore *2 12.38 11.32 12.28 11.46 0.14 0.11
Other 94.42 69.58 81.79 68.78 3.23 2.28Consolidated adjustment and other
- - 4.89 0.19 -0.28 -3.22
Total 359.42 356.51 336.18 320.82 13.65 16.74
FY2016 Results by Segment4
(Billion yen, rounded down)

Consolidated Balance Sheets
FY2015 FY2016 Change
Current liabilities 115.03 126.06 11.03Notes and accounts payable 57.96 59.11 1.15Short-term borrowings 8.70 21.64 12.94
Other 48.36 45.30 -3.06
Non-current liabilities 50.90 35.13 -15.77Long-term borrowings and bonds
32.20 18.12 -14.07
Other 18.70 17.00 -1.69
Total Liabilities 165.93 161.19 -4.73
Shareholders’ equity 123.66 136.69 13.02
Common stock 15.01 15.01 -Accumulated other comprehensive income 3.38 2.39 -0.98
Non-controlling interests 3.06 3.24 0.18
Total net assets 130.11 142.34 12.22
Total liabilities and net assets 296.05 303.54 7.48
FY2015 FY2016 Change
Current assets 214.32 222.46 8.14Cash on hand and in banks 49.18 64.80 15.61
Notes and accounts receivable 131.29 124.00 -7.29
Inventories 22.09 22.85 0.76
Other 11.74 10.80 -0.94
Non-current assets 81.73 81.07 -0.65
Property, plant and equipment 32.88 33.58 0.70
Intangible assets 17.07 15.43 -1.64
Goodwill 11.18 9.88 -1.29
Other 5.89 5.54 -0.34Investments and other assets 31.77 32.05 0.27
Total assets 296.05 303.54 7.48
5(Billion yen, rounded down)

Consolidated Statements of Cash Flows6
FY2015 FY2016 Change
Cash flows from operating activities 7.20 26.68 19.47
Cash flows from investing activities -2.09 -5.39 -3.29
Free cash flows 5.10 21.28 16.18
Cash flows from financing activities -8.70 -4.40 4.29
Effect of exchange rate change on cash and cash equivalents -1.40 -1.17 0.22
Net increase in cash and cash equivalents -4.99 15.70 20.70
Cash and cash equivalents, beginning of the year 54.08 49.08 -4.99
Cash and cash equivalents, end of the year 49.08 64.79 15.70
(Billion yen, rounded down)

Orders and Sales by Industry (Consolidated)
Industry
Orders SalesFY2015 FY2016 FY2015 FY2016
Orders Composition Orders Composition Sales Composition Sales Composition
Automobile, auto parts 73.07 20.3% 61.87 17.4% 64.64 19.2% 60.41 18.8% Electronics 111.74 31.1% 120.50 33.8% 105.18 31.3% 98.84 30.8% Commerce, retail 60.02 16.7% 62.69 17.6% 64.68 19.2% 53.59 16.7% Transportation, warehousing 23.75 6.6% 21.75 6.1% 21.35 6.4% 19.35 6.0%
Machinery 9.59 2.7% 7.08 2.0% 9.10 2.7% 7.68 2.4% Chemicals, pharmaceuticals 14.07 3.9% 15.51 4.4% 15.34 4.6% 17.47 5.4%
Food 14.74 4.1% 15.62 4.4% 9.48 2.8% 12.47 3.9% Iron, steel, nonferrous metals 4.09 1.1% 3.21 0.9% 3.89 1.2% 3.85 1.2% Precision machinery, printing, office equipment
4.43 1.2% 4.26 1.2% 3.90 1.2% 4.78 1.5%
Airport 28.81 8.0% 31.54 8.8% 27.66 8.2% 28.31 8.8% Other 15.06 4.3% 12.43 3.4% 10.90 3.2% 14.00 4.5% Total 359.42 100.0% 356.51 100.0% 336.18 100.0% 320.82 100.0%
7(Billion yen, rounded down)
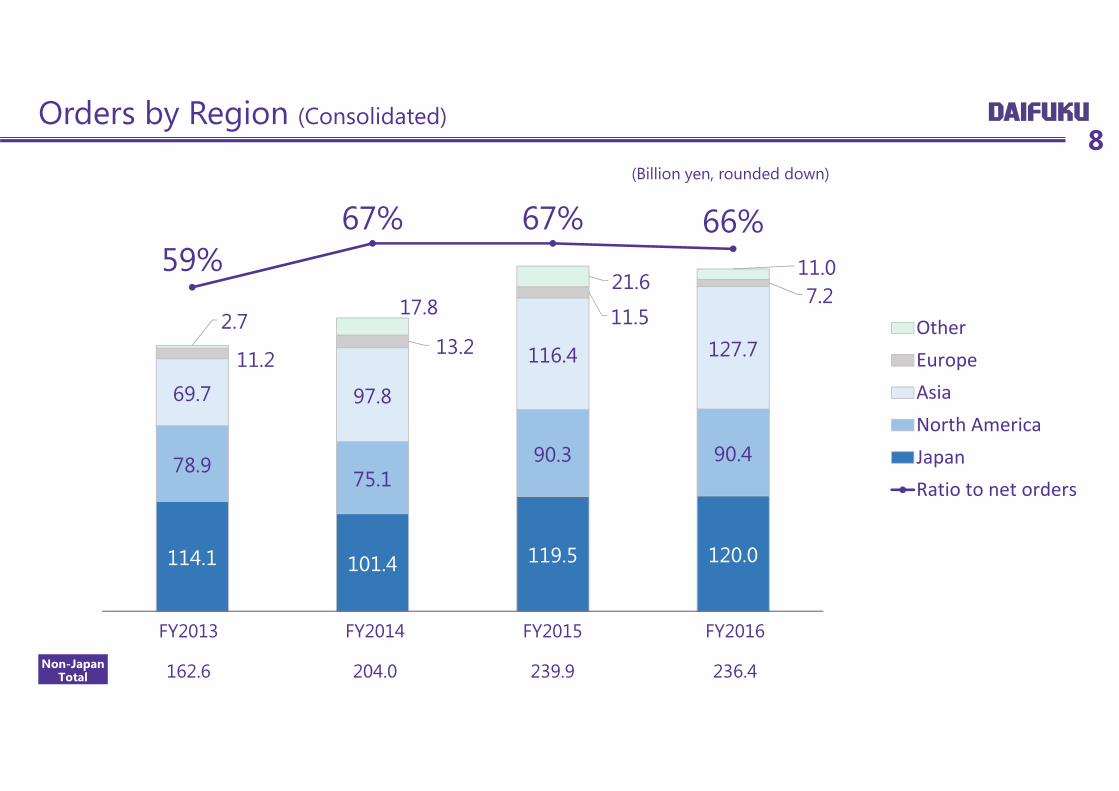
Orders by Region (Consolidated)
FY2013
162.6
FY2014
204.0
FY2015
239.9
114.1 101.4 119.5 120.0
78.9 75.1
90.3 90.4
69.7 97.8
116.4 127.7 11.2 13.2 11.5
7.2 2.7
17.8 21.6
11.0 59%67% 67% 66%
OtherEuropeAsiaNorth AmericaJapanRatio to net orders
FY2016
236.4
8(Billion yen, rounded down)
Non-Japan Total
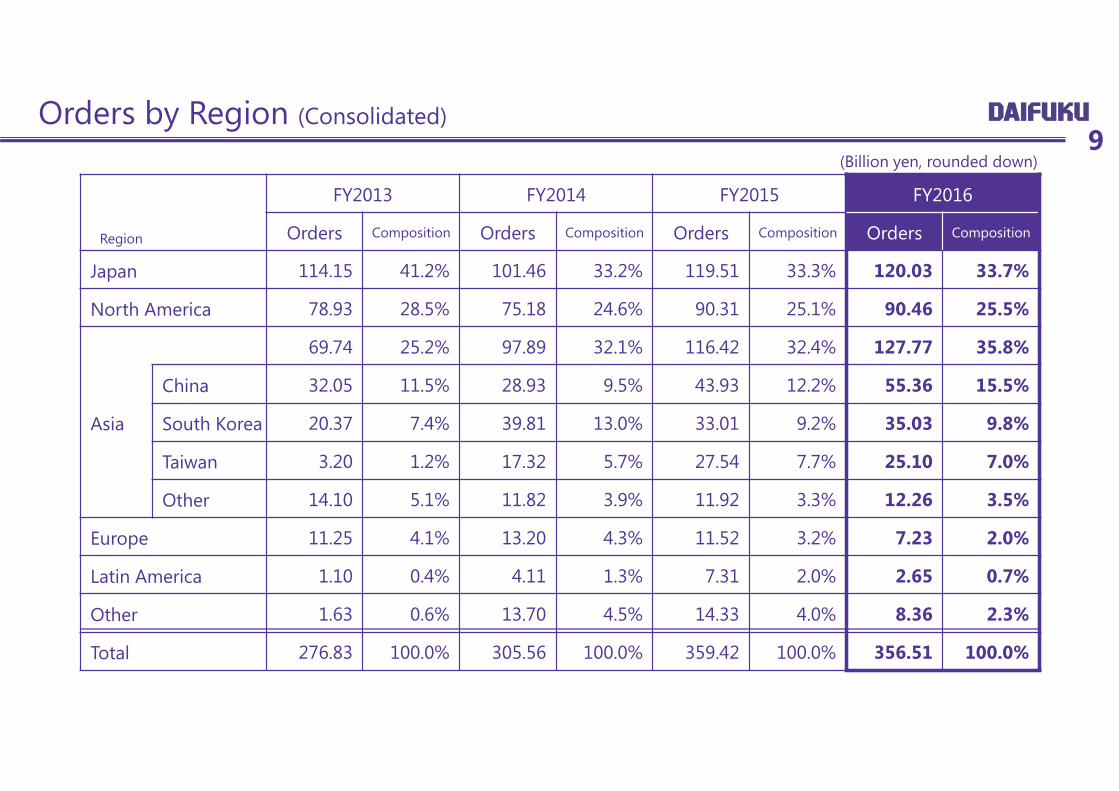
Orders by Region (Consolidated)
Region
FY2013 FY2014 FY2015 FY2016
Orders Composition Orders Composition Orders Composition Orders Composition
Japan 114.15 41.2% 101.46 33.2% 119.51 33.3% 120.03 33.7%
North America 78.93 28.5% 75.18 24.6% 90.31 25.1% 90.46 25.5%
Asia
69.74 25.2% 97.89 32.1% 116.42 32.4% 127.77 35.8%
China 32.05 11.5% 28.93 9.5% 43.93 12.2% 55.36 15.5%
South Korea 20.37 7.4% 39.81 13.0% 33.01 9.2% 35.03 9.8%
Taiwan 3.20 1.2% 17.32 5.7% 27.54 7.7% 25.10 7.0%
Other 14.10 5.1% 11.82 3.9% 11.92 3.3% 12.26 3.5%
Europe 11.25 4.1% 13.20 4.3% 11.52 3.2% 7.23 2.0%
Latin America 1.10 0.4% 4.11 1.3% 7.31 2.0% 2.65 0.7%
Other 1.63 0.6% 13.70 4.5% 14.33 4.0% 8.36 2.3%
Total 276.83 100.0% 305.56 100.0% 359.42 100.0% 356.51 100.0%
(Billion yen, rounded down)9
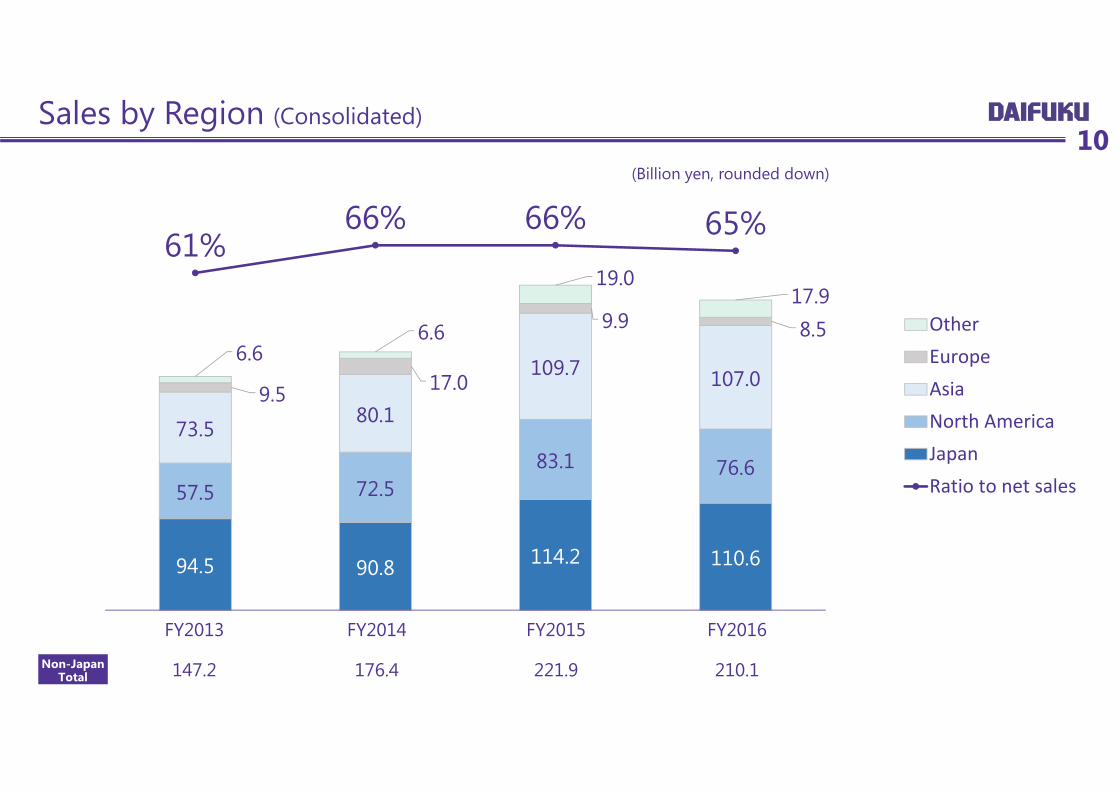
FY2013
147.2
FY2014
176.4
FY2015
221.9
94.5 90.8 114.2 110.6
57.5 72.5 83.1 76.6
73.5 80.1
109.7 107.0 9.5 17.0
9.9 8.5 6.6
6.6
19.0 17.9
61%66% 66% 65%
OtherEuropeAsiaNorth AmericaJapanRatio to net sales
FY2016
210.1
Sales by Region (Consolidated)10
(Billion yen, rounded down)
Non-Japan Total

Sales by Region (Consolidated)
Region
FY2013 FY2014 FY2015 FY2016
Sales Composition Sales Composition Sales Composition Sales Composition
Japan 94.54 39.1% 90.87 34.0% 114.21 34.0% 110.67 34.5%
North America 57.56 23.8% 72.51 27.1% 83.17 24.7% 76.62 23.9%
Asia
73.51 30.4% 80.19 30.0% 109.79 32.7% 107.00 33.3%
China 28.35 11.7% 30.50 11.4% 39.58 11.8% 36.86 11.5%
South Korea 22.28 9.2% 30.53 11.4% 34.45 10.2% 32.27 10.0%
Taiwan 7.70 3.2% 6.94 2.6% 23.37 7.0% 27.84 8.7%
Other 15.16 6.3% 12.21 4.6% 12.37 3.7% 10.02 3.1%
Europe 9.54 3.9% 17.09 6.4% 9.92 3.0% 8.57 2.7%
Latin America 4.83 2.0% 4.48 1.7% 2.70 0.8% 4.09 1.3%
Other 1.80 0.7% 2.12 0.8% 16.35 4.9% 13.84 4.3%
Total 241.81 100.0% 267.28 100.0% 336.18 100.0% 320.82 100.0%
11(Billion yen, rounded down)
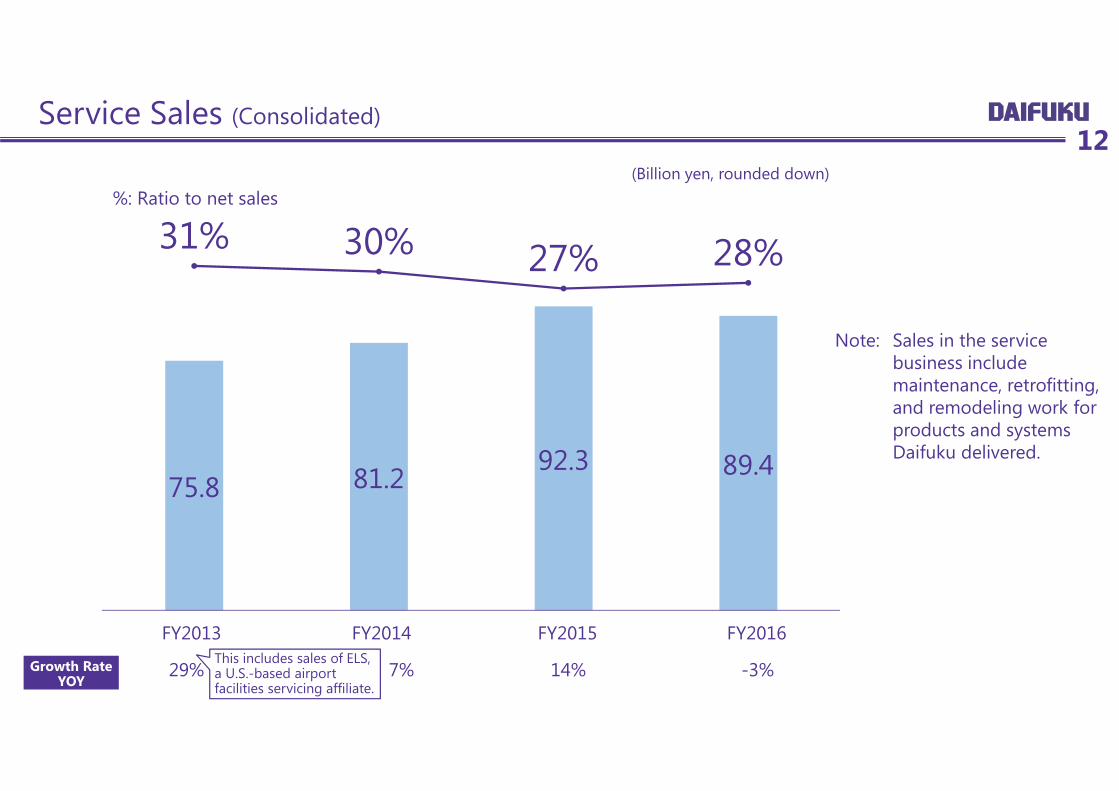
Service Sales (Consolidated)
14%7%29%
75.8 81.292.3 89.4
31% 30% 27% 28%
-3%
FY2014FY2013 FY2015 FY2016
12
%: Ratio to net sales(Billion yen, rounded down)
Growth Rate YOY
This includes sales of ELS, a U.S.-based airport facilities servicing affiliate.
Note: Sales in the service business include maintenance, retrofitting, and remodeling work for products and systems Daifuku delivered.
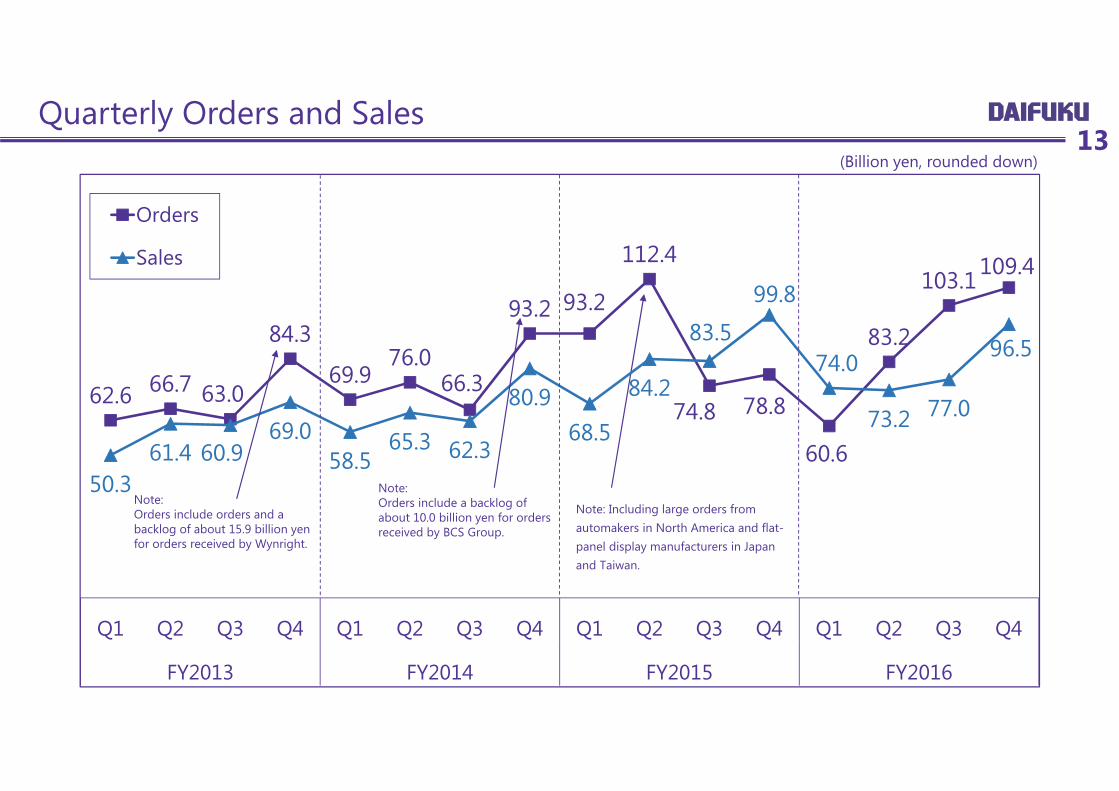
Quarterly Orders and Sales13
(Billion yen, rounded down)
62.6 66.7 63.0
84.3
69.9 76.0
66.3
93.2 93.2
112.4
74.8 78.8
60.6
83.2
103.1 109.4
50.361.4 60.9
69.058.5
65.3 62.3
80.968.5
84.2
83.5
99.8
74.0
73.2 77.0
96.5
Q1 Q2 Q3 Q4 Q1 Q2 Q3 Q4 Q1 Q2 Q3 Q4 Q1 Q2 Q3 Q4
FY2013 FY2014 FY2015 FY2016
Orders
Sales
Note: Orders include orders and a backlog of about 15.9 billion yen for orders received by Wynright.
Note: Orders include a backlog of about 10.0 billion yen for orders received by BCS Group.
Note: Including large orders from automakers in North America and flat-panel display manufacturers in Japan and Taiwan.
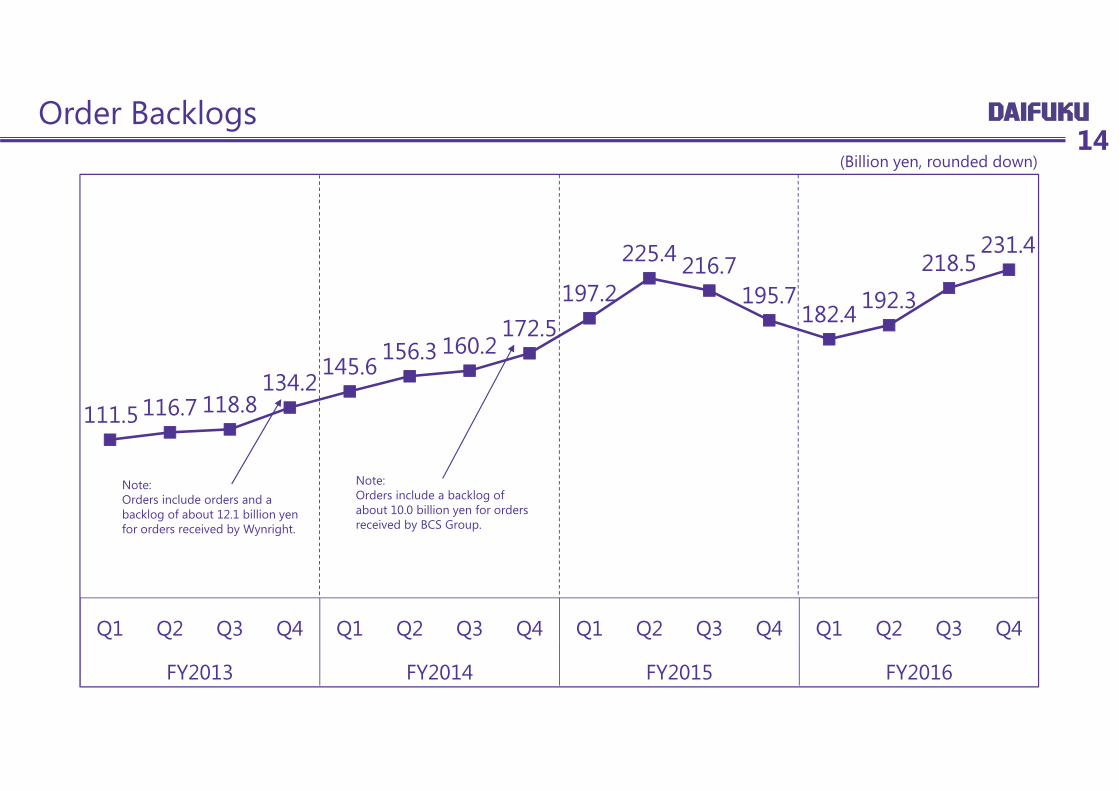
Order Backlogs14
(Billion yen, rounded down)
111.5 116.7 118.8134.2
145.6156.3 160.2
172.5197.2
225.4 216.7195.7
182.4 192.3218.5
231.4
Q1 Q2 Q3 Q4 Q1 Q2 Q3 Q4 Q1 Q2 Q3 Q4 Q1 Q2 Q3 Q4
FY2013 FY2014 FY2015 FY2016
Note: Orders include orders and a backlog of about 12.1 billion yen for orders received by Wynright.
Note: Orders include a backlog of about 10.0 billion yen for orders received by BCS Group.
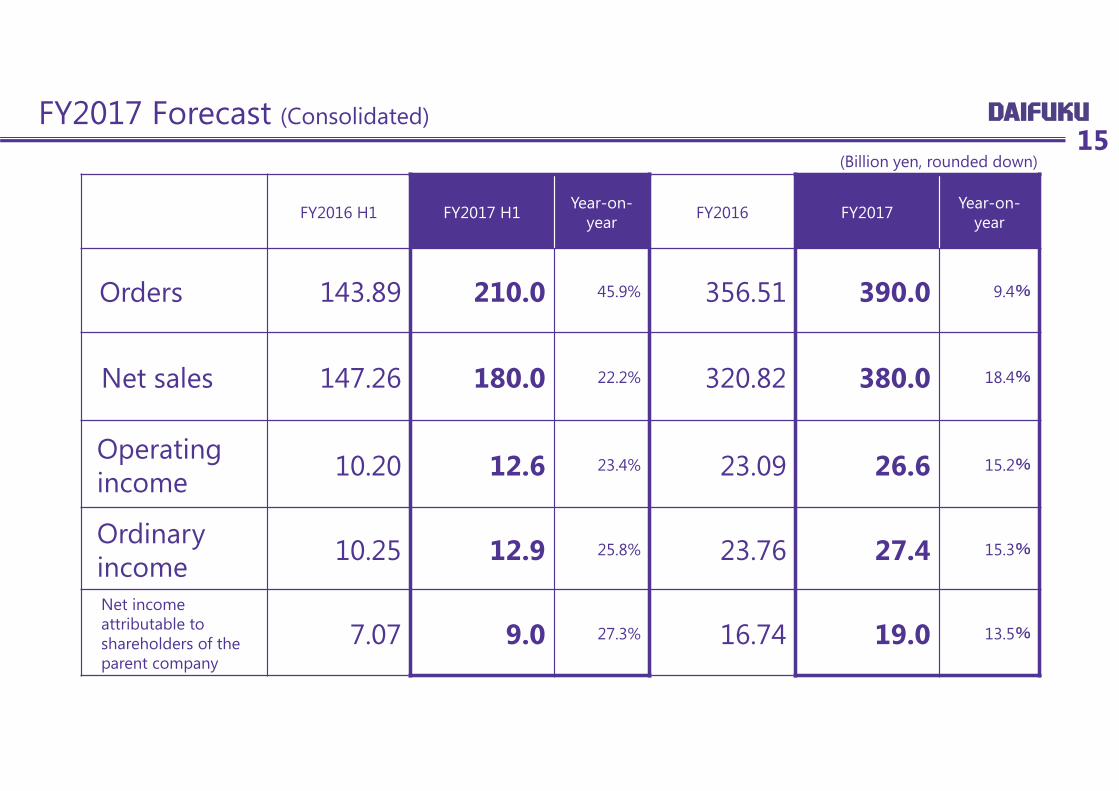
FY2017 Forecast (Consolidated)
FY2016 H1 FY2017 H1 Year-on-year FY2016 FY2017 Year-on-
year
Orders 143.89 210.0 45.9% 356.51 390.0 9.4%
Net sales 147.26 180.0 22.2% 320.82 380.0 18.4%
Operating income 10.20 12.6 23.4% 23.09 26.6 15.2%
Ordinary income 10.25 12.9 25.8% 23.76 27.4 15.3%
Net income attributable to shareholders of the parent company
7.07 9.0 27.3% 16.74 19.0 13.5%
15(Billion yen, rounded down)
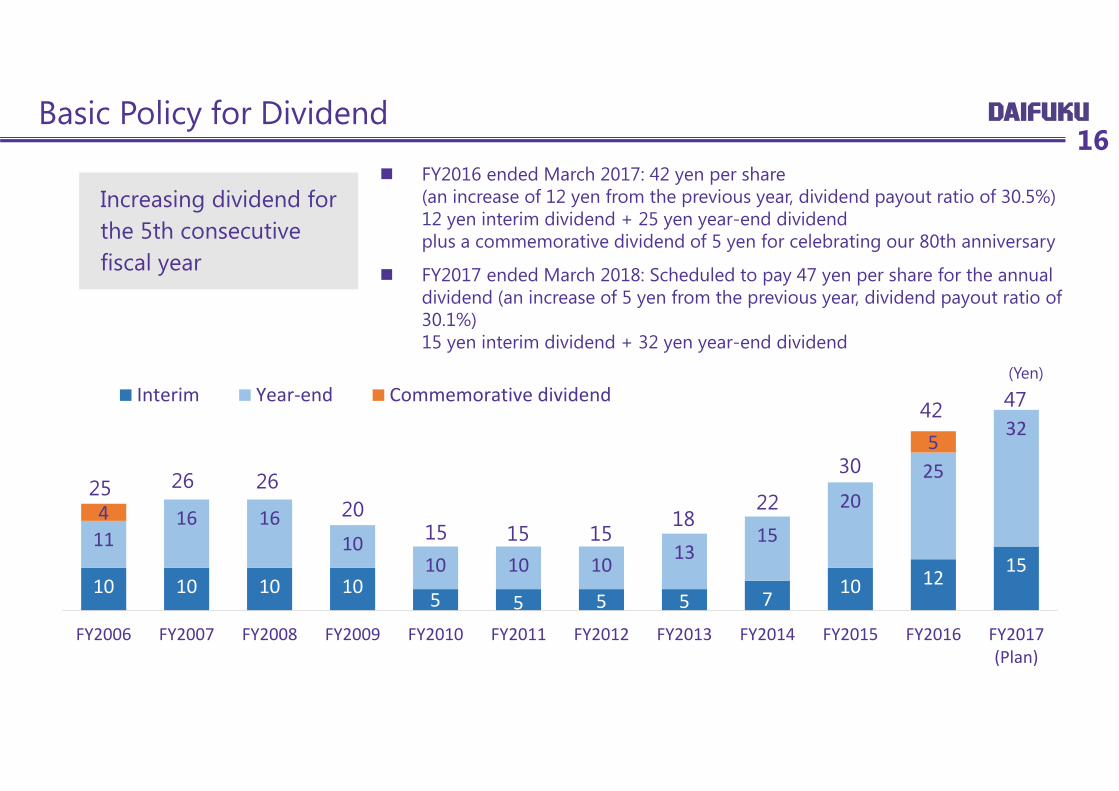
Basic Policy for Dividend
10 10 10 105 5 5 5 7 10 12 15
1116 16
1010 10 10 13
15
2025
32
4
5
FY2006 FY2007 FY2008 FY2009 FY2010 FY2011 FY2012 FY2013 FY2014 FY2015 FY2016 FY2017(Plan)
Interim Year‐end Commemorative dividend
30
2215
181515
20262625
42 47
16
(Yen)
Increasing dividend for the 5th consecutive fiscal year
FY2016 ended March 2017: 42 yen per share(an increase of 12 yen from the previous year, dividend payout ratio of 30.5%)12 yen interim dividend + 25 yen year-end dividend plus a commemorative dividend of 5 yen for celebrating our 80th anniversary
FY2017 ended March 2018: Scheduled to pay 47 yen per share for the annual dividend (an increase of 5 yen from the previous year, dividend payout ratio of 30.1%)15 yen interim dividend + 32 yen year-end dividend
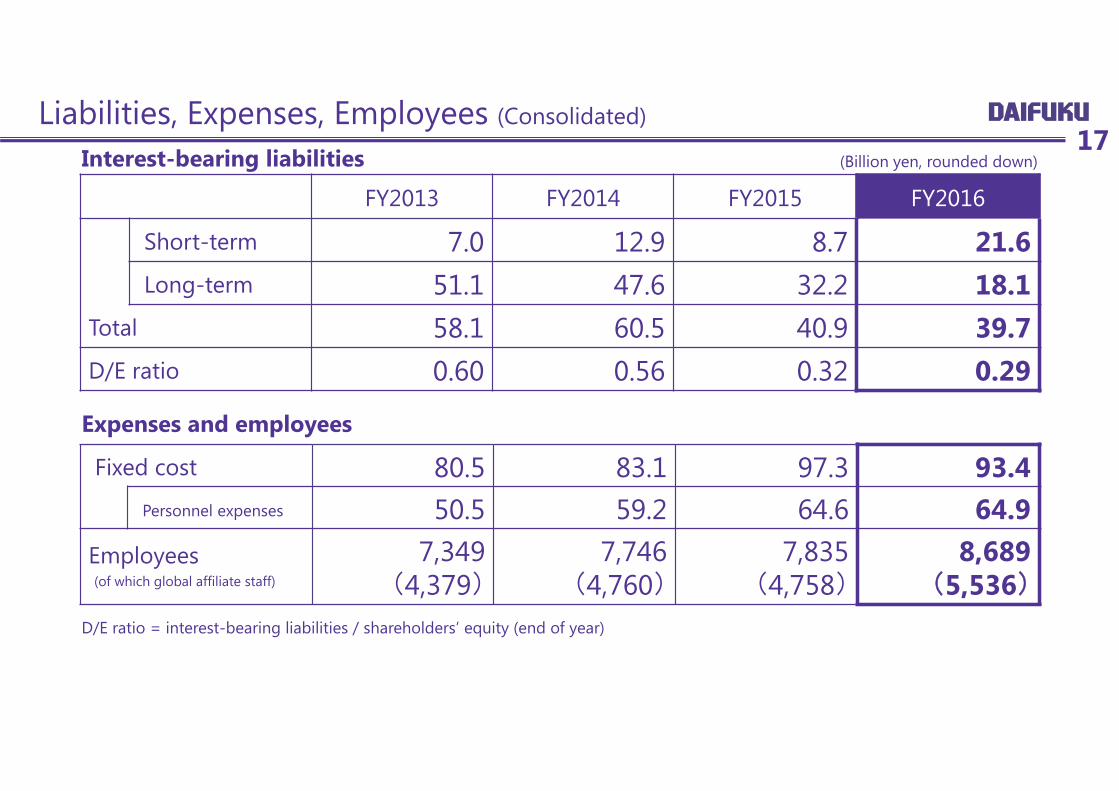
Liabilities, Expenses, Employees (Consolidated)17
FY2013 FY2014 FY2015 FY2016
Short-term 7.0 12.9 8.7 21.6Long-term 51.1 47.6 32.2 18.1
Total 58.1 60.5 40.9 39.7D/E ratio 0.60 0.56 0.32 0.29
Fixed cost 80.5 83.1 97.3 93.4Personnel expenses 50.5 59.2 64.6 64.9
Employees(of which global affiliate staff)
7,349(4,379)
7,746(4,760)
7,835(4,758)
8,689(5,536)
(Billion yen, rounded down)Interest-bearing liabilities
Expenses and employees
D/E ratio = interest-bearing liabilities / shareholders’ equity (end of year)
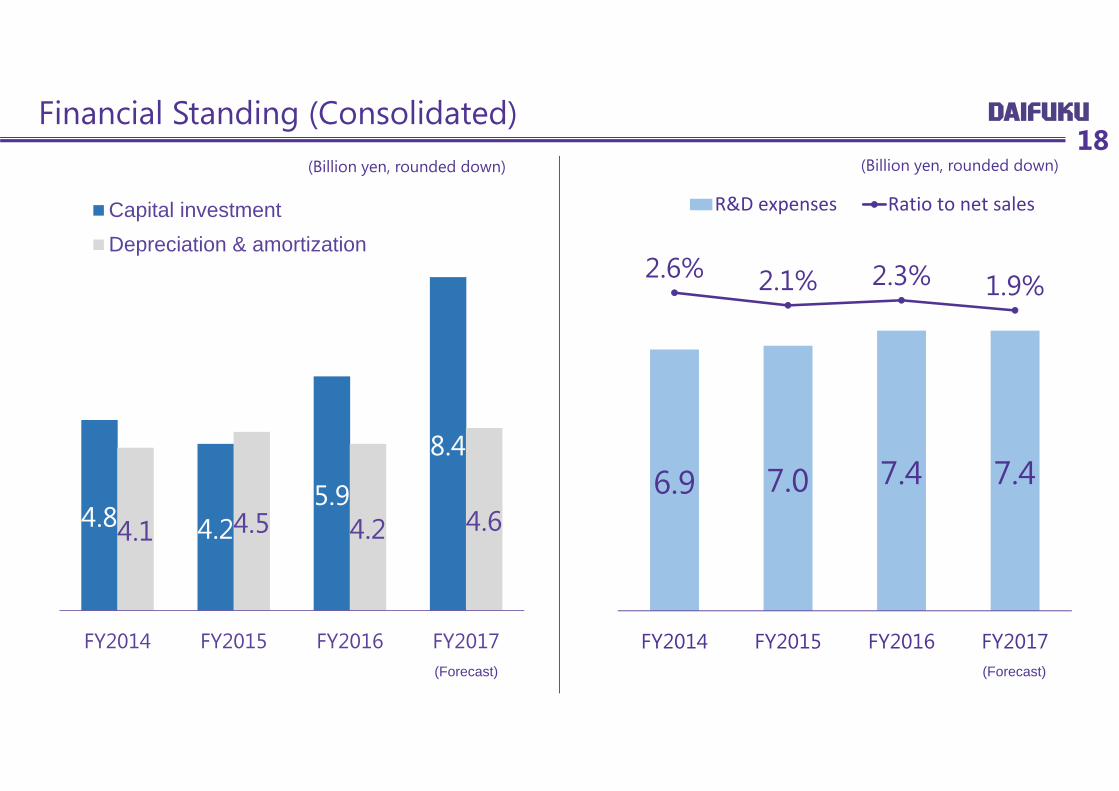
Financial Standing (Consolidated)18
4.8 4.25.9
8.4
4.1 4.5 4.2 4.6
FY2014 FY2015 FY2016 FY2017
Capital investmentDepreciation & amortization
6.9 7.0 7.4 7.4
2.6% 2.1% 2.3% 1.9%
FY2014 FY2015 FY2016 FY2017
R&D expenses Ratio to net sales
(Billion yen, rounded down) (Billion yen, rounded down)
(Forecast) (Forecast)
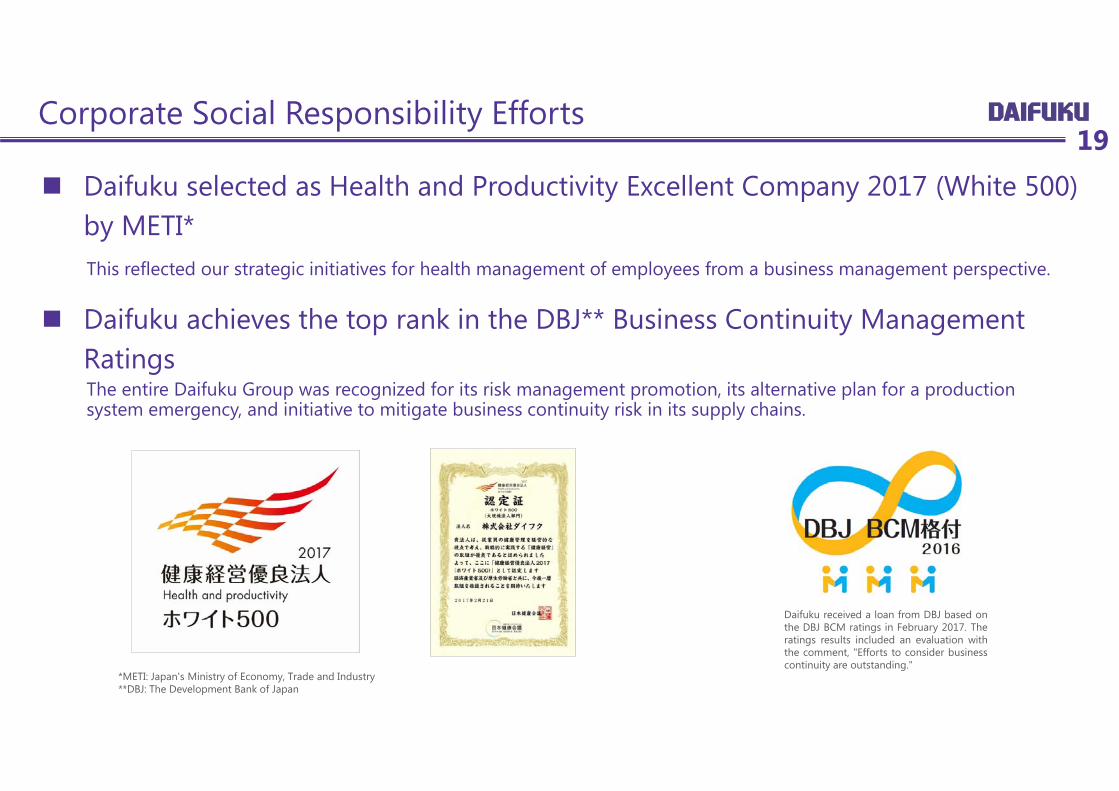
Corporate Social Responsibility Efforts19
Daifuku received a loan from DBJ based onthe DBJ BCM ratings in February 2017. Theratings results included an evaluation withthe comment, "Efforts to consider businesscontinuity are outstanding."
Daifuku selected as Health and Productivity Excellent Company 2017 (White 500) by METI*This reflected our strategic initiatives for health management of employees from a business management perspective.
Daifuku achieves the top rank in the DBJ** Business Continuity Management RatingsThe entire Daifuku Group was recognized for its risk management promotion, its alternative plan for a production system emergency, and initiative to mitigate business continuity risk in its supply chains.
*METI: Japan's Ministry of Economy, Trade and Industry**DBJ: The Development Bank of Japan
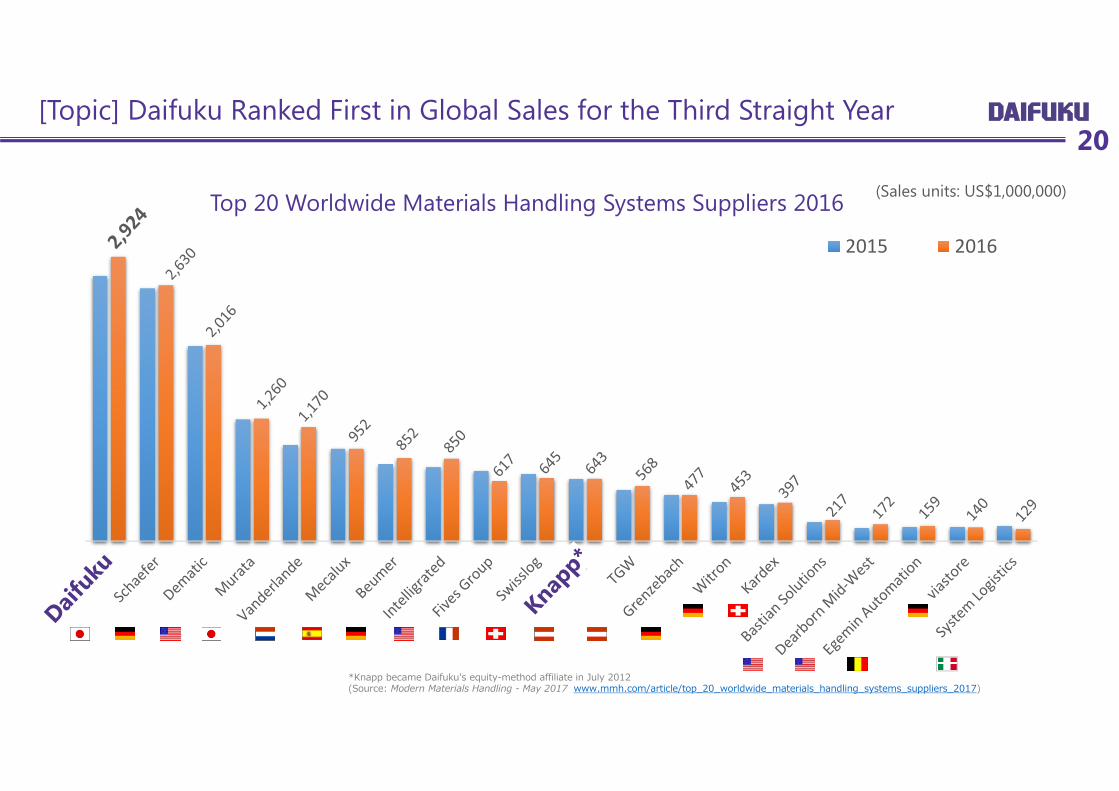
2015 2016
Top 20 Worldwide Materials Handling Systems Suppliers 2016
20
*Knapp became Daifuku's equity-method affiliate in July 2012(Source: Modern Materials Handling - May 2017 www.mmh.com/article/top_20_worldwide_materials_handling_systems_suppliers_2017)
(Sales units: US$1,000,000)
[Topic] Daifuku Ranked First in Global Sales for the Third Straight Year
© 2017 Daifuku Co., Ltd.
Cautionary Statement with Respect to Forward-Looking StatementsThe strategies, beliefs and plans related to future business performance as described in this document are not established facts. They are business prospects based on the assumptions and beliefs of themanagement team judging from the most current information, and therefore, these prospects are subject to potential risks and uncertainties. Due to various crucial factors, actual results may differmaterially from these forward-looking statements. These crucial factors that may adversely affect performance include 1) consumer trends and economic conditions in the Daifuku Group's operatingenvironment; 2) the effect of yen exchange rates on sales, assets and liabilities denominated in U.S. dollars and other currencies; 3) the tightening of laws and regulations regarding safety and othermatters that may lead to higher costs or sales restrictions; and 4) the impact of natural disasters and intentional threats, war, acts of terrorism, strikes, and plagues. Moreover, there are other factors thatmay adversely affect the Group's performance.