Embed Size (px)
Citation preview
1
Fiscal credibility as nominal anchor: the Brazilian experience
Roseli da Silva1
University of São Paulo at Ribeirão Preto
Department of Economics
Address: Avenida Bandeirantes, 3900, Monte Alegre,
Ribeirão Preto, SP – Brazil
CEP: 14040-905
Helder Ferreira de Mendonça
Fluminense Federal University
Department of Economics and
National Council for Scientific and Technological
Development (CNPq)
email: [email protected]
phone: +55 (16) 3315-0506
[corresponding author]
email: [email protected]
Abstract
This study investigates how the fiscal credibility affects the inflation rate in an emerging
economy under inflation target. Based on the Brazilian experience, a fiscal credibility index is
built taking into account how the market expectations are anchored to the primary surplus
target. The main idea is that a government that is able to anchor expectations around the target
(case of high credibility) may reduce inflation. The findings provide empirical evidence that
the success of government in achieving the fiscal primary surplus target (gain of credibility) is
an important ally to reduce inflation rate and its expectations.
Key words: fiscal credibility, inflation, primary surplus, inflation targeting.
Resumo
Este estudo investiga como a credibilidade fiscal afeta a taxa de inflação em uma economia
emergente sob o regime de metas de inflação. Com base na experiência brasileira, um índice
de credibilidade fiscal é construído levando-se em conta como as expectativas de mercado são
ancoradas à meta de superávit primário. A ideia principal é a de que um governo capaz de
ancorar as expectativas em torno da meta (caso de alta credibilidade) pode reduzir a inflação.
Os resultados evidenciam que o sucesso do governo em produzir a meta de superávit primário
(ganho de credibilidade) é um importante aliado para reduzir tanto a taxa quanto as
expectativas de inflação
Palavras-chave: credibilidade fiscal, inflação, superávit primário, meta de inflação.
JEL classification: E31, E62, E63.
ANPEC: Área 5 – Economia do Setor Público
1 Os autores agradecem a Jéssica Martins, graduanda FEA-RP/USP, pela colaboração na sistematização do
banco de dados de expectativas de superávit primário.
2
1. Introduction
A sound fiscal position is essential to any economy. Since the 1990s the growing
concern with inflation has brought several countries to adopt inflation targeting. There exist
several studies which indicate that the use of this monetary framework represents a success in
the control of inflation (e.g. Lin and Ye, 2009; and de Mendonça and de Guimarães e Souza,
2012). However, one of the preconditions to the success of inflation targeting is the fiscal
balance. It is well-known that in the case where the government is not committed to fiscal
balance, the result is a pressure on inflation due to the risk of expansionary monetary policy
and to finance public debts. In brief, there exists a relationship between government fiscal
commitment and inflation.
An important issue in the analysis regarding inflation targeting is credibility because it
plays an essential role in the commitment of reaching low and stable inflation. Although a
great part of the literature pays attention only to the credibility of the monetary authority, this
is only one side of the coin. Following the literature that builds on Sargent e Wallace (1981),
unsustainable fiscal police may lead the monetary authority to monetize fiscal deficits and
thus wreck credibility. Based on a different view, scholars from fiscal theory of price level
(e.g. Woodford, 2001; and Sims, 1994) argue that the control of money supply is not a
sufficient condition to stabilize inflation. In brief, the government solvency is essential to
monetary policy being able to control inflation.
This study investigates how the fiscal credibility affects the inflation rate in an
emerging economy under inflation target. The analysis on the Brazilian case after adoption of
inflation targeting is useful, as with Chile and Poland, this country announces the inflation
target jointly by the government and central bank in order to make the government commit to
the fiscal discipline needed to achieve the target. Moreover, Brazil has had explicit fiscal
primary surplus targets since 2000, and expectations of variables (e.g. inflation rate and
primary surplus) are available from the Time Series Management System - Central Bank of
Brazil (TSMS/CBB). The main idea is that a government that is able to anchor expectations
around the target (case of high credibility) may reduce inflation. The results in this study
provide empirical evidence that the success of government in achieving the fiscal primary
surplus target (gain of credibility) contributes to the reduction of inflation.
Few studies analyze the impact of fiscal credibility on inflation rate in emerging
economies. For an analysis of the pass-through on inflation for the Brazilian economy, de
Mendonça and Tostes (2015), taking into account the fiscal credibility index built by de
3
Mendonça and Machado (2013), found that fiscal credibility is an important tool for reducing
inflation. Kuncoro (2015) in an analysis regarding Indonesia concluded that fiscal credibility
is important for price stabilization in the inflation targeting framework.
This study differs from these above-mentioned in several dimensions. It is important
to highlight that the indicator of fiscal credibility in de Mendonça and Machado (2013) is
based on the deviations of the market expectations on public debt-to-GDP in relation to the
prudential benchmark suggested by International Monetary Fund. Moreover, the index used
by Kuncoro (2015) quantifies the fiscal rules credibility measure using the deviation of actual
budget from the projected one. In a different manner, the fiscal credibility index in this study
takes into account how the market expectations are anchored to the primary surplus target.
Therefore, we consider a true fiscal commitment announced previously by the government.
This procedure is in agreement with the well-known definition of credibility made by
Cukierman and Meltzer (1986), which can be understood as the difference between the
policymaker’s plans and the public’s beliefs about those plans. Furthermore, we provide
empirical evidence regarding the effect of fiscal credibility on inflation rate, inflation of
market prices, inflation of administered prices, and inflation expectations, based on the
structural model adopted by Central Bank of Brazil (CBB) through Ordinary Least Squares
(OLS) and Generalized Method of Moments (GMM) regressions. Furthermore, a vector
autoregression model (VAR) is also performed for the period January 2003 to December
2015.
The remainder of this study is organized as follows: Section 2 makes a presentation of
the measurement of the fiscal credibility in Brazil for the period from 2003 to 2015. Section 3
presents the data and methodology used in this study. Section 4 provides empirical evidence,
through an econometric analysis, of the effect of the fiscal credibility on inflation. Section 5
concludes the paper.
2. Measuring fiscal credibility in Brazil
It is a challenge to summarize the government’s ability in guiding the expectation
process of the economic agents through only one measurement (fiscal credibility index). It
involves multiple dimensions such as: the intertemporal nature of fiscal sustainability; the
empirical limits for the public debt-to-GDP growth ratio; the risk perception about possible
fiscal dominance scenarios; the institutional setting and accountability of fiscal policy; and the
effects of political and electoral cycles on fiscal authorities. In this context, we build an index
4
which starts from two criteria: (i) because the index under construction is a limited variable,
instead of using variables like debt-to-GDP ratio (see, de Mendonça and Machado, 2013),
which usually follow a non-stationary stochastic process, stationary fiscal flow measurement
is used; and (ii) the use of a reference for exogenous expectation guidance based on a very
well defined lower bound for the fiscal flow variable which is publicly preannounced for the
next year.
The one-step-ahead expectations of fiscal primary surplus are the natural candidate for
being the main information for a fiscal credibility index because the fiscal primary surplus is
the adjustment component in the nominal deficit that could ensure the fulfillment of the
intertemporal budget restriction. In addition, the expectations of fiscal primary surplus are
measured as a ratio-to-GDP (usually a stationary process) and represent the median of
financial market institutions expectations for the next year for the fiscal primary surplus. This
information is extracted from a daily survey of market expectations conducted by Central
Bank of Brazil (CBB) for the evolution of the main Brazilian macroeconomic variables
(Focus Market Readout).
It is important to highlight that since the promulgation of the Fiscal Responsibility
Law in 2000 the government has to define annual goals for fiscal variables for execution in
current year and the next two years, publicly announced as an Annex of Budget Guidelines
Law (Lei de Diretrizes Orçamentárias – LDO) by September of the previous year. In other
words, this information represents a benchmark for macroeconomic forecasts, and thus, the
goals for fiscal primary surplus (FPS*) are the essence of the fiscal credibility index in order
to evaluate the performance and ability of the government to anchor expectations. Table 1
shows these goals and their respective laws.2
It is a fact that expectations deteriorate faster as the fiscal primary surplus is lower
than the target. Hence, the use of different intervals creates an asymmetrical framework which
is useful in the measurement of credibility. In this context, two intervals are considered in the
index: (i) an ideal interval which corresponds to a very good performance of the government
regarding the primary surplus in reaching the target, that is,
* *
min max, 0.05, 0.1ideal idealFPS PFS FPS FPS ; and (ii) a tolerance interval which represents an
acceptable performance given by * *
min max, 0.15, 0.3tolerance toleranceFPS FPS FPS FPS . Taking into
consideration the idea above, a fiscal credibility index is elaborated (FCRED), which assumes
2 Some fiscal surplus goals were revised within the current year. Those revisions were not considered because
they do not affect the expectations formed during the previous year.
5
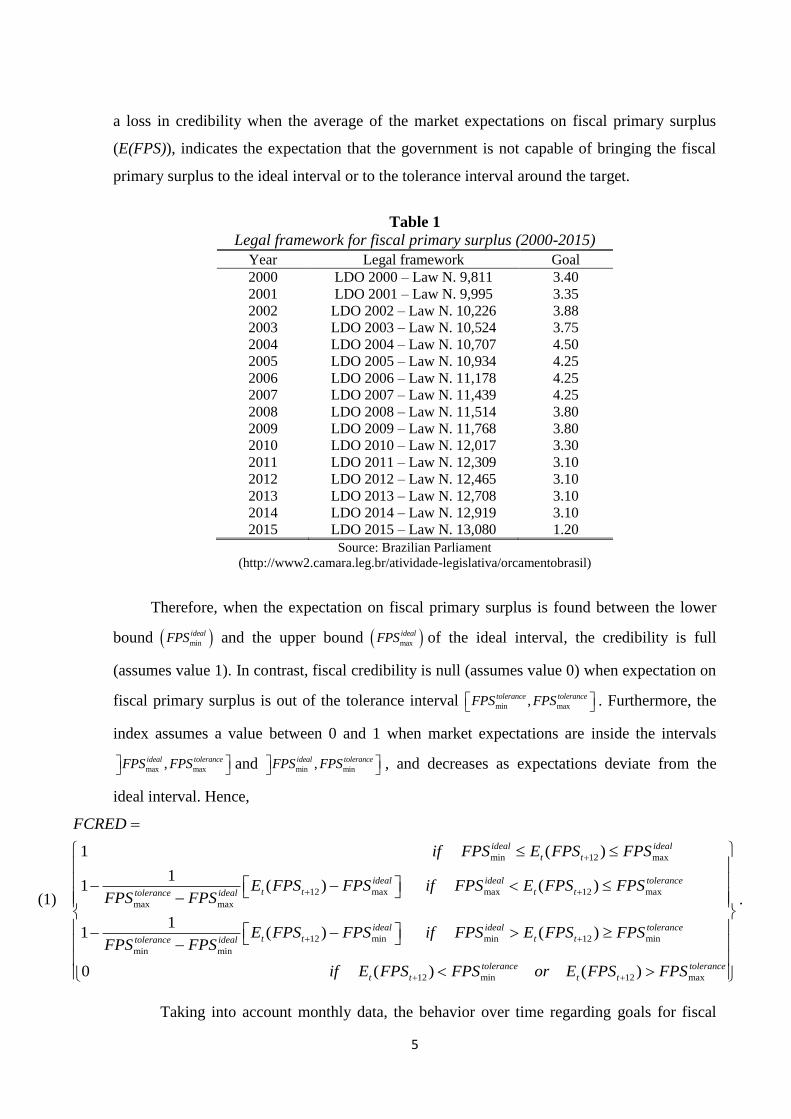
a loss in credibility when the average of the market expectations on fiscal primary surplus
(E(FPS)), indicates the expectation that the government is not capable of bringing the fiscal
primary surplus to the ideal interval or to the tolerance interval around the target.
Table 1
Legal framework for fiscal primary surplus (2000-2015)
Year Legal framework Goal
2000 LDO 2000 – Law N. 9,811 3.40
2001 LDO 2001 – Law N. 9,995 3.35
2002 LDO 2002 – Law N. 10,226 3.88
2003 LDO 2003 – Law N. 10,524 3.75
2004 LDO 2004 – Law N. 10,707 4.50
2005 LDO 2005 – Law N. 10,934 4.25
2006 LDO 2006 – Law N. 11,178 4.25
2007 LDO 2007 – Law N. 11,439 4.25
2008 LDO 2008 – Law N. 11,514 3.80
2009 LDO 2009 – Law N. 11,768 3.80
2010 LDO 2010 – Law N. 12,017 3.30
2011 LDO 2011 – Law N. 12,309 3.10
2012 LDO 2012 – Law N. 12,465 3.10
2013 LDO 2013 – Law N. 12,708 3.10
2014 LDO 2014 – Law N. 12,919 3.10
2015 LDO 2015 – Law N. 13,080 1.20
Source: Brazilian Parliament
(http://www2.camara.leg.br/atividade-legislativa/orcamentobrasil)
Therefore, when the expectation on fiscal primary surplus is found between the lower
bound min
idealFPS and the upper bound max
idealFPS of the ideal interval, the credibility is full
(assumes value 1). In contrast, fiscal credibility is null (assumes value 0) when expectation on
fiscal primary surplus is out of the tolerance interval min max,tolerance toleranceFPS FPS . Furthermore, the
index assumes a value between 0 and 1 when market expectations are inside the intervals
max max,ideal toleranceFPS FPS and min min,ideal toleranceFPS FPS , and decreases as expectations deviate from the
ideal interval. Hence,
(1)
min 12 max
12 max max 12 max
max max
12 min
min min
1 ( )
11 ( ) ( )
11 ( )
ideal ideal
t t
ideal ideal tolerance
t t t ttolerance ideal
ideal
t ttolerance ideal
FCRED
if FPS E FPS FPS
E FPS FPS if FPS E FPS FPSFPS FPS
E FPS FPS iFPS FPS
min 12 min
12 min 12 max
( )
0 ( ) ( )
ideal tolerance
t t
tolerance tolerance
t t t t
f FPS E FPS FPS
if E FPS FPS or E FPS FPS
.
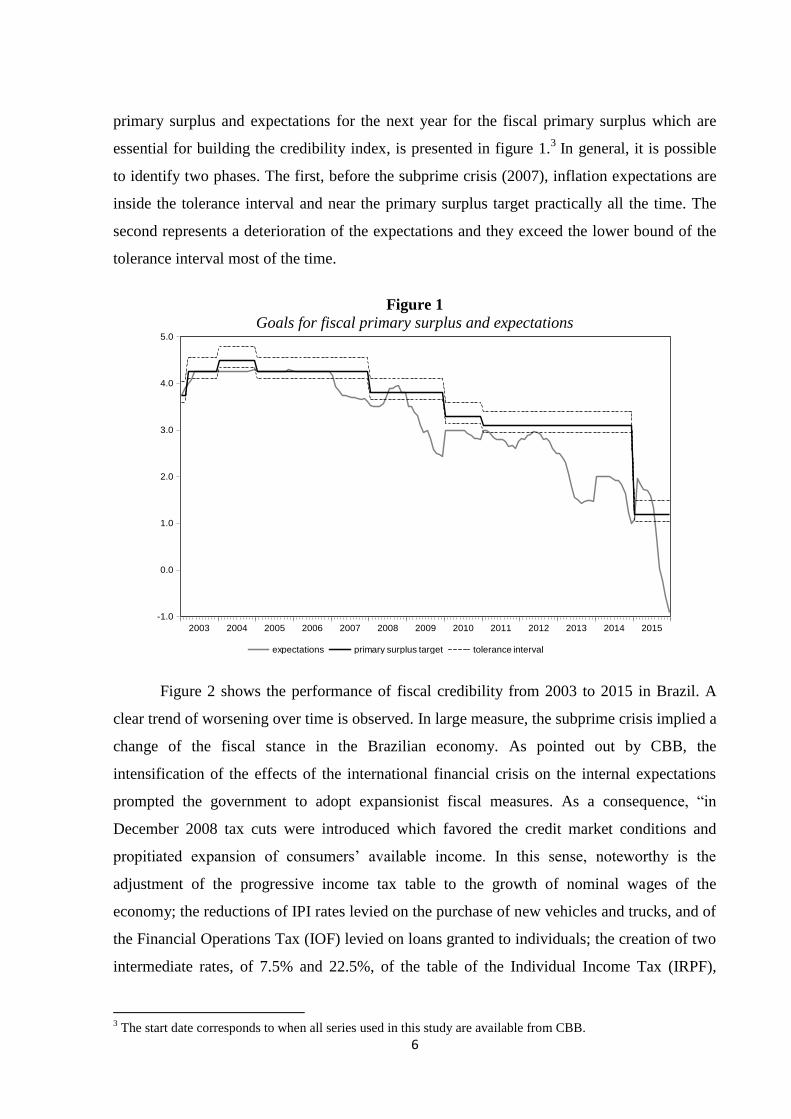
Taking into account monthly data, the behavior over time regarding goals for fiscal
6
primary surplus and expectations for the next year for the fiscal primary surplus which are
essential for building the credibility index, is presented in figure 1.3 In general, it is possible
to identify two phases. The first, before the subprime crisis (2007), inflation expectations are
inside the tolerance interval and near the primary surplus target practically all the time. The
second represents a deterioration of the expectations and they exceed the lower bound of the
tolerance interval most of the time.
Figure 1
Goals for fiscal primary surplus and expectations
-1.0
0.0
1.0
2.0
3.0
4.0
5.0
2003 2004 2005 2006 2007 2008 2009 2010 2011 2012 2013 2014 2015
expectations primary surplus target tolerance interval
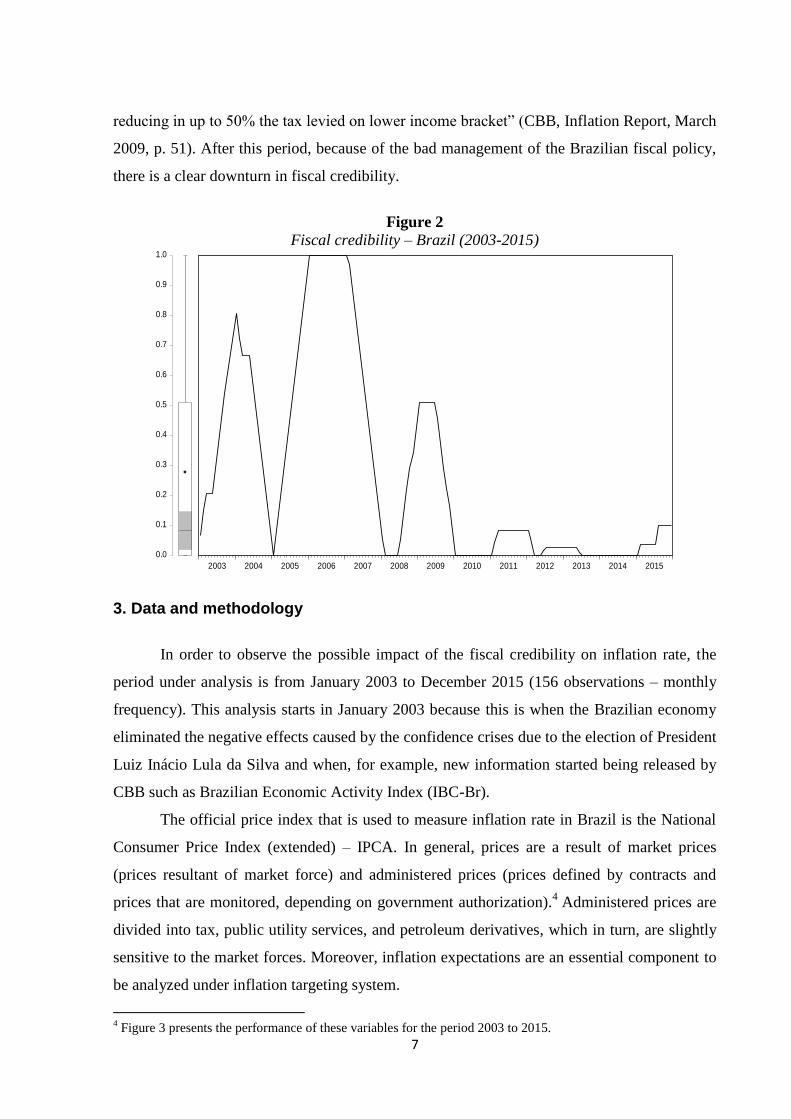
Figure 2 shows the performance of fiscal credibility from 2003 to 2015 in Brazil. A
clear trend of worsening over time is observed. In large measure, the subprime crisis implied a
change of the fiscal stance in the Brazilian economy. As pointed out by CBB, the
intensification of the effects of the international financial crisis on the internal expectations
prompted the government to adopt expansionist fiscal measures. As a consequence, “in
December 2008 tax cuts were introduced which favored the credit market conditions and
propitiated expansion of consumers’ available income. In this sense, noteworthy is the
adjustment of the progressive income tax table to the growth of nominal wages of the
economy; the reductions of IPI rates levied on the purchase of new vehicles and trucks, and of
the Financial Operations Tax (IOF) levied on loans granted to individuals; the creation of two
intermediate rates, of 7.5% and 22.5%, of the table of the Individual Income Tax (IRPF),
3 The start date corresponds to when all series used in this study are available from CBB.
7
reducing in up to 50% the tax levied on lower income bracket” (CBB, Inflation Report, March
2009, p. 51). After this period, because of the bad management of the Brazilian fiscal policy,
there is a clear downturn in fiscal credibility.
Figure 2
Fiscal credibility – Brazil (2003-2015)
0.0
0.1
0.2
0.3
0.4
0.5
0.6
0.7
0.8
0.9
1.0
2003 2004 2005 2006 2007 2008 2009 2010 2011 2012 2013 2014 2015
3. Data and methodology
In order to observe the possible impact of the fiscal credibility on inflation rate, the
period under analysis is from January 2003 to December 2015 (156 observations – monthly
frequency). This analysis starts in January 2003 because this is when the Brazilian economy
eliminated the negative effects caused by the confidence crises due to the election of President
Luiz Inácio Lula da Silva and when, for example, new information started being released by
CBB such as Brazilian Economic Activity Index (IBC-Br).
The official price index that is used to measure inflation rate in Brazil is the National
Consumer Price Index (extended) – IPCA. In general, prices are a result of market prices
(prices resultant of market force) and administered prices (prices defined by contracts and
prices that are monitored, depending on government authorization).4 Administered prices are
divided into tax, public utility services, and petroleum derivatives, which in turn, are slightly
sensitive to the market forces. Moreover, inflation expectations are an essential component to
be analyzed under inflation targeting system.
4 Figure 3 presents the performance of these variables for the period 2003 to 2015.

8
Figure 3
Inflation (full IPCA), Market Prices, and Administered Prices (%)
-2.0
-1.0
0.0
1.0
2.0
3.0
4.0
2003 2004 2005 2006 2007 2008 2009 2010 2011 2012 2013 2014 2015
Administered prices Inflation (full IPCA) Market prices
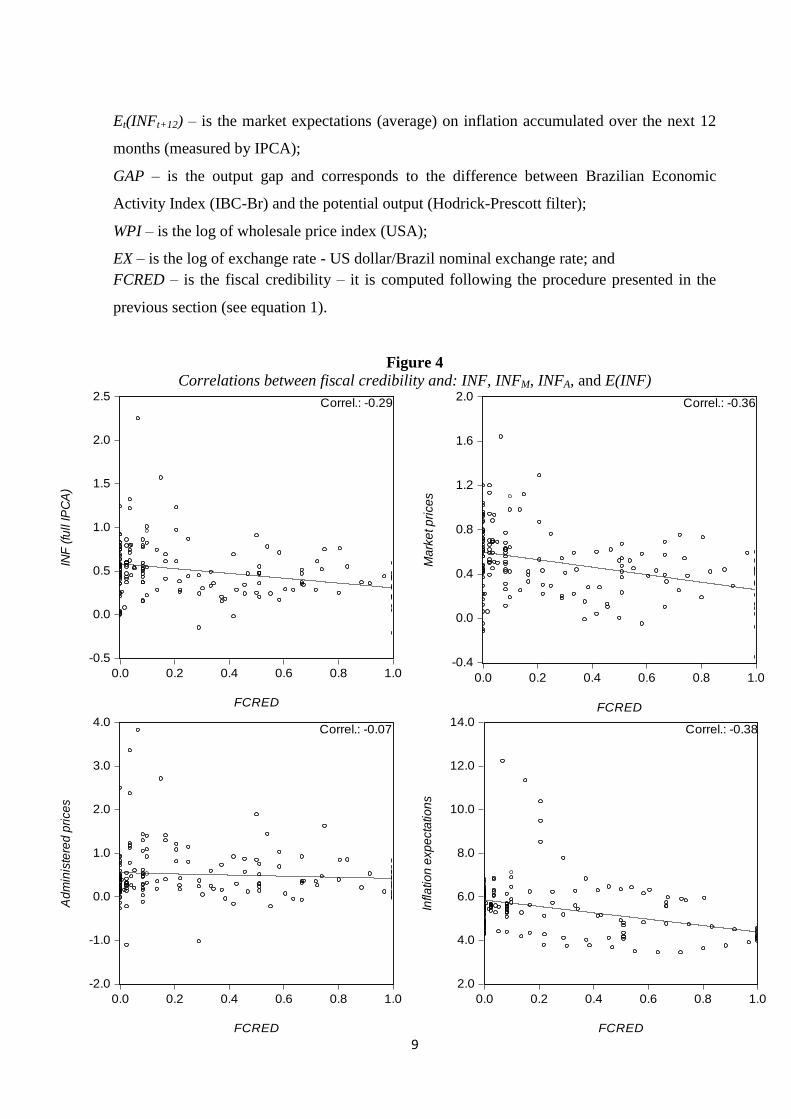
With the intention of observing the relation between the fiscal credibility and inflation
rate in the Brazilian economy, the first empirical procedure is straightforward. We present
four scatterplots and correlations for fiscal credibility (FCRED) and its relation with: full
inflation rate (INF), inflation of market prices (INFM), inflation of administered prices (INFA),
and inflation expectations (E(INF)) respectively (see figure 4). With exception for the case of
administered prices, there exists a negative correlation (around -0.3) to other cases, which in
turn, suggests that fiscal credibility may reduce inflation rate and reinforces the causal
hypothesis to be tested econometrically.
A simple manner of observing how fiscal credibility can affect inflation under
inflation targeting is through a Phillips curve. Because credibility is a forward-looking
concept (see de Mendonça and de Guimarães e Souza, 2009) and taking as reference the
version of the Phillips curve used in the structural model adopted by CBB when inflation
targeting was adopted in June of 1999 (see Bogdanski, Tombini, and Werlang, 2000), the
following equation is considered:5
(2) 0 1 1 2 12 3 4 5( ) ,t t t t t t ttINF INF E INF GAP WPI EX FCRED
where: t ~ N(0,2);
tINF - is the inflation measured by National consumer price index – extended (IPCA);
5 See table A.1 (appendix) for sources of data and description of the variables. Descriptive statistics are presented
in table A.2 (appendix).
9
Et(INFt+12) – is the market expectations (average) on inflation accumulated over the next 12
months (measured by IPCA);
GAP – is the output gap and corresponds to the difference between Brazilian Economic
Activity Index (IBC-Br) and the potential output (Hodrick-Prescott filter);
WPI – is the log of wholesale price index (USA);
EX – is the log of exchange rate - US dollar/Brazil nominal exchange rate; and
FCRED – is the fiscal credibility – it is computed following the procedure presented in the
previous section (see equation 1).
Figure 4
Correlations between fiscal credibility and: INF, INFM, INFA, and E(INF)
-0.5
0.0
0.5
1.0
1.5
2.0
2.5
0.0 0.2 0.4 0.6 0.8 1.0
FCRED
INF
(fu
ll IP
CA
)
Correl.: -0.29
-0.4
0.0
0.4
0.8
1.2
1.6
2.0
0.0 0.2 0.4 0.6 0.8 1.0
FCRED
Ma
rke
t p
rice
s
Correl.: -0.36
-2.0
-1.0
0.0
1.0
2.0
3.0
4.0
0.0 0.2 0.4 0.6 0.8 1.0
FCRED
Ad
min
iste
red
pri
ce
s
Correl.: -0.07
2.0
4.0
6.0
8.0
10.0
12.0
14.0
0.0 0.2 0.4 0.6 0.8 1.0
FCRED
Infla
tio
n e
xp
ecta
tio
ns
Correl.: -0.38
10
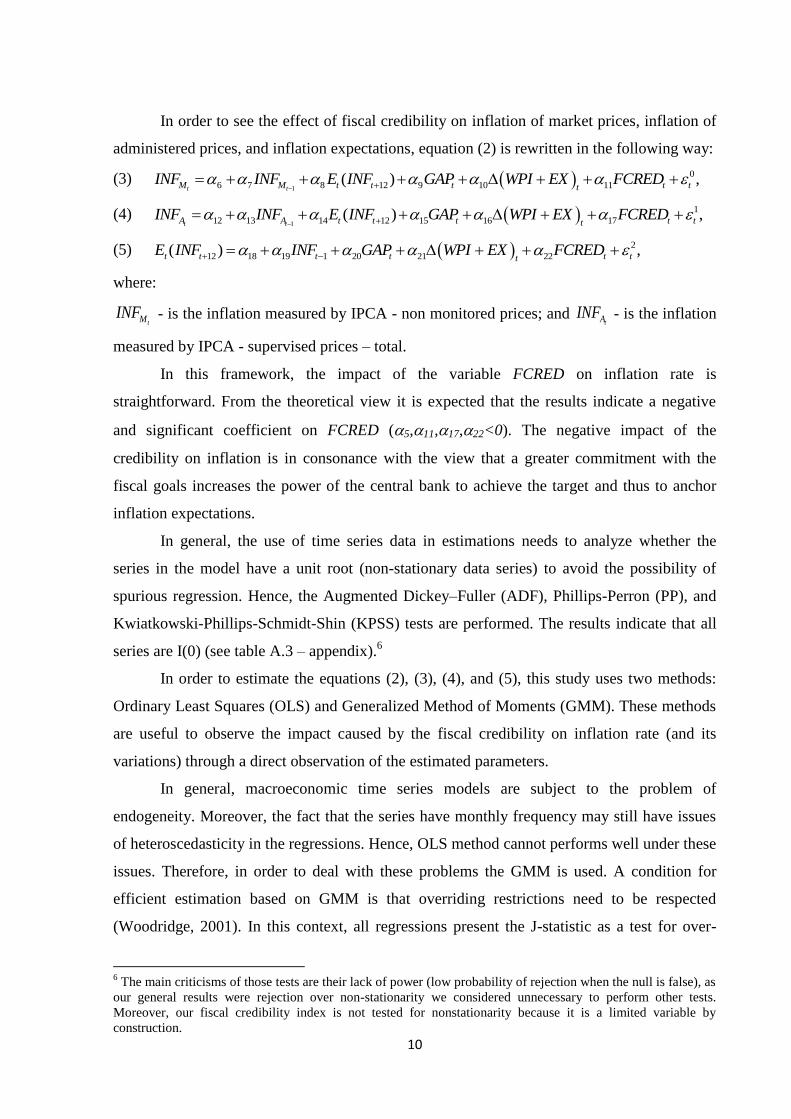
In order to see the effect of fiscal credibility on inflation of market prices, inflation of
administered prices, and inflation expectations, equation (2) is rewritten in the following way:
(3) 1
0
6 7 8 12 9 10 11( ) ,t tM M t t t t tt
INF INF E INF GAP WPI EX FCRED
(4) 1
1
12 13 14 12 15 16 17( ) ,t tA A t t t t tt
INF INF E INF GAP WPI EX FCRED
(5) 2
12 18 19 1 20 21 22( ) ,t t t t t ttE INF INF GAP WPI EX FCRED
where:
tMINF - is the inflation measured by IPCA - non monitored prices; and tAINF - is the inflation
measured by IPCA - supervised prices – total.
In this framework, the impact of the variable FCRED on inflation rate is
straightforward. From the theoretical view it is expected that the results indicate a negative
and significant coefficient on FCRED (5,11,17,22<0). The negative impact of the
credibility on inflation is in consonance with the view that a greater commitment with the
fiscal goals increases the power of the central bank to achieve the target and thus to anchor
inflation expectations.
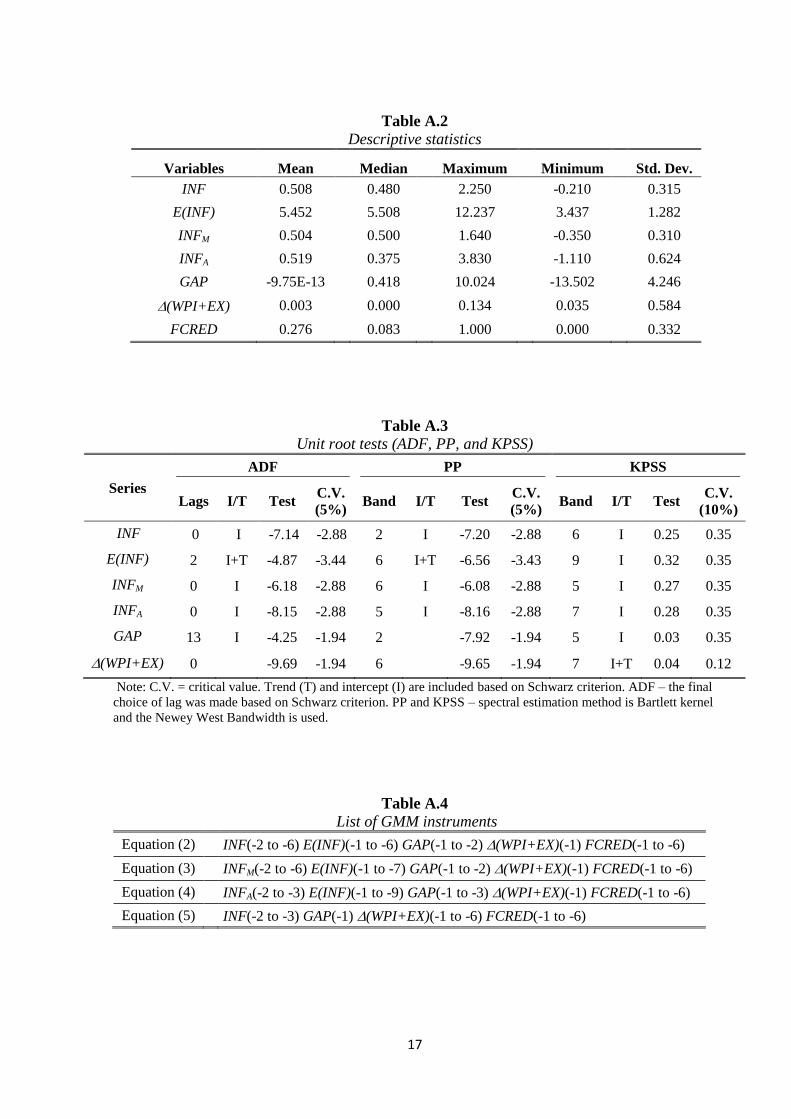
In general, the use of time series data in estimations needs to analyze whether the
series in the model have a unit root (non-stationary data series) to avoid the possibility of
spurious regression. Hence, the Augmented Dickey–Fuller (ADF), Phillips-Perron (PP), and
Kwiatkowski-Phillips-Schmidt-Shin (KPSS) tests are performed. The results indicate that all
series are I(0) (see table A.3 – appendix).6
In order to estimate the equations (2), (3), (4), and (5), this study uses two methods:
Ordinary Least Squares (OLS) and Generalized Method of Moments (GMM). These methods
are useful to observe the impact caused by the fiscal credibility on inflation rate (and its
variations) through a direct observation of the estimated parameters.
In general, macroeconomic time series models are subject to the problem of
endogeneity. Moreover, the fact that the series have monthly frequency may still have issues
of heteroscedasticity in the regressions. Hence, OLS method cannot performs well under these
issues. Therefore, in order to deal with these problems the GMM is used. A condition for
efficient estimation based on GMM is that overriding restrictions need to be respected
(Woodridge, 2001). In this context, all regressions present the J-statistic as a test for over-
6 The main criticisms of those tests are their lack of power (low probability of rejection when the null is false), as
our general results were rejection over non-stationarity we considered unnecessary to perform other tests.
Moreover, our fiscal credibility index is not tested for nonstationarity because it is a limited variable by
construction.
11
identifying restrictions in the models. Furthermore, as usual, the instrument variables in the
GMM regressions are the lagged regressors.7
In order to observe the relevance of the credibility effect on inflation (full IPCA),
inflation of market prices, inflation of administered prices, and inflation expectations over
time, this study besides the OLS and GMM models provides empirical evidence through
Vector Autoregressive (VAR) models.8 In general, the analysis of VAR is made through
impulse response functions because it allows one to see the impulse of fiscal credibility on
inflation rate and inflation expectations caused by shocks (or innovations) provoked by
residual variables over time. As suggested by Koop, Pesaran, and Potter (1996) and Pesaran
and Shin (1998), this study makes use of the generalized impulse response function (impulse
responses are invariant to any re-ordering of the variables in the VAR) because it provides
more robust results than the orthogonalized method.
4. Empirical evidence
This section presents some empirical evidence on the impact of the fiscal credibility
on inflation (full IPCA), inflation of market prices, inflation of administered prices, and
inflation expectations in the Brazilian economy. The analysis is divided into three steps. In the
first step we present OLS estimations. The second step presents GMM estimations. Finally, in
the third step, we observe the response of the inflation rate and its variations to a shock
transmitted by the fiscal credibility through impulse-response analysis.
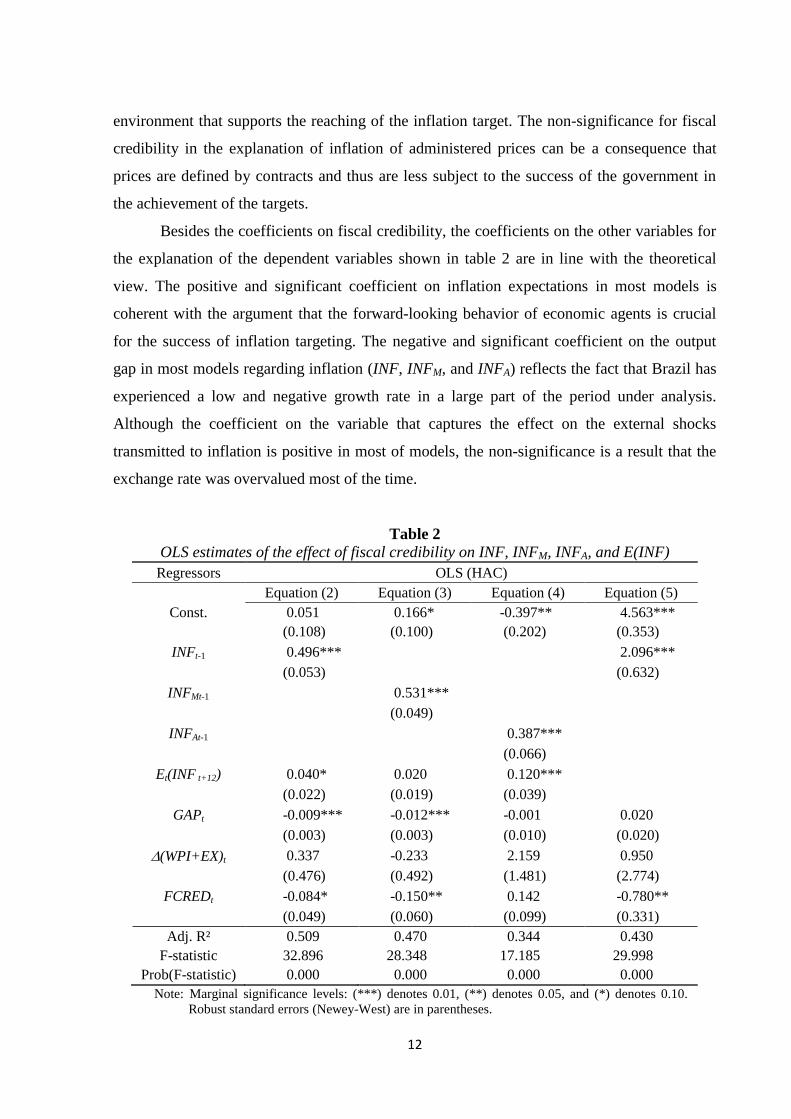
The coefficients for the OLS estimations are in consonance with the theoretical
perspective (see table 2). The negative and significant coefficients on fiscal credibility
observed for the regressions on inflation (full IPCA), inflation of market prices, and inflation
expectations are in line with the first impression from the correlation observed in figure 5.
This observation is a clear indication that the government commitment with the fiscal primary
surplus target (high credibility) is an important mechanism to reduce inflation rate. This result
comes as no surprise because one of the main pillars for the success of inflation targeting is
the sustained fiscal balance. In this context, a breach of the Brazilian government with the
fiscal surplus (low credibility) target denotes a lack of the commitment to ensure an
7 In order to eliminate skewing the results, the maximum of lags applied for each instrument was 9. In addition,
the number of instruments in all models is less than 14% in relation to the total of observations) – the
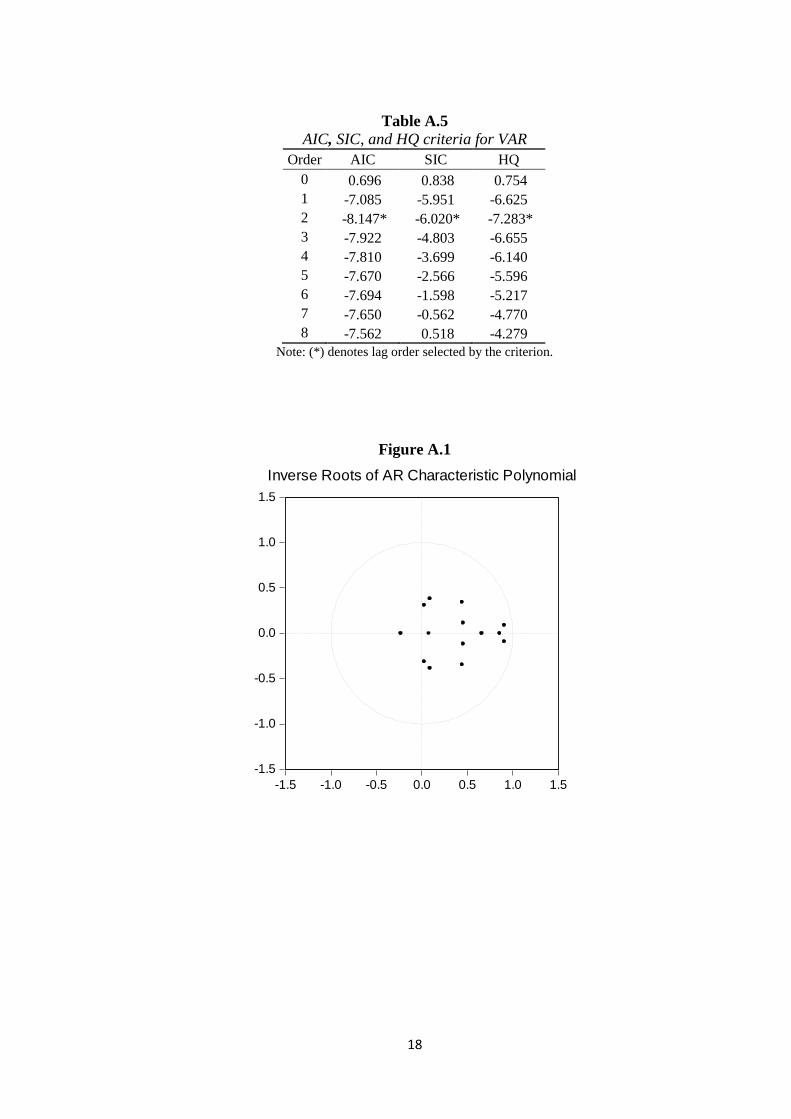
instruments are listed in the appendix (see table A.4). 8 Based on Schwarz (SIC), Akaike (AIC), and Hannan-Quinn (HQ) criteria, the VAR order is 2 (see table A.5).
Furthermore, VARs satisfy the stability condition (see figure A.1 – appendix).
12
environment that supports the reaching of the inflation target. The non-significance for fiscal
credibility in the explanation of inflation of administered prices can be a consequence that
prices are defined by contracts and thus are less subject to the success of the government in
the achievement of the targets.
Besides the coefficients on fiscal credibility, the coefficients on the other variables for
the explanation of the dependent variables shown in table 2 are in line with the theoretical
view. The positive and significant coefficient on inflation expectations in most models is
coherent with the argument that the forward-looking behavior of economic agents is crucial
for the success of inflation targeting. The negative and significant coefficient on the output
gap in most models regarding inflation (INF, INFM, and INFA) reflects the fact that Brazil has
experienced a low and negative growth rate in a large part of the period under analysis.
Although the coefficient on the variable that captures the effect on the external shocks
transmitted to inflation is positive in most of models, the non-significance is a result that the
exchange rate was overvalued most of the time.
Table 2
OLS estimates of the effect of fiscal credibility on INF, INFM, INFA, and E(INF)
Regressors OLS (HAC)
Equation (2) Equation (3) Equation (4) Equation (5)
Const. 0.051 0.166* -0.397** 4.563***
(0.108) (0.100) (0.202) (0.353)
INFt-1 0.496*** 2.096***
(0.053) (0.632)
INFMt-1 0.531***
(0.049)
INFAt-1 0.387***
(0.066)
Et(INF t+12) 0.040* 0.020 0.120***
(0.022) (0.019) (0.039)
GAPt -0.009*** -0.012*** -0.001 0.020
(0.003) (0.003) (0.010) (0.020)
(WPI+EX)t 0.337 -0.233 2.159 0.950
(0.476) (0.492) (1.481) (2.774)
FCREDt -0.084* -0.150** 0.142 -0.780**
(0.049) (0.060) (0.099) (0.331)
Adj. R² 0.509 0.470 0.344 0.430
F-statistic 32.896 28.348 17.185 29.998
Prob(F-statistic) 0.000 0.000 0.000 0.000
Note: Marginal significance levels: (***) denotes 0.01, (**) denotes 0.05, and (*) denotes 0.10.
Robust standard errors (Newey-West) are in parentheses.
13
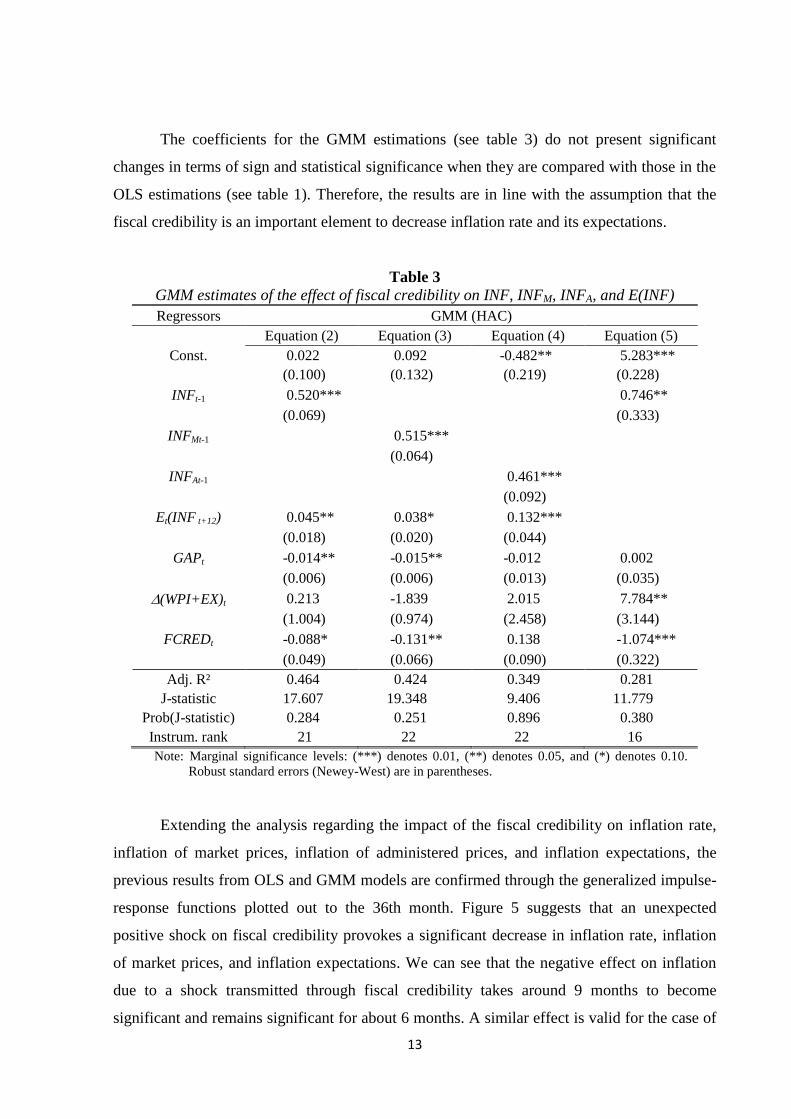
The coefficients for the GMM estimations (see table 3) do not present significant
changes in terms of sign and statistical significance when they are compared with those in the
OLS estimations (see table 1). Therefore, the results are in line with the assumption that the
fiscal credibility is an important element to decrease inflation rate and its expectations.
Table 3
GMM estimates of the effect of fiscal credibility on INF, INFM, INFA, and E(INF)
Regressors GMM (HAC)
Equation (2) Equation (3) Equation (4) Equation (5)
Const. 0.022 0.092 -0.482** 5.283***
(0.100) (0.132) (0.219) (0.228)
INFt-1 0.520*** 0.746**
(0.069) (0.333)
INFMt-1 0.515***
(0.064)
INFAt-1 0.461***
(0.092)
Et(INF t+12) 0.045** 0.038* 0.132***
(0.018) (0.020) (0.044)
GAPt -0.014** -0.015** -0.012 0.002
(0.006) (0.006) (0.013) (0.035)
(WPI+EX)t 0.213 -1.839 2.015 7.784**
(1.004) (0.974) (2.458) (3.144)
FCREDt -0.088* -0.131** 0.138 -1.074***
(0.049) (0.066) (0.090) (0.322)
Adj. R² 0.464 0.424 0.349 0.281
J-statistic 17.607 19.348 9.406 11.779
Prob(J-statistic) 0.284 0.251 0.896 0.380
Instrum. rank 21 22 22 16
Note: Marginal significance levels: (***) denotes 0.01, (**) denotes 0.05, and (*) denotes 0.10.
Robust standard errors (Newey-West) are in parentheses.
Extending the analysis regarding the impact of the fiscal credibility on inflation rate,
inflation of market prices, inflation of administered prices, and inflation expectations, the
previous results from OLS and GMM models are confirmed through the generalized impulse-
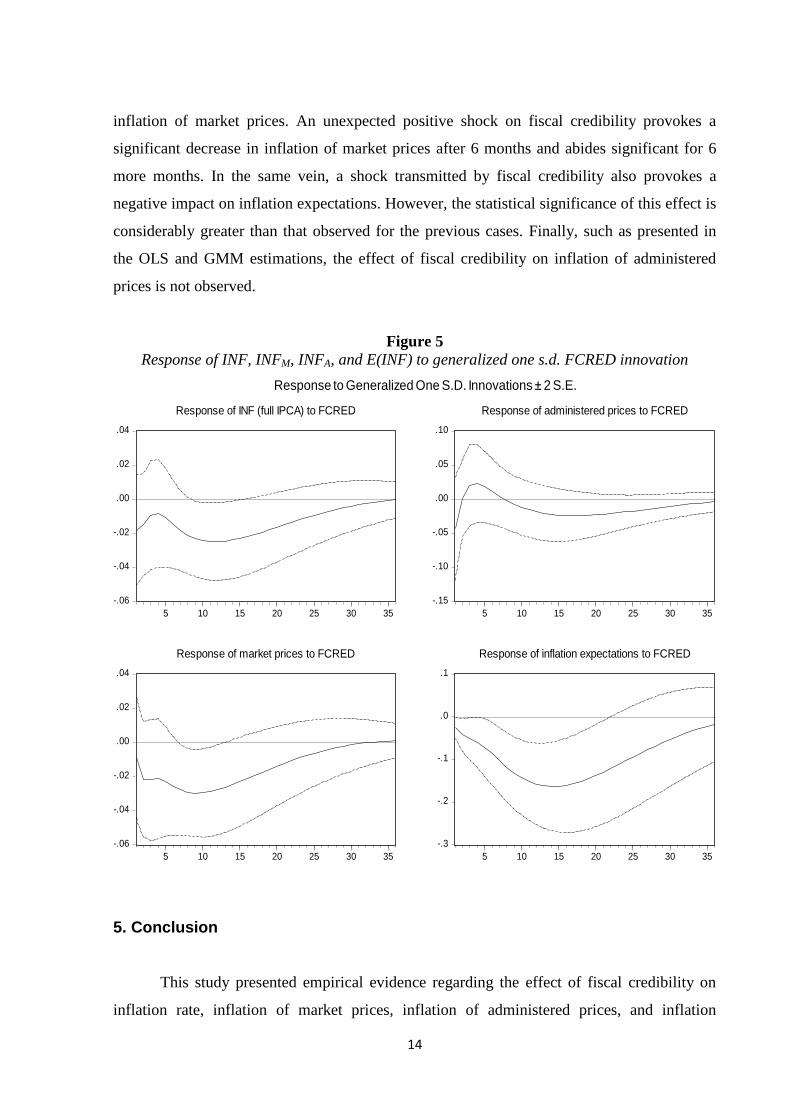
response functions plotted out to the 36th month. Figure 5 suggests that an unexpected
positive shock on fiscal credibility provokes a significant decrease in inflation rate, inflation
of market prices, and inflation expectations. We can see that the negative effect on inflation
due to a shock transmitted through fiscal credibility takes around 9 months to become
significant and remains significant for about 6 months. A similar effect is valid for the case of
14
inflation of market prices. An unexpected positive shock on fiscal credibility provokes a
significant decrease in inflation of market prices after 6 months and abides significant for 6
more months. In the same vein, a shock transmitted by fiscal credibility also provokes a
negative impact on inflation expectations. However, the statistical significance of this effect is
considerably greater than that observed for the previous cases. Finally, such as presented in
the OLS and GMM estimations, the effect of fiscal credibility on inflation of administered
prices is not observed.
Figure 5
Response of INF, INFM, INFA, and E(INF) to generalized one s.d. FCRED innovation
-.06
-.04
-.02
.00
.02
.04
5 10 15 20 25 30 35
Response of INF (full IPCA) to FCRED
-.15
-.10
-.05
.00
.05
.10
5 10 15 20 25 30 35
Response of administered prices to FCRED
-.06
-.04
-.02
.00
.02
.04
5 10 15 20 25 30 35
Response of market prices to FCRED
-.3
-.2
-.1
.0
.1
5 10 15 20 25 30 35
Response of inflation expectations to FCRED
Response to Generalized One S.D. Innovations ± 2 S.E.
5. Conclusion
This study presented empirical evidence regarding the effect of fiscal credibility on
inflation rate, inflation of market prices, inflation of administered prices, and inflation
15
expectations, in the Brazilian economy after the adoption of inflation targeting. One important
contribution in this study was the elaboration of a fiscal credibility index based on how the
market expectations are anchored to the primary surplus target. The findings suggest that the
success of government in achieving the fiscal primary surplus target (gain of credibility) is an
important ally to reduce inflation rate and its expectations.
6. References
BOGDANSKI, J., TOMBINI, A.A., WERLANG, S.R.C. (2000), “Implementing Inflation
Targeting in Brazil” (in) Inflation Targeting in Brazil, Central Bank of Brazil.
CBB - Central Bank of Brazil (2009). Inflation Report, March.
CUKIERMAN, A., MELTZER, A.H., (1986). “A theory of ambiguity, credibility, and
inflation under discretion and asymmetric information.” Econometrica, 54(5), 1099-1128.
de MENDONÇA, H.F., de GUIMARÃES e SOUZA, G.J. (2009). “Inflation targeting
credibility and reputation: the consequences for the interest rate.” Economic Modelling,
26(6), 1228-38.
de MENDONÇA, H.F., MACHADO, M.R. (2013). “Public debt management and credibility:
Evidence from an emerging economy.” Economic Modelling 30(1), 10-21.
de MENDONÇA, H.F., TOSTES, F.S., (2015). “The effect of monetary and fiscal credibility
on exchange rate pass-through in an emerging economy.” Open Economies Review,
26(4), 787-816.
KOOP, G., PESARAN, M. H., POTTER, S. M. (1996). “Impulse response analysis in non-
linear multivariate models.” Journal of Econometrics, 74(1), 119-147.
KUNCORO, H. (2015). “Does the Credible Fiscal Policy Support the Prices Stabilization?”
Review of Economic Perspectives, 15(2), 137-156.
LIN, S., YE, H. (2009). “Does inflation targeting make a difference in developing countries?”
Journal of Development Economics, 89(1), 118-123.
PESARAN, M.H., SHIN, Y. (1998). “Generalized impulse response analysis in linear
multivariate models.” Economic Letters, 58(1), 17-29.
SARGENT, T.J., WALLACE, N. (1981). “Some unpleasant monetarist arithmetic.” Federal
Reserve Bank of Minneapolis Quarterly Review, 5(3), 1-17.
SIMS, C. A. (1994). “A Simple Model for the Study of the Determination of the Price Level
and the Interaction of Monetary and Fiscal Policy.” Economy Theory, 4(3), 381-399.
WOODFORD, M. (2001). “Fiscal Requirements for Price Stability.” Journal of Money,
Credit and Banking, 33(3), 669-728.
WOOLDRIDGE, J. (2001). “Applications of Generalized Method of Moments Estimation.”
Journal of Economic Perspective, 15(4), 87-100.
16
Appendix
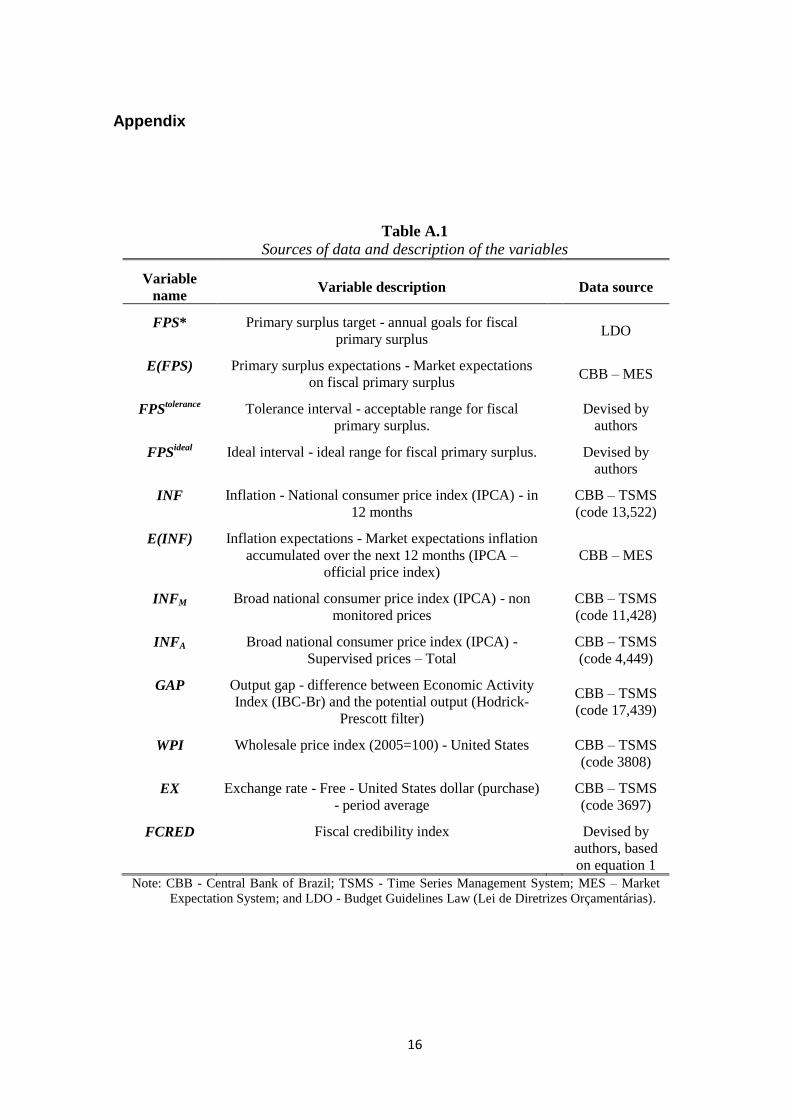
Table A.1
Sources of data and description of the variables
Variable
name Variable description Data source
FPS* Primary surplus target - annual goals for fiscal
primary surplus LDO
E(FPS) Primary surplus expectations - Market expectations
on fiscal primary surplus CBB – MES
FPStolerance Tolerance interval - acceptable range for fiscal
primary surplus.
Devised by
authors
FPSideal Ideal interval - ideal range for fiscal primary surplus.
Devised by
authors
INF Inflation - National consumer price index (IPCA) - in
12 months
CBB – TSMS
(code 13,522)
E(INF) Inflation expectations - Market expectations inflation
accumulated over the next 12 months (IPCA –
official price index)
CBB – MES
INFM Broad national consumer price index (IPCA) - non
monitored prices
CBB – TSMS
(code 11,428)
INFA Broad national consumer price index (IPCA) -
Supervised prices – Total
CBB – TSMS
(code 4,449)
GAP Output gap - difference between Economic Activity
Index (IBC-Br) and the potential output (Hodrick-
Prescott filter)
CBB – TSMS
(code 17,439)
WPI Wholesale price index (2005=100) - United States
CBB – TSMS
(code 3808)
EX Exchange rate - Free - United States dollar (purchase)
- period average
CBB – TSMS
(code 3697)
FCRED Fiscal credibility index
Devised by
authors, based
on equation 1
Note: CBB - Central Bank of Brazil; TSMS - Time Series Management System; MES – Market
Expectation System; and LDO - Budget Guidelines Law (Lei de Diretrizes Orçamentárias).
17
Table A.2
Descriptive statistics
Variables Mean Median Maximum Minimum Std. Dev.
INF 0.508 0.480 2.250 -0.210 0.315
E(INF) 5.452 5.508 12.237 3.437 1.282
INFM 0.504 0.500 1.640 -0.350 0.310
INFA 0.519 0.375 3.830 -1.110 0.624
GAP -9.75E-13 0.418 10.024 -13.502 4.246
(WPI+EX) 0.003 0.000 0.134 0.035 0.584
FCRED 0.276 0.083 1.000 0.000 0.332
Table A.3
Unit root tests (ADF, PP, and KPSS)
Series
ADF PP KPSS
Lags I/T Test C.V.
(5%) Band I/T Test
C.V.
(5%) Band I/T Test
C.V.
(10%)
INF 0 I -7.14 -2.88 2 I -7.20 -2.88 6 I 0.25 0.35
E(INF) 2 I+T -4.87 -3.44 6 I+T -6.56 -3.43 9 I 0.32 0.35
INFM 0 I -6.18 -2.88 6 I -6.08 -2.88 5 I 0.27 0.35
INFA 0 I -8.15 -2.88 5 I -8.16 -2.88 7 I 0.28 0.35
GAP 13 I -4.25 -1.94 2 -7.92 -1.94 5 I 0.03 0.35
(WPI+EX) 0 -9.69 -1.94 6 -9.65 -1.94 7 I+T 0.04 0.12
Note: C.V. = critical value. Trend (T) and intercept (I) are included based on Schwarz criterion. ADF – the final
choice of lag was made based on Schwarz criterion. PP and KPSS – spectral estimation method is Bartlett kernel
and the Newey West Bandwidth is used.
Table A.4
List of GMM instruments
Equation (2) INF(-2 to -6) E(INF)(-1 to -6) GAP(-1 to -2) (WPI+EX)(-1) FCRED(-1 to -6)
Equation (3) INFM(-2 to -6) E(INF)(-1 to -7) GAP(-1 to -2) (WPI+EX)(-1) FCRED(-1 to -6)
Equation (4) INFA(-2 to -3) E(INF)(-1 to -9) GAP(-1 to -3) (WPI+EX)(-1) FCRED(-1 to -6)
Equation (5) INF(-2 to -3) GAP(-1) (WPI+EX)(-1 to -6) FCRED(-1 to -6)
18
Table A.5
AIC, SIC, and HQ criteria for VAR
Order AIC SIC HQ
0 0.696 0.838 0.754
1 -7.085 -5.951 -6.625
2 -8.147* -6.020* -7.283*
3 -7.922 -4.803 -6.655
4 -7.810 -3.699 -6.140
5 -7.670 -2.566 -5.596
6 -7.694 -1.598 -5.217
7 -7.650 -0.562 -4.770
8 -7.562 0.518 -4.279
Note: (*) denotes lag order selected by the criterion.
Figure A.1
-1.5
-1.0
-0.5
0.0
0.5
1.0
1.5
-1.5 -1.0 -0.5 0.0 0.5 1.0 1.5
Inverse Roots of AR Characteristic Polynomial