Embed Size (px)
Citation preview
Fisheries Centre
The University of British Columbia
Working Paper Series
Working Paper #2015 - 77
Reconstruction of India’s marine fish catch from 1950-2010
Claire Hornby, Brajgeet Bhathal, Daniel Pauly and Dirk Zeller
Year: 2015
Email: [email protected]
This working paper is made available by the Fisheries Centre, University of British Columbia, Vancouver, BC, V6T 1Z4, Canada.
RECONSTRUCTION OF INDIA’S MARINE FISH CATCH FROM 1950-2010
Claire Hornby, Brajgeet Bhathal, Daniel Pauly and Dirk Zeller
Sea Around Us, Fisheries Centre, University of British Columbia,
2202 Main Mall, Vancouver, BC, V6T 1Z4, Canada
[email protected], [email protected], [email protected],
ABSTRACT
The Republic of India, located in South Asia, is a country that is mostly surrounded by ocean. It has 28
states (9 maritime) and 7 union territories (4 maritime). With a total population currently exceeding 1.2
billion people, India is the second most populous country in the world. There are marked oceanographic
differences between the east and west coasts. However, both the Bay of Bengal on the east and Arabian Sea
along the west coast provide rich marine resources to coastal communities. This study aims to evaluate the
current status of India’s marine fisheries by presenting a reconstruction of total marine fish catch from
1950-2010 (the Andaman and Nicobar Island group is not included here, and is covered elsewhere). It was
found that total extractions, by all sectors from within India’s mainland EEZ were over 155 million tonnes,
i.e., over twice the 75 million tonnes reported by FAO on behalf of India. The industrial sector, with over
54 million t was deemed the largest sector over the full time period, while the unreported subsistence
sector was estimated at nearly 51 million t, followed by the artisanal sector with nearly 50 million t. Illegal
fishing and ‘fishing down’ were both identified as being major threats to India’s fisheries, and without
changes to local monitoring and offshore enforcement, they will continue to operate at an unsustainable
levels.
INTRODUCTION
The Republic of India is a South Asia country bounded by oceans and located between latitudes 8° 4' and
37° 6' N and longitudes 68° 7' and 97° 25' E (Figure 1). It shares land borders with Pakistan on the west,
China, Nepal and Bhutan to the north, and Burma and Bangladesh to the east. India is the second most
populous country in the world, with approximately 1.2 billion people (2011 census), and contains 17.5% of
the total world population.1 With 28 states (9 maritime) and 7 union territories (UT; 4 maritime), India
covers a total land area of about 3.3 million km2 (Arora and Grover 1996). The west coast of India has 5
maritime states: Gujarat, Maharashtra, Goa, Karnataka, and Kerala (1-5, Figure 1) and two UTs, Daman
and Diu, and Lakshadweep. The east coast of India has 4 maritime states: Tamil Nadu, Andhra Pradesh,
Orissa, and West Bengal (6-9, Figure 1). The UTs in the east include Pondicherry and the Andaman and
Nicobar Islands, the latter not covered here. The marine waters of India encompass two Large Marine
Ecosystems (LMEs), the Arabian Sea along the west coast and the Bay of Bengal along the east. India’s
Exclusive Economic Zone (EEZ) covers a total area of 1.63 million km2 (including the Lakshadweep
1 http://www.censusindia.gov.in/2011-prov-results/data_files/india/Final_PPT_2011_chapter3.pdf
1
Islands on the west coast). As with most developing countries with vast coastlines, the rich resources of the
surrounding ocean play an important role in the national economy, diet and culture of the Indian people.
The marine fishing sector in India has shown steady growth since India’s independence in 1947. India’s
200 nautical mile EEZ was declared in 1976. The fisheries in west and east India are characterized by
noticeable differences in terms of the types of vessels, number of fishers and available resources
(Flewwelling and Hosch 2006). The west coast of India, known as the ‘Malabar coast’, has a wider
continental shelf and is known for its high primary production. It supports over 75% of India’s total fish
landings (Chandy 1970). The east coast, which is also known as the ‘Coromandel coast’, has a much
narrower shelf and primary production and fish catch from the Bay of Bengal are much lower than in the
Arabian Sea. Along the extensive coastline, there are approximately 3,827 fishing villages and 1,914
traditional landing centers (FAO 2004). The waters off India are known for their extensive diversity of
marine resources and traditional fishing has been a way of life for many coastal communities
The growth of India’s fisheries sector can be separated into three phases (Figure 2) (Bhathal 2005; Srinath
and Pillai 2006; Sathianandan et al. 2011). In phase one (1950-1966), landings were mainly by non-
mechanized traditional crafts and gears, such as hook and line, gillnets, seines, bag nets and traps, from
catamarans, canoes and plank built boats. During the second phase (1967-1986), these vessels were
modified to hold outboard engines of 5-9 hp (i.e., motorization)2, in order to travel farther and increase
fishing effort. In the third phase from about 1987 to 2010, major endeavors were made to further increase
mechanization3 and develop the industrial fishing sector (Rao and Murty 1993; Bhathal 2005). Vessels
were equipped to engage in multi-day voyages and a large expansion of fishing grounds was observed.
Despite this, India’s fisheries remain small-scale in nature and difficult to categorise, since boundaries
between subsistence (i.e., small-scale non-commercial) and artisanal (i.e., small-scale commercial) sectors
are blurred (Flewwelling and Hosch 2006). There are approximately 1.45 million fishers in India and the
bulk of marine fish landed (about 70%) is being targeted by mechanized fishing vessels (Funge-Smith et
al. 2005), which for the purpose of this report are defined as industrial.
Trawling has emerged as the most important method of exploiting demersal resources and accounts for
about half of the total Indian catch. Today, the mechanized/industrial fleets consist of small trawlers, pair
trawlers, purse seiners and gillnetters. Chartered and joint-venture trawlers, tuna longliners, and other
multi-purpose vessels (i.e., that catch prawn and fish), ultimately operated by foreign vessels, make up the
bulk of the industrial fleet and have been fishing off India’s coastline since 1972 (Devaraj 1996). Valuable
species such as Indian oil sardine (Sardinella longiceps), penaeid and non-penaeid shrimp, Indian
mackerel (Rastrelliger kanagurta), Bombay duck (Harpadon nehereus) and croakers (Micropogonias
2 Within the Indian context “motorization” refers to outboard engine propulsion, replacing or added to sails and oars of traditional craft; fishing operations are carried out manually.
3 “Mechanization” refers to the deployment of fishing crafts equipped with inboard engines.
2
spp.) are the primary targets, although various types of commercial finfish are often caught as by-catch
(Gordon 1991).
Large quantities of prawn and shrimp resources are also caught along the coasts of India in major
estuaries, creeks, brackish water lakes and backwaters. The most important estuaries are the Sundarbans
in West Bengal, and Godavary in Andhra Pradesh, each are estimated to produce approximately 1,000 t of
shrimp catch per year. The Chilka, in Orissa and the Pulicat, shared by Madras and Andhra Pradesh, are
vital brackish water lakes also know to yield about 1,000 t∙year-1. The most important backwater is the one
in the Cochin area of Kerala, with an estimated annual yield of over 10,000 t (Jones 1968). On the
northeast and west coast, prawn species are abundant and form a major portion of the subsistence fishery
(Jones 1968). The magnitude of the estuarine and backwater fishery for the entire country is notable, yet
the cumulative catch from these areas has not been estimated (Rao 2000).
The first offshore policy was developed in 1977, in hopes to initiate chartering arrangements with foreign
companies. However, the Maritime Zones of India (Regulation of Fishing by Foreign Vessels) Act came
into effect in 1981 to regulate fishing by foreign fishing vessels in India’s EEZ (Bhathal 2005). The number
of large trawlers increased from 37 in 1978 to 180 in 1991, most of which operated off the east coast from
Visakhapatnam (Rao 1988; Kurien 1995; Devaraj 1996). By the early 1980s, about 110 chartered and joint-
venture vessels were exploiting inshore grounds up to 50 m (Kurien 1995; Devaraj 1996). In 1983, depth
restrictions beyond 80 m were enforced which resulted in many foreign vessels leaving the country, as
most were targeting valuable shrimp species found inshore. The ‘Deep Sea Policy (1991)’ set the stage for
further foreign influence; however, the policy was rescinded in 1997 after protests from local fishers forced
the government to halt administering licenses to joint-venture companies (MOEF 2002).
The marine fisheries in India are regulated both by the Central and State Governments. Offshore fishing
within India’s EEZ by domestic and foreign fleets is managed by the Central government. However, there
is no comprehensive fisheries legislation (Rajagopalan 2011). Fisheries within the 12 nm territorial zone
fall under the jurisdiction of the States, which are responsible for managing and collecting official fisheries
statistics under the Marine Fishing Regulation Act (MFRA) (Bhathal 2005; Rajagopalan 2011). Along with
State governments, the Central Marine Fisheries Research Institute (CMFRI, www.cmfri.org.in) estimates
the annual fish landings by state and compiles the data for the entire country. National catch statistics
prior to 1994 were put through a rigorous statistical sampling procedure; however, since the mid-1990s,
changes to the sampling program caused deterioration of India’s marine production statistics (Malhotra
and Sinha 2007; Bhathal and Pauly 2008).
The national data collected by the CMFRI were used as a baseline to reconstruct India’s total marine
fisheries catches from 1950-2000 (details in Bhathal 2005), as most data published by other institutes and
departments were not available. India regularly reports commercial landings from the artisanal sector.
3
However, industrial landings have historically been unreported in the national data. Bhathal (2005)
estimated total catch by industrial vessels from 1972-2000, since the first commercial trawlers arrived in
India’s waters and began operation in 1972 (Devaraj 1996). Industrial and mechanized vessel discards
were also estimated, as they are rarely reported to designated institutes (Bhathal and Pauly 2008).
However, these estimates were considered to be conservative compared to previous reports on by-catch
and discards in India (Gordon 1991; Davies et al. 2009; Dineshbabu et al. 2010). Furthermore, it was
assumed that all by-catch was retained prior to 1970, as even low value species had a market, resulting in
negligible discards (Bhathal 2005).
An attempt at estimating fishery extractions, including illegal and unreported catches from India can be
found in Pramod (2012). Estimates of illegal fishing by Indian and foreign vessels, discards by industrial
trawlers, subsistence fishing, and underreporting by the artisanal sector were estimated during a 2008
field study. Pramod (2012) conducted interviews with fishers from the small-scale and mechanized sector,
in 9 out of 10 coastal states4 and in the Andaman and Nicobar Islands. In addition to reported catch,
Pramod (2012) findings suggested that approximately 1.5 million tonnes were unreported in 2008. The
highest unreported catch (approximately 1.2 million tonnes) was contributed by discarded by-catch from
industrial vessels. Often the low quality by-catch is discarded at sea in order to save space for storing
shrimps and valuable finfish (Devaraj 1996). Subsistence fishing, which is entirely missing from the catch
statistics (Morgan 2006), was very conservatively estimated at 149,000 t for the entire country, and
underreported catch within the artisanal sector was conservatively estimated at about 105,000 t. Pramod
(2012) also estimated discards by foreign-chartered trawlers and Letter of Permission (LoP) tuna
longliners, fishing within India’s EEZ intermittently from 1982-2009. Recreational catch by part-time
fishers and catches from remote fish landing centers, which are poorly monitored by government officials,
were incorporated into Pramod’s field study; however, individual estimates for these sectors were not
given.
According to the United Nations Food and Agriculture Organization (FAO), which has been compiling
annual catch data worldwide since 1950, reported landings by India have increased from 530,000 tonnes
in 1950 to approximately 3.2 million tonnes by 20105. In 2008, the country ranked eighth in global marine
fisheries catches. Currently, increased fishing pressure by excess fishing capacity results in overfishing and
fishing down the food web (Bhathal and Pauly 2008), and has depleted inshore resources and increased
catch of juveniles and discards (Somvanshi 2001; Sathiadhas 2005). It is apparent that the status of
marine fisheries in India must be critically evaluated. Therefore a further breakdown of India’s total
marine exactions is useful. The methodology and detailed taxonomic breakdown from Bhathal (2005),
serve as a foundation for the reconstruction of Indian catches to 2010. The information on discarding,
4 Goa and the union territory of Daman and Diu were not visited on this study. Information from the Lakshawdeep Islands was under review at the time Pramod (2012) was writing and therefore not included either.
5 Fishstat database http://www.fao.org/fishery/statistics/en.
4
subsistence and illegal fishing by foreign fishers presented by Pramod (2012) will also be used in the
present study to enhance estimates of unreported catches from India’s waters.
METHODS
National marine landing statistics
The Ministry of Agriculture collects, collates and compiles data on marine fish landings and fishing fleets
through the state governments, fisheries departments and central institutions like the CMFRI and the
Fishery Survey of India, or FSI (Malhotra and Sinha 2007). Under the Ministry of Agriculture, it is the
responsibility of the Department of Animal Husbandry, Dairying and Fisheries (DAHD) to report national
fisheries statistics to international agencies, such as the FAO. Regarding the coastal fishery around
mainland India, the CMFRI collects data on fish landings through a stratified multi-stage random
sampling procedure (Somvanshi et al. 1999; Srinath et al. 2006; Malhotra and Sinha 2007;
Vijayakumaran and Varghese 2011). It has been noted that fish production estimates are not very reliable,
and due to the long coastline, widely dispersed landing sites and diversity of fishing practices, finding
accurate catch statistics is challenging (Malhotra and Sinha 2007).
Discrepancies have been observed between the reported FAO catch statistics and national data presented
by the CMFRI (Moreno et al. 2012; Figure 3). Based on personal communications (to B. Bhathal) by
personnel of the Indian Council of Agriculture Research (ICAR), either CMFRI data or one collected
independently by the State Fisheries Departments are sent to FAO through the Ministry. In earlier years,
the State Governments obtained required statistics from the CMFRI; however, over time they gradually
started their own data collection. It is unknown when this transition may have occurred, but it is one
explanation for the inconsistencies in catch data. In addition, the FSI has been collecting data on
exploratory fishing of oceanic tuna resources in the Indian and Andaman and Nicobar EEZ, as well as
catches from foreign chartered and joint-venture operations (Somvanshi et al. 1999; Vijayakumaran and
Varghese 2011). The catches by chartered vessels flying Indian flags are reported on behalf of India, and
since the national CMFRI data do not include offshore industrial catch (Bhathal 2005), this may
contribute to the reported catch by FAO being higher.
Fisheries statistics are collected only from important landings places, although species that are destined
for export are recorded at the point of sale or export (Flewwelling and Hosch 2006; Morgan 2006). The
quality of monitoring by government, municipality or corporative bodies at any point remains poor. In
addition, improper handling of fish products at the wholesale markets results in poor quality of fish and
high amounts of unwanted species that are either discarded or used for fishmeal production (Kumar et al.
2008). At the majority of landing sites, all species are landed, whether for local consumption or export.
Due to this system, it has been recognized that at times aquaculture production may have been
erroneously incorporated into the official capture statistics (Morgan 2006). In addition, it has been noted
that fish originating from subsistence fishing, as well as catches originating from estuaries and backwaters
(Pramod 2012), are not included in the statistical collection (Morgan 2006). These issues of
5
underreporting of India’s marine catches, suggest that national catch statistics, and therefore the fisheries
statistics provided to the FAO, are incomplete and must be examined with caution.
Fishing sectors
Marine resources in India are targeted by four main fishery types, operating various types of fishing
vessels and gears: (1) artisanal fishers operate non-motorized vessels, (2) artisanal fishers operating
motorized vessels (with outboard motors of less than 50 hp) in inshore waters, (3) industrial fishers using
mechanized vessels (with inboard motors), and (4) industrial deep-sea vessels (Bhathal 2005). Sector-wise
landings as described in the annual CMFRI reports (1957-2010), were used to separate the total marine
catch using proportional breakdown by sector and year. It was assumed that, from 1950-1952 the artisanal
sector landed 100% of catches. Due to a gradual shift to vessels with motors, an increase in landings was
observed (Figure 2); resulting in both sectors (non-motorized and motorized) contributing to the artisanal
catch from 1952-1972. After 1983, landings from the artisanal sector begin to decrease as phase three of
India’s development plan was initiated. The number of industrial vessels steadily increased from the mid-
1970s to 2010, and the proportion of catch by the industrial sector (excluding industrial shrimp) increased
from zero in 1980 to 71.1% in 2010.
Industrial fisheries
Unlike most developing countries, India has never signed fisheries access agreements with distant water
fishing nations (DWFN) and has worked for decades to develop its own domestic industrial fishing fleet
(Flewwelling and Hosch 2006). The expansion of India’s small-scale fishing sector, which operates in
inshore waters, slowed substantially by 1970, while mechanized fishing in offshore waters increased
(Bhathal 2005). However, the CMFRI failed to obtain catch data from large-scale industrial vessels (M.
Srinath, pers. comm. 2004). Due to the inconsistencies and discrepancies in catch statistics (Moreno et al.
2012), it is likely that the DAHD or FSI is compiling data and reporting on behalf of the industrial fishery
to the FAO, resulting in higher catches in some years (Figure 3). In order to account for misreporting
issues, it was assumed that the differences in tonnage (most importantly for large pelagics from 1974 to
2007) were from large-scale industrial vessels fishing outside India’s EEZ and reported to the FAO by an
agency other than the CMFRI.
Shrimp fishery Crustaceans (prawn and lobster), form the most economically important resource in the marine landings
in India (Jones 1968; Radhakrishnan 2008). Small-boat shrimp trawling started on the west coast in the
early 1970s. It was estimated that out of the 875,400 t of marine fish caught in 1957, approximately 16%
(136,800 t) were contributed by the prawn and shrimp fishery, but this decreased to approximately 10% by
1970 (Jones 1968). The economically important prawns constitute the major portion of catches; these
include Penaeus, Metapenaeous, Parapenaeopsis and Solenocera shrimp. In addition, non-penaeid
species belonging to the genera Palaemon, Hippolysmata, and Acetes are also caught.
6
Shrimp landings and underreported industrial catch (i.e., shrimp catch) were previously estimated by
Bhathal (2005). However, these estimates are now considered too conservative; thus when added to the
CMFRI national data, they were lower than the catch reported to FAO in the early-1950s and 1970-1980.
In years when the reconstructed total was less than the reported FAO landings for ‘natantian decapods
nei’, the FAO total was accepted as is. Updated state shrimp data from the CMFRI was used from 2001-
2005, and from 2005-2010 the FAO reported landings were accepted as is.
Besides the industrial trawl fishery, substantial quantities of prawns are caught with traditional gears in
various estuaries, tidal creeks, brackish water lakes and backwaters along the coast (Panikkar and Menon
1956; Jones 1968; Radhakrishnan 2008). It was assumed that the artisanal contribution to shrimp
landings would be 100% from 1950-1958, and would gradually decrease to 17% in 1974 (Silas et al. 1984).
The industrial contribution to this fishery increased to 96% by 1990 and was held constant to 2010.
Giant tiger prawn
Giant tiger prawn (GTP; Penaeus monodon) is the largest Indian marine prawn, and is more common
along the east coast, especially the northern sections of West Bengal and Orissa. On the west coast, it is
caught in very low quantities, mostly in the north (Panikkar and Menon 1956; Jones 1968). FAO reported
an increase in landings of giant tiger prawn from the west coast from the late 1980s to 1990s. This is
primarily a cultured species on the west coast, suggesting that the reported ‘landings’ had mistakenly
included aquaculture production (Morgan 2006). Landings of GTP are not reported in the official catch
statistics until 1988. However, it is likely that prior to 1988 they would have been incorporated into
‘natantian decapods nei’. GTP landings from the east coast fluctuated from about 17,500 t∙year-1 in late
1980s to a peak of about 93,500 t in 2008. Conversely, 73,000 t was recorded on the west coast in 1988
and landings peaked at about 128,000 t in 2008. It has been noted that 92.2% of wild GTP catch
originates from the east coast, with the west coast only contributing the rest (Rao 2000). Using these
proportions, the FAO west coast reported GTP landings were separated into two categories: wild caught
(7.8%) and assumed aquaculture production (Figure 4). This assumed cultured production was subtracted
from the reported GTP landings for the west coast, as the present report only considers wild capture
fisheries.
Using the adjusted GTP landings, it was estimated that this species contributed approximately 11% to total
shrimp landings in 1988 and has increased to 22.5% by 2010. To estimate GTP landings prior to 1988, it
was assumed that they would contribute 5% to total shrimp landings in 1950 and gradually increased to
9% by 1988 (Figure 4). The previous breakdown for the east and west coast (92.2% and 7.8% respectively)
were applied to the total GTP landings to estimate catches on both coasts from 1950-1988.
7
Discards The practice of discarding shrimp by-catch in India is associated with long distance, multi-day fishing,
which applies to trawlers based in Visakhapatnam, Andhra Pradesh (Gordon 1991; Zacharia et al. 2006).
Trawl by-catch is generally not properly cared for, and thus discarded due to improper handling,
preservation and processing. According to one estimate, about 130,000 t∙year-1 of by-catch was discarded
by large trawlers alone in the northeast coast of India in 1988 (Gordon 1991; Rao and Murty 1993).
Industrial trawlers do not keep any records of their discards and the amount of by-catch discarded at sea
can vary by vessel, haul and season (Rao 1988).
Few studies have been conducted on by-catch and discards from Indian waters (George et al. 1981; Gordon
1991; Zacharia et al. 2006; Dineshbabu et al. 2010). However, the earliest survey of by-catch in India
found that 79% of the total landings in the shrimp trawl fishery consisted of non-shrimp catch (George et
al. 1981; Silas et al. 1984). By-catch estimates tend to vary among states (Boopendranath et al. 2010).
However, the data available suggest that one third of all by-catch is discarded (Davies et al. 2009).
Another source suggests that 20% of by-catch is lost, although this may be a conservative estimate
(Chandrapal 2007). It has been suggested that discards have declined since the 1990s, due to a reduction
in fleet size and catch of shrimp (Kelleher 2005). However, according to Pramod (2012), an estimated 0.9-
1.5 million tonnes are still discarded annually in the eight coastal states, representing about 32-53% of the
reported catch for India.
Discards and retained by-catch for the shrimp trawl fishery were calculated using reconstructed industrial
shrimp landings by state as described above. A 1:4 ratio of shrimp to by-catch was applied to all state
industrial shrimp catch from 1950-2010. Using information from Davies et al. (2009), it was estimated
that 33% of all by-catch was discarded from 1950-2010. Discards are considered to be negligible in non-
motorized fisheries and very low in motorized artisanal fisheries (Kelleher 2005). However, mechanized
(i.e., industrial) vessels discard unwanted species (Gordon 1991). Therefore, as done by Bhathal (2005), it
was assumed here that 2% of India’s total marine catch, excluding industrial shrimp, was discarded from
1950-2010.
Artisanal fisheries
The three largest artisanal fisheries on the west coast are Indian oil sardine, Bombay duck (Harpadon
nehereus) and prawn fisheries, while the main stocks exploited on the east coast include lesser sardines
(Sardinella spp.), silverbellies (Leiognathidae), penaeid shrimp, croakers (Sciaenidae), Hilsa spp., and
catfishes (Ariidae). Today, the main fisheries on the west and east coast are highly mechanized (i.e.,
industrial) and the traditional, non-motorized sector contributes less than 5%. For this report, the
artisanal sector consists of the non-motorized and inshore motorized fishing fleets.
8
Landing of fish takes place at numerous locations along the coast, both day and night. There are about
3,200 marine fishing villages and about 1,300 landing centers along the mainland coast (Srinath et al.
2006). Out of these landing centers, about 100 are considered ‘major’, i.e., centers that handle India’s
commercial marine catch of approximately 3 million tonnes (Srinath et al. 2006). The CMFRI describes
the use of a sampling method to quantify landings across all landing centres, and collect and submit the
data for the coastal fisheries on a monthly basis (Srinath et al. 2006; Malhotra and Sinha 2007). Issues
with this type of data collection include: no distinction of the type of gear used, the type and number of
boats are often ignored and species-specific catch data are often aggregated under a broad category, e.g.,
‘billfishes’ (Moreno et al. 2012).
Misreporting of India’s marine catches has been observed to differ along the coast and among different
fishing sectors. For example, the Government of Kerala made note of the difficulties in monitoring
marginal fisheries; thus, there is no organized landing procedure for brackish water catches, which are
typically brought directly home or taken to nearby coastal markets (Pramod 2012). According to Pramod
(2012), for many small-scale landing centers along the east coast, catches, which are sold as ‘lots’ (i.e.,
heaps of fish) were never weighed or recorded. In addition, interviews with fishers revealed that catches by
unregulated or unlicensed fishing boats, in both the artisanal and industrial sectors, are not quantified or
accounted for in the reported catch statistics.
The total catch contributed by the artisanal sector was calculated using a proportional breakdown, as
described earlier. To account for issues of mis/underreporting within this sector, artisanal catches
(including catch of shrimp by artisanal fishers) were conservatively increased by 10% from 1950-1990. As
previously mentioned, the CMFRI statistical collection and sampling procedure has shown deterioration
since the mid-1990s. It was therefore assumed that underreported catch from the artisanal sector would
increase gradually to 22% of the total catch in 1995, and remain in that range to 2010.
Molluscan catch
Many traditional artisanal vessels fishing for mollusks along India’s coast are unregistered. Also, much of
the molluscan catch from the shore, in mangrove and backwaters using shore seines, drag nets, push nets
and cast nets remains unrecorded (Kurien and Willmann 1982; Pramod 2012). Interviews with Fisheries
Department staff have confirmed that in some coastal states, there is not enough staff or budget to
quantify molluscan catch from remote areas (Pramod 2012). Pramod (2012) estimated that 42,420 t of
molluscs were harvested in 2008 and Suja and Mohamed (2010) have estimated that in the state of Kerala
alone, about 66,000 t of clams were landed in 2008-2009. The official reported landings for molluscs are
currently about 7,000 t∙year-1.
Using the official FAO data for ‘marine molluscs nei’ (reported from 1981-2010) and the estimate for 2008
from Pramod (2012), it was conservatively estimated that about 80% of molluscan catches were
unreported. This unreported proportion was applied to all catches from 1981-2010. In 1981, reported
9
landings were 50 t and then jump to 1,320 in 1981. It was therefore assumed that in 1950 total molluscan
catch (reported and unreported component) would be 250 t and was linearly interpolated to the total catch
derived in 1982 to estimate unreported catches from 1950-1980.
Subsistence Fishing communities rank amongst the poorest in India, and the push for modernization of the traditional
fishing fleets has reduced the production for home consumption and local markets, and shifted the focus
to international markets (Johnson 2001; Flewwelling and Hosch 2006; Sathiadhas et al. 2012). The tribal
population of the Sundarbans, the largest mangrove forest in the world, depend on its rich resources of
shrimp and other aquatic species (Das 2009). Thousands of people are engaged in shore-based fishing for
personal consumption, or sale in domestic market or export. The shore-based fishers in India, many of
them women and children (Koshy and Sharma 2007), are amongst the most marginalized and vulnerable
fishing populations.
Fish products intended for home consumption are not included in official Indian statistics, although they
represent a substantial component of marine fishery extractions (Morgan 2006). Thus, interviews by
Pramod (2012) with government officials and subsistence fishers revealed that catches by this sector are
rarely quantified, due to shortage of personnel and the opportunistic nature of this sector. In addition,
certain fisheries targeting demersal species also catch reef-dwelling species; however, due to the multi-
species nature of the fishes and since much of it is for subsistence, these catches have been poorly
documented as well (Rajasuriya et al. 2000).
Following Pramod’s field study, subsistence6 estimates were derived from a small sample of sites
(estuaries, backwaters or creeks) from each state and were not scaled up to reflect total subsistence catch
for the entire country. For example, the state of Gujarat has 14 coastal districts and four out of the five
total locations sampled from Gujarat were from the same district. Taking this into consideration, it was
assumed that the subsistence estimates conservatively only represented 10% of the total subsistence catch
of each state. All state estuary and reef-based subsistence estimates were scaled up to account for the un-
sampled districts (Table 1). The take-home catch of artisanal fishers was also included in the subsistence
estimate. Using the average take home catch per trip provided by Pramod (2012), the average take-home
catch for each state was re-calculated using the average trips per year (88.3) for artisanal fishers (Kurien
and Willmann 1982) and the number of fishing households in each state (Table 1). Also included in
Pramod (2012) were estimates for trawlers’ take-home catch and fish consumption at sea, which were
included in the subsistence estimate and accepted as is.
6 Subsistence fishing, as defined by Ganapathiraju (2012), is “localized fishing in inshore habitats (backwaters, creeks, intertidal areas) using traditional gears like push nets, cast nets and line etc. primarily for consumption at home and survival on a daily basis, without intention to generate profit or intend for commercial sale purposes.”
10
To estimate Indian subsistence catch from 1950-2010, we derived a per capita subsistence catch rate using
the scaled-up subsistence catch estimate from 2008 (Table 1) and the coastal rural population data
supplied by NASA’s Socioeconomic Data and Applications Centre, or SEDAC (CIESIN 2012). The
population data was presented by either coastal rural or urban locations, with a distance from the coastline
of between 5 and 200 km. We chose 10 km for the limit of marine subsistence effort, resulting in a coastal
subsistence rate of 13 kg∙person-1∙year-1. Data on coastal population were only available for the years 1990,
2000 and 2010; linear interpolations were used for years without data. To estimate coastal population in
earlier years, the proportion of people living on the coast in relation to India’s total population from 1990
was derived and applied to the total population from 1950-1990. Country wide population data were
obtained from the Government of India’s Census department,7 which was completed every ten years
starting in 1961 (Figure 5). In years with missing or incomplete data, population estimates were gathered
from the historical demography website8 or the World Bank.9 Interpolations were used for 1982-1985,
1991-2001, and 2001-2006.
Pramod (2012) suggests that prior to 1990, “subsistence fishers engaged in fishing throughout the year,
while in recent decades they find it difficult to eke out a living from fishing alone and are increasingly
compelled to work as manual daily wage labour in construction, agriculture and aquaculture for certain
periods of the year.” Taking this into account, the 1990 rate was increased by 50% to 20 kg∙person-1∙year-1,
and for 1950, a rate of 40 kg∙person-1∙year-1 was assumed; rates were interpolated between anchor points.
The 2008 rate was held constant to 2010. The per capita subsistence catch rates were applied to the 10 km
coastal population to estimate India’s total subsistence catch from 1950-2010.
Tuna fishery India’s tuna fishery consists of:
• A coastal fishery, mainly by artisanal fisheries using motorized boats but operating a number of traditional gears;
• An artisanal pole and line fishery based in the Lakshadweep Islands; • Small-scale longliners (mainly converted shrimp trawlers) targeting tuna within the EEZ; • An industrial longline fishery by joint-ventures (LoP Taiwanese vessels), targeting tuna off the
northwest coast and in the Andaman and Nicobar Islands.10
Coastal and oceanic tuna
Catch data for the tuna fishery included previously reconstructed totals from 1950-2005 (Bhathal 2005)
and landings data supplied by the CMFRI from 2006-2010. The CMFRI reports five categories of tuna:
kawakawa (Euthynnus affinis), frigate and bullet tunas (Auxis spp.), skipjack tuna (Katsuwonus pelamis),
longtail tuna (Thunnus tonggol) and an ‘other tunnies’ group. The FAO provides data on these species,
7 http://censusindia.gov.in/ [accessed May 7, 2013]. 8 http://www.populstat.info/[accessed May 7, 2013]. 9 http://data.worldbank.org/[accessed May 7, 2013]. 10 Andaman & Nicobar contributes about 2.2% to the national tuna landings. Coastal tuna catch for the islands were subtracted from
India’s reconstructed tuna catch and will be presented in a separate study.
11
except it includes a separate category for landings of bigeye (Thunnus obesus) and yellowfin tuna
(Thunnus albacares), which are likely incorporated into the ‘other tunnies’ group in the national data.
Catch data reported by the two agencies are generally the same from 1950-1970; however, from 1970-
2010, the FAO totals are higher for most years. It was assumed that the national data for tuna represented
catch by the coastal fishery (i.e., primarily artisanal) and the difference between the FAO and
reconstructed data would represent catches outside of the EEZ by the oceanic (industrial) fishery, likely
not reported by the CMFRI. The oceanic tuna catch in 1950, of 2 t, was linearly interpolated to 1970 (487 t)
to represent a gradual increase in mechanized vessels targeting oceanic tuna species.
The amount of tuna caught by coastal and oceanic fleets has been analyzed from 1990-1997 (Anon. 1999;
Somvanshi et al. 1999) and from 2006-2010 (Abdussamad et al. 2012). It was estimated that yellowfin
tuna catches by coastal fleets amounted to about 27,300 t∙year-1 and the oceanic fleet about 82,530 t∙year-1
from 2006-2010. However, FAO reports only about 17,200 t∙year-1 for the same time period, suggesting
that the landings for the oceanic fleet are underreported. Using this information, it was assumed that only
about 16% of yellowfin tuna catch is reported and 84% (mainly from the oceanic fishery) is unreported.
Using this percent breakdown, total unreported catch of yellowfin tuna by the oceanic fishery was
estimated from 1970-2010, as it was likely that prior to this catches would have been targeted by
traditional vessels that did not operate outside EEZ-equivalent waters.
Of the tuna catch landed by these vessels, kawakawa, skipjack and yellowfin tuna are the most common
catches of the coastal fishery, while for the oceanic fishery, yellowfin and skipjack make up the majority of
the catch (Somvanshi et al. 1999; Vijayakumaran and Varghese 2012). The by-catch associated with this
fishery is about 49% of the total catch and was calculated for both the coastal and oceanic tuna fishery.
Important species within the by-catch are billfish (Istiophorus platypterus, Makaira indica and Xiphias
gladius), seerfish (Scomberomorus commerson, S. guttatus, S. lineolatus, and Acanthocybium solandri)
and sharks (Somvanshi et al. 1999).
Joint-venture longliners
From 1985-1995, over 200 Taiwanese joint-venture (LoP) vessels were licensed to operate in the Indian
EEZ, exploiting offshore tuna resources, specifically yellowfin tuna (Shajahan 1996; Flewwelling and
Hosch 2006; Pramod 2012). The key fishing areas for these fleets are located off the north-west coast of
India and within the waters of the Andaman and Nicobar Islands. Catch data for the industrial tuna
fishery can be traced from voyage reports received by the FSI from these tuna longliners operating under
the LoP scheme. According to the Indian Ocean Tuna Commission (IOTC), all catches made by joint-
venture operations registered under the Indian flag are reported as domestic to the IOTC. Therefore, it was
assumed that the joint-venture tuna catch from 1986-2010 was reported to the appropriate agencies
(including FAO) as domestic.
12
Interviews with joint-venture longliners have suggested that only 20% of the actual catch caught during
the year is reported and by-catch is rarely reported (Pramod 2012). The rationale supporting this claim is
that the total amount of tuna landed by these vessels does not even cover the operating costs of the vessel,
let alone profit from the catch (Rao 2009; Pramod 2012). These vessels have also been observed to engage
in ‘flag hopping’ and will operate under an Indian flag in Indian waters and then switch to a Taiwanese flag
in international waters. This is done to illegally tranship the tuna catch caught from the Indian EEZ at sea
(Pramod 2012).
Information on the catch and by-catch contributed by LoP tuna vessels were available from 1983-1998
(Somvanshi et al. 1999) and from 2008-2009 (John and Pillai 2009; Vijayakumaran and Varghese 2010).
The reported catch in 1998 was interpolated to 2008, as no other information was available for those
years. It was also estimated that 80% of the total catch (tuna plus by-catch) went unreported. This
unreported proportion was applied to all LoP longline catches from 1986-2009. The catch from 2009 was
carried to 2010.
Foreign fishing
Industrial fishing has been dominated by foreign chartered or join-venture fishing companies from
Taiwan, China and Thailand (Anon. 1999). Owing to the fact that these vessels often land their catch
outside of India, the actual take of these industrial vessels is relatively unknown (Flewwelling and Hosch
2006). It has been documented that these vessels undertake long fishing trips, rarely return to registered
ports and are believed to also transship their catch at sea (Abdussamad et al. 2012; Pramod 2012). Illegal
catch by foreign fishing vessels was observed to be as high as 60,000 t annually, combined with an
estimated 1,840 t∙year-1∙vessel-1 (i.e., 8 t per day x 230 fishing days) of discarded by-catch (Devaraj 1996;
Pramod 2012). A detailed analysis of the discrepancies of foreign joint-venture and chartered tuna
longliners can be found in Pramod (2012).
Chartered tuna longliners
Fishing under the charter scheme was introduced in 1985 and peaked (about 12,570 t of mostly yellowfin
tuna) in 1990. The fleets comprised mainly Taiwanese-origin vessels flying flags of Panama or Honduras
(Somvanshi et al. 1999). Although joint-venture operations registered under the Indian flag are reported
as domestic to IOTC, chartered vessels that no do fly the Indian flag are apportioned to the flag country.
However, this may not always be the case, as concerns have been raised to possible double reporting of the
catch in India and Taiwan’s statistics for these chartered vessels (Anon. 1999).
Fishing effort and catch by chartered vessels was available from 1985-1995 (Somvanshi et al. 1999). As
joint-venture and Indian ownership agreements became more popular, the charter scheme was gradually
phased out between 1992 and 1995. Catch composition of these vessels consisted of yellowfin tuna (69%),
bigeye tuna (Thunnus obesus) (4%), billfish (19%) and other fishes, primarily sharks (8%). Catches were
13
assigned to the flag country of Panama and Honduras. Due to a lack of flag-specific information, 50% of
the catch was assigned to Panama and the other 50% to Honduras. Discards from foreign-chartered tuna
longliners were estimated by Pramod (2012) from 1985-1997. Discard rates were low (0.5-1.2 t∙haul-1),
mostly accounting for species of sharks of which only the fins were retained. The remaining species caught
in the by-catch typically go underreported.
Chartered trawlers
It was estimated during 1982-1983, 110 chartered or joint-venture trawlers operated in the inshore waters
along the south west coast and caught about 13 tonnes∙vessel-1∙day-1 (Devaraj 1996). These vessels were
also reported to discard their by-catch at a rate of 8 tonnes∙vessel-1∙day-1. Using these rates, Pramod (2012)
estimated the total discards by stern trawlers operating from 1982-1985 and 1990-1995, as well as pair
trawlers operating from 1990-1995. Using the total discarded tonnage and the above catch per unit effort
(CPUE), we were able to estimate the number of trawlers in operation during these time periods and the
total catch.
Although Devaraj (1996) discusses the development of offshore fishing by foreign vessels, there is no
mention of the origin of these companies (i.e., country) involved in fishing. Based on Pramond (2010) and
other documents (Vivekanandan et al. 2006), it was assumed that the catch by trawlers operating from
1983-1985 were primarily Taiwanese. Catch by chartered vessels from 1990-1995 were assigned to Taiwan,
Thailand and China in equal proportions.
These may only represent a small portion of foreign countries operating in India’s waters, as cases of
illegal fishing by South Korean, Pakistani, Sri Lankan and Bangladeshi trawlers have all been documented
(Pramod 2012). There is very little information on Chinese vessels fishing in the Indian EEZ (see online
supporting material for Pauly et al. 2013); however, recently the Sri Lankan government has allowed more
than a dozen Chinese fishing vessels to operate under the island country’s flag under an agreement called
‘distant water fishing’ (Martin 2013). These vessels are expected to fish heavily in the Wedge Bank area,
which is located between the southern tip of India and Sri Lanka.
TAXONOMIC COMPOSITION
Reported data
The taxonomic breakdown for the reported artisanal and industrial commercial catch data were derived
from the official catch statistics reported to the FAO and CMFRI on behalf of India (Table 2). The national
CMFRI species composition was used to improve general categories in the FAO data, such as the
‘anchovies nei’ into more detailed genus level i.e., Coilia, Setipinna, Stolephorus, Thrissina and Thryssa
species.
14
The reported ‘marine fishes nei’ category includes all varieties of commercially reported taxa, many
juveniles, that are caught in small amounts (Rao 1973). All reported taxa (Table 2) were included in the
taxonomic breakdown for the ‘marine fishes nei’, along with information provided in the Handbook for
Field Identification of Fish Species Occurring in the Indian Seas (Somvanshi 2009). All major families
and species not reported by the national or FAO data were included to improve overall taxonomic detail
(Table 3). All taxa were cross-referenced with FishBase (Froese and Pauly 2013) to ensure that they do
occur in the Indian EEZ, and that currently valid scientific names are used.
Unreported artisanal
The species composition and proportional breakdown for India’s marine catch derived by Bhathal (2005),
was applied to the estimated unreported artisanal component from 1950-2005 (Table 4). The data and
taxonomic breakdown from the CMFRI was used in 2010 and the proportions for each taxon were linearly
interpolated from 2005-2010 (Table 4). Species listed in the handbook mentioned above were also
incorporated to improve the existing taxonomic segregation and detail.
Molluscan fishery
The CMFRI provided limited catch data on molluscs, which were broken down into bivalves and
gastropods for some years (1987-2010). Details regarding the different taxa of molluscs occurring in the
India EEZ were found in Somvanshi (2009) and Narasimham (1991). Using this information, the resulting
taxonomic breakdown was applied to the unreported molluscan fishery from 1950-2010 (Table 5).
Shrimp fishery
Among the exploited shrimps, penaeid prawns contributes about 60% to country wide shrimp landings.
The most commercially important are: giant tiger prawn (Penaeus monodon), Indian white prawn (P.
indicus) and green tiger prawn (P. semisulcatus), which combined contribute about 40% and speckled
shrimp (Metapenaeus monoceros), greasyback shrimp (M. ensis) and jinga shrimp (M. affinis) contribute
20% each. Of the non-penaeid prawns, which comprise the remaining 40% of total shrimp landings,
sergestids (Acetes spp.), palaemonids and hippolytids (Hippolysmata spp.) are targeted.
By-catch and discards
Information regarding the incidence and composition of finfish and other crustaceans in the shrimp trawl
by-catch was provided by Silas et al. (1984), Boopendranath et al. (2010) and Clucas (1997). This derived
taxonomic breakdown was applied to the estimated retained by-catch from 1950-2010 (Table 6).
The discarded by-catch typically includes juveniles and low value species of finfishes, crabs, gastropods,
shrimps, cephalopods, jellyfish and stomatopods (Kurup et al. 2004). The same taxonomic composition
for the retained by-catch was applied to the estimated discards. However, high-value species (Clucas 1997)
were given lower proportions and lower-value species such as clupeids, cephalopods, and other
15
crustaceans, were assumed to have a larger contribution to shrimp trawl discards (Table 6). The other
mechanized discards were assumed to consist of unwanted commercial species, and thus the same
taxonomic breakdown as the unreported artisanal catch was applied (Table 4).
Subsistence
The taxonomic composition of the subsistence fishery for India was derived from a study of finfishes in the
Kali Estuary, Karnataka (Roopa et al. 2011), Ponnani Estuary (Bijukumar and Sushama 2000), important
species of fish, crustaceans and molluscs of Vembanad Lake, Karala (Suja and Mohamed 2010) and
Chilika Lake, Orissa (Mishra et al. 2012). As catch composition data were not available at species level, all
the major families were selected and assumed to contribute equally. The 41 major families, plus a
miscellaneous marine fish category, were then applied to all western and eastern mainland states from
1950-2010 (Table 7).
Tuna fishery
Kawakawa (Euthynnus affinis) was the major species, representing 41.9 % of the coastal total tuna catch,
followed by frigate and bullet tunas (Auxis spp.; 18.9 %), skipjack (Katsuwonus pelamis; 17.1 %), longtail
(Thunnus tonggol; 9.5 %), yellowfin tuna (Thunnus albacares; 8.6 %) and bonito (Sarda orientalis ; 3.0
%). The offshore fishery is primarily directed at yellowfin and skipjack, with some catch of bigeye tuna
(Thunnus obesus), kawakawa and longtail tuna.
By-catch related to the coastal and oceanic tuna fishery was almost half of the total tuna catch and
consisted of narrow-barred Spanish mackerel (Scomberomorus commerson), Indo-Pacific king mackerel
(S. guttatus), streaked seerfish (S. lineolatus) and wahoo (Acanthocybium solandri). The first two are the
most commercially important, contributing 59.9 % and 39.4 %, respectively, to the total catch of seerfishes
(Table 8). Of the billfishes, Indo-Pacific sailfish (Istiophorus platypterus), swordfish (Xiphias gladius)
and marlin (Istiompax indica) are the most common. In the offshore fishery for tuna, sharks (25%) (Table
8) are also caught as by-catch (Sivasubramaniam 1985).
Shark catches
The national data for India’s elasmobranch catch are reported under one general category from 1950-
1980; thereafter, separate categories for sharks, skates and rays are included. The FAO reports one
category of ‘sharks, rays and skates nei’, from 1950-2010. Using the proportional breakdown from
previously reconstructed data in Bhathal (2005), the reported landings were divided into sharks, rays and
skates from 1950-2005 (Table 9), and the 2005 proportions were extended to 2010.
Species composition of the most important sharks recorded in a tuna longline survey in the Indian and
Andaman and Nicobar EEZ (John and Varghese 2009) was used to provide a more detailed taxonomic
breakdown for sharks. Shark catches were allocated to the west and east coast and for those designated as
16
originating outside the EEZ, the taxonomic breakdown for the Andaman and Nicobar Islands was used
(Table 10). The same taxonomic breakdown was applied to the unreported shark by-catch from the
industrial tuna longline operations.
RESULTS Industrial fisheries
Reconstructed total catch for the industrial sector amounted to just over 54 million tonnes from 1950-
2010 (Figure 6). Reported landings in this sector totaled to over 32.8 million tonnes for the same time
period. With mechanization of vessels, landings quickly increased from around 30 t in 1953 to over
102,000 t by 1971. Landings exceeded 1 million t by 1994 and thereafter, were on average
1.4 million t∙year-1. Shrimp trawlers dominated the industrial catch and produced over 10 million tonnes
from 1950-2010. Total unreported industrial catch, contributed primarily by shrimp trawlers and the
offshore tuna fishery (see below) amounted to about 6.0 million tonnes from 1950-2010 (Figure 6).
Discards, generated by shrimp trawlers and other mechanized vessels, were estimated to be about 16
million tonnes from 1950-2010 (Figure 6).
Artisanal fisheries
The reconstructed total catch for the artisanal fisheries, including unreported artisanal catch and
unreported catches of molluscs, amounted to almost 49.9 million tonnes from 1950-2010 (Figure 7). This
excludes coastal artisanal tuna catch and unreported by-catch, which is described below. Official reported
landings of artisanal catch totaled to just over 42.7 million tonnes from 1950-2010 and it was estimated
that unreported catch was 7.2 million tonnes for the same time period (Figure 7). It was found that lack of
proper reporting of the molluscan fishery resulted in an estimated 656,000 t of unreported catch.
Tuna fisheries
Coastal tuna (artisanal)
The artisanal fishery for coastal tuna totaled about 1.4 million tonnes from 1950-2010 (Figure 8). In the
early years, landings of tuna were approximately 3,800 t∙year-1, increasing gradually with considerable
inter-annual variation to a peak of about 82,900 t in 2008 (Figure 8). By-catch from this fishery, which
was estimated to be almost half of the total catch of the coastal tuna fishery, was found to produce about
620,000 tonnes of unreported catch (Figure 8).
Oceanic tuna (industrial)
Although the offshore fishery for oceanic tuna was slow to develop, reconstructed total catch (including
by-catch) of this fishery amounted to over 4.3 million tonnes from 1950-2010 (Figure 9). Reported catches
increased from about 500 t in 1956 to almost 3,000 t by 1980. Landings increased throughout the 1980s
as joint-venture operations were introduced. From 2000-2008, average landings decrease slightly to
43,000 t∙year-1, then increased again to almost 70,000 t in 2010.
17
The unreported catch of yellowfin tuna totaled over 1.2 million tonnes from 1970-2010 (Figure 9). This
was an evolving fishery and average unreported catch increased from about 8,200 t in 1975 to
25,000 t∙year-1 by the mid-1980s. Total unreported by-catch produced by this fishery amounted to almost
2 million tonnes from 1950-2010 (Figure 9), of which about 184,600 t originated from joint-venture
longlining operations in 1983-2010.
Subsistence
The second largest sector in India, the reconstructed subsistence catch amounted to about 50.9 million t
over the 1950-2010 time period. Catches were estimated at 666,000 t∙year-1 in the 1950s, increased
steadily to a peak of 950,000 t in 1990, before declining to 860,000 t∙year-1 in the late 2000s (Figure 10).
The majority of subsistence catches originated from the Kerala state (22%), the West Bengal state (18%)
and the Orissa state (15%). While the majority of the subsistence catch originate from the take home catch
of the artisanal fishery (61.2%), a fair portion were also reconstructed from estuaries, backwaters and
mangrove areas (17.7%).
Foreign fishing
Catch by Taiwanese chartered trawlers fishing in India’s EEZ from 1982-1985 totaled almost 622,000 t,
while about 382,700 t were discarded (Figure 11). Pair and stern trawlers operating from 1990-1995,
caught about 118,000 t and discarded 73,100 t (Figure 11). The combined catch by all foreign countries
(Taiwan, China and Thailand) was almost 30,000 t in 1990, but decreased to 1,450 t in 1995.
Total catch (including by-catch) of chartered tuna longliners fishing in India’s waters from 1985-1995,
amounted to almost 40,000 t (Figure 11). These vessels were reported to discard 6,600 t of by-catch for
the same time period. The highest catch of 12,600 t was recorded in 1990; thereafter, an average of
3,900 t∙year-1 was caught from 1991-1995 (Figure 11).
Reconstructed total catch
The total reconstructed catch by India from within the Indian mainland EEZ was estimated to be over 156
million tonnes from 1950-2010 (Figure 12a; Appendix A1). This total catch by all sectors is over twice the
official landings of just over 75 million tonnes reported by India as domestic EEZ catches for the same
time period. The industrial sector dominated time series catches, with over 55 million t, accounting for
36% of total Indian EEZ catches. Within industrial catches, landings accounted for 59% (33 million t),
while 29% (i.e., 16 million t) were discards and the remaining 6.7 million t were deemed unreported
catches. The second largest sector was the subsistence sector, which was not included in the official catch
statistics, and which was estimated here to be almost 51 million tonnes and 33% of the total reconstructed
catch (Figure 12a). Lastly, the artisanal sector contributed nearly 50 million tonnes and represented 32%
of the total reconstructed catch. Within this sector, unreported artisanal catch (including molluscs) and
18
unreported by-catch from the coastal tuna fishery was estimated to be approximately 7.2 million tonnes
from 1950-2010.
The total reconstructed catch from 1950-2010 was dominated by eleven families: Clupeidae, Penaeidae
Scombridae, Sciaenidae, Synodontidae, Carangidae, Engraulidae, Leiognathidae, Sergestidae, Trichiuridae
and Ariidae (Figure 12b, Appendix A2).
Foreign catches within India’s mainland EEZ totalled 1.3 million tonnes, and they were dominated by seven taxa: Penaeidae, Sergestidae, Decapoda, Palaemonidae, Scombridae, Leiognathidae and Sciaenidae.
DISCUSSION The total reconstructed catch for mainland India’s marine fisheries was estimated to be over twice the
official landings reported by FAO (about 75 million tonnes within the EEZ) on behalf of India for the 1950-
2010 time period. Due to successive subsidy-driven motorization and industrialization (mechanization)
schemes , India’s domestic fishing fleets and the marine catch they generated have been increasing since
the mid-1970s (Figure 12a). The industrial sector contributed 35% of the total reconstructed catch, and is
dominated by catches of shrimp, small pelagics and large (offshore) pelagic species such as tuna, billfishes
and sharks. This sector generated 21 million tonnes of unreported catch and unreported industrial
discards from the shrimp trawl fishery and other mechanized vessels. The subsistence sector, which is not
included in any official catch statistics, was estimated to be the second largest sector, with over 50 million
tonnes and represented 33% of the total reconstructed catch (Figure 12a). The artisanal (small-scale
commercial) sector contributed slightly less than the subsistence sector, i.e., 32% of the total reconstructed
catch. This sector has been declining since the 1970s and many coastal species have reportedly been fully
or overexploited. Underreported artisanal catch, including molluscs, and large amounts of unreported by-
catch from the coastal tuna fishery contributed over 7.2 million tonnes to this sector. Thus, the small-scale
fisheries (artisanal and subsistence) accounted for 65% of the total Indian catch, illustrating the
significance of small-scale fisheries in India (see also Pauly 2006).
Discrepancies between the national (CMFRI) reported data and the official landings reported to FAO have
raised serious concerns regarding the lack of routine monitoring of industrial fleets and LoP tuna vessels.
Many species of oceanic tuna and larger pelagics typically caught as by-catch were either underreported or
not included within the CMFRI data (such as yellowfin tuna and separate categories for billfish). The FAO
database showed a better taxonomic representation for these species. However, it was found that in most
cases, large pelagics were still grossly underreported.
The push for modernization of the traditional vessels in India, and the overall marine catch increases
observed through the 1980s-1990s (Figure 2) stemmed from a desire to promote the transformation of
India’s fisheries into more industrial activities (Rao and Murty 1993). The offshore expansion that this
19
required was viewed as unproblematic, as the assumption was made that rich resources were available in
deeper waters. However, the deep waters around India are unproductive, as they are generally oxygen
deficient (Banse 1968; Longhurst and Pauly 1987). Therefore, the subsidized trawlers added to the Indian
fleets since the 1980s have resulted in increased competition with small-scale fishers operating close
inshore. Much of the coastal resources are described as being ‘overfished’, and the open access regime is
identified as one of the main reasons for this current situation (Flewwelling and Hosch 2006). There is
also evidence that ‘fishing down’ has occurred in Indian waters (Bhathal and Pauly 2008).
A study published by the CMFRI (2008) shows an overall decrease in landings of major commercial
species and groups such as non-penaeid/penaeid shrimps, ribbonfishes, Bombay duck, threadfin breams
and cuttlefishes from 2006-2010. Also, it has been suggested that Bombay duck and pomfrets
(Stromateidae) have declined by 25% each, sharks and rays by 28%, and prawns by 35% in the past decade
(Rao 2013). One reason behind this is that fishers are more often catching juvenile, under-sized fish,
which are driving populations down further. In addition, larger fish like the Bombay duck do not seem to
be able to tolerate increasing ocean temperatures, which is affecting fish growth in India and globally
(Cheung et al. 2012).
Foreign fishing and joint-venture operations have historically been controversial and continue to be a
prominent issue for Indian fisheries. The foreign fishery by chartered longline and trawl operations was
estimated in this study to account for 800,000 t of catch, with approximately 462,400 t of discards from
1982-1995. This should be taken as a conservative estimate, as detailed information on foreign fishing is
scarce and cases of illegal fishing have been frequent in Indian waters (Pramond 2010). Although no
foreign flagged vessels are currently allowed to fish within the EEZ, recent reports from Kerala-based
fishers have indicated possible entry of 91 foreign fishing vessels into Indian waters; “..this is not a new
phenomenon, rather this jack-in-the-box is simply a resurgence of an old problem (Karnad 2012).” It is
not known what foreign countries these vessels belong to.
The LoP (joint-venture) scheme introduced in 2002 was thought to correct the major downfalls of the
chartered vessels fishing in the 1990s. However, it created a whole new game for foreign companies to
abuse, often claiming to be in partnerships with Indian companies to allow for continued fishing in Indian
waters. Lack of proper enforcement and regulation of these vessels in and outside of the Indian EEZ, has
allowed foreign companies to continue re-flagging and transshipping their catch at sea undetected. Thus,
the Indian government lost about 24,000 tonnes through illegal transshipments by Taiwanese owned
longliners operating under the LoP scheme in 2007 alone (Pramod 2012). It has been suggested that
improved vessel monitoring systems (including compulsory satellite VMS) and strict requirements for LoP
vessels to land all their catch in Indian ports before exporting to foreign ports, would help decrease the
massive underreporting and economic loss. In addition, all foreign vessels should require 100%
20
independent onboard observer coverage to better account for catch, by-catch and discards (Zeller et al.
2011).
This study, along with previous work (Bhathal 2005; Bhathal and Pauly 2008; Pramod 2012), has
highlighted many factors behind the unreporting of catch in the Indian EEZ. Issues such as weak
governance, overcapacity in the artisanal and industrial fisheries and insufficient monitoring of foreign
chartered vessels, have all contributed to overfishing of the Indian coastal resources. Small-scale fisheries
interests have largely been neglected and many coastal communities have been displaced and affected by
industrial development and land reclamation (Pramod 2012). The offshore expansion into deeper waters
was probably the main reason for the growth then maintenance of Indian fisheries catches (Bhathal and
Pauly 2008). However, this expansion must be accounted for when evaluating the health and productivity
of Indian fisheries, as true trends in the status of fisheries (e.g., changes in mean trophic level and changes
in mean size of fishes) are masked when catch data are not disaggregated spatially (Pauly et al. 2012).
Given their spatial expansion, it is apparent that Indian marine fisheries are operating unsustainably.
Moreover, the discrepancies described above between actual and official reported landings suggest a need
for improvements in the national data collection system, to regularly make and report estimates for poorly
and non-monitored sectors to ensure comprehensive accounts of all fishing sector and components (Zeller
et al. 2007). This study, which provides a more comprehensive analysis of total extractions of India’s
marine fisheries, also highlights the need for measures, at a local and government level, to reduce effort
and increase enforcement, in order to avoid further depletion of resources.
ACKNOWLEDGMENTS We would like acknowledge the support of the Sea Around Us, a scientific collaboration between The
University of British Columbia and The Pew Charitable Trusts.
21
REFERENCES Abdussamad EM, Said Koya KP, Rohit P, Joshi KK, Ghosh S, Elayathu MNK, Prakasan D, Sebastine M,
Beni M and Syda Rao G (2012) Fishery of yellowfin tuna Thunnus albacares (Bonnaterre, 1788) in the Indian EEZ with special reference to their biology and population characteristics. Indian Journal of Fisheries 59(3): 43-51.
Anon. (1999) Report of the expert consultation on Indian Ocean tunas, 7th session. IOTC/SP/99/01, IOTC, Victoria, Seychelles. 58 p.
Arora R and Grover V (1996) Land and the People. pp. 1-8 In Arora R and Grover V (eds.), Land and people, governments, constitution and central acts. Deep & Deep, New Delhi.
Banse K (1968) Hydrology of the Arabian Sea Shelf of India and Pakistan and effects on demersal fishes. Deep-Sea Research 15: 45-79.
Bhathal B (2005) Historical reconstruction of Indian marine fisheries catches, 1950-2000, as a basis for testing the ‘Marine Trophic Index'. Fisheries Centre Research Reports 13(4), Fisheries Centre, University of British Columbia, Vancouver, Canada. 122 p.
Bhathal B and Pauly D (2008) 'Fishing down marine food webs' and spatial expansion of coastal fisheries in India, 1950-2000. Fisheries Research 91: 26-34.
Bijukumar A and Sushama S (2000) Ichthyofauna of Ponnani estuary, Kerala. Marine Biological Association of India 42(1/2): 182-189.
Boopendranath MR, Sabu S, Gibinkumar TR and Pravin P (2010) Soft bycatch reduction devices for bottom trawls: A review. Fishery Technology 47(2): 99-110.
Chandrapal G (2007) Status of trash fish utilization and fish feed requirements in aquaculture-India. pp. 241-247 In Anon. (ed.) Collected papers on the APFIC regional workshop on "Low value and trash fish in the Asia-Pacific region" Hanoi, Viet Nam, 7-9 June 2005. Asian-Pacific Fishery Commission AD HOC, Bangkok.
Chandy M (1970) Fishes. National Book Trust, New Delhi. XI+166 p. Cheung W, Sariento JL, Dunne J, Frölicher TL, Lam V, Palomares M, Watson R and Pauly D (2012)
Shrinking of fishes exacerbates impacts of global ocean changes on marine ecosystems. Nature Climate Change 3: 254-258.
CIESIN (2012) National Aggregates of Geospatial Data Collection: Population, Landscape, And Climate Estimates, Version 3 (PLACE III). Center for International Earth Science Information Network (CIESIN)/Columbia University, Palisades, NY. Available at: http://sedac.ciesin.columbia.edu/data/set/nagdc-population-landscape-climate-estimates-v3. [Accessed: Nov 21, 2012].
Clucas I (1997) A study of the options for utilization of bycatch and discards from marine capture fisheries. FAO Fisheries Circular No. 928, FAO, Rome. 59 p.
CMFRI (2008) CMFRI research highlights 2007-2008. Central Marine Fisheries Research Institiute, Kochi. 41 p.
Das M (2009) Impact of commerical coastal fishing on the environment of Sundarbans for sustainable development. Asian Fisheries Science 22: 157-167.
Davies RWD, Cripps SJ, Nickson A and Porter G (2009) Defining and estimating global marine fisheries bycatch. Marine Policy 33: 661-672.
Devaraj M (1996) Deep sea fishing in Indian waters. Proceedings of the seminar on fisheries-A multibillion dollar industry, Central Marine Fisheries Research Institute, Madras. 35-41 p.
Dineshbabu AP, Thomas S and Radhakrishnan EV (2010) Bycatch from trawlers with special reference to its impact on commercial fishery, off Mangalore. pp. 327-334 In Meenakumari B, Boopendranath MR, Edwin L, Sankar TV, Gopal N and Ninan G (eds.), Coastal fishery resources of India- conservation and sustainable utilisation. Society of Fisheries Technologists.
FAO (2004) India. Fishery and aquaculture country profile, Food and Agriculture Organization of the United Nations, Rome. Available at: http://www.fao.org/fishery/countrysector/FI-CP_IN/en [Accessed: August 24, 2012].
Flewwelling P and Hosch G (2006) Country review: India (East coast). pp. 111-125 In De Young C (ed.) Review of the state of world marine capture fisheries managment: Indian Ocean. FAO Fisheries Technical Paper 448, Rome.
Froese R and Pauly D (2013) FishBase. Available at: www.fishbase.org [Accessed: February 6, 2013]. Funge-Smith S, Lindebo E and Staples D (2005) Asian fisheries today: the production and use of low
value/trash fish from marine fisheries in the Asia-Pacific region. FAO, Bangkok. 47 p.
22
George M, Suseelan C and Balan K (1981) Bycatch of the shrimp fishery in India. Marine fisheries information service, technical and extension series 28, Central Marine Fisheries Research Institute, Cochin. 1-13 p.
Gordon A (1991) Bycatch from Indian trawlers in Bay of Bengal.BOBP/WP/68, Bay of Bengal program. 29 p.
John M and Varghese B (2009) Decline in CPUE of oceanic sharks in the Indian EEZ : Urgent need for precautionary approach. IOTC working party on ecosystems and bycatch, 12-14 October 2009, Mombasa, Kenya, IOTC-2009-WPEB-17. 10 p.
John ME and Pillai NGK (2009) Current status of tuna fisheries in India. IOTC-2009-SC-INF05, Indian Ocean Tuna Commision. 10 p.
Johnson D (2001) Wealth and waste: contrasting legacies of fisheries development in Gujarat since 1950. Economic and Political Weekly 36(13): 1095-1097+1099-1102.
Jones S (1968) Prawn fishery recources of India. p. 582 In Mistakidis MN (ed.) Proceedings of the world scientific conference on the biology and culture of shrimps and prawns. FAO Fisheries Report No. 57, Vol. 4, Rome.
Karnad D (2012) Trawling in real hot water. Researchers for Wildlife Conservation. Available at: http://www.rwcindia.org/2012/08/trawling-in-real-hot-water/ [Accessed: July 29, 2013].
Kelleher K (2005) Discards in the world's marine fisheries. An update. FAO Fisheries Technical Paper 470, Rome. 131 p.
Koshy N and Sharma C (2007) Shoring up: In the wake of the adoption of the Work in Fishing Convention, 2007, working conditions in shore-based fishing operations must be improved. Samudra Report 48: 17-21.
Kumar B, Ganesh, Datta KK, Joshi PK, Katiha PK, Suresh R, Ravisankar T, Ravindranath K and Menon M (2008) Domestic fish marketing in India-changing structure, conduct, preformance and policies. Agriculture Economics Research Review 21: 345-354.
Kurien J (1995) Impact of joint ventures on fish economy. Economic and Political Weekly 30(6): 300-302. Kurien J and Willmann R (1982) Economics of artisanal and mechanized fisheries in Kerala. A study on
costs and earnings of fishing units. Small-scale fisheries promotion in South Asia. RAS/77/044, FAO/UNDP project, Madras. 128 p.
Kurup BM, Premlal P, Thomas JV and Anand V (2004) Status of epifaunal component in the bottom trawl discards along Kerala coast (South India). Fishery Technology 41(2): 101-108.
Longhurst A and Pauly D (1987) Ecology of tropical oceans. Academic Press, Inc., San Diego. 369 p. Malhotra SP and Sinha VRP (2007) Fisheries statistics. pp. 266-315 In Malhotra SP and Sinha VRP (eds.),
Indian fisheries and aquaculture in a globalizing economy: part 1. Narendra Publishing House, Delhi.
Martin KA (2013) Fishermen alarmed by Chinese vessels under Lankan flag. The Hindu, edition of June 23, 2013. Available at: http://www.thehindu.com/news/cities/Kochi/fishermen-alarmed-by-chinese-vessels-under-lankan-flag/article4843720.ece#comments [Accessed: June 28, 2013].
Mishra S, Jha BC and Das AK (2012) Ichthyofaunal diversity of Chilika Lake- the southern sector. Chemical, Biological and Physical Sciences 3(1): 345-353.
MOEF (2002) Marine and coastal enviornment. Ministry of Environment, New Delhi. 24 p. Available at: http://envfor.nic.in/divisions/ic/wssd/doc2/ch11.pdf [Accessed: Nov. 11, 2012].
Moreno G, Herrera M and Pierre L (2012) Pilot project to improve data collection for tuna, sharks and billfish from artisanal fisheries in the Indian Ocean. Part II: Revision of catch statistics for India, Indonesia and Sri Lanka (1950-2011). Assigment of species and gears to the total ctach and issues on data quality. Fifteenth session of the scientific commitee, 10-15 December 2012. IOTC-2012-SC15-38[E], IOTC, Victoria, Seychelles. 6 p.
Morgan G (2006) Country review: India (West coast). pp. 221-236 In Young CD (ed.) Review of the state of world marine capture fisheries managment: Indian Ocean. FAO Fisheries Technical Paper 488, Rome.
Narasimham KA (1991) Present status of clam fisheries of India. The Marine Biological Association of India 33(1/2): 76-88.
Panikkar N and Menon N (1956) Prawn fisheries of India. Proceedings of Indo-Pacific Fisheries Council 6(3): 328-336.
Pauly D (2006) Major trends in small-scale marine fisheries, with emphasis on developing countries, and some implications for the social sciences. Maritime Studies 4(2): 7-22.
23
Pauly D, Belhabib D, Blomeyer R, Cheung W, Cisneros-Montemayor A, Copeland D, Harper S, Lam V, Mai Y, Le Manach F, Österblom H, Mok KM, van der Meer L, Sanz Antonio A, Shon S, Sumaila UR, Swartz W, Watson R, Zhai Y and Zeller D (2013) China's distant-water fisheries in the 21st century. Fish and Fisheries DOI: 10.1111/faf.12032.
Pauly D, Kleisner K, Bhathal B, Boonzaier L, Freire K, Greer K, Hornby C, Lam V, Palomares M, McCrea Strub A, van der Meer L and Zeller D (2012) Towards increasing fisheries’ contribution to food security. Part I: The potentials of Brazil, Chile, India and the Philippines. Report by the Sea Around Us Project to Oceana, University of British Columbia, Vancouver. 111 p.
Pramod G (2012) Illegal and unreported fishing: global analysis of incentives and a case study estimating illegal and unreported catches from India. Doctor of Philosophy thesis, University of British Columbia, Recource Management and Environmental Studies, Vancouver. 343 p.
Pramond G (2010) Illegal, Unreported and Unregulated marine fish catches in the Indian Exclusive Economic Zone. Field Report: Policy and ecosystem restoration in fisheries, Fisheries Research Centre, University of British Columbia, Vancouver. 29 p.
Radhakrishnan EV (2008) Status of crustacean fishery resources. pp. 22-31 In Vivekanandan E and Jayasankar J (eds.), Winter school on impact of climate change on Indian marine fisheries. CMFRI, Cochin.
Rajagopalan R (2011) India. pp. 33-49 In Sanders JS, Gréboval D and Hjort A (eds.), Marine protected areas: country case studies on policy, governance and institutional issues. FAO Fisheries and Aquaculture Technical Paper 556/1, Rome.
Rajasuriya A, Zahir H, Muley EV, Subramanian BR, Venkataraman K, Wafar MVM, Munjurul Hannan Khan SM and Whittingham E (2000) Status of coral reefs in South Asia: Bangladesh, India, Maldives, Sri Lanka. pp. 841-846 In Moosa MK, Soemodihardjo S, Soegiarto A, Romimohtarto K, Nontji A, Soekarno and Suharsono (eds.), Proceedings of the Ninth International Coral Reef Symposium, Vol. 2. International Coral Reef Society, Bali.
Rao K (2013) Bombay duck: iconic fish fast disappearing from city's coastal waters. The Guardian. Available at: http://www.guardian.co.uk/environment/blog/2013/mar/22/bombay-duck-mumbai-fish [Accessed: March 27, 2013].
Rao KV (1973) Distribution pattern of the major exploited marine fishery resources of India. pp. 19-101 In Qasim SZ (ed.) Proceedings of the symposium on living resources of the seas around India. CMFRI, Cochin.
Rao PV and Murty VS (1993) Complexitites of management of inshore fishery resources of India. Fishing Chimes 13(8): 5-8.
Rao SG (1988) Prawn fishery by the 'big trawlers' along the northeast coast. pp. 15-30 In CMFRI (ed.) Technical and Extension Series, Vol. 87. Marine Fisheries Information Service, Central Marine Fisheries Research Institute, Koci.
Rao SG (2000) The Indian tiger prawn Penaeus monodon Fabricius. pp. 511-524 In Pillai V and Menon N (eds.), Marine fisheries research and management. CMFRI, Kerala.
Rao SG (2009) Deep-sea fisheries of India. B.R. Publishing Corporation, Delhi. 520 p. Roopa S, Rathod J and Vasanth kumar B (2011) Fin fish diversity in Kali Estuarine ecosystem of Karwar,
Karnataka. World Journal of Science and Technology 1(3): 22-25. Sathiadhas R (2005) Policy issues for marine fisheries managment in India. pp. 348-366 In Vasudevappa
C, Basavaraju D, Seenappa S, Ayyappan S and Ravichandra Reddy S (eds.), The seventh Indian fisheries forum proceedings. AFSIB Mangalore.
Sathiadhas R, Narayanakumar R and Aswathy N (2012) Marine fish marketing in India. Central Marine Fisheries Research Institute, Kochi. 276 p.
Sathianandan TV, Jayasankar J, Kuriakose S, Mini KG and Mathew WT (2011) Indian marine fishery resources: optimistic present, challenging future. Indian Journal of Fisheries 58(4): 1-15.
Shajahan KM (1996) Deep sea fishing policy: a critique. Economic and Political Weekly 31(5): 263-266. Silas E, George M and Jacob T (1984) A review of the shrimp fisheries of India: a scientific basis for the
management of the resources. pp. 83-103 In Gulland J and Rothschild B (eds.), Penaeid shrimps-their biology and management. Fishing News Books, Farnham, Surrey.
Sivasubramaniam K (1985) The tuna fishery in the EEZs of India, Maldives and Sri Lanka. pp. 19-47 In FAO (ed.) The tuna fisheries in the EEZs of India, Maldives and Sri Lanka. Bay of Bengal Programme, Marine Fishery Resource Management, BOBP/WP/31, Colombo, Sri Lanka.
Somvanshi V (2001) Issues concerning marine fisheries and fisheries management in India. pp. 21-32 In FAO (ed.) Fish code MCS/Legal: Report of the national workshop on fisheries management (Goa,
24
India, 12-17 Feb 2001). FAO/NORWAY GOVERNMENT GCP/INT/648/NOR COOPERATIVE PROGRAMME Field Report C-7 (En), Goa.
Somvanshi VS (2009) Handbook for field identification of fish species occurring in the Indian Seas. Fishery Survey of India, Mumbai. 160 p.
Somvanshi VS, Pillai NGK and John ME (1999) Current status of fisheries for tunas and tuna-like fishes in India. pp. 31-35 In Anon. (ed.) Report of the Expert Consultation on Indian Ocean Tunas, 7th Session, 9-14 November, 1998. Indian Ocean Tuna Commission, IOTC/SP/99/01, Victoria, Seychelles.
Srinath M, Kuriakose S, Ammini PL, Prasad CJ, Ramani K and Beena MR (2006) Marine fish landings in India 1985-2004. CMFRI Special Publication 89Kerala. 161 p.
Srinath M and Pillai NGK (2006) Marine fisheries of India: an approach to responsible fisheries management. Fishing Chimes 26(4): 23-28.
Suja N and Mohamed K (2010) The black clam, Villorita cyprinoides, fishery in the state of Kerala, India. Marine Fisheries Review 72(3): 48-61.
Vijayakumaran K and Varghese S, P (2011) India's national report to the scientific committee of the Indian Ocean Tuna Commission. Fishery Survey of India, Mumbai. 12 p.
Vijayakumaran K and Varghese S, P (2012) India's national report to the Scientific Committee of the Indian Ocean Tuna Commission. Fishery Survey of India, Mumbai. 13 p.
Vijayakumaran K and Varghese SP (2010) Update on the status of tuna fisheries in India. IOTC-2010-SC-INF12, Indian Ocean Tuna Commision. 6 p.
Vivekanandan E, Mohamed K, Pillai N and Rohit P (2006) Offshore fisheries resources of India. Central Marine Fisheries Research Institute, Cochin. 20 p. Available at: www.apfic.org/modules/smartsection/visit.php?fileid=949 [Accessed: Oct 29, 2012].
Zacharia P, Krishnakumar P, Durgekar NR, Anoop A and Muthiah C (2006) Assessment of bycatch and discards associated with bottom trawling along Karnataka coast, India. pp. 434-445 In Kurup BM and Ravindran K (eds.), Proceedings of the international symposium on improved sustainability of fish production systems and appropriate technologies for utilization. 16-18 March, 2005. School of Industrial Fisheries, Cochin University of Science and Technology, Cochin.
Zeller D, Booth S, Davis G and Pauly D (2007) Re-estimation of small-scale fisheries catches for U.S. flag island areas in the Western Pacific: the last 50 years. Fisheries Bulletin 105: 266-277.
Zeller D, Rossing P, Harper S, Persson L, Booth S and Pauly D (2011) The Baltic Sea: estimates of total fisheries removals 1950-2007. Fisheries Research 108: 356-363.
25
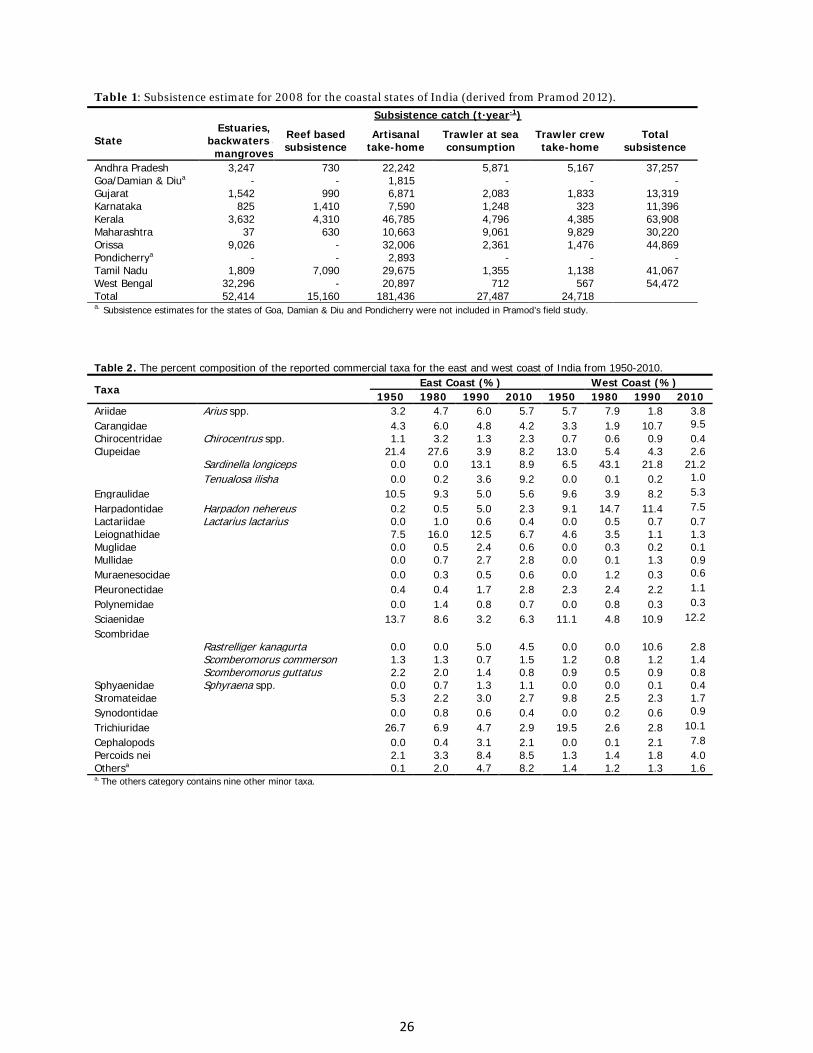
Table 1: Subsistence estimate for 2008 for the coastal states of India (derived from Pramod 2012). Subsistence catch (t·year-1)
State Estuaries,
backwaters & mangroves
Reef based subsistence
Artisanal take-home
Trawler at sea consumption
Trawler crew take-home
Total subsistence
Andhra Pradesh 3,247 730 22,242 5,871 5,167 37,257 Goa/Damian & Diua - - 1,815 - - - Gujarat 1,542 990 6,871 2,083 1,833 13,319 Karnataka 825 1,410 7,590 1,248 323 11,396 Kerala 3,632 4,310 46,785 4,796 4,385 63,908 Maharashtra 37 630 10,663 9,061 9,829 30,220 Orissa 9,026 - 32,006 2,361 1,476 44,869 Pondicherrya - - 2,893 - - - Tamil Nadu 1,809 7,090 29,675 1,355 1,138 41,067 West Bengal 32,296 - 20,897 712 567 54,472 Total 52,414 15,160 181,436 27,487 24,718 a. Subsistence estimates for the states of Goa, Damian & Diu and Pondicherry were not included in Pramod’s field study. Table 2. The percent composition of the reported commercial taxa for the east and west coast of India from 1950-2010.
Taxa East Coast (%) West Coast (%) 1950 1980 1990 2010 1950 1980 1990 2010
Ariidae Arius spp. 3.2 4.7 6.0 5.7 5.7 7.9 1.8 3.8 Carangidae 4.3 6.0 4.8 4.2 3.3 1.9 10.7 9.5 Chirocentridae Chirocentrus spp. 1.1 3.2 1.3 2.3 0.7 0.6 0.9 0.4 Clupeidae
21.4 27.6 3.9 8.2 13.0 5.4 4.3 2.6
Sardinella longiceps 0.0 0.0 13.1 8.9 6.5 43.1 21.8 21.2
Tenualosa ilisha 0.0 0.2 3.6 9.2 0.0 0.1 0.2 1.0
Engraulidae 10.5 9.3 5.0 5.6 9.6 3.9 8.2 5.3
Harpadontidae Harpadon nehereus 0.2 0.5 5.0 2.3 9.1 14.7 11.4 7.5 Lactariidae Lactarius lactarius 0.0 1.0 0.6 0.4 0.0 0.5 0.7 0.7 Leiognathidae 7.5 16.0 12.5 6.7 4.6 3.5 1.1 1.3 Muglidae 0.0 0.5 2.4 0.6 0.0 0.3 0.2 0.1 Mullidae
0.0 0.7 2.7 2.8 0.0 0.1 1.3 0.9
Muraenesocidae 0.0 0.3 0.5 0.6 0.0 1.2 0.3 0.6
Pleuronectidae 0.4 0.4 1.7 2.8 2.3 2.4 2.2 1.1
Polynemidae 0.0 1.4 0.8 0.7 0.0 0.8 0.3 0.3
Sciaenidae 13.7 8.6 3.2 6.3 11.1 4.8 10.9 12.2
Scombridae
Rastrelliger kanagurta 0.0 0.0 5.0 4.5 0.0 0.0 10.6 2.8
Scomberomorus commerson 1.3 1.3 0.7 1.5 1.2 0.8 1.2 1.4
Scomberomorus guttatus 2.2 2.0 1.4 0.8 0.9 0.5 0.9 0.8
Sphyaenidae Sphyraena spp. 0.0 0.7 1.3 1.1 0.0 0.0 0.1 0.4 Stromateidae 5.3 2.2 3.0 2.7 9.8 2.5 2.3 1.7 Synodontidae 0.0 0.8 0.6 0.4 0.0 0.2 0.6 0.9
Trichiuridae 26.7 6.9 4.7 2.9 19.5 2.6 2.8 10.1
Cephalopods 0.0 0.4 3.1 2.1 0.0 0.1 2.1 7.8 Percoids nei 2.1 3.3 8.4 8.5 1.3 1.4 1.8 4.0 Othersa
0.1 2.0 4.7 8.2 1.4 1.2 1.3 1.6
a. The others category contains nine other minor taxa.
26
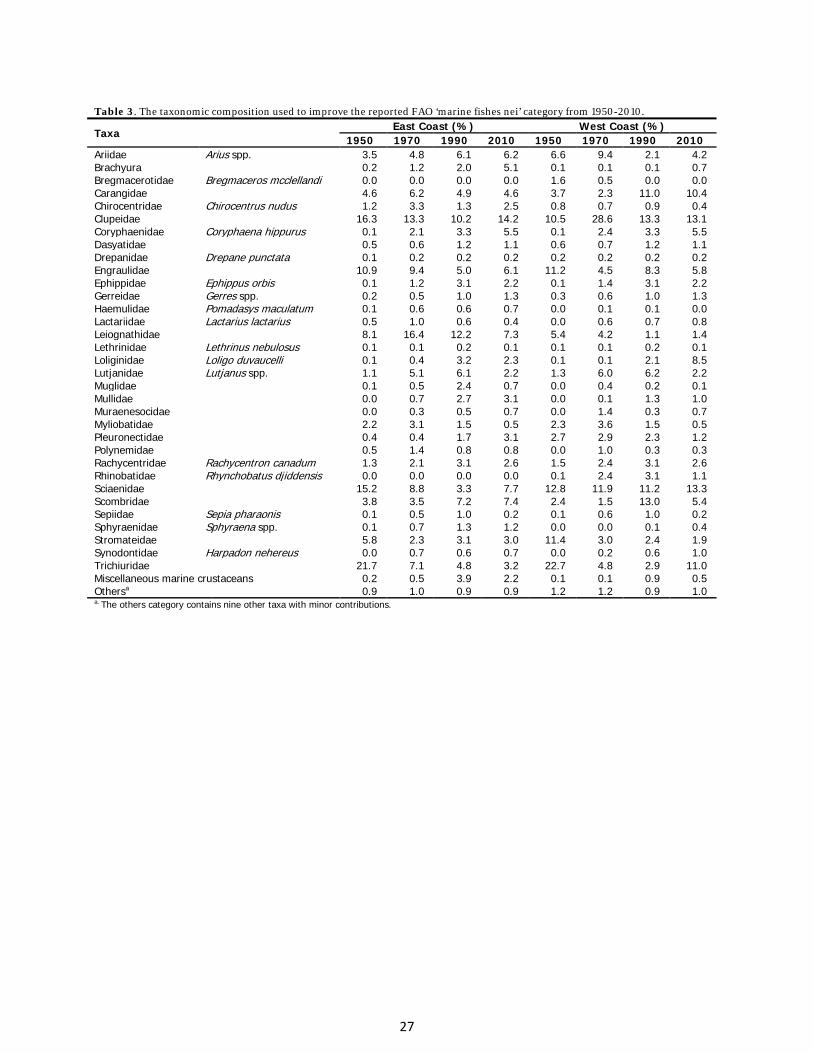
Table 3. The taxonomic composition used to improve the reported FAO ‘marine fishes nei’ category from 1950-2010.
Taxa East Coast (%) West Coast (%)
1950 1970 1990 2010 1950 1970 1990 2010 Ariidae Arius spp. 3.5 4.8 6.1 6.2 6.6 9.4 2.1 4.2 Brachyura 0.2 1.2 2.0 5.1 0.1 0.1 0.1 0.7 Bregmacerotidae Bregmaceros mcclellandi 0.0 0.0 0.0 0.0 1.6 0.5 0.0 0.0 Carangidae 4.6 6.2 4.9 4.6 3.7 2.3 11.0 10.4 Chirocentridae Chirocentrus nudus 1.2 3.3 1.3 2.5 0.8 0.7 0.9 0.4 Clupeidae 16.3 13.3 10.2 14.2 10.5 28.6 13.3 13.1 Coryphaenidae Coryphaena hippurus 0.1 2.1 3.3 5.5 0.1 2.4 3.3 5.5 Dasyatidae 0.5 0.6 1.2 1.1 0.6 0.7 1.2 1.1 Drepanidae Drepane punctata 0.1 0.2 0.2 0.2 0.2 0.2 0.2 0.2 Engraulidae 10.9 9.4 5.0 6.1 11.2 4.5 8.3 5.8 Ephippidae Ephippus orbis 0.1 1.2 3.1 2.2 0.1 1.4 3.1 2.2 Gerreidae Gerres spp. 0.2 0.5 1.0 1.3 0.3 0.6 1.0 1.3 Haemulidae Pomadasys maculatum 0.1 0.6 0.6 0.7 0.0 0.1 0.1 0.0 Lactariidae Lactarius lactarius 0.5 1.0 0.6 0.4 0.0 0.6 0.7 0.8 Leiognathidae 8.1 16.4 12.2 7.3 5.4 4.2 1.1 1.4 Lethrinidae Lethrinus nebulosus 0.1 0.1 0.2 0.1 0.1 0.1 0.2 0.1 Loliginidae Loligo duvaucelli 0.1 0.4 3.2 2.3 0.1 0.1 2.1 8.5 Lutjanidae Lutjanus spp. 1.1 5.1 6.1 2.2 1.3 6.0 6.2 2.2 Muglidae 0.1 0.5 2.4 0.7 0.0 0.4 0.2 0.1 Mullidae 0.0 0.7 2.7 3.1 0.0 0.1 1.3 1.0 Muraenesocidae 0.0 0.3 0.5 0.7 0.0 1.4 0.3 0.7 Myliobatidae 2.2 3.1 1.5 0.5 2.3 3.6 1.5 0.5 Pleuronectidae 0.4 0.4 1.7 3.1 2.7 2.9 2.3 1.2 Polynemidae 0.5 1.4 0.8 0.8 0.0 1.0 0.3 0.3 Rachycentridae Rachycentron canadum 1.3 2.1 3.1 2.6 1.5 2.4 3.1 2.6 Rhinobatidae Rhynchobatus djiddensis 0.0 0.0 0.0 0.0 0.1 2.4 3.1 1.1 Sciaenidae 15.2 8.8 3.3 7.7 12.8 11.9 11.2 13.3 Scombridae 3.8 3.5 7.2 7.4 2.4 1.5 13.0 5.4 Sepiidae Sepia pharaonis 0.1 0.5 1.0 0.2 0.1 0.6 1.0 0.2 Sphyraenidae Sphyraena spp. 0.1 0.7 1.3 1.2 0.0 0.0 0.1 0.4 Stromateidae 5.8 2.3 3.1 3.0 11.4 3.0 2.4 1.9 Synodontidae Harpadon nehereus 0.0 0.7 0.6 0.7 0.0 0.2 0.6 1.0 Trichiuridae 21.7 7.1 4.8 3.2 22.7 4.8 2.9 11.0 Miscellaneous marine crustaceans 0.2 0.5 3.9 2.2 0.1 0.1 0.9 0.5 Othersa 0.9 1.0 0.9 0.9 1.2 1.2 0.9 1.0 a. The others category contains nine other taxa with minor contributions.
27
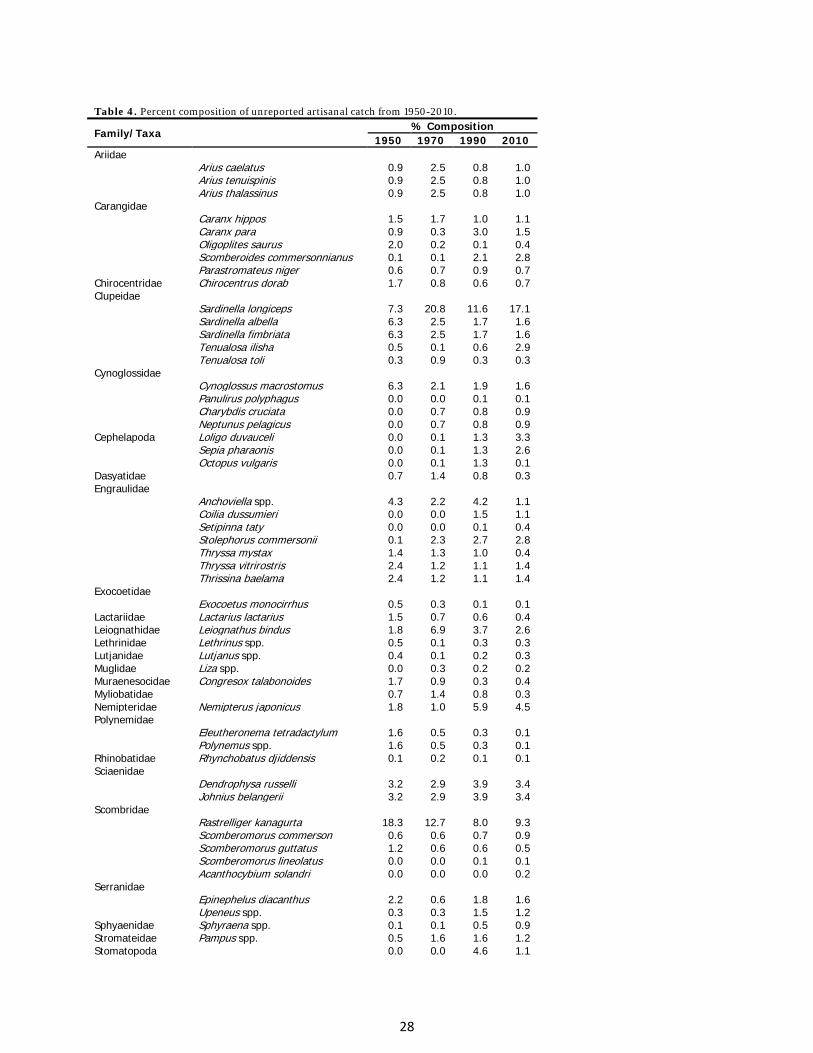
Table 4. Percent composition of unreported artisanal catch from 1950-2010.
Family/Taxa % Composition
1950 1970 1990 2010 Ariidae
Arius caelatus 0.9 2.5 0.8 1.0 Arius tenuispinis 0.9 2.5 0.8 1.0 Arius thalassinus 0.9 2.5 0.8 1.0 Carangidae
Caranx hippos 1.5 1.7 1.0 1.1 Caranx para 0.9 0.3 3.0 1.5 Oligoplites saurus 2.0 0.2 0.1 0.4 Scomberoides commersonnianus 0.1 0.1 2.1 2.8 Parastromateus niger 0.6 0.7 0.9 0.7 Chirocentridae Chirocentrus dorab 1.7 0.8 0.6 0.7 Clupeidae
Sardinella longiceps 7.3 20.8 11.6 17.1 Sardinella albella 6.3 2.5 1.7 1.6 Sardinella fimbriata 6.3 2.5 1.7 1.6 Tenualosa ilisha 0.5 0.1 0.6 2.9 Tenualosa toli 0.3 0.9 0.3 0.3 Cynoglossidae
Cynoglossus macrostomus 6.3 2.1 1.9 1.6 Panulirus polyphagus 0.0 0.0 0.1 0.1 Charybdis cruciata 0.0 0.7 0.8 0.9 Neptunus pelagicus 0.0 0.7 0.8 0.9 Cephelapoda Loligo duvauceli 0.0 0.1 1.3 3.3 Sepia pharaonis 0.0 0.1 1.3 2.6 Octopus vulgaris 0.0 0.1 1.3 0.1 Dasyatidae 0.7 1.4 0.8 0.3 Engraulidae Anchoviella spp. 4.3 2.2 4.2 1.1 Coilia dussumieri 0.0 0.0 1.5 1.1 Setipinna taty 0.0 0.0 0.1 0.4 Stolephorus commersonii 0.1 2.3 2.7 2.8 Thryssa mystax 1.4 1.3 1.0 0.4 Thryssa vitrirostris 2.4 1.2 1.1 1.4 Thrissina baelama 2.4 1.2 1.1 1.4 Exocoetidae
Exocoetus monocirrhus 0.5 0.3 0.1 0.1 Lactariidae Lactarius lactarius 1.5 0.7 0.6 0.4 Leiognathidae Leiognathus bindus 1.8 6.9 3.7 2.6 Lethrinidae Lethrinus spp. 0.5 0.1 0.3 0.3 Lutjanidae Lutjanus spp. 0.4 0.1 0.2 0.3 Muglidae Liza spp. 0.0 0.3 0.2 0.2 Muraenesocidae Congresox talabonoides 1.7 0.9 0.3 0.4 Myliobatidae 0.7 1.4 0.8 0.3 Nemipteridae Nemipterus japonicus 1.8 1.0 5.9 4.5 Polynemidae
Eleutheronema tetradactylum 1.6 0.5 0.3 0.1 Polynemus spp. 1.6 0.5 0.3 0.1 Rhinobatidae Rhynchobatus djiddensis 0.1 0.2 0.1 0.1 Sciaenidae
Dendrophysa russelli 3.2 2.9 3.9 3.4 Johnius belangerii 3.2 2.9 3.9 3.4 Scombridae
Rastrelliger kanagurta 18.3 12.7 8.0 9.3 Scomberomorus commerson 0.6 0.6 0.7 0.9 Scomberomorus guttatus 1.2 0.6 0.6 0.5 Scomberomorus lineolatus 0.0 0.0 0.1 0.1 Acanthocybium solandri 0.0 0.0 0.0 0.2 Serranidae
Epinephelus diacanthus 2.2 0.6 1.8 1.6 Upeneus spp. 0.3 0.3 1.5 1.2 Sphyaenidae Sphyraena spp. 0.1 0.1 0.5 0.9 Stromateidae Pampus spp. 0.5 1.6 1.6 1.2 Stomatopoda 0.0 0.0 4.6 1.1
28
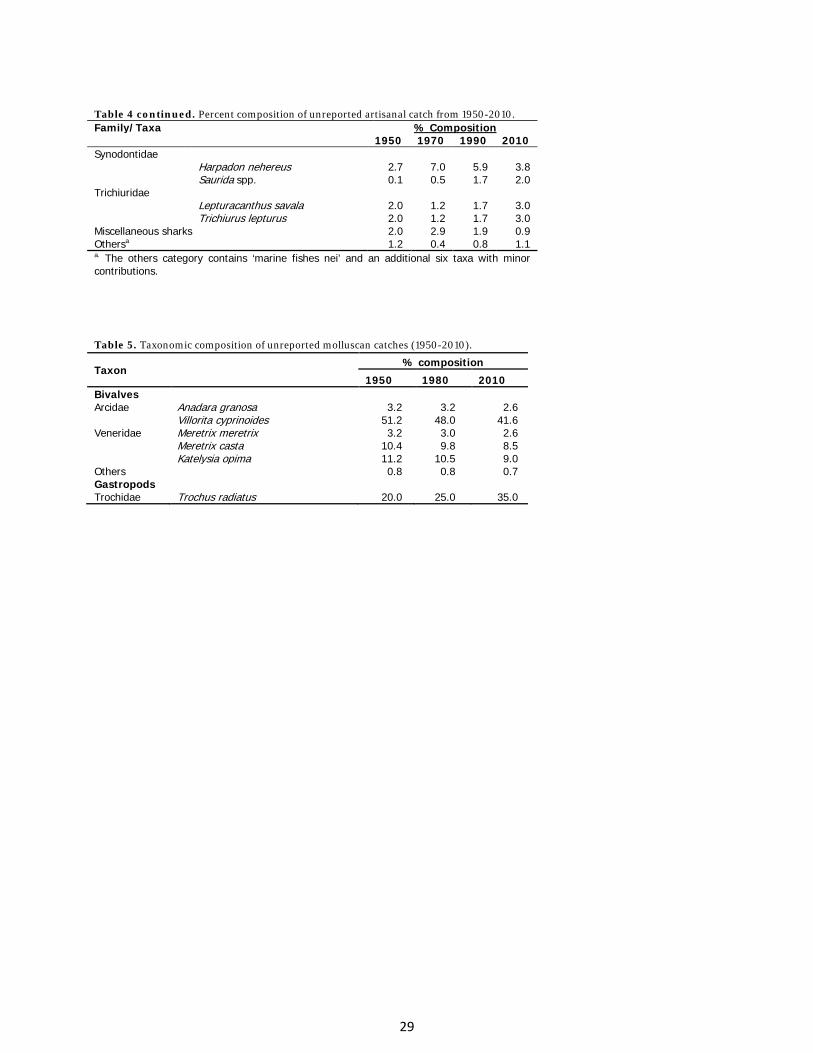
Table 4 continued. Percent composition of unreported artisanal catch from 1950-2010. Family/Taxa % Composition 1950 1970 1990 2010 Synodontidae
Harpadon nehereus 2.7 7.0 5.9 3.8 Saurida spp. 0.1 0.5 1.7 2.0 Trichiuridae
Lepturacanthus savala 2.0 1.2 1.7 3.0 Trichiurus lepturus 2.0 1.2 1.7 3.0 Miscellaneous sharks 2.0 2.9 1.9 0.9 Othersa 1.2 0.4 0.8 1.1 a. The others category contains ‘marine fishes nei’ and an additional six taxa with minor contributions. Table 5. Taxonomic composition of unreported molluscan catches (1950-2010).
Taxon % composition
1950 1980 2010 Bivalves Arcidae Anadara granosa 3.2 3.2 2.6 Villorita cyprinoides 51.2 48.0 41.6 Veneridae Meretrix meretrix 3.2 3.0 2.6 Meretrix casta 10.4 9.8 8.5 Katelysia opima 11.2 10.5 9.0 Others 0.8 0.8 0.7 Gastropods
Trochidae Trochus radiatus 20.0 25.0 35.0
29
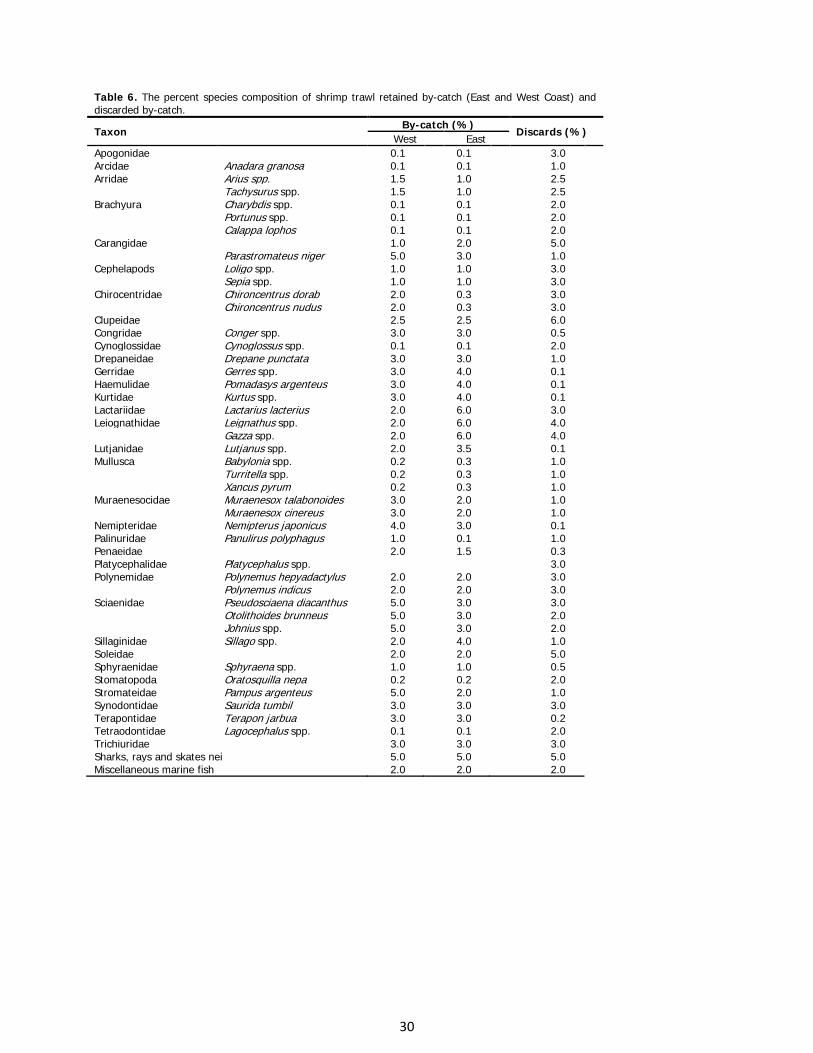
Table 6. The percent species composition of shrimp trawl retained by-catch (East and West Coast) and discarded by-catch.
Taxon By-catch (%)
Discards (%) West East
Apogonidae
0.1 0.1 3.0 Arcidae Anadara granosa 0.1 0.1 1.0 Arridae Arius spp. 1.5 1.0 2.5
Tachysurus spp. 1.5 1.0 2.5
Brachyura Charybdis spp. 0.1 0.1 2.0 Portunus spp. 0.1 0.1 2.0 Calappa lophos 0.1 0.1 2.0 Carangidae
1.0 2.0 5.0
Parastromateus niger 5.0 3.0 1.0
Cephelapods Loligo spp. 1.0 1.0 3.0
Sepia spp. 1.0 1.0 3.0
Chirocentridae Chironcentrus dorab 2.0 0.3 3.0
Chironcentrus nudus 2.0 0.3 3.0
Clupeidae
2.5 2.5 6.0 Congridae Conger spp. 3.0 3.0 0.5 Cynoglossidae Cynoglossus spp. 0.1 0.1 2.0 Drepaneidae Drepane punctata 3.0 3.0 1.0 Gerridae Gerres spp. 3.0 4.0 0.1 Haemulidae Pomadasys argenteus 3.0 4.0 0.1 Kurtidae Kurtus spp. 3.0 4.0 0.1 Lactariidae Lactarius lacterius 2.0 6.0 3.0 Leiognathidae Leignathus spp. 2.0 6.0 4.0
Gazza spp. 2.0 6.0 4.0
Lutjanidae Lutjanus spp. 2.0 3.5 0.1 Mullusca Babylonia spp. 0.2 0.3 1.0
Turritella spp. 0.2 0.3 1.0
Xancus pyrum 0.2 0.3 1.0
Muraenesocidae Muraenesox talabonoides 3.0 2.0 1.0
Muraenesox cinereus 3.0 2.0 1.0
Nemipteridae Nemipterus japonicus 4.0 3.0 0.1 Palinuridae Panulirus polyphagus 1.0 0.1 1.0 Penaeidae
2.0 1.5 0.3
Platycephalidae Platycephalus spp.
3.0 Polynemidae Polynemus hepyadactylus 2.0 2.0 3.0
Polynemus indicus 2.0 2.0 3.0
Sciaenidae Pseudosciaena diacanthus 5.0 3.0 3.0
Otolithoides brunneus 5.0 3.0 2.0
Johnius spp. 5.0 3.0 2.0
Sillaginidae Sillago spp. 2.0 4.0 1.0 Soleidae
2.0 2.0 5.0
Sphyraenidae Sphyraena spp. 1.0 1.0 0.5 Stomatopoda Oratosquilla nepa 0.2 0.2 2.0 Stromateidae Pampus argenteus 5.0 2.0 1.0 Synodontidae Saurida tumbil 3.0 3.0 3.0 Terapontidae Terapon jarbua 3.0 3.0 0.2 Tetraodontidae Lagocephalus spp. 0.1 0.1 2.0 Trichiuridae
3.0 3.0 3.0
Sharks, rays and skates nei 5.0 5.0 5.0 Miscellaneous marine fish 2.0 2.0 2.0
30
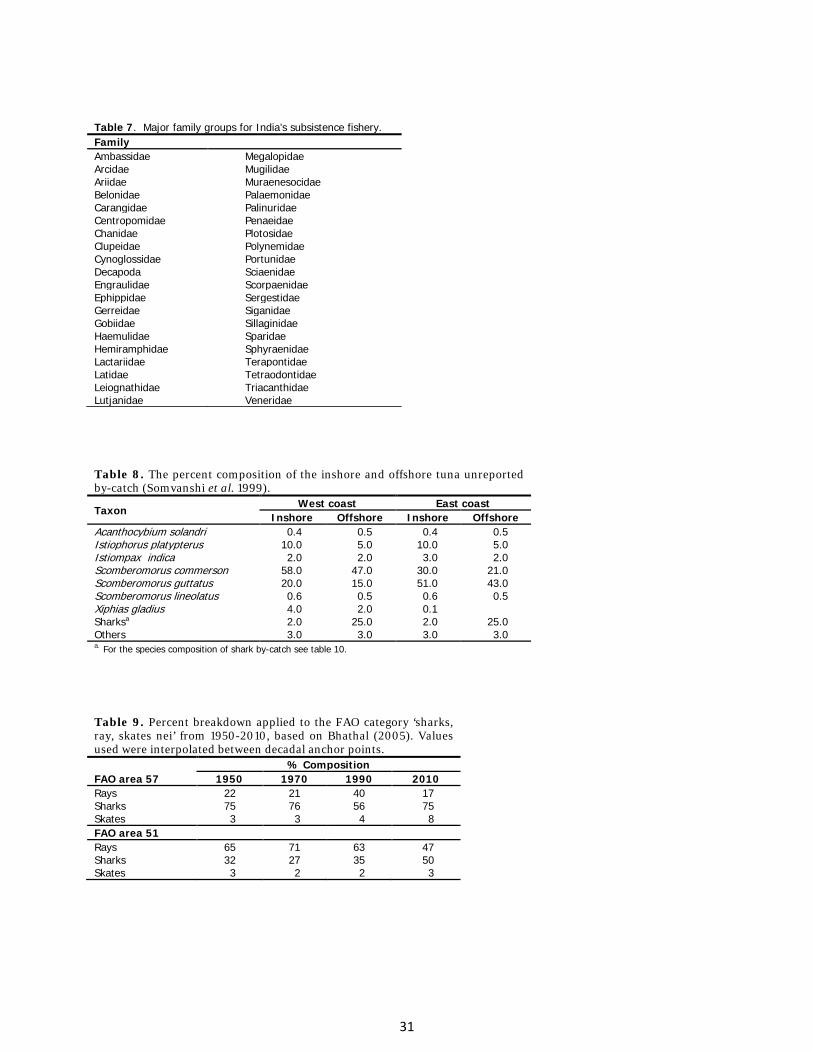
Table 7. Major family groups for India’s subsistence fishery. Family Ambassidae Megalopidae Arcidae Mugilidae Ariidae Muraenesocidae Belonidae Palaemonidae Carangidae Palinuridae Centropomidae Penaeidae Chanidae Plotosidae Clupeidae Polynemidae Cynoglossidae Portunidae Decapoda Sciaenidae Engraulidae Scorpaenidae Ephippidae Sergestidae Gerreidae Siganidae Gobiidae Sillaginidae Haemulidae Sparidae Hemiramphidae Sphyraenidae Lactariidae Terapontidae Latidae Tetraodontidae Leiognathidae Triacanthidae Lutjanidae Veneridae Table 8. The percent composition of the inshore and offshore tuna unreported by-catch (Somvanshi et al. 1999).
Taxon West coast East coast
Inshore Offshore Inshore Offshore Acanthocybium solandri 0.4 0.5 0.4 0.5 Istiophorus platypterus 10.0 5.0 10.0 5.0 Istiompax indica 2.0 2.0 3.0 2.0 Scomberomorus commerson 58.0 47.0 30.0 21.0 Scomberomorus guttatus 20.0 15.0 51.0 43.0 Scomberomorus lineolatus 0.6 0.5 0.6 0.5 Xiphias gladius 4.0 2.0 0.1
Sharksa 2.0 25.0 2.0 25.0 Others 3.0 3.0 3.0 3.0 a. For the species composition of shark by-catch see table 10. Table 9. Percent breakdown applied to the FAO category ‘sharks, ray, skates nei’ from 1950-2010, based on Bhathal (2005). Values used were interpolated between decadal anchor points.
FAO area 57 % Composition
1950 1970 1990 2010 Rays 22 21 40 17 Sharks 75 76 56 75 Skates 3 3 4 8 FAO area 51
Rays 65 71 63 47 Sharks 32 27 35 50 Skates 3 2 2 3
31
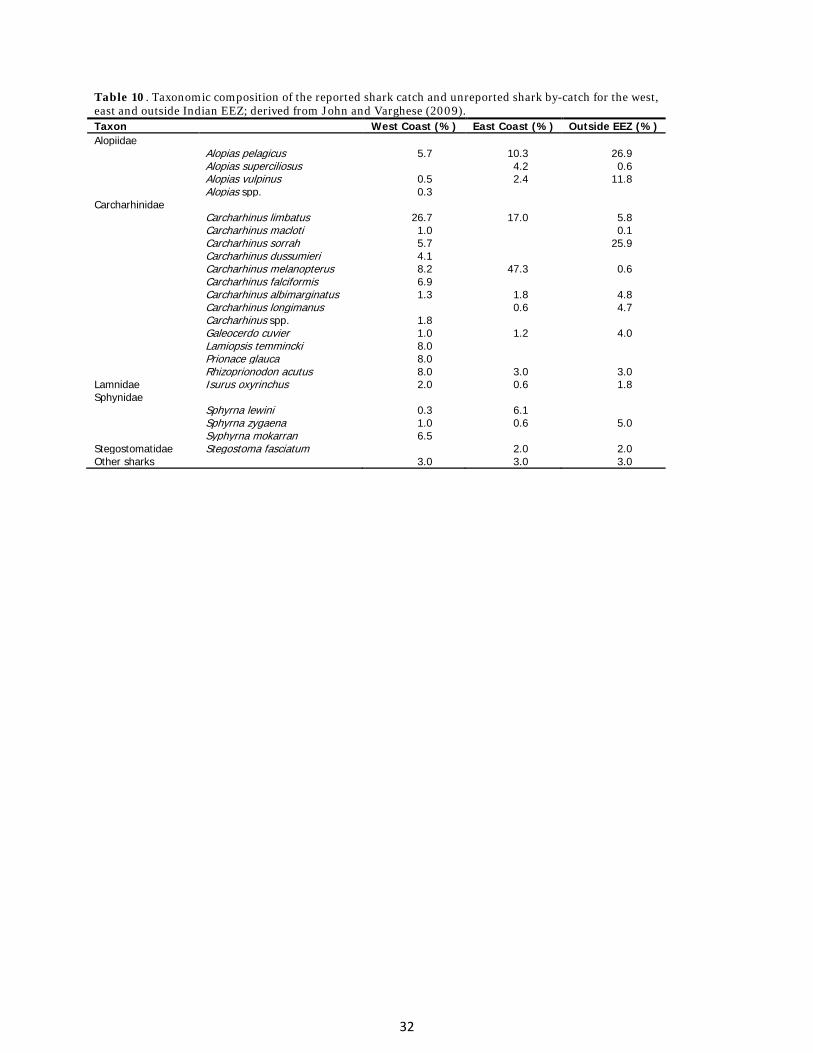
Table 10. Taxonomic composition of the reported shark catch and unreported shark by-catch for the west, east and outside Indian EEZ; derived from John and Varghese (2009). Taxon West Coast (%) East Coast (%) Outside EEZ (%) Alopiidae
Alopias pelagicus 5.7 10.3 26.9 Alopias superciliosus
4.2 0.6
Alopias vulpinus 0.5 2.4 11.8 Alopias spp. 0.3
Carcharhinidae Carcharhinus limbatus 26.7 17.0 5.8
Carcharhinus macloti 1.0
0.1 Carcharhinus sorrah 5.7
25.9
Carcharhinus dussumieri 4.1 Carcharhinus melanopterus 8.2 47.3 0.6
Carcharhinus falciformis 6.9 Carcharhinus albimarginatus 1.3 1.8 4.8
Carcharhinus longimanus
0.6 4.7 Carcharhinus spp. 1.8 Galeocerdo cuvier 1.0 1.2 4.0 Lamiopsis temmincki 8.0 Prionace glauca 8.0 Rhizoprionodon acutus 8.0 3.0 3.0 Lamnidae Isurus oxyrinchus 2.0 0.6 1.8 Sphynidae
Sphyrna lewini 0.3 6.1 Sphyrna zygaena 1.0 0.6 5.0
Syphyrna mokarran 6.5 Stegostomatidae Stegostoma fasciatum 2.0 2.0 Other sharks 3.0 3.0 3.0
32
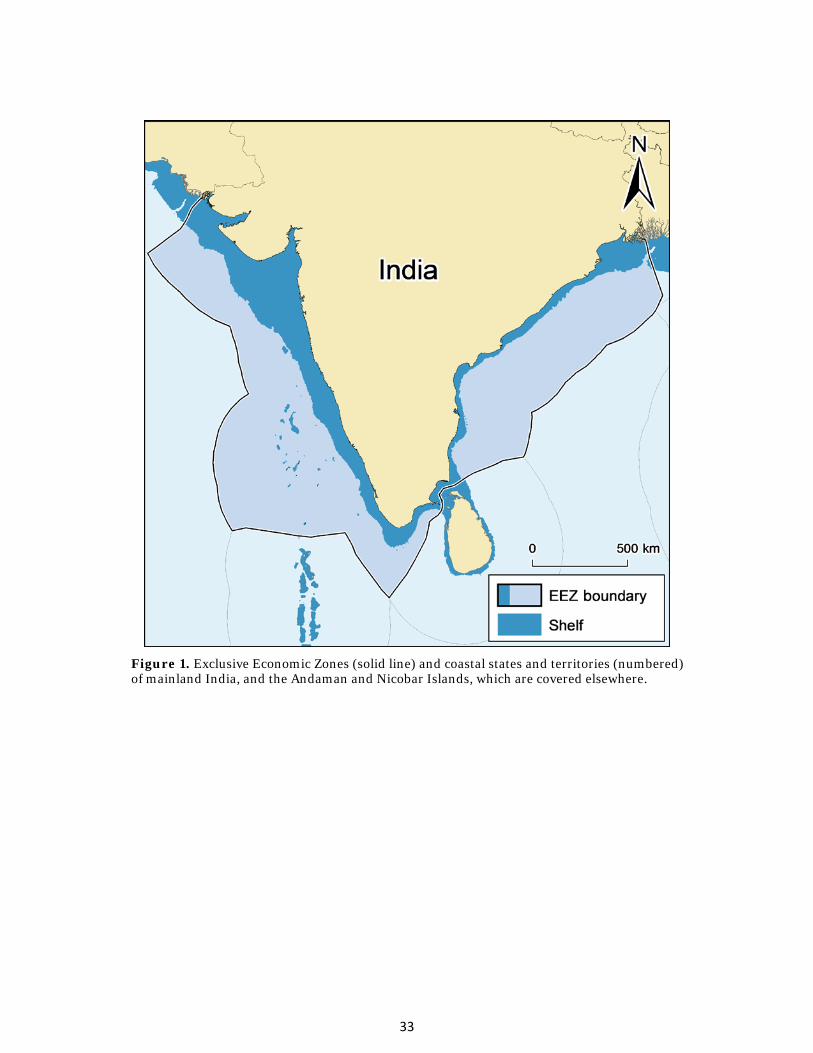
Figure 1. Exclusive Economic Zones (solid line) and coastal states and territories (numbered) of mainland India, and the Andaman and Nicobar Islands, which are covered elsewhere.
33
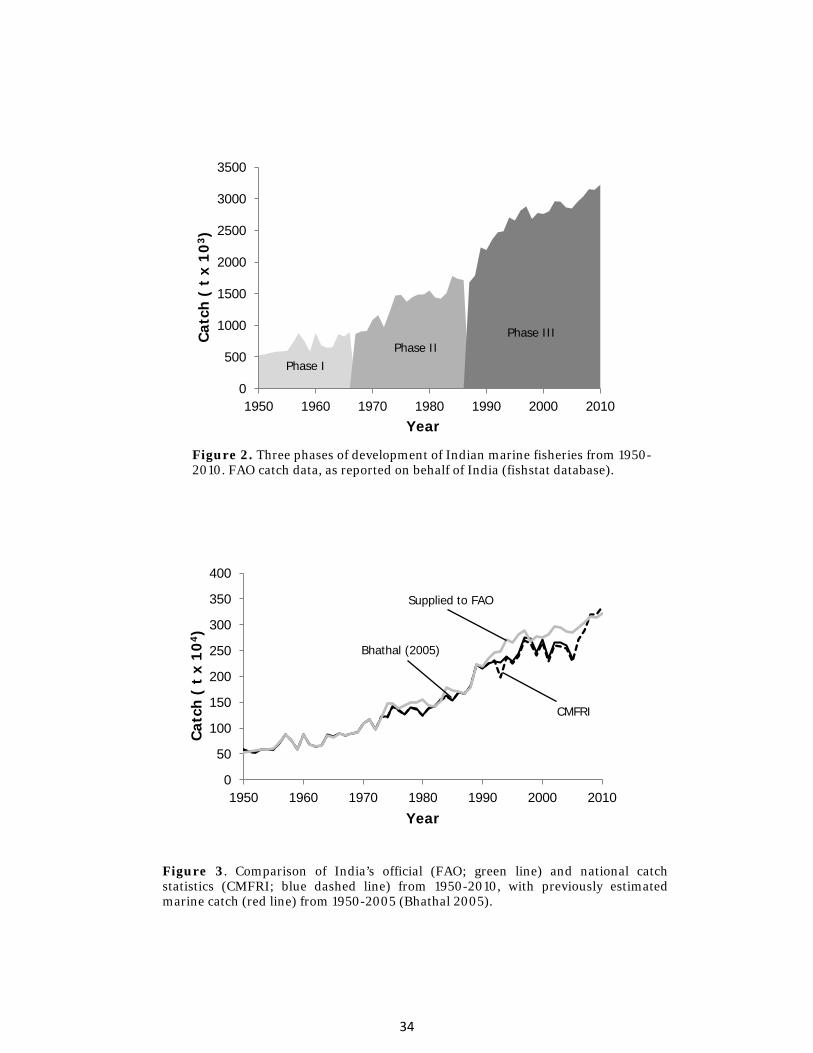
0
500
1000
1500
2000
2500
3000
3500
1950 1960 1970 1980 1990 2000 2010
Cat
ch (
t x
10
3 )
Year
Phase I Phase II
Phase III
0
50
100
150
200
250
300
350
400
1950 1960 1970 1980 1990 2000 2010
Cat
ch (
t x
10
4 )
Year
Supplied to FAO
CMFRI
Bhathal (2005)
Figure 2. Three phases of development of Indian marine fisheries from 1950-2010. FAO catch data, as reported on behalf of India (fishstat database).
Figure 3. Comparison of India’s official (FAO; green line) and national catch statistics (CMFRI; blue dashed line) from 1950-2010, with previously estimated marine catch (red line) from 1950-2005 (Bhathal 2005).
34
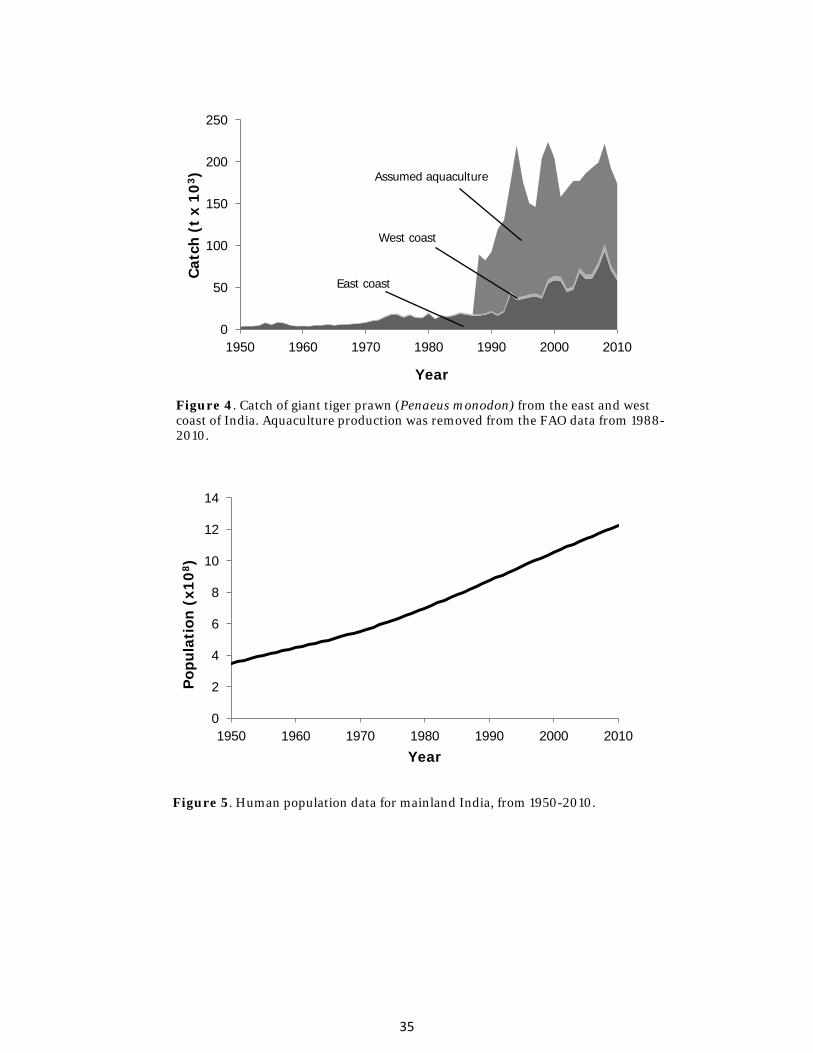
0
50
100
150
200
250
1950 1960 1970 1980 1990 2000 2010
Cat
ch (
t x
103 )
Year
Assumed aquaculture
West coast
East coast
0
2
4
6
8
10
12
14
1950 1960 1970 1980 1990 2000 2010
Pop
ulat
ion
(x10
8 )
Year
Figure 5. Human population data for mainland India, from 1950-2010.
Figure 4. Catch of giant tiger prawn (Penaeus monodon) from the east and west coast of India. Aquaculture production was removed from the FAO data from 1988-2010.
35
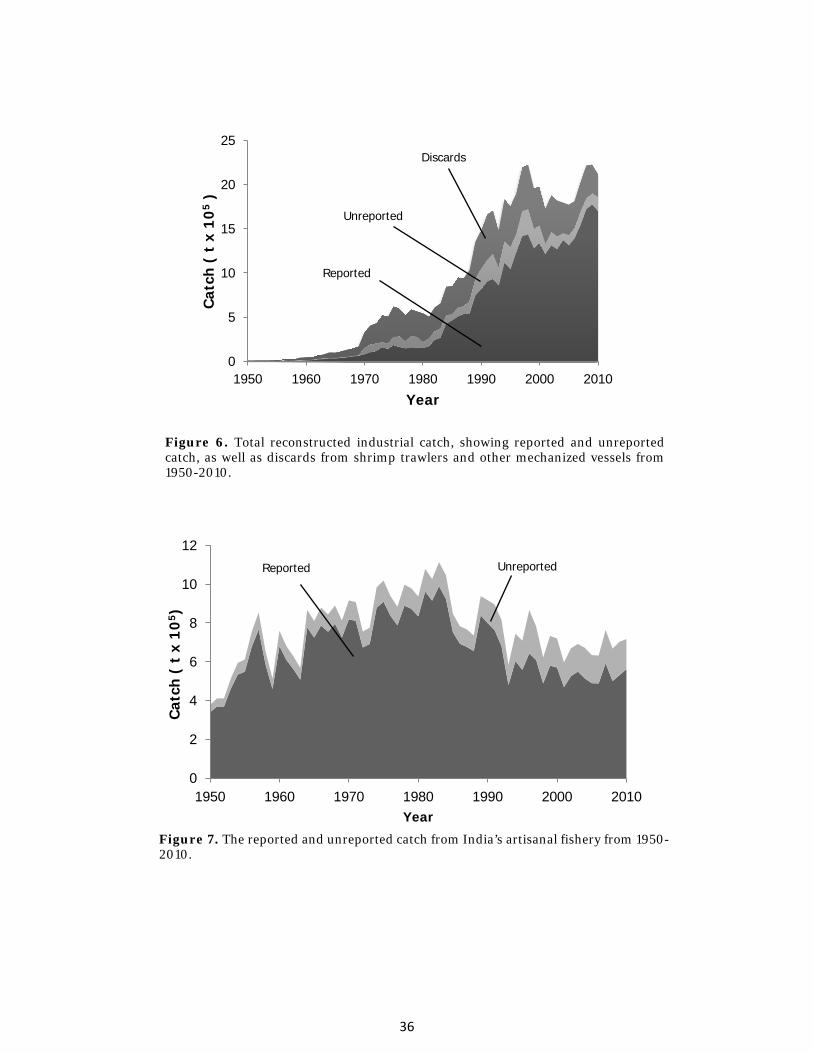
0
5
10
15
20
25
1950 1960 1970 1980 1990 2000 2010
Cat
ch (
t x
10
5 )
Year
Reported
Unreported
Discards
0
2
4
6
8
10
12
1950 1960 1970 1980 1990 2000 2010
Cat
ch (
t x
10
5 )
Year
Unreported Reported
Figure 6. Total reconstructed industrial catch, showing reported and unreported catch, as well as discards from shrimp trawlers and other mechanized vessels from 1950-2010.
Figure 7. The reported and unreported catch from India’s artisanal fishery from 1950-2010.
36
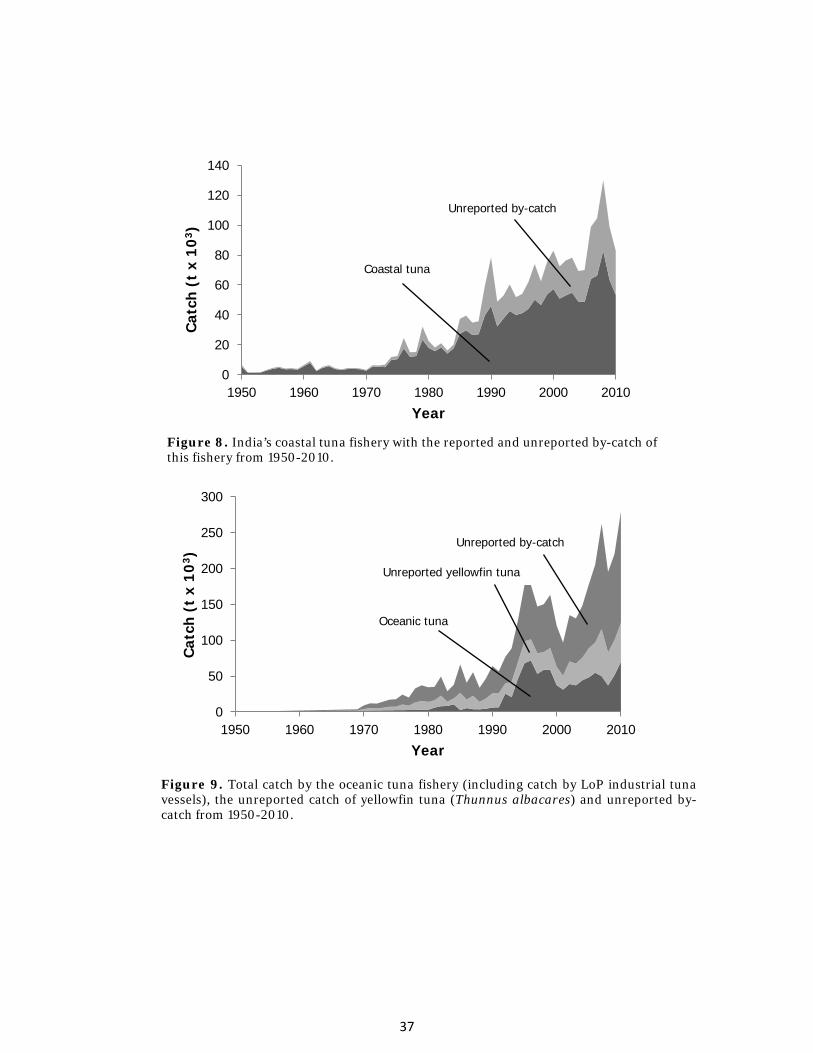
0
20
40
60
80
100
120
140
1950 1960 1970 1980 1990 2000 2010
Cat
ch (
t x
103 )
Year
Coastal tuna
Unreported by-catch
0
50
100
150
200
250
300
1950 1960 1970 1980 1990 2000 2010
Cat
ch (
t x
103 )
Year
Oceanic tuna
Unreported yellowfin tuna
Unreported by-catch
Figure 8. India’s coastal tuna fishery with the reported and unreported by-catch of this fishery from 1950-2010.
Figure 9. Total catch by the oceanic tuna fishery (including catch by LoP industrial tuna vessels), the unreported catch of yellowfin tuna (Thunnus albacares) and unreported by-catch from 1950-2010.
37
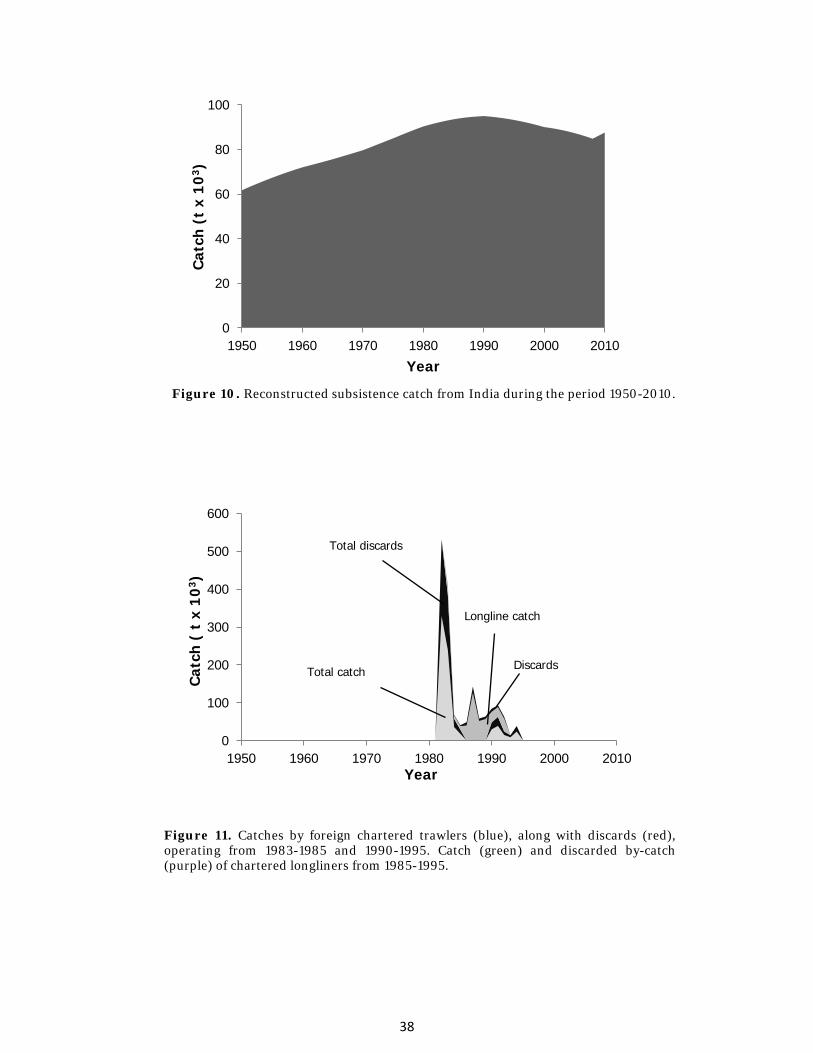
0
20
40
60
80
100
1950 1960 1970 1980 1990 2000 2010
Cat
ch (
t x
103 )
Year
0
100
200
300
400
500
600
1950 1960 1970 1980 1990 2000 2010
Cat
ch (
t x
10
3 )
Year
Total catch
Total discards
Longline catch
Discards
Figure 11. Catches by foreign chartered trawlers (blue), along with discards (red), operating from 1983-1985 and 1990-1995. Catch (green) and discarded by-catch (purple) of chartered longliners from 1985-1995.
Figure 10. Reconstructed subsistence catch from India during the period 1950-2010.
38
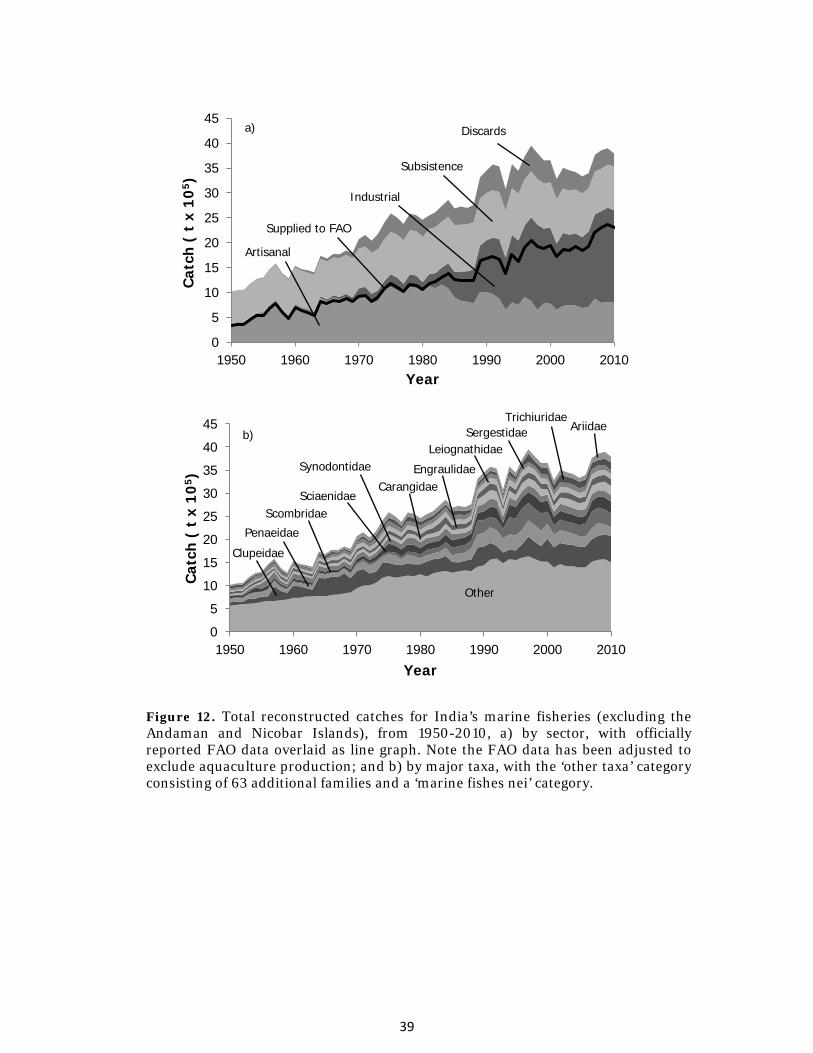
0
5
10
15
20
25
30
35
40
45
1950 1960 1970 1980 1990 2000 2010
Cat
ch (
t x
10
5 )
Year
Discards
Industrial
Subsistence
Supplied to FAO
Artisanal
a)
0
5
10
15
20
25
30
35
40
45
1950 1960 1970 1980 1990 2000 2010
Cat
ch (
t x
10
5 )
Year
Other
Clupeidae
Sciaenidae Scombridae
Penaeidae
Synodontidae
Carangidae Engraulidae
Ariidae
Leiognathidae
Trichiuridae b) Sergestidae
Figure 12. Total reconstructed catches for India’s marine fisheries (excluding the Andaman and Nicobar Islands), from 1950-2010, a) by sector, with officially reported FAO data overlaid as line graph. Note the FAO data has been adjusted to exclude aquaculture production; and b) by major taxa, with the ‘other taxa’ category consisting of 63 additional families and a ‘marine fishes nei’ category.
39
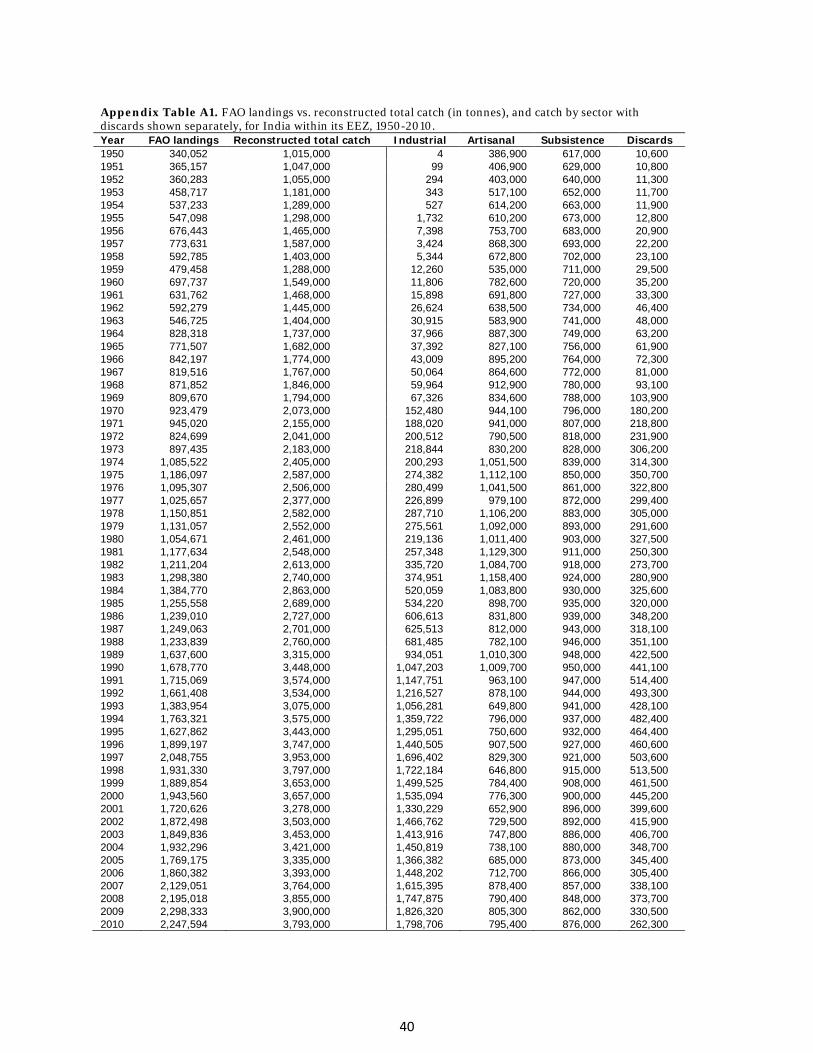
Appendix Table A1. FAO landings vs. reconstructed total catch (in tonnes), and catch by sector with discards shown separately, for India within its EEZ, 1950-2010. Year FAO landings Reconstructed total catch Industrial Artisanal Subsistence Discards 1950 340,052 1,015,000 4 386,900 617,000 10,600 1951 365,157 1,047,000 99 406,900 629,000 10,800 1952 360,283 1,055,000 294 403,000 640,000 11,300 1953 458,717 1,181,000 343 517,100 652,000 11,700 1954 537,233 1,289,000 527 614,200 663,000 11,900 1955 547,098 1,298,000 1,732 610,200 673,000 12,800 1956 676,443 1,465,000 7,398 753,700 683,000 20,900 1957 773,631 1,587,000 3,424 868,300 693,000 22,200 1958 592,785 1,403,000 5,344 672,800 702,000 23,100 1959 479,458 1,288,000 12,260 535,000 711,000 29,500 1960 697,737 1,549,000 11,806 782,600 720,000 35,200 1961 631,762 1,468,000 15,898 691,800 727,000 33,300 1962 592,279 1,445,000 26,624 638,500 734,000 46,400 1963 546,725 1,404,000 30,915 583,900 741,000 48,000 1964 828,318 1,737,000 37,966 887,300 749,000 63,200 1965 771,507 1,682,000 37,392 827,100 756,000 61,900 1966 842,197 1,774,000 43,009 895,200 764,000 72,300 1967 819,516 1,767,000 50,064 864,600 772,000 81,000 1968 871,852 1,846,000 59,964 912,900 780,000 93,100 1969 809,670 1,794,000 67,326 834,600 788,000 103,900 1970 923,479 2,073,000 152,480 944,100 796,000 180,200 1971 945,020 2,155,000 188,020 941,000 807,000 218,800 1972 824,699 2,041,000 200,512 790,500 818,000 231,900 1973 897,435 2,183,000 218,844 830,200 828,000 306,200 1974 1,085,522 2,405,000 200,293 1,051,500 839,000 314,300 1975 1,186,097 2,587,000 274,382 1,112,100 850,000 350,700 1976 1,095,307 2,506,000 280,499 1,041,500 861,000 322,800 1977 1,025,657 2,377,000 226,899 979,100 872,000 299,400 1978 1,150,851 2,582,000 287,710 1,106,200 883,000 305,000 1979 1,131,057 2,552,000 275,561 1,092,000 893,000 291,600 1980 1,054,671 2,461,000 219,136 1,011,400 903,000 327,500 1981 1,177,634 2,548,000 257,348 1,129,300 911,000 250,300 1982 1,211,204 2,613,000 335,720 1,084,700 918,000 273,700 1983 1,298,380 2,740,000 374,951 1,158,400 924,000 280,900 1984 1,384,770 2,863,000 520,059 1,083,800 930,000 325,600 1985 1,255,558 2,689,000 534,220 898,700 935,000 320,000 1986 1,239,010 2,727,000 606,613 831,800 939,000 348,200 1987 1,249,063 2,701,000 625,513 812,000 943,000 318,100 1988 1,233,839 2,760,000 681,485 782,100 946,000 351,100 1989 1,637,600 3,315,000 934,051 1,010,300 948,000 422,500 1990 1,678,770 3,448,000 1,047,203 1,009,700 950,000 441,100 1991 1,715,069 3,574,000 1,147,751 963,100 947,000 514,400 1992 1,661,408 3,534,000 1,216,527 878,100 944,000 493,300 1993 1,383,954 3,075,000 1,056,281 649,800 941,000 428,100 1994 1,763,321 3,575,000 1,359,722 796,000 937,000 482,400 1995 1,627,862 3,443,000 1,295,051 750,600 932,000 464,400 1996 1,899,197 3,747,000 1,440,505 907,500 927,000 460,600 1997 2,048,755 3,953,000 1,696,402 829,300 921,000 503,600 1998 1,931,330 3,797,000 1,722,184 646,800 915,000 513,500 1999 1,889,854 3,653,000 1,499,525 784,400 908,000 461,500 2000 1,943,560 3,657,000 1,535,094 776,300 900,000 445,200 2001 1,720,626 3,278,000 1,330,229 652,900 896,000 399,600 2002 1,872,498 3,503,000 1,466,762 729,500 892,000 415,900 2003 1,849,836 3,453,000 1,413,916 747,800 886,000 406,700 2004 1,932,296 3,421,000 1,450,819 738,100 880,000 348,700 2005 1,769,175 3,335,000 1,366,382 685,000 873,000 345,400 2006 1,860,382 3,393,000 1,448,202 712,700 866,000 305,400 2007 2,129,051 3,764,000 1,615,395 878,400 857,000 338,100 2008 2,195,018 3,855,000 1,747,875 790,400 848,000 373,700 2009 2,298,333 3,900,000 1,826,320 805,300 862,000 330,500 2010 2,247,594 3,793,000 1,798,706 795,400 876,000 262,300
40
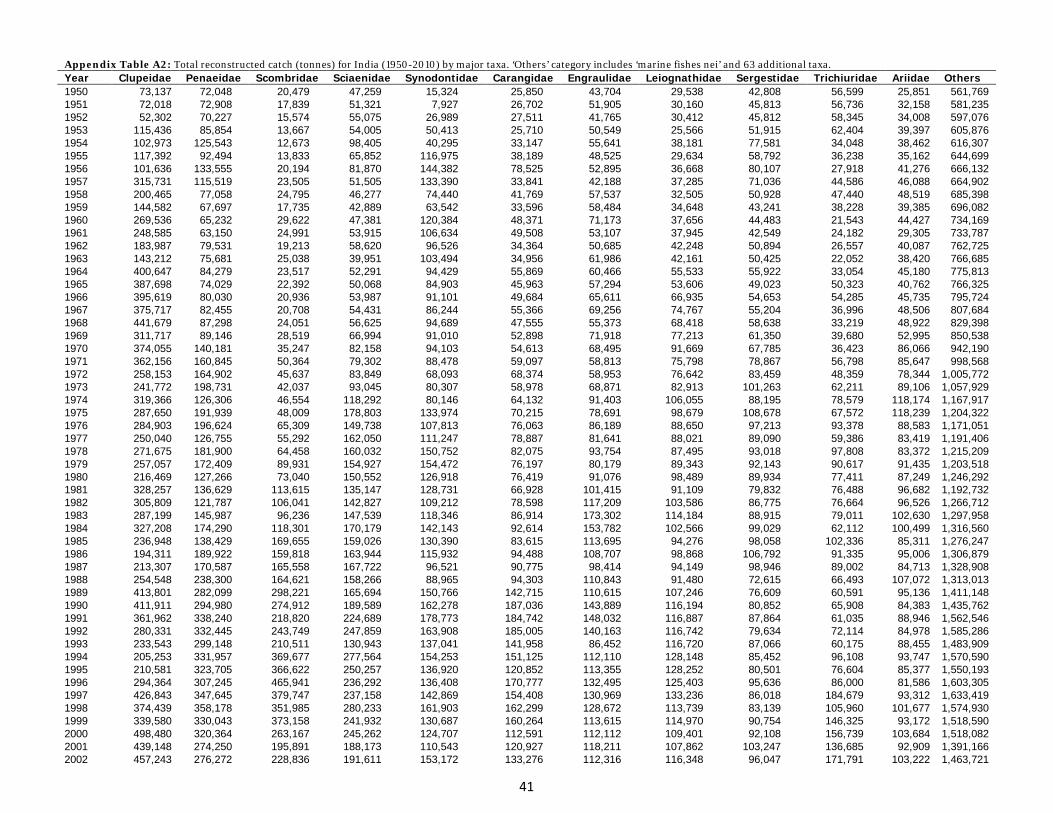
Appendix Table A2: Total reconstructed catch (tonnes) for India (1950-2010) by major taxa. ‘Others’ category includes ‘marine fishes nei’ and 63 additional taxa. Year Clupeidae Penaeidae Scombridae Sciaenidae Synodontidae Carangidae Engraulidae Leiognathidae Sergestidae Trichiuridae Ariidae Others 1950 73,137 72,048 20,479 47,259 15,324 25,850 43,704 29,538 42,808 56,599 25,851 561,769 1951 72,018 72,908 17,839 51,321 7,927 26,702 51,905 30,160 45,813 56,736 32,158 581,235 1952 52,302 70,227 15,574 55,075 26,989 27,511 41,765 30,412 45,812 58,345 34,008 597,076 1953 115,436 85,854 13,667 54,005 50,413 25,710 50,549 25,566 51,915 62,404 39,397 605,876 1954 102,973 125,543 12,673 98,405 40,295 33,147 55,641 38,181 77,581 34,048 38,462 616,307 1955 117,392 92,494 13,833 65,852 116,975 38,189 48,525 29,634 58,792 36,238 35,162 644,699 1956 101,636 133,555 20,194 81,870 144,382 78,525 52,895 36,668 80,107 27,918 41,276 666,132 1957 315,731 115,519 23,505 51,505 133,390 33,841 42,188 37,285 71,036 44,586 46,088 664,902 1958 200,465 77,058 24,795 46,277 74,440 41,769 57,537 32,505 50,928 47,440 48,519 685,398 1959 144,582 67,697 17,735 42,889 63,542 33,596 58,484 34,648 43,241 38,228 39,385 696,082 1960 269,536 65,232 29,622 47,381 120,384 48,371 71,173 37,656 44,483 21,543 44,427 734,169 1961 248,585 63,150 24,991 53,915 106,634 49,508 53,107 37,945 42,549 24,182 29,305 733,787 1962 183,987 79,531 19,213 58,620 96,526 34,364 50,685 42,248 50,894 26,557 40,087 762,725 1963 143,212 75,681 25,038 39,951 103,494 34,956 61,986 42,161 50,425 22,052 38,420 766,685 1964 400,647 84,279 23,517 52,291 94,429 55,869 60,466 55,533 55,922 33,054 45,180 775,813 1965 387,698 74,029 22,392 50,068 84,903 45,963 57,294 53,606 49,023 50,323 40,762 766,325 1966 395,619 80,030 20,936 53,987 91,101 49,684 65,611 66,935 54,653 54,285 45,735 795,724 1967 375,717 82,455 20,708 54,431 86,244 55,366 69,256 74,767 55,204 36,996 48,506 807,684 1968 441,679 87,298 24,051 56,625 94,689 47,555 55,373 68,418 58,638 33,219 48,922 829,398 1969 311,717 89,146 28,519 66,994 91,010 52,898 71,918 77,213 61,350 39,680 52,995 850,538 1970 374,055 140,181 35,247 82,158 94,103 54,613 68,495 91,669 67,785 36,423 86,066 942,190 1971 362,156 160,845 50,364 79,302 88,478 59,097 58,813 75,798 78,867 56,798 85,647 998,568 1972 258,153 164,902 45,637 83,849 68,093 68,374 58,953 76,642 83,459 48,359 78,344 1,005,772 1973 241,772 198,731 42,037 93,045 80,307 58,978 68,871 82,913 101,263 62,211 89,106 1,057,929 1974 319,366 126,306 46,554 118,292 80,146 64,132 91,403 106,055 88,195 78,579 118,174 1,167,917 1975 287,650 191,939 48,009 178,803 133,974 70,215 78,691 98,679 108,678 67,572 118,239 1,204,322 1976 284,903 196,624 65,309 149,738 107,813 76,063 86,189 88,650 97,213 93,378 88,583 1,171,051 1977 250,040 126,755 55,292 162,050 111,247 78,887 81,641 88,021 89,090 59,386 83,419 1,191,406 1978 271,675 181,900 64,458 160,032 150,752 82,075 93,754 87,495 93,018 97,808 83,372 1,215,209 1979 257,057 172,409 89,931 154,927 154,472 76,197 80,179 89,343 92,143 90,617 91,435 1,203,518 1980 216,469 127,266 73,040 150,552 126,918 76,419 91,076 98,489 89,934 77,411 87,249 1,246,292 1981 328,257 136,629 113,615 135,147 128,731 66,928 101,415 91,109 79,832 76,488 96,682 1,192,732 1982 305,809 121,787 106,041 142,827 109,212 78,598 117,209 103,586 86,775 76,664 96,526 1,266,712 1983 287,199 145,987 96,236 147,539 118,346 86,914 173,302 114,184 88,915 79,011 102,630 1,297,958 1984 327,208 174,290 118,301 170,179 142,143 92,614 153,782 102,566 99,029 62,112 100,499 1,316,560 1985 236,948 138,429 169,655 159,026 130,390 83,615 113,695 94,276 98,058 102,336 85,311 1,276,247 1986 194,311 189,922 159,818 163,944 115,932 94,488 108,707 98,868 106,792 91,335 95,006 1,306,879 1987 213,307 170,587 165,558 167,722 96,521 90,775 98,414 94,149 98,946 89,002 84,713 1,328,908 1988 254,548 238,300 164,621 158,266 88,965 94,303 110,843 91,480 72,615 66,493 107,072 1,313,013 1989 413,801 282,099 298,221 165,694 150,766 142,715 110,615 107,246 76,609 60,591 95,136 1,411,148 1990 411,911 294,980 274,912 189,589 162,278 187,036 143,889 116,194 80,852 65,908 84,383 1,435,762 1991 361,962 338,240 218,820 224,689 178,773 184,742 148,032 116,887 87,864 61,035 88,946 1,562,546 1992 280,331 332,445 243,749 247,859 163,908 185,005 140,163 116,742 79,634 72,114 84,978 1,585,286 1993 233,543 299,148 210,511 130,943 137,041 141,958 86,452 116,720 87,066 60,175 88,455 1,483,909 1994 205,253 331,957 369,677 277,564 154,253 151,125 112,110 128,148 85,452 96,108 93,747 1,570,590 1995 210,581 323,705 366,622 250,257 136,920 120,852 113,355 128,252 80,501 76,604 85,377 1,550,193 1996 294,364 307,245 465,941 236,292 136,408 170,777 132,495 125,403 95,636 86,000 81,586 1,603,305 1997 426,843 347,645 379,747 237,158 142,869 154,408 130,969 133,236 86,018 184,679 93,312 1,633,419 1998 374,439 358,178 351,985 280,233 161,903 162,299 128,672 113,739 83,139 105,960 101,677 1,574,930 1999 339,580 330,043 373,158 241,932 130,687 160,264 113,615 114,970 90,754 146,325 93,172 1,518,590 2000 498,480 320,364 263,167 245,262 124,707 112,591 112,112 109,401 92,108 156,739 103,684 1,518,082 2001 439,148 274,250 195,891 188,173 110,543 120,927 118,211 107,862 103,247 136,685 92,909 1,391,166 2002 457,243 276,272 228,836 191,611 153,172 133,276 112,316 116,348 96,047 171,791 103,222 1,463,721
41
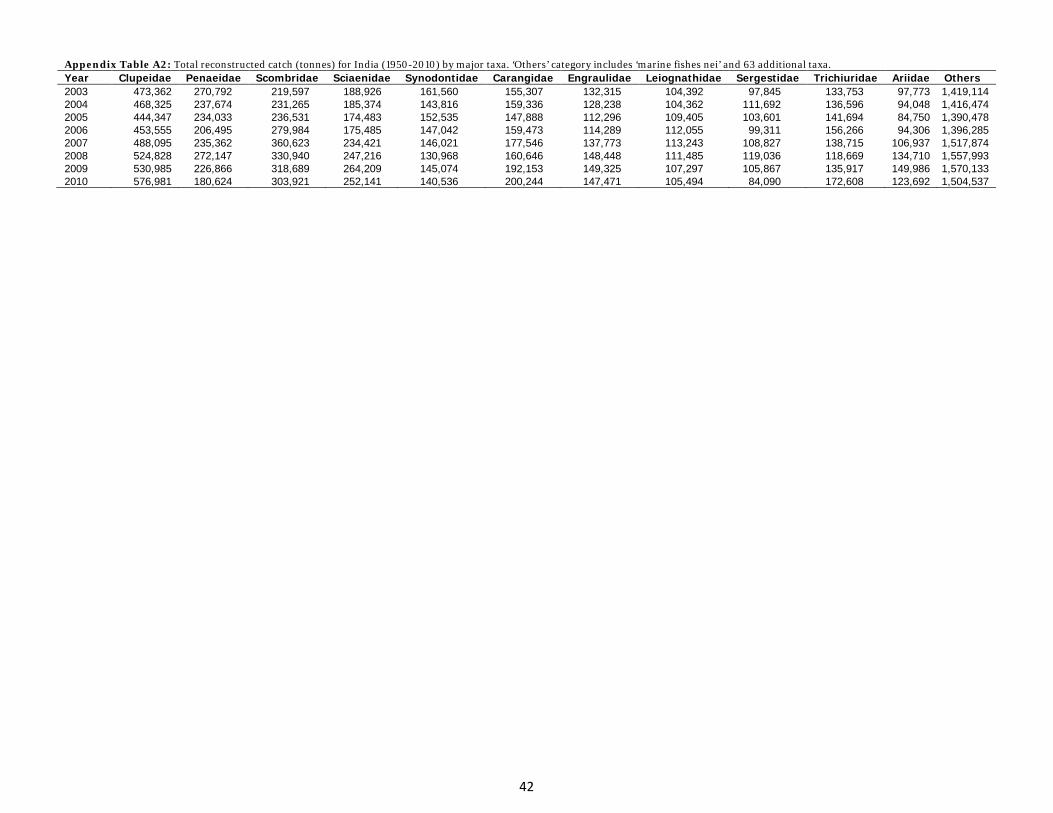
Appendix Table A2: Total reconstructed catch (tonnes) for India (1950-2010) by major taxa. ‘Others’ category includes ‘marine fishes nei’ and 63 additional taxa. Year Clupeidae Penaeidae Scombridae Sciaenidae Synodontidae Carangidae Engraulidae Leiognathidae Sergestidae Trichiuridae Ariidae Others 2003 473,362 270,792 219,597 188,926 161,560 155,307 132,315 104,392 97,845 133,753 97,773 1,419,114 2004 468,325 237,674 231,265 185,374 143,816 159,336 128,238 104,362 111,692 136,596 94,048 1,416,474 2005 444,347 234,033 236,531 174,483 152,535 147,888 112,296 109,405 103,601 141,694 84,750 1,390,478 2006 453,555 206,495 279,984 175,485 147,042 159,473 114,289 112,055 99,311 156,266 94,306 1,396,285 2007 488,095 235,362 360,623 234,421 146,021 177,546 137,773 113,243 108,827 138,715 106,937 1,517,874 2008 524,828 272,147 330,940 247,216 130,968 160,646 148,448 111,485 119,036 118,669 134,710 1,557,993 2009 530,985 226,866 318,689 264,209 145,074 192,153 149,325 107,297 105,867 135,917 149,986 1,570,133 2010 576,981 180,624 303,921 252,141 140,536 200,244 147,471 105,494 84,090 172,608 123,692 1,504,537
42