Embed Size (px)
Citation preview
Computational Modelling Of Concrete Structures - Meschke, Pichler & Rots (Eds) © 2018 Taylor & Francis Group, London, ISBN 978· 1-138-74117· 1
Fishnet mode) for failure probability of nacre-Jike imbricated Jamenar materials and Monte Carlo verification
Zdenek P. Bazant Department of Civil and Mechanical Engineering and Materials Science, Northwestern Universit)\ Evanston, USA
Wen Luo Northwestern University, Evanston, USA
ABSTRACT: The conference paper reviews recent studies at Northwestern University, in which the connectivity in nacreous staggered lamellar systems is, for probabilistic analysis, represented as a fishnet pulled diagonally. The probability distnbutions of nacre, including its tail at 10"'6 probability, turns out to be analytically tractable. The fishnet distribution is intermediate between those corresponding to the weakest link chain (series coupling) and fiber-bundle (parallel coupling). Millions of Monte Carlo simulations are presented to verify the analyticaJ distribution, including its tail.
I INTRODUCTION
In spite of their weak brittle constituents, nacrelike imbricated (staggered) lamellar structures can attain very high strength and fracture energy, exceeding by one to two orders of magnitude the strength or the constituents. The reasons have been clarified in a host of studies of the mechanics of failure [I, 2, 3, 4, 5, 6, 7, 8, 9, 10, 11, e.g.].
These studies, however, were mostly deterministic and provided only the mean behavior. For nacreous structures, no reaJistic probability distribution of the strength with the far left fail seems to exist at present, yet this is where the 'devil' resides. To capture the tail is the goal of this study (whose main ideas were compactly presented in (12) and developed in fu]) detail in (13D,
To design safe structures with nacre-mimetic materials typically requires knowing their strength distribution up to the tail with failure probability of about P
1 = JO-f (per lifetime), which requires
determining the extreme value distribution [14, 15]. This is generally the level of safety required for engineering structures such as bridges, aircraft, MEMS, etc. It ensures the risks of engineering structures to be three orders magnitude lower than other risks that people willingly or inevitably tak.e (e.g. , car driving), and to be of about the same level as the risk of being killed, e.g., by a lightning of falling tree. Such low tail probabilities can hardly be determined by histogram testing of strength of many identical specimens of structures.
Consequently, one needs a realistic mathematical model for the strength distribution, to be
73
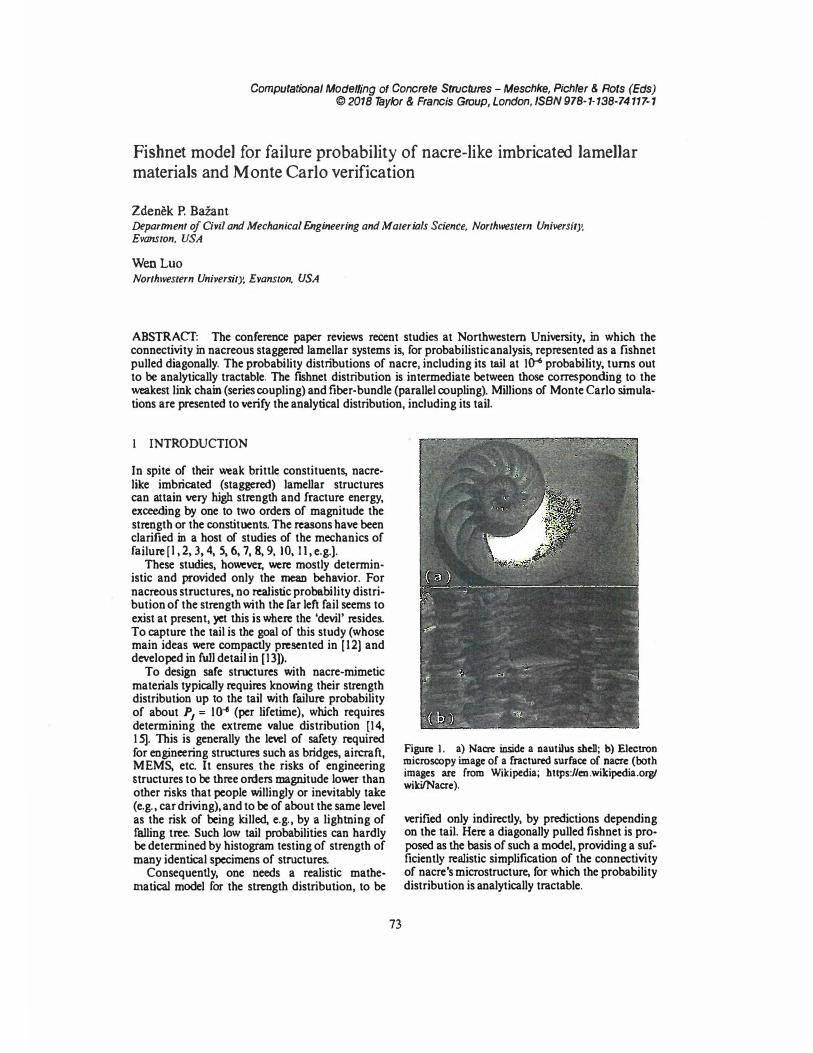
Figure I. a) Nacre inside a nautilus shell; b) Electron microscopy image of a fractured surface of nacre (both images are from Wikipedia; https://en.wikipedia.org/ wild/Nacre).
verified only indirectly, by predictions depending on the tail. Here a diagonally pulled fishnet is proposed as the basis of such a model, providing a sufficiently realistic simplification of the connectivity of nacre's microstructure, for which the probability distribution is analytically tractable.
The new idea of this article is to model the tail probability of strength of nacre-like structures by a square fishnet pulled along one of the diagonals. Same as the weakest-link model, the failure probability of fishnet, P
,. is obtained by calculating its
counterpart-the survival probability, I - Pr
As will be shown, these additional survival probabilities greatly enhance the strength for P
1< 1�, com
pared to the the weakest-link model. The analytical predictions of failure probabil
ity are here verified by millions of Monte-Carlo simulations. Monte Carlo simulations of nacreous structures have previously been conducted with the random fuse model (RFM) [I 6, 5), in which the brittle bonds in the structure are simplified as a lattice of resisters with random burnout thresholds. The RFM simulates the gradual failure of resister network under increasing voltage. This is similar to the failure process of quasibrittle elastic material under controlled uniaxial load .
To calculate the maximum loads of the system of fishnet links, a simple finite element (FE) program for a pin-jointed truss is developed (m MatLab). For each of many shapes and sizes of the fishnet, the maximum loads are calculated for about l million input samples of randomly generated strengths of the links, based on the assumption that the link strength follows the grafter GaussWeibull distribution (see [15)). Running each set of about 1 million FE solutions takes a few days. With such a large number of random samples, the resulting strength histograms become visually indistinguishable from the theoretical cumulative probability density function (cdt) of failure probability P
,. derived in [13).
For the purpose of statistical analysis, the longitudinal load transmission must be realistically sim
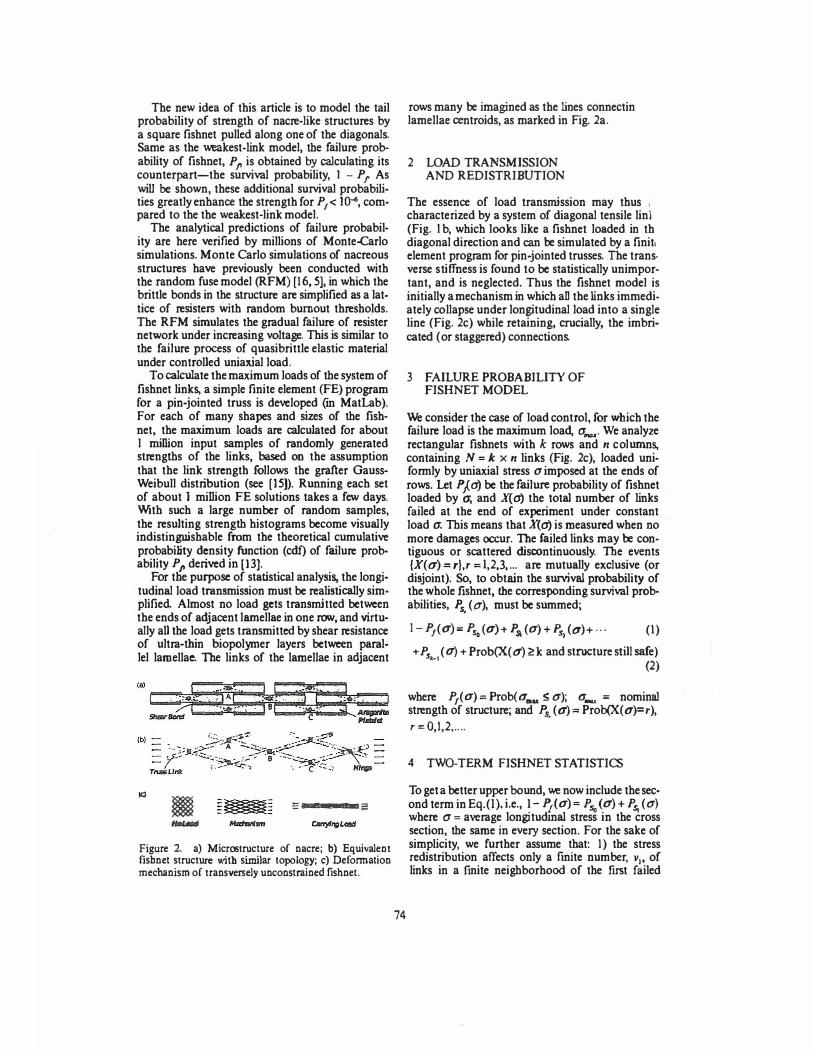
plified Almost no load gets transmitted between the ends of adjacent lamellae in one 'CCNI, and virtu· ally all the load gets transmitted by shear resistance of ultra-thin biopolymer layers between parallel lamellac. The links of the lamellae in adjacent
Id
_____ _.
Figure 2. a) Microstructurc of nacre; b) Equivalent fisbnct structure with similar topology; c) Dcfonnation mechanism of t ransversely unconstrained fishnet.
rows many be imagined as the lines connectin lamellae centroids, as marked in Fig. 2a.
2 LOAD TRANSMISSION AND REDISTRIBUTION
The essence of load transmission may thus , characterized by a system of diagonal tensile linl (Fig. l b, which looks like a fishnet loaded in th diagonal direction and can be simulated by a finit, element program for pin-jointed trusses. The trans, verse stiffness is found to be statistically unimportant, and is neglected. Thus the fishnet model is initially a mechanism in which an the links immediately collapse under longitudinal load into a single line (Fig. 2c) while retaining, crucially, the imbricated (or staggered) connections.
3 FAILURE PROBABILITY OF FISHNET MODEL
We consider the case of load control, for which the failure load is the maximum load, u_,. We analyze rectangular fishnets with k rows and n colwnns, containing N = k x n links (Fig. 2c), loaded uniformly by uniaxial stress uimposed at the ends of rows. Let P J.. d.J be the failure probability of fishnet loaded by o; and X{o) the total number of links failed at the end of experiment under constant load CT. This means that X{ o) is measured when no more damages occur. The failed links may be contiguous or scattered discontinuously. The events {X(u) = r},r = 1,2,3, ... are mutually exclusive (or disjoint). So, to obtain the swvival probability of the whole fishnet, the corresponding survival probabilities, Ps, (O'), must be summed;
74
I - P1(a)= P
So (u)+ P� (a)+ ,Ps1 (O')+ ... (1)
+Ps (a)+ Prob(X(O') �k and structure still safe)�· (2)
where P1(a)= Prob(u.u s; a); a_, = nominal
strength of structure; and Ps, (O'} = Prob(X(o')=r), r=0,1,2, ....
4 TWO-TERM FISHNET STATISTICS
To get a better upper bound, we now include the second term in Eq.(I}. i.e., 1- Pt<a) = P
s,, (a)+ P
s, (d)
where a= average longitudinal stress in the cross section, the same in every section. For the sake of simplicity, we further assume that: I) the stress redistribution affects only a finite number, v1, of links in a finite neighborhood of the first failed
link in which .il; > 1.1, and 2) factor .il1 is treated as constant, ,{ = 17;'> (> I) within this neighborhood, taken either as the weighted average of all redistribution factors (to get the best estimate), or as the maximum of these factors (to preserve an upper bound on P
1). With this simplification,
P.s, (O')= NPi(t7)[1- fi(O'W->1-1(!- fi(11,!'>0')]'I (3)
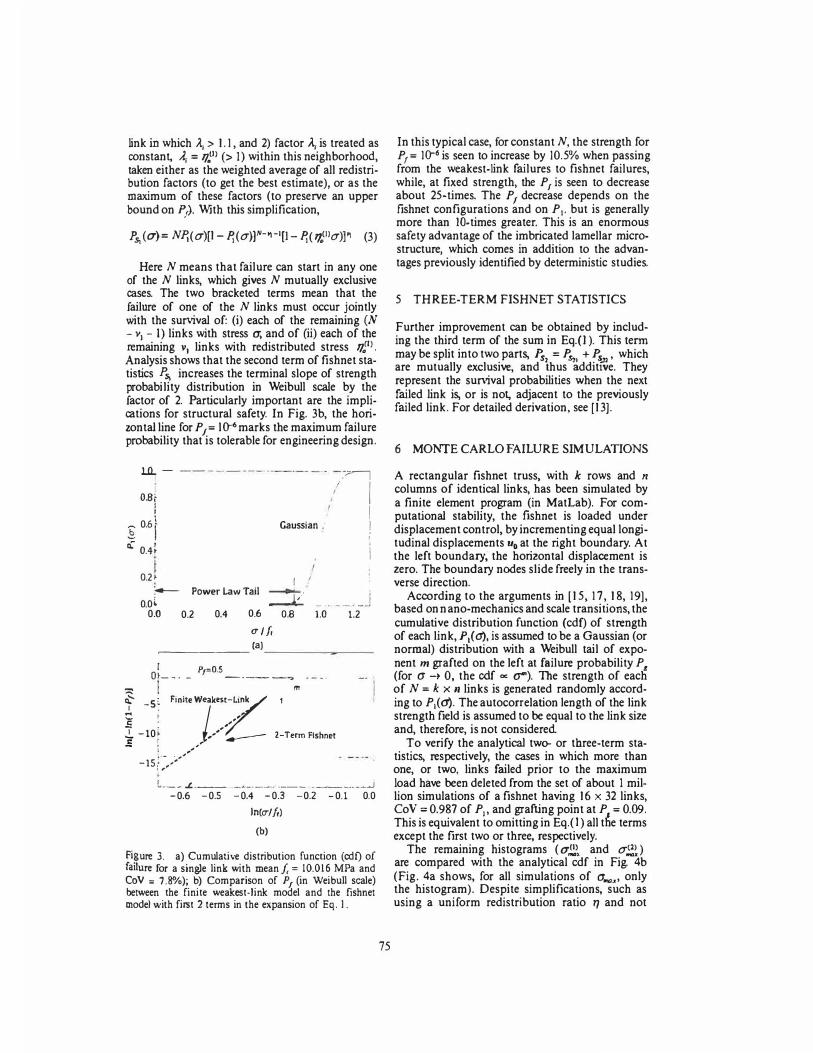
Here N means that failure can start in any one of the N links, which gives N mutually exclusive cases. The two bracketed terms mean that the failure of one of the N links must occur jointly with the survival of: (i) each of the remaining (N- v1 - 1) links with stress a, and of (ii) each of theremaining v, links with redistributed stress ,ti.Analysis shows that the second term of fishnet statistics P.s, increases the terminal slope of strengthprobability distribution in Weibull scale by thefactor of 2. Particularly important are the implications for structural safety. In Fig. 3b, the horizontal line for P
1= lo-6marks the maximum failure
probability that is tolerable for engineering design.
lll...-
0.8} t I 'l
� 0,6t Gaussian. !
r[ 0,4(
0.2f I ; :-·
o.oLPower Law Tail
• • l_/ 0.0 0.2 0.4 0.6
u If,
(a) -------
0.8
r P,=o.s Of--. - -·----,
' i
- .. ---- - i1.0 1.2
r -sf FiniteWeakest-L:1/ 1 m
f -10[ {.,-,[ __ 2-TermFlshnet i ! ,,
l ,,
-1sr;,,/L ___ J ___ -------- ---- _______ --.J
-0.6 -0.5 -0.4 -0.3 -0.2 -0.1 0.0 ln(o-/ /,)
(b)
Fi�ure 3. a) Cumulative distribution function (all) of failure for a single link with mean J; = 10.016 MPa and CoV = 7.8%); b) Comparison of P1 (in Weibull scale) between the finite weakest-link model and the fishnet model with first 2 terms in the expansion of Eq. I.
75
In this typical case, for constant N, the strength for P
1= 10-6 is seen to increase by I0.5% when passing
from the weakest-link failures to fishnet failures, while, at fixed strength, the P
1 is seen to decrease
about 25-times. The P1
decrease depends on the fishnet configurations and on P 1 • but is generally more than IO-times greater. This is an enormous safety advantage of the imbricated lamellar microstructure, which comes in addition to the advantages previously identified by deterministic studies.
5 THREE-TERM FISHNET STATISTICS
Further improvement can be obtained by including the third term of the sum in Eq.(I ). This tenn may be split into two parts, l's = Ps. + P.s , which are mutually exclusive, and �hus additFve. They represent the sun�val probabilities when the next failed link is, or is not, adjacent to the previously failed link. For detailed derivation, see (13].
6 MONTE CARL O FAILURE SIMULATIONS
A rectangular fishnet truss, with k rows and n columns of identical links, has been simulated by a finite element program (in Matlab). For computational stability, the fishnet is loaded under displacement control, by incrementing equal longitudinal displacements u0 at the right boundary. At the left boundary, the horizontal displacement is zero. The boundary nodes slide freely in the transverse direction.
According to the arguments in [15, 17, 18, 19], based on nano-mechanics and scale transitions, the cumulative distribution function (cdf) of strength of each link, P
1(d), is assumed to be a Gaussian (or
normal) distribution with a Weibull tail of exponent m grafted on the left at failure probability P
6
(for a -t 0, the cdf oc a"'). The strength of each of N = k x n links is generated randomly according to P.(<f). The autocorrelation length of the link strength field is assumed to be equal to the link size and, therefore, is not considered
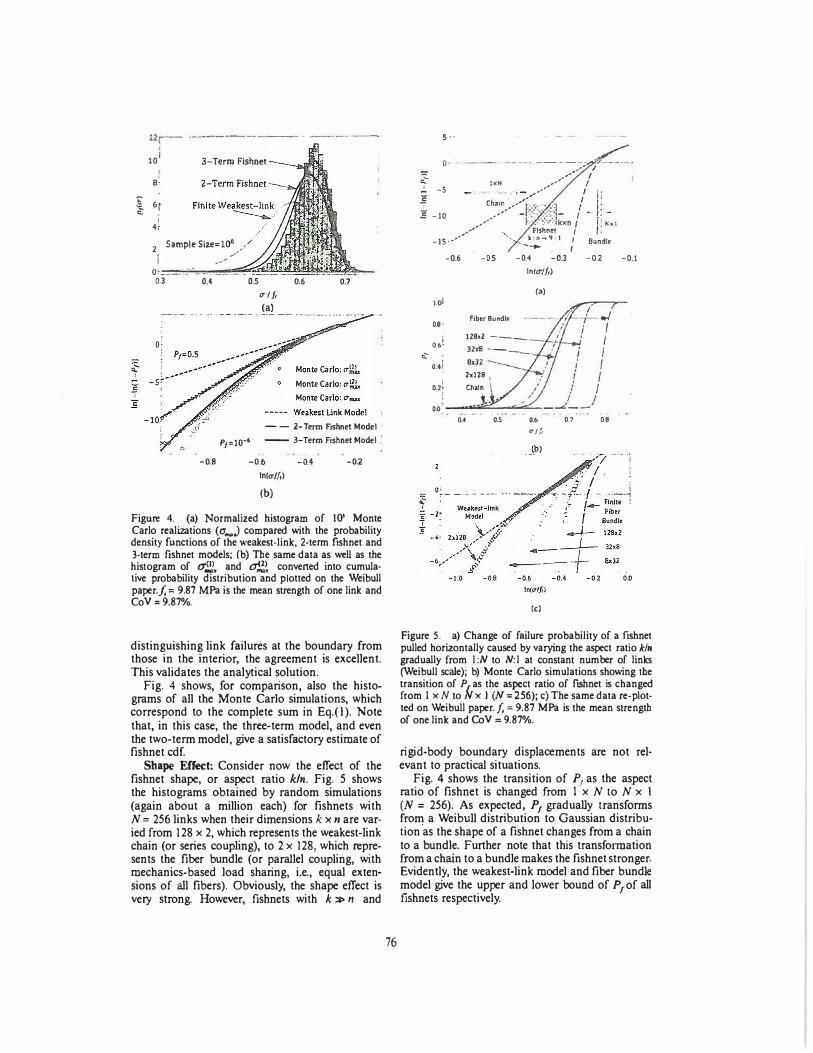
To verify the analytical two- or three-term statistics, respectively, the cases in which more than one, or two, links failed prior to the maximum load have been deleted from the set of about I million simulations of a fishnet having 16 x 32 links, CoV = 0.987 of P., and grafting point at P, = 0.09. This is equivalent to omitting in Eq.( I) all the terms except the first two or three, respectively.
The remaining histograms ( 17,!!}, and O'!,!�) are compared with the analytical cdf in Fig. 4b (Fig . 4a shows, for all simulations of a..,,, only the histogram). Despite simplifications, such as using a uniform redistribution ratio tJ and not
3-Term Fishnet
B·
b 6t � i
4r
2 Sample Sii.e=lW ,/ I /,,,
o-____ .....
0.3 0.4 0.5
u I/,
(a)
0.6 0.?
- - 2-Term Fishnet Model
P1 :10·• -- 3-Term Fishnet Model'.
-0.8 -0.6
ln(u//,)
(b)
-0.4 -0.2
Figure 4. (a} Normalized histogram of 10' Monte Carlo realizations (u_.) compared with the probability density functions of the weakest-link, 2-term fishnet and 3-term fishnet models; (b) The same data as well as the histogram of O'!!!., and tr,.!� convened into cumulative probability distribution and plotted on the Weibull paper.!,= 9.87 MPa is the mean strength of one link and CoV = 9.87%.
distinguishing link failures at the boundary from those in the interior, the agreement is excellent. This validates the analytical solution.
Fig. 4 shows, for comparison, also the histo· grams of all the Monte Carlo simulations, which correspond to the complete sum in Eq.(I). Note that, in this case, the three-term model, and even the two-term model, give a satisfactory estimate of fishnet cdf.
Shape Effect: Consider now the effect of the fishnet shape, or aspect ratio kin. Fig. 5 shows the histograms obtained by random simulations (again about a million each) for fishnets with N = 256 links when their dimensions k x n are varied from 128 x 2, which represents the weakest-link chain (or series coupling), to 2 x 128, which represents the fiber bundle (or parallel coupling, with mechanics-based load sharing, i.e., equal extensions of all fibers). Obviously, the shape effect is very strong. However, fishnets with k » n and
76
s ..
o- ··---- ------ 'r----····
,,,,-'' ,1
� 1 lxN ,,, ... "' / C -5 -; -··· . ....,, .. ·,:,,.,
....
/ ll
k -10 Cho��/):(•;_: :/j- / • !: -,,/ ( •.. ·:<,::: kxn / i' ._ 1
.;:
,,/ ., Fishnet / I:
-IS··'' ' •,•-�·! f Bundle -.._ I
1.ol
0.8·
i 06·
0.41
d :
OD
-0.6 -0.S -0.4 -0.3 -0.2 -0.1
ln(u//,)
(a)
Fibtr Bu ndlP.
128,2 ----
32"11 ·---
2xl28 1
Chain
. /--/-..!
/ ; / f
j
/
.' I I I J
__ t. _ _..e_ __
0.4 o.s 0.6
er/Ii
(C)
0.7 0.8
Figure 5. a} Change of failure probability of a fishnet pulled horizontally caused by varying the aspect ratio kin
gradually from l:N to N:l at constant number of links (Weibull scale); b} Monte Carlo simulations showing the transition of P1_as the aspect ratio of fishnet is changedfrom 1 x N to N x I (N = 256}; c) The same data re-plotted on Weibull paper./,= 9.87 MPa is the mean strength of one link and O:,V = 9.87%.
rigid-body boundary displacements are not rel· evant to practical situations.
Fig. 4 shows the transition of P1
as the aspect ratio of fishnet is changed from I x N to N x I (N : 256). As expected, P
1 gradually transforms
from a Weibull distribution to Gaussian distribution ·as the shape of a fishnet changes from a chain to a bundle. Further note that this transfonnation from a chain to a bundle makes the fishnet stronger. Evidently, the weakest-link model and fiber bundle model give the upper and lower bound of P
1 of all
fishnets respectively.
I
I II e' _,.
.,,, ci' b! C>O'
_g I
Transition of Probability
Density Function (pdf)
�---------------'-- ·-·---·-----
log D
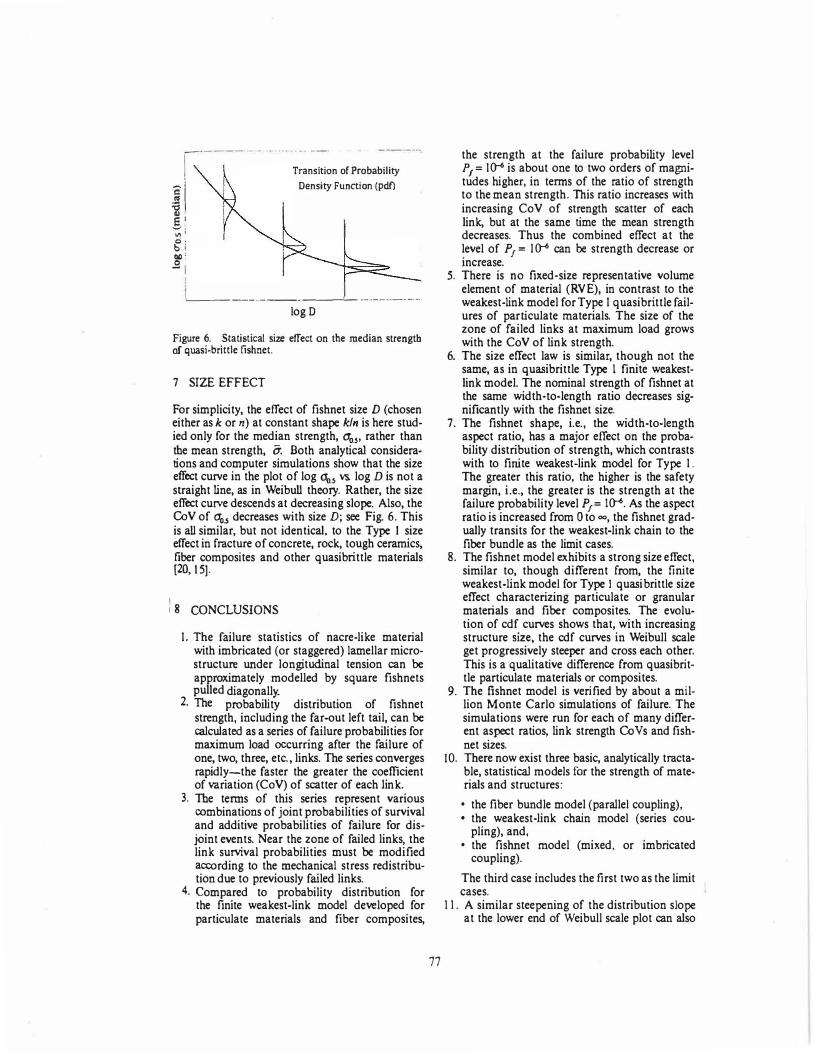
Figure 6. Statistical si2e effect on the median strength of quasi-brittle fishnet.
7 SIZE EFFECT
For simplicity, the effect of fishnet size D (chosen either ask or n) at constant shape kin is here studied only for the median strength, 0'0.5, rather than the mean strength, a. Both analytical considerations and computer simulations show that the size effect curve in the plot of log <10_5 vs. log D is not a straight line, as in Weibull theory. Rather, the size effect curve descends at decreasing slope. Also, the C.oV of O'o.5 decreases with size D; see Fig. 6. This is all similar, but not identical, to the Type I size effect in fracture of concrete, rock, tough ceramics, fiber composites and other quasibrittle materials (20, 15).
i 8 CONCLUSIONS
I. The failure statistics of nacre-like materialwith imbricated (or staggered) lamellar microstructure under longitudinal tension can beapproximately modelled by square fishnetspulled diagonally.
2. The probability distribution of fishnetstrength, including the far-out left tail, can becalculated as a series of failure probabilities formaximum load occurring after the failure ofone, two, three, etc., links. The series convergesrapidly-the faster the greater the coefficientof variation (CoV) of scatter of each link.
3. The terms of this series represent variouscombinations of joint probabilities of survivaland additive probabilities of failure for disjoint events. Near the zone of failed links, thelink survival probabilities must be modifiedaccording to the mechanical stress redistribution due to previously failed links.
4. Compared to probability distribution forthe finite weakest-link model developed forparticulate materials and fiber composites,
77
the strength at the failure probability level P
1= I� is about one to two orders of magni
tudes higher, in terms of the ratio of strength to the mean strength. This ratio increases with increasing CoV of strength scatter of each link, but at the same time the mean strength decreases. Thus the combined effect at the level of P
1 = l � can be strength decrease or
increase. 5. There is no fixed-size representative volume
element of material (RVE), in contrast to theweakest-link model for Type I quasibrittle failures of particulate materials. The size of thezone of failed links at maximum load growswith the CoV of link strength.
6. The size effect law is similar, though not thesame, as in quasibrittle Type I finite weakestlink model. The nominal strength of fishnet atthe same width-to-length ratio decreases significantly with the fishnet size.
7. The fishnet shape, i.e., the width-to-lengthaspect ratio, has a major effect on the probability distribution of strength, which contrastswith to finite weakest-link model for Type I.The greater this ratio, the higher is the safetymargin, i.e., the greater is the strength at thefailure probability level P
1= I�. As the aspect
ratio is increased from Oto 00, the fishnet gradually transits for the weakest-link chain to the fiber bundle as the limit cases.
8. The fishnet model exhibits a strong size effect,similar to, though different from, the finiteweakest-link model for Type I quasi brittle sizeeffect characterizing particulate or granularmaterials and fiber composites. The evolution of cdf curves shows that, with increasingstructure size, the cdf curves in Weibull scaleget progressively steeper and cross each other.This is a qualitative difference from quasibrittle particulate materials or composites.
9. The fishnet model is verified by about a million Monte Carlo simulations of failure. Thesimulations were run for each of many different aspect ratios, link strength C.oVs and fishnet sizes.
10. There now exist three basic, analytically tractable, statistical models for the strength of mate·rials and structures:
• the fiber bundle model (parallel coupling),• the weakest-link chain model (series cou
pling), and,• the fishnet model (mixed, or imbricated
coupling).
The third case includes the first two as the limit cases.
11. A similar steepening of the distribution slopeat the lower end of Weibull scale plot can also
be achieved by the chain-of-bundles model, but only if a convenient intuitive non-mechanical load-sharing rule is empirically postulated for each bundle, and if the specimen length is subdivided by chosen cross sections into statistically independent segments of suitable length, corresponding to each bundle. However, the imbricated (staggered) lamellar connectivity cannot be captured.
ACKNOWLEDGMENT
Partial support from the Army Research Office Grant W9l l NF-15-1-0240 is gratefully acknowledged. Some preliminary studies also drew support from NSF Grant CMS = 0556323.
REFERENCES
[I] Huajian Gao, Baohua Ji, lngomar L Jager, EduardArzt, and Peter Fratzl. Materials become insensitiveto flaws at nanoscale: lessons from nature. Proceedings of the national Academy of Sciences, 100(10):5597-5600, 2003.
(2) RZ Wang, Z Suo, AG Evans, N Yao, and IA Aksay.Deformation mechanisms in nacre. Journal of Marerials Research, 16(9): 2485-2493, 2001.
(3) Xiaoding We� Tobin Filleter, and Horacio DEspinosa. Statistical shear lag model-unravellingthe size effect in hierarchical composites. Acra biomarerialia, 18: 206-212, 2015.
(4) Yue Shao, Hong-Ping Zhao, Xi-Qiao Feng, andHuajian Gao. Discontinuous crack-bridging modelfor fracture toughness analysis of nacre Journal of rhe Mechanics and Physics of Solids, 60(8):1400--1419, 2012.
I 5) Zsolt Bertalan, Ashivni Sbekhawat, James P Setbna, and Stefano Zapperi . Fracture strength: Stress concentration, extreme value statistics, and the fate of the weibull distribution. Physical Review Applied, 2(3): 034008, 2014.
(6) Sina Askarinejad and Nima Rabbar. Tougheningmechanisms in bioinspired multilayered materials.Journal of The Royal Sociery lnrerface, 12(102):20140855, 2015.
[7) Roberto Ballarini and Arthur H Heuer. Secrets in the shell the body armor of the queen conch is much tougher than comparable synthetic materials. what secrets does it bold? American Scientist, 95(5): 422-429, 2007.
(8) F Barthelat and HD Espinosa. An experimentalinvestigation of deformation and fracture of nacre-
78
mother of pearl. Experimental med,anics, 47(3): 311-324, 2007.
[9) Abhishek Dutta, Srinivasan Arjun Tekalur, and Milan Miklavcic. Optimal overlap length in stag. gered architecture composites under dynamic loading conditions. Journal of the Mechanics and Physics of Solids,61(1): 145-160, 2013.
(10) Abhisbek Dutta and Srinivasan Arjun Tekalur.Crack tortuousity in the nacreous layer- topological dependence and biomimetic design guideliDe.lnrernariona/ Journal of Solids and Srrucrures, 51 (2):325-335, 2014.
[11) S Kamat, X Su, R Ballarini, and AH Heuer. Struc. tural basis for the fracture toughness of the shell of the conch strombus gigas. Na111re, 405(6790): 1036-1040, 2000.
(12) Wen Luo and Zden!k P Bazant. Fishnet statisticsfor probabilistic strength and scaling of nacreous imbricated lamellar materials. Journal of theMechanics and Physics of Solids, 109: 264-287 2017.
'
[13) Wen Luo and Zdenek P Bazan!. Fishnet statistics for strength scaling of nacreous imbricated Jamellar materials. arXivpreprintarXiv: 1706.0/591, 2017.
(14) Ronald Aylmer Fisher and Leonard Henry CalebTippett. Limiting forms of the frequency distribution of the largest or smallest member of a sample.In Mathematical Proceedings of the CambridgePhilosophical Sociery, volume 24, pages 180-190.Cjambridge University Press, 1928.
[ 15) Zdenek P Bazant and Jia-Liang Le. Probabilistic Mechanics of Quasibritrle Structures: Srrengrli. Lifetime. and Size Ejfel't. Cambridge University Press, 2017.
(16] Mikko J Aiava, Pbani KVV Nukala, and Stefano Zapperi. Statistical models of fracture . Advances in Physics, 55(3-4): 349-4 76, 2006.
[I 7] Zden!k P Ba2ant and Sze-Dai Pang. Mechanics based statistics of failure risk of quasibrittle structures and size effect on safety factors. Proceedings of rile National Academy if Sciences, 103(25): 9434-9439, 2006.
(18) Zden!k P Ba!ant and Sze-Dai Pang. Activationenergy based extreme value statistics and size effectin brittle and quasibrittle fracture. Journal of rheMechanics and Physics of Solids, 5S(J): 91-131,2007.
[19) Zdenek P Bazant, Jia-Liang Le, and Martin zBazant. Scaling of strength and lifetime probability distributions of quasibrittle structures based on atomistic fracture mechanics. Proceedings of rhe National Academy of Sciences, 106(28): 11484-11489, 2009.
(20) Zdenek P Bazant. Scaling of srrucrural strengrh.Butterworth-Heinemann, 2005.