Embed Size (px)
Citation preview
FLOODPLAIN SOIL SAMPLINGSUMMARY REPORT
HUDSON RIVER PCBS SITENEW YORK
August 2005
USEPA Contract No. 68-W-00-121
Prepared for:
U.S. Environmental Protection AgencyRegion 2
New York, New York 10007
Prepared by:
Region 2 Site Assessment TeamWeston Solutions, Inc.
Edison, New Jersey 08837
W.O. No. 20103.001.001.1048.00
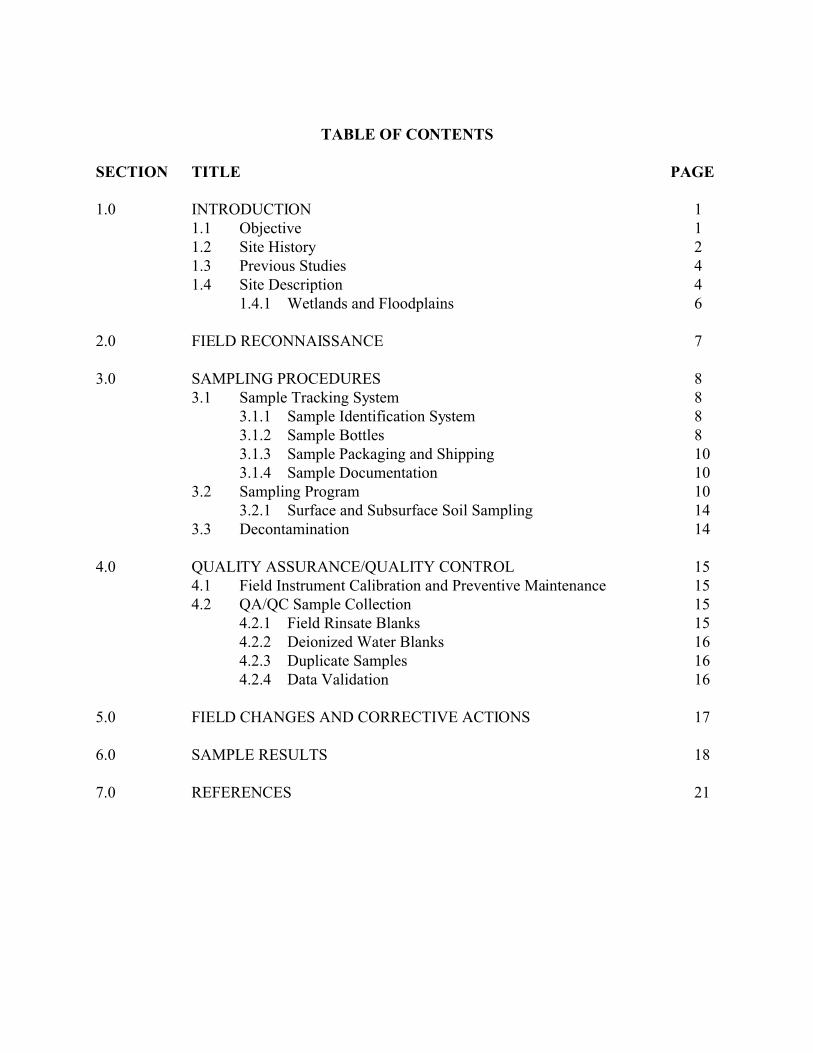
TABLE OF CONTENTS
SECTION TITLE PAGE
1.0 INTRODUCTION 11.1 Objective 11.2 Site History 21.3 Previous Studies 4 1.4 Site Description 4
1.4.1 Wetlands and Floodplains 6
2.0 FIELD RECONNAISSANCE 7
3.0 SAMPLING PROCEDURES 83.1 Sample Tracking System 8
3.1.1 Sample Identification System 83.1.2 Sample Bottles 83.1.3 Sample Packaging and Shipping 103.1.4 Sample Documentation 10
3.2 Sampling Program 103.2.1 Surface and Subsurface Soil Sampling 14
3.3 Decontamination 14
4.0 QUALITY ASSURANCE/QUALITY CONTROL 154.1 Field Instrument Calibration and Preventive Maintenance 154.2 QA/QC Sample Collection 15
4.2.1 Field Rinsate Blanks 154.2.2 Deionized Water Blanks 164.2.3 Duplicate Samples 164.2.4 Data Validation 16
5.0 FIELD CHANGES AND CORRECTIVE ACTIONS 17
6.0 SAMPLE RESULTS 18
7.0 REFERENCES 21
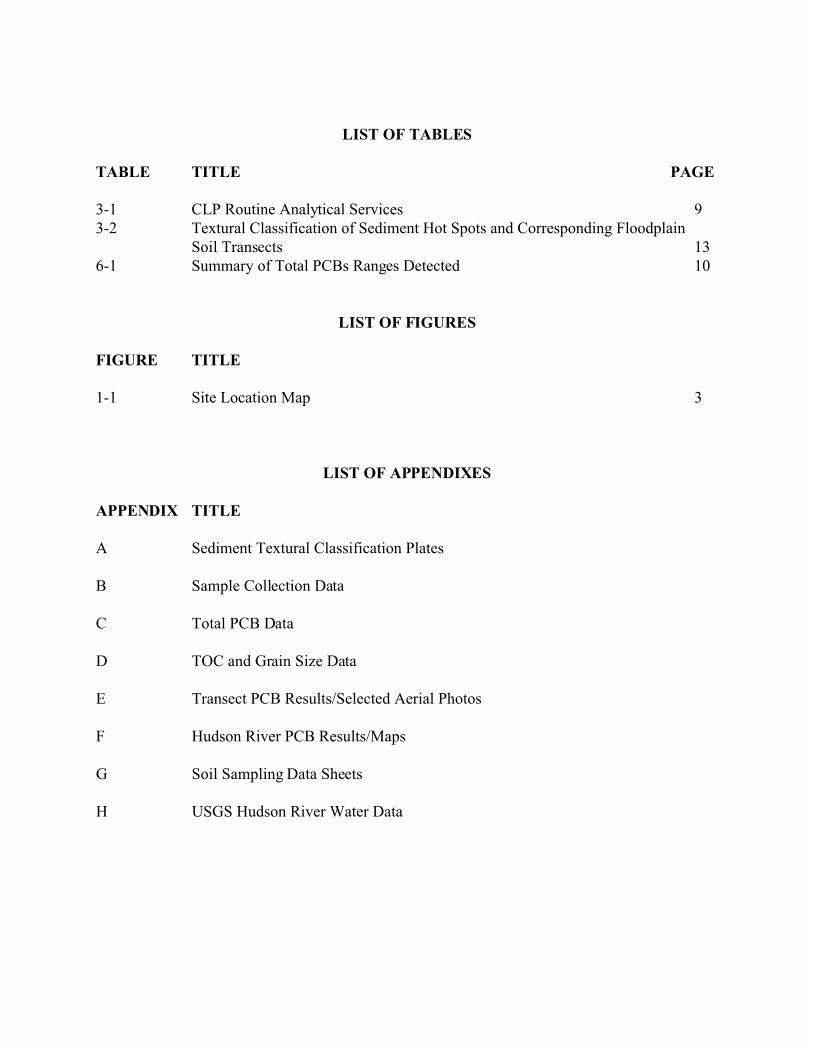
LIST OF TABLES
TABLE TITLE PAGE
3-1 CLP Routine Analytical Services 93-2 Textural Classification of Sediment Hot Spots and Corresponding Floodplain
Soil Transects 136-1 Summary of Total PCBs Ranges Detected 10
LIST OF FIGURES
FIGURE TITLE
1-1 Site Location Map 3
LIST OF APPENDIXES
APPENDIX TITLE
A Sediment Textural Classification Plates
B Sample Collection Data
C Total PCB Data
D TOC and Grain Size Data
E Transect PCB Results/Selected Aerial Photos
F Hudson River PCB Results/Maps
G Soil Sampling Data Sheets
H USGS Hudson River Water Data
1
1.0 INTRODUCTION
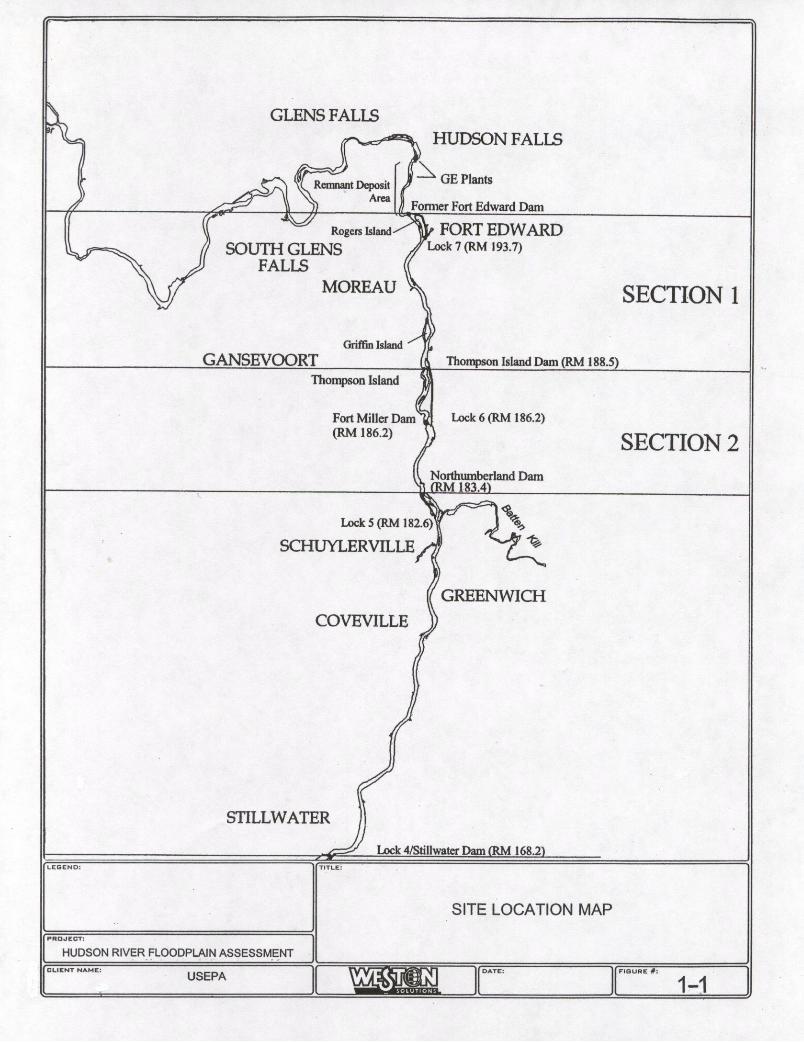
The Hudson River PCBs Site ("Site"), United States Environmental Protection Agency (USEPA)Identification Number NYD980763841, includes a nearly 200-river-mile stretch of the Hudson Riverin eastern New York State from the Village of Hudson Falls in Washington County south to theBattery in New York City. The Site is divided into the Upper Hudson River (the length of riverbetween Hudson Falls and the Federal Dam at Troy, New York) and the Lower Hudson River (thelength of river between the Federal Dam at Troy and the Battery). For purposes of this project,USEPA further divided the Upper Hudson River area into three main sections known as RiverSection 1, River Section 2, and River Section 3. The focus of the Field Sampling event wasapproximately a 12-mile-long river reach ("the subject reach") extending from Fort Edward toSchuylerville, NY, which encompasses River Sections 1 and 2, and the upper portion of RiverSection 3 (Figure 1-1).
Under USEPA Contract No. 68-W-00-121, Weston Solutions, Inc. (WESTON) was issued workassignment No. 48, to prepare a Draft - Field Sampling Plan, for site characterization of floodplainsoils contaminated by polychlorinated biphenyls (PCBs). This Floodplain Soil Sampling SummaryReport document details the Field Sampling Plan rationale, the implementation of the plan, andsummarizes the tasks performed under this work assignment.
The data gathered during the Floodplain Soil Sampling event provides a preliminary indication asto the potential nature and extent of PCB contamination in floodplain soils within the subject reach.Results may be useful in the design of future studies that may be necessary to fully delineate the PCBcontamination.
The Field Sampling Plan was developed at the request of the USEPA in accordance with the USEPARegion 2 Comprehensive Environmental Response, Compensation and Liability Act (CERCLA)Quality Assurance Manual (October 1989) and the Site Assessment Team (SAT) Quality AssuranceProject Plan (September 2000), and the EPA Requirements for Quality Assurance Project Plans,QA/R5 (March 2001).
The sampling strategy listed within this Floodplain Soil Sampling Summary Report emphasizes thecollection of samples required to evaluate certain pathways of concern to the CERCLA Program.The summary report includes the following sections: Field Reconnaissance (2.0), SamplingProcedures (3.0), Quality Assurance/Quality Control (4.0), Field Changes and Corrective Actions(5.0), Sample Results (6.0), and References (7.0).
1.1 Objective
The objective of this initial investigation was to look at the variability of PCB concentrations inselected locations within the floodplain and to determine if additional characterization is warranted.This sampling investigation was preliminary in nature and builds upon the previous floodplain soildata collection and study by the National Oceanographic and Atmospheric Administration (NOAA)dated February 2002 (NOAA, 2002). Additional sampling of the floodplain reach from Fort Edward
2
to Schuylerville, and other floodplain reaches of the Hudson River, may be necessary to fully identifyand characterize potential human and ecological exposure pathways relative to possible PCBcontamination within floodplain soils.
The study was designed to investigate if PCB contamination in floodplain soils is greatest in areasimmediately adjacent to known PCB sediment locations and depositional areas of the river;characterized by broad floodplains and greater channel sinuosity. The sampling design employeda transect approach in which floodplain soil transects were located based on existing sediment dataindicating the presence of PCBs in the river, as well as river characteristics and property access.Several new transects were co-located in the vicinity of the previous NOAA samples.
Results are used to determine if river characteristics and PCB sediment locations can be used as anaccurate indicator of the likely extent of PCB contamination in floodplain soils throughout the 12-mile reach study area. If so, future studies aimed at delineating the extent of contamination mightbe able to focus on floodplain areas where contamination is likely to be highest, which in turn willform the basis for accurate assessment of human health and ecological risks.
The rationale behind the sampling and analysis approach is described in further detail in Section 3.0below.
1.2 Site History
During an approximate 30-year period ending in 1977, the General Electric Company (GE) usedPCBs in its capacitor manufacturing operations at its Hudson Falls and Fort Edward, New Yorkfacilities. PCB oils were discharged both directly and indirectly from these plants into the HudsonRiver. This included both non-permitted and permitted discharges. Even after GE received a permitin 1975, permit exceedances occurred. Estimates of the total quantity of PCBs discharged directlyfrom the two plants into the river from the 1940s to 1977 are as high as 1,330,000 pounds (lbs)(about 603,000 kilograms (kg)).
Many of the PCBs discharged to the river adhered to sediments and accumulated with the sedimentsas they settled in the impounded pool behind the Fort Edward Dam, as well as other depositionalareas farther downstream. Because of its deteriorating condition, the Fort Edward Dam was removedin 1973. Five areas of PCB-contaminated sediments were exposed due to the lowering of the riverwater level when the Fort Edward Dam was removed. These five areas are known as the RemnantDeposits. During subsequent floods, PCB-contaminated sediments from the Fort Edward Dam areawere scoured and transported downstream.
The sediments of the Upper Hudson River were surveyed by the New York State Department ofEnvironmental Conservation (NYSDEC) in 1976 through 1978 and 1984. Areas with average totalPCB concentrations of 50 ppm or greater were identified and are known as the NYSDEC-definedPCB "hot spots." There were 40 NYSDEC-defined hot spots, located between River Mile (RM) 194at Rogers Island and Lock 2 at RM 163. Hot spots 1 through 4 were dredged by New York State fornavigational purposes in the 1970s. Legal action brought against GE by the NYSDEC in 1975
4
resulted in a $7 million program for the investigation of PCBs in the river and the development ofmethods to reduce or remove the threat of PCB contamination. The Site was proposed for inclusionon the CERCLA National Priorities List (NPL) in September 1983 and formally listed in September1984.
Although commercial uses of PCBs ceased in 1977, GE's Fort Edward and Hudson Falls plantscontinue to contaminate the Hudson River with PCBs, due primarily to releases of PCBs via bedrockfractures from the GE Hudson Falls plant. In 1984, the USEPA completed a Feasibility Study (FS)and issued a Record of Decision (ROD) for the Site. USEPA recognized that PCB contaminationin the Upper Hudson River sediments was a problem, but selected an interim No Action remedy forthe contaminated sediments because, in the Agency's view, the reliability and effectiveness ofremedial technologies available at that time were uncertain and there were downward trends of PCBsin fish, sediment, and water at the time. In December 1989, USEPA announced its decision toinitiate a detailed Reassessment Remedial Investigation/Feasability Study (RI/FS) of the interim NoAction decision for the Upper Hudson River sediments. This was prompted by the five-year reviewrequired by CERCLA, technical advances in sediment dredging and treatment/destructiontechnologies, as well as a request by the NYSDEC for a re-examination of the 1984 decision.
A second ROD was issued with respect to this site in February 2002. The selected remedy includedthe dredging of approximately 2.65 million cubic yards of PCB-contaminated sediments from theUpper Hudson River, which is estimated to contain 70,000 kg (about 154,000 lbs) of total PCBs(approximately 65% of the total PCB mass present within the Upper Hudson River).
An investigation of the floodplains and other areas external to the river (i.e., historical dredge spoildisposal areas along the Upper Hudson River) was not included in the scope of the ReassessmentRI/FS and was not addressed in the February 2002 ROD. According to the ROD, "Concerns relatedto possible exposure of residents and ecological receptors to PCB contamination in the floodplainswill be further evaluated concurrent with the design phase of this project in coordination with NewYork State."
1.3 Previous Studies
In September and October 2000, National Oceanographic and Atmospheric Administration (NOAA)collected samples of soils and biota within the floodplain of the Hudson River between Fort Edward,New York and the Saratoga Battlefield National Historical Park in Stillwater, New York (NOAA,2002). The study was funded by NOAA. A total of 179 floodplain soil samples were collected from11 transect sites along the Hudson River and analyzed for Total PCBs, Total Organic Carbon (TOC)and grain size. Concurrent with soil sampling activities, the NOAA conducted biota sampling ofsmall mammals and earthworms.
The purpose of the screening study was to assist the Hudson River Natural Resources DamageAssessment Trustees in determining whether soils and biota containing PCBs are present in thefloodplain and to determine if additional pathway and injury assessment studies should be conducted.For the floodplain assessment portion of the study, a total of 179 floodplain soil samples were
5
collected from 11 sites along the Hudson River and analyzed for Total PCBs, Total Organic Carbon(TOC) and grain size.
PCBs were found at detectable levels at all of the 11 soil sampling sites, with PCB concentrationsranging from 0.018 milligram/kilogram(mg/kg) to 360 mg/kg (not normalized for carbon fraction).At individual sites, PCB soil concentrations were usually highest closest to the river, and generallyin soils between 0 and 10 inches deep. In general, PCB soil levels were highest at low-lying sitesdirectly adjacent to the Hudson River and at Rogers Island, where high concentrations of PCBs insoils had been previously documented (367 ppm surface and 1800 ppm subsurface by USEPA in1999; 170 ppm by NYSDEC in 1998; and 384 ppm by the NYSDOH 1992).
1.4 Site Description
The subject reach includes River Sections 1, and 2 and a small portion of Section 3. River Section1 extends about 6.3 miles from the former Fort Edward Dam (RM 194.8) to the Thompson Island(TI) Dam at RM 188.5. The area between the former Fort Edward Dam and the northern end ofRogers Island, a distance of about 0.2 mile, contains minimal PCB contamination and was notconsidered for remediation under the ROD. River Section 2 extends from the TI Dam to theNorthumberland Dam near Schuylerville (RM 183.4), an extent of 5.1 river miles. River Section 3extends from below the Northumberland Dam to the Federal Dam at Troy (RM 153.9), an extent of29.5 river miles. However, only the upper of this Section is included within the subject reach.
Floodplain soils have been previously documented to contain PCBs (e.g., NOAA 2002, USEPA1999, NYSDEC and NYSDOH) but the contamination has not been fully delineated.
1.4.1 Wetlands and Floodplains
Both federal and state freshwater wetlands exist throughout the Upper Hudson region. Wetlandsalong the Upper Hudson River are identified on U.S. Fish and Wildlife Service (USFWS) NationalWetland Inventory maps and NYSDEC wetland maps. Areas adjacent to the Upper Hudson Riverinclude forested shoreline wetlands, transitional uplands, and vegetated backwaters such as emergentmarsh and scrub-shrub wetlands.
The 100-year floodplain of the Upper Hudson and tributaries are shown on Flood Insurance RateMaps prepared by the Federal Emergency Management Agency (FEMA). The National FloodInsurance Program (NFIP) Flood Insurance Rate Maps (FIRMs) depict the 100-year floodplain forthe Upper Hudson River and tributaries. The width of the 100-year floodplain ranges fromapproximately 400 feet to over 5,000 feet at places along the Upper Hudson River.
The contaminant transport processes affecting the fate and effects of PCBs within the Upper HudsonRiver and its floodplain are interrelated. For example, because of a relatively high partitioningcoefficient (Koc), PCBs have an affinity for sediment particles. High-flow events and flooding maythen suspend the contaminated sediment particles, carrying them farther downstream, or over the
6
banks of the river to potentially contaminate riverbank and floodplain soils. Contaminated riverbankand floodplain soils could then be carried back into the river by erosion or movement of the riverchannel and runoff during storm events, eventually settling out into the sediment. Rivercharacteristics influencing where sediment is deposited, as well as floodplain characteristicsinfluencing the extent and duration of seasonal flooding events, are important determinants offloodplain soil contamination by PCB contaminated sediments. This conceptual model provides thebasis for the Field Sampling Plan rationale described in Section 3.2.
7
2.0 FIELD RECONNAISSANCE
WESTON representatives conducted the first field reconnaissance of the site on 31 July 2003 inconjunction with a pre-planned trip down the river by NYSDEC representatives. Because severalinvestigations have already been conducted of the Site, the focus of the initial field reconnaissancewas on identifying potential sampling locations that would address the objectives of thisinvestigation. The field reconnaissance consisted of a boat trip through the subject reach, beginningimmediately below Rogers Island and culminating at Lock 5 near Schuylerville, NY. During thereconnaissance, observations of bank conditions, public access, land use and river characteristicswere recorded in conjunction with review of existing mapping showing PCB sediment hot spots.Areas that were considered primary candidates for floodplain sampling were identified in the fieldand were photo documented.
A follow-up reconnaissance was conducted with USEPA, NYSDEC and NYSDOH personnel on1 July 2004. The focus of this effort was to assess, from the adjacent roadway network, generalproperty access and other potential physical limitations to the river floodplain
Finally, during the initiation and concurrent to the field sampling event, reconnaissance and propertyaccess activities were performed throughout the period between 2 November and 19 November2004.
8
3.0 SAMPLING PROCEDURES
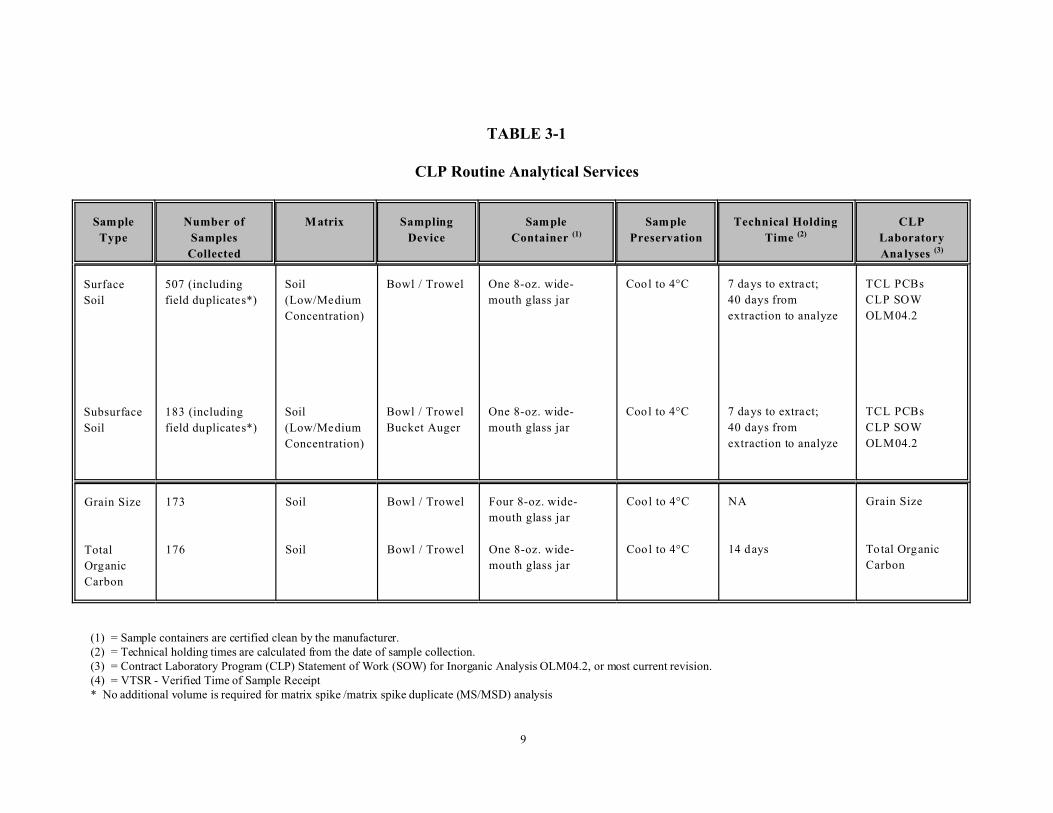
This section outlines overall sample management and control procedures implemented by WESTONpersonnel during field activities. The number of samples, matrix, sample devices, containers,standard analytical methods, preservation, and holding times are summarized in Table 3-1.
3.1 Sample Tracking System
3.1.1 Sample Identification System
Each sample was designated by a numeric code which will identify the site. The numeric code wasa site-specific project tracking number. The transect locational codes followed the site code. Themedia type followed the locational codes. A hyphen separates the site code, locational codes, andmedia type. Specific codes are as follows:
T = Transect NumberE/W = East /West Transect LocationS = Surface SoilSS = Subsurface SoilRIN = Field Rinsate Blank
After the media type, the sequential sample numbers were listed; sample numbers began with 01 andincrease accordingly. For example, two soil samples collected from a site may be designated asSample Nos. 1048-T3E-S01 and 1048-T3E-S02. A duplicate sample will be identified in the samemanner as other samples and will be distinguished in the field logbook.
3.1.2 Sample Bottles
Sample bottles were obtained from qualified vendors via a competitive bid process and met allguidelines specified in Office of Solid Waste and Emergency Response (OSWER) Directive9240.0-05A, Specifications and Guidance for Obtaining Contaminant-Free Sample Containers(December 1992).
9
TABLE 3-1
CLP Routine Analytical Services
Sample
Type
Number of
Samples
Collected
Matrix Sampling
Device
Sample
Container (1)
Sample
Preservation
Technical Holding
Time (2)
CLP
Laboratory
Analyses (3)
Surface
Soil
Subsurface
Soil
507 (including
field duplicates*)
183 (including
field duplicates*)
Soil
(Low/Medium
Concentration)
Soil
(Low/Medium
Concentration)
Bowl / Trowel
Bowl / Trowel
Bucket Auger
One 8-oz. wide-
mouth glass jar
One 8-oz. wide-
mouth glass jar
Cool to 4°C
Cool to 4°C
7 days to extract;
40 days from
extraction to analyze
7 days to extract;
40 days from
extraction to analyze
TCL PCBs
CLP SOW
OLM04.2
TCL PCBs
CLP SOW
OLM04.2
Grain Size
Total
Organic
Carbon
173
176
Soil
Soil
Bowl / Trowel
Bowl / Trowel
Four 8-oz. wide-
mouth glass jar
One 8-oz. wide-
mouth glass jar
Cool to 4°C
Cool to 4°C
NA
14 days
Grain Size
Total Organic
Carbon
(1) = Sample containers are certified clean by the manufacturer.(2) = Technical holding times are calculated from the date of sample collection.(3) = Contract Laboratory Program (CLP) Statement of Work (SOW) for Inorganic Analysis OLM04.2, or most current revision.(4) = VTSR - Verified Time of Sample Receipt* No additional volume is required for matrix spike /matrix spike duplicate (MS/MSD) analysis
10
3.1.3 Sample Packaging and Shipping
Samples were packaged and shipped according to the Contract Laboratory Program Guidance forField Samplers, April 2003. Chain-of-custody forms, sample labels, custody seals, and other sampledocuments were completed as specified in the above-reference manual. All entries were made inpermanent ink. If errors were made when completing any of these forms, the error was crossed outwith a single line, initialed, and dated by the sampler. Each environmental sample was properlyidentified and sealed in a polyethylene bag. The bag was then placed in a plastic cooler which wasalso lined with a large polyethylene bag. When required, samples were packed with sufficient ice(sealed in polyethylene bags) to cool the samples to 4°C. Sufficient non-combustible, adsorbentcushioning material was placed in the cooler so as to minimize the possibility of container breakage.The large plastic bag was then sealed and the container closed. Custody seals and strapping tape werethen affixed to the outer packaging. All samples were either hand-delivered or shipped via commoncarrier to the laboratory within 24 hours of collection. Sample shipments conformed to Weston'sGuidelines For Classifying Field Sample Shipments and the most current International Air TransportAssociation (IATA) Dangerous Goods Regulations. Information relating to the shipment of samples,including the air bill number, sample quantity, and sample types, were reported to the USEPA SampleManagement Office (SMO) on the day of or morning after shipment.
3.1.4 Sample Documentation
The sampling team or individual performing a particular sampling activity was required to maintaina field logbook. The bound, numbered, and paginated logbook was filled out at the location ofsample collection immediately after sampling. The logbooks contain sampling information,including: sample number, sample collection time, sample location, sample descriptions, samplingmethods, weather conditions, field measurements, name of sampler, site-specific observations, andany deviations from protocol. All entries were entered legibly in permanent ink. If errors were madewhen completing the logbooks, the error was crossed out with a single line, initialed, and dated bythe sampler.
3.2 Sampling Program
This section outlines overall rationale for the collection of samples, as well as the procedures thatwere followed during sampling activities. The sampling approach was designed to address theobjective of evaluating the potential extent of PCB contamination within floodplain soils, within thesubject reach. It was based on known fate and transport properties of PCBs and prior studies of theSite. These studies indicate, that should PCBs be present within the water column, they will likelybe adsorbed to suspended fine particles and organic material. The PCBs would settle out over timeinto the sediments, or potentially, floodplain soils in areas where flooding from the river has occurred. The floodplain soils investigation focused on areas where contamination would most likely beexpected. These areas included:
C Areas in the immediate vicinity of known sediment hot spot areas that are also
11
depositional in nature.C Areas where topographic relief is low, the floodplain is broad and the channel exhibits
greater sinuosity, indicative of areas with greater potential for sedimentation duringflooding events. These included wetlands and low-lying areas identified during the fieldreconnaissance.
C Areas adjacent to sediment hot spots with textural characterization of "cohesive".C Areas where PCB contamination in floodplain soils already has been documented in the
prior sampling events.
In addition, consideration was given to locations with public access and/or residential exposure, aswell as roadway access.
The sampling design employed a transect approach. Floodplain soil transects were located based onproperty access and existing sediment data indicating the presence of PCB hot spots in the river, aswell as river characteristics. The use of transects allowed for correlation of PCB concentrations withfloodplain characteristics. This includes elevation, distance from the river bank, and distance froma given sediment hot spot. For example, it was expected that transects located in areas farther awayfrom hot spots and in areas where the floodplain is narrow and surrounding banks are steep wouldshow less floodplain soil contamination by PCBs than areas closer to the hot spots that also exhibita broader floodplain and shallower banks. It was also anticipated that locations with higher elevationand greater distance from the riverbank would exhibit lower PCB concentrations in floodplain soilsthan areas closer to the riverbank.
An additional advantage of collecting samples along transects is that it will allow the USEPA to buildupon existing data by collecting samples along additional transects upstream or downstream duringfollow-up investigations.
A total of 95 transects were delineated as part of the floodplain soils investigation. Subject to access,the majority of the transects were located within areas most likely to resuspend PCB-contaminatedsediments and deposit them onto adjacent properties. A limited number of transects were also locatedin areas less likely to flood, as indicated by mapping, aerial photo interpretation and the fieldreconnaissance of the river.
Transects consisted of multiple sample locations on each side of the river, with the first two soillocations collected at two depths: 0-6 inches and 6-12 inches; the remaining locations were sampledat 0-6 inches. An additional 10 percent of the samples were collected at random, as blind duplicatesamples for PCB analysis. Collection of samples on both sides of the river along or near the sametransect allowed some direct comparison of PCB results with floodplain characteristics at a givenlocation along both sides of the river. In addition, collection of TOC and grain size samples allowfor comparison of PCB results with soil characteristics within the floodplain. It is expected thathigher PCB concentrations would be detected in fine-grained organic soils within wetland areas ofthe floodplain, while coarser-grained soils would probably not contain as high of a PCBconcentration, even if located along the bank.
12
Hudson River PCB Results, Figures1 through 3 (Appendix F) shows the distribution of transectssampled under the sampling program. As shown in the figures, transects (to the extent practicableand subject to access limitations), were clustered in groups to allow comparison of results in relationto known hot spots and bank characteristics. Transects were located generally perpendicular to theriver along a general east-west compass bearing. The location of specific soil sampling locationsalong each transect depended on the width of the floodplain in the area sampled and any surface orsubsurface obstructions. The sample locations were delineated using a global positioning system(GPS). Samples were generally taken at regular intervals, with one located near the debris line, thesecond one at 25 feet from the first point and the remaining points were selected to the outer limit ofthe 100-year floodplain. To the extent possible samples were place at 25, 50 100, and 150 ft and/orat some other point to the outer limit of the floodplain, as determined in the field. Along the transects,the outer extent of the floodplain was no more than 500 feet from the edge of the river for most of thelocations. In cases where the floodplain was very narrow, as few as two sample locations wereidentified along the transect. On the sides of the river in areas with a broader floodplain, typically fivesample locations were identified along a transect. Additionally, biased samples were also collectednear some transects if a unique physical feature (e.g. depression, trench) or land use (e.g. garden, boatramp) was present.
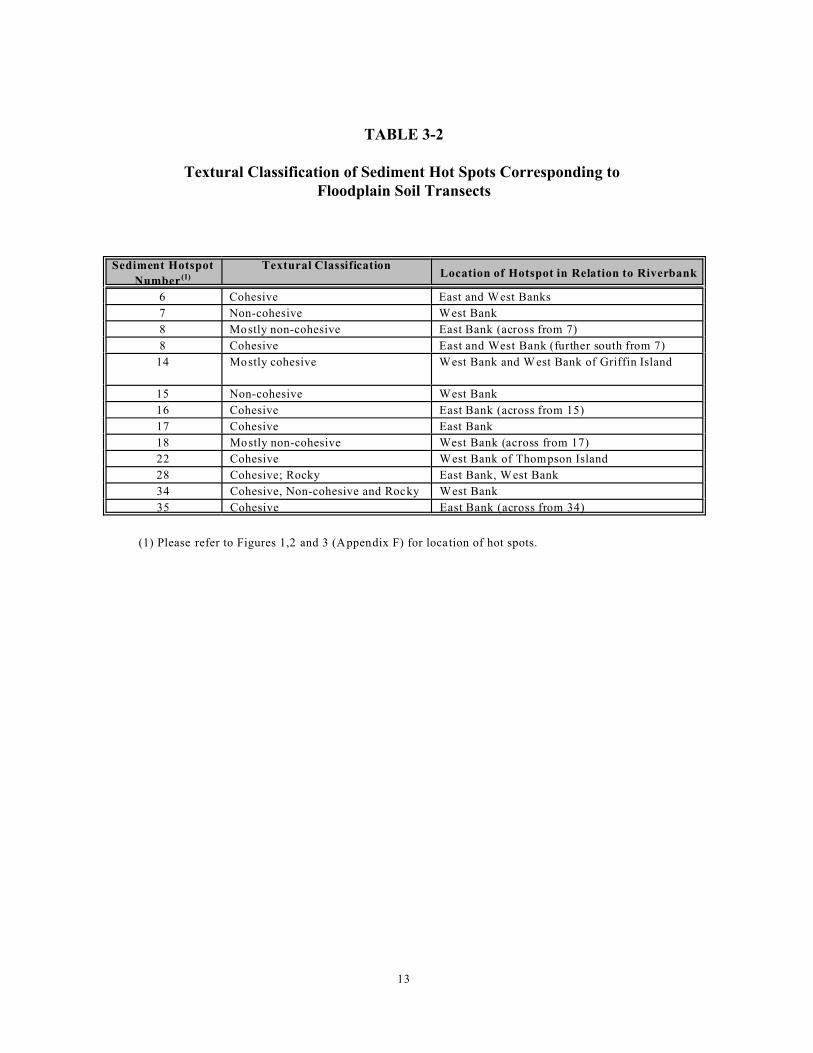
Table 3-2 provides a summary of transect clusters associated with hot spots, and their correspondingsediment textural characteristics as determined from the figures provided in Attachment A. The useof the transects may allow for comparison of PCB concentrations in floodplain soils withcorresponding textural characteristics in adjacent sediment hot spots. This, in conjunction withfloodplain characteristics, may be used for later data interpretation purposes in developing apreliminary conceptual model of PCB contamination in floodplain soils.
Collection of soils at two depths (0-6 inches and 6-12 inches) allows comparison of surficial soilPCB concentrations with those at depth. Data from the surface and subsurface intervals mayeventually be used for assessment of human health risks in conjunction with additional data. Datafrom the 6-12 inch interval would provide an indication of potential vertical extent of PCBcontaminated soils.
Surface and subsurface soil samples were analyzed for PCBs through the USEPA Contract LaboratoryProgram (CLP). Approximately 20 percent of the samples collected were also analyzed for grain sizeand TOC by the USEPA Region 2 DESA laboratory. The description of samples, including samplenumbering, and sample analyses are detailed in Appendix B.
13
TABLE 3-2
Textural Classification of Sediment Hot Spots Corresponding to Floodplain Soil Transects
Sediment Hotspot
Number (1)
Textural ClassificationLocation of Hotspot in Relation to Riverbank
6 Cohesive East and West Banks
7 Non-cohesive West Bank
8 Mostly non-cohesive East Bank (across from 7)
8 Cohesive East and West Bank (further south from 7)
14 Mostly cohesive West Bank and W est Bank of Griffin Island
15 Non-cohesive West Bank
16 Cohesive East Bank (across from 15)
17 Cohesive East Bank
18 Mostly non-cohesive West Bank (across from 17)
22 Cohesive West Bank of Thompson Island
28 Cohesive; Rocky East Bank, West Bank
34 Cohesive, Non-cohesive and Rocky West Bank
35 Cohesive East Bank (across from 34)
(1) Please refer to Figures 1,2 and 3 (Appendix F) for location of hot spots.

14
3.2.1 Surface and Subsurface Soil Sampling
The following procedures applied to the collection of soils using a dedicated plastic scoop or trowel:
1. Wore protective gear as specified in the Health and Safety Plan. Samplers donned newouter sampling gloves prior to sampling at each location.
2. A decontaminated shovel was used to scrape away surficial organic material (grass,leaves, etc.).
3. Obtained a soil sample using a decontaminated dedicated, disposable scoop/trowel byscooping soil from the surface to 6 inches below the surface.
4. Emptied contents of the scoop/trowel into a dedicated disposable, aluminum bowl.Repeat steps 2 and 3 until enough soil is collected to fill required sample containers.
5. Collected photo ionization detector (PID) readings; record results in field logbook.6. Removed unnecessary rocks, twigs, and other non-soil materials.7. Homogenized remaining soil for the non-volatile organic analysis fractions in the bowl
using a decontaminated, stainless steel utensil. Homogenization was completed as per thefollowing procedure:C The soil in the aluminum bowl was scraped from the sides, corners and bottom
of the bowl, rolled to the middle of the bowl, and mixed. C The soil was then be quartered and moved to the four corners of the bowl. C Each quarter was then be mixed individually and when completed be rolled to the
center of the bowl and mixed once again.C Transferred samples into required sample containers.
7. Placed samples in cooler and chilled with ice. Samples were hand-delivered or shippedwithin 24 hours of collection to the designated CLP laboratory(ies).
8. Filled out field logbook, custody seals, sample labels, and chain of custody forms.
3.3 Decontamination
All non-dedicated disposable equipment involved in field sampling activities was decontaminatedprior to and subsequent to sampling. Decontamination of sampling equipment was kept to aminimum in the field and dedicated disposable sampling equipment was used.
15
4.0 QUALITY ASSURANCE/QUALITY CONTROL
This section details the Quality Assurance/Quality Control (QA/QC) requirements for field activitiesperformed during the sampling effort.
4.1 Field Instrument Calibration and Preventive Maintenance
The sampling team was responsible for assuring that a master calibration/maintenance log wasbrought into the field and maintained for each measuring device. Each log included at a minimum,where applicable:
• name of device and/or instrument calibrated• device/instrument serial and/or ID number• frequency of calibration• date of calibration• results of calibration• name of person performing the calibration• identification of the calibrant (PID, FID, pH meter)
Equipment used each day was be calibrated prior to the commencement of daily activities.
4.2 QA/QC Sample Collection
4.2.1 Field Rinsate Blanks
Field rinsate blanks consisted of deionized, demonstrated analyte-free water that was poured overdecontaminated sampling equipment. The field rinsate blank analytical results are utilized inevaluation of potential cross-contamination resulting from inadequate decontamination. Thefrequency of field rinsate blank collection was one blank per decontamination event per type ofequipment, not to exceed more than one per day. Blanks were collected for all parameters of interest(excluding physical parameters) and shipped with the samples collected the same day.
Field rinsate blanks were be collected in accordance with the procedure listed below:
1. Sampling equipment was decontaminated, or factory sealed dedicated plastic andaluminum sampling equipment was un-wrapped.
2. Deionized water was poured over the sampling device and the rinsate was collected inthe appropriate sample containers.
3. Remaining samples were preserved as specified in Table 3-1 of this report. pH was testedby pouring a small portion of sample on broad range pH paper over a collection bowl.Samples were placed in a cooler.
4. Sample labels, custody seals, and chain of custody forms were completed and relevantinformation was recorded in field logbook.
16
4.2.2 Deionized Water Blanks
The distilled deionized water utilized for the trip and field blanks was provided and certified by theanalytical labs. A copy of this certificate was kept on site and another in the site-specific project file.The criteria used to demonstrate analyte-free was consistent with that specified in the USEPA Region2 CERCLA Quality Assurance Manual (October 1989), and is as follows:
• Pesticides/PCBs < CRQL
The CRQL is represented by the Contract Required Quantitation Limit in the most recent ContractLaboratory Program (CLP) Statement of Work (SOW).
4.2.3 Duplicate Samples
Duplicate samples were sent for laboratory analysis to evaluate the ability of reproducing thesampling methods. At a minimum, a rate of one duplicate sample per 20 samples, or one duplicatesample per batch of less than 20 samples, was obtained for each matrix.
In addition, a minimum of one matrix spike/matrix spike duplicate (MS/MSD) sample per matrix wascollected per 20 samples, or one MS/MSD sample per matrix per batch of less than 20 samples. 4.2.4 Data Validation
The USEPA Region 2 provided the validated floodplain soil sampling CLP data to WESTON.WESTON personnel, trained and approved by USEPA Region 2 Monitoring Management Branchperformed a review of all data validation utilizing the most current USEPA Region 2 data validationguidelines.
17
5.0 FIELD CHANGES AND CORRECTIVE ACTIONS
The WESTON Project Manager (PM) or his/her designee was required to modify generic siteprocedures to accommodate site-specific needs or unforeseeable events. When it became necessaryto modify a procedure, the PM notified the USEPA Region 2 Work Assignment Manager (WAM)or his designee at the USEPA Region 2 - Hudson River Field Office. Deviations from the fieldsampling plan are documented in the field logbook and signed by the initiator and/or the PM.
In general, the predominant changes to the sampling plan were caused by the limitation of access tocollect soil samples on private land or restrictions due to physiography, and the subsequent need tofield determine the final transect locations.
18
6.0 SOIL SAMPLE RESULTS
A total of 95 transects were established for the collection of soil samples. Within those transects,samples from 690 soil sample locations were analyzed for PCBs and a subset of 176 soil sampleswere co-analyzed for total organic carbon (TOC) and grain size (173 of this subset of 176 sampleswere analyzed for grain size). One subsurface sample was rejected by the laboratory for QA/QCpurposes. The starting point for each transect and subsequent collection of soils samples wasestablished as the debris line adjacent to the river, as observed in the field at the time of sampling.This field location seems to roughly correspond to the study area delineation of the shoreline asdefined by 2002 aerial photography, with a river flow rate of approximately 5,000 cubic feet persecond.
The sampling results confirm to certain extent, the results of prior investigations, and are notunexpected. PCBs in the floodplain soils were previously documented (NOAA, NYSDEC,NYSDOH, and EPA) . Generally, the PCBs are found in depositional floodplain areas. Higherconcentrations are generally found in low lying heavily vegetated locations. Higher concentrationsare also generally found closer to the river (decreasing inland).
A direct correlation between the documented hot spots in the river, and elevated PCB concentrationsfound at select floodplain depositional environments, could not be conclusively established from thedata collected. Although PCB contamination was found throughout the study area adjacent to theriver and in lower-lying wetland areas, as indicated above, anomalous elevated PCB concentrationswere also found at other sample points along the transects. Additionally, further review of the datacould not conclusively establish a correlation between TOC, grain size, and PCB concentrationswithin the floodplain soils. The total PCB, TOC, and grain size data is summarized and presentedin Appendix D.
The PCB concentration ranges and absence of a direct relationship to adjacent hot spots is generallydepicted in River Section 1 between Transects 4 through 24 East. This is the most northerly portionof the study yet the ranges of PCBs in the adjacent floodplain, whether as a function of width or soilcharacteristics, do not show any direct correlation to adjacent hotspots in the river and do not appearto provide data that allows for predicting a concentration at a similar physiographic area adjacent tothe river or in the floodplain.
The highest concentration of PCBs were detected at Transect 10 East. PCBs in subsurface sampleSS01 were detected at an estimated concentration of 880 ppm (PCBs in the corresponding surfacesample were detected at a concentration of 250 ppm). PCBs in subsurface sample SS02 were detectedat an estimated concentration of 600 ppm (PCBs in the corresponding surface sample were detectedat a concentration of 87 ppm). The PCB concentrations decreased with distance from the river as thesamples were collected farther inland. PCBs were detected at 0.130 ppm in the farthest inlandsample, S05, at this transect. This area does seem to be depositional in nature and is adjacent to someriver hotspots.
19
An overall evaluation of the data shows that: approximately 70.1% of the total number of samplescollected were below 1 ppm total PCBs; 19.2% of the samples were within 1-10 ppm range; 8.3%ofthe samples were within the 10-50 ppm range; 1.5% of the samples were within the 50-100 ppmrange; and 1% of the samples were greater than 100 ppm.
Further review of the data also indicates that PCB contamination generally decreases (and is lesslikely) the farther inland from the river the samples are collected (or alternatively PCB contaminationis highest and more likely to be located closer to the river). However, it should be noted that elevatedPCB concentrations were also found at other sample points along the transects (i.e., farther inland).The data shows that: approximately 50% (90 samples) of the samples collected at locations S01 andSS01 (closest to the river) were below 1 ppm; approximately 70% (127 samples) of the samplescollected at locations S02 and SS02 (which is approximately 25 feet from S01) were below 1 ppm;approximately 75% (61 samples) of samples collected at location S03 (approximately 50 feet fromS01) were below 1 ppm; approximately 80% (64 samples) of the samples collected at location S04(approximately 100 feet from S01) were below 1 ppm; and approximately 90% (89 samples) ofsamples collected at locations S05 and S06 were below 1 ppm.
A complete summary of the total PCB sample results by location is presented in Appendix C. Table6-1 summarizes the results for the study area of total PCBs detected in ranges and by soil sampleinterval (i.e., surface and subsurface). Transect-specific sample locations and associated total PCBresults are also depicted on aerial photographs and are presented in Appendix E. For confidentialitypurposes, the sample locations present on private property are not presented in the figures of thisreport. Appendix F presents the maps and total PCB results for the study area. Appendix G presentsthe Soil Sampling Data Sheets completed in the field as the samples were collected.

20
TABLE 6-1
Summary of Total PCBs Ranges Detected
Detected Levels (1) Surface Soils Subsurface Soils
Non-Detect 221 56
< 1 ppm 152 54
1 - 10 ppm 86 46
10 - 50 ppm 39 18
> 50 ppm 9 8
(1)The results are depicted graphically on the Hudson River PCB Results, Figures 1 through 3 located in Appendix F.
21
7.0 REFERENCES
National Oceanographic and Atmospheric Administration (NOAA), 2002. Hudson River NaturalResources Damage Assessment, Floodplain Soil and Biota Screening Sampling Report. Prepared bySEA Consultants, Inc. for Industrial Economics, Inc. under contract to the National Oceanographicand Atmospheric Administration.
U.S. Environmental Protection Agency (USEPA), 2002. Responsiveness Summary, Hudson RiverPCB Site Record of Decision. Prepared by Tams Consultants, Inc. for U.S. Environmental ProtectionAgency, Region 2 and U.S. Army Corps of Engineers, Kansas City District.
U.S. Environmental Protection Agency (USEPA), 2002. Environmental Protection Agency (EPA)Record of Decision, Hudson River PCB Site, Hudson Falls to New York City, New York.
U.S. Environmental Protection Agency (USEPA), 1999. Removal Site Evaluation (RSE) for RogersIsland, Fort Edward, Washington County, New York. Memorandum from: Joseph V. Cosentino, On-Scene Coordinator, Removal Action Branch, USEPA, Site I.D. No.: 84.