Embed Size (px)
Citation preview
Florida Alternate Assessment Item Characteristics Study:
Analysis of Item Response Data Summary of Results
2010–2011
Prepared by Measured Progress for the Florida Department of Education

Table of Contents i 2010–11 Florida Alternate Assessment Item Characteristics Report
TABLE OF CONTENTS CHAPTER 1 OBJECTIVE ................................................................................................................................................ 1 CHAPTER 2 RESEARCH QUESTIONS ............................................................................................................................. 3 CHAPTER 3 METHOD ................................................................................................................................................... 5
3.1 Design ................................................................................................................................................................ 5 3.1.1 Design Specifics ........................................................................................................................................................ 5
3.2 Materials ........................................................................................................................................................... 5 3.3 Process .............................................................................................................................................................. 6 3.4 Analyses ............................................................................................................................................................. 6 3.5 Results ............................................................................................................................................................... 7
3.5.1 Observed p-values ..................................................................................................................................................... 7 3.5.2 ANOVA .................................................................................................................................................................... 7 3.5.3 Individual Item Sets .................................................................................................................................................. 8
CHAPTER 4 DISCUSSION .............................................................................................................................................. 9

Table of Contents ii 2010–11 Florida Alternate Assessment Item Characteristics Report
Chapter 1—Objective 1 2010–11 Florida Alternate Assessment Item Characteristics Report
CHAPTER 1 OBJECTIVE The Florida Alternate Assessment (FAA) is based on a tiered level of complexity. Next Generation
Sunshine State Standards Access Points, approved by the Florida State Board of Education, creates the
frameworks upon which alternate assessment items are constructed. A single item consists of three questions,
one at the Participatory level of complexity (least challenging), one at the Supported level, and one at the
Independent level (most challenging). The FAA was developed to allow students an opportunity to progress
through all three levels of complexity per item. Teachers present questions within an item to students until an
incorrect answer is given at the Participatory, Supported, or Independent level.
This method of test construction theoretically permits an increasing level of complexity for the
questions within an item. In order to confirm that the questions within each developed item are in the desired
order of hierarchical difficulty, it is necessary to examine the scores obtained via an administration method
that provides the opportunity for a student to respond to all questions within an item (irrespective of achieving
a correct score at any one level of complexity).
The purpose of this study is to examine the hypothesis that the difficulty of test questions within
items increases with each level of complexity (i.e., Independent questions are more difficult than Supported
questions, which are in turn more difficult than Participatory questions).

Chapter 1—Objective 2 2010–11 Florida Alternate Assessment Item Characteristics Report
Chapter 2—Research Questions 3 2010–11 Florida Alternate Assessment Item Characteristics Report
CHAPTER 2 RESEARCH QUESTIONS 1. Does the difficulty of test questions within items increase as expected, if difficulty is measured by
calculating item average scores?
2. Is the increase in difficulty observable for all items in the test?
3. Is the increase in difficulty observable at all grade levels tested?

Chapter 2—Research Questions 4 2010–11 Florida Alternate Assessment Item Characteristics Report
Chapter 3—Method 5 2010–11 Florida Alternate Assessment Item Characteristics Report
CHAPTER 3 METHOD
3.1 Design
We administered the entire test to a sample of students without using any of the scaffolding or
stopping guidelines (i.e., all students were administered all test questions regardless of whether they correctly
answered the lower-complexity questions).
3.1.1 Design Specifics
• Mathematics and Reading
• Grades 3, 4, 5, 7, 8, and 9
• Separate test kits were produced based on grade and content area.
o Each kit had 20 Form A items from the spring 2010 FAA. Each item was composed of three
questions – one each at the Participatory, Supported, and Independent levels of complexity.
• Test kits were administered to 500 students per grade and content area. The resulting usable sample sizes
ranged from 444 for several items in grade 8 mathematics and reading to 483 for several items in grade 9
reading.
• Items were scored on a 1-0 (right-wrong) metric, without scaffolding (i.e., the possible scores on each
three-question item were 0, 1, 2, or 3 instead of 0, 1, 2, 3, 6, or 9).
3.2 Materials
• Mathematics kits (grade specific)
o test booklet (mathematics only)
o response booklet (mathematics only)
o mathematics cards (where applicable)
• Reading kits (grade specific)
o test booklet (reading only)
o response booklet (reading only)
o passage booklet
o reading cards (where applicable)
o reading strips (where applicable)
• Scannable student answer sheet
o Space for teachers to write/bubble in student information.
o Space for teachers to record student scores.
• Administration guide
o Measured Progress document that included information such as administration practices, rules for
Chapter 3—Method 6 2010–11 Florida Alternate Assessment Item Characteristics Report
scoring student responses, test security information, return of materials to Measured Progress
(including 1-day UPS pick up date).
3.3 Process
• Student recruitment
o To maximize school district and teacher representation, each district’s proportion by grade of
alternate assessment participants from the spring 2010 assessment was calculated by the Florida
Department of Education (FLDOE). This number was then stratified within district and grade on
the following variables: gender, race/ethnicity, and level assessed in spring 2010. Due to security
issues, students in grade 4 were administered test kits based on the grade 3 spring 2010 FAA,
students in grade 5 were administered test kits based on the grade 4 spring 2010 FAA, and so on.
The FLDOE was responsible for the student recruitment process.
• Pre-study Webinar
o Sessions were held one week before the assessment window opened.
• Administration window
o October 25–November 5, 2010
• Post-study Webinar
o Session was held one week after the assessment window closed.
• Printing, distribution, and login
o Measured Progress was responsible for the printing, shipping, and return of all materials for this
study.
o Materials were printed, shipped, and logged in a secure manner, similar to the processes utilized
by Piedra Data Services.
o One-day UPS pickup and return service labels were provided for the return of all materials to
Measured Progress.
o All student answer documents were scanned at Measured Progress and this information was
provided to the Data and Reporting Services (DRS) department for data analysis.
3.4 Analyses
Item statistics were examined for the modified assessment to investigate whether item means decrease
as students progress from the Participatory (P) level to the Supported (S) level of an item, and from the
supported to the Independent (I) level. First, the item means were simply observed to see if the means seem to
confirm the expectations. Next, the item means were converted to delta values and an analysis of variance
(ANOVA) was conducted. The items were treated as a random effect (theoretically assumed to be randomly
selected from a larger hypothetical pool), and the different levels of complexity within an item were treated as
Chapter 3—Method 7 2010–11 Florida Alternate Assessment Item Characteristics Report
a three-level factor with repeated measures (because the same students took all three levels within an item).
When complexity was significant, post-hoc Tukey tests were conducted to determine which levels were
significantly different from one another.
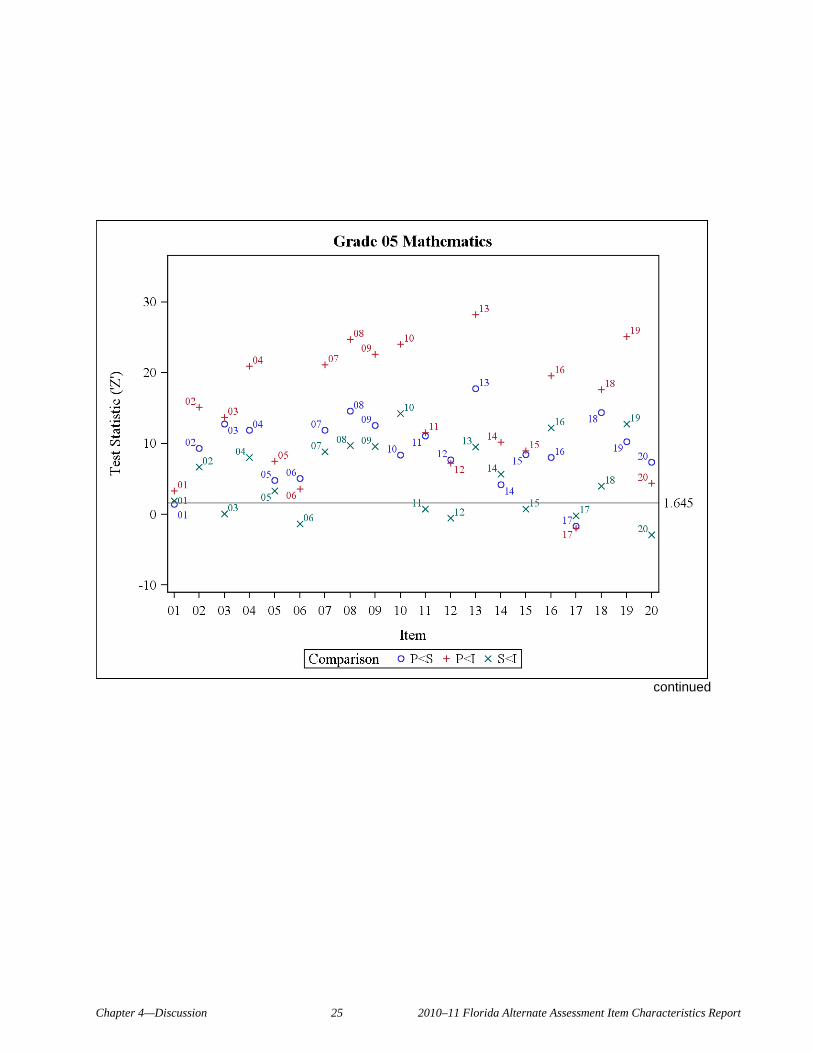
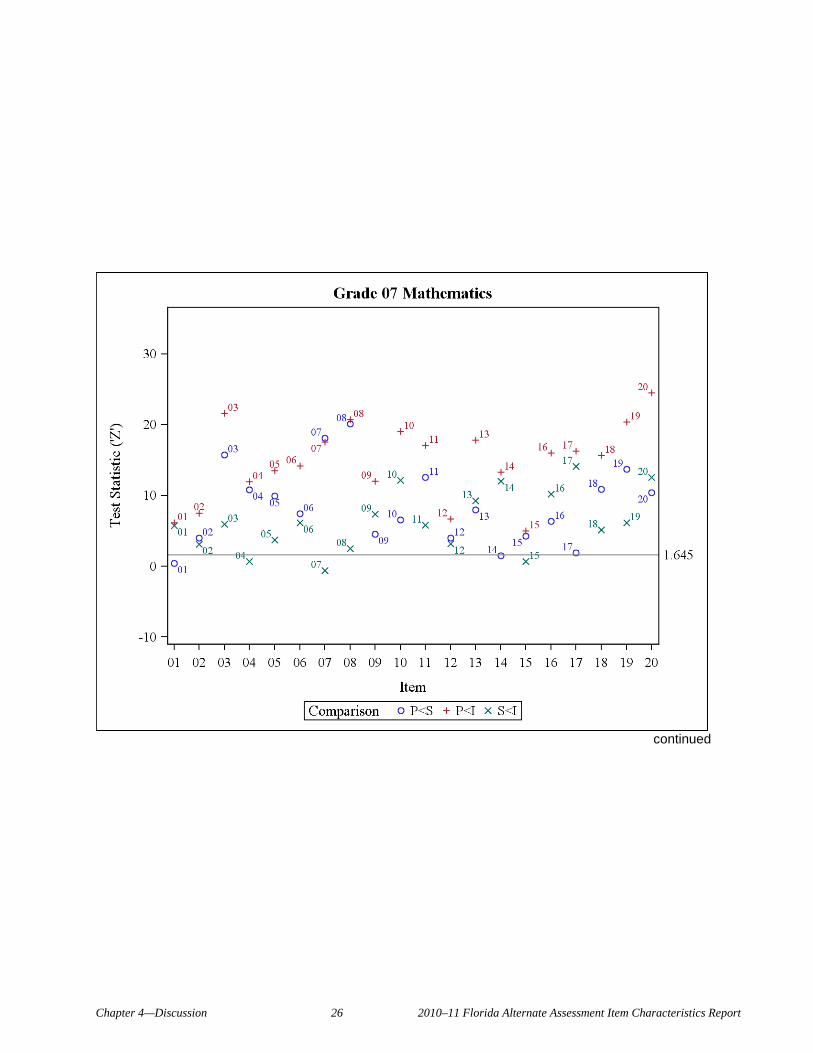
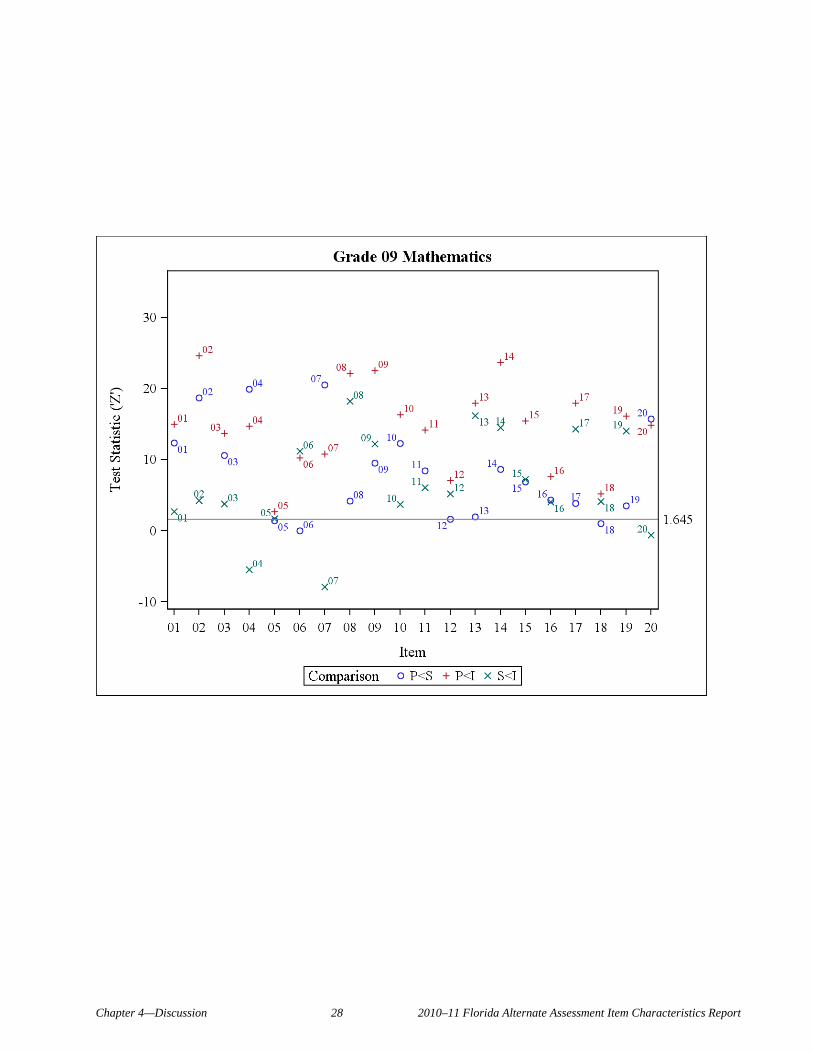
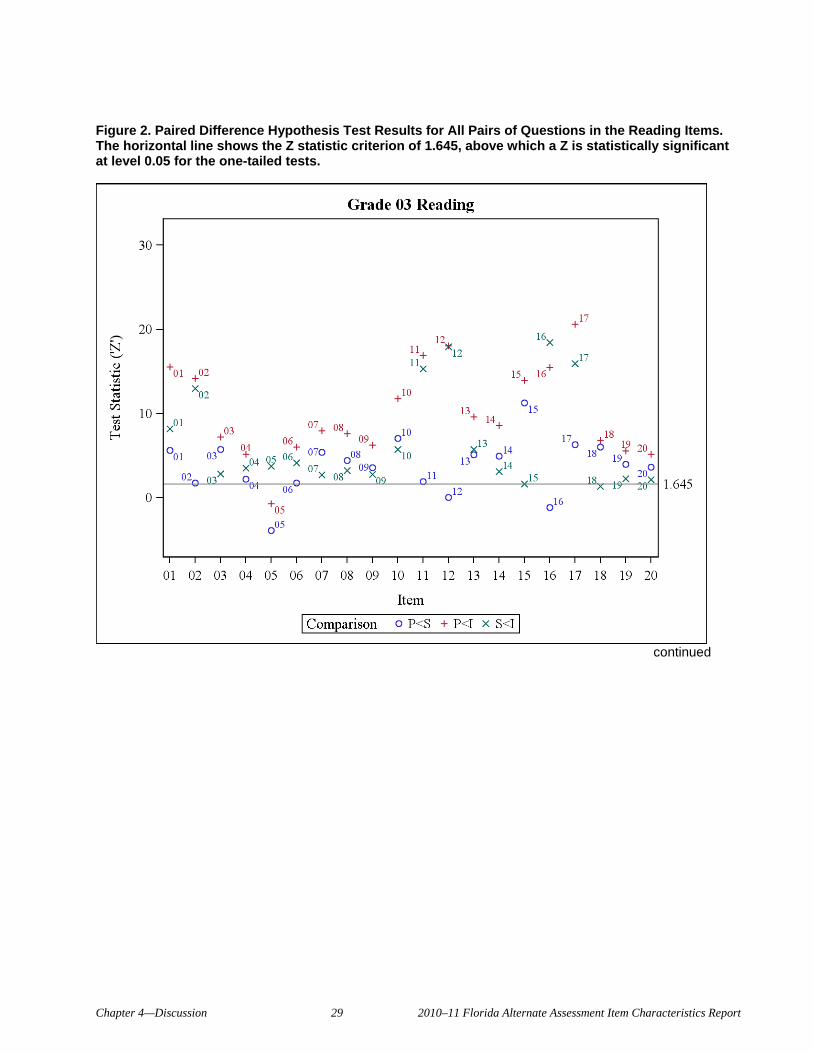
To determine whether there were any items for which the effects of complexity were not statistically
significant, an analysis was conducted on each pair of questions within each item. For each pair of questions,
the difference score was calculated for the students who took both questions, and the mean of these difference
scores was calculated. Next, a bootstrap resampling procedure was applied to this sample of difference scores.
For each bootstrap sample, the mean of the difference scores was calculated. The standard deviation of these
bootstrap means was then taken as an estimate of the standard error. Then the observed mean difference was
divided by the standard error to obtain a Z statistic to test the null hypothesis of Z = 0 against the alternative
hypothesis of Z > 0 (the order of the difference was always taken in such a way that the complexity
assumption would indicate a positive value). In this way, one-tailed hypothesis tests were conducted to
compare the three levels of complexity within each item in each grade and in each content area.
3.5 Results
3.5.1 Observed p-values
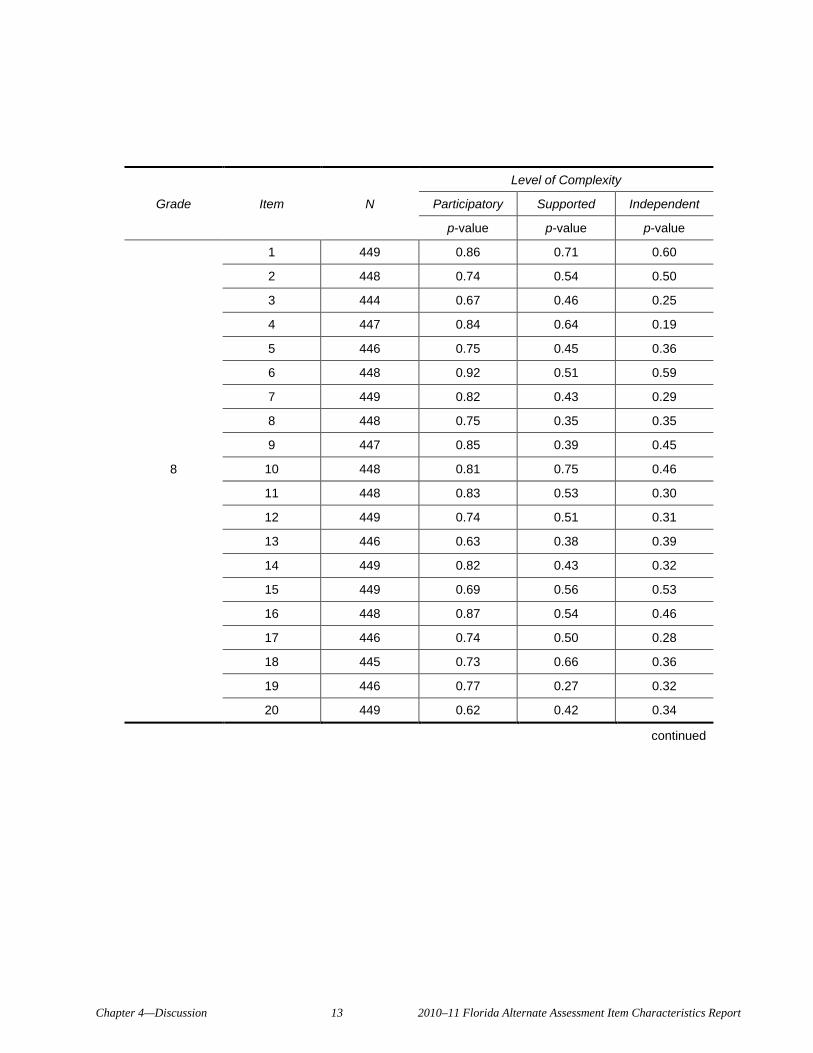
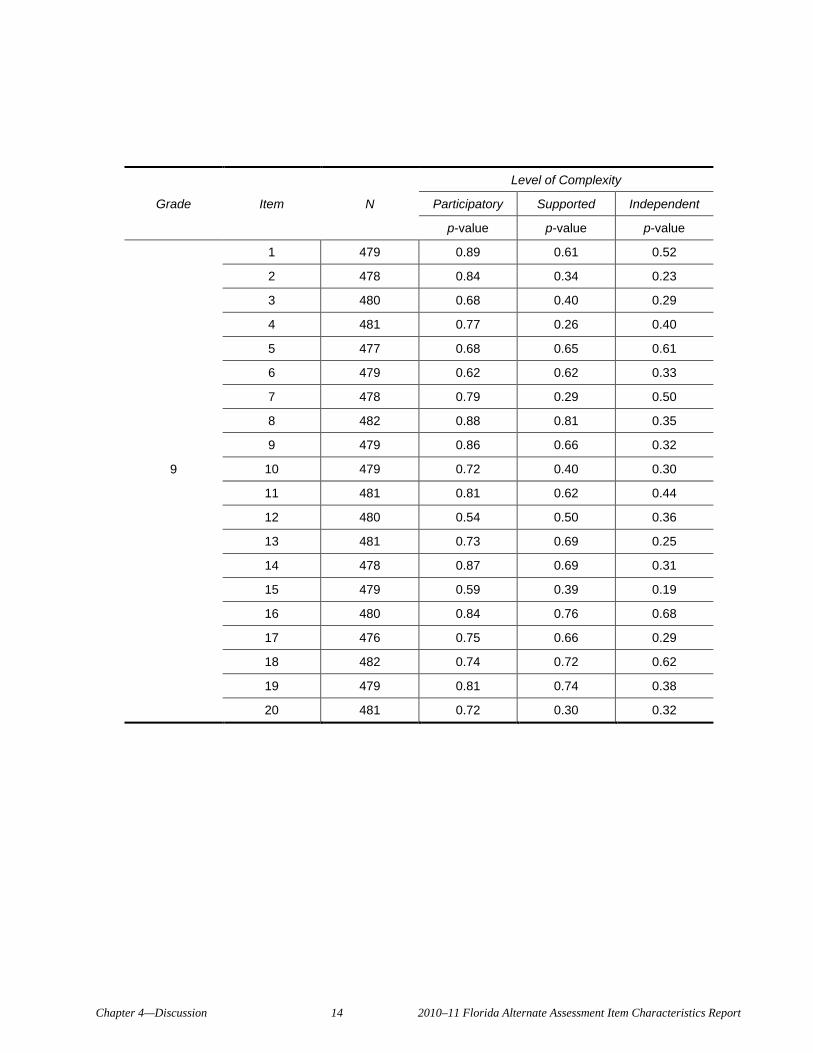
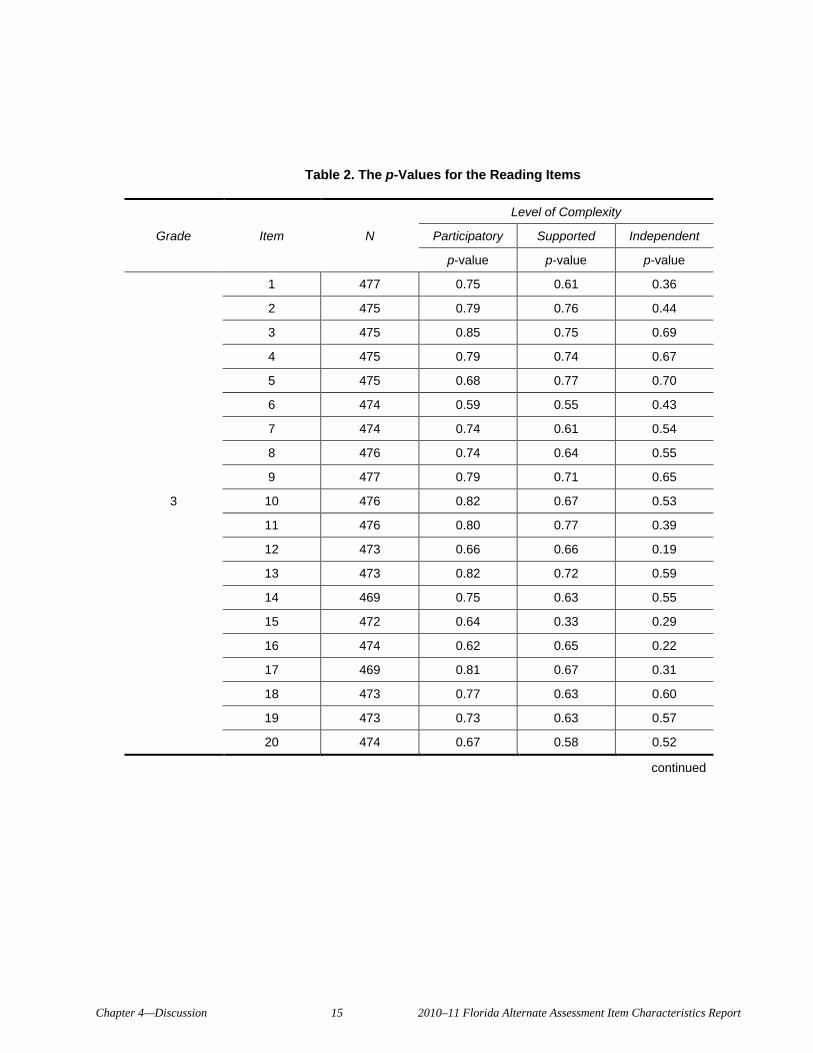
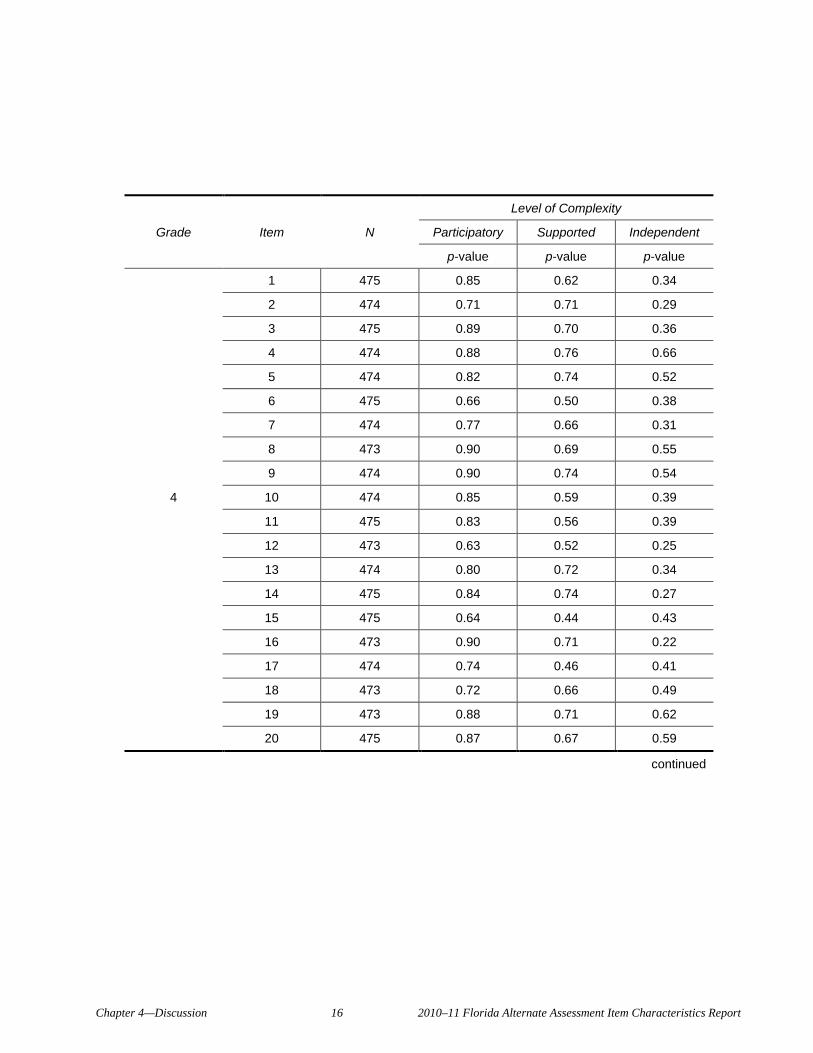
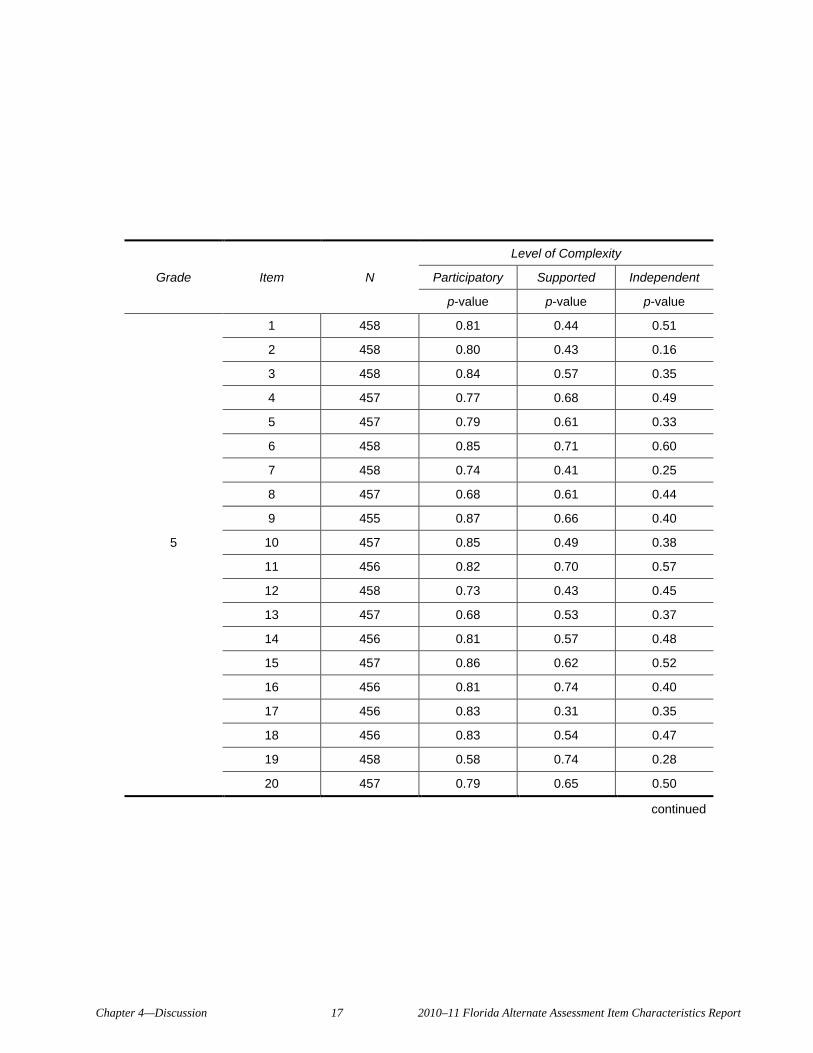
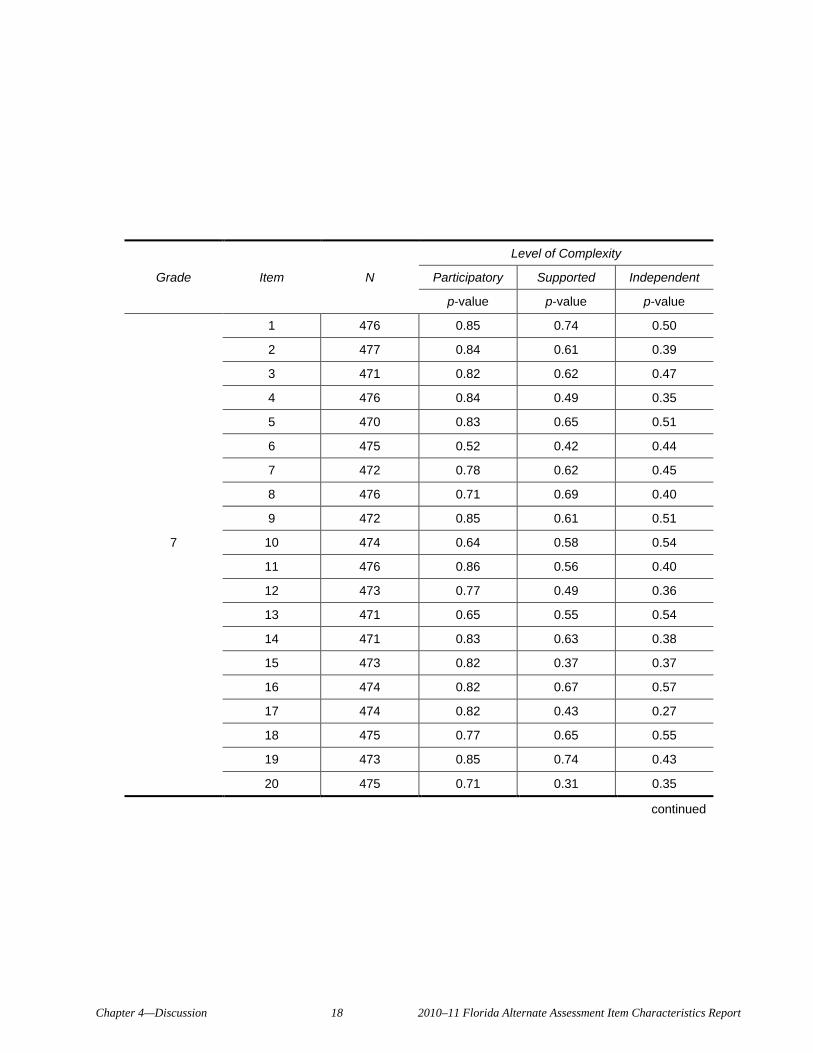
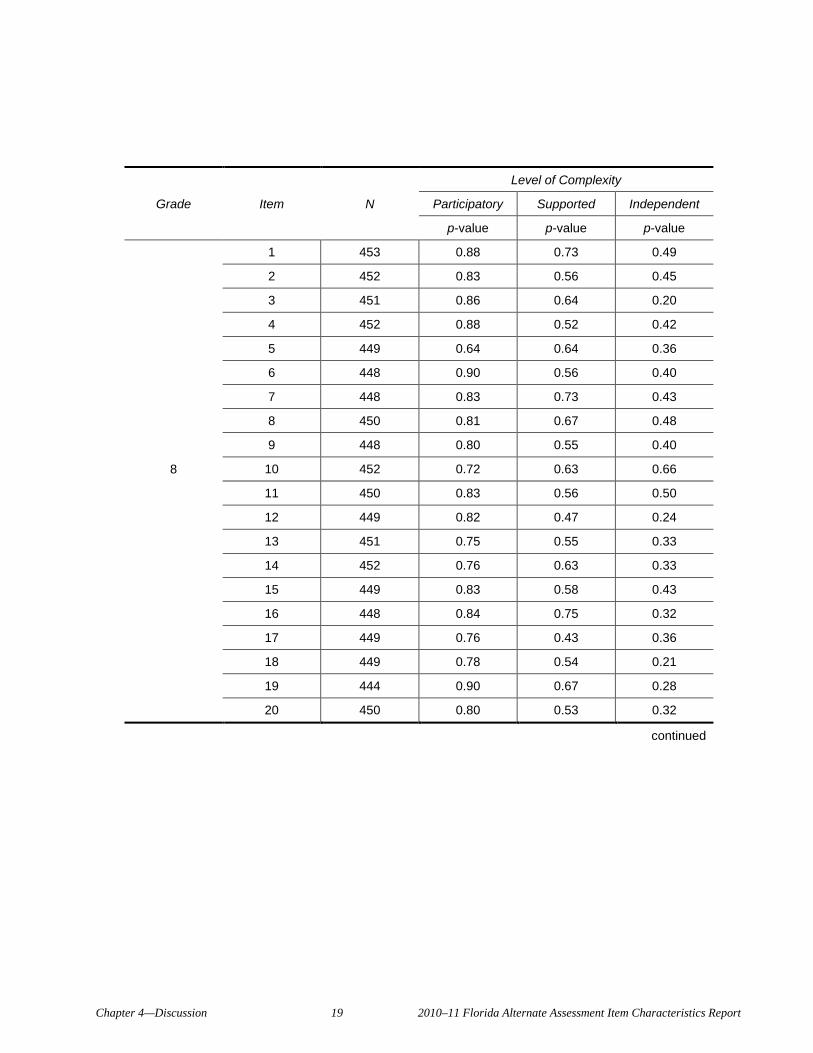
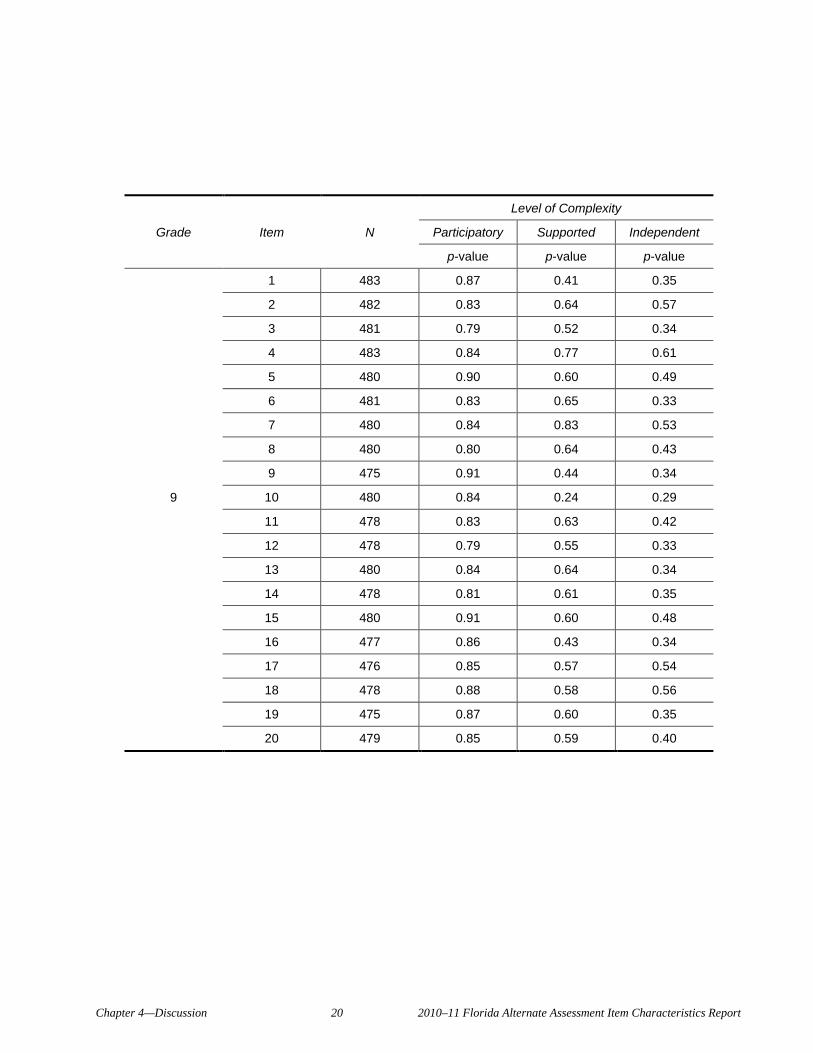
Looking at the observed P, S, and I p-values for each of the items (20 items in each of six grades for
two content areas), in 209 out of 240 cases, the p-values were ordered as expected with the p-value for P
being greater than that for S, which in turn was greater than that for I. The results are shown in Tables 1 and
2 (see tables and figures at end of document), for mathematics and reading, respectively.
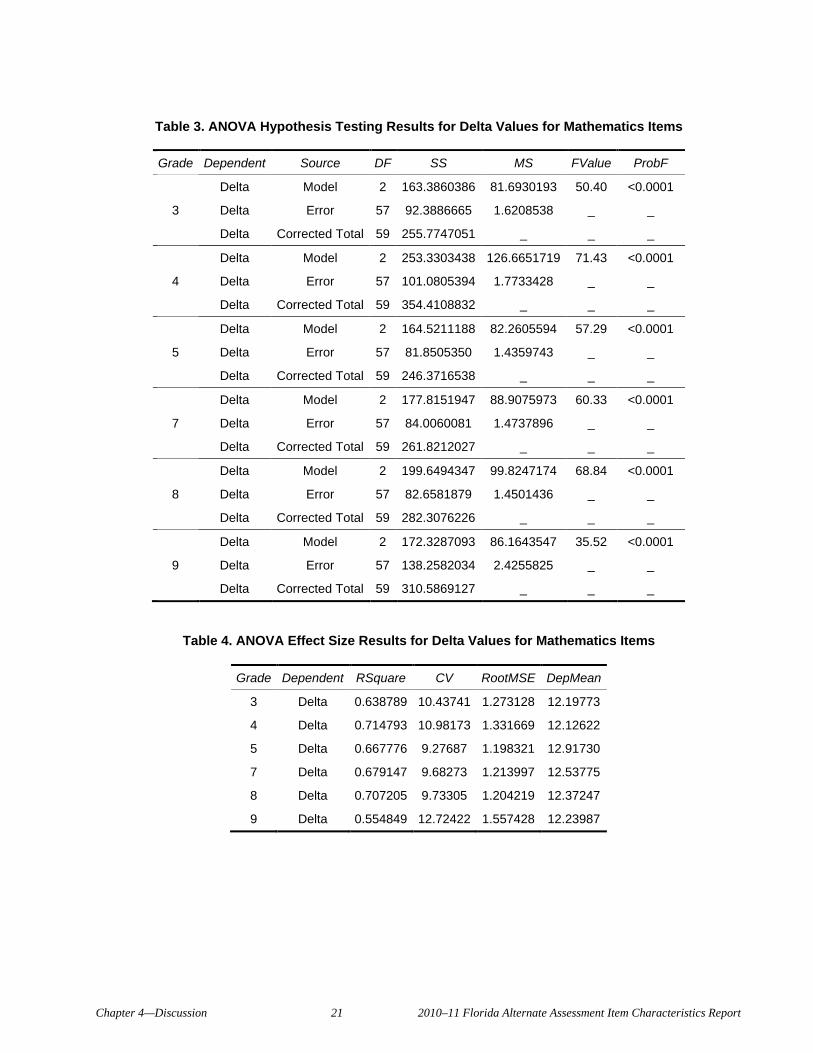
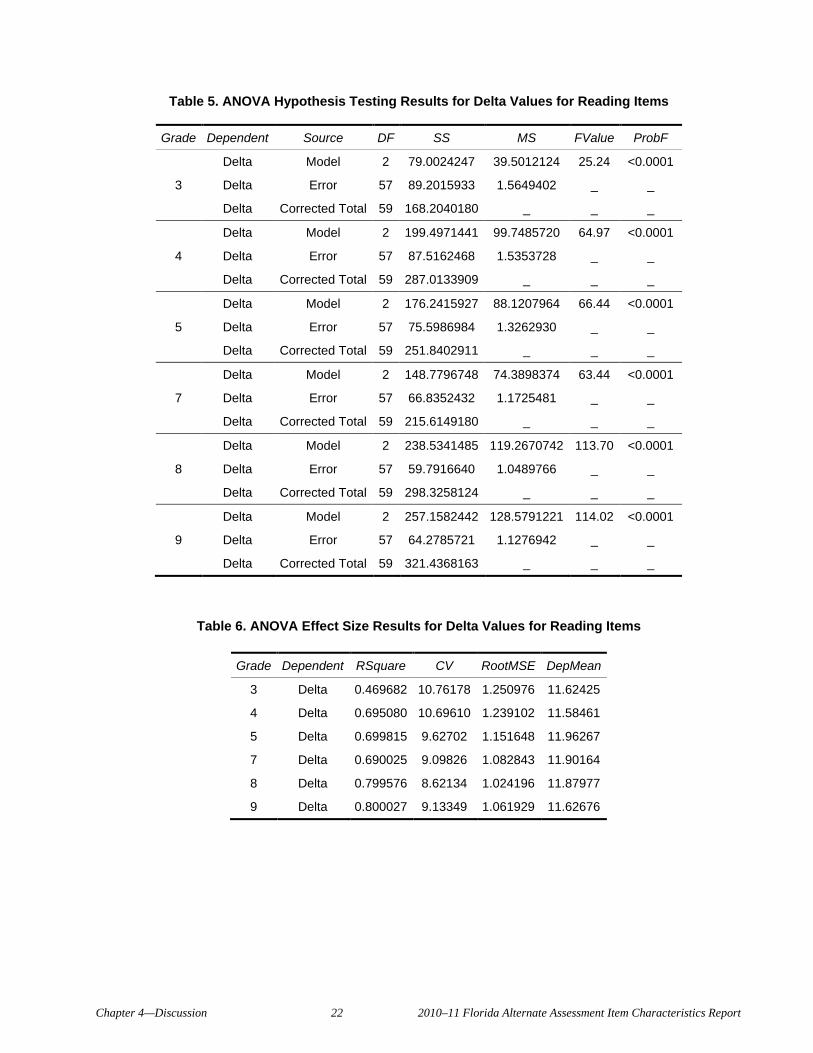
3.5.2 ANOVA
Given the p-value results, it was not surprising that the repeated-measures ANOVA results indicated
that the complexity factor was statistically significant (p < 0.0001) for every grade level for both content
areas. The ANOVA hypothesis testing results are presented in Tables 3 and 5, for mathematics and reading,
respectively. Furthermore, the R-squared values (variance accounted for) across the 12 combinations of grade
and content area ranged from 47% to 80% (mean = 0.68, sd = 0.09), which are considered to be large effect
sizes. The ANOVA effect size results are presented in Tables 4 and 6, for mathematics and reading,
respectively.
The post-hoc Tukey tests indicated that the average complexity delta values for each grade and
content area were significantly different from each other in the expected manner in all 12 cases at level 0.05
(one-tailed test).
Chapter 3—Method 8 2010–11 Florida Alternate Assessment Item Characteristics Report
3.5.3 Individual Item Sets
These analyses showed that the desired pattern among the P, S, and I questions was statistically
significant (P significantly greater than S, and S significantly greater than I) at level 0.05 for 75.8% of the
items (182 out of 240). For both content areas, the nonsignificant results tended to occur for P vs. S for grade
3, but for S vs. I for the other grades.
Furthermore, in 238 out of 240 cases, P was significantly greater than I. In two items (reading grade
3, item 5; and mathematics grade 5, item 17), the p-value of the P question was less than the p-value for the I
question, but the difference was not statistically significant. In all the other items, the P question had a greater
p-value than that of the I question, and in every case the difference was statistically significant.
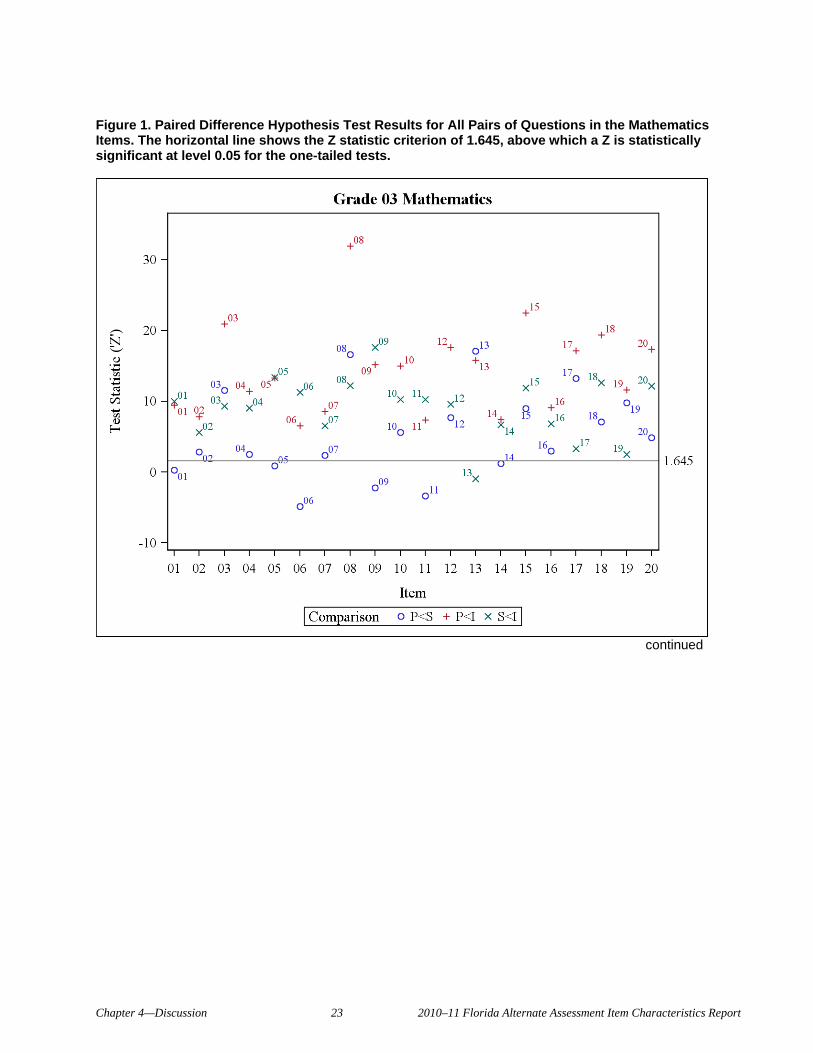
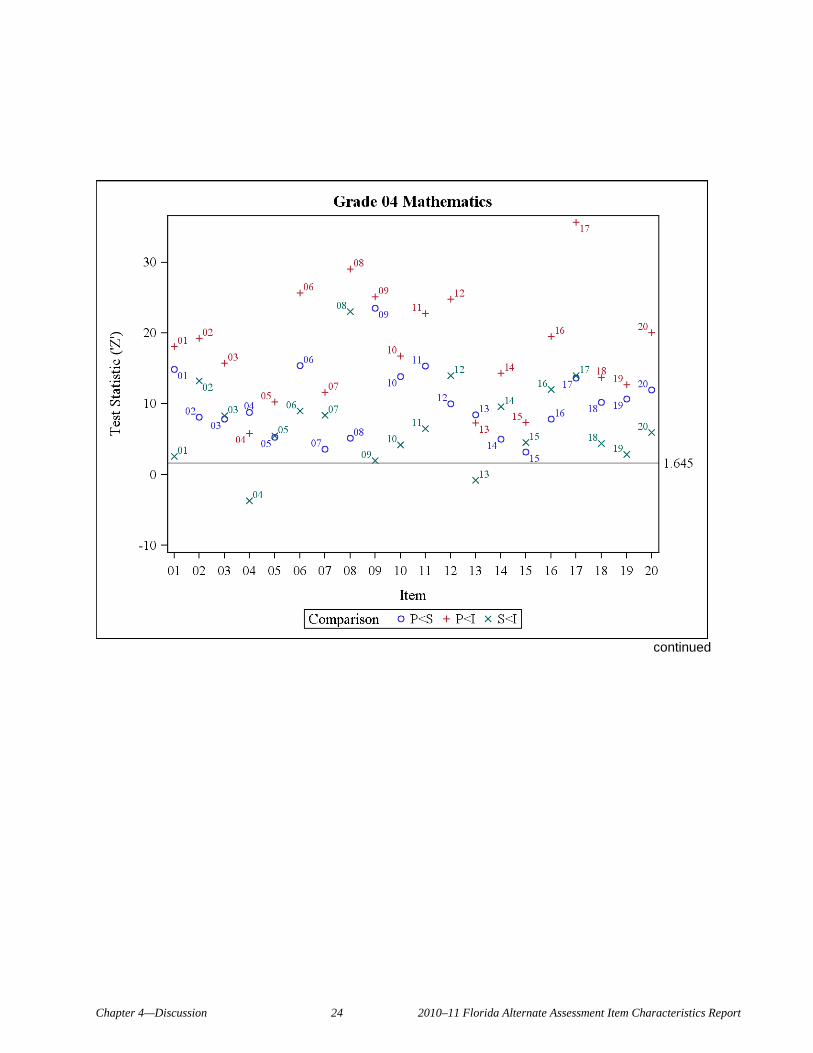
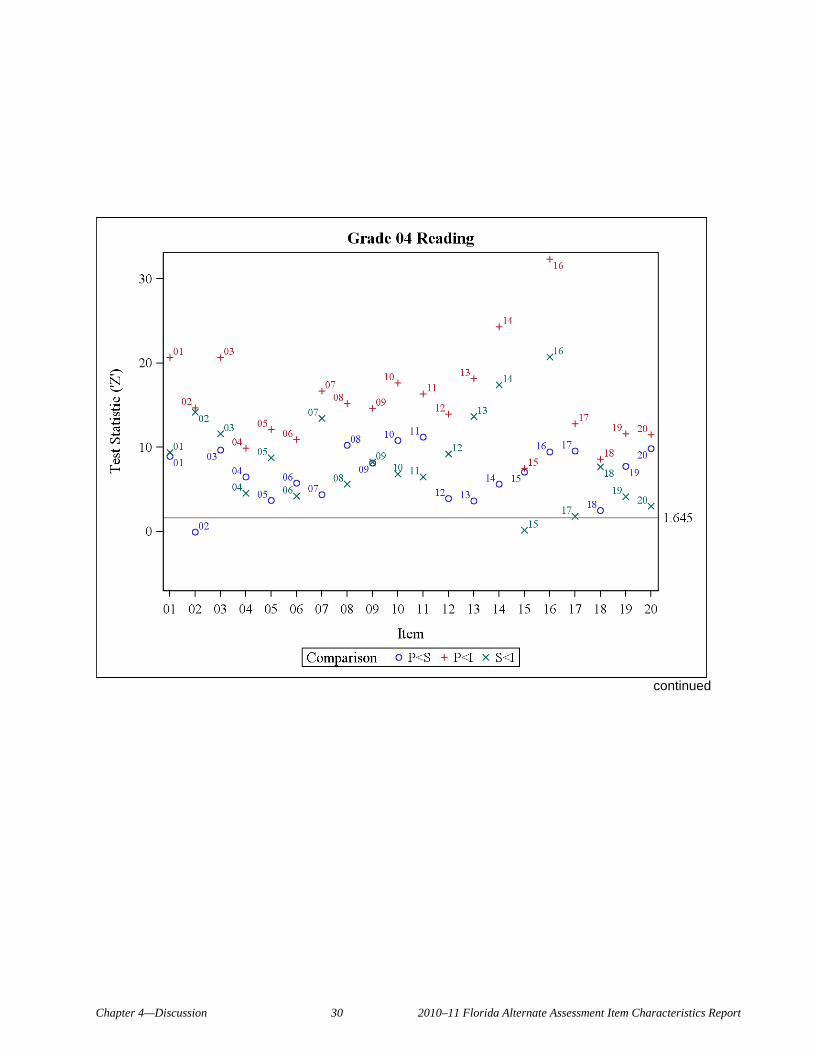
The paired-difference hypothesis testing results for all the pairs of questions in the items are displayed
in Figures 1 and 2, for mathematics and reading, respectively.
Chapter 4—Discussion 9 2010–11 Florida Alternate Assessment Item Characteristics Report
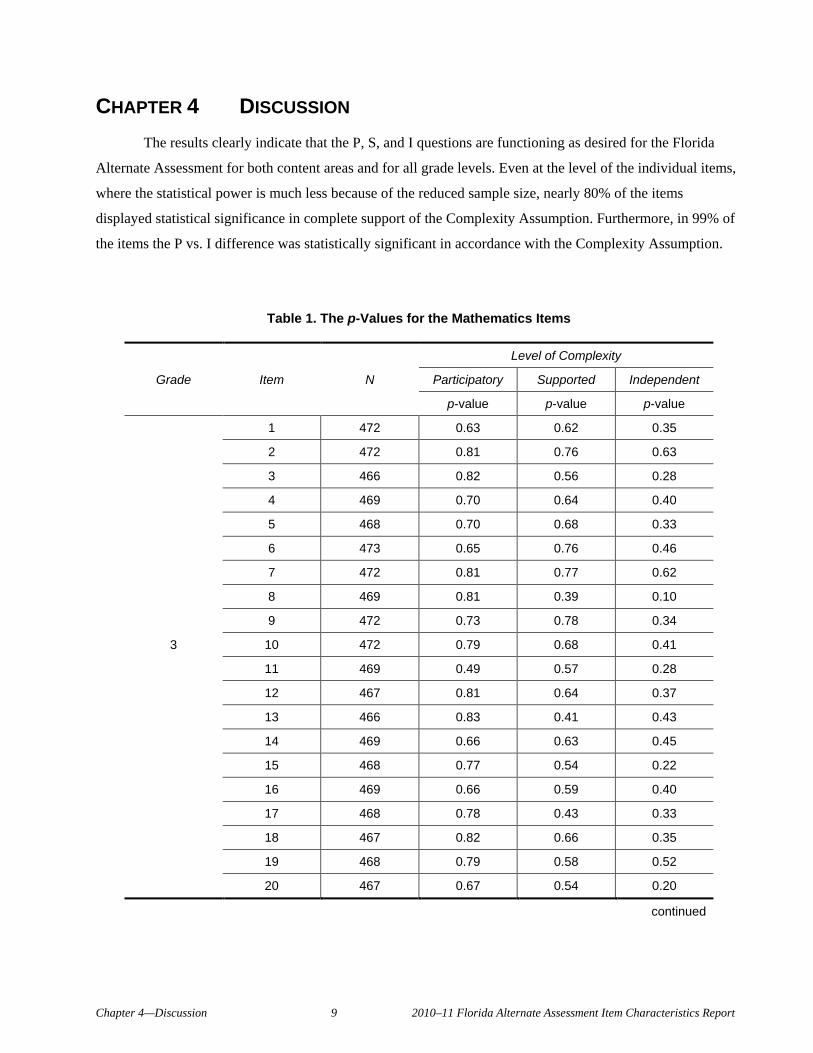
CHAPTER 4 DISCUSSION The results clearly indicate that the P, S, and I questions are functioning as desired for the Florida
Alternate Assessment for both content areas and for all grade levels. Even at the level of the individual items,
where the statistical power is much less because of the reduced sample size, nearly 80% of the items
displayed statistical significance in complete support of the Complexity Assumption. Furthermore, in 99% of
the items the P vs. I difference was statistically significant in accordance with the Complexity Assumption.
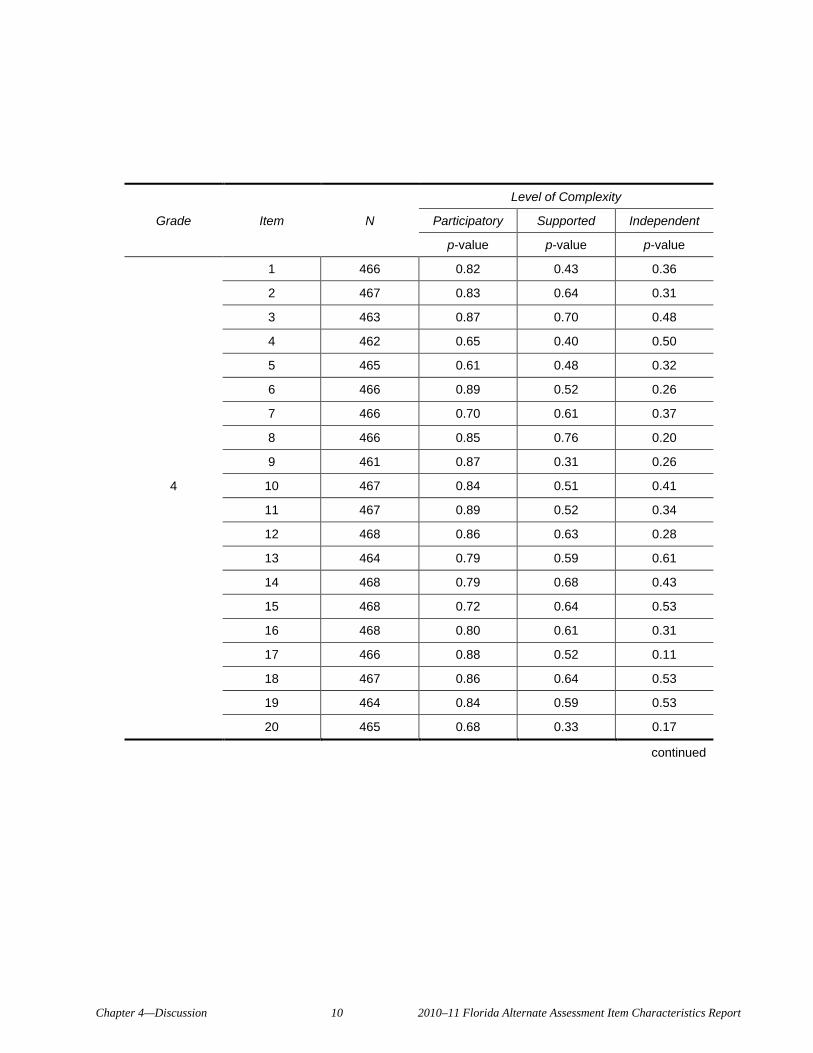
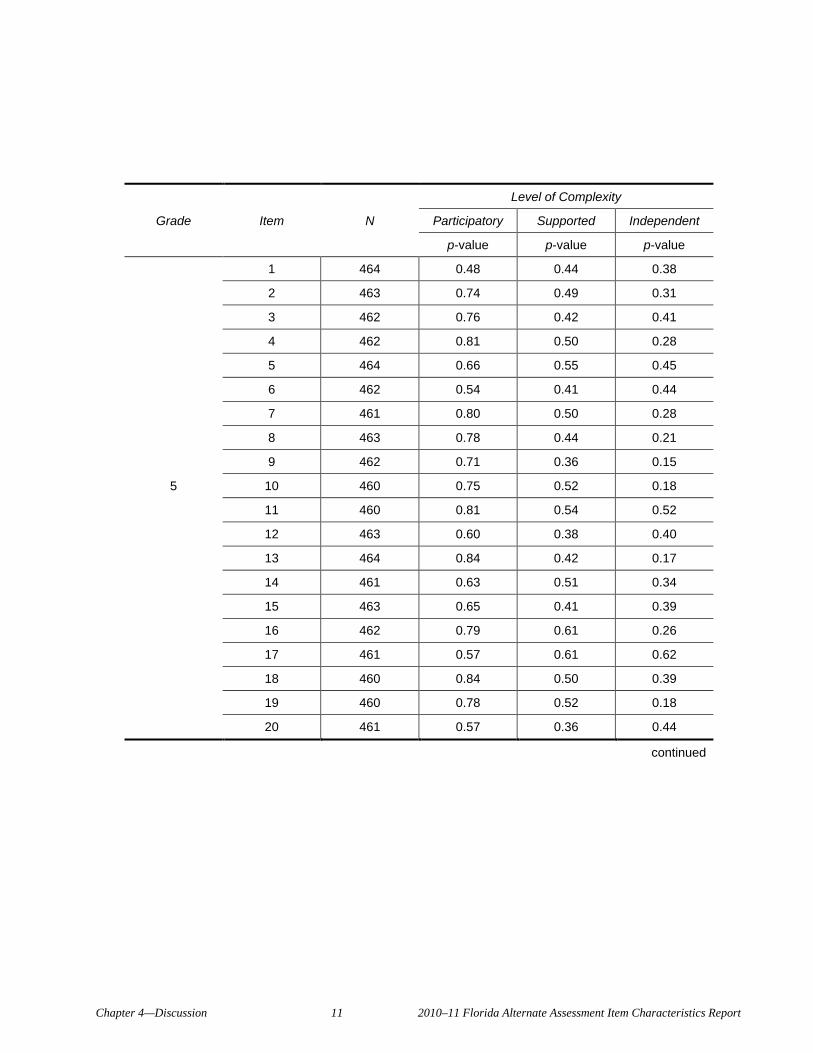
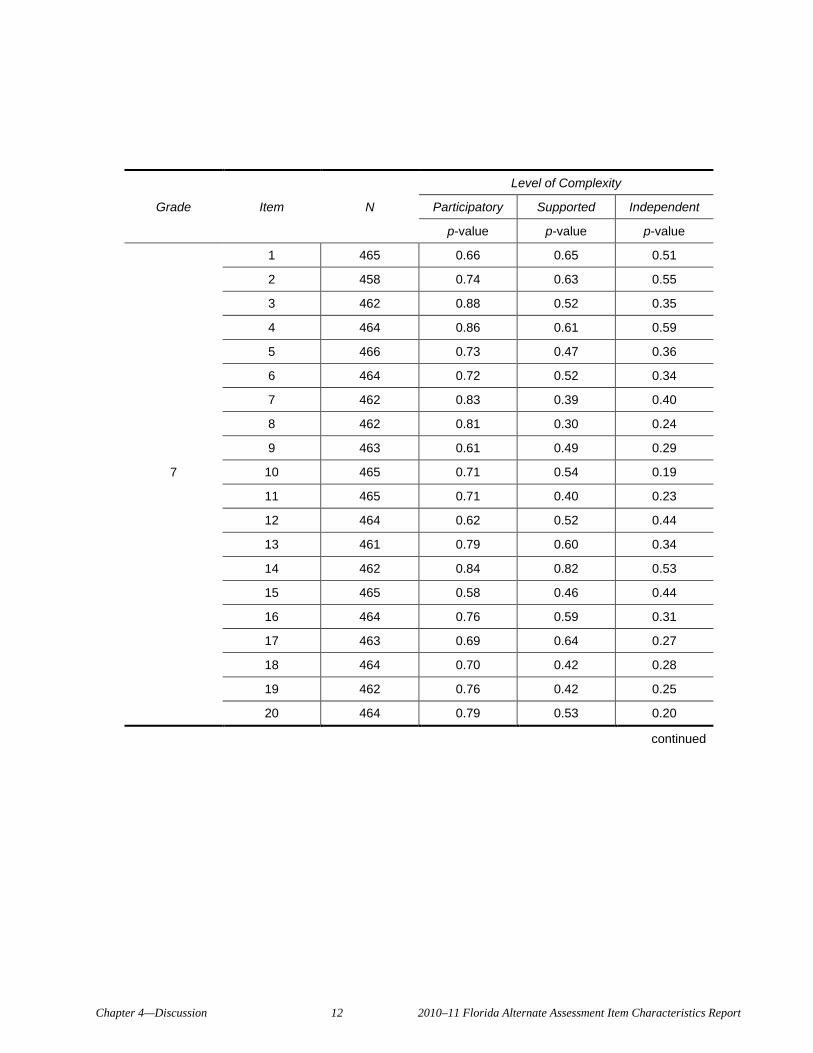
Table 1. The p-Values for the Mathematics Items
Level of Complexity Grade Item N Participatory Supported Independent
3
p-value p-value p-value
1 472 0.63 0.62 0.35
2 472 0.81 0.76 0.63
3 466 0.82 0.56 0.28
4 469 0.70 0.64 0.40
5 468 0.70 0.68 0.33
6 473 0.65 0.76 0.46
7 472 0.81 0.77 0.62
8 469 0.81 0.39 0.10
9 472 0.73 0.78 0.34
10 472 0.79 0.68 0.41
11 469 0.49 0.57 0.28
12 467 0.81 0.64 0.37
13 466 0.83 0.41 0.43
14 469 0.66 0.63 0.45
15 468 0.77 0.54 0.22
16 469 0.66 0.59 0.40
17 468 0.78 0.43 0.33
18 467 0.82 0.66 0.35
19 468 0.79 0.58 0.52
20 467 0.67 0.54 0.20
continued
Chapter 4—Discussion 10 2010–11 Florida Alternate Assessment Item Characteristics Report
Level of Complexity Grade Item N Participatory Supported Independent
4
p-value p-value p-value
1 466 0.82 0.43 0.36
2 467 0.83 0.64 0.31
3 463 0.87 0.70 0.48
4 462 0.65 0.40 0.50
5 465 0.61 0.48 0.32
6 466 0.89 0.52 0.26
7 466 0.70 0.61 0.37
8 466 0.85 0.76 0.20
9 461 0.87 0.31 0.26
10 467 0.84 0.51 0.41
11 467 0.89 0.52 0.34
12 468 0.86 0.63 0.28
13 464 0.79 0.59 0.61
14 468 0.79 0.68 0.43
15 468 0.72 0.64 0.53
16 468 0.80 0.61 0.31
17 466 0.88 0.52 0.11
18 467 0.86 0.64 0.53
19 464 0.84 0.59 0.53
20 465 0.68 0.33 0.17
continued
Chapter 4—Discussion 11 2010–11 Florida Alternate Assessment Item Characteristics Report
Level of Complexity Grade Item N Participatory Supported Independent
p-value p-value p-value
5
1 464 0.48 0.44 0.38
2 463 0.74 0.49 0.31
3 462 0.76 0.42 0.41
4 462 0.81 0.50 0.28
5 464 0.66 0.55 0.45
6 462 0.54 0.41 0.44
7 461 0.80 0.50 0.28
8 463 0.78 0.44 0.21
9 462 0.71 0.36 0.15
10 460 0.75 0.52 0.18
11 460 0.81 0.54 0.52
12 463 0.60 0.38 0.40
13 464 0.84 0.42 0.17
14 461 0.63 0.51 0.34
15 463 0.65 0.41 0.39
16 462 0.79 0.61 0.26
17 461 0.57 0.61 0.62
18 460 0.84 0.50 0.39
19 460 0.78 0.52 0.18
20 461 0.57 0.36 0.44
continued
Chapter 4—Discussion 12 2010–11 Florida Alternate Assessment Item Characteristics Report
Level of Complexity Grade Item N Participatory Supported Independent
7
p-value p-value p-value
1 465 0.66 0.65 0.51
2 458 0.74 0.63 0.55
3 462 0.88 0.52 0.35
4 464 0.86 0.61 0.59
5 466 0.73 0.47 0.36
6 464 0.72 0.52 0.34
7 462 0.83 0.39 0.40
8 462 0.81 0.30 0.24
9 463 0.61 0.49 0.29
10 465 0.71 0.54 0.19
11 465 0.71 0.40 0.23
12 464 0.62 0.52 0.44
13 461 0.79 0.60 0.34
14 462 0.84 0.82 0.53
15 465 0.58 0.46 0.44
16 464 0.76 0.59 0.31
17 463 0.69 0.64 0.27
18 464 0.70 0.42 0.28
19 462 0.76 0.42 0.25
20 464 0.79 0.53 0.20
continued
Chapter 4—Discussion 13 2010–11 Florida Alternate Assessment Item Characteristics Report
Level of Complexity Grade Item N Participatory Supported Independent
8
p-value p-value p-value
1 449 0.86 0.71 0.60
2 448 0.74 0.54 0.50
3 444 0.67 0.46 0.25
4 447 0.84 0.64 0.19
5 446 0.75 0.45 0.36
6 448 0.92 0.51 0.59
7 449 0.82 0.43 0.29
8 448 0.75 0.35 0.35
9 447 0.85 0.39 0.45
10 448 0.81 0.75 0.46
11 448 0.83 0.53 0.30
12 449 0.74 0.51 0.31
13 446 0.63 0.38 0.39
14 449 0.82 0.43 0.32
15 449 0.69 0.56 0.53
16 448 0.87 0.54 0.46
17 446 0.74 0.50 0.28
18 445 0.73 0.66 0.36
19 446 0.77 0.27 0.32
20 449 0.62 0.42 0.34
continued
Chapter 4—Discussion 14 2010–11 Florida Alternate Assessment Item Characteristics Report
Level of Complexity Grade Item N Participatory Supported Independent
9
p-value p-value p-value
1 479 0.89 0.61 0.52
2 478 0.84 0.34 0.23
3 480 0.68 0.40 0.29
4 481 0.77 0.26 0.40
5 477 0.68 0.65 0.61
6 479 0.62 0.62 0.33
7 478 0.79 0.29 0.50
8 482 0.88 0.81 0.35
9 479 0.86 0.66 0.32
10 479 0.72 0.40 0.30
11 481 0.81 0.62 0.44
12 480 0.54 0.50 0.36
13 481 0.73 0.69 0.25
14 478 0.87 0.69 0.31
15 479 0.59 0.39 0.19
16 480 0.84 0.76 0.68
17 476 0.75 0.66 0.29
18 482 0.74 0.72 0.62
19 479 0.81 0.74 0.38
20 481 0.72 0.30 0.32
Chapter 4—Discussion 15 2010–11 Florida Alternate Assessment Item Characteristics Report
Table 2. The p-Values for the Reading Items
Level of Complexity Grade Item N Participatory Supported Independent
3
p-value p-value p-value
1 477 0.75 0.61 0.36
2 475 0.79 0.76 0.44
3 475 0.85 0.75 0.69
4 475 0.79 0.74 0.67
5 475 0.68 0.77 0.70
6 474 0.59 0.55 0.43
7 474 0.74 0.61 0.54
8 476 0.74 0.64 0.55
9 477 0.79 0.71 0.65
10 476 0.82 0.67 0.53
11 476 0.80 0.77 0.39
12 473 0.66 0.66 0.19
13 473 0.82 0.72 0.59
14 469 0.75 0.63 0.55
15 472 0.64 0.33 0.29
16 474 0.62 0.65 0.22
17 469 0.81 0.67 0.31
18 473 0.77 0.63 0.60
19 473 0.73 0.63 0.57
20 474 0.67 0.58 0.52
continued
Chapter 4—Discussion 16 2010–11 Florida Alternate Assessment Item Characteristics Report
Level of Complexity Grade Item N Participatory Supported Independent
4
p-value p-value p-value
1 475 0.85 0.62 0.34
2 474 0.71 0.71 0.29
3 475 0.89 0.70 0.36
4 474 0.88 0.76 0.66
5 474 0.82 0.74 0.52
6 475 0.66 0.50 0.38
7 474 0.77 0.66 0.31
8 473 0.90 0.69 0.55
9 474 0.90 0.74 0.54
10 474 0.85 0.59 0.39
11 475 0.83 0.56 0.39
12 473 0.63 0.52 0.25
13 474 0.80 0.72 0.34
14 475 0.84 0.74 0.27
15 475 0.64 0.44 0.43
16 473 0.90 0.71 0.22
17 474 0.74 0.46 0.41
18 473 0.72 0.66 0.49
19 473 0.88 0.71 0.62
20 475 0.87 0.67 0.59
continued
Chapter 4—Discussion 17 2010–11 Florida Alternate Assessment Item Characteristics Report
Level of Complexity Grade Item N Participatory Supported Independent
p-value p-value p-value
5
1 458 0.81 0.44 0.51
2 458 0.80 0.43 0.16
3 458 0.84 0.57 0.35
4 457 0.77 0.68 0.49
5 457 0.79 0.61 0.33
6 458 0.85 0.71 0.60
7 458 0.74 0.41 0.25
8 457 0.68 0.61 0.44
9 455 0.87 0.66 0.40
10 457 0.85 0.49 0.38
11 456 0.82 0.70 0.57
12 458 0.73 0.43 0.45
13 457 0.68 0.53 0.37
14 456 0.81 0.57 0.48
15 457 0.86 0.62 0.52
16 456 0.81 0.74 0.40
17 456 0.83 0.31 0.35
18 456 0.83 0.54 0.47
19 458 0.58 0.74 0.28
20 457 0.79 0.65 0.50
continued
Chapter 4—Discussion 18 2010–11 Florida Alternate Assessment Item Characteristics Report
Level of Complexity Grade Item N Participatory Supported Independent
p-value p-value p-value
7
1 476 0.85 0.74 0.50
2 477 0.84 0.61 0.39
3 471 0.82 0.62 0.47
4 476 0.84 0.49 0.35
5 470 0.83 0.65 0.51
6 475 0.52 0.42 0.44
7 472 0.78 0.62 0.45
8 476 0.71 0.69 0.40
9 472 0.85 0.61 0.51
10 474 0.64 0.58 0.54
11 476 0.86 0.56 0.40
12 473 0.77 0.49 0.36
13 471 0.65 0.55 0.54
14 471 0.83 0.63 0.38
15 473 0.82 0.37 0.37
16 474 0.82 0.67 0.57
17 474 0.82 0.43 0.27
18 475 0.77 0.65 0.55
19 473 0.85 0.74 0.43
20 475 0.71 0.31 0.35
continued
Chapter 4—Discussion 19 2010–11 Florida Alternate Assessment Item Characteristics Report
Level of Complexity Grade Item N Participatory Supported Independent
8
p-value p-value p-value
1 453 0.88 0.73 0.49
2 452 0.83 0.56 0.45
3 451 0.86 0.64 0.20
4 452 0.88 0.52 0.42
5 449 0.64 0.64 0.36
6 448 0.90 0.56 0.40
7 448 0.83 0.73 0.43
8 450 0.81 0.67 0.48
9 448 0.80 0.55 0.40
10 452 0.72 0.63 0.66
11 450 0.83 0.56 0.50
12 449 0.82 0.47 0.24
13 451 0.75 0.55 0.33
14 452 0.76 0.63 0.33
15 449 0.83 0.58 0.43
16 448 0.84 0.75 0.32
17 449 0.76 0.43 0.36
18 449 0.78 0.54 0.21
19 444 0.90 0.67 0.28
20 450 0.80 0.53 0.32
continued
Chapter 4—Discussion 20 2010–11 Florida Alternate Assessment Item Characteristics Report
Level of Complexity Grade Item N Participatory Supported Independent
9
p-value p-value p-value
1 483 0.87 0.41 0.35
2 482 0.83 0.64 0.57
3 481 0.79 0.52 0.34
4 483 0.84 0.77 0.61
5 480 0.90 0.60 0.49
6 481 0.83 0.65 0.33
7 480 0.84 0.83 0.53
8 480 0.80 0.64 0.43
9 475 0.91 0.44 0.34
10 480 0.84 0.24 0.29
11 478 0.83 0.63 0.42
12 478 0.79 0.55 0.33
13 480 0.84 0.64 0.34
14 478 0.81 0.61 0.35
15 480 0.91 0.60 0.48
16 477 0.86 0.43 0.34
17 476 0.85 0.57 0.54
18 478 0.88 0.58 0.56
19 475 0.87 0.60 0.35
20 479 0.85 0.59 0.40
Chapter 4—Discussion 21 2010–11 Florida Alternate Assessment Item Characteristics Report
Table 3. ANOVA Hypothesis Testing Results for Delta Values for Mathematics Items
Grade
Dependent Source DF SS MS FValue ProbF
Delta Model 2 163.3860386 81.6930193 50.40 <0.0001
3 Delta Error 57 92.3886665 1.6208538 _ _
Delta Corrected Total 59 255.7747051 _ _ _
Delta Model 2 253.3303438 126.6651719 71.43 <0.0001
4 Delta Error 57 101.0805394 1.7733428 _ _
Delta Corrected Total 59 354.4108832 _ _ _
Delta Model 2 164.5211188 82.2605594 57.29 <0.0001
5 Delta Error 57 81.8505350 1.4359743 _ _
Delta Corrected Total 59 246.3716538 _ _ _
Delta Model 2 177.8151947 88.9075973 60.33 <0.0001
7 Delta Error 57 84.0060081 1.4737896 _ _
Delta Corrected Total 59 261.8212027 _ _ _
Delta Model 2 199.6494347 99.8247174 68.84 <0.0001
8 Delta Error 57 82.6581879 1.4501436 _ _
Delta Corrected Total 59 282.3076226 _ _ _
Delta Model 2 172.3287093 86.1643547 35.52 <0.0001
9 Delta Error 57 138.2582034 2.4255825 _ _
Delta Corrected Total 59 310.5869127 _ _ _
Table 4. ANOVA Effect Size Results for Delta Values for Mathematics Items
Grade
3
Dependent RSquare CV RootMSE DepMean
Delta 0.638789 10.43741 1.273128 12.19773
4 Delta 0.714793 10.98173 1.331669 12.12622
5 Delta 0.667776 9.27687 1.198321 12.91730
7 Delta 0.679147 9.68273 1.213997 12.53775
8 Delta 0.707205 9.73305 1.204219 12.37247
9 Delta 0.554849 12.72422 1.557428 12.23987
Chapter 4—Discussion 22 2010–11 Florida Alternate Assessment Item Characteristics Report
Table 5. ANOVA Hypothesis Testing Results for Delta Values for Reading Items
Grade
Dependent Source DF SS MS FValue ProbF
Delta Model 2 79.0024247 39.5012124 25.24 <0.0001
3 Delta Error 57 89.2015933 1.5649402 _ _
Delta Corrected Total 59 168.2040180 _ _ _
Delta Model 2 199.4971441 99.7485720 64.97 <0.0001
4 Delta Error 57 87.5162468 1.5353728 _ _
Delta Corrected Total 59 287.0133909 _ _ _
Delta Model 2 176.2415927 88.1207964 66.44 <0.0001
5 Delta Error 57 75.5986984 1.3262930 _ _
Delta Corrected Total 59 251.8402911 _ _ _
Delta Model 2 148.7796748 74.3898374 63.44 <0.0001
7 Delta Error 57 66.8352432 1.1725481 _ _
Delta Corrected Total 59 215.6149180 _ _ _
Delta Model 2 238.5341485 119.2670742 113.70 <0.0001
8 Delta Error 57 59.7916640 1.0489766 _ _
Delta Corrected Total 59 298.3258124 _ _ _
Delta Model 2 257.1582442 128.5791221 114.02 <0.0001
9 Delta Error 57 64.2785721 1.1276942 _ _
Delta Corrected Total 59 321.4368163 _ _ _
Table 6. ANOVA Effect Size Results for Delta Values for Reading Items
Grade
3
Dependent RSquare CV RootMSE DepMean
Delta 0.469682 10.76178 1.250976 11.62425
4 Delta 0.695080 10.69610 1.239102 11.58461
5 Delta 0.699815 9.62702 1.151648 11.96267
7 Delta 0.690025 9.09826 1.082843 11.90164
8 Delta 0.799576 8.62134 1.024196 11.87977
9 Delta 0.800027 9.13349 1.061929 11.62676
Chapter 4—Discussion 23 2010–11 Florida Alternate Assessment Item Characteristics Report
Figure 1. Paired Difference Hypothesis Test Results for All Pairs of Questions in the Mathematics Items. The horizontal line shows the Z statistic criterion of 1.645, above which a Z is statistically significant at level 0.05 for the one-tailed tests.
continued
Chapter 4—Discussion 24 2010–11 Florida Alternate Assessment Item Characteristics Report
continued
Chapter 4—Discussion 25 2010–11 Florida Alternate Assessment Item Characteristics Report
continued
Chapter 4—Discussion 26 2010–11 Florida Alternate Assessment Item Characteristics Report
continued

Chapter 4—Discussion 27 2010–11 Florida Alternate Assessment Item Characteristics Report
continued
Chapter 4—Discussion 28 2010–11 Florida Alternate Assessment Item Characteristics Report
Chapter 4—Discussion 29 2010–11 Florida Alternate Assessment Item Characteristics Report
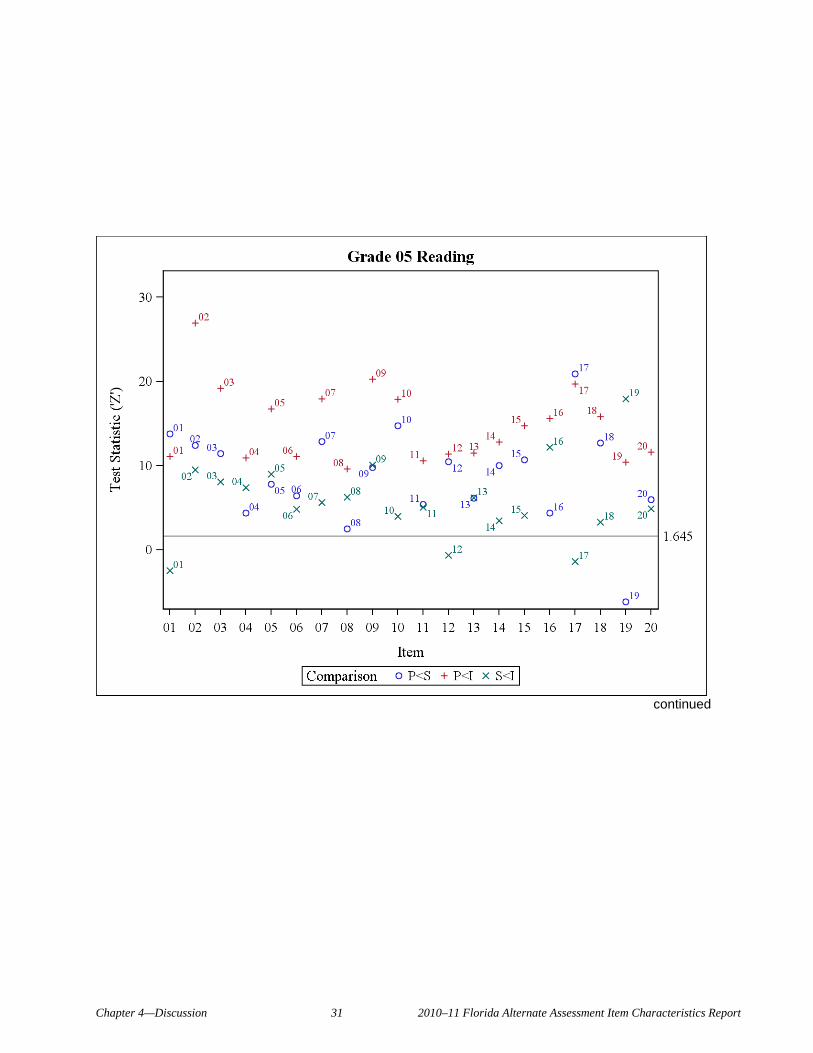
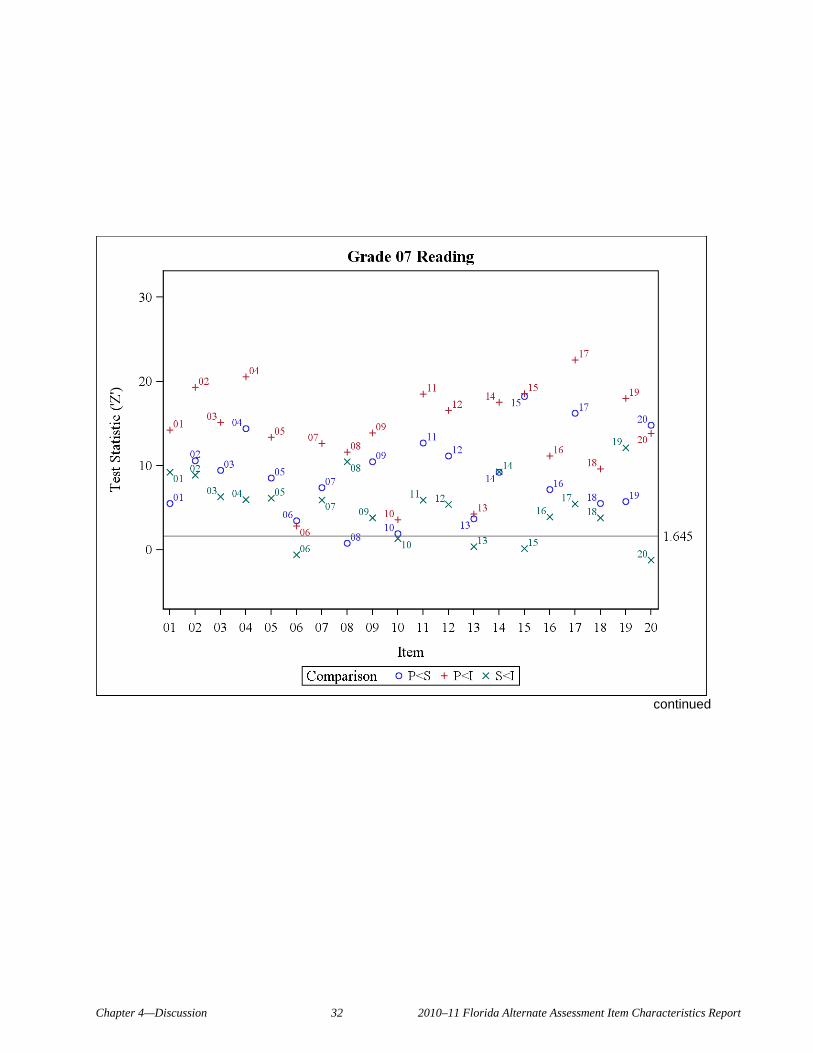
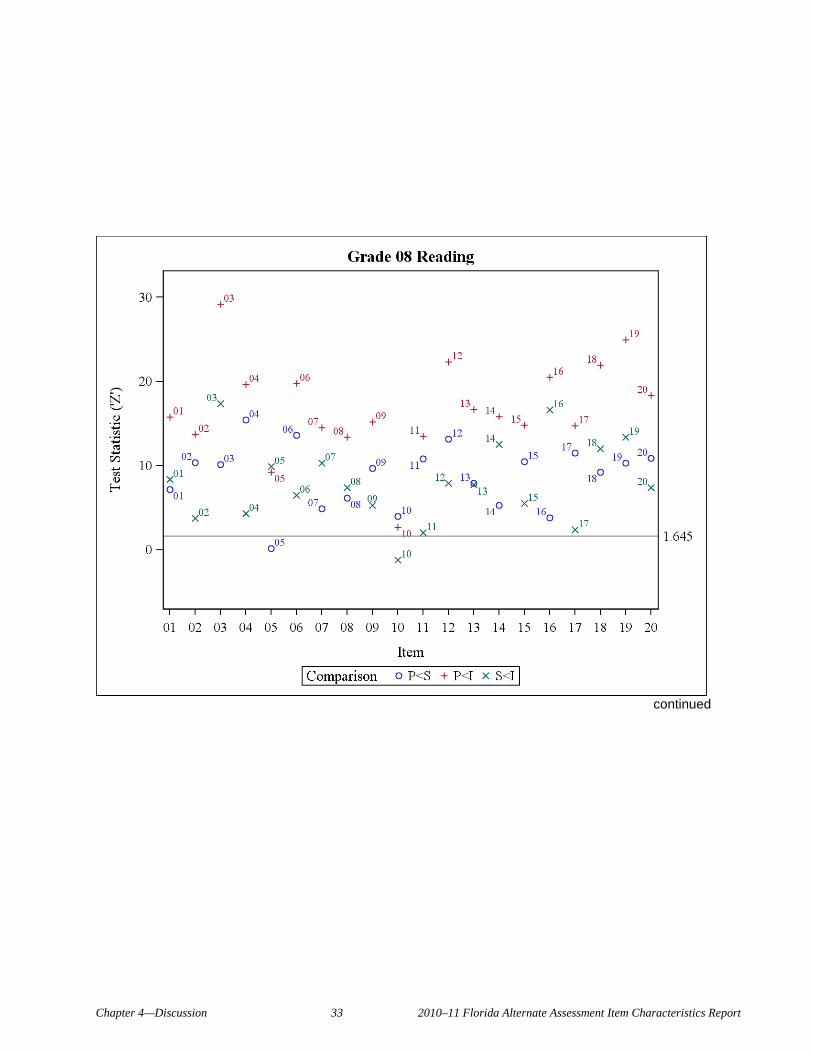
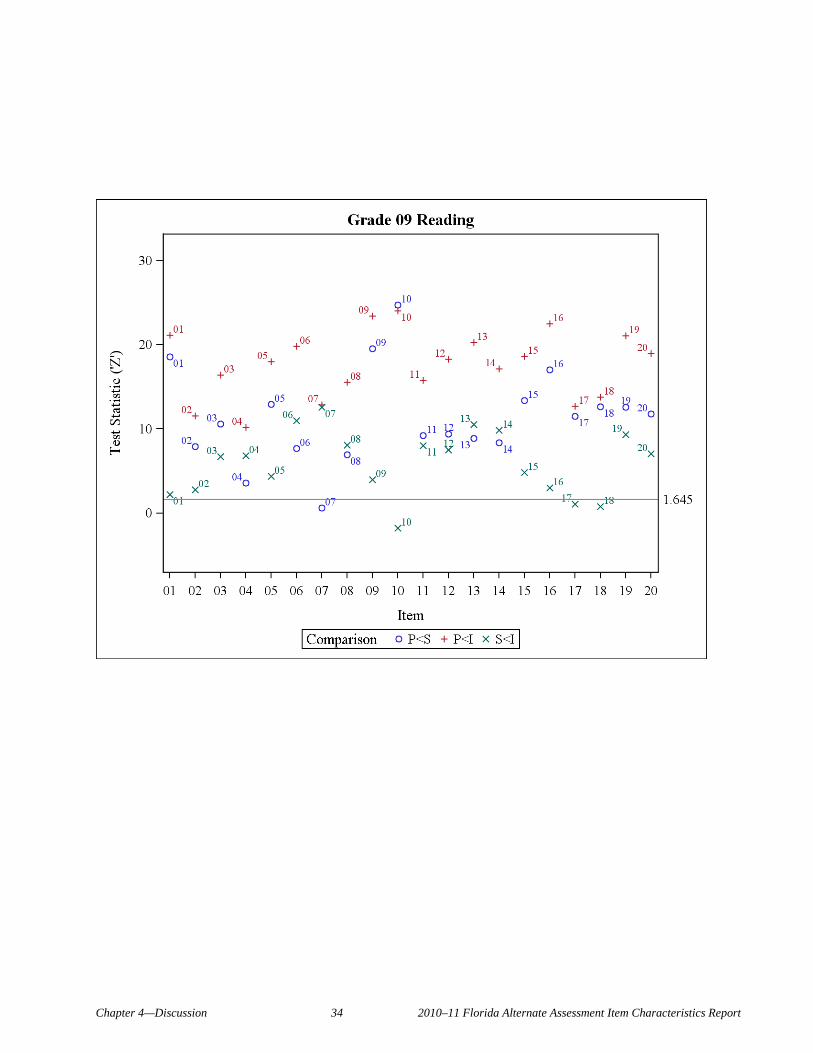
Figure 2. Paired Difference Hypothesis Test Results for All Pairs of Questions in the Reading Items. The horizontal line shows the Z statistic criterion of 1.645, above which a Z is statistically significant at level 0.05 for the one-tailed tests.
continued
Chapter 4—Discussion 30 2010–11 Florida Alternate Assessment Item Characteristics Report
continued
Chapter 4—Discussion 31 2010–11 Florida Alternate Assessment Item Characteristics Report
continued
Chapter 4—Discussion 32 2010–11 Florida Alternate Assessment Item Characteristics Report
continued
Chapter 4—Discussion 33 2010–11 Florida Alternate Assessment Item Characteristics Report
continued
Chapter 4—Discussion 34 2010–11 Florida Alternate Assessment Item Characteristics Report