Embed Size (px)
Citation preview
HARMO 14 – Kos, Greece – 2-6 Oct. 2011
FluxSAP 2010 experimental campaign over an heterogeneous urban zone, part 1: heat
and vapour flux assessmentpresented by Patrice Mestayer
IRSTV, FR CNRS 2488, France
The participants and co-authors P. Mestayer1,3, I. Bagga3, I. Calmet3, G. Fontanilles3, D. Gaudin3, J. H. Lee3, T. Piquet3,
J.-M. Rosant3, K. Chancibault2, L. Lebouc2, L. Letellier2, M.-L. Mosini2, F. Rodriguez2, J.-M. Rouaud2, M. Sabre4, Y. Tétard4, A. Brut5, J.-L. Selves5, P.-A. Solignac5, Y. Brunet6, S. Dayau6, M. Irvine6, J.-P. Lagouarde6, Z. Kassouk7, P. Launeau7, O. Connan8, P. Defenouillère8, M. Goriaux8, D. Hébert8, B. Letellier8, D. Maro8, G. Najjar9, F. Nerry9, C. Quentin9, R. Biron10, J.-M. Cohard10, J. Galvez11, P. Klein11
1Institut de recherche en sciences et techniques de la ville (IRSTV), FR CNRS 2488, BP 92101, Nantes, France
2Département géotechnique, eau et risques (GER), IFSTTAR, Bouguenais, France 3Laboratoire de mécanique des fluides (LMF), UMR CNRS 6598, École Centrale de Nantes, France 4Département climatologie, aérodynamique, pollution et épuration (CAPE), CSTB, Nantes, France 5Centre d'études spatiales de la biosphère (CESBIO), UMR CNRS 5126, Toulouse, France 6Ecologie fonctionnelle et physique de l’environnement, UR1263 EPHYSE, INRA, Villenave d'Ornon,
France 7Laboratoire de planétologie et géodynamique de Nantes (LPGN), UMR CNRS 6112, Nantes, France 8Laboratoire de radioécologie de Cherbourg-Octeville (LRC), IRSN, Cherbourg, France 9Laboratoire des sciences de l'image de l'informatique et de la télédétection (LSIIT), UMR CNRS 7005,
Strasbourg, France 10Laboratoire d'étude des transferts en hydrologie et environnement (LTHE), UMR CNRS 5564,
Grenoble, France 11School of Meteorology, University of Oklahoma, Norman, OK 73072 USA - 2 -
The context VegDUD, The role of vegetation in the sustainable urban
development; an approach by the stakes linked to climatology, hydrology, energy control, and environment,
a cooperative program based on a systemic approach, with some 15 partners aiming at understanding and quantitatively assessing the vegetation impact in the present and future urban development projects
funded by the French National Research Agency (ANR) during 4 years (2010-2013).
within this framework two campaigns of at-ground and airborne measurements are organized, the first one in 2010 and the second one in 2012
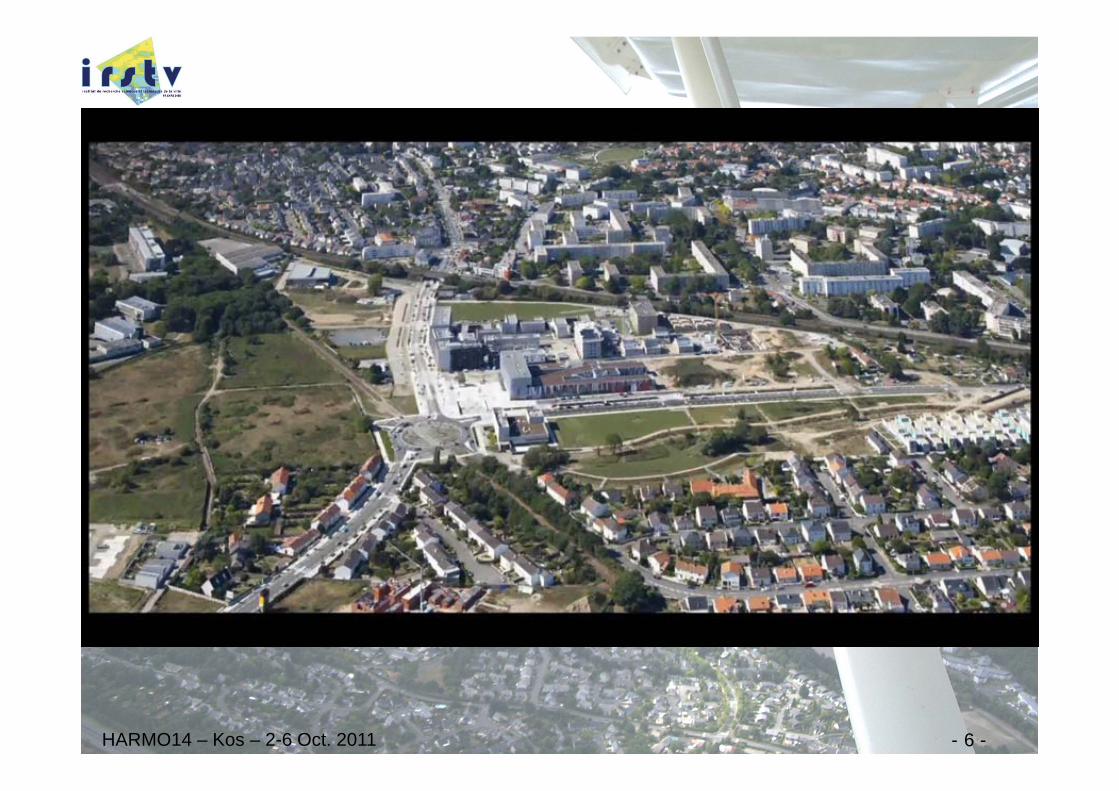
around the permanent observation site of IRSTV (Pin Sec district)
HARMO14 – Kos – 2-6 Oct. 2011 - 3 -
The objectives
FluxSAP’s objective : to obtain reference data for assessing quantitatively the role of vegetation in urban climate,
and for evaluating urban hydrology and climatology models
FluxSAP2010’s objective : to test the methods allowing to measure the sensible heat and water vapour fluxes
over a heterogeneous urban district, to spatialize the measurements taking into account
the heterogeneous land surface cover modes, and to test the footprint models for a urban area.
- 4 -HARMO14 – Kos – 2-6 Oct. 2011
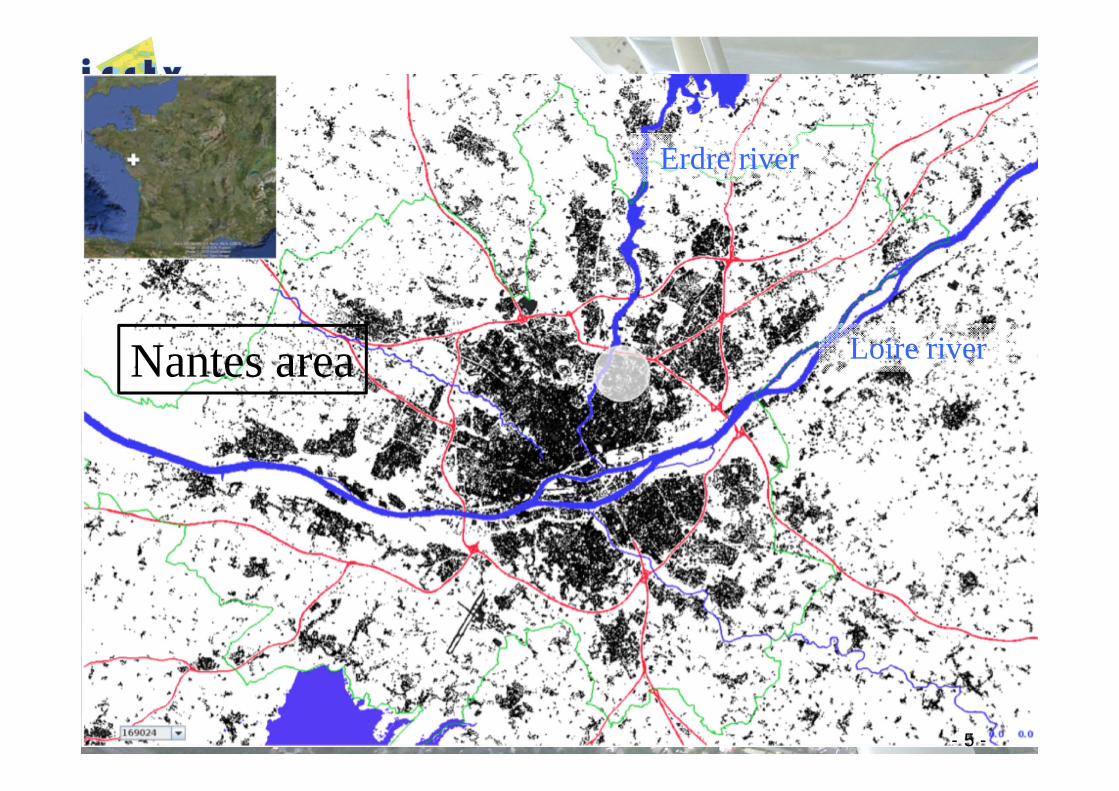
Nantes area Loire river
Erdre river
- 5 -
- 6 -HARMO14 – Kos – 2-6 Oct. 2011
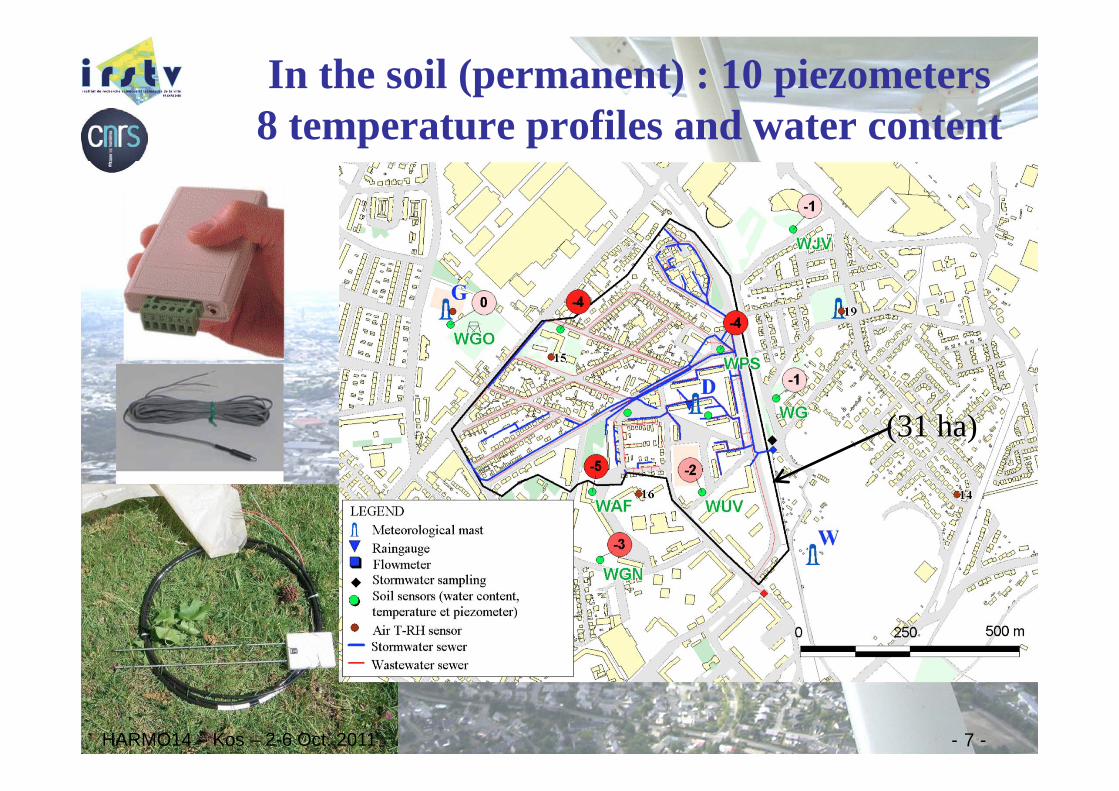
In the soil (permanent) : 10 piezometers8 temperature profiles and water content
- 7 -HARMO14 – Kos – 2-6 Oct. 2011
(31 ha)
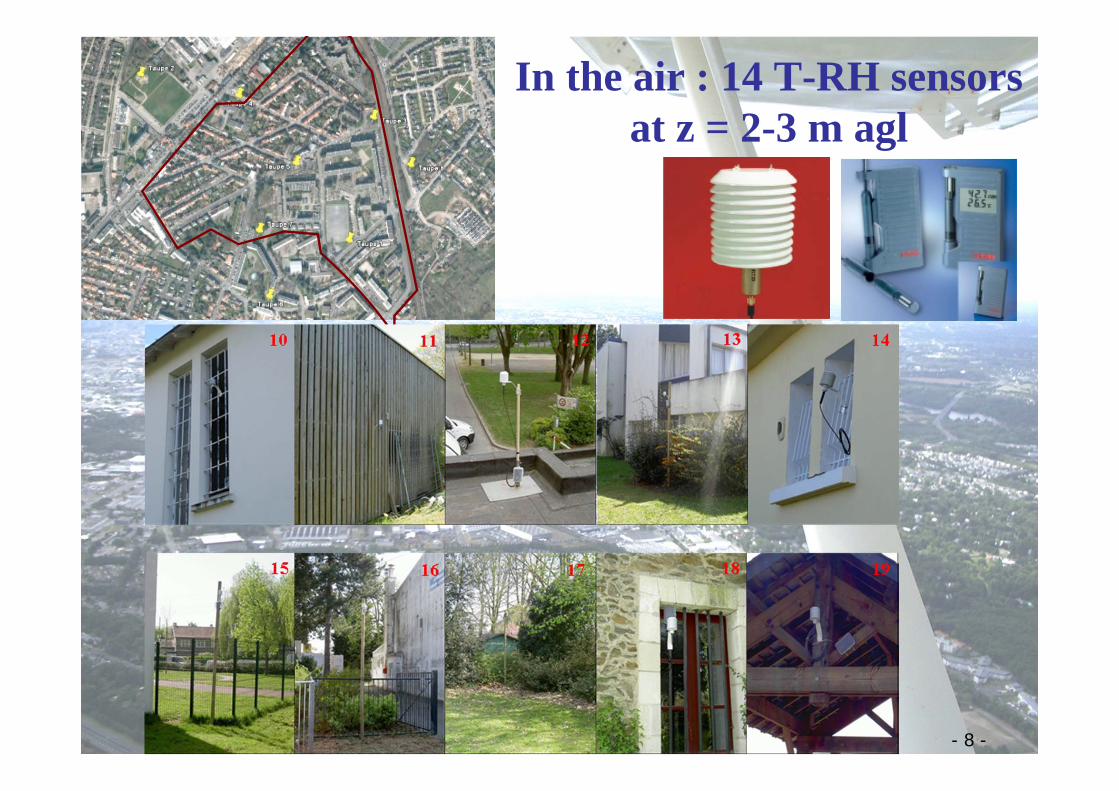
In the air : 14 T-RH sensors at z = 2-3 m agl
- 8 -
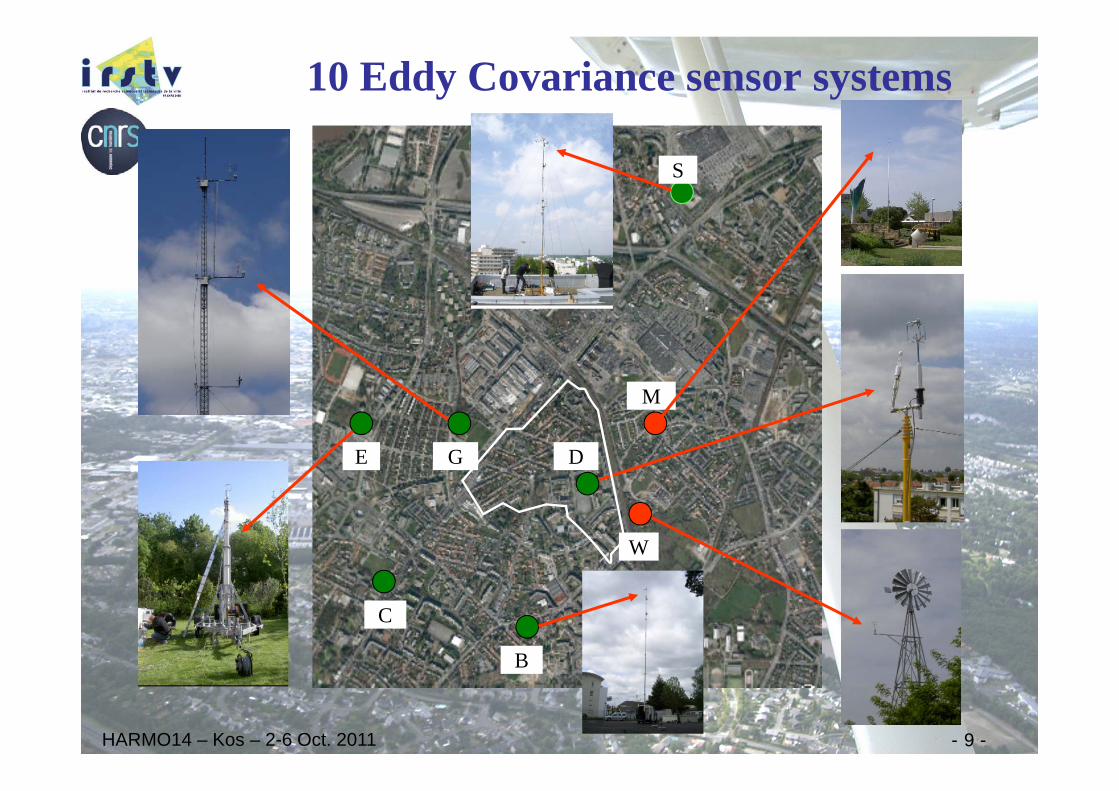
10 Eddy Covariance sensor systems
S
M
B
C
GE
W
D
- 9 -HARMO14 – Kos – 2-6 Oct. 2011
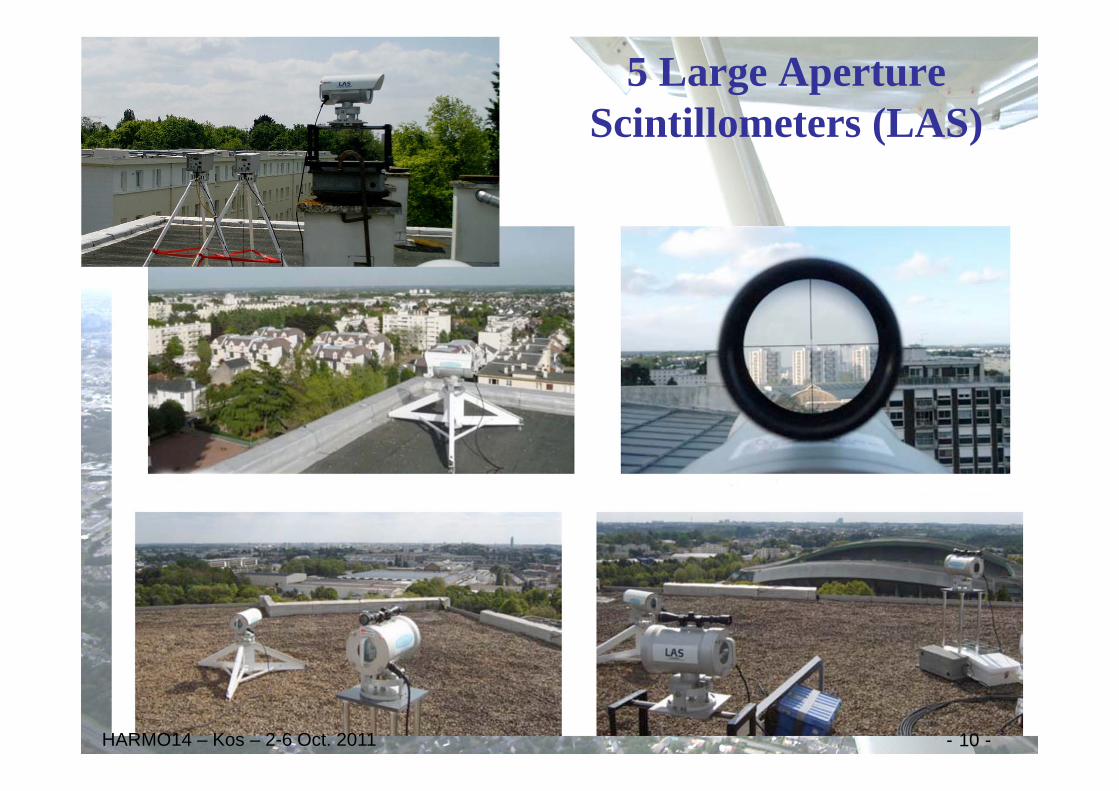
5 Large Aperture Scintillometers (LAS)
- 10 -HARMO14 – Kos – 2-6 Oct. 2011
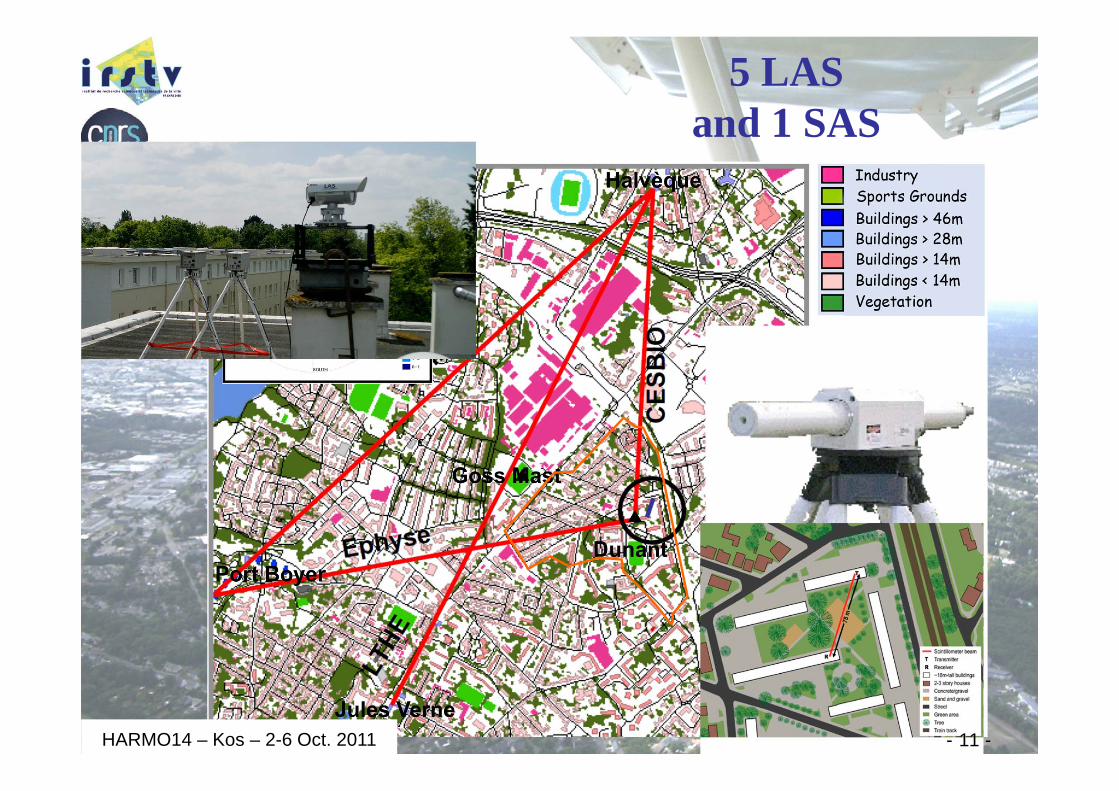
5 LASand 1 SAS
- 11 -HARMO14 – Kos – 2-6 Oct. 2011
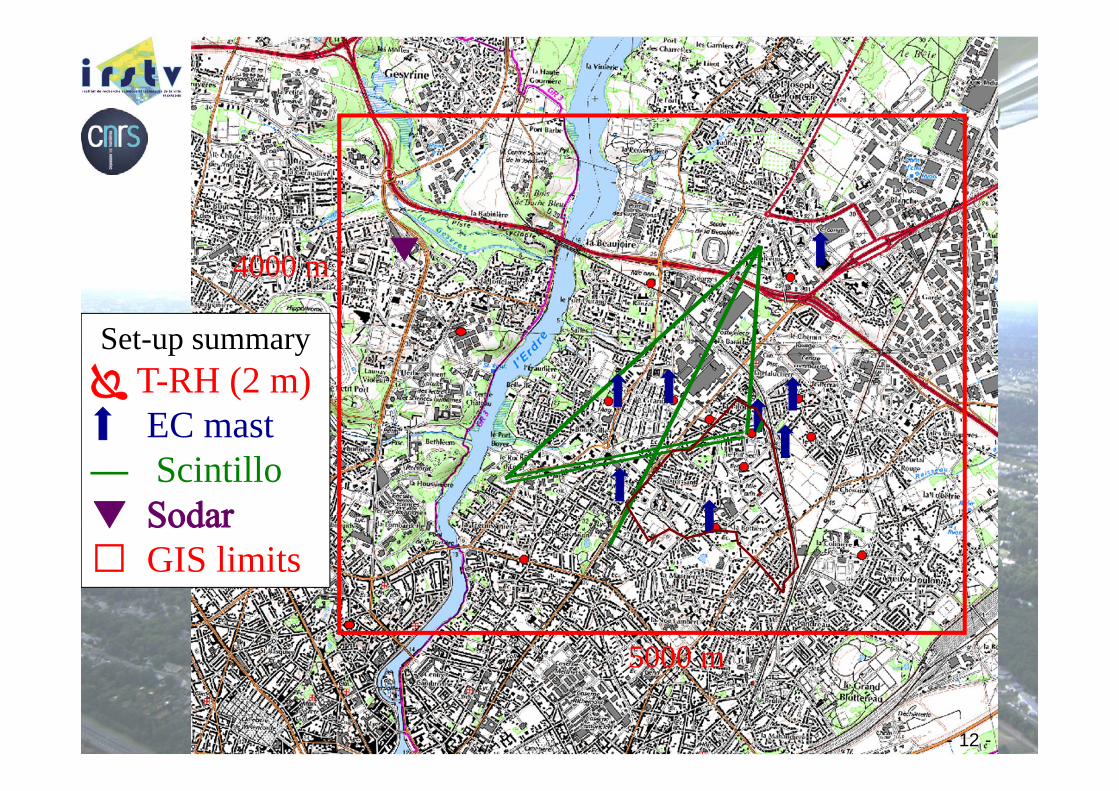
- 12 -
Set-up summary T-RH (2 m)
EC mast–– Scintillo
☐ GIS limits
5000 m
4000 m
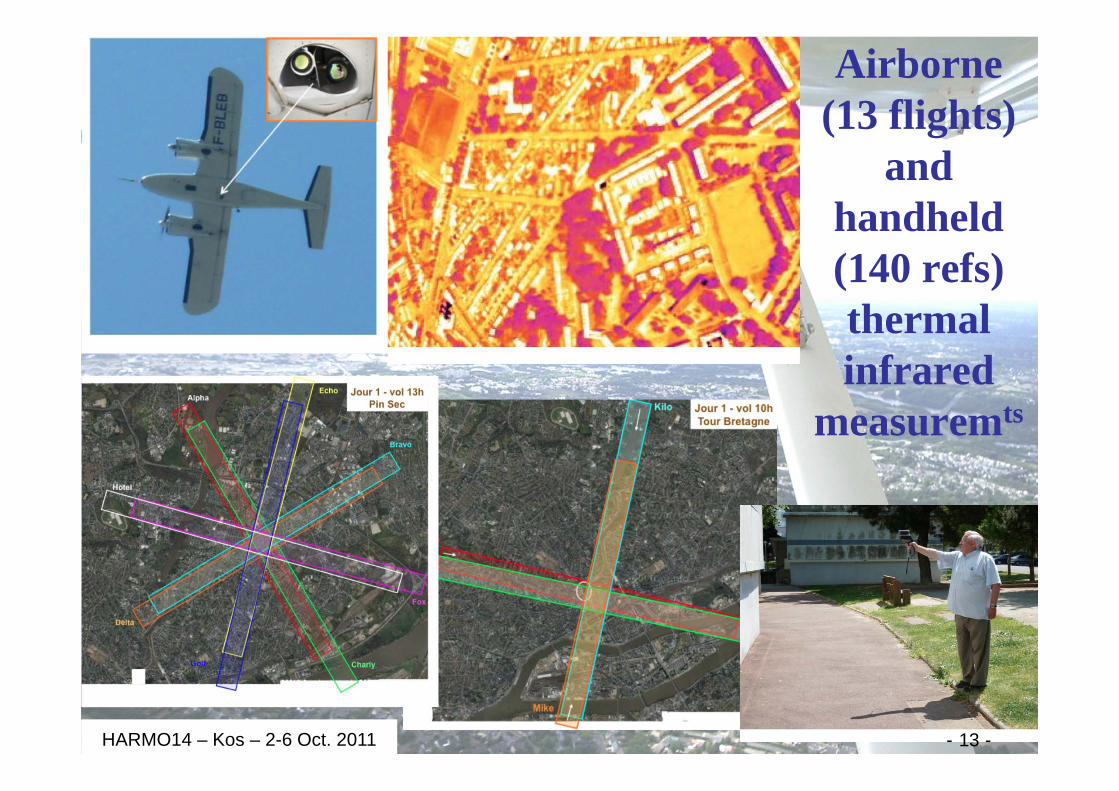
Airborne(13 flights)
and handheld(140 refs) thermal infrared
measuremts
- 13 -HARMO14 – Kos – 2-6 Oct. 2011
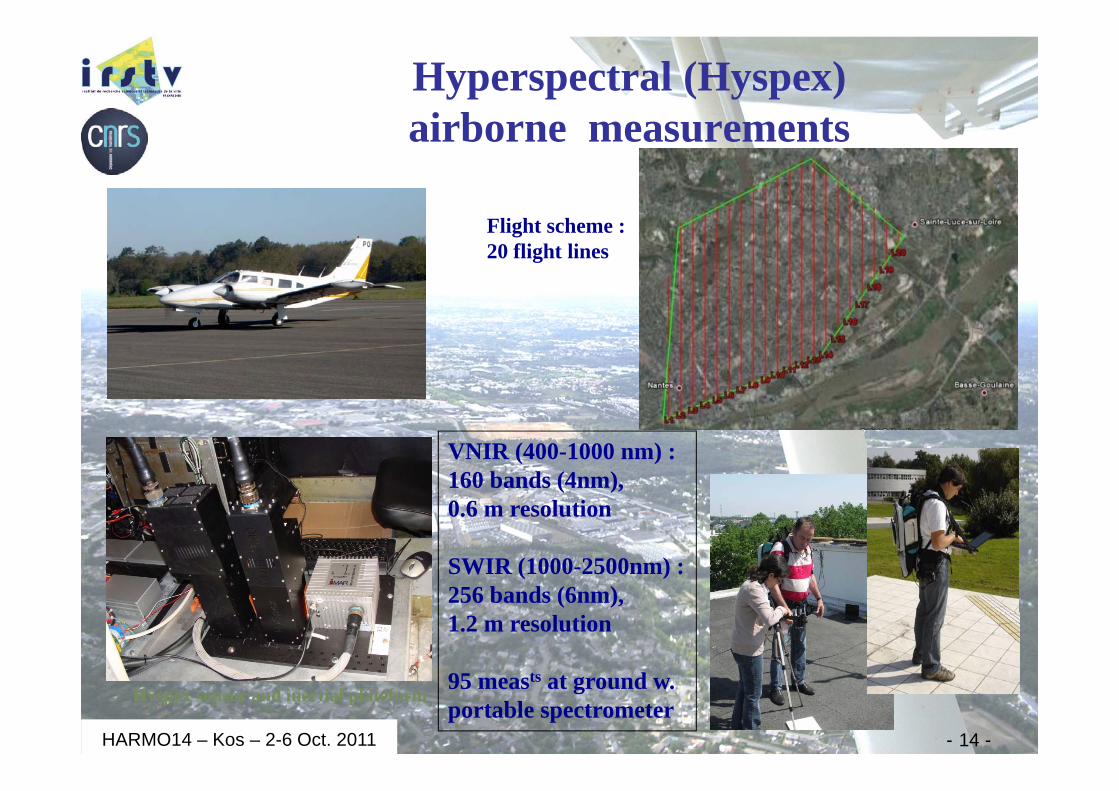
Flight scheme :20 flight lines
Hyspex sensor and inertial plateform
Hyperspectral (Hyspex)airborne measurements
VNIR (400-1000 nm) :160 bands (4nm),0.6 m resolution
SWIR (1000-2500nm) :256 bands (6nm),1.2 m resolution
95 measts at ground w. portable spectrometer
- 14 -HARMO14 – Kos – 2-6 Oct. 2011
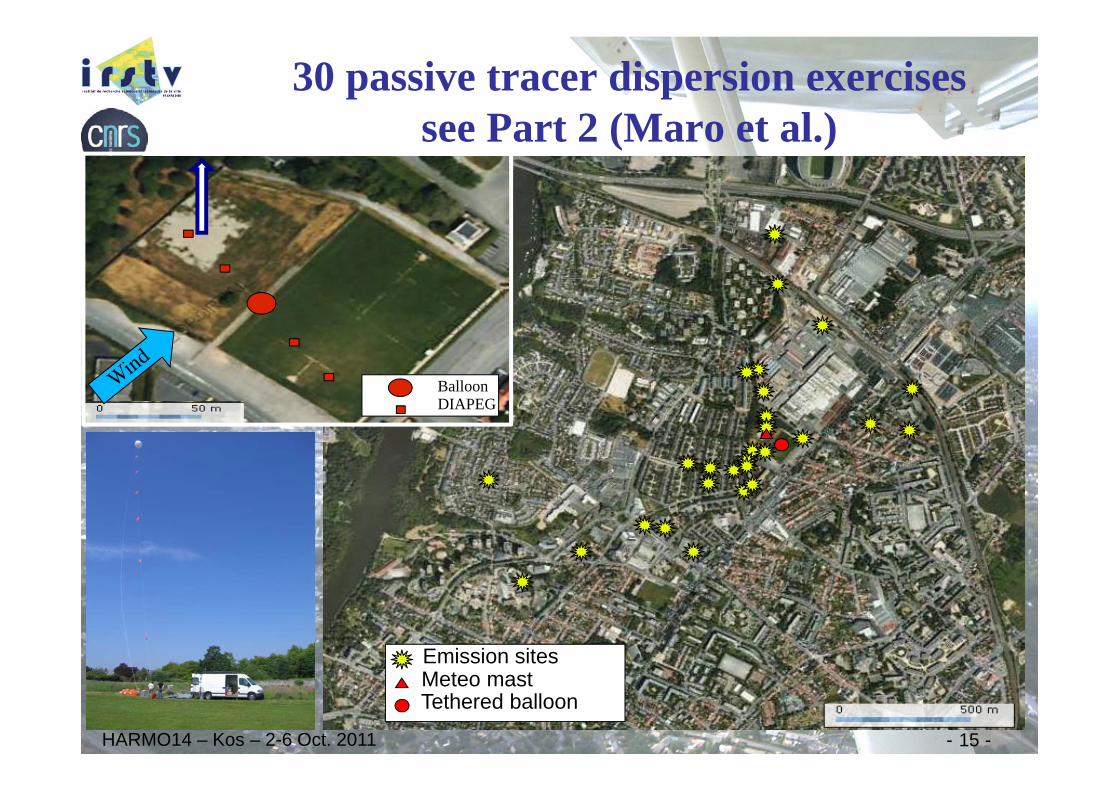
Meteo mastTethered balloon
Emission sites
30 passive tracer dispersion exercisessee Part 2 (Maro et al.)
Balloon DIAPEG
- 15 -HARMO14 – Kos – 2-6 Oct. 2011
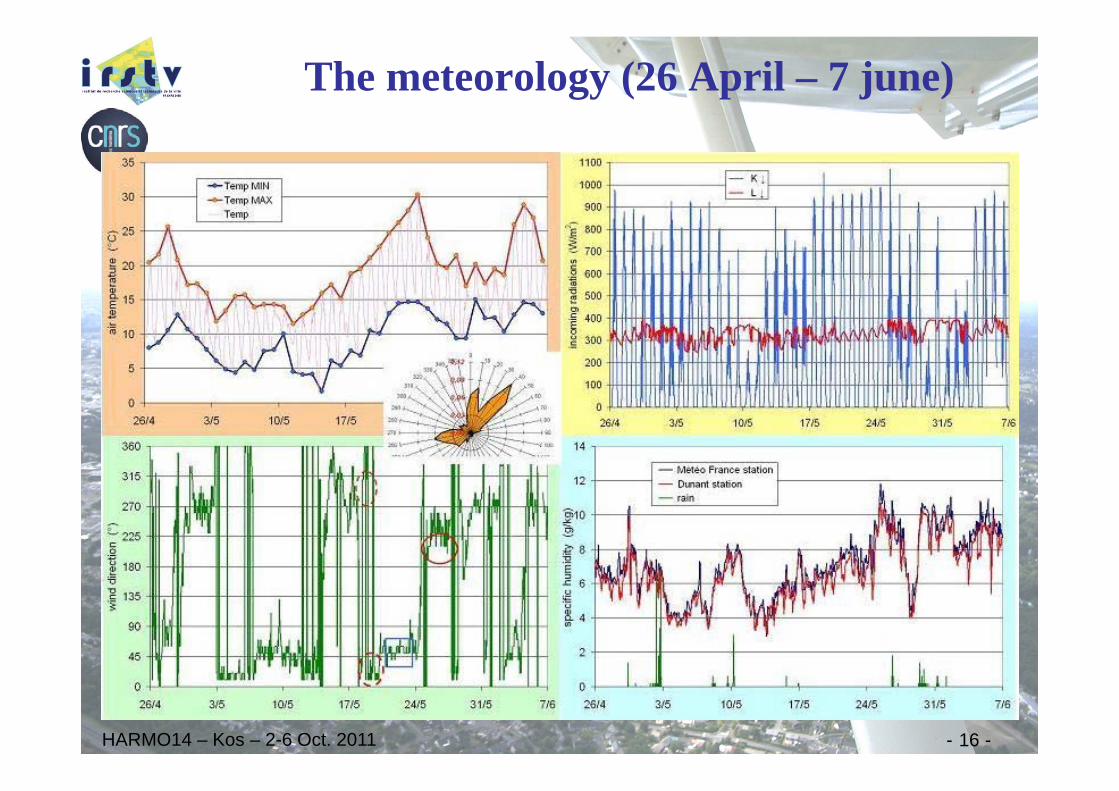
The meteorology (26 April – 7 june)
- 16 -HARMO14 – Kos – 2-6 Oct. 2011
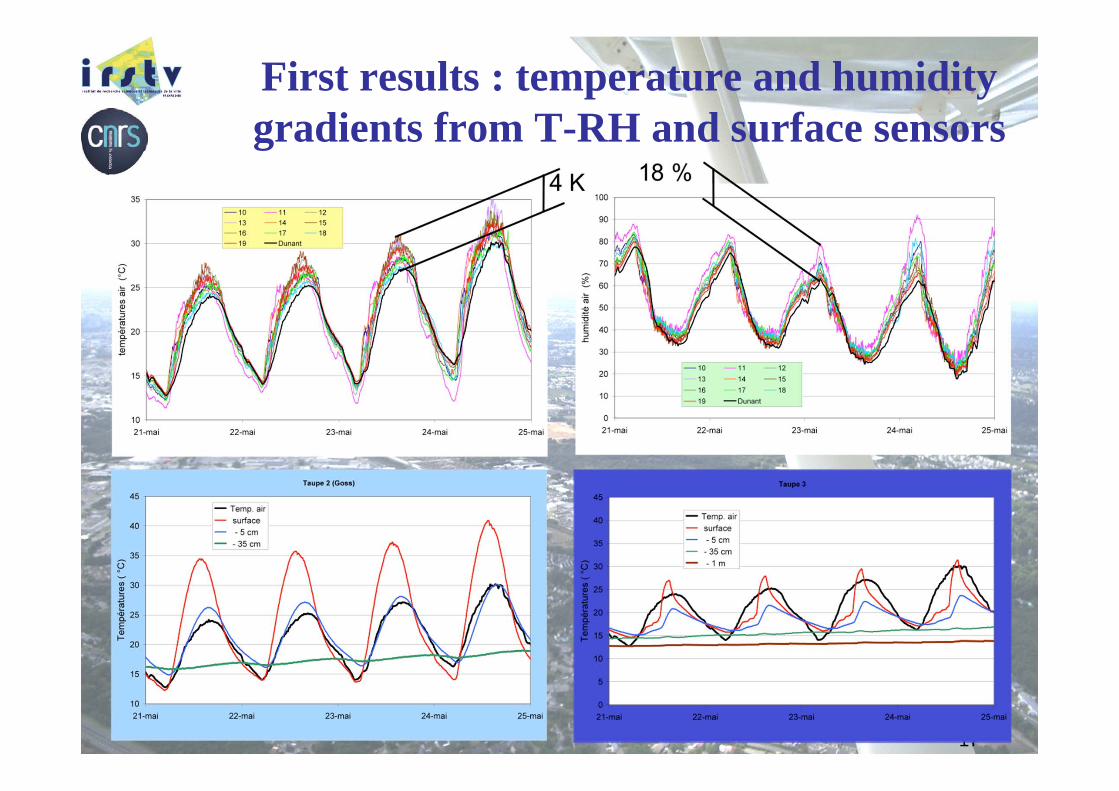
First results : temperature and humidity gradients from T-RH and surface sensors
- 17 -
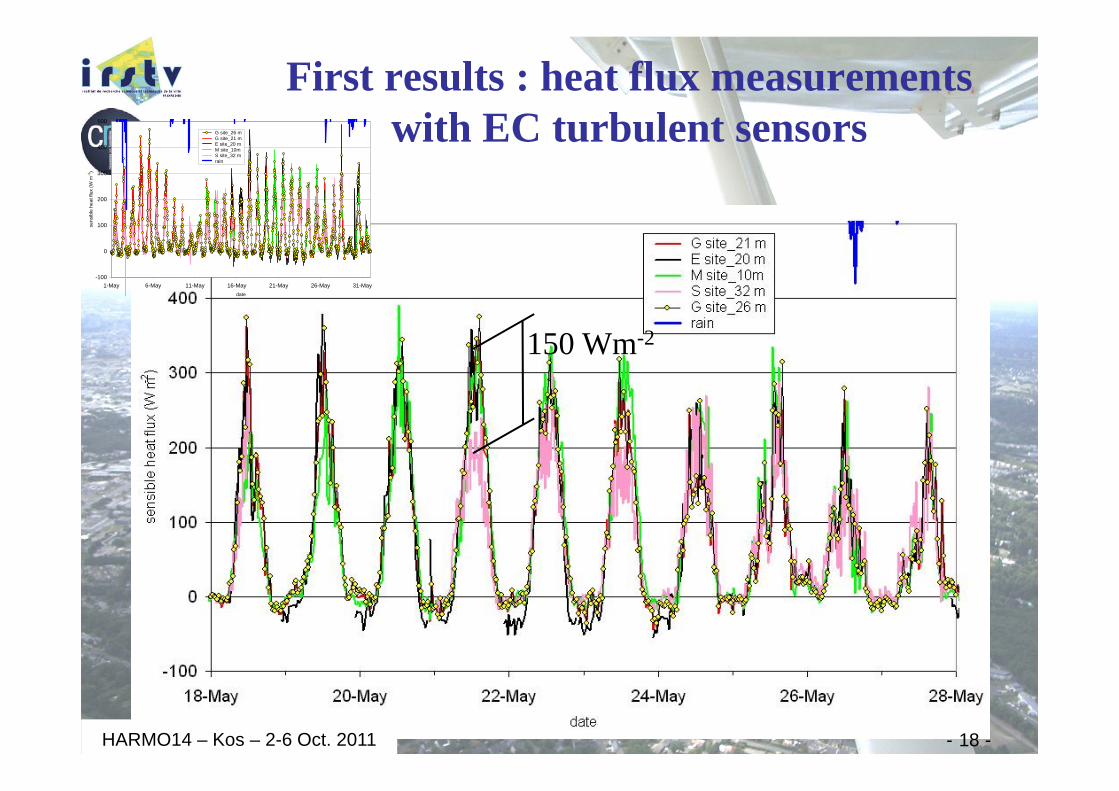
First results : heat flux measurementswith EC turbulent sensors
- 18 -
-100
0
100
200
300
400
500
1-May 6-May 11-May 16-May 21-May 26-May 31-Maydate
sens
ible
hea
t flu
x (W
m-2
)
G site_26 m G site_21 m E site_20 m M site_10m S site_32 m rain
150 Wm-2
HARMO14 – Kos – 2-6 Oct. 2011
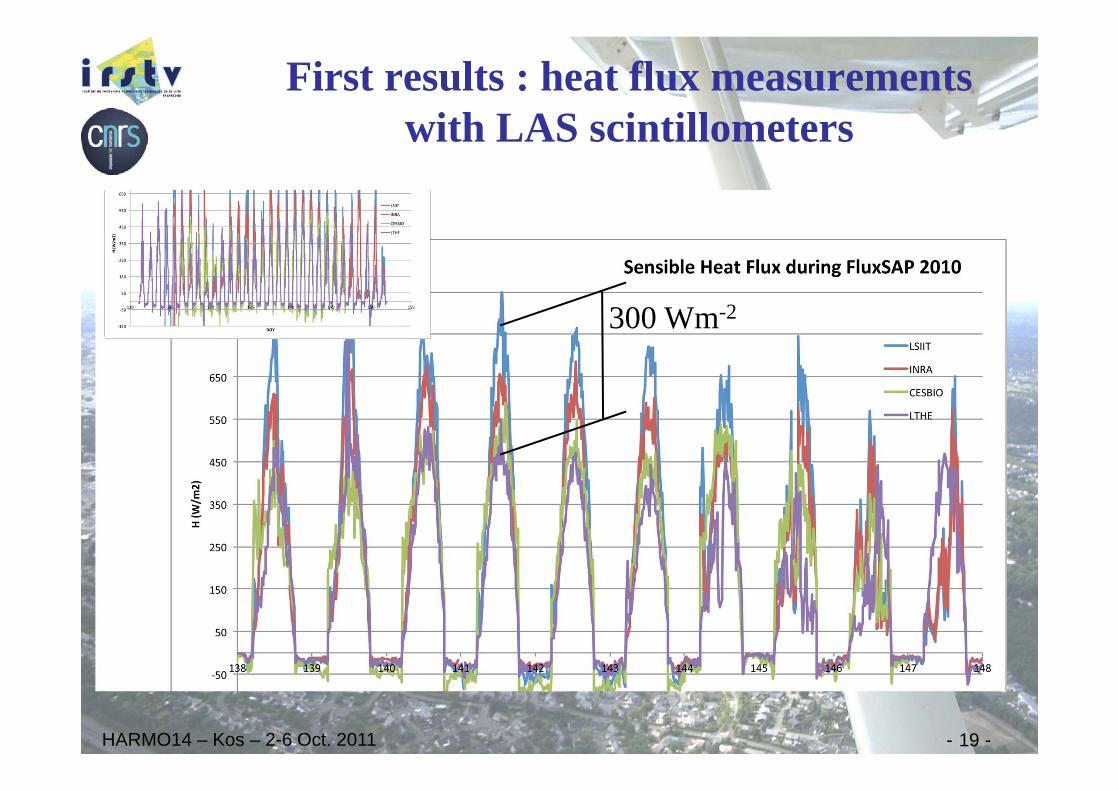
First results : heat flux measurementswith LAS scintillometers
- 19 -
300 Wm-2
HARMO14 – Kos – 2-6 Oct. 2011
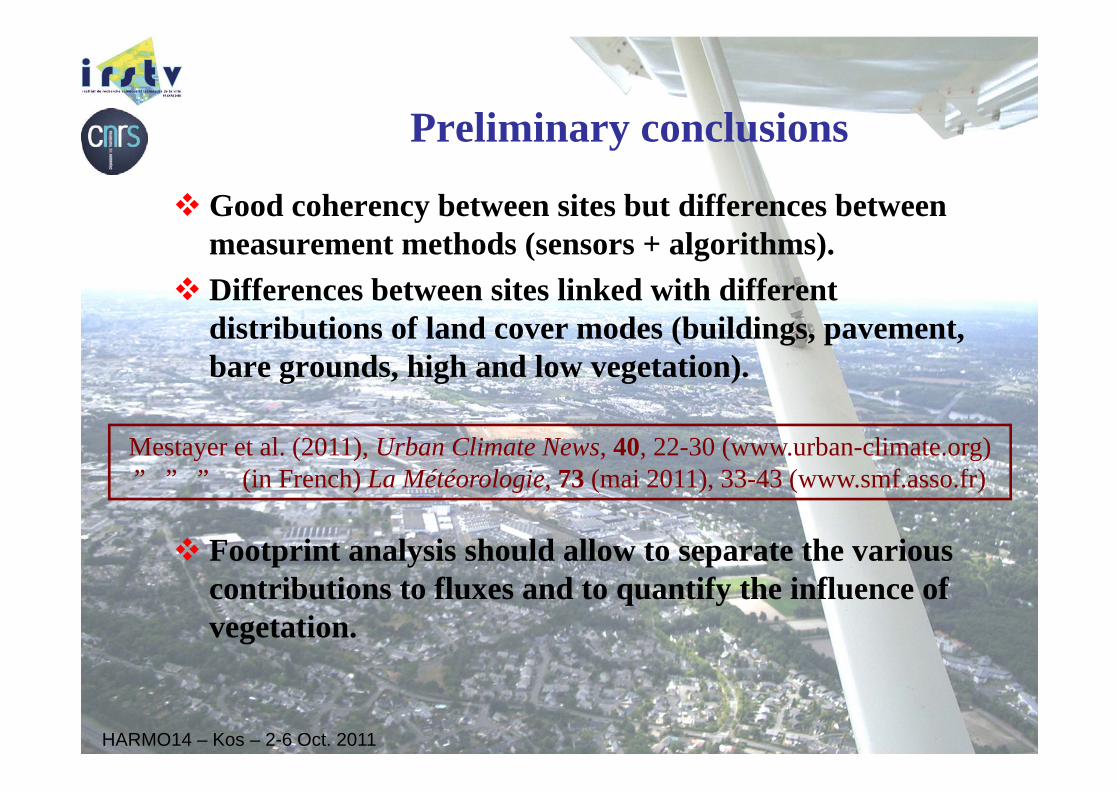
Preliminary conclusions
Good coherency between sites but differences between measurement methods (sensors + algorithms).
Differences between sites linked with different distributions of land cover modes (buildings, pavement, bare grounds, high and low vegetation).
Footprint analysis should allow to separate the various contributions to fluxes and to quantify the influence of vegetation.
Mestayer et al. (2011), Urban Climate News, 40, 22-30 (www.urban-climate.org) ” ” ” (in French) La Météorologie, 73 (mai 2011), 33-43 (www.smf.asso.fr)
HARMO14 – Kos – 2-6 Oct. 2011
- 21 -
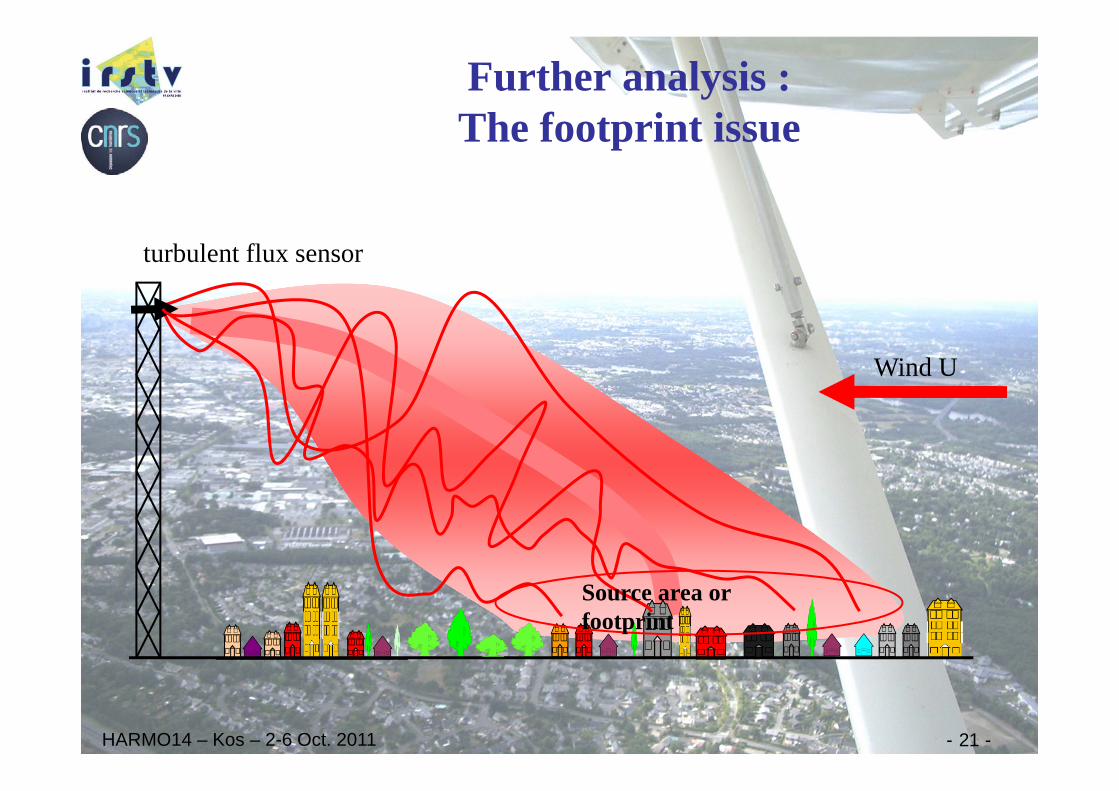
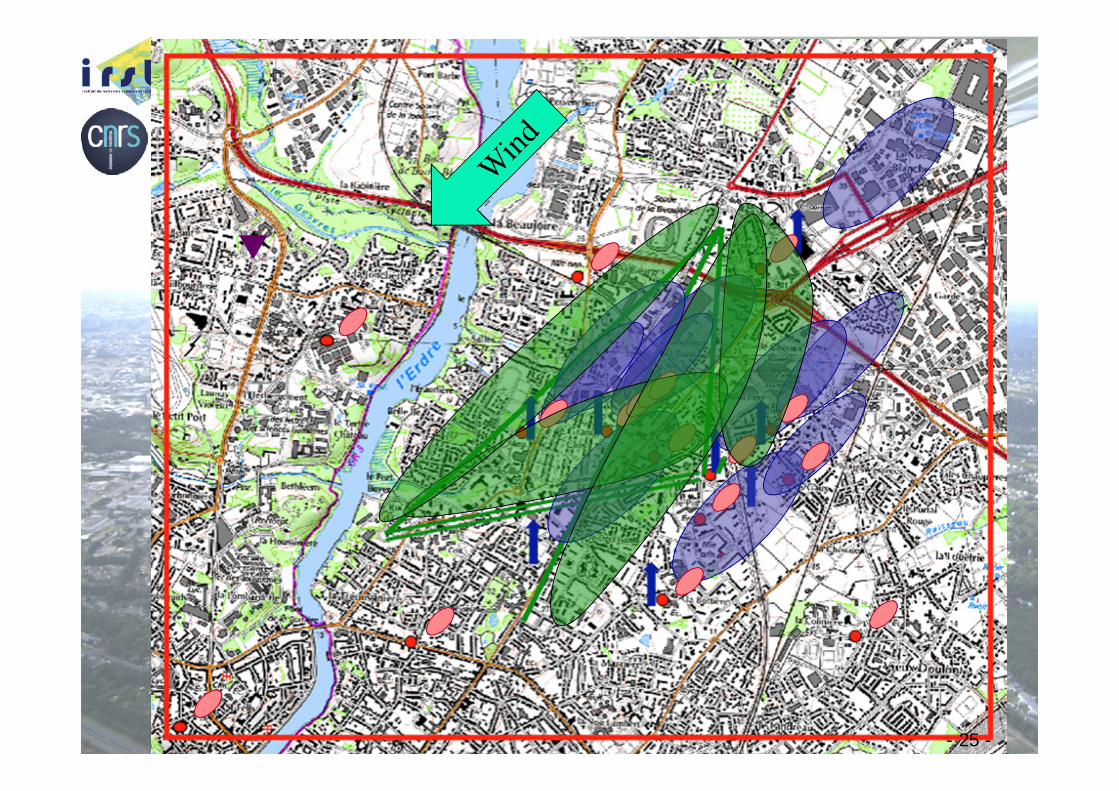
Further analysis : The footprint issue
turbulent flux sensor
Source area or footprint
Wind U
HARMO14 – Kos – 2-6 Oct. 2011
- 22 -
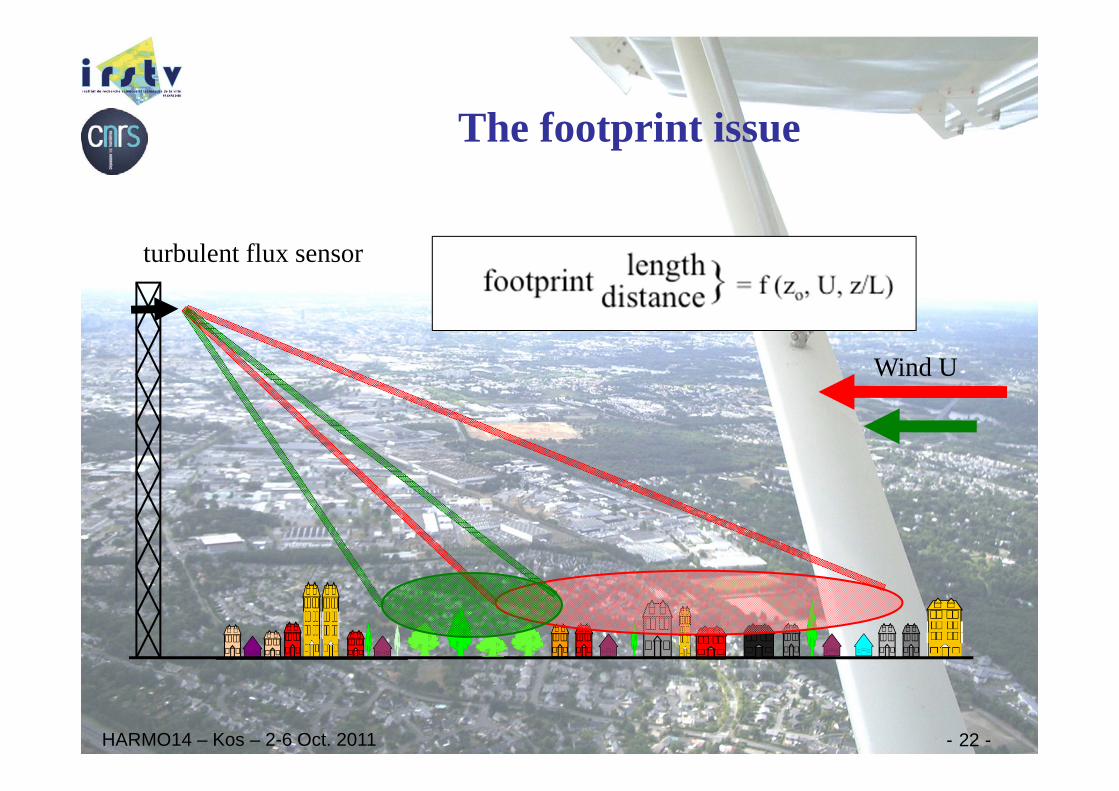
The footprint issue
Wind U
turbulent flux sensor
HARMO14 – Kos – 2-6 Oct. 2011
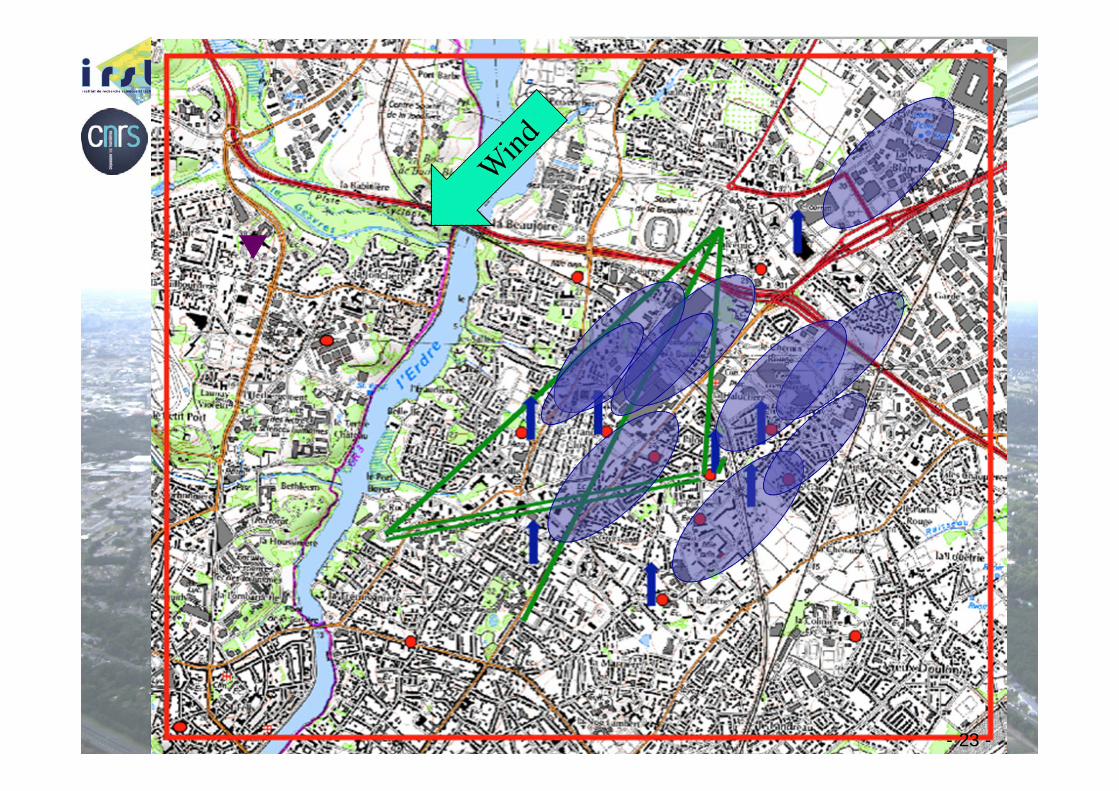
- 23 -- 23 -
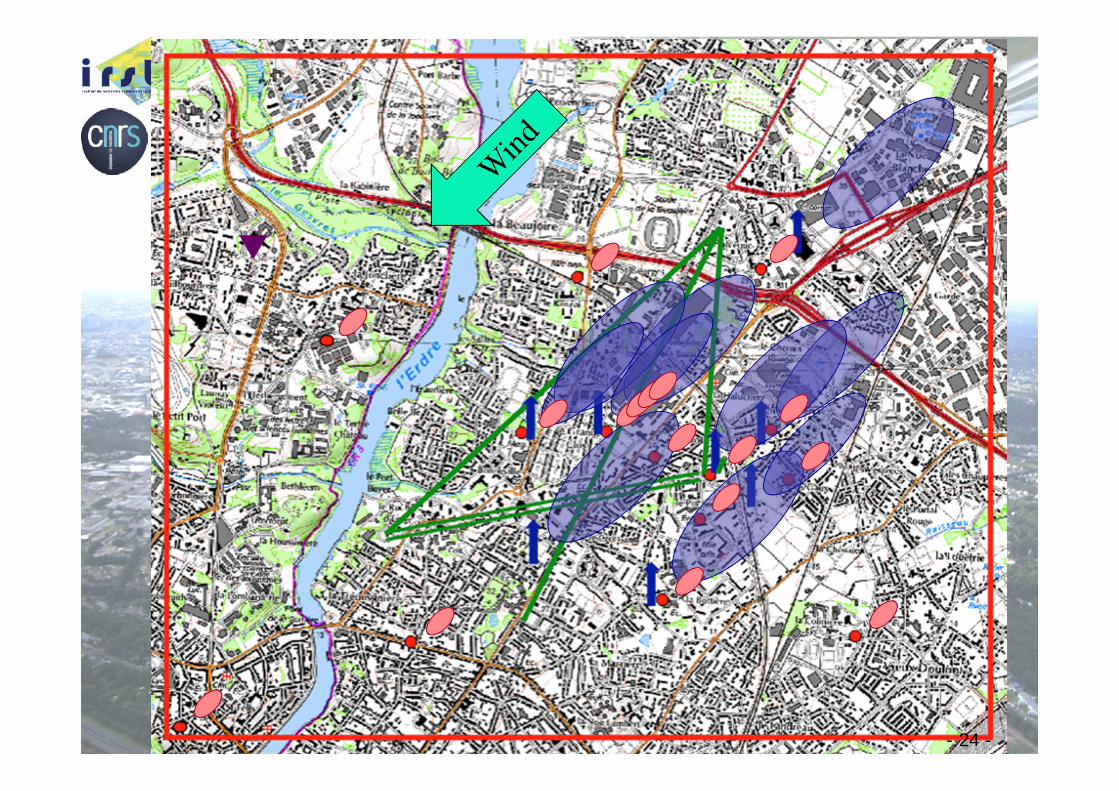
- 24 -- 24 -
- 25 -
Preparation for second campaign,May-June 2012
Look for more differences between footprint land cover modes.
Look for more differentiated LAS paths (mineral, vegetal, mixed).
Look for more EC masts over vegetated eco-districts. Look for more H2O turbulent sensors (Li-Cor). Look for building influence on vegetation.Monitor water table in the ground (soil moisture
profile)Measure PTUV profile (0-150 m) with tethered balloon. Hope to have 1 or 2 water vapour scintillometers.
HARMO14 – Kos – 2-6 Oct. 2011 - 26 -
Thank you for your attention