Embed Size (px)
Citation preview
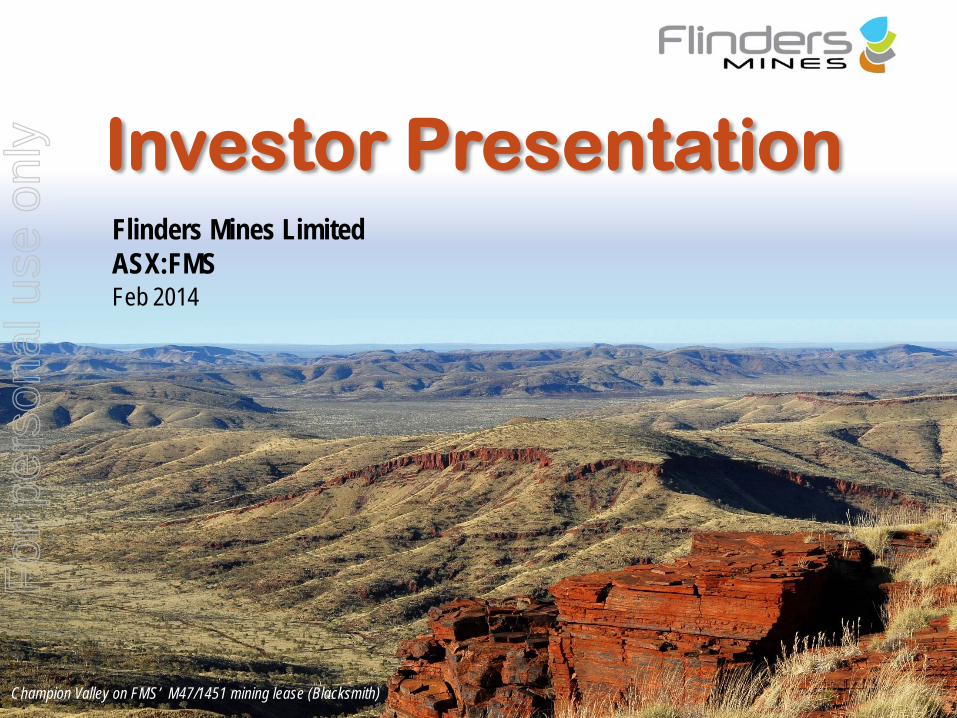
Investor Presentation Flinders Mines LimitedASX:FMSFeb 2014
Champion Valley on FMS’ M47/1451 mining lease (Blacksmith)
For
per
sona
l use
onl
y
2INVESTOR PRESENTATION │ FEBRUARY 2014 │
Compliance Statements
Forward Looking StatementsThis presentation may include forward-looking statements. These forward-looking statements are based on management’s
expectations and beliefs concerning future events as of the time of the release of this document. Forward-looking statements
are necessarily subject to risks, uncertainties and other factors, some of which are outside the control of Flinders Mines
Limited, that could cause actual results to differ materially from such statements. Flinders Mines Limited makes no
undertaking to subsequently update or revise the forward-looking statements made in this release to reflect events or
circumstances after the date of this release, except as required by law.
Exploration TargetsExploration Targets are reported according to Clause 18 of the 2004 JORC Code. This means that the potential quantity and
grade is conceptual in nature and that considerable further exploration, particularly drilling, is necessary before any
Identified Mineral Resource can be reported. It is uncertain if further exploration will lead to a larger, smaller or any Mineral
Resource.
Competent PersonThe information in this report that relates to Exploration Results, Mineral Resources and Ore Reserves is based on information
compiled Dr G McDonald (who is a member of the Australasian Institute of Mining and Metallurgy). Dr McDonald is an
employee of Flinders Mines Limited and has sufficient experience that is relevant to the style of mineralisation and types of
deposit under consideration and consents to inclusion of the information in this report in the form and context in which it
appears. Dr McDonald qualifies as a Competent Person as defined in the 2012 Edition of the “Australasian Code for reporting
of Exploration Results, Mineral Resources and Ore Reserves”.
For
per
sona
l use
onl
y
3INVESTOR PRESENTATION │ FEBRUARY 2014 │
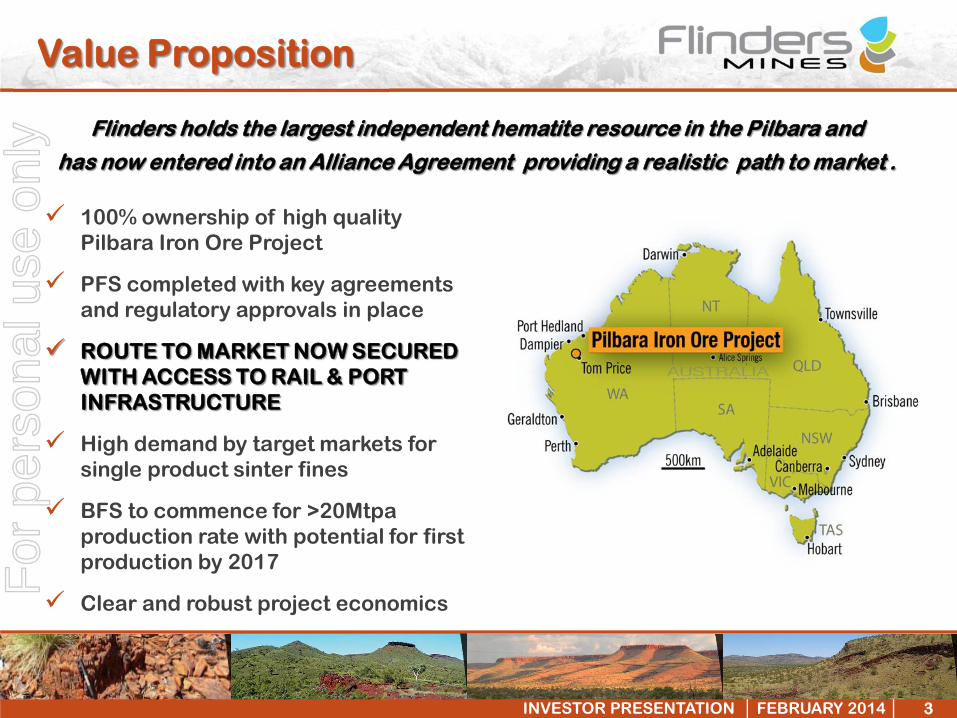
Value Proposition
Flinders holds the largest independent hematite resource in the Pilbara and
has now entered into an Alliance Agreement providing a realistic path to market .
100% ownership of high quality Pilbara Iron Ore Project
PFS completed with key agreements and regulatory approvals in place
ROUTE TO MARKET NOW SECURED WITH ACCESS TO RAIL & PORT INFRASTRUCTURE
High demand by target markets for single product sinter fines
BFS to commence for >20Mtpa production rate with potential for first production by 2017
Clear and robust project economics
For
per
sona
l use
onl
y
4INVESTOR PRESENTATION │ FEBRUARY 2014 │
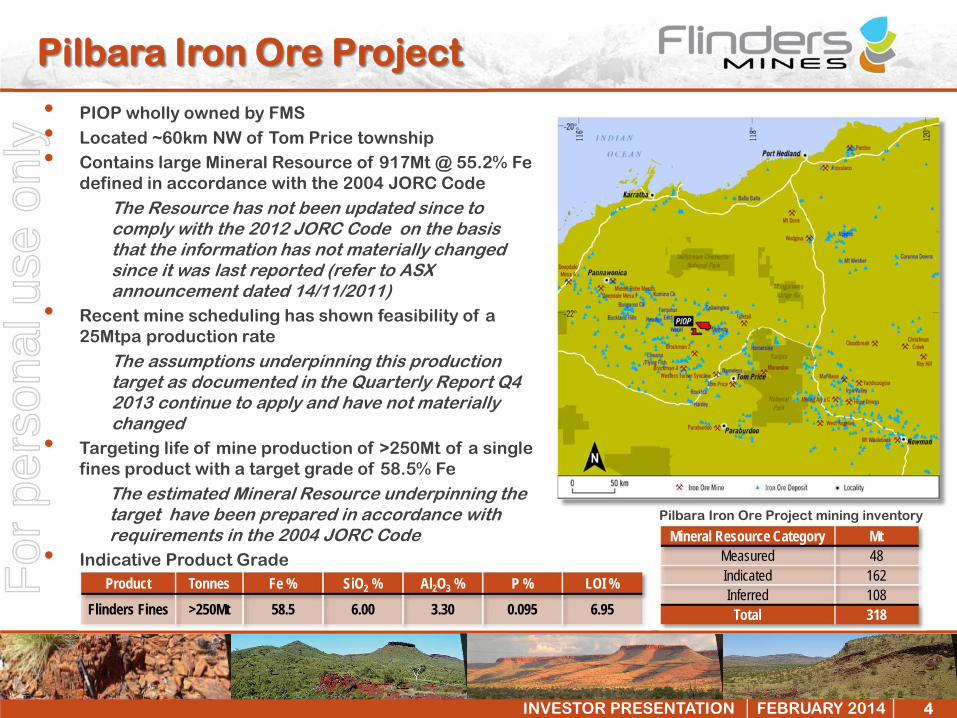
Product Tonnes Fe % SiO2 % Al2O3 % P % LOI %Flinders Fines >250Mt 58.5 6.00 3.30 0.095 6.95
• PIOP wholly owned by FMS• Located ~60km NW of Tom Price township• Contains large Mineral Resource of 917Mt @ 55.2% Fe
defined in accordance with the 2004 JORC CodeThe Resource has not been updated since to comply with the 2012 JORC Code on the basis that the information has not materially changed since it was last reported (refer to ASX announcement dated 14/11/2011)
• Recent mine scheduling has shown feasibility of a 25Mtpa production rate
The assumptions underpinning this production target as documented in the Quarterly Report Q4 2013 continue to apply and have not materially changed
• Targeting life of mine production of >250Mt of a single fines product with a target grade of 58.5% Fe
The estimated Mineral Resource underpinning the target have been prepared in accordance with requirements in the 2004 JORC Code
• Indicative Product Grade
Pilbara Iron Ore Project
Mineral Resource Category MtMeasured 48Indicated 162Inferred 108
Total 318
Pilbara Iron Ore Project mining inventory
For
per
sona
l use
onl
y
5INVESTOR PRESENTATION │ FEBRUARY 2014 │
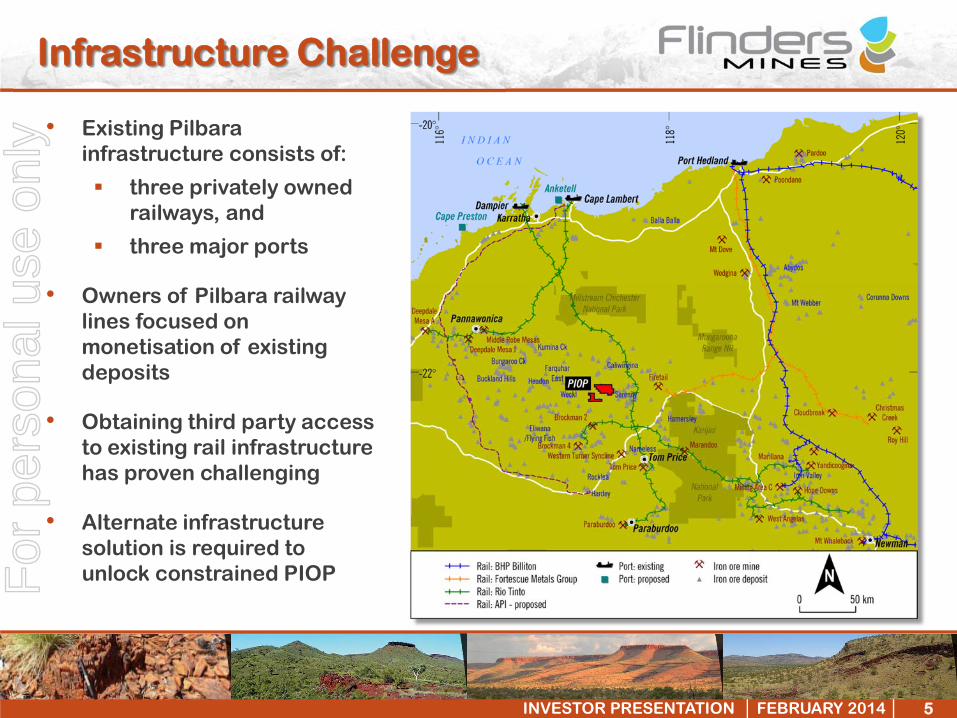
Infrastructure Challenge
• Existing Pilbara infrastructure consists of:
three privately owned railways, and
three major ports
• Owners of Pilbara railway lines focused on monetisation of existing deposits
• Obtaining third party access to existing rail infrastructure has proven challenging
• Alternate infrastructure solution is required to unlock constrained PIOP F
or p
erso
nal u
se o
nly
6INVESTOR PRESENTATION │ FEBRUARY 2014 │
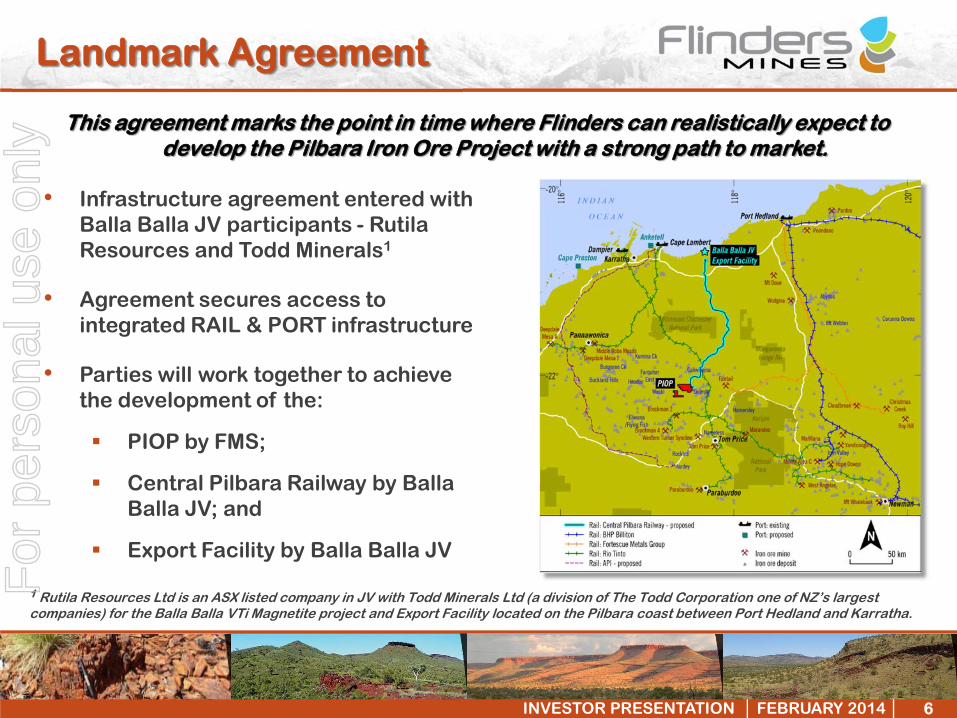
Landmark Agreement
This agreement marks the point in time where Flinders can realistically expect to develop the Pilbara Iron Ore Project with a strong path to market.
• Infrastructure agreement entered with Balla Balla JV participants - RutilaResources and Todd Minerals1
• Agreement secures access to integrated RAIL & PORT infrastructure
• Parties will work together to achieve the development of the:
PIOP by FMS;
Central Pilbara Railway by BallaBalla JV; and
Export Facility by Balla Balla JV
1 Rutila Resources Ltd is an ASX listed company in JV with Todd Minerals Ltd (a division of The Todd Corporation one of NZ’s largest companies) for the Balla Balla VTi Magnetite project and Export Facility located on the Pilbara coast between Port Hedland and Karratha.
For
per
sona
l use
onl
y
7INVESTOR PRESENTATION │ FEBRUARY 2014 │
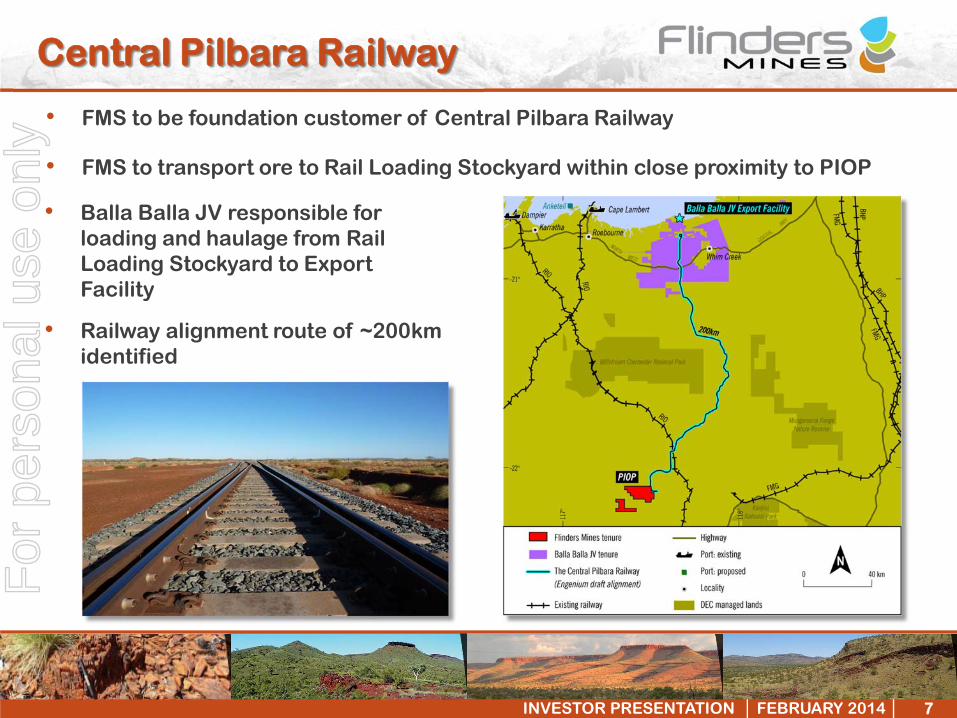
Central Pilbara Railway
• FMS to be foundation customer of Central Pilbara Railway
• FMS to transport ore to Rail Loading Stockyard within close proximity to PIOP
• Balla Balla JV responsible for loading and haulage from Rail Loading Stockyard to Export Facility
• Railway alignment route of ~200km identified
For
per
sona
l use
onl
y
8INVESTOR PRESENTATION │ FEBRUARY 2014 │
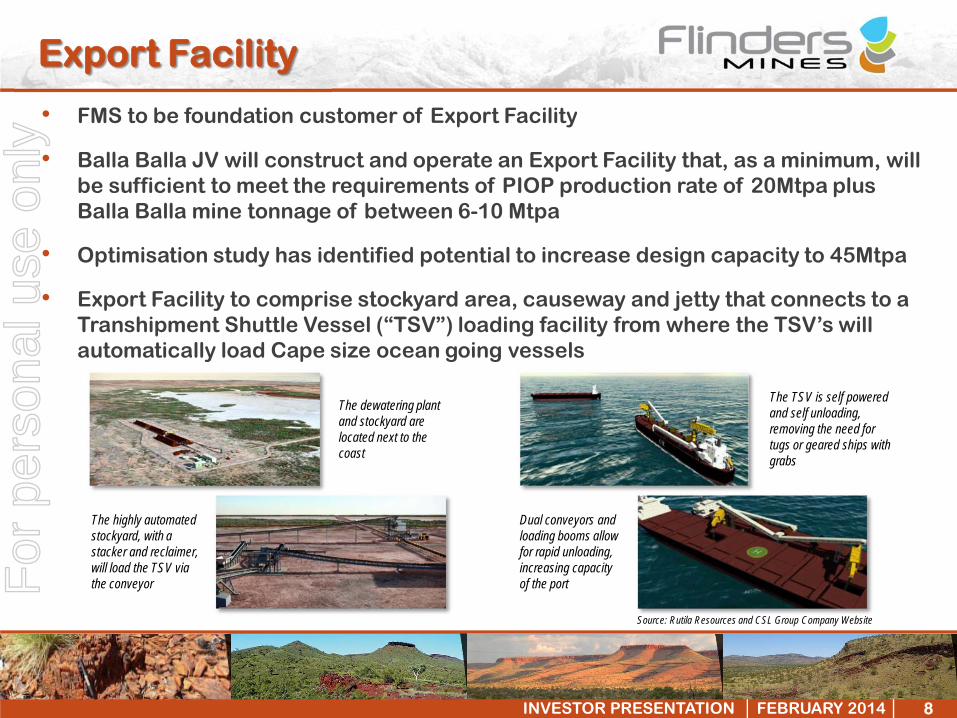
Export Facility
• FMS to be foundation customer of Export Facility
• Balla Balla JV will construct and operate an Export Facility that, as a minimum, will be sufficient to meet the requirements of PIOP production rate of 20Mtpa plus Balla Balla mine tonnage of between 6-10 Mtpa
• Optimisation study has identified potential to increase design capacity to 45Mtpa
• Export Facility to comprise stockyard area, causeway and jetty that connects to a Transhipment Shuttle Vessel (“TSV”) loading facility from where the TSV’s will automatically load Cape size ocean going vessels
The dewatering plant and stockyard are located next to the coast
The highly automated stockyard, with a stacker and reclaimer, will load the TSV via the conveyor
The TSV is self powered and self unloading, removing the need for tugs or geared ships with grabs
Dual conveyors and loading booms allow for rapid unloading, increasing capacity of the port
Source: Rutila Resources and CSL Group Company Website
For
per
sona
l use
onl
y
9INVESTOR PRESENTATION │ FEBRUARY 2014 │
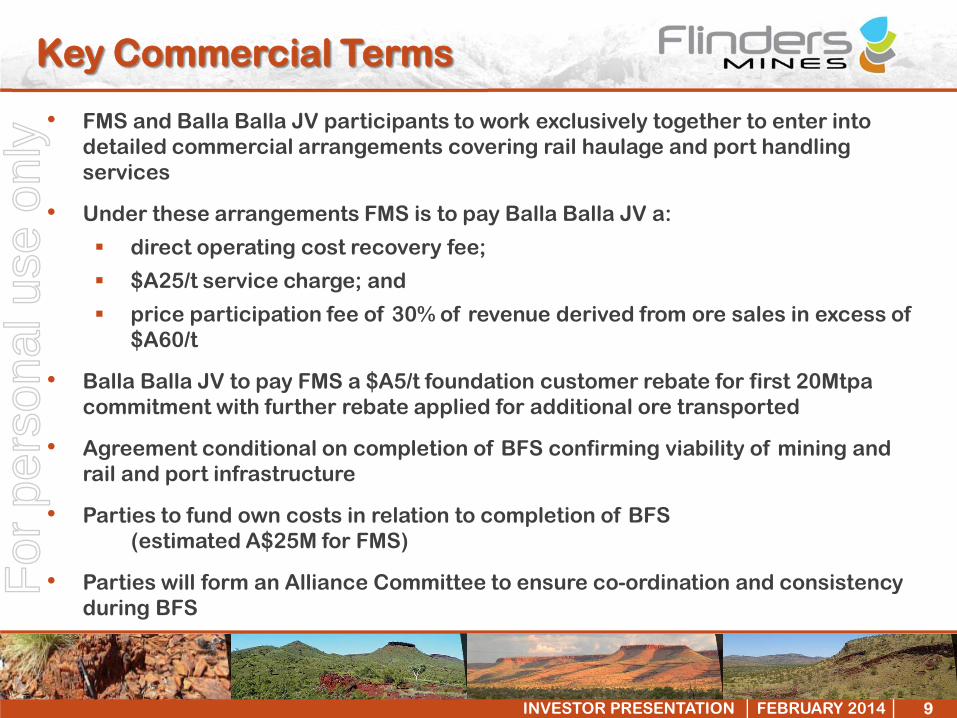
Key Commercial Terms
• FMS and Balla Balla JV participants to work exclusively together to enter into detailed commercial arrangements covering rail haulage and port handling services
• Under these arrangements FMS is to pay Balla Balla JV a:
direct operating cost recovery fee;
$A25/t service charge; and
price participation fee of 30% of revenue derived from ore sales in excess of $A60/t
• Balla Balla JV to pay FMS a $A5/t foundation customer rebate for first 20Mtpa commitment with further rebate applied for additional ore transported
• Agreement conditional on completion of BFS confirming viability of mining and rail and port infrastructure
• Parties to fund own costs in relation to completion of BFS(estimated A$25M for FMS)
• Parties will form an Alliance Committee to ensure co-ordination and consistency during BFS
For
per
sona
l use
onl
y
10INVESTOR PRESENTATION │ FEBRUARY 2014 │
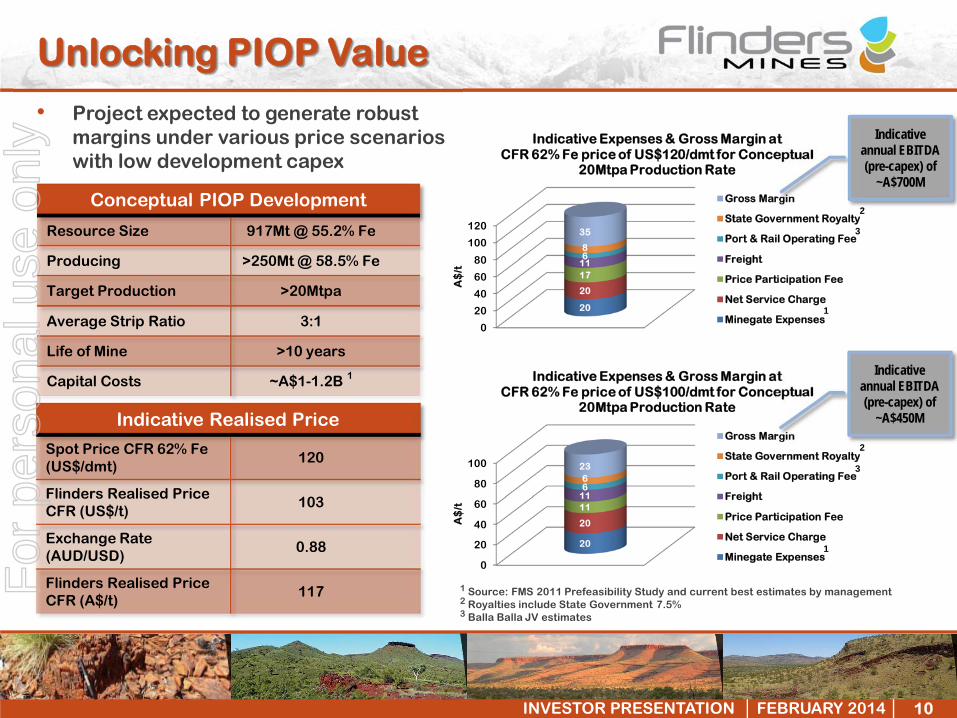
0
20
40
60
80
100
20
20
111166
23A
$/t
Indicative Expenses & Gross Margin at CFR 62% Fe price of US$100/dmt for Conceptual
20Mtpa Production Rate
Gross Margin
State Government Royalty
Port & Rail Operating Fee
Freight
Price Participation Fee
Net Service Charge
Minegate Expenses
0
20
40
60
80
100
120
20
20
171168
35
A$
/t
Indicative Expenses & Gross Margin at CFR 62% Fe price of US$120/dmt for Conceptual
20Mtpa Production Rate
Gross Margin
State Government Royalty
Port & Rail Operating Fee
Freight
Price Participation Fee
Net Service Charge
Minegate Expenses
Unlocking PIOP Value
• Project expected to generate robust margins under various price scenarios with low development capex
Conceptual PIOP Development
Resource Size 917Mt @ 55.2% Fe
Producing >250Mt @ 58.5% Fe
Target Production >20Mtpa
Average Strip Ratio 3:1
Life of Mine >10 years
Capital Costs ~A$1-1.2B 1
Indicative Realised Price
Spot Price CFR 62% Fe (US$/dmt)
120
Flinders Realised Price CFR (US$/t)
103
Exchange Rate (AUD/USD)
0.88
Flinders Realised Price CFR (A$/t)
117 1 Source: FMS 2011 Prefeasibility Study and current best estimates by management 2 Royalties include State Government 7.5% 3 Balla Balla JV estimates
1
1
2
2
3
3
Indicative annual EBITDA (pre-capex) of
~A$700M
Indicative annual EBITDA (pre-capex) of
~A$450M
For
per
sona
l use
onl
y
11INVESTOR PRESENTATION │ FEBRUARY 2014 │
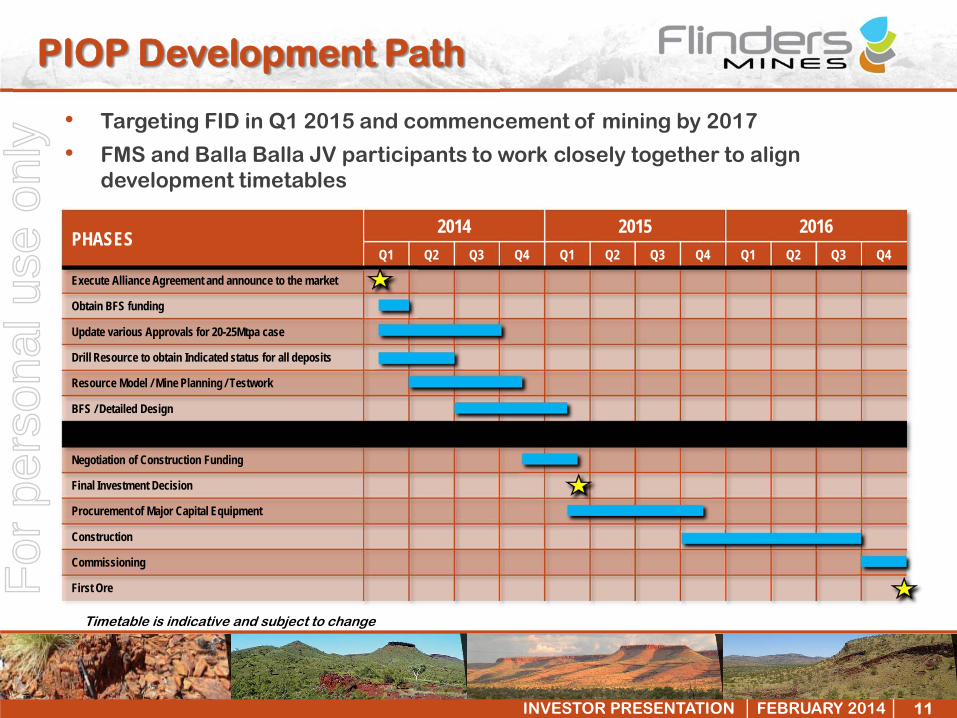
PIOP Development Path
Timetable is indicative and subject to change
PHASES 2014 2015 2016Q1 Q2 Q3 Q4 Q1 Q2 Q3 Q4 Q1 Q2 Q3 Q4
Execute Alliance Agreement and announce to the market
Obtain BFS funding
Update various Approvals for 20-25Mtpa case
Drill Resource to obtain Indicated status for all deposits
Resource Model / Mine Planning / Testwork
BFS / Detailed Design
Negotiation of Construction Funding
Final Investment Decision
Procurement of Major Capital Equipment
Construction
Commissioning
First Ore
• Targeting FID in Q1 2015 and commencement of mining by 2017
• FMS and Balla Balla JV participants to work closely together to align development timetables
For
per
sona
l use
onl
y
12INVESTOR PRESENTATION │ FEBRUARY 2014 │
Summary
FMS to be a foundation customer of a rail and port infrastructure solution in the Pilbara
Landmark agreement will deliver a route to market for the PIOP and other iron ore deposits in the central Pilbara Region
Targeting first ore production by 2017
PIOP has been significantly de-risked with key approvals in place
PIOP has exceptional project economics
Proven management team in place with expertise in project development
The arrangements entered break the deadlock Flinders has faced
in having stranded high quality assets without access to infrastructure.
For
per
sona
l use
onl
y
13INVESTOR PRESENTATION │ FEBRUARY 2014 │
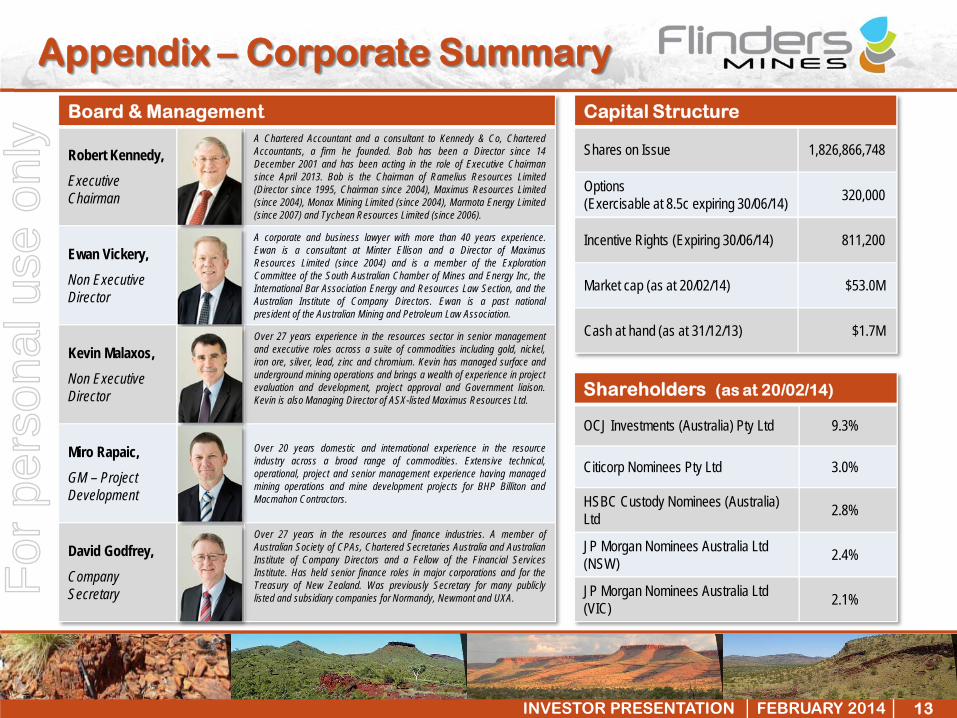
Board & Management
Robert Kennedy,Executive Chairman
A Chartered Accountant and a consultant to Kennedy & Co, CharteredAccountants, a firm he founded. Bob has been a Director since 14December 2001 and has been acting in the role of Executive Chairmansince April 2013. Bob is the Chairman of Ramelius Resources Limited(Director since 1995, Chairman since 2004), Maximus Resources Limited(since 2004), Monax Mining Limited (since 2004), Marmota Energy Limited(since 2007) and Tychean Resources Limited (since 2006).
Ewan Vickery, Non Executive Director
A corporate and business lawyer with more than 40 years experience.Ewan is a consultant at Minter Ellison and a Director of MaximusResources Limited (since 2004) and is a member of the ExplorationCommittee of the South Australian Chamber of Mines and Energy Inc, theInternational Bar Association Energy and Resources Law Section, and theAustralian Institute of Company Directors. Ewan is a past nationalpresident of the Australian Mining and Petroleum Law Association.
Kevin Malaxos, Non Executive Director
Over 27 years experience in the resources sector in senior managementand executive roles across a suite of commodities including gold, nickel,iron ore, silver, lead, zinc and chromium. Kevin has managed surface andunderground mining operations and brings a wealth of experience in projectevaluation and development, project approval and Government liaison.Kevin is also Managing Director of ASX-listed Maximus Resources Ltd.
Miro Rapaic, GM – Project Development
Over 20 years domestic and international experience in the resourceindustry across a broad range of commodities. Extensive technical,operational, project and senior management experience having managedmining operations and mine development projects for BHP Billiton andMacmahon Contractors.
David Godfrey, Company Secretary
Over 27 years in the resources and finance industries. A member ofAustralian Society of CPAs, Chartered Secretaries Australia and AustralianInstitute of Company Directors and a Fellow of the Financial ServicesInstitute. Has held senior finance roles in major corporations and for theTreasury of New Zealand. Was previously Secretary for many publiclylisted and subsidiary companies for Normandy, Newmont and UXA.
Appendix – Corporate SummaryCapital Structure
Shares on Issue 1,826,866,748
Options(Exercisable at 8.5c expiring 30/06/14) 320,000
Incentive Rights (Expiring 30/06/14) 811,200
Market cap (as at 20/02/14) $53.0M
Cash at hand (as at 31/12/13) $1.7M
Shareholders (as at 20/02/14)
OCJ Investments (Australia) Pty Ltd 9.3%
Citicorp Nominees Pty Ltd 3.0%
HSBC Custody Nominees (Australia) Ltd 2.8%
JP Morgan Nominees Australia Ltd (NSW) 2.4%
JP Morgan Nominees Australia Ltd (VIC) 2.1%F
or p
erso
nal u
se o
nly
14INVESTOR PRESENTATION │ FEBRUARY 2014 │
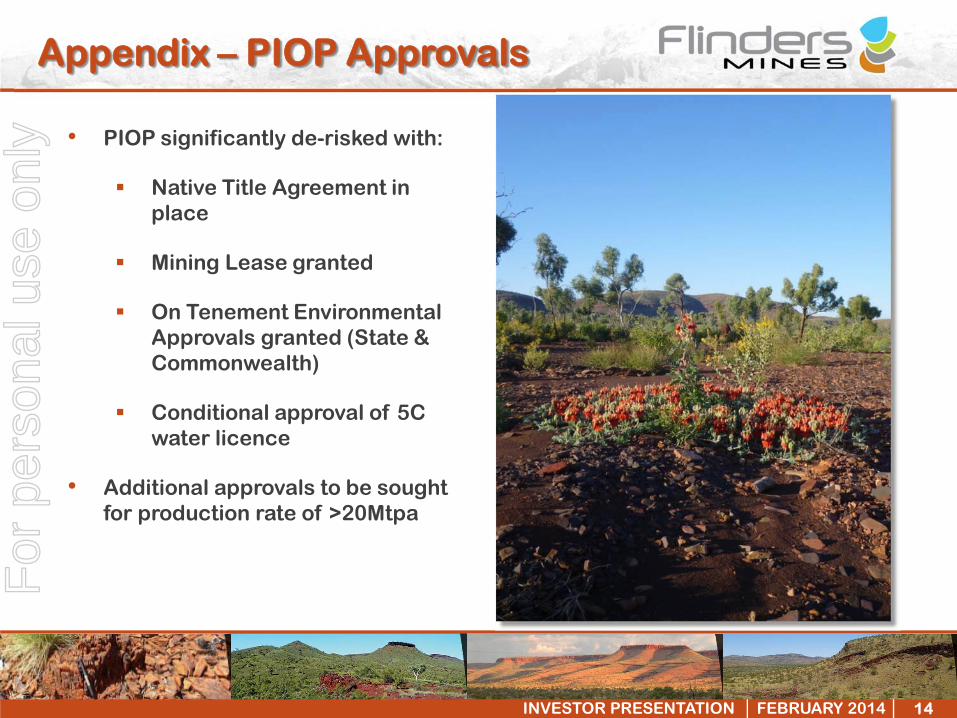
Appendix – PIOP Approvals
• PIOP significantly de-risked with:
Native Title Agreement in place
Mining Lease granted
On Tenement Environmental Approvals granted (State & Commonwealth)
Conditional approval of 5C water licence
• Additional approvals to be sought for production rate of >20Mtpa
For
per
sona
l use
onl
y
15INVESTOR PRESENTATION │ FEBRUARY 2014 │
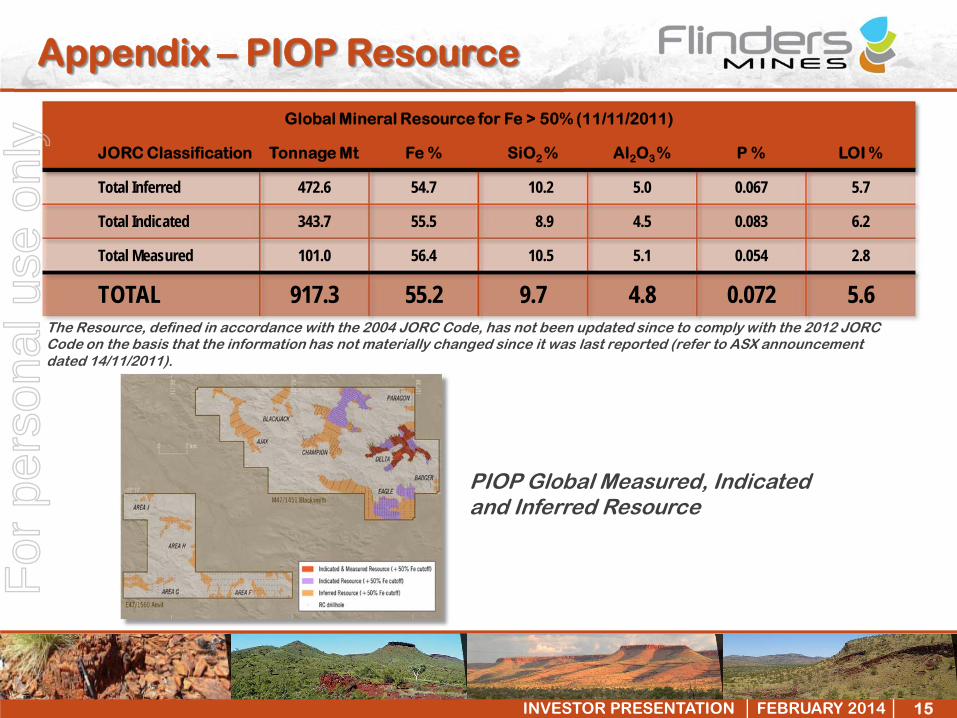
Appendix – PIOP Resource
Global Mineral Resource for Fe > 50% (11/11/2011)
JORC Classification Tonnage Mt Fe % SiO2 % Al2O3 % P % LOI %
Total Inferred 472.6 54.7 10.2 5.0 0.067 5.7
Total Indicated 343.7 55.5 8.9 4.5 0.083 6.2
Total Measured 101.0 56.4 10.5 5.1 0.054 2.8
TOTAL 917.3 55.2 9.7 4.8 0.072 5.6The Resource, defined in accordance with the 2004 JORC Code, has not been updated since to comply with the 2012 JORC Code on the basis that the information has not materially changed since it was last reported (refer to ASX announcement dated 14/11/2011).
PIOP Global Measured, Indicatedand Inferred Resource
For
per
sona
l use
onl
y
16INVESTOR PRESENTATION │ FEBRUARY 2014 │
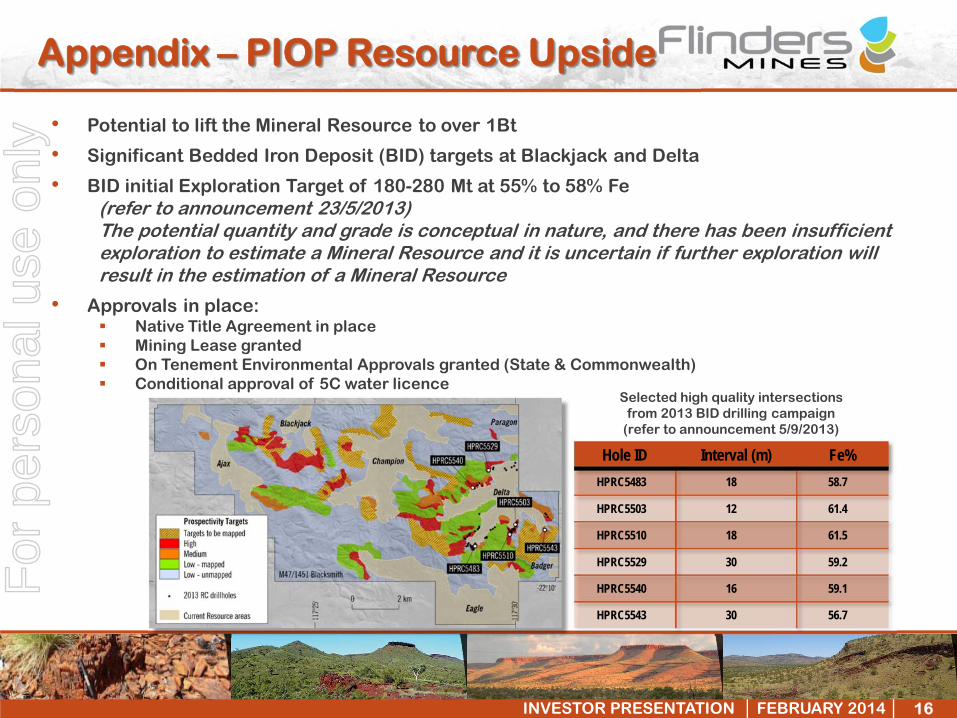
Appendix – PIOP Resource Upside
• Potential to lift the Mineral Resource to over 1Bt
• Significant Bedded Iron Deposit (BID) targets at Blackjack and Delta
• BID initial Exploration Target of 180-280 Mt at 55% to 58% Fe(refer to announcement 23/5/2013) The potential quantity and grade is conceptual in nature, and there has been insufficient exploration to estimate a Mineral Resource and it is uncertain if further exploration will result in the estimation of a Mineral Resource
• Approvals in place: Native Title Agreement in place Mining Lease granted On Tenement Environmental Approvals granted (State & Commonwealth) Conditional approval of 5C water licence
Selected high quality intersectionsfrom 2013 BID drilling campaign
(refer to announcement 5/9/2013)
Hole ID Interval (m) Fe%HPRC5483 18 58.7
HPRC5503 12 61.4
HPRC5510 18 61.5
HPRC5529 30 59.2
HPRC5540 16 59.1
HPRC5543 30 56.7
For
per
sona
l use
onl
y

17INVESTOR PRESENTATION │ FEBRUARY 2014 │
Contact Information
Head Office
Level 1, 136 Frome Street
Adelaide, South Australia 5000
Telephone (08) 8132 7950
Facsimile (08) 8132 7999
Email: [email protected]
Web: www.flindersmines.com
Not an asset of the Company
For
per
sona
l use
onl
y


![2013A股推介材料 CH 20140226.final.ppt [兼容模式]](https://img.pdfslide.net/doc/110x75/61cfb1bcf84244109077135b/2013a-ch-.jpg)