Embed Size (px)
Citation preview
FONTERRA STRATEGY REFRESH& 2012 INTERIM RESULTS
Fonterra Co-operative Group Ltd
29 March 2012
Page 2Fonterra Co-operative Group Ltd
OVERVIEW• 2012 INTERIM RESULTS• STRATEGY REFRESH• QUESTIONS & ANSWERS
SIR HENRY VAN DER HEYDEN
Fonterra Co-operative Group Ltd
Page 4Fonterra Co-operative Group Ltd
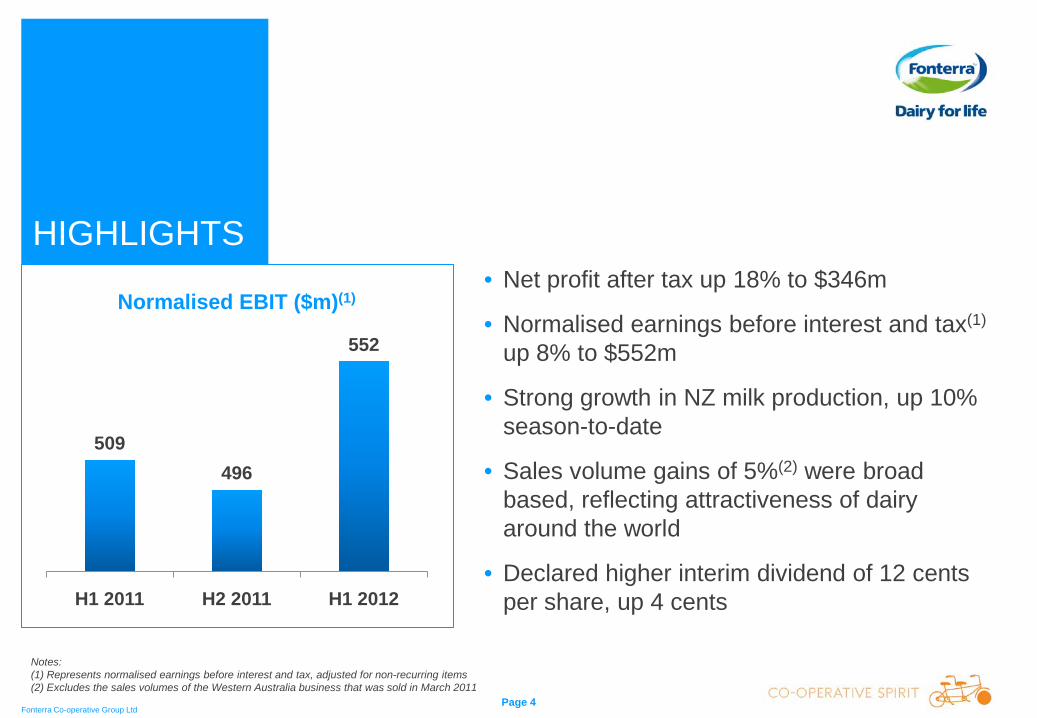
HIGHLIGHTS• Net profit after tax up 18% to $346m
• Normalised earnings before interest and tax(1)
up 8% to $552m
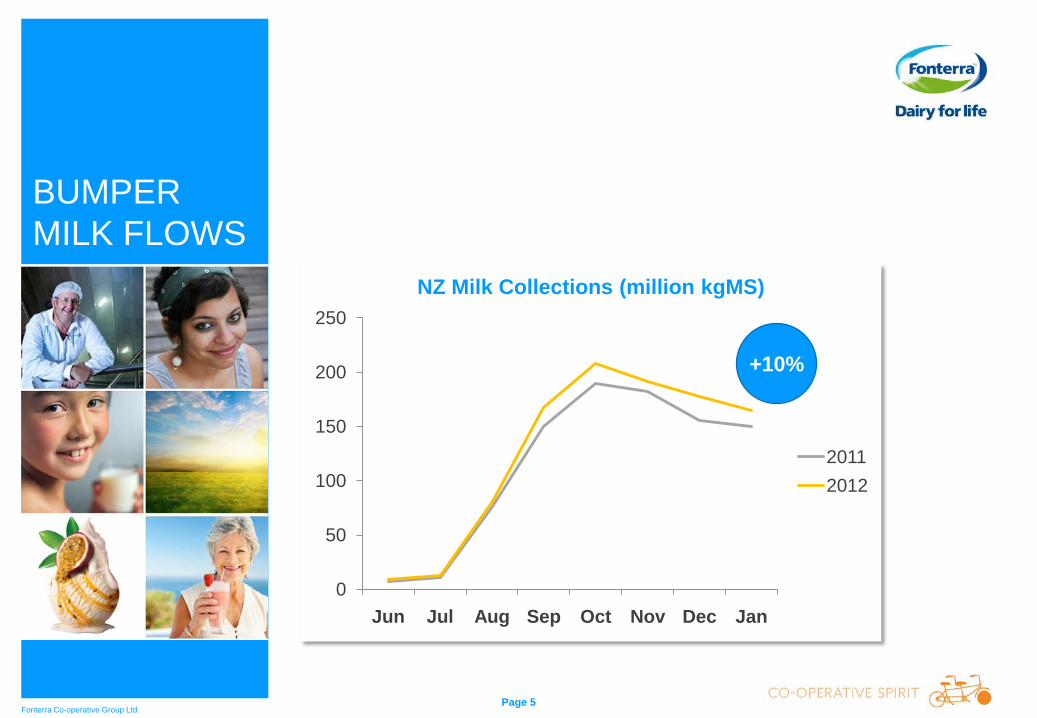
• Strong growth in NZ milk production, up 10% season-to-date
• Sales volume gains of 5%(2) were broad based, reflecting attractiveness of dairy around the world
• Declared higher interim dividend of 12 cents per share, up 4 cents
Notes:(1) Represents normalised earnings before interest and tax, adjusted for non-recurring items(2) Excludes the sales volumes of the Western Australia business that was sold in March 2011
509496
552
H1 2011 H2 2011 H1 2012
Normalised EBIT ($m)(1)
Page 5Fonterra Co-operative Group Ltd
BUMPER MILK FLOWS
0
50
100
150
200
250
Jun Jul Aug Sep Oct Nov Dec Jan
NZ Milk Collections (million kgMS)
20112012
+10%
Page 6Fonterra Co-operative Group Ltd
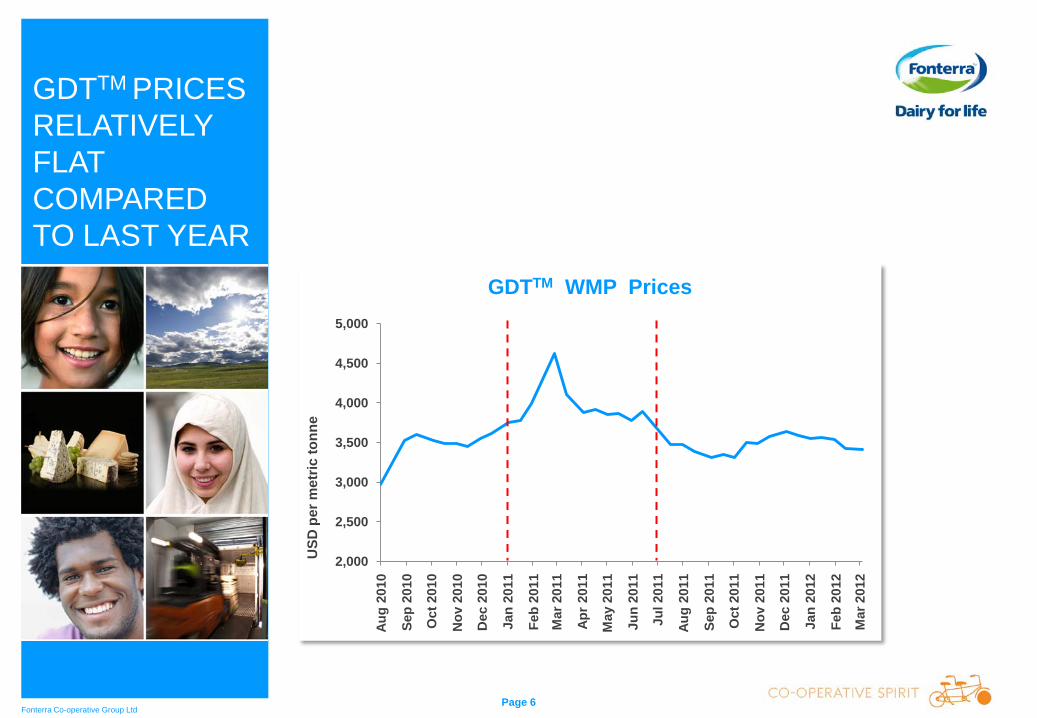
2,000
2,500
3,000
3,500
4,000
4,500
5,000
Aug
2010
Sep
2010
Oct
201
0
Nov
201
0
Dec
201
0
Jan
2011
Feb
2011
Mar
201
1
Apr
2011
May
201
1
Jun
2011
Jul 2
011
Aug
2011
Sep
2011
Oct
201
1
Nov
201
1
Dec
201
1
Jan
2012
Feb
2012
Mar
201
2
GDTTM WMP Prices
GDTTM PRICES RELATIVELY FLAT COMPARED TO LAST YEAR
USD
per
met
ric to
nne
Page 7Fonterra Co-operative Group Ltd
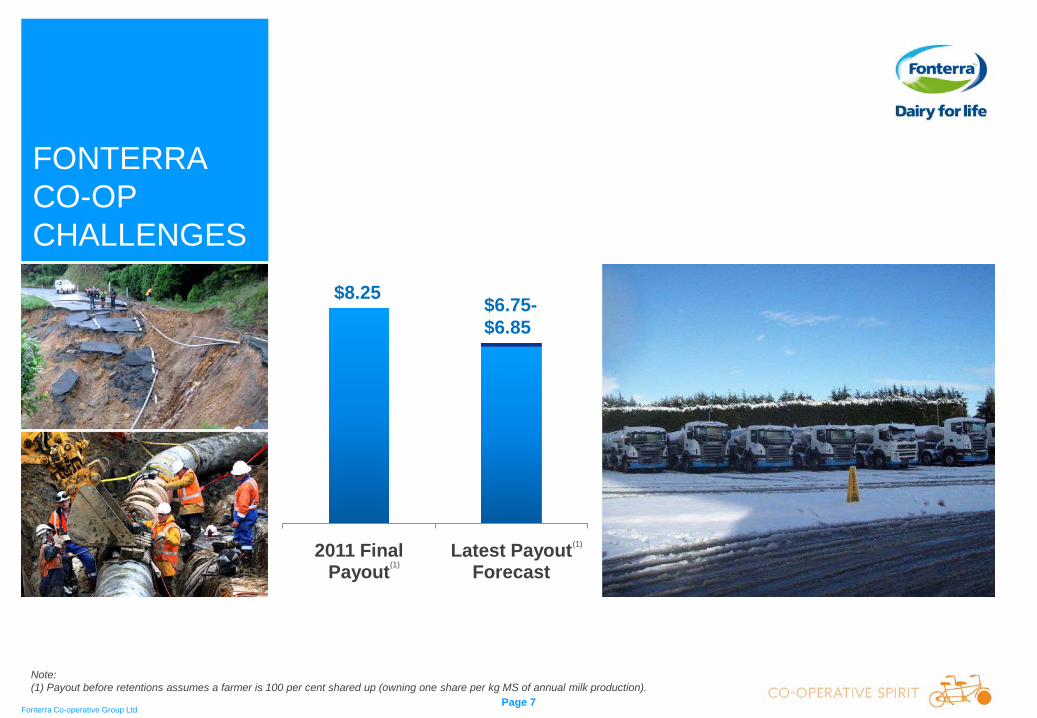
FONTERRACO-OP CHALLENGES
2011 Final Payout
Latest Payout Forecast(1)
$8.25 $6.75-$6.85
Note:(1) Payout before retentions assumes a farmer is 100 per cent shared up (owning one share per kg MS of annual milk production).
(1)

THEO SPIERINGS
Fonterra Co-operative Group Ltd
Page 9Fonterra Co-operative Group Ltd
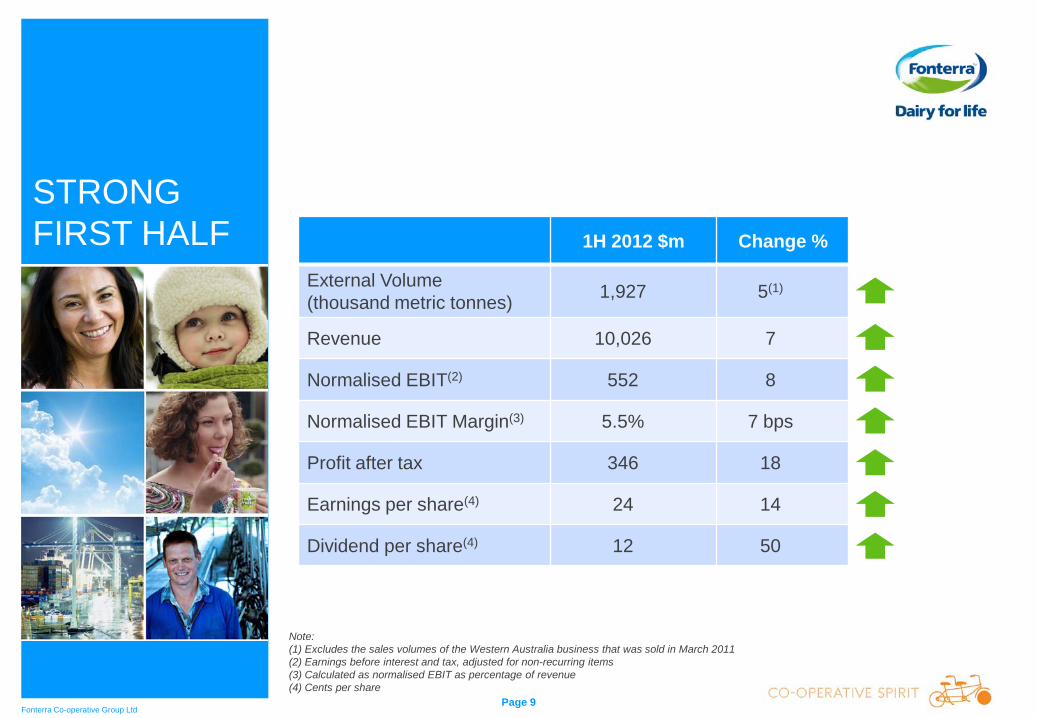
STRONG FIRST HALF 1H 2012 $m Change %
External Volume(thousand metric tonnes) 1,927 5(1)
Revenue 10,026 7
Normalised EBIT(2) 552 8
Normalised EBIT Margin(3) 5.5% 7 bps
Profit after tax 346 18
Earnings per share(4) 24 14
Dividend per share(4) 12 50
Note:(1) Excludes the sales volumes of the Western Australia business that was sold in March 2011(2) Earnings before interest and tax, adjusted for non-recurring items(3) Calculated as normalised EBIT as percentage of revenue(4) Cents per share
Page 10Fonterra Co-operative Group Ltd
KEY DRIVERS
• Solid growth in total sales volume • Improved margins in Standard & Premium
Ingredients• ANZ impacted by challenging trading conditions• Stronger NZD had negative impact on earnings
of our Asia/AME & Latam operations
Page 11Fonterra Co-operative Group Ltd
OUTLOOK• Stronger global milk production expected in
2012• Milk powder demand appears robust but dairy
commodity prices likely to remain under some pressure through to mid 2012
• Forecast Farmgate Milk Price of $6.35 per kgMS and net profit after tax guidance of 40-50 cents per share equating to $570-$720 million
Page 12Fonterra Co-operative Group Ltd
MILK FOR SCHOOLS
• Launched Fonterra Milk for Schools programme
• Northland pilot – 112 schools, 10,000 children
• Test systems and processes• Decision in term 3 on national
roll out

JONATHAN MASON
Fonterra Co-operative Group Ltd
Page 14Fonterra Co-operative Group Ltd
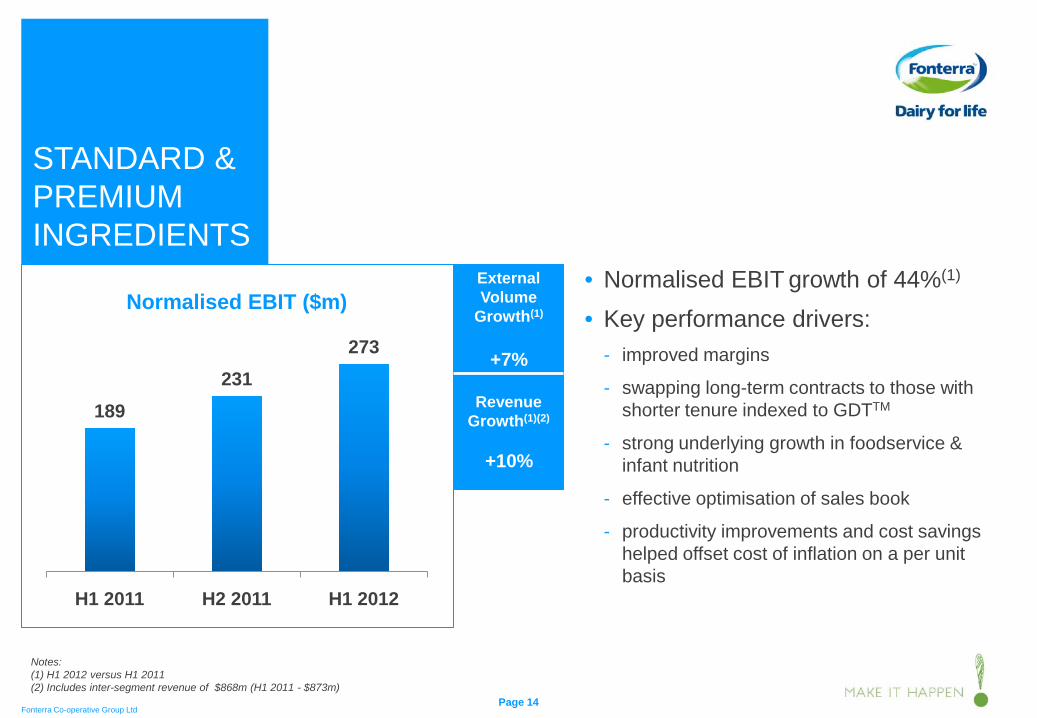
STANDARD & PREMIUM INGREDIENTS
• Normalised EBIT growth of 44%(1)
• Key performance drivers:- improved margins
- swapping long-term contracts to those with shorter tenure indexed to GDTTM
- strong underlying growth in foodservice & infant nutrition
- effective optimisation of sales book
- productivity improvements and cost savings helped offset cost of inflation on a per unit basis
External Volume
Growth(1)
+7%
Revenue Growth(1)(2)
+10%
Notes:(1) H1 2012 versus H1 2011(2) Includes inter-segment revenue of $868m (H1 2011 - $873m)
189231
273
H1 2011 H2 2011 H1 2012
Normalised EBIT ($m)
Page 15Fonterra Co-operative Group Ltd
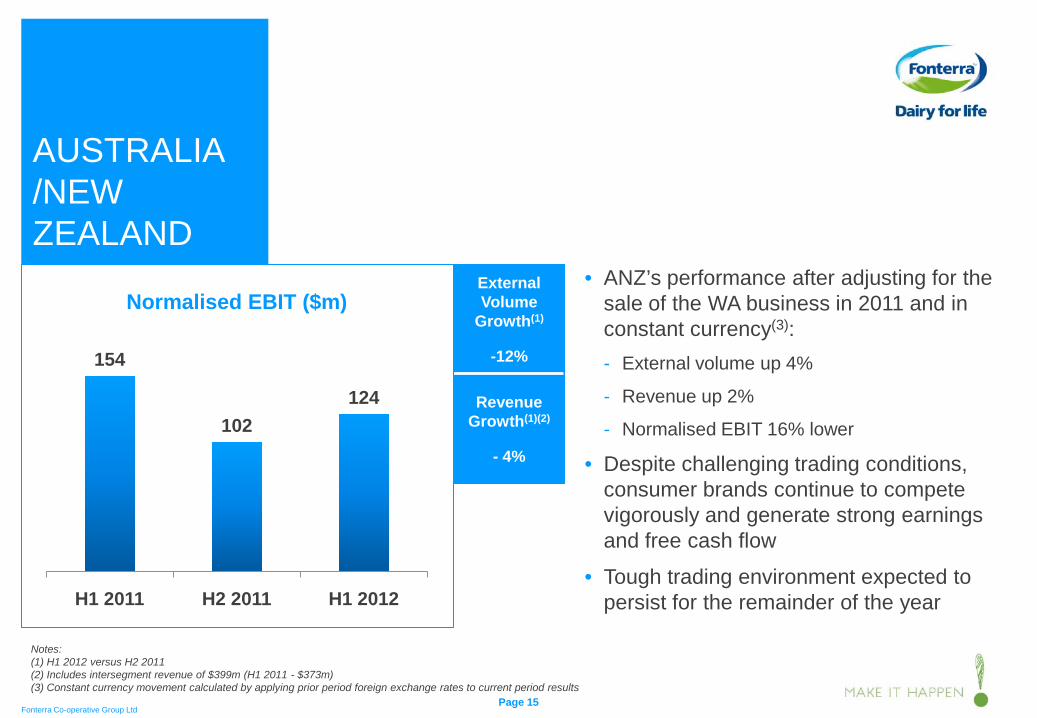
AUSTRALIA /NEW ZEALAND
• ANZ’s performance after adjusting for the sale of the WA business in 2011 and in constant currency(3):- External volume up 4%
- Revenue up 2%
- Normalised EBIT 16% lower
• Despite challenging trading conditions, consumer brands continue to compete vigorously and generate strong earnings and free cash flow
• Tough trading environment expected to persist for the remainder of the year
External Volume
Growth(1)
-12%
Revenue Growth(1)(2)
- 4%
Notes:(1) H1 2012 versus H2 2011(2) Includes intersegment revenue of $399m (H1 2011 - $373m)(3) Constant currency movement calculated by applying prior period foreign exchange rates to current period results
154
102124
H1 2011 H2 2011 H1 2012
Normalised EBIT ($m)
Page 16Fonterra Co-operative Group Ltd
Notes:(1) H1 2012 versus H2 2011(2) Constant currency movement calculated by applying prior period foreign exchange rates to current period results
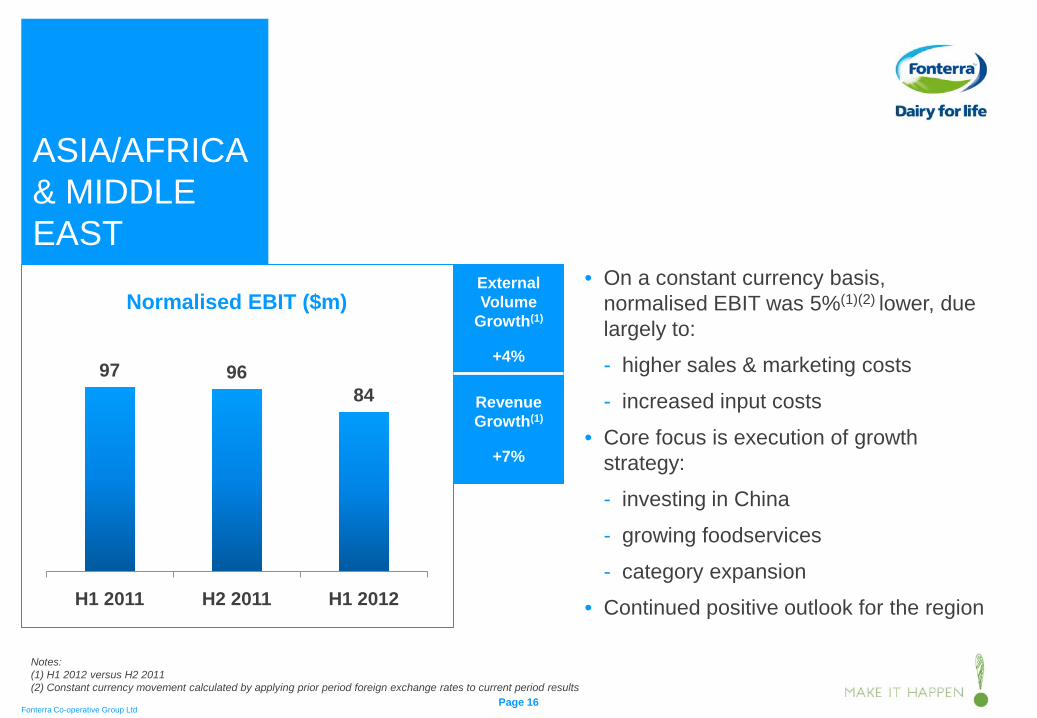
ASIA/AFRICA & MIDDLE EAST
• On a constant currency basis, normalised EBIT was 5%(1)(2) lower, due largely to:
- higher sales & marketing costs
- increased input costs
• Core focus is execution of growth strategy:
- investing in China
- growing foodservices
- category expansion
• Continued positive outlook for the region
External Volume
Growth(1)
+4%
Revenue Growth(1)
+7%
97 9684
H1 2011 H2 2011 H1 2012
Normalised EBIT ($m)
Page 17Fonterra Co-operative Group Ltd
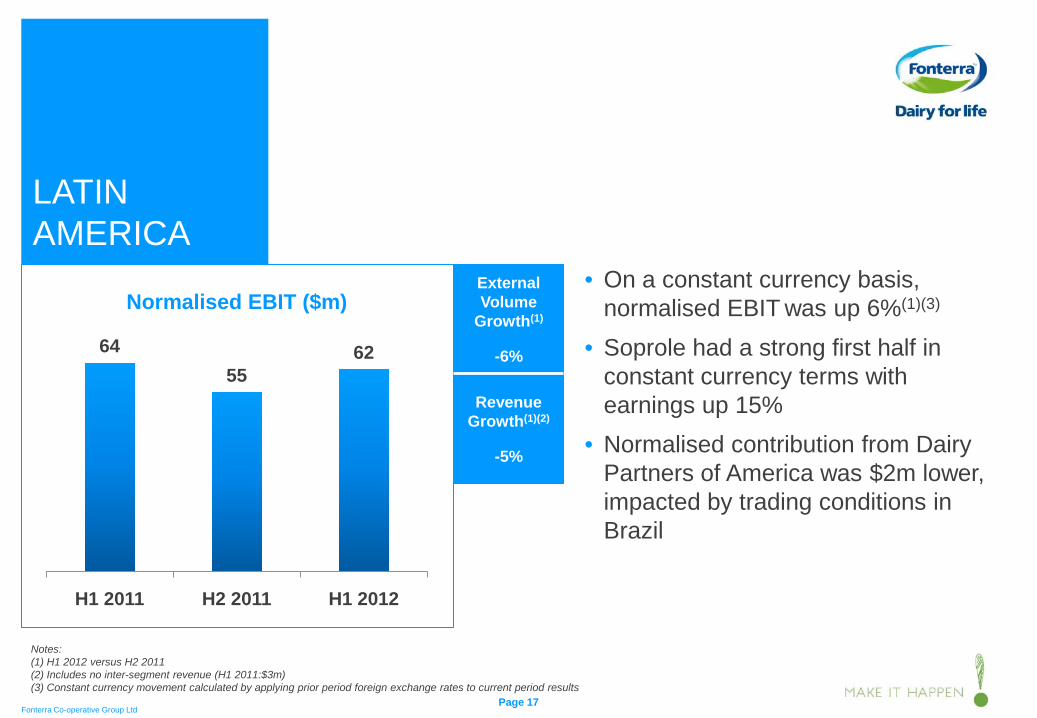
LATIN AMERICA
• On a constant currency basis, normalised EBIT was up 6%(1)(3)
• Soprole had a strong first half in constant currency terms with earnings up 15%
• Normalised contribution from Dairy Partners of America was $2m lower, impacted by trading conditions in Brazil
External Volume
Growth(1)
-6%
Revenue Growth(1)(2)
-5%
Notes:(1) H1 2012 versus H2 2011(2) Includes no inter-segment revenue (H1 2011:$3m)(3) Constant currency movement calculated by applying prior period foreign exchange rates to current period results
6455
62
H1 2011 H2 2011 H1 2012
Normalised EBIT ($m)
Page 18Fonterra Co-operative Group Ltd
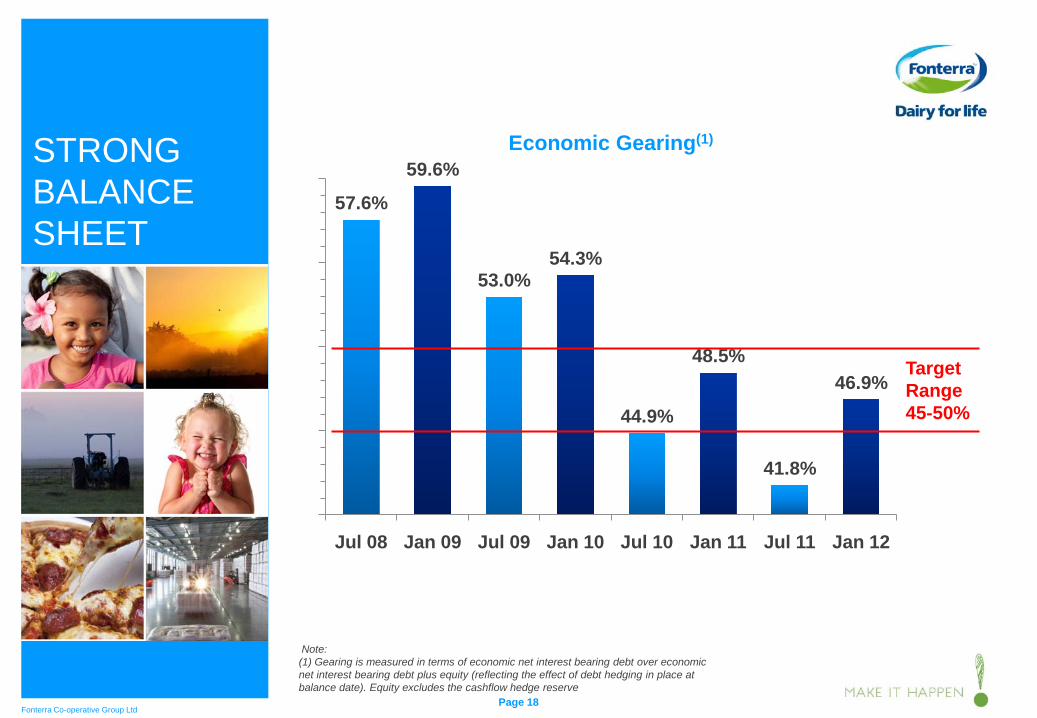
STRONG BALANCE SHEET
57.6%
59.6%
53.0%54.3%
44.9%
48.5%
41.8%
46.9%
Jul 08 Jan 09 Jul 09 Jan 10 Jul 10 Jan 11 Jul 11 Jan 12
Economic Gearing(1)
Target Range 45-50%
Note:(1) Gearing is measured in terms of economic net interest bearing debt over economic net interest bearing debt plus equity (reflecting the effect of debt hedging in place at balance date). Equity excludes the cashflow hedge reserve
Page 19Fonterra Co-operative Group Ltd
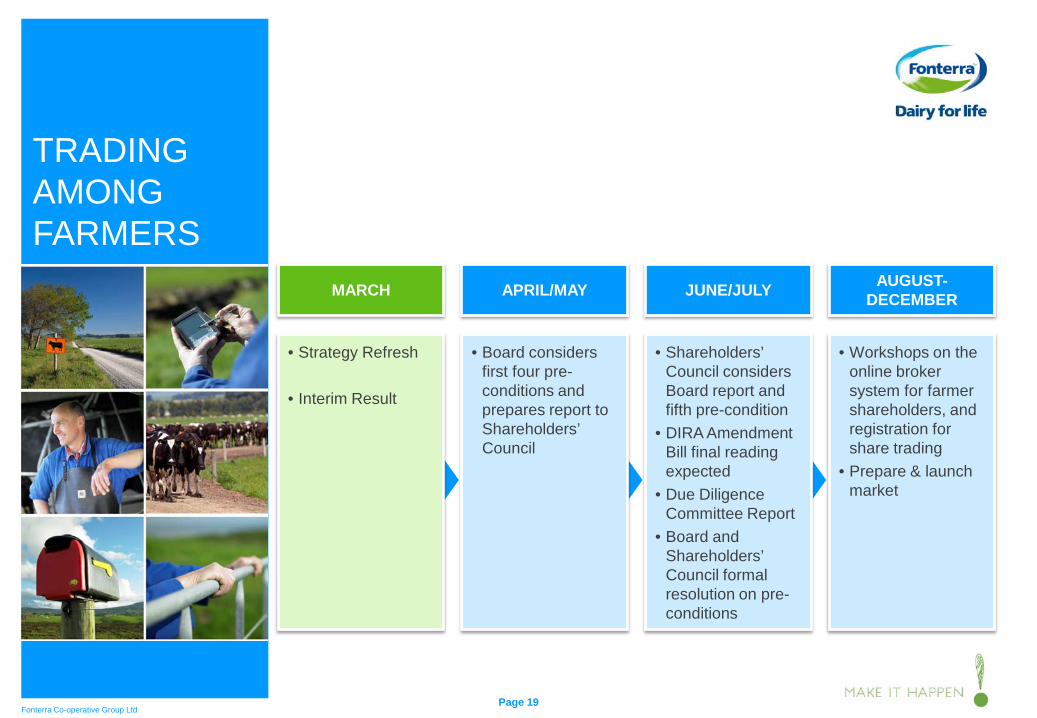
TRADING AMONG FARMERS
MARCH
• Strategy Refresh
• Interim Result
APRIL/MAY
• Board considers first four pre-conditions and prepares report to Shareholders’ Council
JUNE/JULY
• Shareholders’ Council considers Board report and fifth pre-condition
• DIRA Amendment Bill final reading expected
• Due Diligence Committee Report
• Board and Shareholders’ Council formal resolution on pre-conditions
AUGUST-DECEMBER
• Workshops on the online broker system for farmer shareholders, and registration for share trading
• Prepare & launch market
THEO SPIERINGS
Fonterra Co-operative Group Ltd
Page 21Fonterra Co-operative Group Ltd
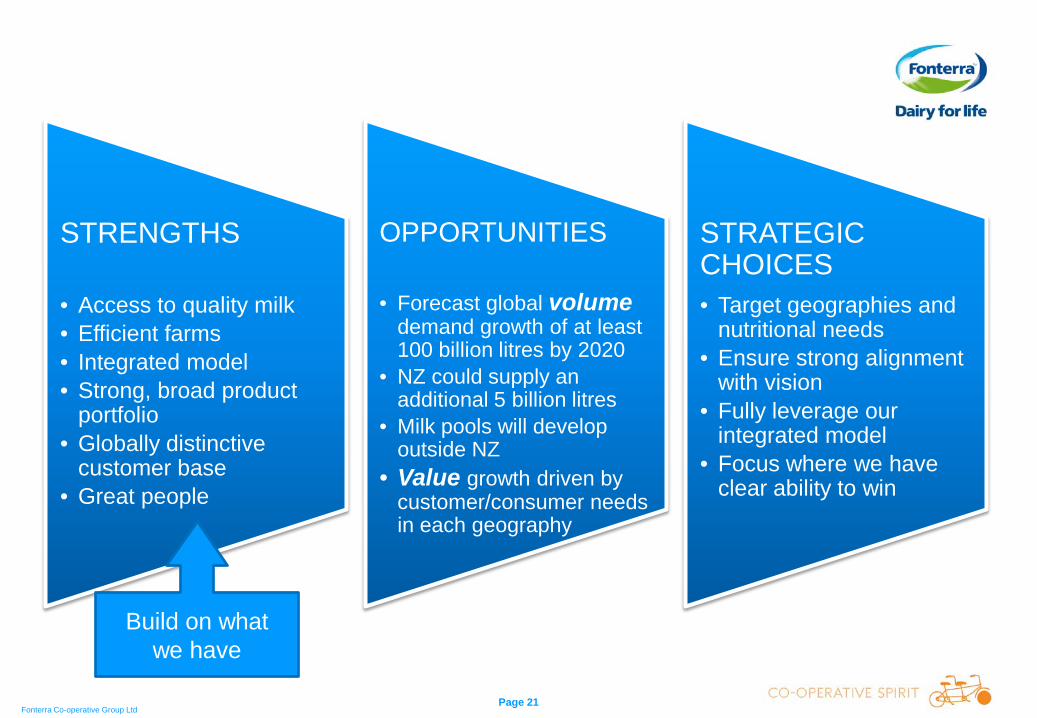
STRENGTHS
• Access to quality milk• Efficient farms• Integrated model• Strong, broad product
portfolio• Globally distinctive
customer base• Great people
OPPORTUNITIES
• Forecast global volumedemand growth of at least 100 billion litres by 2020
• NZ could supply an additional 5 billion litres
• Milk pools will develop outside NZ
• Value growth driven by customer/consumer needs in each geography
STRATEGIC CHOICES• Target geographies and
nutritional needs• Ensure strong alignment
with vision• Fully leverage our
integrated model• Focus where we have
clear ability to win
Build on what we have
Page 22Fonterra Co-operative Group Ltd
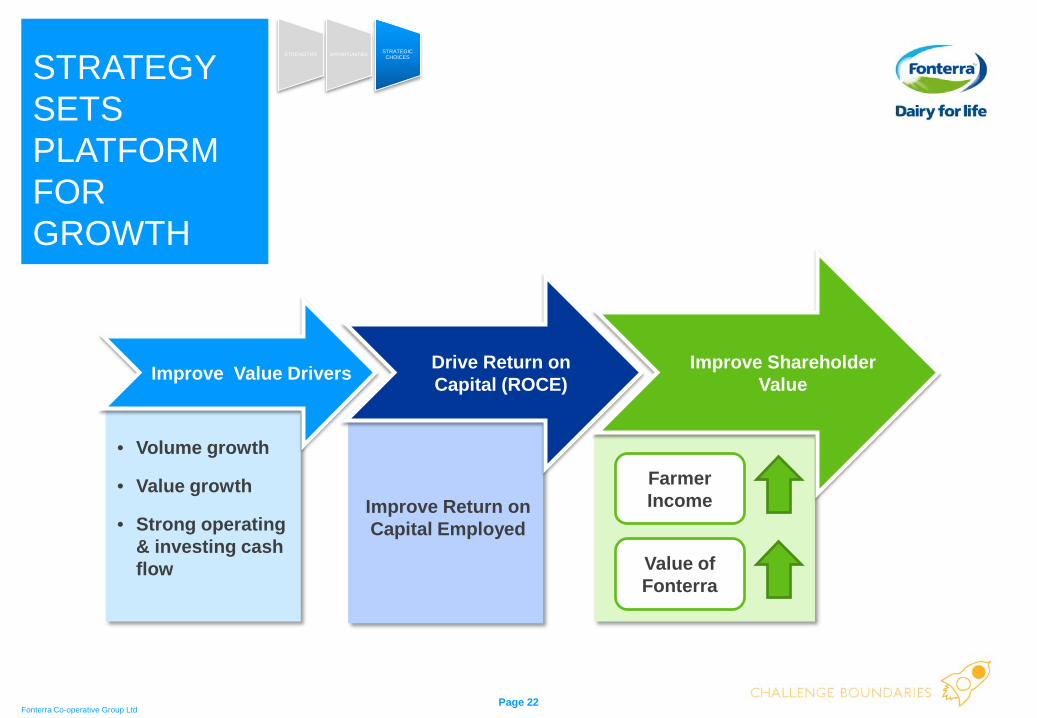
STRATEGY SETS PLATFORM FOR GROWTH
Improve Value Drivers Drive Return on Capital (ROCE)
Improve Shareholder Value
• Volume growth
• Value growth
• Strong operating & investing cash flow
Improve Return on Capital Employed
Farmer Income
STRENGTHS OPPORTUNITIES STRATEGIC CHOICES
Value of Fonterra
Page 23Fonterra Co-operative Group Ltd
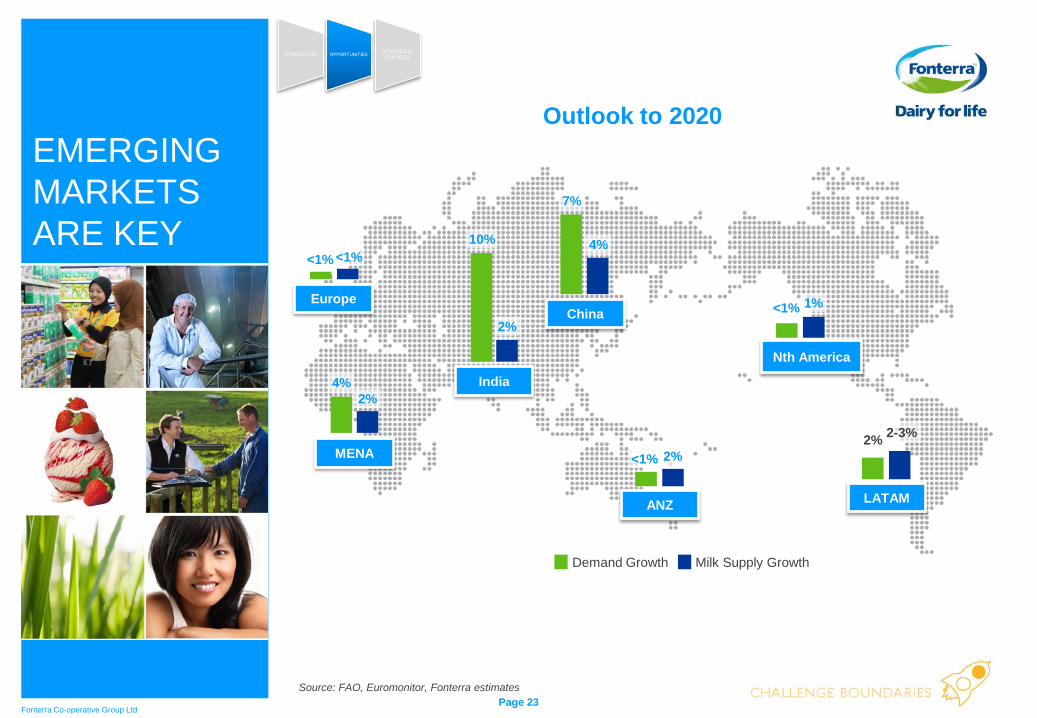
EMERGING MARKETS ARE KEY
Demand Growth Milk Supply Growth
MENA
2%4%
10%
India
2%
7%
China
4%
2-3%
LATAM
2%2%
ANZ
<1%
1%
Nth America
<1%
Outlook to 2020
<1%
Europe
<1%
STRENGTHS OPPORTUNITIES STRATEGIC CHOICES
Source: FAO, Euromonitor, Fonterra estimates
Page 24Fonterra Co-operative Group Ltd
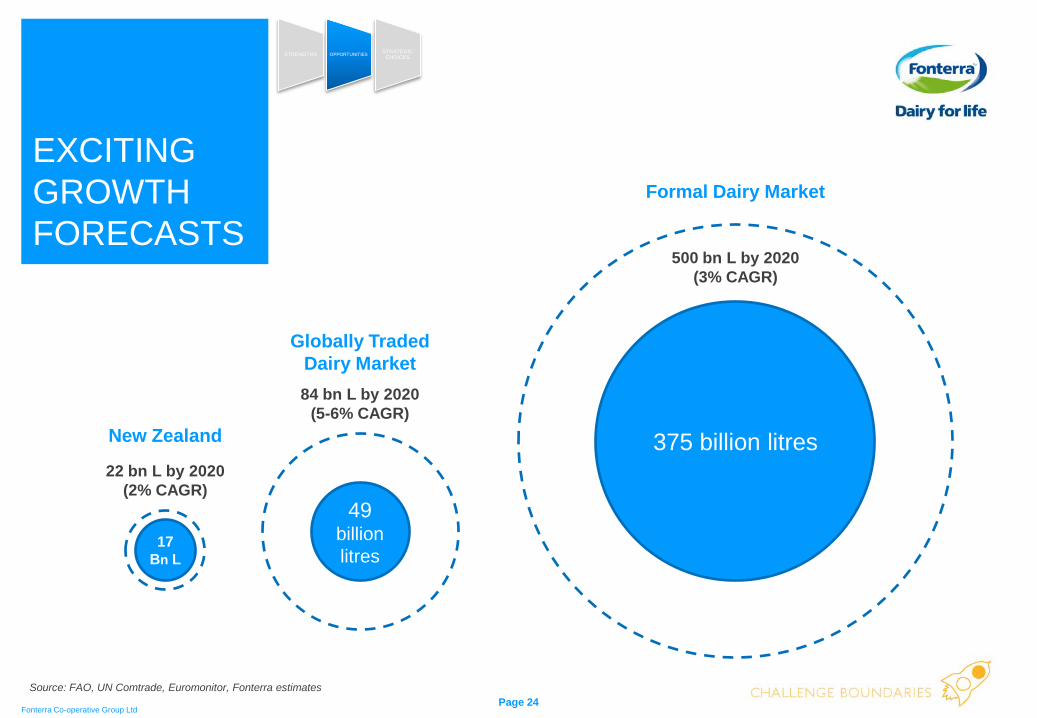
EXCITING GROWTH FORECASTS
17 Bn L
49 billion litres
375 billion litresNew Zealand
Globally Traded Dairy Market
Formal Dairy Market
22 bn L by 2020(2% CAGR)
84 bn L by 2020 (5-6% CAGR)
500 bn L by 2020 (3% CAGR)
STRENGTHS OPPORTUNITIES STRATEGIC CHOICES
Source: FAO, UN Comtrade, Euromonitor, Fonterra estimates
Page 25Fonterra Co-operative Group Ltd
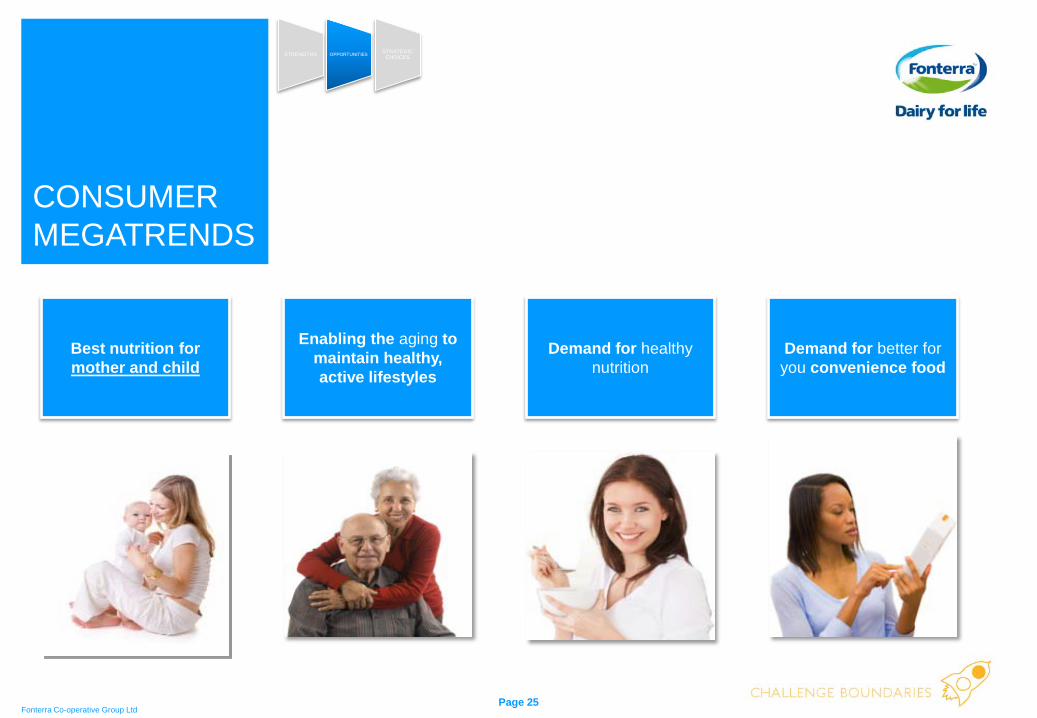
CONSUMERMEGATRENDS
STRENGTHS OPPORTUNITIES STRATEGIC CHOICES
Enabling the aging to maintain healthy, active lifestyles
Demand for better for you convenience food
Best nutrition for mother and child
Demand for healthy nutrition
Page 26Fonterra Co-operative Group Ltd
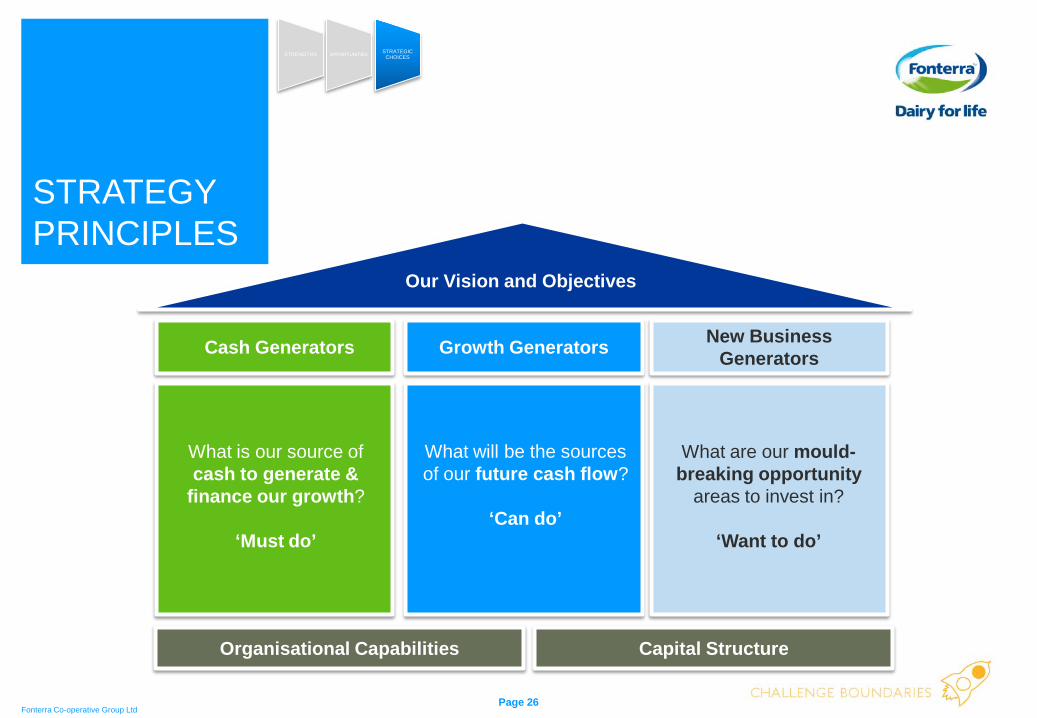
STRATEGY PRINCIPLES
Organisational Capabilities
Our Vision and Objectives
Cash Generators Growth Generators New Business Generators
Capital Structure
What is our source of cash to generate &
finance our growth?
‘Must do’
What will be the sources of our future cash flow?
‘Can do’
What are our mould-breaking opportunity
areas to invest in?
‘Want to do’
STRENGTHS OPPORTUNITIES STRATEGIC CHOICES
Page 27Fonterra Co-operative Group Ltd
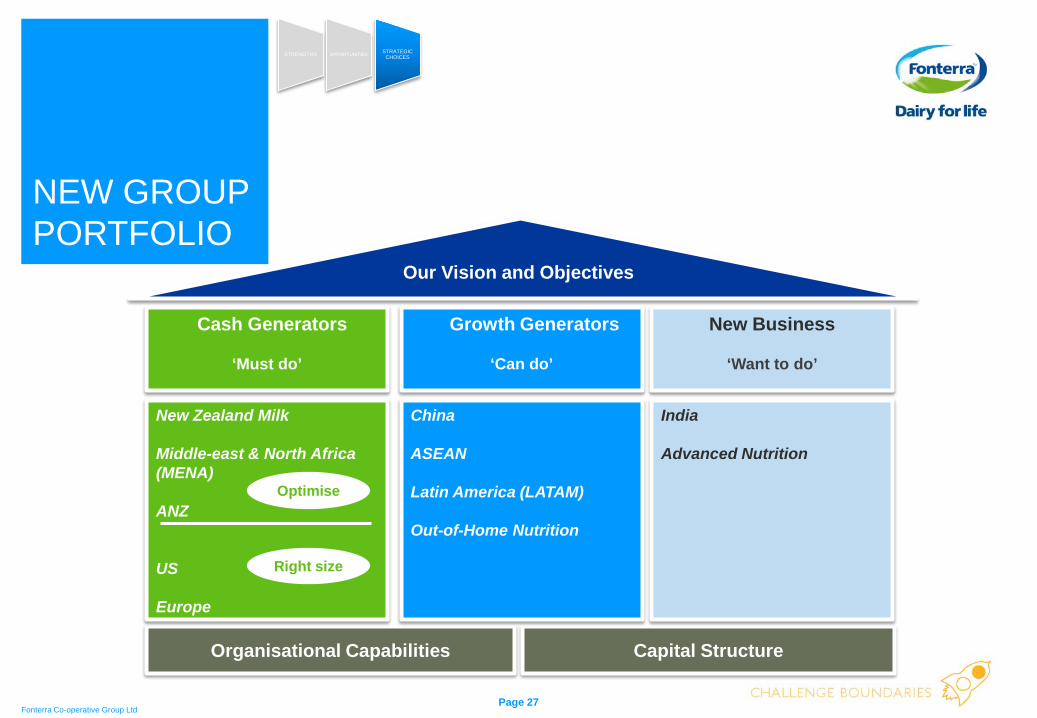
NEW GROUP PORTFOLIO
Our Vision and Objectives
Cash Generators
‘Must do’
Growth Generators
‘Can do’
New Business
‘Want to do’
Organisational Capabilities Capital Structure
New Zealand Milk
Middle-east & North Africa (MENA)
ANZ
US
Europe
China
ASEAN
Latin America (LATAM)
Out-of-Home Nutrition
India
Advanced Nutrition
Optimise
Right size
STRENGTHS OPPORTUNITIES STRATEGIC CHOICES
Page 28Fonterra Co-operative Group Ltd
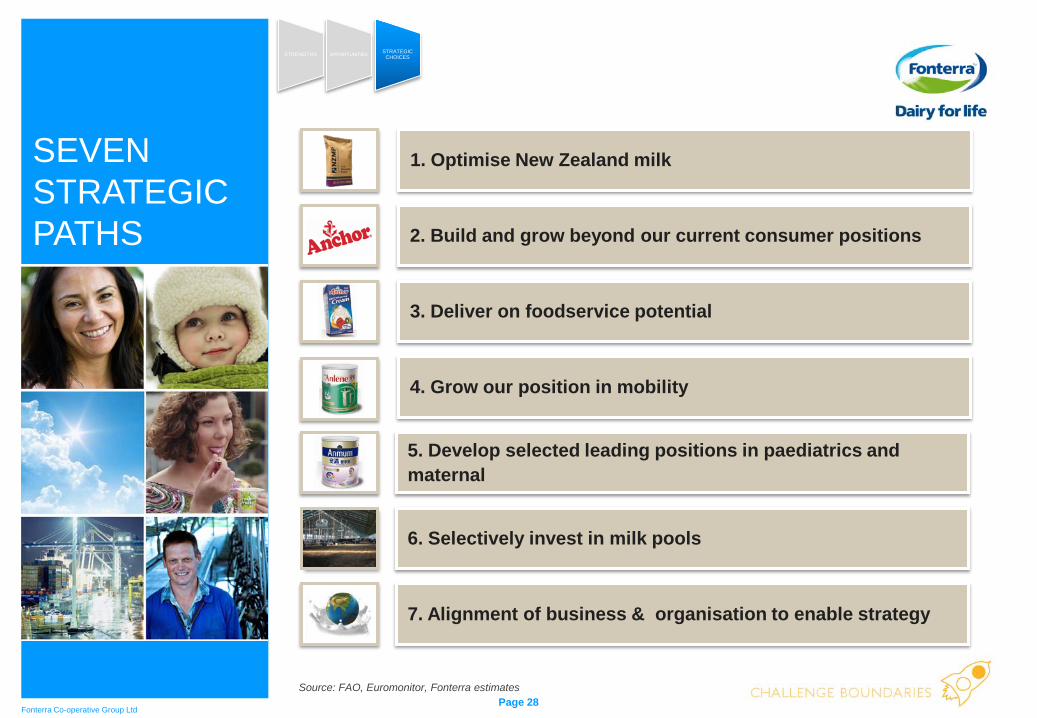
SEVEN STRATEGIC PATHS
1. Optimise New Zealand milk
2. Build and grow beyond our current consumer positions
3. Deliver on foodservice potential
4. Grow our position in mobility
5. Develop selected leading positions in paediatrics and maternal
6. Selectively invest in milk pools
7. Alignment of business & organisation to enable strategy
STRENGTHS OPPORTUNITIES STRATEGIC CHOICES
Source: FAO, Euromonitor, Fonterra estimates
Page 29Fonterra Co-operative Group Ltd
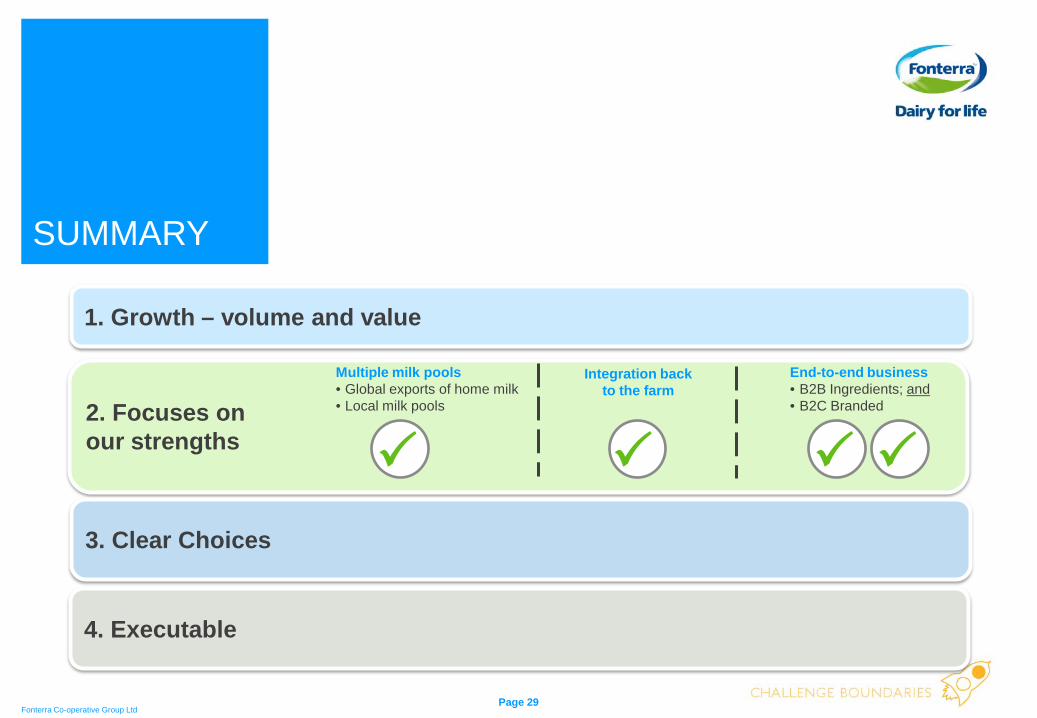
SUMMARY
1. Growth – volume and value
2. Focuses on our strengths
3. Clear Choices
Multiple milk pools• Global exports of home milk• Local milk pools
Integration backto the farm
End-to-end business• B2B Ingredients; and• B2C Branded
4. Executable