Embed Size (px)
Citation preview
Contents lists available at ScienceDirect
Food and Waterborne Parasitology
journal homepage: www.elsevier.com/locate/fawpar
Risk ranking of foodborne parasites: State of the art
Brecht Devleesschauwera,⁎, Martijn Bouwknegtb, Pierre Dornyc,d, Sarah Gabriële,Arie H. Havelaarf, Sophie Quoilina, Lucy J. Robertsong, Niko Speybroeckh,Paul R. Torgersoni, Joke W.B. van der Giessenj, Chiara Trevisanc
aDepartment of Public Health and Surveillance, Scientific Institute of Public Health (WIV-ISP), Brussels, BelgiumbGroup Quality Assurance/R&D, Vion, Boxtel, The NetherlandscDepartment of Biomedical Sciences, Institute of Tropical Medicine, Antwerp, Belgiumd Laboratory of Parasitology, Faculty of Veterinary Medicine, Ghent University, Merelbeke, BelgiumeDepartment of Veterinary Public Health and Food Safety, Faculty of Veterinary Medicine, Ghent University, Merelbeke, Belgiumf Emerging Pathogens Institute, Institute for Sustainable Food Systems, Animal Sciences Department, University of Florida, Gainesville, FL, USAg Parasitology, Department of Food Safety and Infection Biology, Faculty of Veterinary Medicine, Norwegian University of Life Sciences, AdamstuenCampus, Oslo, Norwayh Institute of Health and Society (IRSS), Université Catholique de Louvain, Brussels, Belgiumi Section of Epidemiology, Vetsuisse Faculty, University of Zürich, Switzerlandj Centre for Zoonoses and Environmental Microbiology, National Institute for Public Health and the Environment, Bilthoven, The Netherlands
A R T I C L E I N F O
Keywords:Cost-of-illnessDisability-adjusted life yearsFoodborne parasitesMulti-criteria decision analysisPriority setting
A B S T R A C T
In a time of increasing threats and decreasing financial resources, monitoring and controlling allpossible foodborne hazards at the same time and to the same extent has become more challengingthan ever. Therefore, attention is increasingly being paid to the so-called “risk ranking” methodsthat enable decision makers to focus on the most important foodborne hazards— even when timeis limited and knowledge incomplete. In this review paper, we provide an overview of the mostcommon quantitative methods and metrics used for ranking the risks associated with foodborneparasites and present the state of the art on risk ranking exercises for foodborne parasites.
A number of risk ranking metrics and methods are available, ranging from simple approachesthat can be used to assess the health or economic impact of a foodborne parasitic disease, to morecomplicated but more comprehensive multi-criteria assessments. For health impact assessment,measures of population health such as disease occurrence and number of deaths; Disability-Adjusted Life Years (DALYs) measuring the healthy life years lost; and Quality-Adjusted LifeYears (QALYs) measuring the number of life years lived in optimal health, are described. Foreconomic impact assessment, applied approaches that measure the cost-of-illness from a societalperspective and stated preference methods are outlined. Finally, Multi-Criteria Decision Analysis(MCDA), which can be used to integrate multiple metrics and criteria into a single ranking, isdescribed.
These risk ranking methods for foodborne parasites are increasingly performed to aid prioritysetting at global, regional, and national levels. As different stakeholders have their own prior-itization objectives and beliefs, the outcome of such exercises is necessarily context-dependent.Therefore, when designing a risk ranking exercise for foodborne parasites, it is important to
https://doi.org/10.1016/j.fawpar.2017.11.001Received 9 August 2017; Received in revised form 17 November 2017; Accepted 22 November 2017
⁎ Corresponding author at: Department of Public Health and Surveillance, Scientific Institute of Public Health (WIV-ISP), Rue Juliette Wytsmanstraat 14, 1050Brussels, Belgium.
E-mail addresses: [email protected], [email protected] (B. Devleesschauwer).
Abbreviations: DALY, Disability-Adjusted Life Year; FAO, Food and Agriculture Organization of the United Nations; GBD, Global Burden of Disease; MCDA, Multi-Criteria Decision Analysis; QALY, Quality-Adjusted Life Year; SMPH, Summary Measure of Population Health; WHO, World Health Organization; WTA, Willingness-to-accept; WTP, Willingness-to-pay; YLD, Year Lived with Disability; YLL, Year of Life Lost
Food and Waterborne Parasitology xxx (xxxx) xxx–xxx
2405-6766/ © 2017 Published by Elsevier Inc. on behalf of International Association of Food and Waterborne Parasitology. This is an open access article under the CC BY license (http://creativecommons.org/licenses/BY/4.0/).
Please cite this article as: Devleesschauwer, B., Food and Waterborne Parasitology (2017), https://doi.org/10.1016/j.fawpar.2017.11.001
choose the metrics and methods, as well as what to rank, in the light of the predefined context ofthe question being addressed and the target audience.
1. Introduction
In a time of increasing threats (or recognition, c.q., perception thereof) and decreasing financial resources, it has become morechallenging than ever to monitor and control all possible foodborne hazards at the same time and to the same extent (Speybroecket al., 2015). Consequently, attention is being increasingly directed on methods that enable decision makers to focus on the mostimportant foodborne hazards — even when time is limited and knowledge incomplete (Stella et al., 2013). These exercises are oftenlabeled “risk ranking”, but may differ widely in their intention, scope and methodology. According to the Codex Alimentarius, risk isdefined as “a function of the probability of an adverse health effect and the severity of that effect, consequential to a hazard(s) infood” (CAC (Codex Alimentarius Commission), 1999). However, severity can be quantified in different ways — it may, for instance,be defined as the health or economic impact of the adverse health effects. Furthermore, the function can take many different shapes— ranging from a mere sum to complicated weighted averages. As a result, the concept of “risk”, and thus “risk ranking”, is not asstandardized as it should be. However, the same goal, which is to accomplish an internally consistent and comparable set of riskestimates allowing ranking, and thus prioritization among a given number of hazards, is shared in all risk ranking exercises.
Foodborne parasitic diseases present some unique challenges, including their often prolonged incubation period and associationwith chronic sequelae. Furthermore, as most foodborne parasitic diseases are not notifiable, their true importance is often under-reported and under-recognized (Torgerson et al., 2015). In this review paper, we aim to provide an overview of the most commonquantitative methods and metrics used for ranking foodborne parasites according to their associated risks. We also provide the stateof the art on risk ranking exercises for foodborne parasites. For further information on risk ranking, readers are kindly referred toBrookes et al. (2015), who discuss risk ranking in the context of decision science, and to O'Brien et al. (2016) and Van der Fels-Klerxet al. (2016), who discuss risk ranking methods for infectious and foodborne diseases, respectively.
2. Health impact
2.1. Methods and metrics
Quantifying health impacts may be based on disease occurrence (prevalence or incidence) or on the number of deaths (mortality).However, these unidimensional or simplemeasures of population health do not provide a complete picture of the impact of foodborneparasites on human health as they do not combine the impacts of morbidity and mortality, thus precluding a comparative ranking ofdiseases with high morbidity, but low case-fatality, such as chorioretinitis due to toxoplasmosis, and highly lethal diseases such asalveolar echinococcosis (Batz et al., 2012; Devleesschauwer et al., 2015a). Furthermore, disease severity, defined by the impact onquality of life and the duration of the symptoms, as well as the expected residual life expectancy at the age of death, should beaccounted for when quantifying burden of disease. Indeed, certain parasitic infections may be very common, but their clinical impactmay be minimal. For instance, infections with a highly prevalent parasite such as the pinworm, Enterobius vermicularis, have a verylow burden because most of the cases are mild to asymptomatic and self-limiting (Knopp et al., 2012).
In order to overcome the limitations of simple measures such as incidence and mortality, summary measures of population health(SMPHs) have been developed as an additional way of expressing information for quantifying disease burden. The Disability-AdjustedLife Year (DALY) is currently the most widely used SMPH in public health research. Originally developed to quantify and compare theburden of diseases, injuries, and risk factors within and across countries, the DALY summarizes the occurrence and impact ofmorbidity and mortality in a single metric (Devleesschauwer et al., 2014a). The DALY is the key measure in the Global Burden ofDisease (GBD) studies and has been officially adopted by the World Health Organization (WHO) for reporting on health information(Murray et al., 2012; WHO (World Health Organization), 2017).
The DALY is a health gap measure, measuring the quantity of healthy life years lost due to a disease or injury against someidealized health profile. DALYs are calculated by adding the number of years lived with disability adjusted for the severity of thedisease (YLDs) and the number of years of life lost due to premature mortality (YLLs):
YLD= Number of incident cases × Duration until remission or death × Disability Weight.YLL = Number of deaths × Residual life expectancy at the age of death.An alternative formula for calculating YLDs was introduced by the GBD 2010 study (Murray et al., 2012):YLD= Number of prevalent cases × Disability Weight.This formula reflects a prevalence perspective instead of an incidence perspective. The incidence perspective assigns all health
outcomes, including those in future years, to the initial event (e.g., exposure to a certain foodborne parasite). This approach thereforereflects the future burden of disease resulting from current events. In the prevalence perspective, on the other hand, the health statusof a population is assessed at a specific point in time, and prevalent diseases are attributed to initial events that happened in the past.This approach thus reflects the current burden of disease resulting from previous events. Although both perspectives are valid, theincidence perspective is more appropriate for foodborne parasites, as it is more sensitive to current epidemiological trends, includingthe effects of intervention measures (Murray, 1994; Devleesschauwer et al., 2015a).
B. Devleesschauwer et al. Food and Waterborne Parasitology xxx (xxxx) xxx–xxx
2
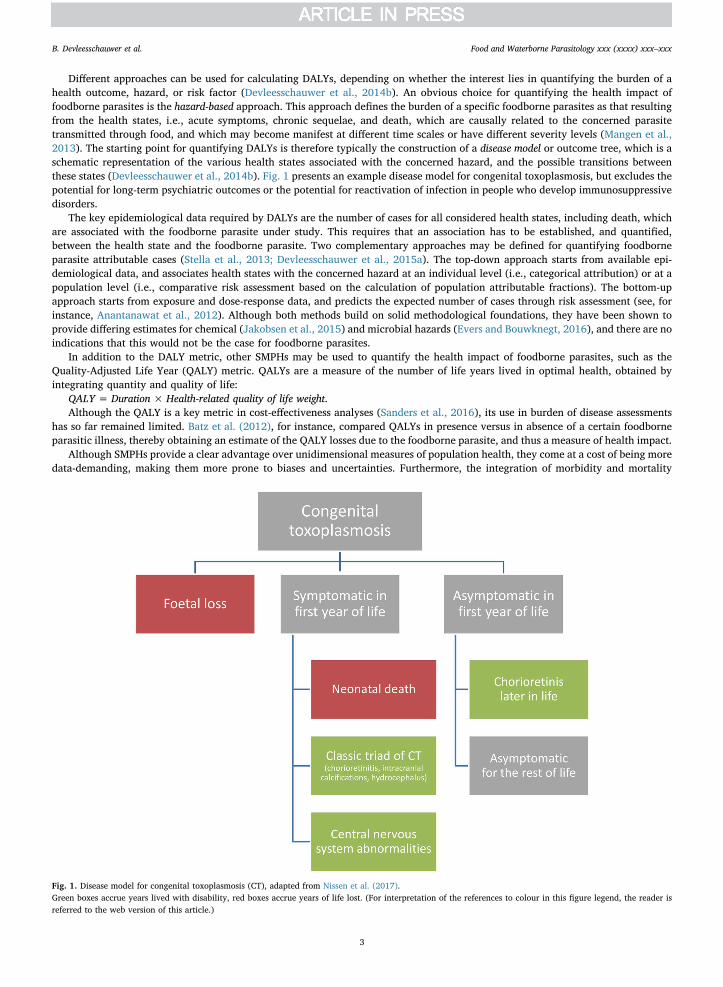
Different approaches can be used for calculating DALYs, depending on whether the interest lies in quantifying the burden of ahealth outcome, hazard, or risk factor (Devleesschauwer et al., 2014b). An obvious choice for quantifying the health impact offoodborne parasites is the hazard-based approach. This approach defines the burden of a specific foodborne parasites as that resultingfrom the health states, i.e., acute symptoms, chronic sequelae, and death, which are causally related to the concerned parasitetransmitted through food, and which may become manifest at different time scales or have different severity levels (Mangen et al.,2013). The starting point for quantifying DALYs is therefore typically the construction of a disease model or outcome tree, which is aschematic representation of the various health states associated with the concerned hazard, and the possible transitions betweenthese states (Devleesschauwer et al., 2014b). Fig. 1 presents an example disease model for congenital toxoplasmosis, but excludes thepotential for long-term psychiatric outcomes or the potential for reactivation of infection in people who develop immunosuppressivedisorders.
The key epidemiological data required by DALYs are the number of cases for all considered health states, including death, whichare associated with the foodborne parasite under study. This requires that an association has to be established, and quantified,between the health state and the foodborne parasite. Two complementary approaches may be defined for quantifying foodborneparasite attributable cases (Stella et al., 2013; Devleesschauwer et al., 2015a). The top-down approach starts from available epi-demiological data, and associates health states with the concerned hazard at an individual level (i.e., categorical attribution) or at apopulation level (i.e., comparative risk assessment based on the calculation of population attributable fractions). The bottom-upapproach starts from exposure and dose-response data, and predicts the expected number of cases through risk assessment (see, forinstance, Anantanawat et al., 2012). Although both methods build on solid methodological foundations, they have been shown toprovide differing estimates for chemical (Jakobsen et al., 2015) and microbial hazards (Evers and Bouwknegt, 2016), and there are noindications that this would not be the case for foodborne parasites.
In addition to the DALY metric, other SMPHs may be used to quantify the health impact of foodborne parasites, such as theQuality-Adjusted Life Year (QALY) metric. QALYs are a measure of the number of life years lived in optimal health, obtained byintegrating quantity and quality of life:
QALY = Duration × Health-related quality of life weight.Although the QALY is a key metric in cost-effectiveness analyses (Sanders et al., 2016), its use in burden of disease assessments
has so far remained limited. Batz et al. (2012), for instance, compared QALYs in presence versus in absence of a certain foodborneparasitic illness, thereby obtaining an estimate of the QALY losses due to the foodborne parasite, and thus a measure of health impact.
Although SMPHs provide a clear advantage over unidimensional measures of population health, they come at a cost of being moredata-demanding, making them more prone to biases and uncertainties. Furthermore, the integration of morbidity and mortality
Fig. 1. Disease model for congenital toxoplasmosis (CT), adapted from Nissen et al. (2017).Green boxes accrue years lived with disability, red boxes accrue years of life lost. (For interpretation of the references to colour in this figure legend, the reader isreferred to the web version of this article.)
B. Devleesschauwer et al. Food and Waterborne Parasitology xxx (xxxx) xxx–xxx
3
necessitates normative assumptions, for instance regarding death being the worst health state to experience. Such assumptions resultin methodological differences for calculating a given SMPH, as well as sparking continuous debate among experts (Gold et al., 2002).Moreover, SMPHs per definition only quantify tangible health impact, thus ignoring economic impact and perceived burden. Finally,the aggregated nature of SMPHs also makes it difficult to understand which factors drive a high burden (incidence, severity, mor-tality, age) and estimates should always be accompanied by disaggregated data.
2.2. State of the art
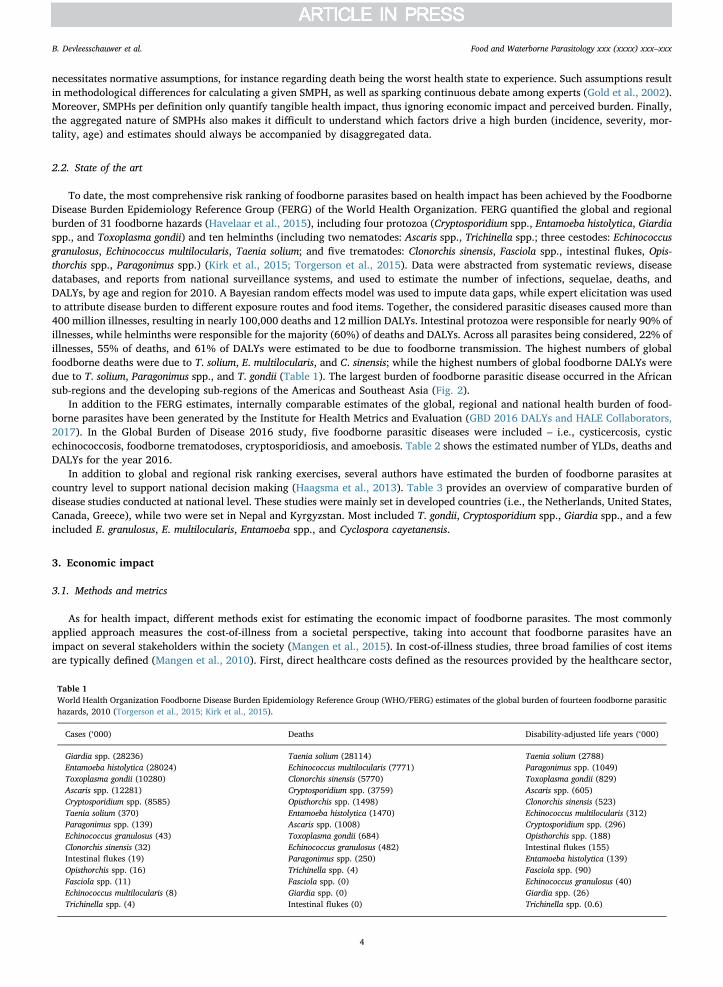
To date, the most comprehensive risk ranking of foodborne parasites based on health impact has been achieved by the FoodborneDisease Burden Epidemiology Reference Group (FERG) of the World Health Organization. FERG quantified the global and regionalburden of 31 foodborne hazards (Havelaar et al., 2015), including four protozoa (Cryptosporidium spp., Entamoeba histolytica, Giardiaspp., and Toxoplasma gondii) and ten helminths (including two nematodes: Ascaris spp., Trichinella spp.; three cestodes: Echinococcusgranulosus, Echinococcus multilocularis, Taenia solium; and five trematodes: Clonorchis sinensis, Fasciola spp., intestinal flukes, Opis-thorchis spp., Paragonimus spp.) (Kirk et al., 2015; Torgerson et al., 2015). Data were abstracted from systematic reviews, diseasedatabases, and reports from national surveillance systems, and used to estimate the number of infections, sequelae, deaths, andDALYs, by age and region for 2010. A Bayesian random effects model was used to impute data gaps, while expert elicitation was usedto attribute disease burden to different exposure routes and food items. Together, the considered parasitic diseases caused more than400 million illnesses, resulting in nearly 100,000 deaths and 12 million DALYs. Intestinal protozoa were responsible for nearly 90% ofillnesses, while helminths were responsible for the majority (60%) of deaths and DALYs. Across all parasites being considered, 22% ofillnesses, 55% of deaths, and 61% of DALYs were estimated to be due to foodborne transmission. The highest numbers of globalfoodborne deaths were due to T. solium, E. multilocularis, and C. sinensis; while the highest numbers of global foodborne DALYs weredue to T. solium, Paragonimus spp., and T. gondii (Table 1). The largest burden of foodborne parasitic disease occurred in the Africansub-regions and the developing sub-regions of the Americas and Southeast Asia (Fig. 2).
In addition to the FERG estimates, internally comparable estimates of the global, regional and national health burden of food-borne parasites have been generated by the Institute for Health Metrics and Evaluation (GBD 2016 DALYs and HALE Collaborators,2017). In the Global Burden of Disease 2016 study, five foodborne parasitic diseases were included – i.e., cysticercosis, cysticechinococcosis, foodborne trematodoses, cryptosporidiosis, and amoebosis. Table 2 shows the estimated number of YLDs, deaths andDALYs for the year 2016.
In addition to global and regional risk ranking exercises, several authors have estimated the burden of foodborne parasites atcountry level to support national decision making (Haagsma et al., 2013). Table 3 provides an overview of comparative burden ofdisease studies conducted at national level. These studies were mainly set in developed countries (i.e., the Netherlands, United States,Canada, Greece), while two were set in Nepal and Kyrgyzstan. Most included T. gondii, Cryptosporidium spp., Giardia spp., and a fewincluded E. granulosus, E. multilocularis, Entamoeba spp., and Cyclospora cayetanensis.
3. Economic impact
3.1. Methods and metrics
As for health impact, different methods exist for estimating the economic impact of foodborne parasites. The most commonlyapplied approach measures the cost-of-illness from a societal perspective, taking into account that foodborne parasites have animpact on several stakeholders within the society (Mangen et al., 2015). In cost-of-illness studies, three broad families of cost itemsare typically defined (Mangen et al., 2010). First, direct healthcare costs defined as the resources provided by the healthcare sector,
Table 1World Health Organization Foodborne Disease Burden Epidemiology Reference Group (WHO/FERG) estimates of the global burden of fourteen foodborne parasitichazards, 2010 (Torgerson et al., 2015; Kirk et al., 2015).
Cases (‘000) Deaths Disability-adjusted life years (‘000)
Giardia spp. (28236) Taenia solium (28114) Taenia solium (2788)Entamoeba histolytica (28024) Echinococcus multilocularis (7771) Paragonimus spp. (1049)Toxoplasma gondii (10280) Clonorchis sinensis (5770) Toxoplasma gondii (829)Ascaris spp. (12281) Cryptosporidium spp. (3759) Ascaris spp. (605)Cryptosporidium spp. (8585) Opisthorchis spp. (1498) Clonorchis sinensis (523)Taenia solium (370) Entamoeba histolytica (1470) Echinococcus multilocularis (312)Paragonimus spp. (139) Ascaris spp. (1008) Cryptosporidium spp. (296)Echinococcus granulosus (43) Toxoplasma gondii (684) Opisthorchis spp. (188)Clonorchis sinensis (32) Echinococcus granulosus (482) Intestinal flukes (155)Intestinal flukes (19) Paragonimus spp. (250) Entamoeba histolytica (139)Opisthorchis spp. (16) Trichinella spp. (4) Fasciola spp. (90)Fasciola spp. (11) Fasciola spp. (0) Echinococcus granulosus (40)Echinococcus multilocularis (8) Giardia spp. (0) Giardia spp. (26)Trichinella spp. (4) Intestinal flukes (0) Trichinella spp. (0.6)
B. Devleesschauwer et al. Food and Waterborne Parasitology xxx (xxxx) xxx–xxx
4
such as healthcare provider consultations, diagnostic testing, medication, and hospitalization. Second, patient costs (or direct non-healthcare costs) defined as the resources used for healthcare that are not borne by the healthcare system, such as over-the-countermedications and other patient co-payments, and travel expenses to visit a healthcare provider. Third, productivity losses (or indirectnon-healthcare costs) defined as the losses due to absenteeism or job loss of patients and their caregivers. A fourth category, thefuture savings in healthcare costs due to premature death (or indirect healthcare costs), is increasingly being discussed, but not yetroutinely included in cost-of-illness studies.
An alternative to cost-of-illness studies are stated preference methods, which elicit general population estimates on the amountpeople would be willing to pay to prevent (willingness-to-pay; WTP) or be willing to receive to compensate the presence of (will-ingness-to-accept; WTA) a certain foodborne illness. Estimates are typically derived using discrete choice (or contingent valuation)experiments, in which respondents are asked to choose between two mutually exclusive scenarios, such as the purchase of non-labeled chicken at current market prices, versus the purchase of Campylobacter-free chicken at a higher price (Van der Fels-Klerxet al., 2016). Health economists consider stated preferences as the most complete and correct economic welfare measures, as they arenot limited to tangible costs but also allow incorporation of changes in consumer welfare associated with pain, distress and incon-venience. Furthermore, they quantify societal preferences, instead of relying solely on technical grounds. Nonetheless, their use hasbeen very limited to date, as the technique is complicated, resource-intensive, and known to suffer from significant between-re-spondent variability — reflecting differential consumer behavior, which, to some extent, is associated with the respondents' differ-ential ability to pay. Comparability of stated preferences across regions may therefore also be difficult.
On top of the costs linked to the health impact of foodborne parasites (quantified through cost-of-illness or stated preferences),these hazards may also incur an economic impact due to surveillance and other regulatory activities in place to monitor and preventinfection. In the EU, for instance, inspection of pigs at slaughterhouse level for Trichinella spp. induces an estimated annual cost of €25 million (Torgerson, 2013), while the health impact of trichinellosis is negligible (Devleesschauwer et al., 2015b). As manyfoodborne parasites are zoonotic, livestock losses due to clinical or subclinical infection may further add to the economic burden. InTanzania, the impact of lower prices for T. solium infected pigs was estimated at US$ 2.8 million, accounting for 35% of the totaleconomic impact of T. solium in the country (Trevisan et al., 2017). At a global level, Budke et al. (2006) estimated up to US$ 2 billionlivestock production losses due to cystic echinococcosis as a result of liver condemnation, reduction in carcass weight, decrease in
Fig. 2. Foodborne Disability-Adjusted Life Years (DALYs) per 100,000 population, per World Health Organization sub-region (Torgerson et al., 2015; Kirk et al., 2015).AFR: African Region, AMR: Region of the Americas, EMR: Eastern Mediterranean Region, EUR: European Region, SEAR: South-East Asia Region, WPR; Western PacificRegion; Stratum A: very low child and adult mortality, Stratum B: low child mortality and very low adult mortality, Stratum C: low child mortality and high adultmortality, Stratum D: high child and adult mortality, Stratum E: high child mortality and very high adult mortality.
Table 2Institute for Health Metrics and Evaluation (IHME) estimates of the global burden of five foodborne parasitic diseases (GBD 2016 DALYs and HALE Collaborators,2017; IHME (Institute for Health Metrics and Evaluation), 2016).
Years lived with disability (‘000) Deaths Disability-adjusted life years (‘000)
Foodborne trematodoses (1771) Cryptosporidiosis (57203) Cryptosporidiosis (4610)Cysticercosis (421) Amoebosis (26748) Foodborne trematodoses (1771)Amoebosis (207) Cystic echinococcosis (1012) Amoebosis (1277)Cryptosporidiosis (117) Cysticercosis (999) Cysticercosis (468)Cystic echinococcosis (90) Foodborne trematodoses (0) Cystic echinococcosis (137)
B. Devleesschauwer et al. Food and Waterborne Parasitology xxx (xxxx) xxx–xxx
5
hide value, decrease in milk production, and decreased fecundity. Market access (or the lack thereof) may also have significanteconomic impacts. Furthermore, these knock-on economic effects are not only limited to the population affected by the outbreak. Forinstance, the first foodborne outbreaks of cyclosporosis in the United States that were associated with raspberries imported fromSouth America resulted in huge economic losses and unemployment in the already marginal economic area of Guatemala where theraspberries originated (Pratdesaba et al., 2001).
Risk ranking based on economic impact may be more tangible and appealing to certain risk managers. It also allows takingmultiple dimensions into account, ranging from medical costs, to trade impacts and livestock losses; this however comes at a cost ofrequiring an even larger amount of data than health impact measures. As for SMPHs, different methodologies and normative valuesexist for estimating economic impact, leading to limited comparability between studies. Finally, economic impact assessments do notalways capture the costs of pain and suffering, yielding cost estimates that are strongly dependent on the economic development levelof the study area.
3.2. State of the art
Although foodborne parasites are of global concern, there are so far no global risk rankings of foodborne parasites based solely oneconomic impact. Murrell (1991), Roberts et al. (1994) and Torgerson and Macpherson (2011) aimed at providing a global per-spective by reviewing the economic impact of foodborne parasites in multiple countries; however, given the methodological dif-ferences between different studies, such reviews do not provide accurate rankings. Furthermore, there are relatively few assessmentsof the global economic impact of individual foodborne parasites. Budke et al. (2006) estimated global monetary losses resulting fromhuman and livestock cystic echinococcosis. Human-associated direct and indirect costs resulted in a global loss of US$ 764 million,while livestock-associated losses due to liver condemnation and reductions in carcass weight, hide value, milk production, andfecundity resulted in a global loss of US$ 2 billion.
More efforts have been made to conduct risk ranking of foodborne parasites based on economic impact at a national level, inparticular in the United States and in the Netherlands. Hoffmann et al. (2012) estimated the annual cost-of-illness in the United Statesof 14 foodborne pathogens for the year 2009, including that of T. gondii (US$ 2973 million), Cryptosporidium parvum (US$ 47 million),and C. cayetanensis (US$ 2 million). Jointly, these three foodborne parasites accounted for 21% of the cost-of-illness of all 14considered pathogens. In a more comprehensive study including 31 foodborne pathogens and a broad category of unspecified agents,Scharff (2012) estimated the cost of foodborne illness in the United States for the year 2010, based on medical costs, monetized QALY
Table 3National risk ranking of foodborne parasites based on summary measures of population health.
Reference Country Reference period Scope Foodborne parasite (disease); ranked from highest tolowest estimated burden
Gkogka et al., 2011 Greece 1996–2006 19 foodbornediseases
Echinococcus granulosus (cystic echinococcosis)Toxoplasma gondii (congenital toxoplasmosis)N/A (“other helminthoses”)Cryptosporidium spp. (cryptosporidiosis)Giardia spp. (giardiosis)Entamoeba spp. (amoebosis)
Hoffmann et al., 2012 United States ofAmerica
2009 14 foodbornepathogens
Toxoplasma gondii (acquired and congenitaltoxoplasmosis)Cryptosporidium spp. (cryptosporidiosis)Cyclospora cayetanensis (cyclosporosis)
Havelaar et al., 2012 The Netherlands 2009 14 foodbornepathogens
Toxoplasma gondii (acquired and congenitaltoxoplasmosis)Giardia spp. (giardiosis)Cryptosporidium spp. (cryptosporidiosis)
Kwong et al., 2012 Ontario, Canada 2006 51 infectious diseases Giardia spp. (giardiosis)Cryptosporidium spp. (cryptosporidiosis)Cyclospora cayetanensis (cyclosporosis)
Devleesschauwer et al., 2014c Nepal 2000–2012 3 parasitic zoonoses Taenia solium (neurocysticercosis)Toxoplasma gondii (congenital toxoplasmosis)Echinococcus granulosus (cystic echinococcosis)
Mangen et al., 2015 The Netherlands 2011 14 foodbornepathogens
Toxoplasma gondii (acquired and congenitaltoxoplasmosis)Giardia spp. (giardiosis)Cryptosporidium spp. (cryptosporidiosis)
Counotte et al., 2016 Kyrgyzstan 2013 7 zoonoses Echinococcus multilocularis (alveolar echinococcosis)Echinococcus granulosus (cystic echinococcosis)Toxoplasma gondii (toxoplasmosis)
van Lier et al., 2016 The Netherlands 2007–2011 32 infectious diseases Toxoplasma gondii (acquired and congenitaltoxoplasmosis)Giardia spp. (giardiosis)Cryptosporidium spp. (cryptosporidiosis)
B. Devleesschauwer et al. Food and Waterborne Parasitology xxx (xxxx) xxx–xxx
6
losses, and illness-related mortality. The total economic impact was estimated at US$ 78 billion, of which 5% was due to the fiveincluded foodborne parasites – i.e., T. gondii (US$ 3456 million), Giardia duodenalis (US$ 282 million), Cryptosporidium spp. (US$ 168million), C. cayetanensis (US$ 17 million) and Trichinella spp. (US$ 2 million). The cost per case was significantly higher for T. gondiiand Trichinella spp. (US$ 40,000 and US$ 15,000, respectively), than for the three other included foodborne parasites (< US$ 4000).In the Netherlands, the cost-of-illness of Cryptosporidium spp., Giardia spp. and T. gondii was € 8 million, € 11 million, and € 55million, respectively, accounting for 16% of the economic impact of all considered foodborne pathogens (Mangen et al., 2015).Whereas direct healthcare costs were found to be the dominant component of the cost-of-illness of T. gondii, productivity losses werethe most important component of Cryptosporidium spp. and Giardia spp. cost-of-illness. This was also noted in the cost estimate for theenormous waterborne outbreak of cryptosporidiosis in Milwaukee in 1993, in which the total cost of outbreak-associated illness wasestimated at 96.2 million US dollars, of which 31.7 million US dollars were medical costs and 64.6 million US dollars were
Fig. 3. Global ranking of foodborne parasites using multi-criteria decision analysis (FAO/WHO (Food and Agriculture Organization of the United Nations and WorldHealth Organization), 2014).The normalized overall scores are weighted sums of normalized criteria scores and weights elicited from expert meeting participants.
Table 4Criterion weights obtained in three multi-criteria decision analyses of foodborne parasites.
Scoring criterion Globala Indiab Europec
Number of global food-borne illnesses 0.22 0.30 0.23Global distribution 0.14 0.13 0.13Morbidity severity 0.22 0.14 0.23Case-fatality ratio 0.15 0.15 0.15Increasing illness potential 0.07 0.12 0.10Trade relevance 0.10 0.07 0.09Impacts on economically vulnerable communities 0.10 0.08 0.07
a FAO/WHO (Food and Agriculture Organization of the United Nations and World Health Organization) (2014).b Robertson et al. (2015).c Bouwknegt et al. (2017).
B. Devleesschauwer et al. Food and Waterborne Parasitology xxx (xxxx) xxx–xxx
7
Table5
Nationa
lan
dregion
alrisk
rank
ingof
food
bornepa
rasitesan
dothe
rpa
thog
ensba
sedon
multi-criteriade
cision
analysis.
Referen
ceLo
cation
Scop
eCriteria
Ran
king
offood
bornepa
rasites
Cardo
enet
al.,20
09Be
lgium
51zo
onotic
pathog
ens
1.Se
verity
ofthediseaseforhu
man
s.2.
Occurrenc
eof
thediseasein
theBe
lgianpo
pulation
.3.
Occurrenc
ein
livean
imalsin
Belgium.
4.Se
verity
ofthediseaseforan
imalsan
dco
mmercial
and
econ
omic
impa
ctof
diseaseforthesector.
5.Occurrenc
eof
theag
entin
food
orin
carcasses.
•Highim
portan
ce:n
one.
•Significant
impo
rtan
ce:To
xoplasmagond
ii,Cryptosporidium
parvum
,Echino
coccus
gran
ulosus,E
chinococcusmultilocularis,F
asciolahepa
tica,
Giardia
duod
enalis.
•Mod
erateim
portan
ce:T
aeniasagina
ta,T
richinella
spp.,S
arcocystisboviho
minis.
•Low
impo
rtan
ce:A
nisakissimplex,S
arcocystissuihom
inis,T
aeniaspp.
(other
than
sagina
ta),Dioctophy
marena
le,C
lono
rchissinensis,B
alan
tidium
coli,
Diphy
llobothrium
,Linguatulaserrata.
Hav
elaa
ret
al.,20
10Th
eNethe
rlan
ds86
zoon
otic
pathog
ens
1.Prob
ability
ofintrod
uction
into
theNethe
rlan
ds.
2.Tran
smission
inan
imal
reservoirs.
3.Ec
onom
icda
mag
ein
anim
alreservoirs.
4.Animal-hum
antran
smission
.5.
Tran
smission
betw
eenhu
man
s.6.
Morbidity
(disab
ility
weigh
t).
7.Mortality(case-fatalityratio).
•Highpriority:T
oxoplasm
agond
ii.
•Med
ium
priority:E
chinococcusmultilocularis,T
richinella
spp.
•Low
priority:C
ryptosporidium
parvum
,Ascarissuum
,Giardia
duod
enalis,
Toxo
cara
canis/cati,
Taenia
soliu
m,E
chinococcusgran
ulosus,A
nisakissimplex,
Taenia
sagina
ta,F
asciolahepa
tica.
Balaba
nova
etal.,
2011
German
y12
7pa
thog
ens
1.Incide
nce(inc
luding
illne
ssan
dsymptom
atic
infection).
2.Workan
dscho
olab
senteeism.
3.Healthcare
utilization
(primarycare
andho
spitalization).
4.Chron
icityof
illne
ssor
sequ
elae.
5.Casefatalityrate.
6.Prop
ortion
ofev
ents
requ
iringpu
blic
health
action
s.7.
Tren
d.8.
Public
attention(inc
luding
political
agen
daan
dpu
blic
percep
tion
).9.
Prev
ention
possibilities
andne
eds(inc
luding
vaccines).
10.Treatm
entpo
ssibilities
andne
eds(inc
luding
AMR).
•Highe
stpriority:n
one.
•Highpriority:C
ryptosporidium
parvum
/hom
inis,G
iardia
duod
enalis,T
oxoplasm
agond
ii.
•Med
ium
priority:T
richinella
spiralis.
•Low
priority:C
yclosporacayetanensis,E
ntam
oeba
histolytica,
Helminhts(fl
ukes),
Helminths(nem
atod
es),Helminths(tap
eworms).
Ngan
dSa
rgeant,
2012
Can
adaan
dUS
62zo
onoses
1.Case-fatalityin
human
s.2.
Incide
nceof
thediseasein
theCan
adian/
UShu
man
popu
lation
inthelast
five
years.
3.Case-fatalityin
anim
als.
4.Incide
nceof
thediseasein
theCan
adian/
USan
imal
popu
lation
inthelast
five
years.
5.Se
verity
ofillne
ssin
human
s.6.
Disease
tren
din
Can
ada/USin
thelast
five
yearsin
human
s.7.
Tran
smission
potentialbe
tweenhu
man
s.8.
Durationof
illne
ssin
human
s.9.
Tran
smission
potentialfrom
anim
alsto
human
s.10
.Disease
tren
din
Can
ada/USin
thelast
five
yearsin
anim
als.
11.Ec
onom
icbu
rden
inhu
man
s.12
.Tran
smission
potentialfrom
human
sto
anim
als.
13.Durationof
illne
ssin
anim
als.
14.Tran
smission
potentialbe
tweenan
imals.
15.Ec
onom
ican
dsocial
burden
ontrad
ein
anim
als.
16.Se
verity
ofillne
ssin
anim
als.
17.Highrisk
grou
psin
human
s.18
.Con
trol
measuresin
human
s.19
.Con
trol
measuresin
anim
als.
20.How
muc
his
know
nscientifically
abou
tthedisease.
•Can
ada:
Cryptospo
ridiosis
(14),G
iardiosis(19),To
xoplasmosis
(22),
Echino
coccosis
(37),T
oxoc
arosis
(38),T
rich
inellosis(49),C
ystioc
erco
sis/
Taen
iosis(57),C
yclosporosis
(59).
•US:
Cryptospo
ridiosis(23),T
oxop
lasm
osis(32),G
iardiosis(33),E
chinoc
occo
sis
(41),T
oxoc
arosis
(43),C
ysticercosis/T
aeniosis
(45),T
rich
inellosis(55),
Cyclosporosis
(57).
(con
tinuedon
next
page)
B. Devleesschauwer et al. Food and Waterborne Parasitology xxx (xxxx) xxx–xxx
8
Table5(con
tinued)
Referen
ceLo
cation
Scop
eCriteria
Ran
king
offood
bornepa
rasites
21.Highrisk
grou
psin
anim
als.
Hum
blet
etal.,20
12Eu
rope
100an
imal
diseases
andzo
onoses
57criteria,inc
luding
17forep
idem
iology
,8forprev
ention
/con
trol,
16forecon
omy/
trad
e,12
forpu
blic
health,a
nd4forsociety
•Highim
portan
ce:E
chinoc
occo
sis/hy
datido
sis.
•Significant
impo
rtan
ce:Po
rcinecysticerco
sis,
Trichine
llosis.
•Mod
erateim
portan
ce:n
one.
•Relativelow
impo
rtan
ce:n
one.
Dah
let
al.,20
15Sw
eden
106pa
thog
ens
1.Incide
nce(inc
luding
illne
ss,s
ymptom
atic
infections,
asym
ptom
atic
infections
butno
tcarriershipor
norm
alflora).
2.Workan
dscho
olab
senteeism.
3.Healthcare
utilization
(primaryhe
alth
care
and
hosptitaliz
ation).
4.Chron
icityof
illne
ssor
sequ
elae.
5.Casefatalityrate.
6.Prop
ortion
ofev
ents
requ
iringpu
blic
health
action
s.7.
Tren
d.8.
Public
attention(inc
luding
political
agen
daan
dpu
blic
percep
tion
).9.
Prev
ention
possibilities
andne
eds(inc
luding
vaccines).
10.Treatm
entpo
ssibilities
andne
eds(inc
luding
AMR).
•Highe
stpriority:E
chinococcusmultilocularis.
•Highpriority:C
ryptosporidium
parvum
/hom
inis,G
iardia
duod
enalis.
•Med
ium
priority:E
chinococcusgran
ulosus,E
nterobiusverm
icularis,T
oxoplasm
agond
ii,Trichinella
spiralis.
•Low
priority:E
ntam
oeba
histolytica,
Helminhts(tap
eworms),H
elminths(fl
ukes),
Helminths(nem
atod
es).
Kad
ohiraet
al.,20
15Japa
n98
zoon
oses
1.No.
ofhu
man
cases/ye
ar(inc
iden
ce).
2.Hum
an-to-hu
man
spread
.3.
Casefatalityrate.
4.Ava
ilabilityof
diag
nostic
test.
5.Treatm
ent.
6.Prev
entive
metho
ds.
7.Freq
uenc
yof
entryto
Japa
n.
Echino
coccosis:1
6/20
mostim
portan
tzo
onoses
B. Devleesschauwer et al. Food and Waterborne Parasitology xxx (xxxx) xxx–xxx
9
productivity losses (Corso et al., 2003).
4. Integrating multiple criteria
4.1. Methods and metrics
Using a single criterion to rank risks may be insufficient as diseases vary greatly in incidence, clinical manifestations, controlmeasures, transmission potential, and socio-economic impact in animals and humans. Trichinella spp., for instance, have a nearnegligible health impact in Europe, but their economic impact remains important due to continued monitoring and trade implications(Devleesschauwer et al., 2015b). Likewise, Taenia saginata mainly poses an economic burden to farmers and society, while the healthimpact of T. saginata taeniosis is limited (Laranjo-González et al., 2016). To explore this limitation of single criterion based riskrankings, it may be useful to rank risks according to multiple criteria (Mangen et al., 2010). Mangen et al. (2015), for instance,quantified the burden of foodborne disease in the Netherlands in 2011 using DALYs and cost-of-illness estimates, both at a populationand individual level. These different criteria led to four different rankings, with some hazards, most notably T. gondii, scoring high onmultiple rankings.
Several authors have gone beyond the simple comparison of different rankings and proposed methods for combining multiplecriteria into a single ranking. The most basic methods rely on the qualitative or semi-quantitative integration of two dimensions, forinstance through the construction of a risk matrix – i.e., a two-dimensional combination of two criteria, such as an exposure and aconsequence measure, with results ranging from low/low to high/high — but see Cox (2008) for a review of limitations of thismethod. A specific example of combining two criteria is the translation of DALYs (or QALY losses) into economic impact estimates,and vice versa. Indeed, some authors combined DALYs and economic impact estimates by assuming one DALY to correspond to aneconomic loss equal to the per capita gross national product (Torgerson et al., 2008). This however implies that the relative value ofhealth loss depends on the wealth of the nation, which may raise equity issues, especially when performing cross-country or globalrankings. To address this limitation, Torgerson et al. (2017) introduced the zDALY metric, which is the sum of the DALY metric forhuman health losses and the equivalent time losses associated with animal losses, defined as the economic impact of the animal lossesdivided by the per capita gross national product.
More advanced methods make use of the Multi-Criteria Decision Analysis (MCDA) framework. In MCDA, an overall importancemeasure is constructed based on different criteria, which are assigned weights reflecting their perceived contribution (Cardoen et al.,2009; Havelaar et al., 2010; FAO/WHO (Food and Agriculture Organization of the United Nations and World Health Organization),2014; Robertson et al., 2015). A typical MCDA exercise thus contains the following steps: identification of pathogens to be ranked;definition of criteria and description of scoring methods (e.g., economic impact, health impact, impact on trade); elicitation ofweights for the different criteria (e.g., economic impact may be perceived as less important than health impact, and morbidity ormortality may vary in importance depending on circumstance and perception); and scoring of the criteria, in a quantitative, semi-quantitative, or qualitative way, based on existing data or on expert elicitation. The final ranking is then given by the weighted sum ofthe different criteria. In addition to this simple additive ranking approach, more advanced MCDA approaches based on utility theoryor outranking have been proposed (Geldermann and Schöbel, 2011). Their application to rank foodborne parasites has so far re-mained limited— but see Ng and Sargeant (2012) for an application of conjoint analysis and Kadohira et al. (2015) for an applicationof the analytic hierarchy process method, both examples of utility based methods. Despite potential subjective elements, MCDAprovides a reproducible, standardized and transparent framework for ranking risks, and is consequently used in multiple sectors(Cardoen et al., 2009; Behzadian et al., 2010; Anderson et al., 2011) — the European Centre for Disease Prevention and Control, forinstance, prepared an MCDA toolkit for prioritizing infectious disease threats (ECDC (European Centre for Disease Prevention andControl), 2017). MCDA also allows the simultaneous consideration of criteria that are quantitative (e.g., incidence, case-fatality ratio)with others for which only semi-quantitative measures are available (e.g., trade relevance scored as “no relevance”, “some re-levance”, and “high relevance”) (Ruzante et al., 2010; FAO/WHO (Food and Agriculture Organization of the United Nations andWorld Health Organization), 2014). MCDA as such does not strive for an absolute numerical reflection of the actual situation; rather,it strives to compare the relative importance of foodborne parasites using a comprehensive consideration of all components that aredeemed relevant for that importance.
4.2. State of the art
In 2012, the Food and Agriculture Organization of the United Nations (FAO) and World Health Organization (WHO) jointlyorganized a multicriteria-based ranking of foodborne parasites at a global level. The exercise considered 24 foodborne parasites,narrowed down from an initial list of 93, which were scored according to seven criteria, including criteria related to health impact,trade relevance, and impacts on economically vulnerable communities. Fig. 3 presents the obtained global ranking of foodborneparasites, confirming the importance of T. solium at a global level, closely followed by E. granulosus, E. multilocularis, and T. gondii.Recently, the FAO/WHO MCDA exercise has been repeated at a regional level. Robertson et al. (2015) used the MCDA approach toperform a risk ranking of foodborne parasites in India, while Bouwknegt et al. (2017) used the approach to generate European riskrankings. As expected, the results differed from those of the global ranking, as the epidemiology and impact of foodborne parasites isknown to vary considerably between countries and regions, while perhaps also the perception of different criteria may vary acrosscultures. Specifically, in India T. solium was ranked highest, followed by Cryptosporidium spp. and E. granulosus, while in Europe, E.multilocularis ranked first, followed by T. gondii and Trichinella spiralis. The criteria weights obtained in the global and European
B. Devleesschauwer et al. Food and Waterborne Parasitology xxx (xxxx) xxx–xxx
10
exercises were relatively similar, while the Indian exercise elicited a lower weight for morbidity severity but a higher weight for thenumber of illnesses (Table 4).
Several other MCDA exercises have been conducted to rank foodborne parasites at national or regional level (Table 5). Thesestudies had a broad scope, focusing for instance on zoonotic diseases or, even more broadly, on communicable diseases. Foodborneparasites generally scored relatively low, although it should be noted that the resulting rankings are not necessarily comparable,given the differences in pathogens to rank, methodologies, and criteria. Inclusion of different pathogens to rank can for instancechange the relative ranking of the other pathogens that are the same. Likewise, different criteria will result in different values beingexpressed.
5. General considerations
To conclude, we want to present three general considerations when designing a risk ranking exercise of foodborne parasites.
• Whose ranking perspective? The aim of risk ranking exercises is to prioritize for decision making certain hazards, hazard-commodity pairs, or exposure routes for a given hazard, based on their perceived importance. As different stakeholders have theirown prioritization objectives, the outcome of such exercises is necessarily context-dependent. Consequently, there is no unique orintrinsically correct ranking of risks. Furthermore, when designing a risk ranking exercise, it is important that the precise questionand goal being addressed are defined explicitly, and from which perspective, along with the intended group who will use theranking and act upon it. When opting for MCDA, quantifying the criteria weights should be conducted along this line by con-sidering whose perception on relative importance among criteria needs to be reflected in the ranking.
• Which risk metric? As outlined in the review, there are different metrics, and methods, that can be used to define and rank risks.Different metrics have different philosophical implications, and result in different rankings. It is thus important to give con-siderable thought to the definition of metrics, and to ensure that the chosen metric and method fulfill the needs of the targetaudience. When multiple criteria are of interest in defining a ranking, methods relying on SMPHs or MCDA provide the mostappropriate quantifications.
• What to rank? Obviously, the prior definition of included foodborne parasites will have an impact on the final ranking.Furthermore, specific foodborne parasites may have multiple appearances, such as congenital versus acquired toxoplasmosis;whether or not to consider these as one or multiple entities is an important prior choice. A further major consideration is whetheror not the included food-related parasites should be ranked solely according to their foodborne transmission; and if so, whetherdrinking water is considered in the definition of food.
6. Conclusion
Risk ranking of foodborne parasites is increasingly performed to aid priority setting at global, regional, and national levels.Different risk ranking metrics and methods are available, ranging from single measures of health or economic impact, to complicated,but more complete, multi-criteria assessments. When designing a risk ranking exercise of foodborne parasites, it is important toconsider the target audience and the reason for which the ranking is done, the choice of metrics and methods, and the prior definitionof what to rank.
Acknowledgments
This work was a collaboration within the framework of EURO-FBP, A European Network for Foodborne Parasites, COST ActionFA1408.
Funding information
BD recognizes travel funding from the International Association for Food and Waterborne Parasitology, enabling him to presentthis work at the IAFWP International Symposium, Kuala Lumpur, Malaysia.
Conflict of interests
The authors state that they have no competing interests.
References
Anantanawat, S., Kiermeier, A., McLeod, C., Sumner, J., 2012. A Semi-Quantitative Risk Assessment of Harmful Parasites in Australian Finfish. South AustralianResearch & Development Institute.
Anderson, M., Jaykus, L.A., Beaulieu, S., Dennis, S., 2011. Pathogen-produce pair attribution risk ranking tool to prioritize fresh produce commodity and pathogencombinations for further evaluation (P3ARRT). Food Control 22, 1865–1872.
Balabanova, Y., Gilsdorf, A., Buda, S., Burger, R., Eckmanns, T., Gärtner, B., et al., 2011. Communicable diseases prioritized for surveillance and epidemiologicalresearch: results of a standardized prioritization procedure in Germany, 2011. PLoS One 6, e25691.
Batz, M.B., Hoffmann, S., Morris, J.G., 2012. Ranking the disease burden of 14 pathogens in food sources in the United States using attribution data from outbreak
B. Devleesschauwer et al. Food and Waterborne Parasitology xxx (xxxx) xxx–xxx
11
investigations and expert elicitation. J. Food Prot. 75, 1278–1291.Behzadian, M., Kazemzadeh, R.B., Albadvi, A., Aghdasi, M., 2010. PROMETHEE: a comprehensive literature review on methodologies and applications. Eur. J. Oper.
Res. 200, 198–215.Bouwknegt, M., Devleesschauwer, B., Graham, H., Robertson, L.J., van der Giessen, J., 2017. On behalf of the COST action participants. Prioritization of foodborne
parasites in Europe. Euro Surveill (in press).Brookes, V.J., Vilas, V.D.R., Ward, M.P., 2015. Disease prioritization: what is the state of the art? Epidemiol. Infect. 143, 2911–2922.Budke, C.M., Deplazes, P., Torgerson, P.R., 2006. Global socioeconomic impact of cystic echinococcosis. Emerg. Infect. Dis. 12, 296–303.CAC (Codex Alimentarius Commission), 1999. Principles and Guidelines for the Conduct of a Microbiological Risk Assessment. FAO, Rome (CAC/GL-30).Cardoen, S., Van Huffel, X., Berkvens, D., Quoilin, S., Ducoffre, G., Saegerman, C., et al., 2009. Evidence-based semiquantitative methodology for prioritization of
foodborne zoonoses. Foodborne Pathog. Dis. 6, 1083–1096.Corso, P.S., Kramer, M.H., Blair, K.A., Addiss, D.G., Davis, J.P., Haddix, A.C., 2003. Costs of illness in the 1993 waterborne Cryptosporidium outbreak, Milwaukee,
Wisconsin. Emerg. Infect. Dis. 9, 426.Counotte, M.J., Minbaeva, G., Usubalieva, J., Abdykerimov, K., Torgerson, P.R., 2016. The burden of Zoonoses in Kyrgyzstan: a systematic review. PLoS Negl. Trop.
Dis. 10, e0004831.Cox, A.T.L., 2008. What's wrong with risk matrices? Risk Anal. 28, 497–512.Dahl, V., Tegnell, A., Wallensten, A., 2015. Communicable diseases prioritized according to their public health relevance, Sweden, 2013. PLoS One 10, e0136353.Devleesschauwer, B., Havelaar, A.H., Maertens de Noordhout, C., Haagsma, J.A., Praet, N., Dorny, P., et al., 2014a. Calculating disability-adjusted life years to quantify
burden of disease. Int. J. Public Health 59, 565–569.Devleesschauwer, B., Havelaar, A.H., Maertens de Noordhout, C., Haagsma, J.A., Praet, N., Dorny, P., et al., 2014b. DALY calculation in practice: a stepwise approach.
Int. J. Public Health 59, 571–574.Devleesschauwer, B., Ale, A., Torgerson, P., Praet, N., Maertens de Noordhout, C., Pandey, B.D., et al., 2014c. The burden of parasitic zoonoses in Nepal: a systematic
review. PLoS Negl. Trop. Dis. 8, e2634.Devleesschauwer, B., Haagsma, J.A., Angulo, F.J., Bellinger, D.C., Cole, D., Döpfer, D., et al., 2015a. Methodological framework for World Health Organization
estimates of the global burden of foodborne disease. PLoS One 10, e0142498.Devleesschauwer, B., Praet, N., Speybroeck, N., Torgerson, P.R., Haagsma, J.A., De Smet, K., et al., 2015b. The low global burden of trichinellosis: evidence and
implications. Int. J. Parasitol. 45, 95–99.ECDC (European Centre for Disease Prevention and Control), 2017. ECDC Tool for the Prioritisation of Infectious Disease Threats – Handbook and Manual. Available
from. https://ecdc.europa.eu/en/publications-data/ecdc-tool-prioritisation-infectious-disease-threats (accessed 17/11/2017).Evers, E.G., Bouwknegt, M., 2016. Combining QMRA and epidemiology to estimate campylobacteriosis incidence. Risk Anal. 36, 1959–1968.FAO/WHO (Food and Agriculture Organization of the United Nations and World Health Organization), 2014. Multicriteria-Based Ranking for Risk Management of
Food-borne Parasites. Report of a Joint FAO/WHO Expert Meeting, 3–7 September 2012. FAO Headquarters, Rome Italy Available from. http://www.fao.org/3/a-i3649e.pdf (accessed 17/11/2017).
GBD 2016 DALYs, HALE Collaborators, 2017. Global, regional, and national disability-adjusted life-years (DALYs) for 333 diseases and injuries and healthy lifeexpectancy (HALE) for 195 countries and territories, 1990–2016: a systematic analysis for the global burden of disease study 2016. Lancet 390, 1260–1344.
Geldermann, J., Schöbel, A., 2011. On the similarities of some multi-criteria decision analysis methods. J. Multi-Crit. Dec. Anal. 18, 219–230.Gkogka, E., Reij, M.W., Havelaar, A.H., Zwietering, M.H., Gorris, L.G., 2011. Risk-based estimate of effect of foodborne diseases on public health, Greece. Emerg.
Infect. Dis. 17, 1581.Gold, M.R., Stevenson, D., Fryback, D.G., 2002. HALYS and QALYS and DALYS, oh my: similarities and differences in summary measures of population health. Annu.
Rev. Public Health 23, 115–134.Haagsma, J.A., Polinder, S., Stein, C.E., Havelaar, A.H., 2013. Systematic review of foodborne burden of disease studies: quality assessment of data and methodology.
Int. J. Food Microbiol. 166, 34–47.Havelaar, A.H., van Rosse, F., Bucura, C., Toetenel, M.A., Haagsma, J.A., Kurowicka, D., et al., 2010. Prioritizing emerging zoonoses in the Netherlands. PLoS One 5,
e13965.Havelaar, A.H., Haagsma, J.A., Mangen, M.J.J., Kemmeren, J.M., Verhoef, L.P., Vijgen, S.M., et al., 2012. Disease burden of foodborne pathogens in the Netherlands,
2009. Int. J. Food Microbiol. 156, 231–238.Havelaar, A.H., Kirk, M.D., Torgerson, P.R., Gibb, H.J., Hald, T., Lake, R.J., et al., 2015. World Health Organization global estimates and regional comparisons of the
burden of foodborne disease in 2010. PLoS Med. 12, e1001923.Hoffmann, S., Batz, M.B., Morris Jr, J.G., 2012. Annual cost of illness and quality-adjusted life year losses in the United States due to 14 foodborne pathogens. J. Food
Prot. 75, 1292–1302.Humblet, M.-F., Vandeputte, S., Albert, A., Gosset, C., Kirschvink, N., Haubruge, E., et al., 2012. Multidisciplinary and evidence-based method for prioritizing diseases
of food-producing animals and zoonoses. Emerg. Infect. Dis. 18, e1.IHME (Institute for Health Metrics and Evaluation), 2016. GBD Compare Data Visualization. IHME, University of Washington, Seattle, WA Available from. http://
vizhub.healthdata.org/gbd-compare (accessed 17/11/2017).Jakobsen, L.S., Nauta, M., Knudsen, V.K., Pires, S.M., Poulsen, M., 2015. Burden of disease estimates of cancer caused by dietary exposure to acrylamide: how
methodological choices affect the outcome. Toxicol. Lett. 238, 115.Kadohira, M., Hill, G., Yoshizaki, R., Ota, S., Yoshikawa, Y., 2015. Stakeholder prioritization of zoonoses in Japan with analytic hierarchy process method. Epidemiol.
Infect. 143, 1477–1485.Kirk, M.D., Pires, S.M., Black, R.E., Caipo, M., Crump, J.A., Devleesschauwer, B., et al., 2015. World Health Organization estimates of the global and regional disease
burden of 22 foodborne bacterial, protozoal, and viral diseases, 2010: a data synthesis. PLoS Med. 12, e1001921.Knopp, S., Steinmann, P., Keiser, J., Utzinger, J., 2012. Nematode infections: soil-transmitted helminths and Trichinella. Infect. Dis. Clin. N. Am. 26, 341–358.Kwong, J.C., Ratnasingham, S., Campitelli, M.A., Daneman, N., Deeks, S.L., Manuel, D.G., et al., 2012. The impact of infection on population health: results of the
Ontario burden of infectious diseases study. PLoS One 7, e44103.Laranjo-González, M., Devleesschauwer, B., Gabriël, S., Dorny, P., Allepuz, A., 2016. Epidemiology, impact and control of bovine cysticercosis in Europe: a systematic
review. Parasit. Vectors 9, 81.Mangen, M.J., Batz, M.B., Käsbohrer, A., Hald, T., Morris, J.G., Taylor, M., et al., 2010. Integrated approaches for the public health prioritization of foodborne and
zoonotic pathogens. Risk Anal. 30, 782–797.Mangen, M.J., Plass, D., Havelaar, A.H., Gibbons, C.L., Cassini, A., Mühlberger, N., et al., 2013. The pathogen- and incidence-based DALY approach: an appropriate
[corrected] methodology for estimating the burden of infectious diseases. PLoS One 8, e79740.Mangen, M.J., Bouwknegt, M., Friesema, I.H., Haagsma, J.A., Kortbeek, L.M., Tariq, L., et al., 2015. Cost-of-illness and disease burden of food-related pathogens in the
Netherlands, 2011. Int. J. Food Microbiol. 196, 84–93.Murray, C.J., 1994. Quantifying the burden of disease: the technical basis for disability-adjusted life years. Bull. World Health Organ. 72, 429–445.Murray, C.J., Ezzati, M., Flaxman, A.D., Lim, S., Lozano, R., Michaud, C., et al., 2012. GBD 2010: design, definitions, and metrics. Lancet 380, 2063–2066.Murrell, K.D., 1991. Economic losses resulting from food-borne parasitic zoonoses. Southeast Asian J. Trop. Med. Public Health 22, 377–381 Suppl.Ng, V., Sargeant, J.M., 2012. A quantitative and novel approach to the prioritization of zoonotic diseases in North America: a public perspective. PLoS One 7, e48519.Nissen, J., Jokelainen, P., Stensvold, C.R., Trevisan, C., Fuchs, J., Burgdorf, K.S., et al., 2017. The disease burden of congenital toxoplasmosis in Denmark, 2014. PLoS
One 12, e0178282.O'Brien, E.C., Taft, R., Geary, K., Ciotti, M., Suk, J.E., 2016. Best practices in ranking communicable disease threats: a literature review, 2015. Euro Surveill. 21, 30212.Pratdesaba, R.A., González, M., Piedrasanta, E., Mérida, C., Contreras, K., Vela, C., et al., 2001. Cyclospora cayetanensis in three populations at risk in Guatemala. J.
Clin. Microbiol. 39, 2951–2953.
B. Devleesschauwer et al. Food and Waterborne Parasitology xxx (xxxx) xxx–xxx
12
Roberts, T., Murrell, K.D., Marks, S., 1994. Economic losses caused by foodborne parasitic diseases. Parasitol. Today 10, 419–423.Robertson, L.J., Sehgal, R., Goyal, K., 2015. An Indian multicriteria-based risk ranking of foodborne parasites. Food Res. Int. 77, 315–319.Ruzante, J.M., Davidson, V.J., Caswell, J., Fazil, A., Cranfield, J.A., Henson, S.J., et al., 2010. A multifactorial risk prioritization framework for foodborne pathogens.
Risk Anal. 30, 724–742.Sanders, G.D., Neumann, P.J., Basu, A., Brock, D.W., Feeny, D., Krahn, M., et al., 2016. Recommendations for conduct, methodological practices, and reporting of cost-
effectiveness analyses: second panel on cost-effectiveness in health and medicine. JAMA 316, 1093–1103.Scharff, R.L., 2012. Economic burden from health losses due to foodborne illness in the United States. J. Food Prot. 75, 123–131.Speybroeck, N., Devleesschauwer, B., Depoorter, P., Dewulf, J., Berkvens, D., Van Huffel, X., et al., 2015. Needs and expectations regarding risk ranking in the food
chain: a pilot survey amongst decision makers and stakeholders. Food Control 54, 135–143.Stella, P., Cerf, O., Hugas, M., Koutsoumanis, K.P., Nguyen-The, C., Sofos, J.N., et al., 2013. Ranking the microbiological safety of foods: a new tool and its application
to composite products. Trends Food Sci. Technol. 33, 124–138.Torgerson, P.R., 2013. One world health: socioeconomic burden and parasitic disease control priorities. Vet. Parasitol. 195, 223–232.Torgerson, P.R., Macpherson, C.N., 2011. The socioeconomic burden of parasitic zoonoses: global trends. Vet. Parasitol. 182, 79–95.Torgerson, P.R., Schweiger, A., Deplazes, P., Pohar, M., Reichen, J., Ammann, R.W., et al., 2008. Alveolar echinococcosis: from a deadly disease to a well-controlled
infection. Relative survival and economic analysis in Switzerland over the last 35 years. J. Hepatol. 49, 72–77.Torgerson, P.R., Devleesschauwer, B., Praet, N., Speybroeck, N., Willingham, A.L., Kasuga, F., et al., 2015. World Health Organization estimates of the global and
regional disease burden of 11 foodborne parasitic diseases, 2010: a data synthesis. PLoS Med. 12, e1001920.Torgerson, P.R., Rüegg, S., Devleesschauwer, B., Abela-Ridder, B., Havelaar, A.H., Shaw, A.P.M., et al., 2017. zDALY: an adjusted indicator to estimate the burden of
zoonotic diseases. One Health (in press).Trevisan, C., Devleesschauwer, B., Schmidt, V., Winkler, A.S., Harrison, W., Johansen, M.V., 2017. The societal cost of Taenia solium cysticercosis in Tanzania. Acta
Trop. 165, 141–154.van Lier, A., McDonald, S.A., Bouwknegt, M., Kretzschmar, M.E., Havelaar, A.H., Mangen, M.J.J., et al., 2016. Disease burden of 32 infectious diseases in the
Netherlands, 2007–2011. PLoS One 11, e0153106.Van der Fels-Klerx, H.J., Van Asselt, E.D., Raley, M., Poulsen, M., Korsgaard, H., Bredsdorff, L., et al., 2016. Critical review of methods for risk ranking of food related
hazards, based on risks for human health. Crit. Rev. Food Sci. Nutr. http://dx.doi.org/10.1080/10408398.2016.1141165. (in press).WHO (World Health Organization), 2017. WHO methods and data sources for global burden of disease estimates 2000–2015. In: Global Health Estimates Technical
Paper. WHO/HIS/IER/GHE/2017.1. Available from. http://www.who.int/healthinfo/global_burden_disease/GlobalDALYmethods_2000_2015.pdf (accessed 17/11/2017).
B. Devleesschauwer et al. Food and Waterborne Parasitology xxx (xxxx) xxx–xxx
13