Embed Size (px)
Citation preview
Media Contact
860.493.4364
Investor Contact
781.522.5123
FOR IMMEDIATE RELEASE
Raytheon Technologies Reports Second Quarter 2020 Results
Accelerated cost reduction and cash conservation actions
Sales of $14.1 billion
Adjusted sales of $14.3 billion
GAAP EPS from continuing operations of a loss of $2.56 and included $2.96 of net significant and/or non-recurring charges and acquisition accounting adjustments
Adjusted EPS of $0.40
Operating cash flow from continuing operations of $210 million
Free cash flow of an outflow of $248 million
Achieved ~$600 million of cost reduction and ~$1 billion of cash conservation actions
Combined book-to-bill ratio of 1.20 at RIS and RMD segments
WALTHAM, Mass., July 28, 2020 – Raytheon Technologies Corporation (NYSE: RTX) reported
second quarter 2020 results.
“During the quarter, we continued to deliver good performance in our defense business, while we
saw challenges in commercial aerospace as expected,” said Raytheon Technologies CEO Greg
Hayes. “Looking ahead, we expect the pressures in commercial aerospace to persist as OEM
production levels and aftermarket activity remain low. As a result, we are taking difficult but
necessary actions to strengthen the business, including achieving the previously announced cost
and cash savings this year. At the same time, we continue to deliver cost synergies from the
Rockwell Collins acquisition and the Raytheon merger.”
Hayes continued, “I’m proud of what our team has accomplished in support of our customers,
suppliers, and communities during this difficult time. Our balance sheet remains strong and the
resiliency of our defense business will help us weather this storm as we continue to capitalize on
growth opportunities supported by our record backlog. I am confident that our balanced portfolio
and advanced technologies will position us for long-term value creation as the global economy
recovers.”
See “Use and Definitions of Non-GAAP Financial Measures” below for information regarding non-GAAP financial measures.
2
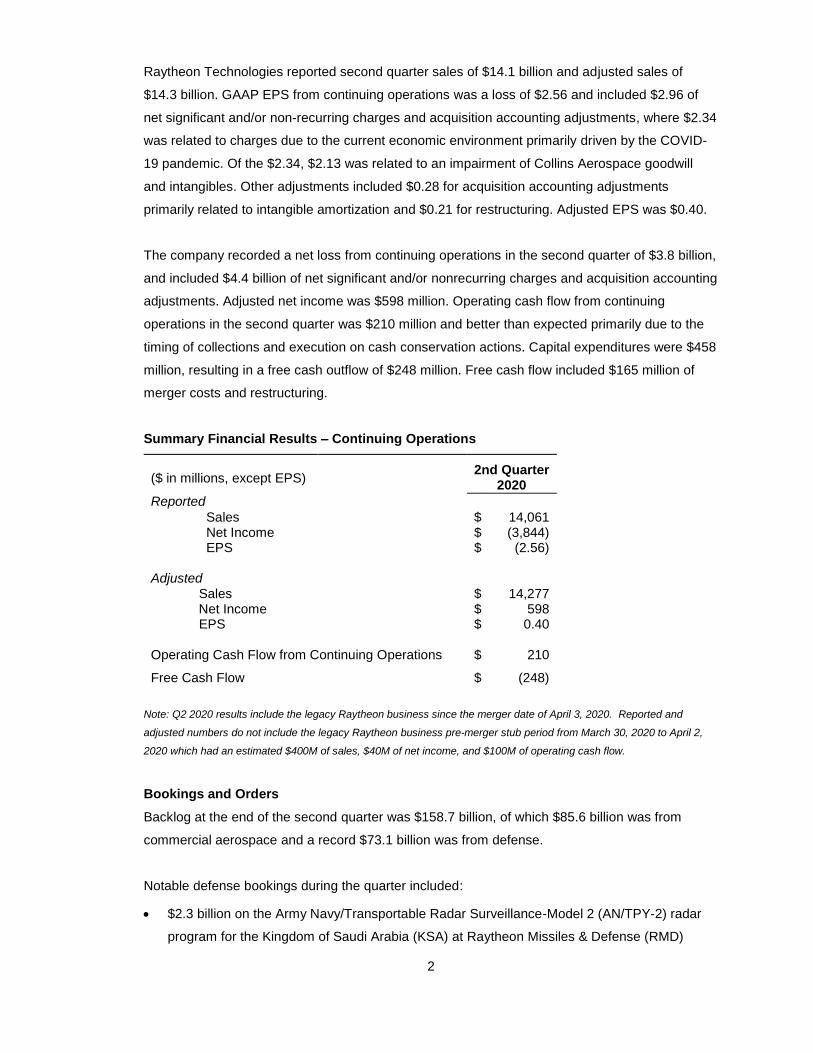
Raytheon Technologies reported second quarter sales of $14.1 billion and adjusted sales of
$14.3 billion. GAAP EPS from continuing operations was a loss of $2.56 and included $2.96 of
net significant and/or non-recurring charges and acquisition accounting adjustments, where $2.34
was related to charges due to the current economic environment primarily driven by the COVID-
19 pandemic. Of the $2.34, $2.13 was related to an impairment of Collins Aerospace goodwill
and intangibles. Other adjustments included $0.28 for acquisition accounting adjustments
primarily related to intangible amortization and $0.21 for restructuring. Adjusted EPS was $0.40.
The company recorded a net loss from continuing operations in the second quarter of $3.8 billion,
and included $4.4 billion of net significant and/or nonrecurring charges and acquisition accounting
adjustments. Adjusted net income was $598 million. Operating cash flow from continuing
operations in the second quarter was $210 million and better than expected primarily due to the
timing of collections and execution on cash conservation actions. Capital expenditures were $458
million, resulting in a free cash outflow of $248 million. Free cash flow included $165 million of
merger costs and restructuring.
Summary Financial Results – Continuing Operations
($ in millions, except EPS)
2nd Quarter
2020
Reported
Sales $ 14,061 Net Income $ (3,844) EPS $ (2.56) Adjusted Sales $ 14,277 Net Income $ 598 EPS $ 0.40 Operating Cash Flow from Continuing Operations $ 210
Free Cash Flow $ (248)
Note: Q2 2020 results include the legacy Raytheon business since the merger date of April 3, 2020. Reported and
adjusted numbers do not include the legacy Raytheon business pre-merger stub period from March 30, 2020 to April 2,
2020 which had an estimated $400M of sales, $40M of net income, and $100M of operating cash flow.
Bookings and Orders
Backlog at the end of the second quarter was $158.7 billion, of which $85.6 billion was from
commercial aerospace and a record $73.1 billion was from defense.
Notable defense bookings during the quarter included:
$2.3 billion on the Army Navy/Transportable Radar Surveillance-Model 2 (AN/TPY-2) radar
program for the Kingdom of Saudi Arabia (KSA) at Raytheon Missiles & Defense (RMD)
3
$1.4 billion on a number of classified programs at Raytheon Intelligence & Space (RIS)
$299 million for Standard Missile-3 (SM-3®) for the Missile Defense Agency (MDA) and an
international customer at RMD
In addition, during the quarter RMD was selected by the U.S. Air Force to develop the Long-
Range Standoff Weapon (LRSO).
Segment Results
The company’s reportable segments are Collins Aerospace, Pratt & Whitney, Raytheon
Intelligence & Space (RIS) and Raytheon Missiles & Defense (RMD). In connection with the
merger, the company revised its segment presentation. Prior periods have been revised to reflect
the current presentation. Refer to the accompanying tables for further details.
Collins Aerospace
2nd Quarter Six Months
($ in millions)
($ in millions )
2020 2019 % Change 2020 2019 % Change
Reported
Sales $ 4,202 $ 6,576 (36)% $ 10,640 $ 13,089 (19)%
Operating Profit $ (317) $ 1,276 (125)% $ 929 $ 2,240 (59)%
ROS (7.5)% 19.4% 8.7% 17.1%
Adjusted
Sales $ 4,298
$ 6,576 (35)% $ 10,758 $ 13,089 (18)%
Operating Profit $ 24 $ 1,293 (98)% $ 1,308 $ 2,502 (48)%
ROS 0.6% 19.7% 12.2% 19.1% Note: Prior periods have been revised to reflect the current segment presentation which excludes acquisition accounting adjustments and includes additional corporate expense allocations.
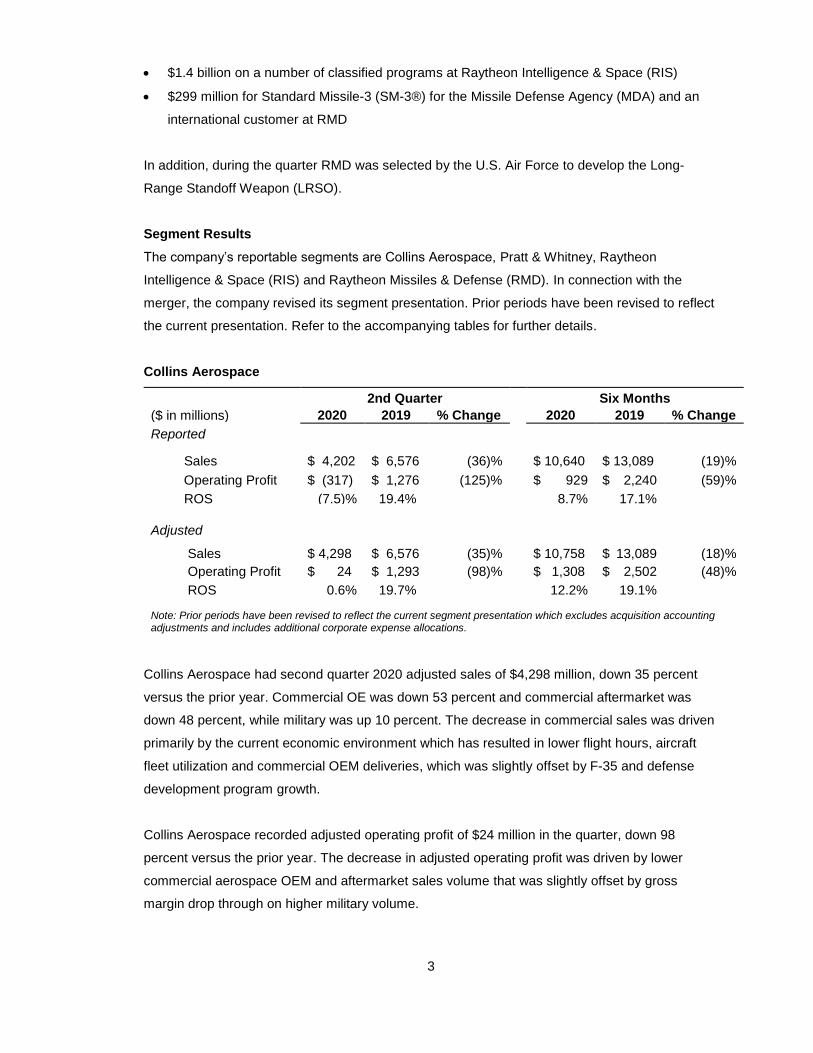
Collins Aerospace had second quarter 2020 adjusted sales of $4,298 million, down 35 percent
versus the prior year. Commercial OE was down 53 percent and commercial aftermarket was
down 48 percent, while military was up 10 percent. The decrease in commercial sales was driven
primarily by the current economic environment which has resulted in lower flight hours, aircraft
fleet utilization and commercial OEM deliveries, which was slightly offset by F-35 and defense
development program growth.
Collins Aerospace recorded adjusted operating profit of $24 million in the quarter, down 98
percent versus the prior year. The decrease in adjusted operating profit was driven by lower
commercial aerospace OEM and aftermarket sales volume that was slightly offset by gross
margin drop through on higher military volume.
4
Pratt & Whitney
2nd Quarter Six Months
($ in millions)
($ in millions )
2020 2019 % Change 2020 2019 % Change
Reported
Sales $ 3,487 $ 5,154 (32)% $ 8,840 $ 9,972 (11)%
Operating Profit $ (457) $ 449 (202)% $ 18 $ 927 (98)%
ROS (13.1)% 8.7% 0.2% 77.3%
9.3%
Adjusted
Sales $ 3,607
$ 5,154 (30)% $ 8,938 $ 9,972 (10)%
Operating Profit $ (151) $ 452 (133)% $ 364 $ 944 (61)%
ROS (4.2)% 8.8% 4.1% 9.5% Note: Prior periods have been revised to reflect the current segment presentation which excludes acquisition accounting adjustments and includes additional corporate expense allocations.
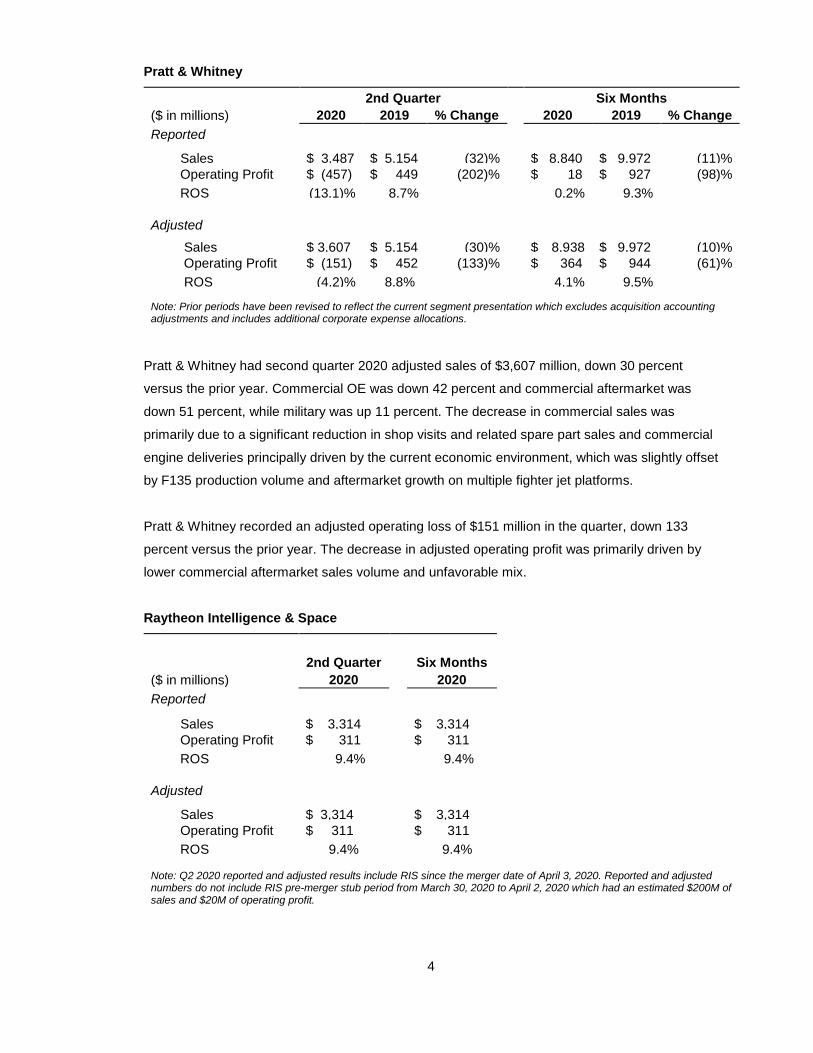
Pratt & Whitney had second quarter 2020 adjusted sales of $3,607 million, down 30 percent
versus the prior year. Commercial OE was down 42 percent and commercial aftermarket was
down 51 percent, while military was up 11 percent. The decrease in commercial sales was
primarily due to a significant reduction in shop visits and related spare part sales and commercial
engine deliveries principally driven by the current economic environment, which was slightly offset
by F135 production volume and aftermarket growth on multiple fighter jet platforms.
Pratt & Whitney recorded an adjusted operating loss of $151 million in the quarter, down 133
percent versus the prior year. The decrease in adjusted operating profit was primarily driven by
lower commercial aftermarket sales volume and unfavorable mix.
Raytheon Intelligence & Space
2nd Quarter
Six Months
($ in millions)
($ in millions )
2020 2020
Reported
Sales $ 3,314 $ 3,314
Operating Profit $ 311 $ 311
ROS 9.4% 9.4%
Adjusted
Sales $ 3,314
$ 3,314
Operating Profit $ 311 $ 311
ROS 9.4% 9.4%
Note: Q2 2020 reported and adjusted results include RIS since the merger date of April 3, 2020. Reported and adjusted numbers do not include RIS pre-merger stub period from March 30, 2020 to April 2, 2020 which had an estimated $200M of sales and $20M of operating profit.
5
RIS had second quarter adjusted sales of $3,314 million and recorded $311 million of adjusted
operating profit in the quarter.
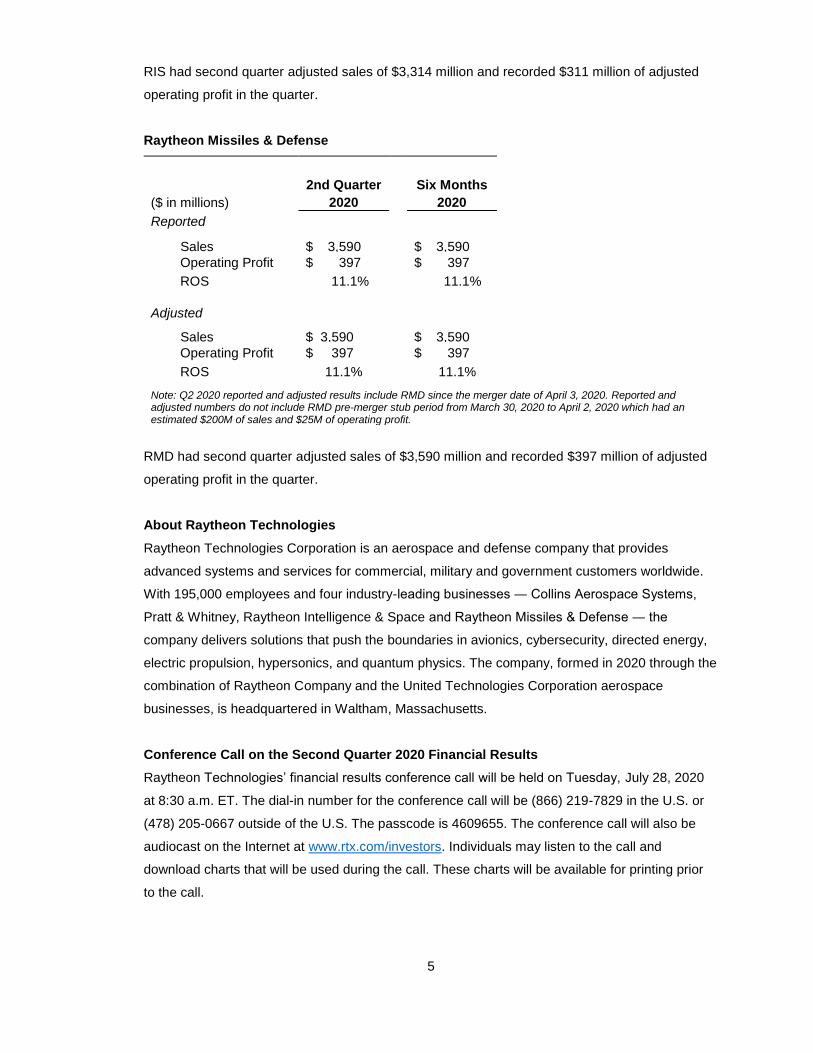
Raytheon Missiles & Defense
2nd Quarter
Six Months
($ in millions)
($ in millions )
2020 2020
Reported
Sales $ 3,590 $ 3,590
Operating Profit $ 397 $ 397
ROS 11.1% 11.1%
Adjusted
Sales $ 3,590
$ 3,590
Operating Profit $ 397 $ 397
ROS 11.1% 11.1%
Note: Q2 2020 reported and adjusted results include RMD since the merger date of April 3, 2020. Reported and adjusted numbers do not include RMD pre-merger stub period from March 30, 2020 to April 2, 2020 which had an estimated $200M of sales and $25M of operating profit.
RMD had second quarter adjusted sales of $3,590 million and recorded $397 million of adjusted
operating profit in the quarter.
About Raytheon Technologies
Raytheon Technologies Corporation is an aerospace and defense company that provides
advanced systems and services for commercial, military and government customers worldwide.
With 195,000 employees and four industry-leading businesses ― Collins Aerospace Systems,
Pratt & Whitney, Raytheon Intelligence & Space and Raytheon Missiles & Defense ― the
company delivers solutions that push the boundaries in avionics, cybersecurity, directed energy,
electric propulsion, hypersonics, and quantum physics. The company, formed in 2020 through the
combination of Raytheon Company and the United Technologies Corporation aerospace
businesses, is headquartered in Waltham, Massachusetts.
Conference Call on the Second Quarter 2020 Financial Results
Raytheon Technologies’ financial results conference call will be held on Tuesday, July 28, 2020
at 8:30 a.m. ET. The dial-in number for the conference call will be (866) 219-7829 in the U.S. or
(478) 205-0667 outside of the U.S. The passcode is 4609655. The conference call will also be
audiocast on the Internet at www.rtx.com/investors. Individuals may listen to the call and
download charts that will be used during the call. These charts will be available for printing prior
to the call.
6
Use and Definitions of Non-GAAP Financial Measures
Raytheon Technologies Corporation’s (“RTC”) reports its financial results in accordance with
accounting principles generally accepted in the United States ("GAAP").
We supplement the reporting of our financial information determined under GAAP with certain non-
GAAP financial information. The non-GAAP information presented provides investors with
additional useful information, but should not be considered in isolation or as substitutes for the
related GAAP measures. Moreover, other companies may define non-GAAP measures differently,
which limits the usefulness of these measures for comparisons with such other companies. We
encourage investors to review our financial statements and publicly-filed reports in their entirety
and not to rely on any single financial measure.
Adjusted net sales, organic sales, adjusted operating profit (loss), adjusted net income, adjusted
earnings per share (“EPS”), adjusted diluted weighted average shares outstanding, and the
adjusted effective tax rate are non-GAAP financial measures. Adjusted net sales represents
consolidated net sales from continuing operations (a GAAP measure), excluding significant items
of a non-recurring and/or nonoperational nature (hereinafter referred to as “other significant
items”). Organic sales represents consolidated net sales (a GAAP measure), excluding the impact
of foreign currency translation, acquisitions and divestitures completed in the preceding twelve
months and other significant items. Adjusted operating profit (loss) represents income from
continuing operations (a GAAP measure), excluding restructuring costs, acquisition accounting
adjustments and other significant items. Adjusted net income represents net income from
continuing operations (a GAAP measure), excluding restructuring costs, acquisition accounting
adjustments and other significant items. Adjusted EPS represents diluted earnings per share from
continuing operations (a GAAP measure), excluding restructuring costs, acquisition accounting
adjustments and other significant items. Adjusted diluted weighted average shares outstanding
represents diluted weighted average shares outstanding (a GAAP measure), including stock
awards which were anti-dilutive during the quarter and six months ended June 30, 2020 as a result
of the net loss from operations. The adjusted effective tax rate represents the effective tax rate (a
GAAP measure), excluding the tax effect of restructuring costs, acquisition accounting
adjustments and other significant items. For the Business segments, when applicable, adjustments
of net sales similarly reflect continuing operations excluding other significant items, and
adjustments of operating profit and margins similarly reflect continuing operations, excluding
restructuring, acquisition accounting adjustments and other significant items.
Free cash flow is a non-GAAP financial measure that represents cash flow from operations (a
GAAP measure) less capital expenditures. Management believes free cash flow is a useful
measure of liquidity and an additional basis for assessing RTC's ability to fund its activities,
7
including the financing of acquisitions, debt service, repurchases of RTC's common stock and
distribution of earnings to shareowners.
A reconciliation of the non-GAAP measures to the corresponding amounts prepared in accordance
with GAAP appears in the tables in this Appendix. The tables provide additional information as to
the items and amounts that have been excluded from the adjusted measures.
When we provide our expectation for free cash flow on a forward-looking basis, a reconciliation of
the differences between the non-GAAP expectations and the corresponding GAAP measures
(expected cash flow from operations) generally is not available without unreasonable effort due to
potentially high variability, complexity and low visibility as to the items that would be excluded from
the GAAP measure in the relevant future period, such as unusual gains and losses, the ultimate
outcome of pending litigation, fluctuations in foreign currency exchange rates, the impact and
timing of potential acquisitions and divestitures, and other structural changes or their probable
significance. The variability of the excluded items may have a significant, and potentially
unpredictable, impact on our future GAAP results.
Cautionary Statement Regarding Forward-Looking Statements
This press release contains statements which, to the extent they are not statements of historical
or present fact, constitute “forward-looking statements” under the securities laws. From time to
time, oral or written forward-looking statements may also be included in other information
released to the public. These forward-looking statements are intended to provide Raytheon
Technologies Corporation’s (“RTC”) management’s current expectations or plans for our future
operating and financial performance, based on assumptions currently believed to be valid.
Forward-looking statements can be identified by the use of words such as “believe,” “expect,”
“expectations,” “plans,” “strategy,” “prospects,” “estimate,” “project,” “target,” “anticipate,” “will,”
“should,” “see,” “guidance,” “outlook,” “confident,” “on track” and other words of similar meaning.
Forward-looking statements may include, among other things, statements relating to future sales,
earnings, cash flow, results of operations, uses of cash, share repurchases, tax rates, R&D
spend, other measures of financial performance, potential future plans, strategies or transactions,
credit ratings and net indebtedness, other anticipated benefits to RTC of United Technologies
Corporation’s (“UTC”) Rockwell Collins acquisition, the merger between UTC and Raytheon
Company (“Raytheon”, and such merger, the “merger”) or the spin-offs by UTC of Otis Worldwide
Corporation and Carrier Global Corporation into separate independent companies (the
“separation transactions”), including estimated synergies and customer cost savings resulting
from the merger and the separation transactions and other statements that are not solely
historical facts. All forward-looking statements involve risks, uncertainties and other factors that
may cause actual results to differ materially from those expressed or implied in the forward-
looking statements. For those statements, we claim the protection of the safe harbor for forward-
8
looking statements contained in the U.S. Private Securities Litigation Reform Act of 1995. Such
risks, uncertainties and other factors include, without limitation: (1) the effect of economic
conditions in the industries and markets in which RTC operates in the U.S. and globally and any
changes therein, including financial market conditions, fluctuations in commodity prices, interest
rates and foreign currency exchange rates, levels of end market demand in construction and in
both the commercial and defense segments of the aerospace industry, levels of air travel,
financial condition of commercial airlines, and the impact of pandemic health issues (including
COVID-19 and its effects, among other things, on global supply, demand and distribution
capabilities as the COVID-19 outbreak continues and results in an increasingly prolonged period
of disruption to air travel and commercial activities generally, and significant restrictions and
limitations on businesses, particularly within the aerospace and commercial airlines industries)
aviation safety concerns, weather conditions and natural disasters, the financial condition of our
customers and suppliers, and the risks associated with U.S. government sales (including changes
or shifts in defense spending due to budgetary constraints, spending cuts resulting from
sequestration or the allocation of funds to governmental responses to COVID-19, a government
shutdown, or otherwise, and uncertain funding of programs); (2) challenges in the development,
production, delivery, support, performance and realization of the anticipated benefits (including
our expected returns under customer contracts) of advanced technologies and new products and
services; (3) the scope, nature, impact or timing of acquisition and divestiture activity, including
among other things the integration of UTC’s and Raytheon’s businesses or the integration of RTC
with other businesses and realization of synergies and opportunities for growth and innovation
and incurrence of related costs and expenses; (4) RTC’s levels of indebtedness, capital spending
and research and development spending; (5) future availability of credit and factors that may
affect such availability, including credit market conditions and our capital structure; (6) the timing
and scope of future repurchases by RTC of its common stock, which have been suspended
through the end of the calendar year and may continue to be suspended, or discontinued or
delayed, at any time due to various factors, including market conditions and the level of other
investing activities and uses of cash; (7) delays and disruption in delivery of materials and
services from suppliers; (8) company and customer-directed cost reduction efforts and
restructuring costs and savings and other consequences thereof (including the potential
termination of U.S. government contracts and performance under undefinitized contract awards
and the potential inability to recover termination costs); (9) new business and investment
opportunities; (10) the ability to realize the intended benefits of organizational changes; (11) the
anticipated benefits of diversification and balance of operations across product lines, regions and
industries; (12) the outcome of legal proceedings, investigations and other contingencies; (13)
pension plan assumptions and future contributions; (14) the impact of the negotiation of collective
bargaining agreements and labor disputes; (15) the effect of changes in political conditions in the
U.S. and other countries in which RTC and its businesses operate, including the effect of
changes in U.S. trade policies or the U.K.’s withdrawal from the European Union, on general
9
market conditions, global trade policies and currency exchange rates in the near term and
beyond; (16) the effect of changes in tax (including U.S. tax reform enacted on December 22,
2017, which is commonly referred to as the Tax Cuts and Jobs Act of 2017), environmental,
regulatory and other laws and regulations (including, among other things, export and import
requirements such as the International Traffic in Arms Regulations and the Export Administration
Regulations, anti-bribery and anti-corruption requirements, including the Foreign Corrupt
Practices Act, industrial cooperation agreement obligations, and procurement and other
regulations) in the U.S. and other countries in which RTC and its businesses operate; (17) the
possibility that the anticipated benefits from the combination of UTC’s and Raytheon’s businesses
(including ongoing integration activities from historic UTC and Raytheon acquisitions prior to the
merger) cannot be realized in full or at all or may take longer to realize than expected, or the
possibility that costs or difficulties related to the integration of UTC’s businesses with Raytheon’s
will be greater than expected or may not result in the achievement of estimated synergies within
the contemplated time frame or at all; (18) the ability of RTC to retain and hire key personnel and
the ability of our personnel to continue to operate our facilities and businesses around the world
in light of, among other factors, the COVID-19 outbreak; (19) the expected benefits to RTC of the
separation transactions; (20) the intended qualification of (i) the merger as a tax-free
reorganization and (ii) the separation transactions as tax-free to UTC and former UTC
shareowners, in each case, for U.S. federal income tax purposes; and (21) the risk that
dissynergy costs incurred in connection with the separation transactions will exceed legacy UTC’s
or legacy Raytheon’s estimates. For additional information on identifying factors that may cause
actual results to vary materially from those stated in forward-looking statements, see the reports
of RTC, UTC and Raytheon on Forms S-4, 10-K, 10-Q and 8-K filed with or furnished to the
Securities and Exchange Commission from time to time. Any forward-looking statement speaks
only as of the date on which it is made, and RTC assumes no obligation to update or revise such
statement, whether as a result of new information, future events or otherwise, except as required
by applicable law.
RTC-IR # # #
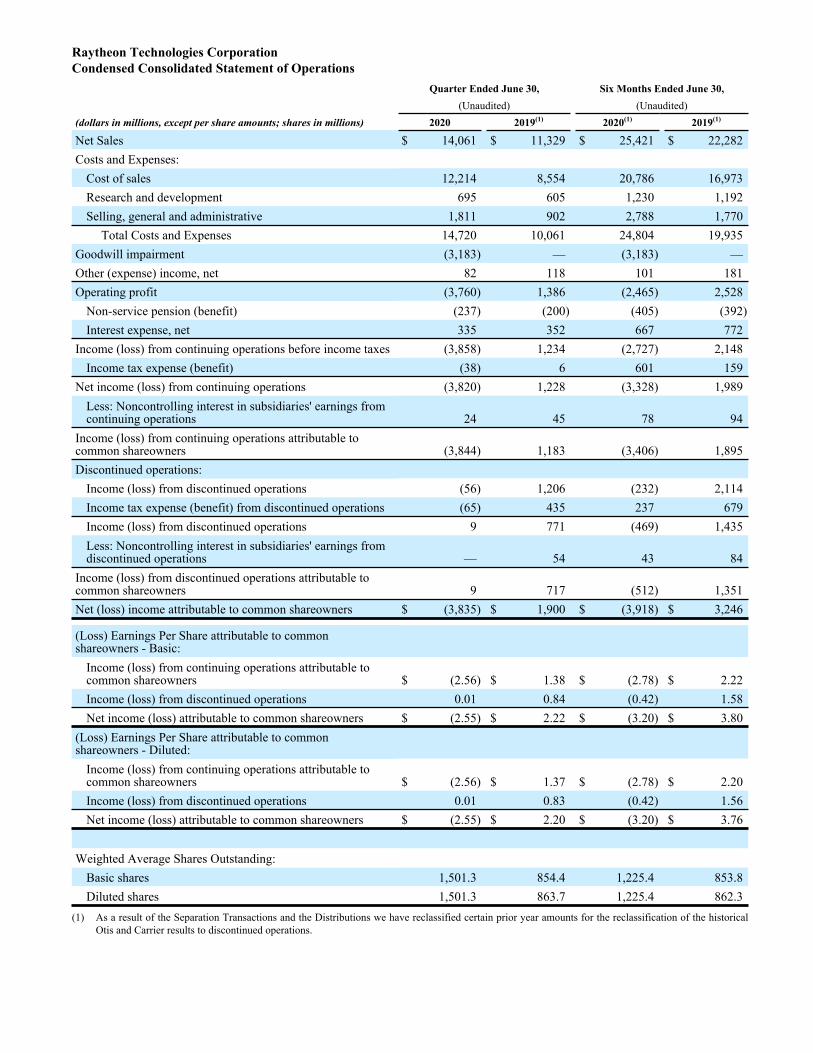
Raytheon Technologies CorporationCondensed Consolidated Statement of Operations
Quarter Ended June 30, Six Months Ended June 30,(Unaudited) (Unaudited)
(dollars in millions, except per share amounts; shares in millions) 2020 2019(1) 2020(1) 2019(1)
Net Sales $ 14,061 $ 11,329 $ 25,421 $ 22,282 Costs and Expenses:
Cost of sales 12,214 8,554 20,786 16,973 Research and development 695 605 1,230 1,192 Selling, general and administrative 1,811 902 2,788 1,770
Total Costs and Expenses 14,720 10,061 24,804 19,935 Goodwill impairment (3,183) — (3,183) — Other (expense) income, net 82 118 101 181 Operating profit (3,760) 1,386 (2,465) 2,528
Non-service pension (benefit) (237) (200) (405) (392) Interest expense, net 335 352 667 772
Income (loss) from continuing operations before income taxes (3,858) 1,234 (2,727) 2,148 Income tax expense (benefit) (38) 6 601 159
Net income (loss) from continuing operations (3,820) 1,228 (3,328) 1,989 Less: Noncontrolling interest in subsidiaries' earnings from continuing operations 24 45 78 94
Income (loss) from continuing operations attributable to common shareowners (3,844) 1,183 (3,406) 1,895 Discontinued operations:
Income (loss) from discontinued operations (56) 1,206 (232) 2,114 Income tax expense (benefit) from discontinued operations (65) 435 237 679 Income (loss) from discontinued operations 9 771 (469) 1,435 Less: Noncontrolling interest in subsidiaries' earnings from discontinued operations — 54 43 84
Income (loss) from discontinued operations attributable to common shareowners 9 717 (512) 1,351 Net (loss) income attributable to common shareowners $ (3,835) $ 1,900 $ (3,918) $ 3,246
(Loss) Earnings Per Share attributable to common shareowners - Basic:
Income (loss) from continuing operations attributable to common shareowners $ (2.56) $ 1.38 $ (2.78) $ 2.22 Income (loss) from discontinued operations 0.01 0.84 (0.42) 1.58 Net income (loss) attributable to common shareowners $ (2.55) $ 2.22 $ (3.20) $ 3.80
(Loss) Earnings Per Share attributable to common shareowners - Diluted:
Income (loss) from continuing operations attributable to common shareowners $ (2.56) $ 1.37 $ (2.78) $ 2.20 Income (loss) from discontinued operations 0.01 0.83 (0.42) 1.56 Net income (loss) attributable to common shareowners $ (2.55) $ 2.20 $ (3.20) $ 3.76
Weighted Average Shares Outstanding:Basic shares 1,501.3 854.4 1,225.4 853.8 Diluted shares 1,501.3 863.7 1,225.4 862.3
(1) As a result of the Separation Transactions and the Distributions we have reclassified certain prior year amounts for the reclassification of the historical Otis and Carrier results to discontinued operations.
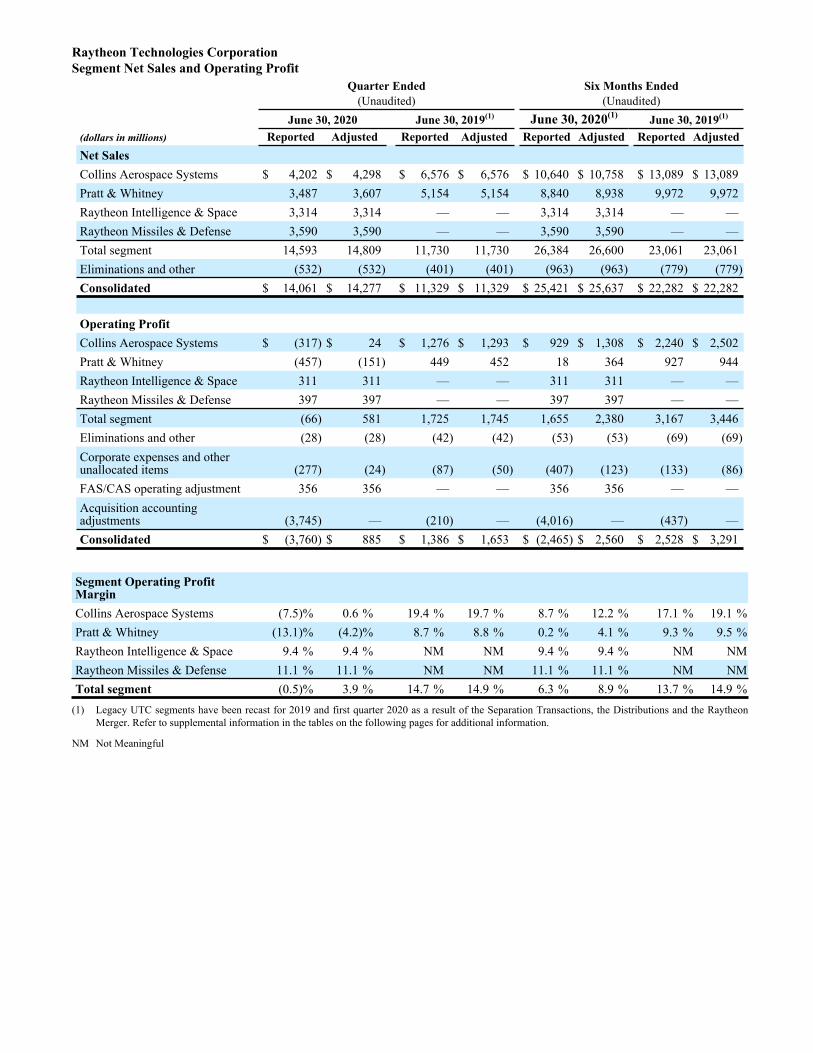
Raytheon Technologies CorporationSegment Net Sales and Operating Profit
Quarter Ended Six Months Ended(Unaudited) (Unaudited)
June 30, 2020 June 30, 2019(1) June 30, 2020(1) June 30, 2019(1)
(dollars in millions) Reported Adjusted Reported Adjusted Reported Adjusted Reported AdjustedNet SalesCollins Aerospace Systems $ 4,202 $ 4,298 $ 6,576 $ 6,576 $ 10,640 $ 10,758 $ 13,089 $ 13,089 Pratt & Whitney 3,487 3,607 5,154 5,154 8,840 8,938 9,972 9,972 Raytheon Intelligence & Space 3,314 3,314 — — 3,314 3,314 — — Raytheon Missiles & Defense 3,590 3,590 — — 3,590 3,590 — — Total segment 14,593 14,809 11,730 11,730 26,384 26,600 23,061 23,061 Eliminations and other (532) (532) (401) (401) (963) (963) (779) (779) Consolidated $ 14,061 $ 14,277 $ 11,329 $ 11,329 $ 25,421 $ 25,637 $ 22,282 $ 22,282
Operating ProfitCollins Aerospace Systems $ (317) $ 24 $ 1,276 $ 1,293 $ 929 $ 1,308 $ 2,240 $ 2,502 Pratt & Whitney (457) (151) 449 452 18 364 927 944 Raytheon Intelligence & Space 311 311 — — 311 311 — — Raytheon Missiles & Defense 397 397 — — 397 397 — — Total segment (66) 581 1,725 1,745 1,655 2,380 3,167 3,446 Eliminations and other (28) (28) (42) (42) (53) (53) (69) (69) Corporate expenses and other unallocated items (277) (24) (87) (50) (407) (123) (133) (86) FAS/CAS operating adjustment 356 356 — — 356 356 — — Acquisition accounting adjustments (3,745) — (210) — (4,016) — (437) — Consolidated $ (3,760) $ 885 $ 1,386 $ 1,653 $ (2,465) $ 2,560 $ 2,528 $ 3,291
Segment Operating Profit MarginCollins Aerospace Systems (7.5) % 0.6 % 19.4 % 19.7 % 8.7 % 12.2 % 17.1 % 19.1 %Pratt & Whitney (13.1) % (4.2) % 8.7 % 8.8 % 0.2 % 4.1 % 9.3 % 9.5 %Raytheon Intelligence & Space 9.4 % 9.4 % NM NM 9.4 % 9.4 % NM NMRaytheon Missiles & Defense 11.1 % 11.1 % NM NM 11.1 % 11.1 % NM NMTotal segment (0.5) % 3.9 % 14.7 % 14.9 % 6.3 % 8.9 % 13.7 % 14.9 %
(1) Legacy UTC segments have been recast for 2019 and first quarter 2020 as a result of the Separation Transactions, the Distributions and the Raytheon Merger. Refer to supplemental information in the tables on the following pages for additional information.
NM Not Meaningful
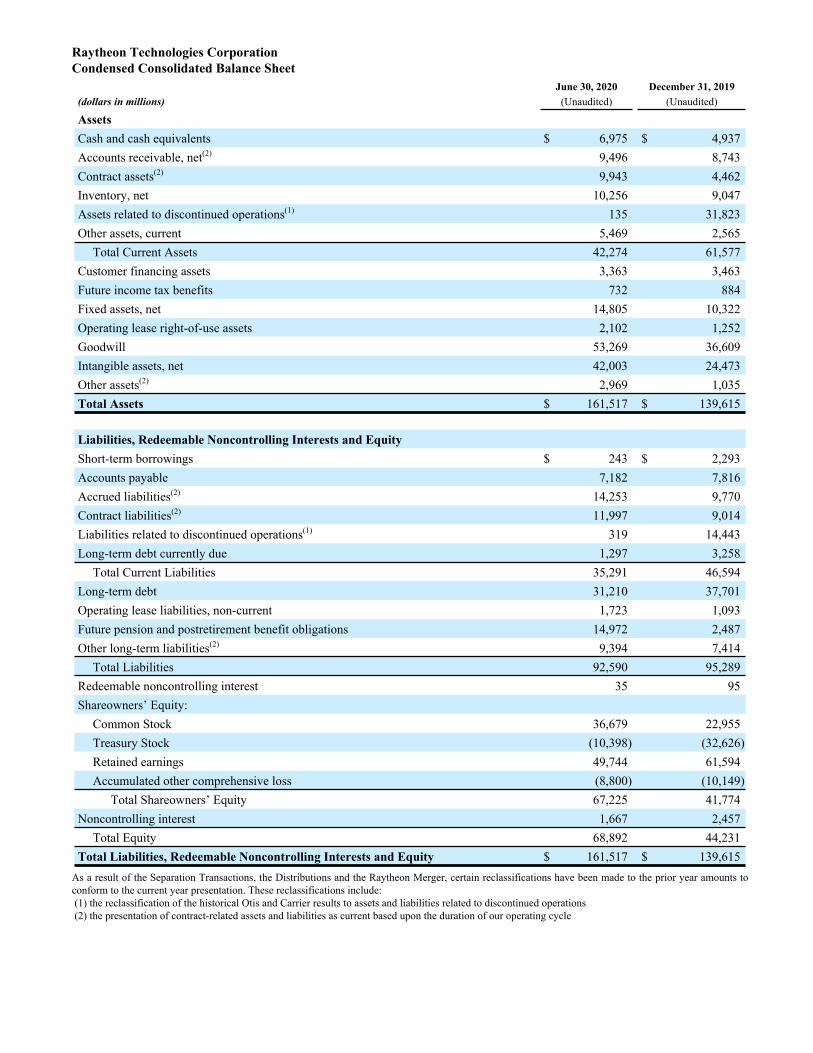
Raytheon Technologies CorporationCondensed Consolidated Balance Sheet
June 30, 2020 December 31, 2019(dollars in millions) (Unaudited) (Unaudited)
AssetsCash and cash equivalents $ 6,975 $ 4,937 Accounts receivable, net(2) 9,496 8,743 Contract assets(2) 9,943 4,462 Inventory, net 10,256 9,047 Assets related to discontinued operations(1) 135 31,823 Other assets, current 5,469 2,565
Total Current Assets 42,274 61,577 Customer financing assets 3,363 3,463 Future income tax benefits 732 884 Fixed assets, net 14,805 10,322 Operating lease right-of-use assets 2,102 1,252 Goodwill 53,269 36,609 Intangible assets, net 42,003 24,473 Other assets(2) 2,969 1,035 Total Assets $ 161,517 $ 139,615
Liabilities, Redeemable Noncontrolling Interests and EquityShort-term borrowings $ 243 $ 2,293 Accounts payable 7,182 7,816 Accrued liabilities(2) 14,253 9,770 Contract liabilities(2) 11,997 9,014 Liabilities related to discontinued operations(1) 319 14,443 Long-term debt currently due 1,297 3,258
Total Current Liabilities 35,291 46,594 Long-term debt 31,210 37,701 Operating lease liabilities, non-current 1,723 1,093 Future pension and postretirement benefit obligations 14,972 2,487 Other long-term liabilities(2) 9,394 7,414
Total Liabilities 92,590 95,289 Redeemable noncontrolling interest 35 95 Shareowners’ Equity:
Common Stock 36,679 22,955 Treasury Stock (10,398) (32,626) Retained earnings 49,744 61,594 Accumulated other comprehensive loss (8,800) (10,149)
Total Shareowners’ Equity 67,225 41,774 Noncontrolling interest 1,667 2,457
Total Equity 68,892 44,231 Total Liabilities, Redeemable Noncontrolling Interests and Equity $ 161,517 $ 139,615
As a result of the Separation Transactions, the Distributions and the Raytheon Merger, certain reclassifications have been made to the prior year amounts to conform to the current year presentation. These reclassifications include: (1) the reclassification of the historical Otis and Carrier results to assets and liabilities related to discontinued operations (2) the presentation of contract-related assets and liabilities as current based upon the duration of our operating cycle
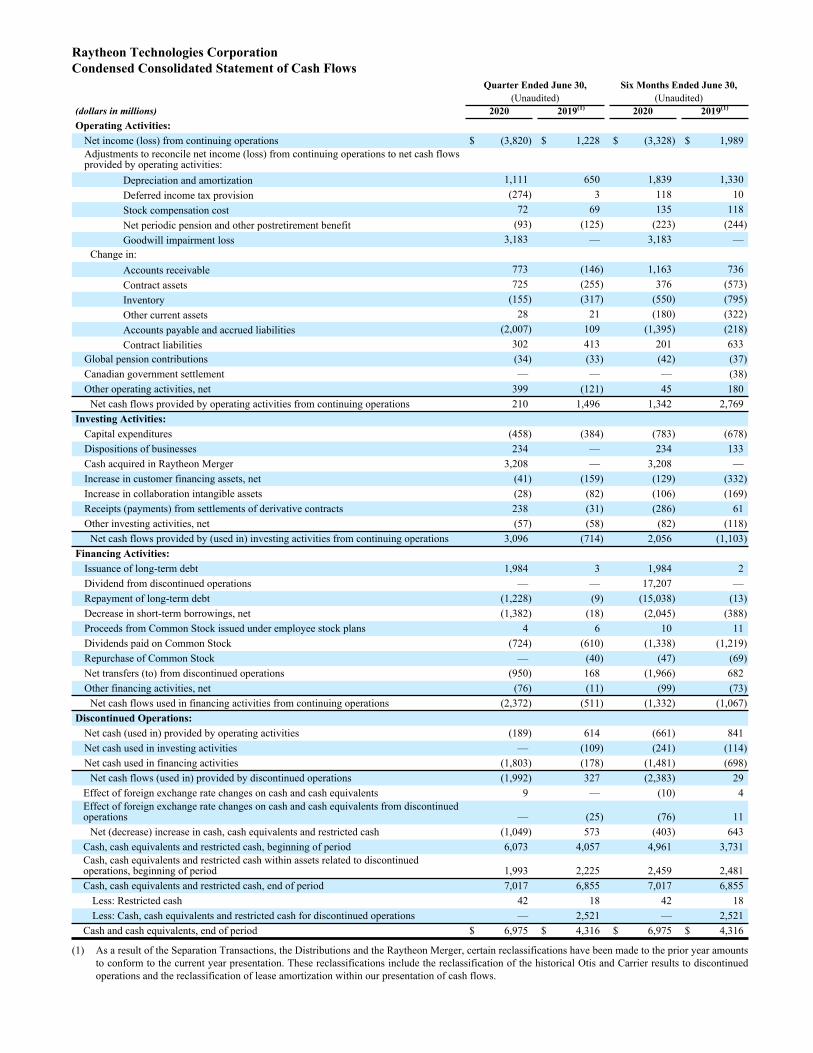
Raytheon Technologies CorporationCondensed Consolidated Statement of Cash Flows
Quarter Ended June 30, Six Months Ended June 30,(Unaudited) (Unaudited)
(dollars in millions) 2020 2019(1) 2020 2019(1)
Operating Activities:Net income (loss) from continuing operations $ (3,820) $ 1,228 $ (3,328) $ 1,989 Adjustments to reconcile net income (loss) from continuing operations to net cash flows provided by operating activities:
Depreciation and amortization 1,111 650 1,839 1,330 Deferred income tax provision (274) 3 118 10 Stock compensation cost 72 69 135 118 Net periodic pension and other postretirement benefit (93) (125) (223) (244) Goodwill impairment loss 3,183 — 3,183 —
Change in:Accounts receivable 773 (146) 1,163 736 Contract assets 725 (255) 376 (573) Inventory (155) (317) (550) (795) Other current assets 28 21 (180) (322) Accounts payable and accrued liabilities (2,007) 109 (1,395) (218) Contract liabilities 302 413 201 633
Global pension contributions (34) (33) (42) (37) Canadian government settlement — — — (38) Other operating activities, net 399 (121) 45 180
Net cash flows provided by operating activities from continuing operations 210 1,496 1,342 2,769 Investing Activities:
Capital expenditures (458) (384) (783) (678) Dispositions of businesses 234 — 234 133 Cash acquired in Raytheon Merger 3,208 — 3,208 — Increase in customer financing assets, net (41) (159) (129) (332) Increase in collaboration intangible assets (28) (82) (106) (169) Receipts (payments) from settlements of derivative contracts 238 (31) (286) 61 Other investing activities, net (57) (58) (82) (118)
Net cash flows provided by (used in) investing activities from continuing operations 3,096 (714) 2,056 (1,103) Financing Activities:
Issuance of long-term debt 1,984 3 1,984 2 Dividend from discontinued operations — — 17,207 — Repayment of long-term debt (1,228) (9) (15,038) (13) Decrease in short-term borrowings, net (1,382) (18) (2,045) (388) Proceeds from Common Stock issued under employee stock plans 4 6 10 11 Dividends paid on Common Stock (724) (610) (1,338) (1,219) Repurchase of Common Stock — (40) (47) (69) Net transfers (to) from discontinued operations (950) 168 (1,966) 682 Other financing activities, net (76) (11) (99) (73)
Net cash flows used in financing activities from continuing operations (2,372) (511) (1,332) (1,067) Discontinued Operations:
Net cash (used in) provided by operating activities (189) 614 (661) 841 Net cash used in investing activities — (109) (241) (114) Net cash used in financing activities (1,803) (178) (1,481) (698)
Net cash flows (used in) provided by discontinued operations (1,992) 327 (2,383) 29 Effect of foreign exchange rate changes on cash and cash equivalents 9 — (10) 4 Effect of foreign exchange rate changes on cash and cash equivalents from discontinued operations — (25) (76) 11
Net (decrease) increase in cash, cash equivalents and restricted cash (1,049) 573 (403) 643 Cash, cash equivalents and restricted cash, beginning of period 6,073 4,057 4,961 3,731 Cash, cash equivalents and restricted cash within assets related to discontinued operations, beginning of period 1,993 2,225 2,459 2,481 Cash, cash equivalents and restricted cash, end of period 7,017 6,855 7,017 6,855
Less: Restricted cash 42 18 42 18 Less: Cash, cash equivalents and restricted cash for discontinued operations — 2,521 — 2,521
Cash and cash equivalents, end of period $ 6,975 $ 4,316 $ 6,975 $ 4,316
(1) As a result of the Separation Transactions, the Distributions and the Raytheon Merger, certain reclassifications have been made to the prior year amounts to conform to the current year presentation. These reclassifications include the reclassification of the historical Otis and Carrier results to discontinued operations and the reclassification of lease amortization within our presentation of cash flows.
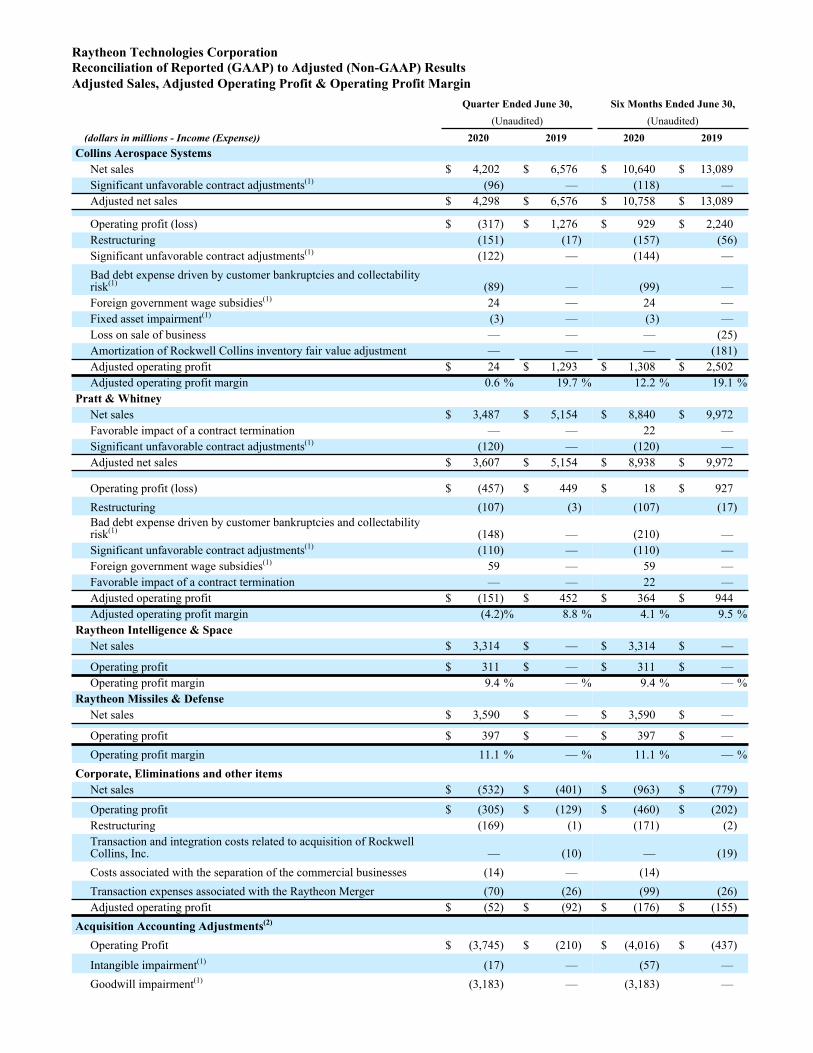
Raytheon Technologies CorporationReconciliation of Reported (GAAP) to Adjusted (Non-GAAP) Results Adjusted Sales, Adjusted Operating Profit & Operating Profit Margin
Quarter Ended June 30, Six Months Ended June 30,(Unaudited) (Unaudited)
(dollars in millions - Income (Expense)) 2020 2019 2020 2019Collins Aerospace Systems
Net sales $ 4,202 $ 6,576 $ 10,640 $ 13,089 Significant unfavorable contract adjustments(1) (96) — (118) — Adjusted net sales $ 4,298 $ 6,576 $ 10,758 $ 13,089
Operating profit (loss) $ (317) $ 1,276 $ 929 $ 2,240 Restructuring (151) (17) (157) (56) Significant unfavorable contract adjustments(1) (122) — (144) — Bad debt expense driven by customer bankruptcies and collectability risk(1) (89) — (99) — Foreign government wage subsidies(1) 24 — 24 — Fixed asset impairment(1) (3) — (3) — Loss on sale of business — — — (25) Amortization of Rockwell Collins inventory fair value adjustment — — — (181) Adjusted operating profit $ 24 $ 1,293 $ 1,308 $ 2,502 Adjusted operating profit margin 0.6 % 19.7 % 12.2 % 19.1 %
Pratt & WhitneyNet sales $ 3,487 $ 5,154 $ 8,840 $ 9,972 Favorable impact of a contract termination — — 22 — Significant unfavorable contract adjustments(1) (120) — (120) — Adjusted net sales $ 3,607 $ 5,154 $ 8,938 $ 9,972
Operating profit (loss) $ (457) $ 449 $ 18 $ 927 Restructuring (107) (3) (107) (17) Bad debt expense driven by customer bankruptcies and collectability risk(1) (148) — (210) — Significant unfavorable contract adjustments(1) (110) — (110) — Foreign government wage subsidies(1) 59 — 59 — Favorable impact of a contract termination — — 22 — Adjusted operating profit $ (151) $ 452 $ 364 $ 944 Adjusted operating profit margin (4.2) % 8.8 % 4.1 % 9.5 %
Raytheon Intelligence & SpaceNet sales $ 3,314 $ — $ 3,314 $ —
Operating profit $ 311 $ — $ 311 $ — Operating profit margin 9.4 % — % 9.4 % — %
Raytheon Missiles & DefenseNet sales $ 3,590 $ — $ 3,590 $ —
Operating profit $ 397 $ — $ 397 $ — Operating profit margin 11.1 % — % 11.1 % — %
Corporate, Eliminations and other itemsNet sales $ (532) $ (401) $ (963) $ (779)
Operating profit $ (305) $ (129) $ (460) $ (202) Restructuring (169) (1) (171) (2) Transaction and integration costs related to acquisition of Rockwell Collins, Inc. — (10) — (19) Costs associated with the separation of the commercial businesses (14) — (14) Transaction expenses associated with the Raytheon Merger (70) (26) (99) (26) Adjusted operating profit $ (52) $ (92) $ (176) $ (155)
Acquisition Accounting Adjustments(2)
Operating Profit $ (3,745) $ (210) $ (4,016) $ (437)
Intangible impairment(1) (17) — (57) — Goodwill impairment(1) (3,183) — (3,183) —
Acquisition accounting adjustments (545) (210) (776) (437)
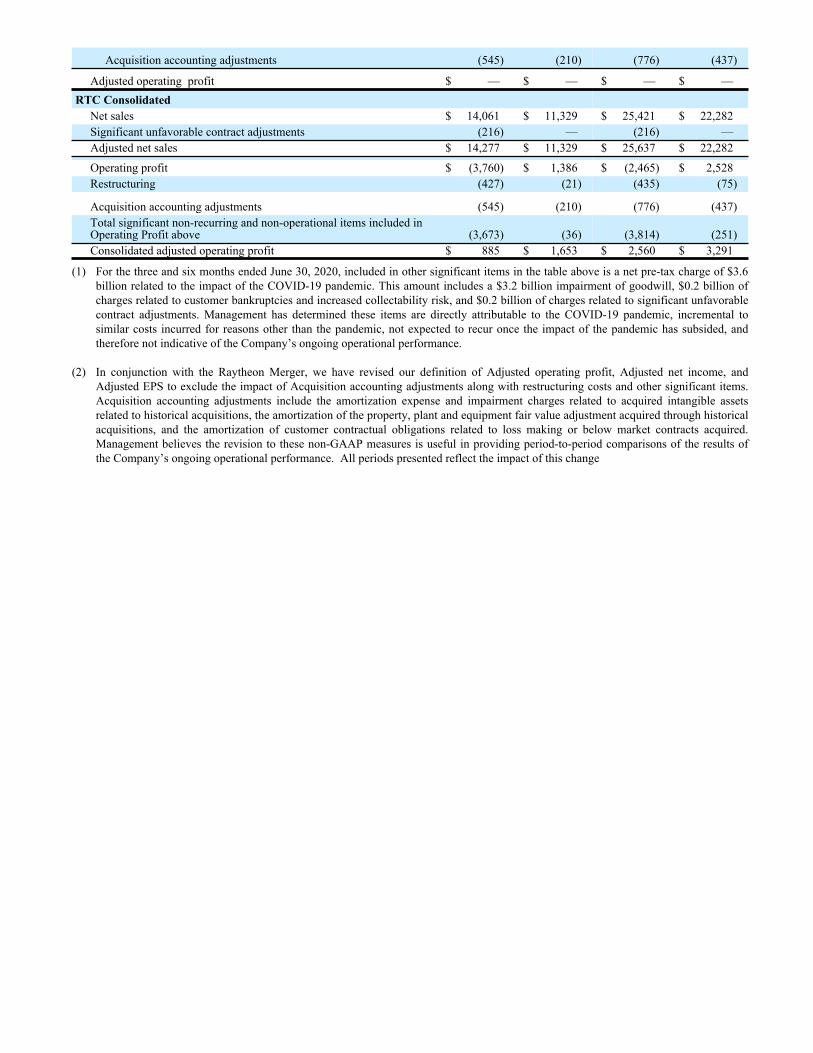
Adjusted operating profit $ — $ — $ — $ — RTC Consolidated
Net sales $ 14,061 $ 11,329 $ 25,421 $ 22,282 Significant unfavorable contract adjustments (216) — (216) — Adjusted net sales $ 14,277 $ 11,329 $ 25,637 $ 22,282
Operating profit $ (3,760) $ 1,386 $ (2,465) $ 2,528 Restructuring (427) (21) (435) (75)
Acquisition accounting adjustments (545) (210) (776) (437) Total significant non-recurring and non-operational items included in Operating Profit above (3,673) (36) (3,814) (251) Consolidated adjusted operating profit $ 885 $ 1,653 $ 2,560 $ 3,291
(1) For the three and six months ended June 30, 2020, included in other significant items in the table above is a net pre-tax charge of $3.6 billion related to the impact of the COVID-19 pandemic. This amount includes a $3.2 billion impairment of goodwill, $0.2 billion of charges related to customer bankruptcies and increased collectability risk, and $0.2 billion of charges related to significant unfavorable contract adjustments. Management has determined these items are directly attributable to the COVID-19 pandemic, incremental to similar costs incurred for reasons other than the pandemic, not expected to recur once the impact of the pandemic has subsided, and therefore not indicative of the Company’s ongoing operational performance.
(2) In conjunction with the Raytheon Merger, we have revised our definition of Adjusted operating profit, Adjusted net income, and Adjusted EPS to exclude the impact of Acquisition accounting adjustments along with restructuring costs and other significant items. Acquisition accounting adjustments include the amortization expense and impairment charges related to acquired intangible assets related to historical acquisitions, the amortization of the property, plant and equipment fair value adjustment acquired through historical acquisitions, and the amortization of customer contractual obligations related to loss making or below market contracts acquired. Management believes the revision to these non-GAAP measures is useful in providing period-to-period comparisons of the results of the Company’s ongoing operational performance. All periods presented reflect the impact of this change
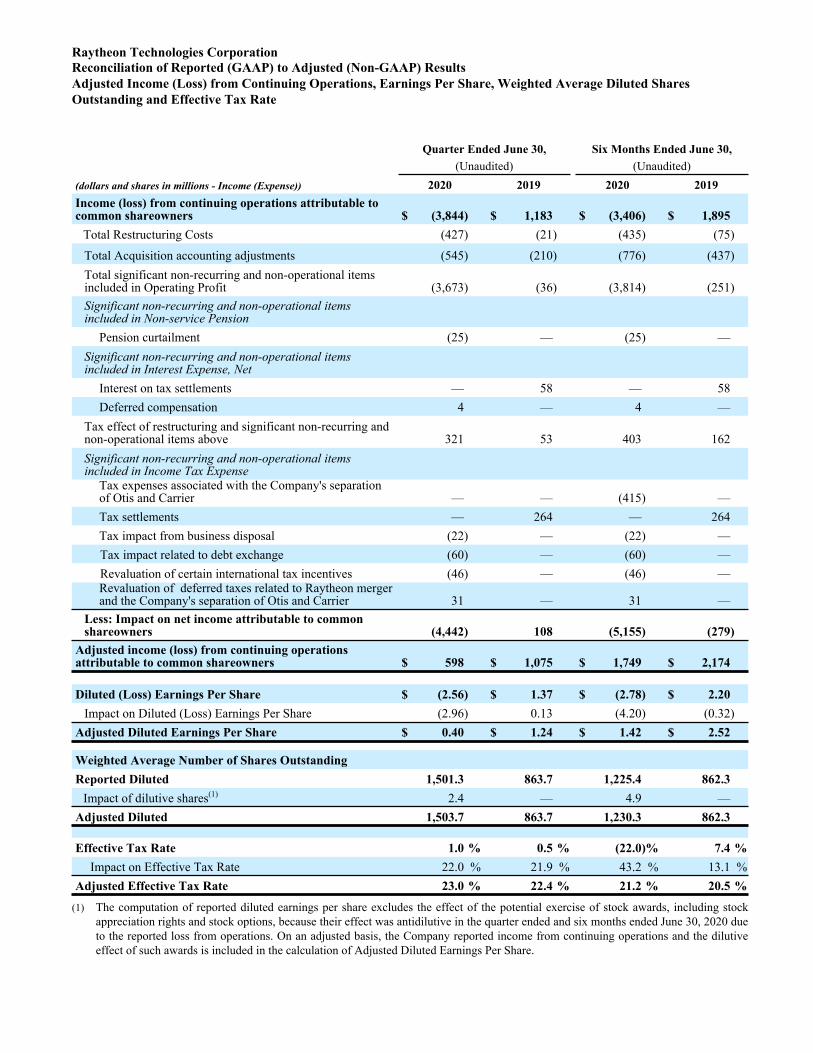
Raytheon Technologies CorporationReconciliation of Reported (GAAP) to Adjusted (Non-GAAP) Results Adjusted Income (Loss) from Continuing Operations, Earnings Per Share, Weighted Average Diluted Shares Outstanding and Effective Tax Rate
Quarter Ended June 30, Six Months Ended June 30,(Unaudited) (Unaudited)
(dollars and shares in millions - Income (Expense)) 2020 2019 2020 2019Income (loss) from continuing operations attributable to common shareowners $ (3,844) $ 1,183 $ (3,406) $ 1,895
Total Restructuring Costs (427) (21) (435) (75)
Total Acquisition accounting adjustments (545) (210) (776) (437) Total significant non-recurring and non-operational items included in Operating Profit (3,673) (36) (3,814) (251) Significant non-recurring and non-operational items included in Non-service Pension
Pension curtailment (25) — (25) — Significant non-recurring and non-operational items included in Interest Expense, Net
Interest on tax settlements — 58 — 58 Deferred compensation 4 — 4 —
Tax effect of restructuring and significant non-recurring and non-operational items above 321 53 403 162 Significant non-recurring and non-operational items included in Income Tax Expense
Tax expenses associated with the Company's separation of Otis and Carrier — — (415) — Tax settlements — 264 — 264 Tax impact from business disposal (22) — (22) —
Tax impact related to debt exchange (60) — (60) — Revaluation of certain international tax incentives (46) — (46) —
Revaluation of deferred taxes related to Raytheon merger and the Company's separation of Otis and Carrier 31 — 31 —
Less: Impact on net income attributable to common shareowners (4,442) 108 (5,155) (279)
Adjusted income (loss) from continuing operations attributable to common shareowners $ 598 $ 1,075 $ 1,749 $ 2,174
Diluted (Loss) Earnings Per Share $ (2.56) $ 1.37 $ (2.78) $ 2.20 Impact on Diluted (Loss) Earnings Per Share (2.96) 0.13 (4.20) (0.32)
Adjusted Diluted Earnings Per Share $ 0.40 $ 1.24 $ 1.42 $ 2.52
Weighted Average Number of Shares OutstandingReported Diluted 1,501.3 863.7 1,225.4 862.3
Impact of dilutive shares(1) 2.4 — 4.9 — Adjusted Diluted 1,503.7 863.7 1,230.3 862.3
Effective Tax Rate 1.0 % 0.5 % (22.0) % 7.4 %Impact on Effective Tax Rate 22.0 % 21.9 % 43.2 % 13.1 %
Adjusted Effective Tax Rate 23.0 % 22.4 % 21.2 % 20.5 %
(1) The computation of reported diluted earnings per share excludes the effect of the potential exercise of stock awards, including stock appreciation rights and stock options, because their effect was antidilutive in the quarter ended and six months ended June 30, 2020 due to the reported loss from operations. On an adjusted basis, the Company reported income from continuing operations and the dilutive effect of such awards is included in the calculation of Adjusted Diluted Earnings Per Share.
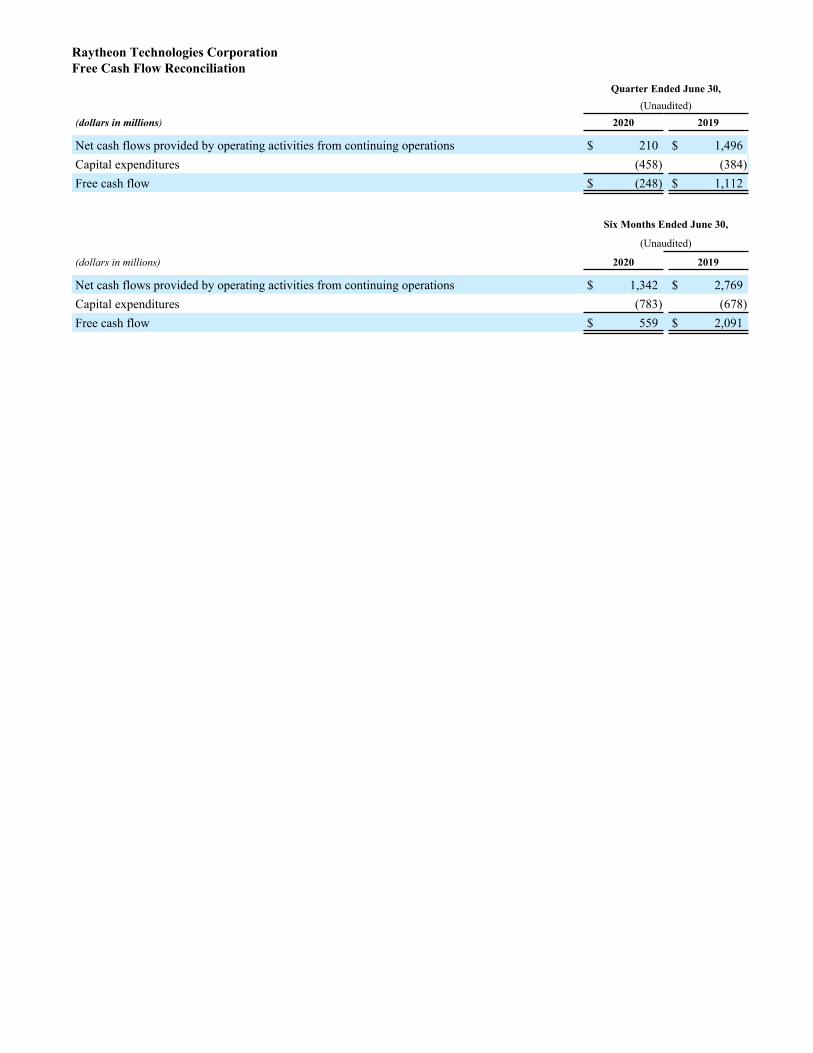
Raytheon Technologies CorporationFree Cash Flow Reconciliation
Quarter Ended June 30,(Unaudited)
(dollars in millions) 2020 2019
Net cash flows provided by operating activities from continuing operations $ 210 $ 1,496 Capital expenditures (458) (384) Free cash flow $ (248) $ 1,112
Six Months Ended June 30,
(Unaudited)
(dollars in millions) 2020 2019
Net cash flows provided by operating activities from continuing operations $ 1,342 $ 2,769 Capital expenditures (783) (678) Free cash flow $ 559 $ 2,091
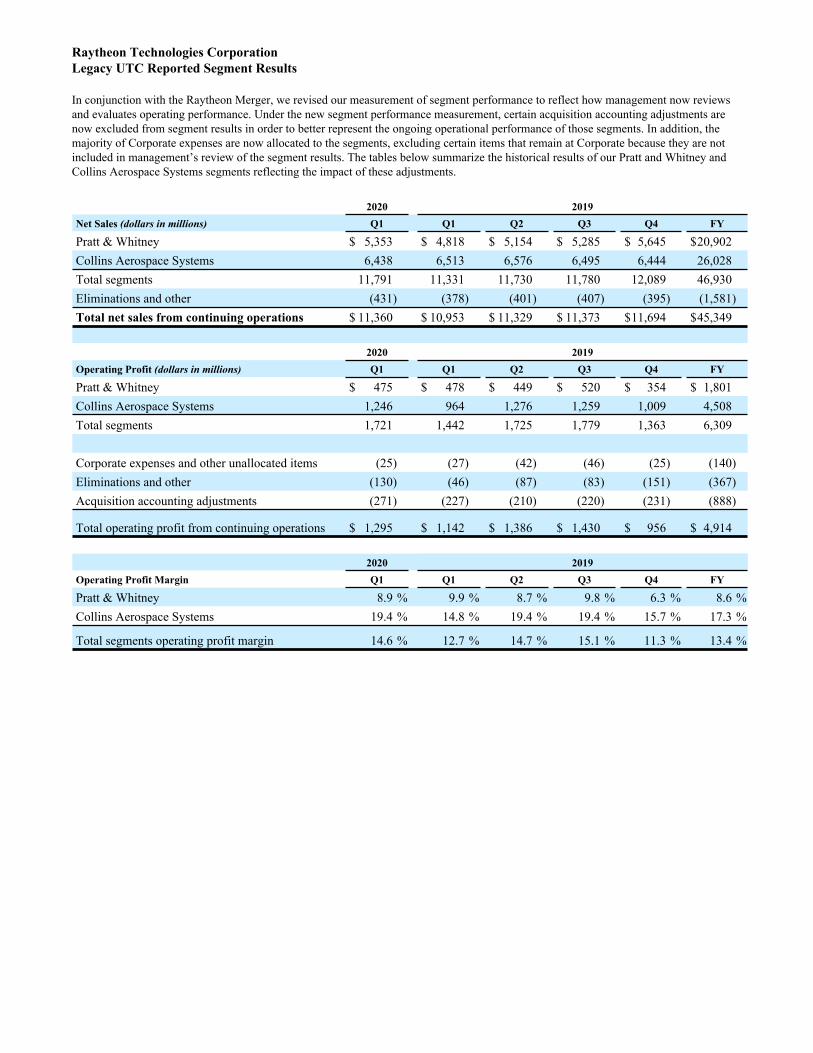
Raytheon Technologies CorporationLegacy UTC Reported Segment Results
In conjunction with the Raytheon Merger, we revised our measurement of segment performance to reflect how management now reviews and evaluates operating performance. Under the new segment performance measurement, certain acquisition accounting adjustments are now excluded from segment results in order to better represent the ongoing operational performance of those segments. In addition, the majority of Corporate expenses are now allocated to the segments, excluding certain items that remain at Corporate because they are not included in management’s review of the segment results. The tables below summarize the historical results of our Pratt and Whitney and Collins Aerospace Systems segments reflecting the impact of these adjustments.
2020 2019Net Sales (dollars in millions) Q1 Q1 Q2 Q3 Q4 FY
Pratt & Whitney $ 5,353 $ 4,818 $ 5,154 $ 5,285 $ 5,645 $ 20,902 Collins Aerospace Systems 6,438 6,513 6,576 6,495 6,444 26,028 Total segments 11,791 11,331 11,730 11,780 12,089 46,930 Eliminations and other (431) (378) (401) (407) (395) (1,581) Total net sales from continuing operations $ 11,360 $ 10,953 $ 11,329 $ 11,373 $ 11,694 $ 45,349
2020 2019Operating Profit (dollars in millions) Q1 Q1 Q2 Q3 Q4 FY
Pratt & Whitney $ 475 $ 478 $ 449 $ 520 $ 354 $ 1,801 Collins Aerospace Systems 1,246 964 1,276 1,259 1,009 4,508 Total segments 1,721 1,442 1,725 1,779 1,363 6,309
Corporate expenses and other unallocated items (25) (27) (42) (46) (25) (140) Eliminations and other (130) (46) (87) (83) (151) (367) Acquisition accounting adjustments (271) (227) (210) (220) (231) (888)
Total operating profit from continuing operations $ 1,295 $ 1,142 $ 1,386 $ 1,430 $ 956 $ 4,914
2020 2019Operating Profit Margin Q1 Q1 Q2 Q3 Q4 FY
Pratt & Whitney 8.9 % 9.9 % 8.7 % 9.8 % 6.3 % 8.6 %Collins Aerospace Systems 19.4 % 14.8 % 19.4 % 19.4 % 15.7 % 17.3 %
Total segments operating profit margin 14.6 % 12.7 % 14.7 % 15.1 % 11.3 % 13.4 %
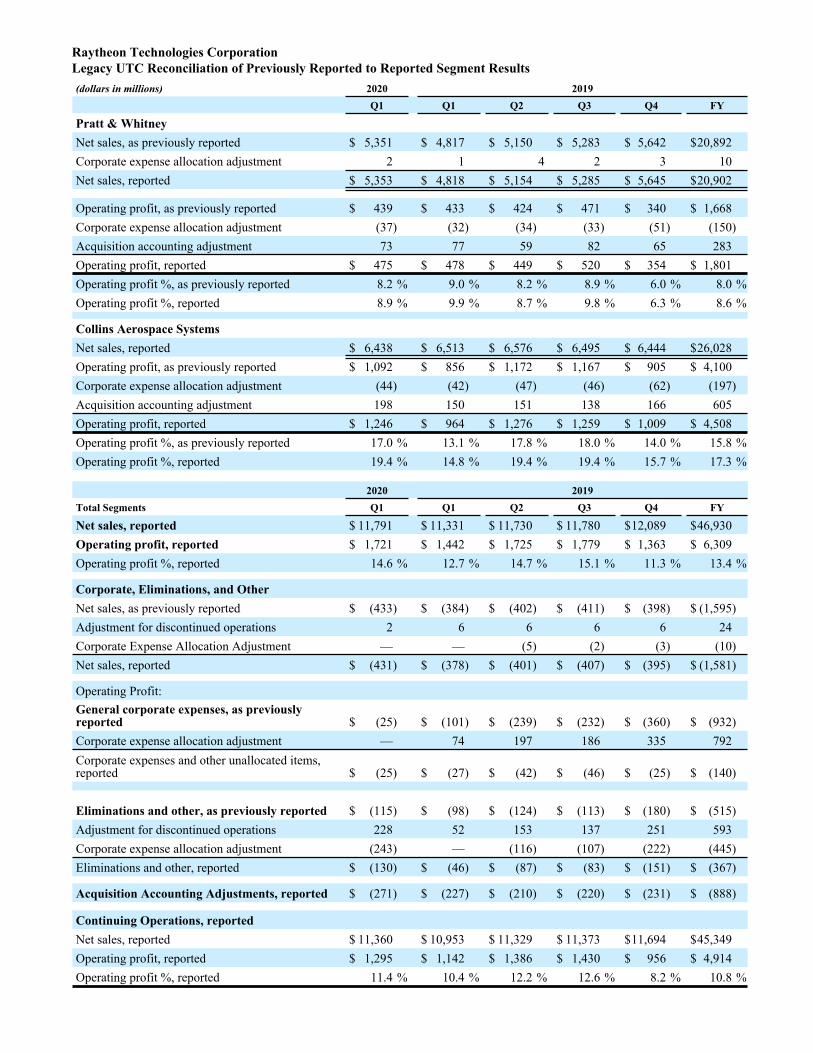
Raytheon Technologies CorporationLegacy UTC Reconciliation of Previously Reported to Reported Segment Results(dollars in millions) 2020 2019
Q1 Q1 Q2 Q3 Q4 FY
Pratt & WhitneyNet sales, as previously reported $ 5,351 $ 4,817 $ 5,150 $ 5,283 $ 5,642 $ 20,892 Corporate expense allocation adjustment 2 1 4 2 3 10 Net sales, reported $ 5,353 $ 4,818 $ 5,154 $ 5,285 $ 5,645 $ 20,902
Operating profit, as previously reported $ 439 $ 433 $ 424 $ 471 $ 340 $ 1,668 Corporate expense allocation adjustment (37) (32) (34) (33) (51) (150) Acquisition accounting adjustment 73 77 59 82 65 283 Operating profit, reported $ 475 $ 478 $ 449 $ 520 $ 354 $ 1,801 Operating profit %, as previously reported 8.2 % 9.0 % 8.2 % 8.9 % 6.0 % 8.0 %Operating profit %, reported 8.9 % 9.9 % 8.7 % 9.8 % 6.3 % 8.6 %
Collins Aerospace SystemsNet sales, reported $ 6,438 $ 6,513 $ 6,576 $ 6,495 $ 6,444 $ 26,028 Operating profit, as previously reported $ 1,092 $ 856 $ 1,172 $ 1,167 $ 905 $ 4,100 Corporate expense allocation adjustment (44) (42) (47) (46) (62) (197) Acquisition accounting adjustment 198 150 151 138 166 605 Operating profit, reported $ 1,246 $ 964 $ 1,276 $ 1,259 $ 1,009 $ 4,508 Operating profit %, as previously reported 17.0 % 13.1 % 17.8 % 18.0 % 14.0 % 15.8 %Operating profit %, reported 19.4 % 14.8 % 19.4 % 19.4 % 15.7 % 17.3 %
2020 2019Total Segments Q1 Q1 Q2 Q3 Q4 FY
Net sales, reported $ 11,791 $ 11,331 $ 11,730 $ 11,780 $ 12,089 $ 46,930 Operating profit, reported $ 1,721 $ 1,442 $ 1,725 $ 1,779 $ 1,363 $ 6,309 Operating profit %, reported 14.6 % 12.7 % 14.7 % 15.1 % 11.3 % 13.4 %
Corporate, Eliminations, and OtherNet sales, as previously reported $ (433) $ (384) $ (402) $ (411) $ (398) $ (1,595) Adjustment for discontinued operations 2 6 6 6 6 24 Corporate Expense Allocation Adjustment — — (5) (2) (3) (10) Net sales, reported $ (431) $ (378) $ (401) $ (407) $ (395) $ (1,581)
Operating Profit:General corporate expenses, as previously reported $ (25) $ (101) $ (239) $ (232) $ (360) $ (932) Corporate expense allocation adjustment — 74 197 186 335 792 Corporate expenses and other unallocated items, reported $ (25) $ (27) $ (42) $ (46) $ (25) $ (140)
Eliminations and other, as previously reported $ (115) $ (98) $ (124) $ (113) $ (180) $ (515) Adjustment for discontinued operations 228 52 153 137 251 593 Corporate expense allocation adjustment (243) — (116) (107) (222) (445) Eliminations and other, reported $ (130) $ (46) $ (87) $ (83) $ (151) $ (367)
Acquisition Accounting Adjustments, reported $ (271) $ (227) $ (210) $ (220) $ (231) $ (888)
Continuing Operations, reportedNet sales, reported $ 11,360 $ 10,953 $ 11,329 $ 11,373 $ 11,694 $ 45,349 Operating profit, reported $ 1,295 $ 1,142 $ 1,386 $ 1,430 $ 956 $ 4,914 Operating profit %, reported 11.4 % 10.4 % 12.2 % 12.6 % 8.2 % 10.8 %
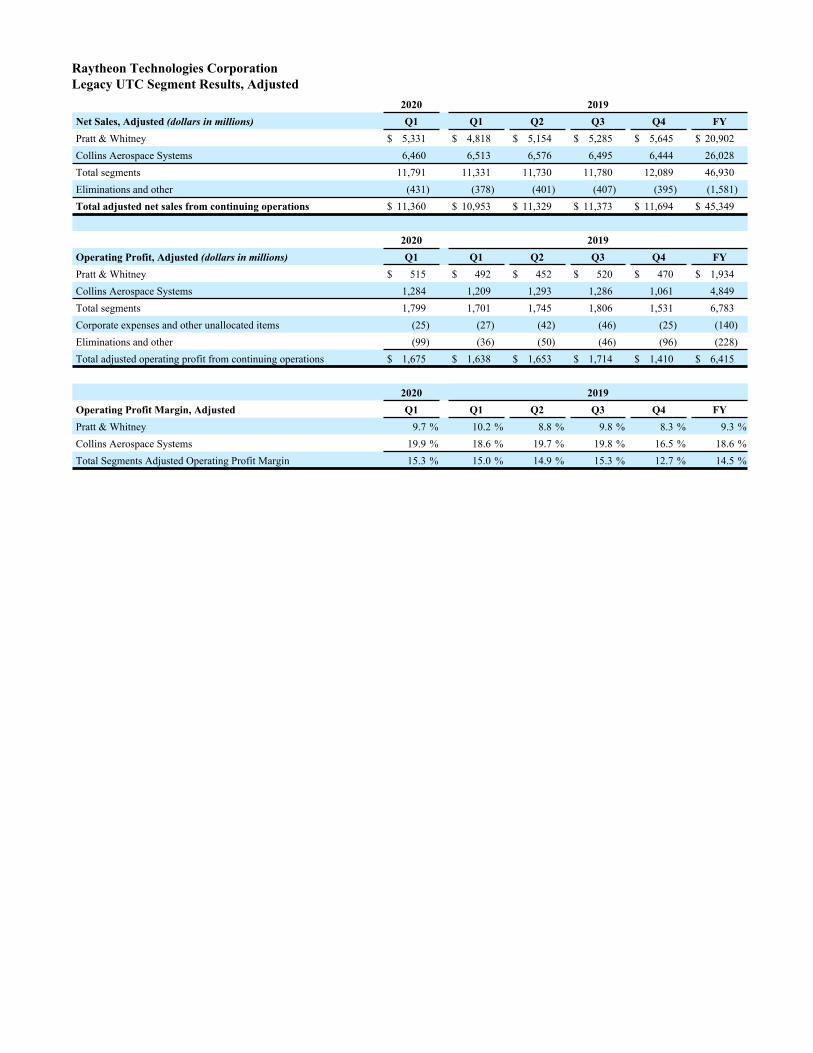
Raytheon Technologies CorporationLegacy UTC Segment Results, Adjusted
2020 2019Net Sales, Adjusted (dollars in millions) Q1 Q1 Q2 Q3 Q4 FYPratt & Whitney $ 5,331 $ 4,818 $ 5,154 $ 5,285 $ 5,645 $ 20,902 Collins Aerospace Systems 6,460 6,513 6,576 6,495 6,444 26,028 Total segments 11,791 11,331 11,730 11,780 12,089 46,930 Eliminations and other (431) (378) (401) (407) (395) (1,581) Total adjusted net sales from continuing operations $ 11,360 $ 10,953 $ 11,329 $ 11,373 $ 11,694 $ 45,349
2020 2019Operating Profit, Adjusted (dollars in millions) Q1 Q1 Q2 Q3 Q4 FYPratt & Whitney $ 515 $ 492 $ 452 $ 520 $ 470 $ 1,934 Collins Aerospace Systems 1,284 1,209 1,293 1,286 1,061 4,849 Total segments 1,799 1,701 1,745 1,806 1,531 6,783 Corporate expenses and other unallocated items (25) (27) (42) (46) (25) (140) Eliminations and other (99) (36) (50) (46) (96) (228) Total adjusted operating profit from continuing operations $ 1,675 $ 1,638 $ 1,653 $ 1,714 $ 1,410 $ 6,415
2020 2019Operating Profit Margin, Adjusted Q1 Q1 Q2 Q3 Q4 FYPratt & Whitney 9.7 % 10.2 % 8.8 % 9.8 % 8.3 % 9.3 %Collins Aerospace Systems 19.9 % 18.6 % 19.7 % 19.8 % 16.5 % 18.6 %Total Segments Adjusted Operating Profit Margin 15.3 % 15.0 % 14.9 % 15.3 % 12.7 % 14.5 %
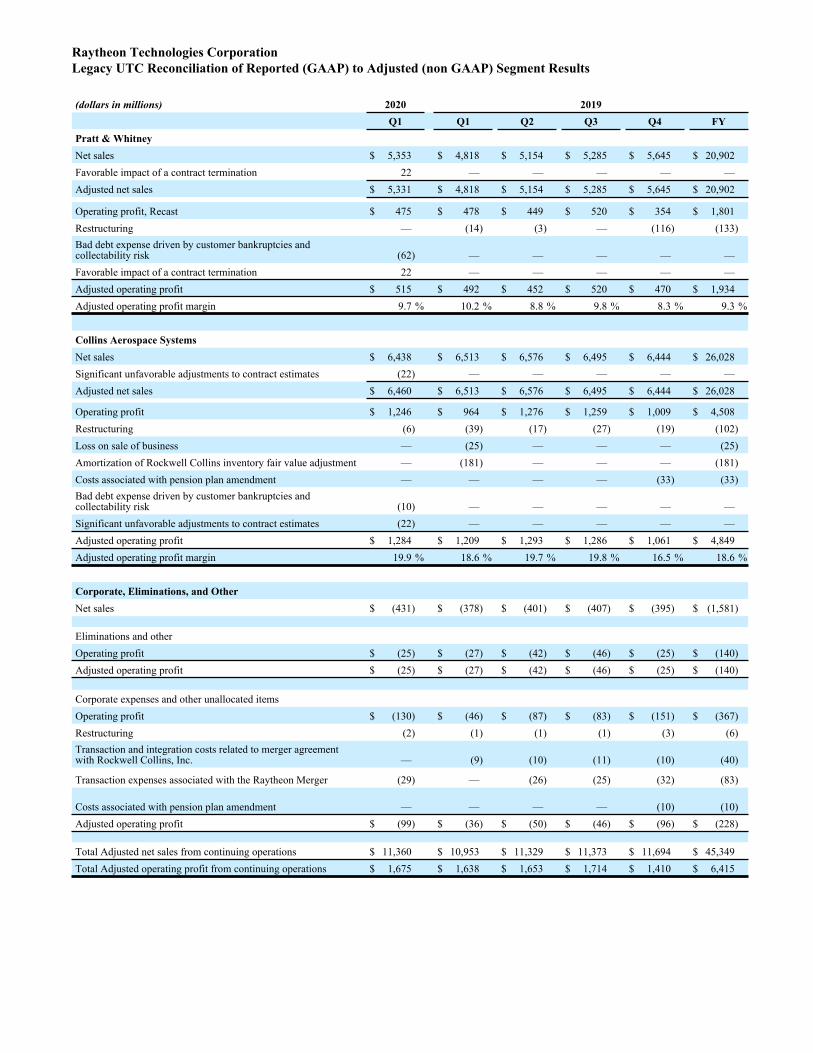
Raytheon Technologies CorporationLegacy UTC Reconciliation of Reported (GAAP) to Adjusted (non GAAP) Segment Results
(dollars in millions) 2020 2019Q1 Q1 Q2 Q3 Q4 FY
Pratt & WhitneyNet sales $ 5,353 $ 4,818 $ 5,154 $ 5,285 $ 5,645 $ 20,902 Favorable impact of a contract termination 22 — — — — — Adjusted net sales $ 5,331 $ 4,818 $ 5,154 $ 5,285 $ 5,645 $ 20,902
Operating profit, Recast $ 475 $ 478 $ 449 $ 520 $ 354 $ 1,801 Restructuring — (14) (3) — (116) (133) Bad debt expense driven by customer bankruptcies and collectability risk (62) — — — — — Favorable impact of a contract termination 22 — — — — — Adjusted operating profit $ 515 $ 492 $ 452 $ 520 $ 470 $ 1,934 Adjusted operating profit margin 9.7 % 10.2 % 8.8 % 9.8 % 8.3 % 9.3 %
Collins Aerospace SystemsNet sales $ 6,438 $ 6,513 $ 6,576 $ 6,495 $ 6,444 $ 26,028 Significant unfavorable adjustments to contract estimates (22) — — — — — Adjusted net sales $ 6,460 $ 6,513 $ 6,576 $ 6,495 $ 6,444 $ 26,028
Operating profit $ 1,246 $ 964 $ 1,276 $ 1,259 $ 1,009 $ 4,508 Restructuring (6) (39) (17) (27) (19) (102) Loss on sale of business — (25) — — — (25) Amortization of Rockwell Collins inventory fair value adjustment — (181) — — — (181) Costs associated with pension plan amendment — — — — (33) (33) Bad debt expense driven by customer bankruptcies and collectability risk (10) — — — — — Significant unfavorable adjustments to contract estimates (22) — — — — — Adjusted operating profit $ 1,284 $ 1,209 $ 1,293 $ 1,286 $ 1,061 $ 4,849 Adjusted operating profit margin 19.9 % 18.6 % 19.7 % 19.8 % 16.5 % 18.6 %
Corporate, Eliminations, and OtherNet sales $ (431) $ (378) $ (401) $ (407) $ (395) $ (1,581)
Eliminations and otherOperating profit $ (25) $ (27) $ (42) $ (46) $ (25) $ (140) Adjusted operating profit $ (25) $ (27) $ (42) $ (46) $ (25) $ (140)
Corporate expenses and other unallocated itemsOperating profit $ (130) $ (46) $ (87) $ (83) $ (151) $ (367) Restructuring (2) (1) (1) (1) (3) (6) Transaction and integration costs related to merger agreement with Rockwell Collins, Inc. — (9) (10) (11) (10) (40)
Transaction expenses associated with the Raytheon Merger (29) — (26) (25) (32) (83)
Costs associated with pension plan amendment — — — — (10) (10) Adjusted operating profit $ (99) $ (36) $ (50) $ (46) $ (96) $ (228)
Total Adjusted net sales from continuing operations $ 11,360 $ 10,953 $ 11,329 $ 11,373 $ 11,694 $ 45,349 Total Adjusted operating profit from continuing operations $ 1,675 $ 1,638 $ 1,653 $ 1,714 $ 1,410 $ 6,415