Embed Size (px)
Citation preview
For Peer Review
Euro depreciation and trade asymmetries between Germany
and Italy versus US: industry-level estimates.
Journal: Applied Economics
Manuscript ID APE-2016-0435.R1
Journal Selection: Applied Economics incorporating Applied Financial Economics
Date Submitted by the Author: 19-Mar-2017
Complete List of Authors: Lucarelli, Stefano; Universita degli Studi di Bergamo, Scienze Aziendali Economiche e Metodi Quantitativi; Centre National de la Recherche Scientifique, Centre d'Economie de la Sorbonne Andrini, Filippo; Universita degli Studi di Bergamo, Scienze Aziendali Economiche e Metodi Quantitativi Bianchi, Annamaria; Universita degli Studi di Bergamo, Scienze Aziendali
Economiche e Metodi Quantitativi
JEL Code: F31 - Foreign Exchange < F3 - International Finance < F - International Economics, F32 - Current Account Adjustment|Short-Term Capital Movements < F3 - International Finance < F - International Economics
Keywords: the J-curve, industry trade, Italy, Germany, US
Editorial Office, Dept of Economics, Warwick University, Coventry CV4 7AL, UK
Submitted Manuscript
For Peer Review
1
Euro depreciation and trade asymmetries between Germany and Italy versus US:
industry-level estimates.
Stefano Lucarelli, Filippo Umberto Andrini, Annamaria Bianchi.
University of Bergamo, Dipartimento di Scienze Aziendali Economiche e Metodi Quantitativi, 24126, Bergamo, Italia. Keywords: Industry trade, bounds testing, J-Curve, Germany, Italy, United States.
Abstract.
Since April 2014 to March 2015, the ECB expansionary monetary policy instigates a huge depreciation of the euro in terms of dollar. According to the mainstream monetary theory these dynamics should make cheaper the exports and at the same time make more expensive the imports. Has real depreciation of the euro helped in the improvement of European countries’ trade balances? Following the main methodologies in the recent literature, our study analyses the effects of this depreciation both for Italy and Germany towards US. We use industry-level data at monthly frequency. The results are different from each bilateral relationship. We find that 11 industries register a long-run improvement (8 for Italy and 3 for Germany). The J-Curve effect is proven just in six cases, always for Italy. The inverted J-curve effect is proven in eight cases, four for Germany, and four for Italy. These results seem to be an indirect demonstration of the structural asymmetries between German and Italian economies: German economic system is more able to be competitive with a strong currency, than Italy.
1. Introduction.
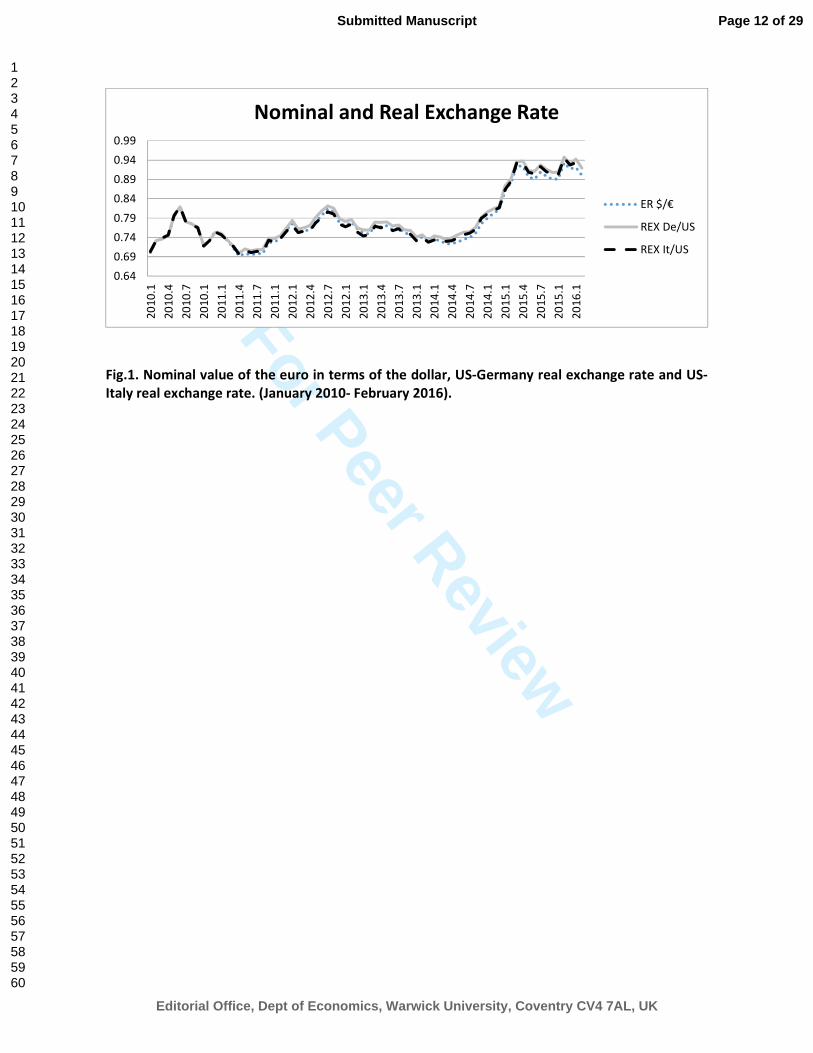
At the end of 2012 and the beginning of 2013, the euro appreciated noticeably towards other currencies. Among others, the French president François Hollande (Breuer and Klose 2015, p.1966)1 stressed the necessity to discuss about potential interventions of the European Central Bank (ECB) in order to manage the exchange rate. Indeed, a persistent appreciation of the nominal exchange rate may determine lower exports and higher imports. While the EMU precludes the traditional mechanism of individual exchange rate adjustment, euro fluctuations may be relevant for trade outside the region. Since the ECB announcement of quantitative easing in mid-20142, the euro has actually depreciated considerably against dollar, as shown in figure 1. The exchange rate goes from 0.732 €/$ (in April 2014) to 0.933 €/$ (in March 2015), then it becomes stable.
[insert figure 1]
1 About the possible advantages of the euro depreciation see the report published by Natixis (Artus 2012) 2 In mid-2014, Mario Draghi, president of the ECB, announced that the bank plans to engage in a form of quantitative easing through the purchase of private sector credit, including asset-backed securities and covered bonds, in addition to a cut of the benchmark refinancing rate from 0.15% to 0.05% and the deposit rate from -0.1% to -0.2%. On 9 March 2015 the Public Sector Purchase Programme (PSPP) actually started. The ECB decided to buy €60 billion-worth of bonds a month as a way of injecting cash into European banks. This was supposed to stop in September 2016 but, in December 2015, it has been extended by six months. The ECB has also said it will start buying regional and local government debt.
Page 1 of 29
Editorial Office, Dept of Economics, Warwick University, Coventry CV4 7AL, UK
Submitted Manuscript
123456789101112131415161718192021222324252627282930313233343536373839404142434445464748495051525354555657585960
For Peer Review
2
Fig.1. Nominal value of the euro in terms of the dollar, US-Germany real exchange rate
and US-Italy real exchange rate. (January 2010- February 2016).
Contrary to Hollandes’s thought, German business community worried especially after the ECB decision to sustain the euro depreciation through September 2015 by quantitative easing: for instance Anton Börner (president of the Federation of German Wholesale) affirmed that one of the reasons Germany has become so competitive is that German companies have been forced to contend with a strong currency, by increasing their innovative investments (Böll et al. 2015). Has real depreciation of the euro helped in the improvement of European countries’ trade balances? The European Economic Forecast, published by European Commission in February 2016, affirms that in 2015 depreciation of exchange rate represents one of the main causes of the strong increase in the current account surplus of the Euro-area (European Commission 2016, p. 5). However, the Euro-area is characterized by important structural asymmetries that are also reflected in European trade imbalances. As shown, among others, by Botta (2014, p. 10), “German exports seem to concentrate even further in the medium/high-tech segment of manufacturing goods, while a process of increasing despecialization is taking place in labour and resource-intensive or low-tech sectors”; France and other Southern European countries are characterized by an export despecialization in the medium-tech capital good sector, notwithstanding Italy confirms its specialization in the mechanical industry. Then we should expect that the depreciation of the euro versus US dollar determined different consequences for trade balances, respectively, according to the aim of our study, for Germany and Italy. The US economy represents the first non-euro trade partner for German ad Italian enterprises. Verheyen (2013) investigates whether euro volatility against the US dollar has affected bilateral German exports to the US, one of its major export destination. His empirical results indicate that, in the period prior to financial crisis, the export demand equation for the US is stable. These findings are in line with Langwasser (2009) who proves that German exports are less exchange rate-sensitive compared with other EMU countries. From a policy point of view Verheyen (2013) suggests that German exporters can cope with strong euro, which cheapens commodity imports. Breuer and Klose (2015) verifies that there are substantial regional differences in the export elasticities of the Euro- countries: particularly for Germany and Italy, the US competitors are of more importance, while for other countries, like France and Spain, are more relevant Japanese or British competitors. They also find that for Germany, Italy and Spain, the real effective exchange rate does not seem to have a significant impact on imports. They conclude that euro depreciation would on average increase the trade balance, since exchange rates elasticities on exports are found to be statistically meaningful with correct sign in most cases. In order to analyse the effects of depreciation on the trade balance, several studies tests the J-Curve effect, firstly introduced by Magee (1973).3 As known such statistical evidence
3 From the seminal contributions of Magee (1973) it has developed an intense debate about the J-Curve phenomenon. The contributions can be divided into two groups: 1. A first one collects the scientific papers that uses aggregate data in order to estimate the phenomenon; 2. A second one collects the scientific paper that uses bilateral data. Clearly this division is based on the progress of the econometric techniques. The most relevant contributions in the first group are Miles (1979) and Himarios (1985); they are the first authors that proposed a precise definition of short and long-run in this field. Miles used several tests involving both the seemingly unrelated and pooled cross-section and time series regression techniques, while Himarios provides a critique of Miles’ results. Among the first research studies in the second group see Rose and Yellen (1989), that explained the reasons for the preferable use of bilateral data, and Bahmani-Oskooee and Brooks (1999).
Page 2 of 29
Editorial Office, Dept of Economics, Warwick University, Coventry CV4 7AL, UK
Submitted Manuscript
123456789101112131415161718192021222324252627282930313233343536373839404142434445464748495051525354555657585960
For Peer Review
3
postulates that depreciation worsens the trade balance first, in the short run, and improves after the lags are realized, in the long run. Bahmani-Oskooee et al. (2013) examine the specific case of trade between Italy and US at industry level using annual data from 1979 to 2010. They find that in only 19 cases (on 106) there is a long–run improvement after a depreciation, that are highly concentrate in miscellaneous manufactures. In this study we examine the specific cases of trade between Germany and United States on one hand, and Italy and United States on the other one. To the best of our knowledge, we are the first to estimate the J curve on these countries using monthly data for the period 2010-2016. The analysis begins in 2010, when severe stress were observed in some euro area bond markets and when we observe the presence of the roots of the ECB’s non-standard monetary policy measures that continue in the present: since May 2010, in order to preserve financial stability in Europe by providing financial assistance to Eurozone states in economic difficulty, the European Financial Stabilisation Mechanism (EFSM) and the European Financial Stability Facility (EFSF) became operative. In the same period the European Central Bank initiated a revolutionary program of monetary policy implementation, the so-called Securities Markets Programme (SMP). The program consists of targeted purchases of Eurozone public and private bonds in the secondary markets in order to ensure the proper transmission of monetary policy impulses in sectors of the bond markets that the ECB considered to be dysfunctional4. The analysis stops in February 2016, when the fluctuations of the exchange rate begin to decrease. Following the main methodologies in the recent literature, we examine the bilateral trade balances for the most representative 68 individual industries, respectively 34 for Germany and 34 for Italy. We find many significant results, which vary from industry to industry and from country to country. Differently by Bahmani-Oskooee et al. (2013) the focus of this contribution are the consequences of the Euro depreciation started in April 2014, by showing in the trade asymmetries characterizing German and Italian main industries; we find that the long-run improvement after the depreciation regards eight industries for Italy and just three for Germany. It is interested to stress that, according to Rose and Yellen (1989) definition, a J-Curve effect occurs just for six Italian industries. This contribution is organized as follows: paragraph 2 outlines the methodology. The main results are presented and discussed in paragraph 3, where robustness and diagnostic checks also validated. A specific robustness test involves the estimation for a longer time period (September 2009-Semptember 2016). Paragraph 4 concludes. Our dataset is explained in the Appendix. 2. The Model and the Method.
Using a model, suggested among others by Bahmani-Oskooee and Wang (2008) who investigate the J-Curve phenomenon between China and US, we assume that the trade balance model for industry takes the following form:
ln(TB)� = α + β lnY��� + β�lnY�
�� + β�lnREX� + ε�, (i) where TB is calculated as the ratio between exports and imports for industry i, Y is the national nominal GDP for US and singularly for Italy and Germany and REX is the real
4 The 2010 represented a real turning point for the European economic policy, as shown by another important event: the Greek government accepted the bailout deal with IMF and ECB. See among others Goodhart (2013).
Page 3 of 29
Editorial Office, Dept of Economics, Warwick University, Coventry CV4 7AL, UK
Submitted Manuscript
123456789101112131415161718192021222324252627282930313233343536373839404142434445464748495051525354555657585960
For Peer Review
4
exchange rate between US and singularly Italy and Germany as well. We used Italy and Germany as home country to analyse their different behaviour towards the US.
Following the previous literature ���� is expected to carry a positive coefficient, while ��
�� is
expected to carry a negative one.5 REX is defined as NEX*(PUS/Pfc) and NEX is defined as the number of American dollars per euro. Finally � is an error term. Using equation (i) leads to two main problems. First this kind of equation does not reveal any information about the short-run dynamics and the J-Curve adjustment; secondly we need a method able to estimate at the same time variables characterized by stationary, I(0), and not stationary, I(1). Pesaran et al. (2001) prove that is possible to define cointegration between variables ruling out pre-unit-root test. Consequently we will estimate the following equation:
∆ln(!"#)� = α + ∑ γ ,�'(∆ln(TB)�'()(* + ∑ γ�,�'(∆lnY�'(
��)(*+ + ∑ γ�,�'(∆lnY�'(
��)(*+ +
∑ γ,,�'(∆lnREX�'( + θ ln(TB)�' + θ�lnY�' �� + θ�lnY�'
�� + θ,lnREX�' + μ�)(*+ (ii)
Pesaran assumption is that the variables are either I(0) or I(1). In this set-up the short run effects are inferred by the coefficients attached to first difference variables and the long-run effects are inferred by the estimates of /�, /�and/, that are normalized on / . Equation (ii) is an AutoRegressive Distribuited Lags (ARDL) methodology, based on the Error Correcting Model (ECM), proposed by Engle and Granger (1987). This approach has become the standard for similar analysis, because it gives both short-run and long-run results simultaneously and it is robust with small samples. After selecting the optimum number of lags n (out of three maximum)6 by minimising the Akaike Information Criterion (AIC), we estimate equation (ii) using OLS for each industry. Given the ARDL “bounds testing” approach, there should be a (cointegrating) relationship among the variables only if the lagged level variables are jointly significant in the estimation of equation (ii). The test is based on standard F-statistic, which specific critical values for its F-test, calculated by Pesaran et al. (2001) and Narayan (2005) for large and small samples, respectively. If the F-test lies above the “upper bound” we can say that the variables are cointegrated; if F-test lies between the upper and the lower bound the result is not conclusive, if lies below the lower bound there is not cointegration. In our case, according to Narayan (2005), the critical value for the F-test is 3.898. In case the F-statistic is smaller than the critical value, following Bahmani-Oskooee and Hegerty (2011) we perform an additional test. According to Banerjee et al. (1998) and Bahmani-Oskooee et al. (2013) we re-run the equation (ii) replacing the lagged level varibles by ECMt-1
7 and test if the coefficient of ECMt-1 is negative and significant, the t-statistic value must exceed 2.94. The cointegration relationship is confirmed in the long-run analysis. We will proceed to calculate the coefficients for both, short and long-run, just for the industries where cointegration if verified. Otherwise we only estimate the short-run coefficients. We will observe which industries benefit from a real currency depreciation in the long-run, while looking for possible J-Curve effects as well. 3. Empirical Results.
In this section we try to estimate the ECM (equation (ii)), for a significant sample of the industries that trade between US and Germany on one side, and US and Italy on the other. We
5 See moreover Haliciglu (2007) about Turkey versus its main trade partners, Bahmani-Oskooee and Zhang (2013) about China and UK and Bahmani-Oskooee et al. (2013) about Italy and US. 6 Bahami-Oskooee and Zhang (2013) used four lags maximum but the fourth lagged level variable is never significant. 7 More precisaly ε�' substitutes θ�Y�'
�� + θ�Y�' �� + θ,REX�' in the equation (ii).
Page 4 of 29
Editorial Office, Dept of Economics, Warwick University, Coventry CV4 7AL, UK
Submitted Manuscript
123456789101112131415161718192021222324252627282930313233343536373839404142434445464748495051525354555657585960
For Peer Review
5
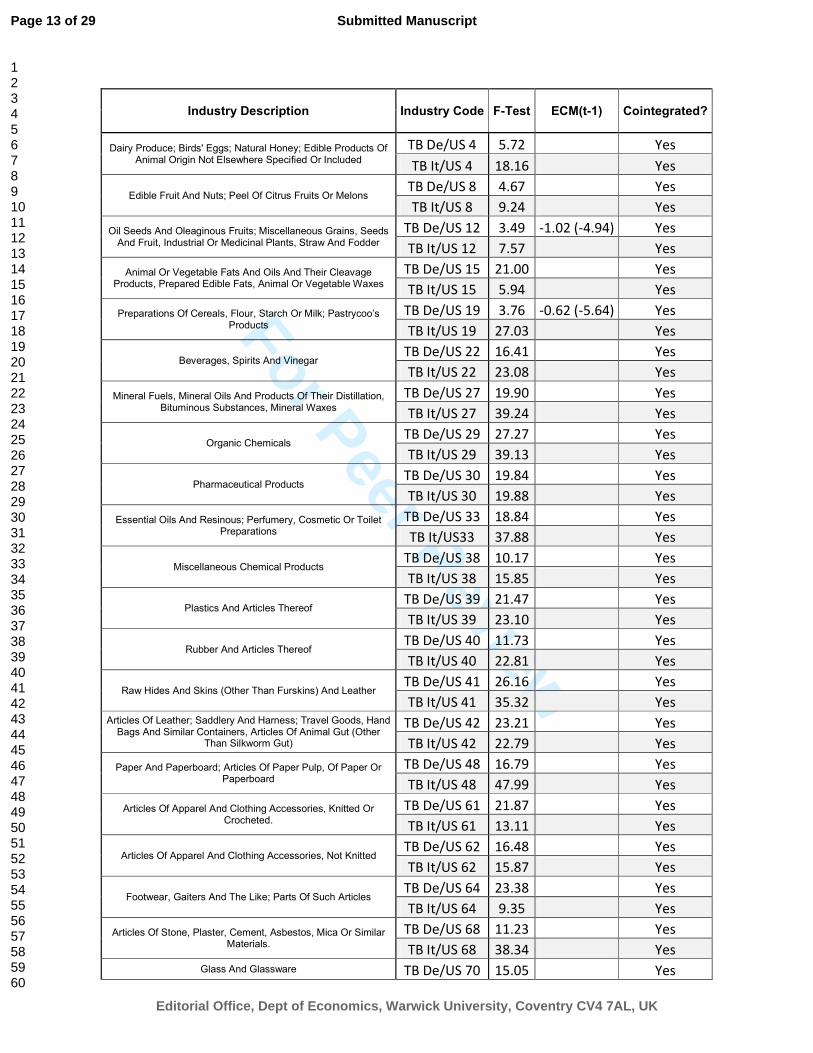
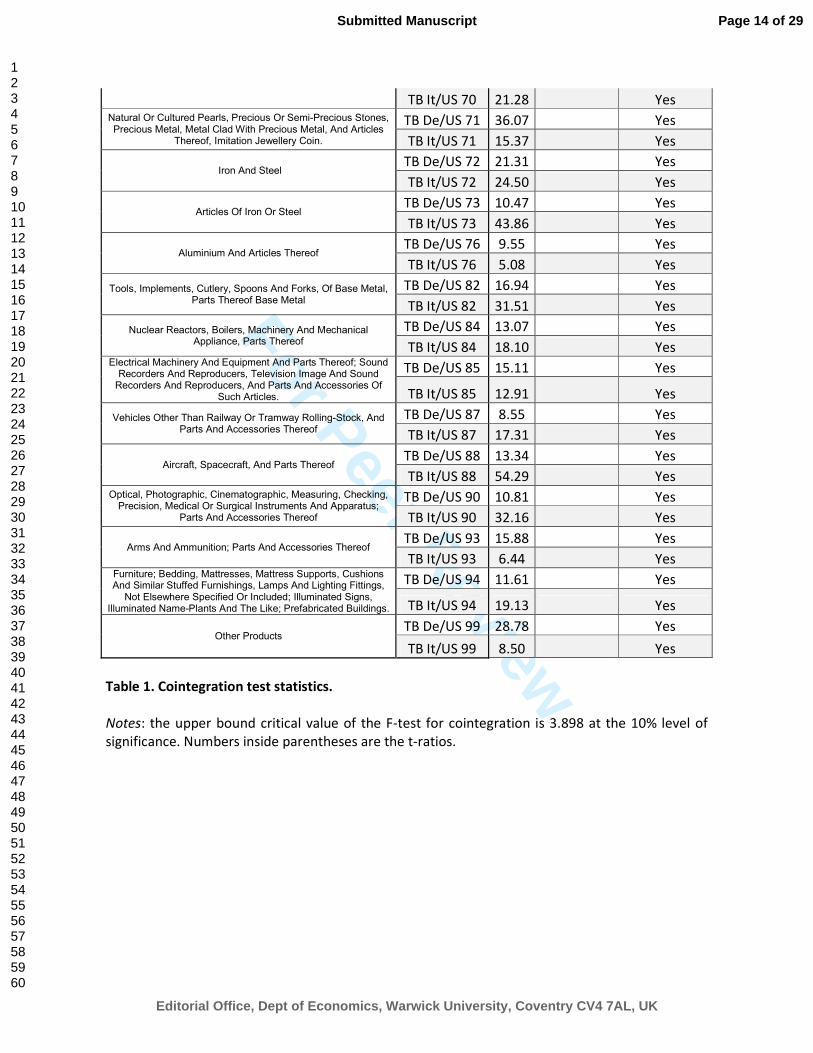
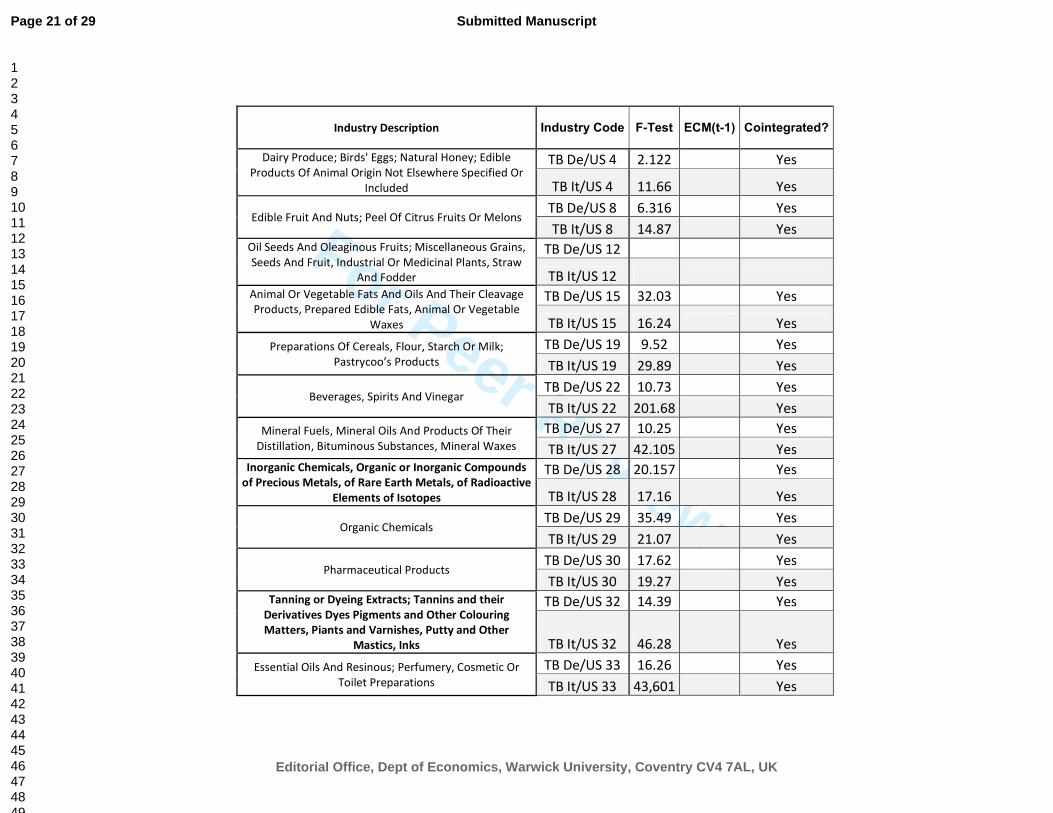
will use monthly data over the period January 2010 to February 2016.8 Eurostat database provides 99 industries. For some of them there are not enough available data. We will analyse the industries that represent, at least, the 0.5% of the bilateral trade for at least a bilateral relationship. Therefore, the estimation is limited to 34 industries for each bilateral relationship, consequently we studied 68 bilateral industry level analysis. According to Pesaran et al. (2001) and Narayan (2005) we investigate the presence of cointegration between the variables. Table 1 provides the results for the F-test. Of our 68 relationships, 66 have statistics that exceed this critical value (3.898). In order to test the presence of cointegration in the two relevant industries, we use the ECM test. In both the cases the ECM assumes a negative and significant value. Table 1 shows that the cointegration between the variables is proven for all the 68 bilateral relationships tested. It means that is possible to investigate the J-curve phenomenon also in the long run. Table 1. Cointegration test statistics.
[insert Table 1]
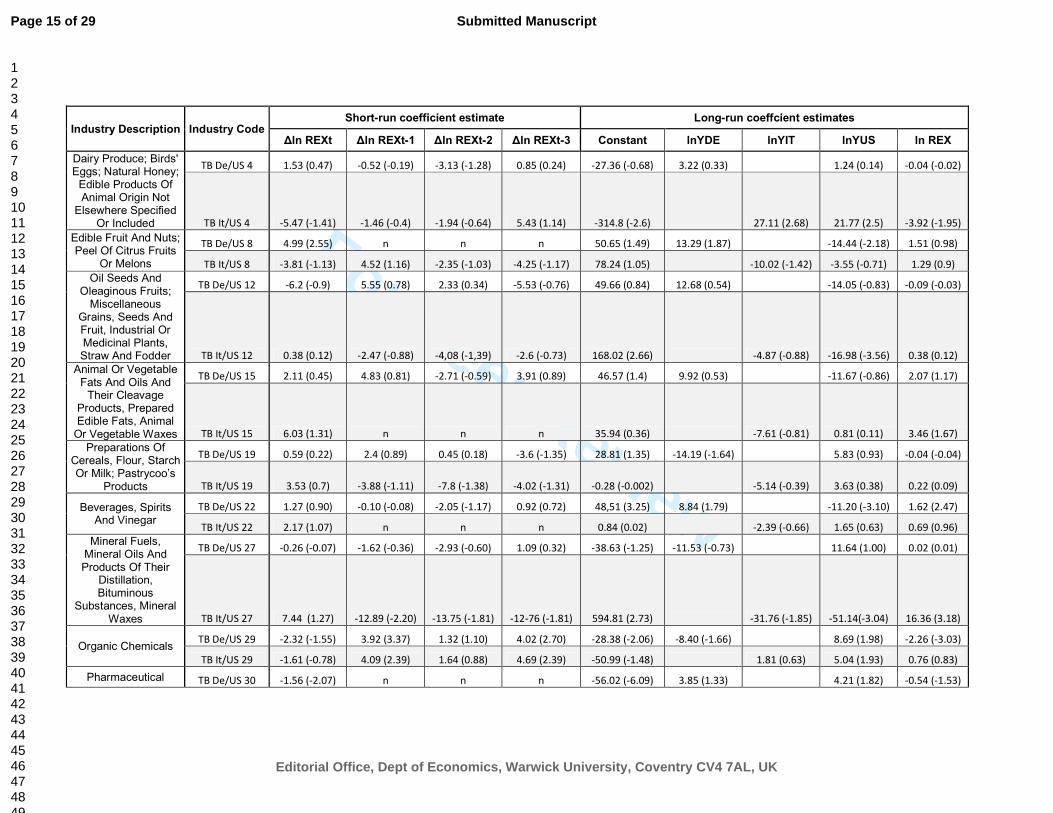
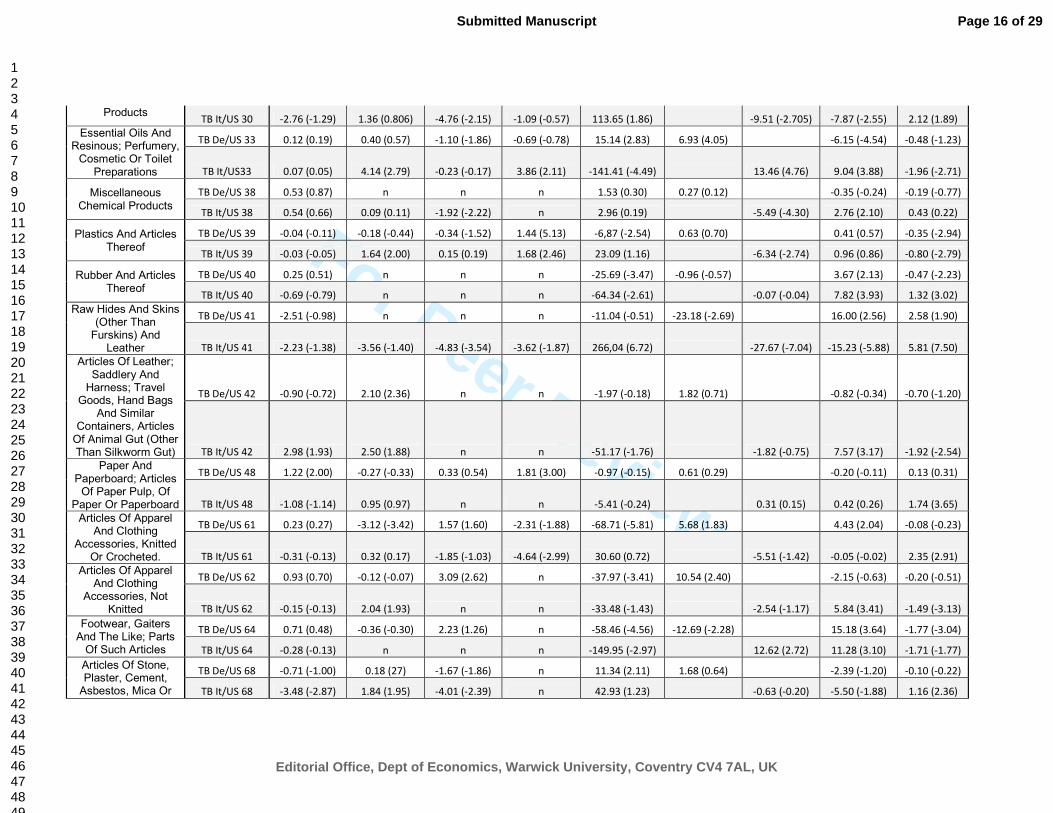
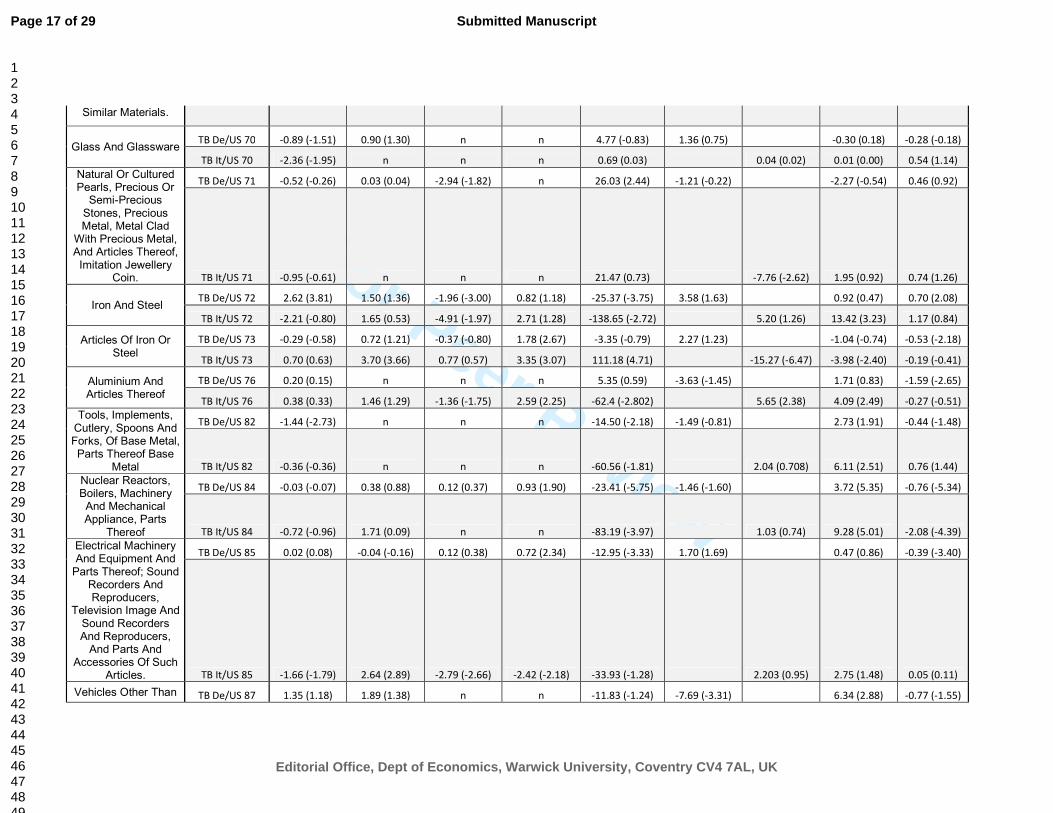
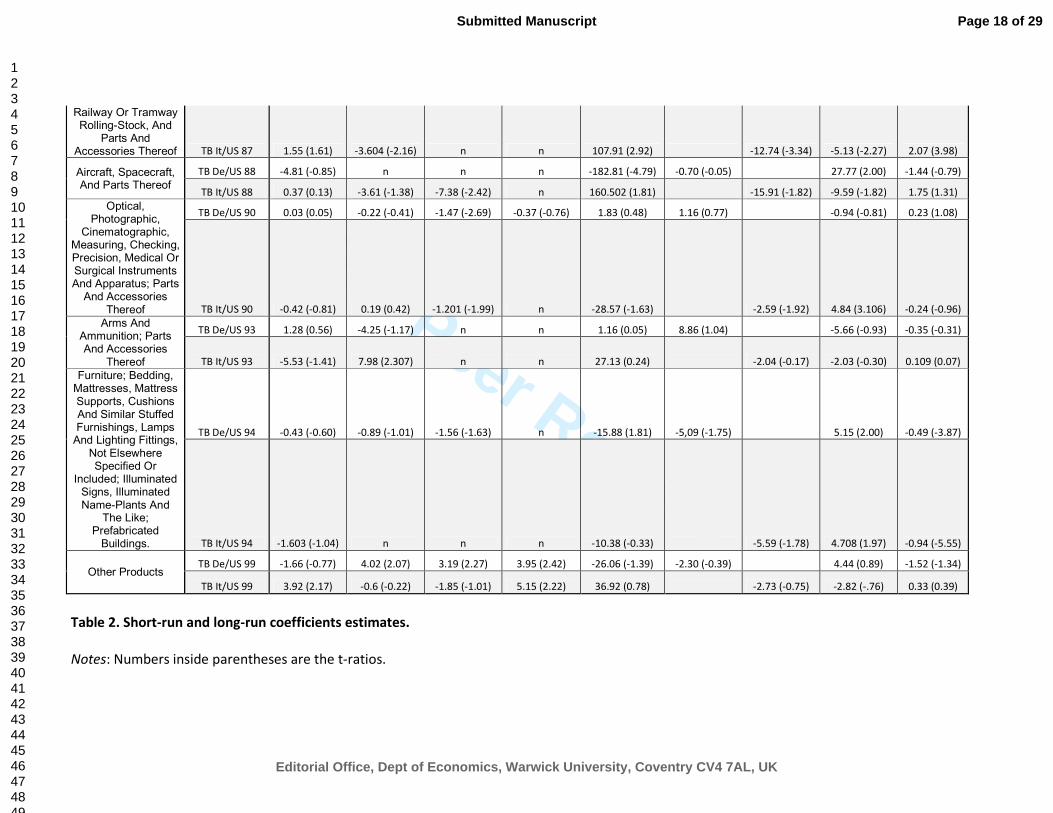
Notes: the upper bound critical value of the F-test for cointegration is 3.898 at the 10% level of significance. Numbers inside parenthesis are the t-ratios. Table2. Short-run and long-run coefficients estimates.
[insert Table 2]
Notes: Numbers inside parenthesis are the t-ratios. Table 2 provides the short and long run coefficients; in this table we have estimated the Pesaran model (equation ii) for the 34 industries and the 68 bilateral relationships. We impose the maximum of three lags and minimizing the AIC we select the optimal number of lags. The theory suggests that an increasing path of the GDP should be positively correlated with an increasing amount of the imports: coeteris paribus the trade balance account will worsen.9 Consequently the US GDP should be positively correlate with the bilateral trade balance (both for Germany and Italy), while the German and the Italian GDP should be negatively correlated with the dependent variable. The data evidence shows that the German GDP is negative and significant in only three industries (41, 64 and 87) and it is positive for three industries as well (8, 33, 62). As regard the Italian GDP we obtain that it is negative and significant for eight industries (30, 38, 39, 41, 71, 73, 87 and 90) and positive for four (4, 33, 64 and 76). Finally, the US GDP is characterized by a positive significance, in both cases, for five industries (29, 64, 82, 84 and 94) and by a negative significance for the industry number 40. The US GDP is also positive towards Germany for other three industries (61, 87 and 88) and towards Italy for other nine industries (4, 33, 38, 41, 42, 62, 72, 76 and 90); it is negative and significant towards Germany for other four industries (8, 22, 33 and 41), and towards Italy for other six (12, 27, 30, 68, 73 and 87). Studying the J-curve phenomenon according to Rose and Yellen (1989) we can observe that a significant negative value (for the real exchange rate) in the short run is followed by a positive
8 See the appendix for the complete explanation about the dataset. 9 This proposition is coherent with the so called multiplier approach as theorized by Meade (1948 and 1949) and described in many international economics handbooks, see for instance Gandolfo (2002), chap. 8.
Page 5 of 29
Editorial Office, Dept of Economics, Warwick University, Coventry CV4 7AL, UK
Submitted Manuscript
123456789101112131415161718192021222324252627282930313233343536373839404142434445464748495051525354555657585960
For Peer Review
6
and significant value in the long run just in six cases, always between US and Italy (27, 30, 41, 61, 68 and 87). An inverted J-curve effect is present in eight cases, four for Germany (29, 39, 73 and 84) and four for Italy (33, 39, 42 and 62). As known Bahmani-Oskooee et al. (2011) followed a different definition of the J-curve: only short run results are used in order to describe the J-curve as a negative and significant real exchange rate coefficient. According with this definition, we can find the presence of J-curve in other thirteen cases, seven for Germany (30, 33, 61, 68, 72, 82 and 90) and six for Italy (38, 70, 72, 85, 88 and 90). The evidence shows that just two industries are interested by the J-curve phenomenon both for Italy and Germany: “Iron and Steel” (72) and “Optical, Photographic, Cinematographic, Measuring, Checking, Precision, Medical or Surgical Instruments and Apparatus, Parts and Accessories thereof” (90). 3.1. Robustness and Diagnostic Checks.
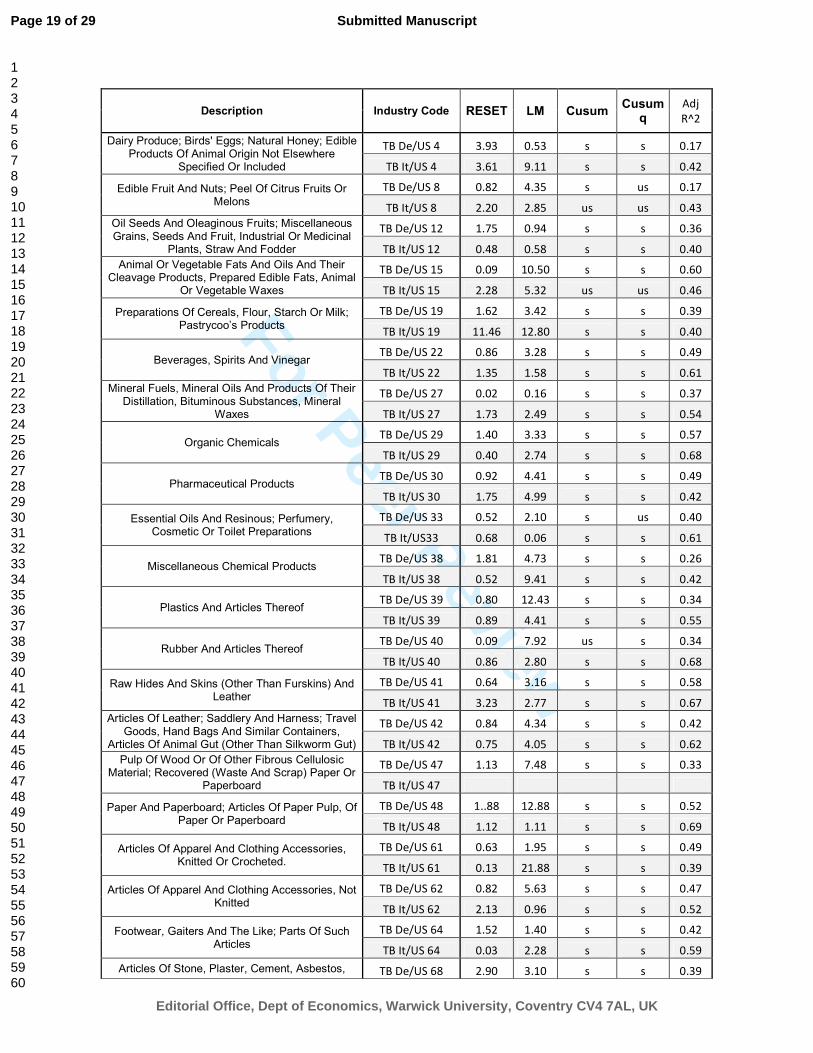
In order to validate the robustness of the estimated ECMs throughout the sample period, we examine the stability of the long-run coefficients together with the short-run dynamics following Pesaran and Pesaran (1997) by applying the Cumulative Sum (CUSUM) and Cumulative Sum of Square (CUSUMQ) tests on the model residuals. As known, CUSUM and CUSUMQ are due to Brown, Durbin and Evans (1975). Table 3 shows that the hypothesis of parameters stability cannot be rejected at the 5% significance level for the great majority of the cases: only in three situations both CUSUM and CUSUMQ reveal parameters instability (8, 15, 85 always in Italy). Table 3. Robustness and Diagnostic statistics.
[insert Table 3]
Notes: Lagrange multiplier test of residual serial correlation; RESET, Ramsey’s test for functional test. Both are distributed as a 2� with one degree of freedom; CUSUM, cumulative sum of residuals; CUSUMSQ, cumulative sum of squared residuals; S, ‘Stable’, US, ‘Unstable’. Following the literature and the previous studies we also report in Table 3 the main diagnostic statistics: the Lagrange Multiplier (LM) to test for autocorrelation and the Regression Equation Specification Error Test (RESET), for functional misspecification of optimum models; these are both distributed as a 2� with one degree of freedom, in this case the critical value is 3.84. Table 3 shows coefficients that are lower than 3.84 in the majority of cases, implying autocorrelation-free residuals in most models as well as confirming correctly specified optimum models. Finally, we add the Adjusted R2 to provide the goodness of the estimations: the results are in line with previous contributions by Payne (2008) and Bahmani-Oskooee & Zang (2013), among others. We may conclude that estimated ECMs are correctly specified and the residuals are well behaved. Another robustness test involves the estimation of the equations for the following longer time period: from September 2009 - when the first serious signals of the global crisis involved EMU countries - to September 2016, i.e. the last available data. Again we focus on the industries that represent at least the 0.5% of the bilateral trade for at least a bilateral relationship. Our sample is now composed by 72 bilateral relationships (36 for Italy and 36 for Germany). Differently from the previous analysis (Jan. 2010 - Feb. 2016), industries 12 and 61 are not part of the sample, while we now comprehend industries 28, 32, 69 and 74.
Page 6 of 29
Editorial Office, Dept of Economics, Warwick University, Coventry CV4 7AL, UK
Submitted Manuscript
123456789101112131415161718192021222324252627282930313233343536373839404142434445464748495051525354555657585960
For Peer Review
7
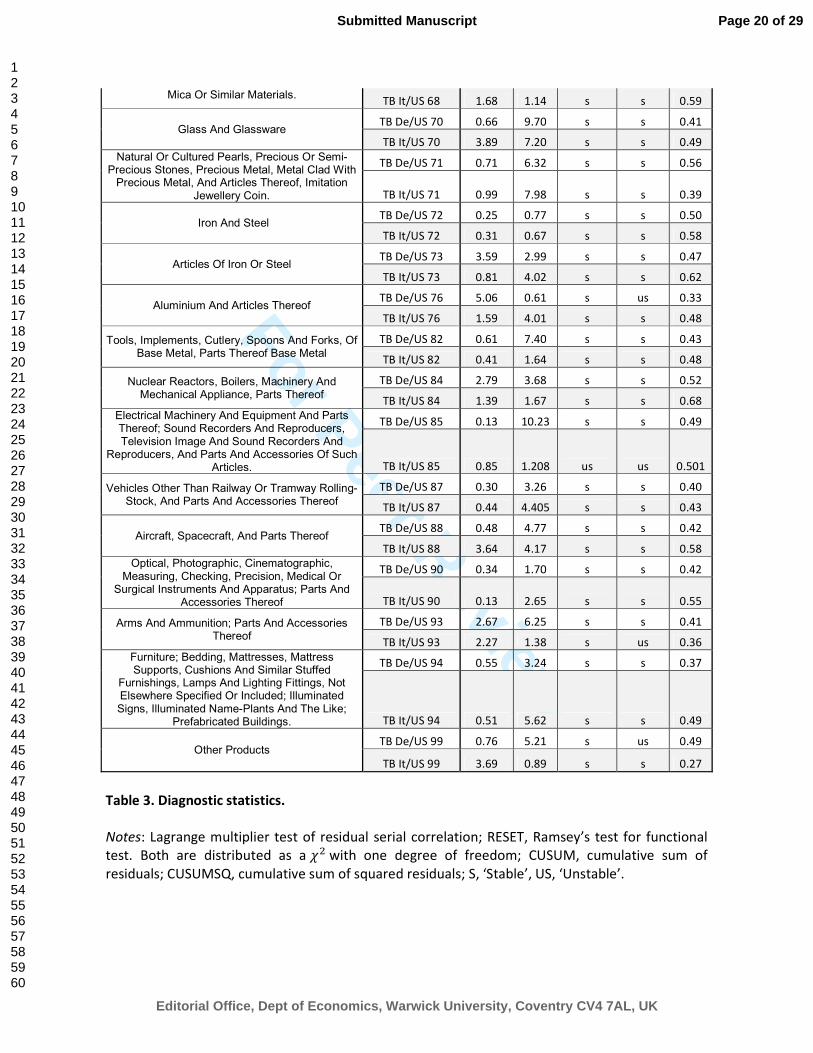
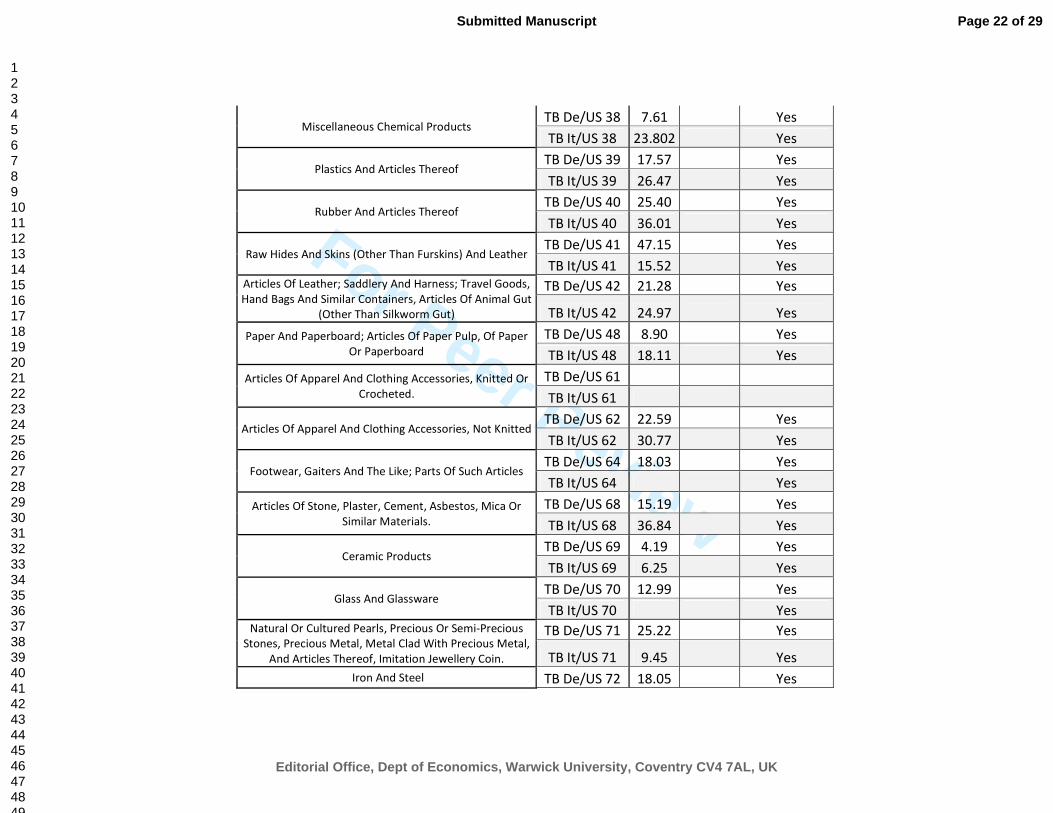
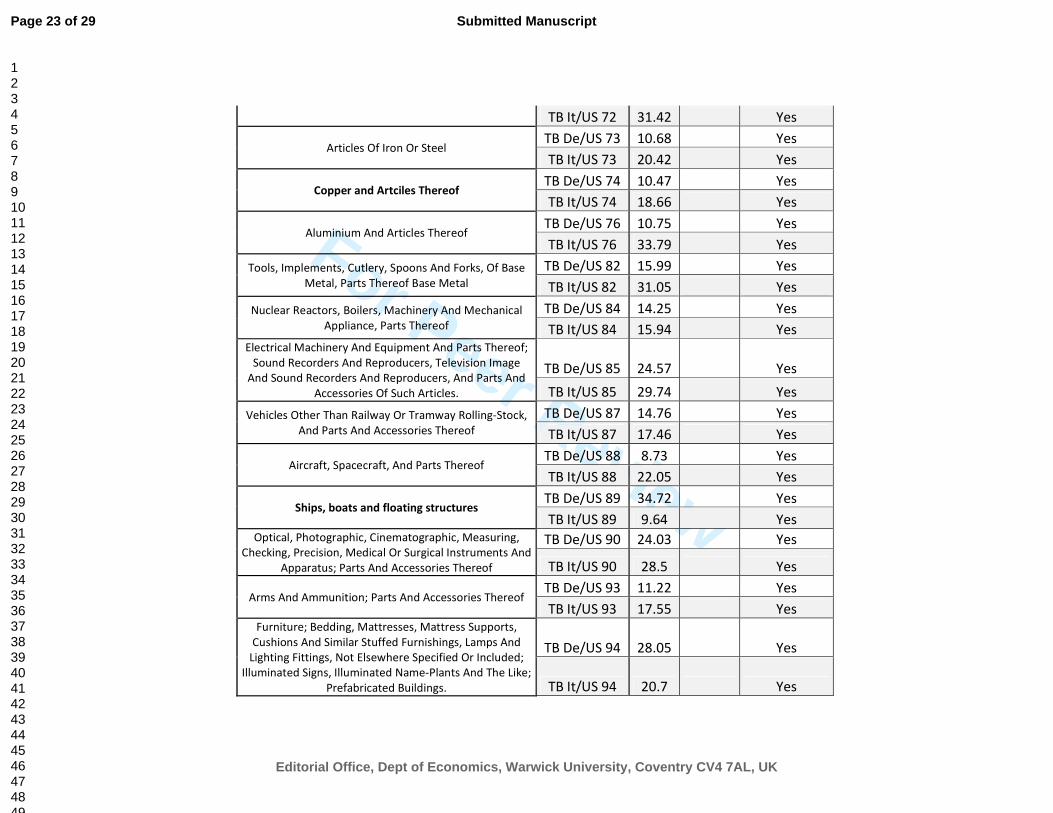
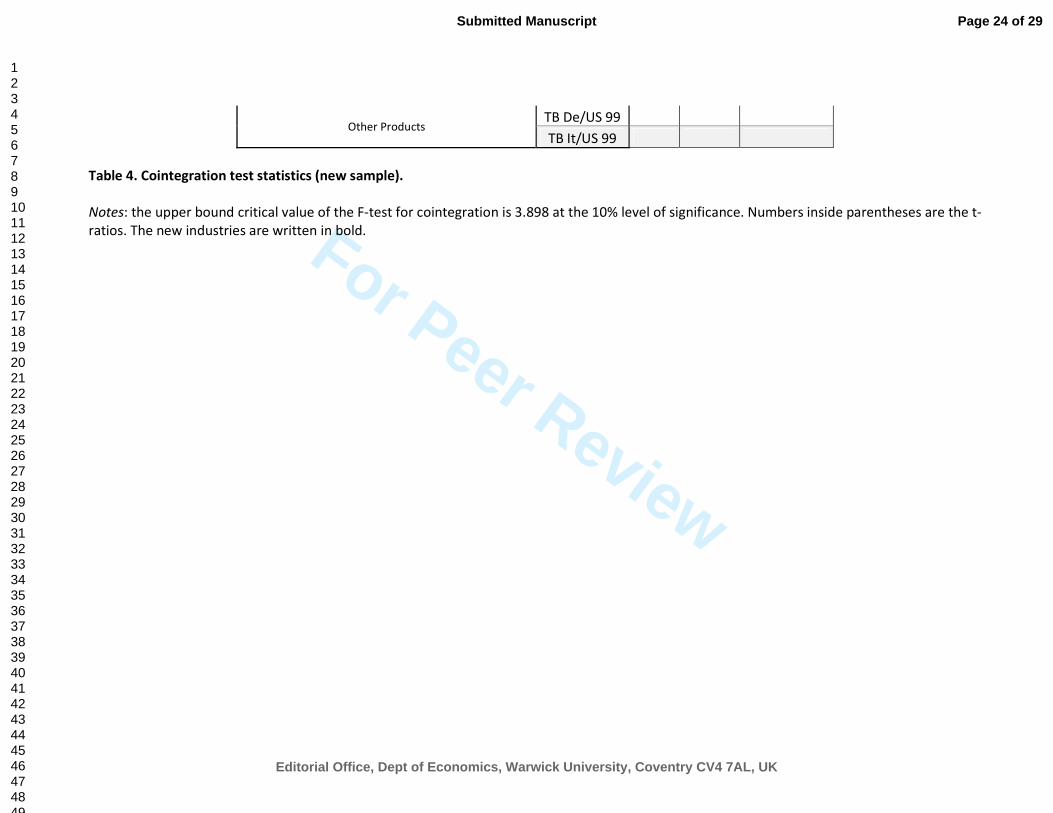
Tables 4 and 5 show that the results do not present any significant changes from those reported previously. The cointegration between the variables is proven for all the 72 bilateral relationships tested. Table 4. Cointegration test statistics (new sample).
[insert Table 4]
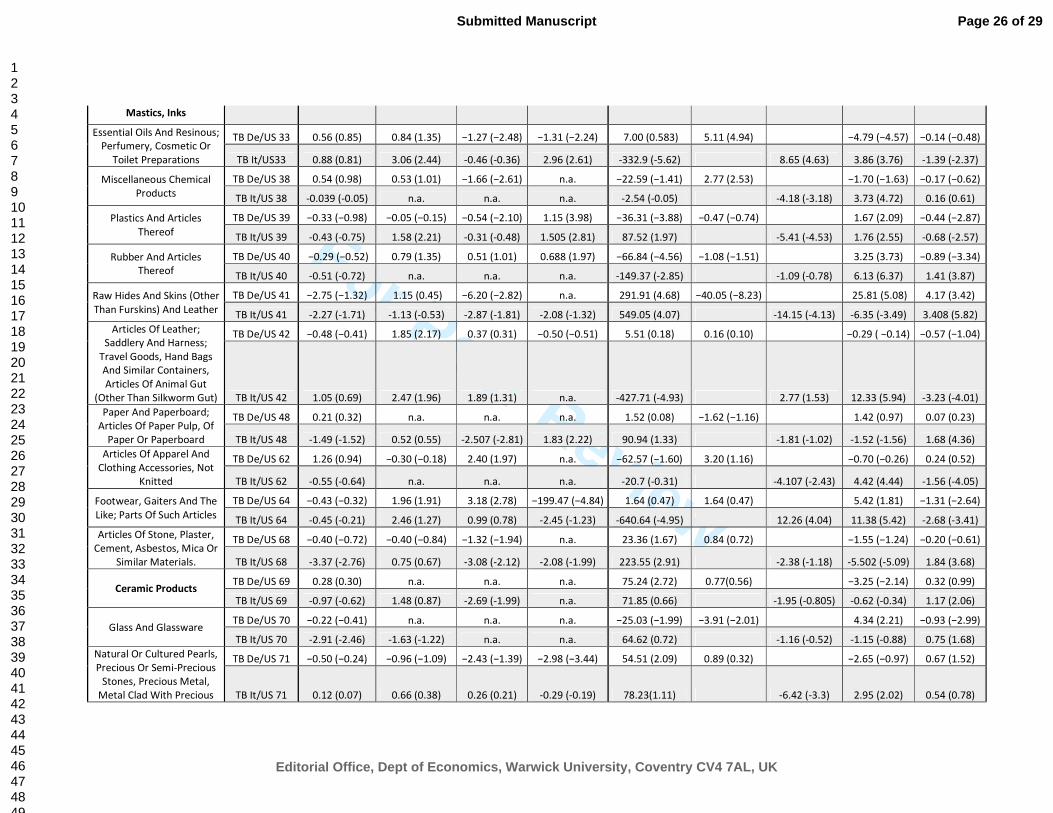
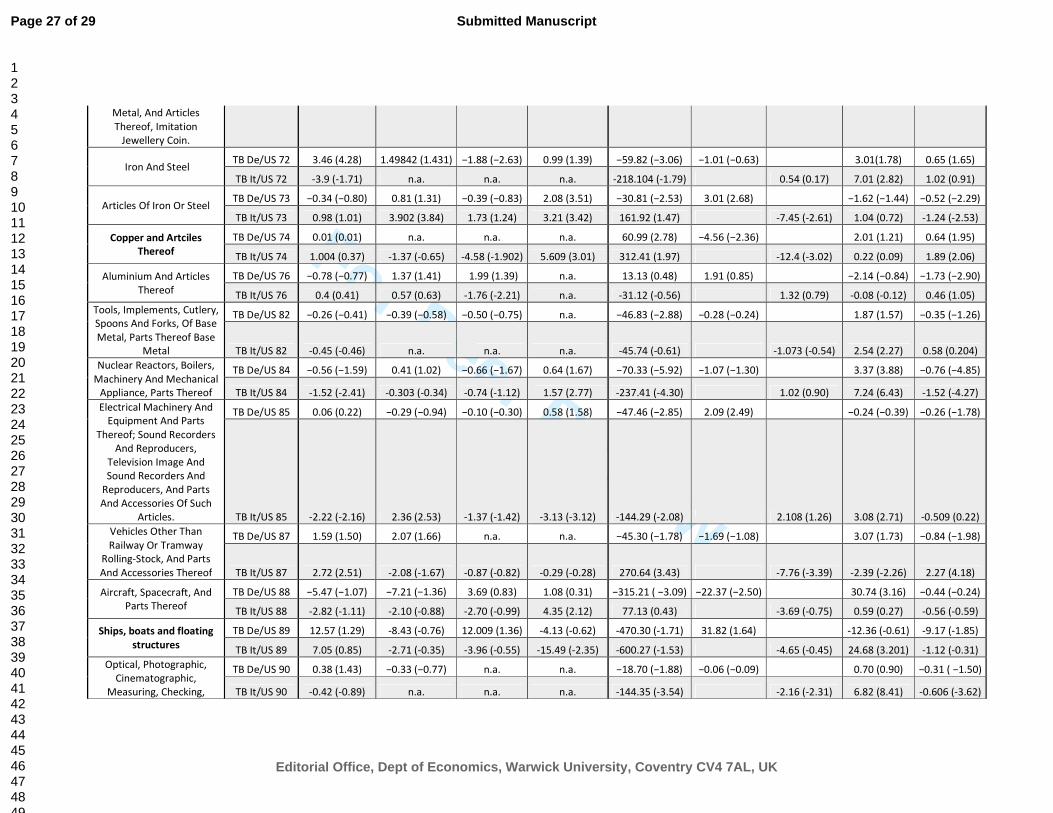
Notes: the upper bound critical value of the F-test for cointegration is 3.898 at the 10% level of significance. Numbers inside parenthesis are the t-ratios. In the case of Germany, all the inverted J-curves that we found for the previous sample are confirmed for the new sample (29, 39, 74, 84), where we also obtained four new inverted J-curves (32, 40, 84 and 87). We also find a J-curve phenomenon (41). In the case of Italy, the J-curves that we found are confirmed for four industries (27, 41, 68, 87), and are not confirmed in two industries (30 and 61). We also obtained four new J-curves (4, 48, 69 and 70). Italian industries in the new sample confirm the inverted J-curve phenomena in four cases (33, 39, 42). Only one case is not confirmed (62). We also obtained two new cases of inverted J-curves (73 and 74). Summing up: the new estimations also show that the J-curve phenomena are concentrated in the Italian case (eight cases) for industries that tend to be competitive by lowering prices, while the inverted J-curve phenomena are typical of the German economy (eight cases) in industries that tend to be competitive without lowering prices. Hence the trade asymmetries for the two national economic systems are confirmed, as we will stress in the following paragraphs. The longer time series also shows that the total amount of inverted-J curves after the euro depreciation tend to increase, both in Germany (from four to eight) and Italy (from four to five). Table 5. Short-run and long-run coefficients estimates (new sample).
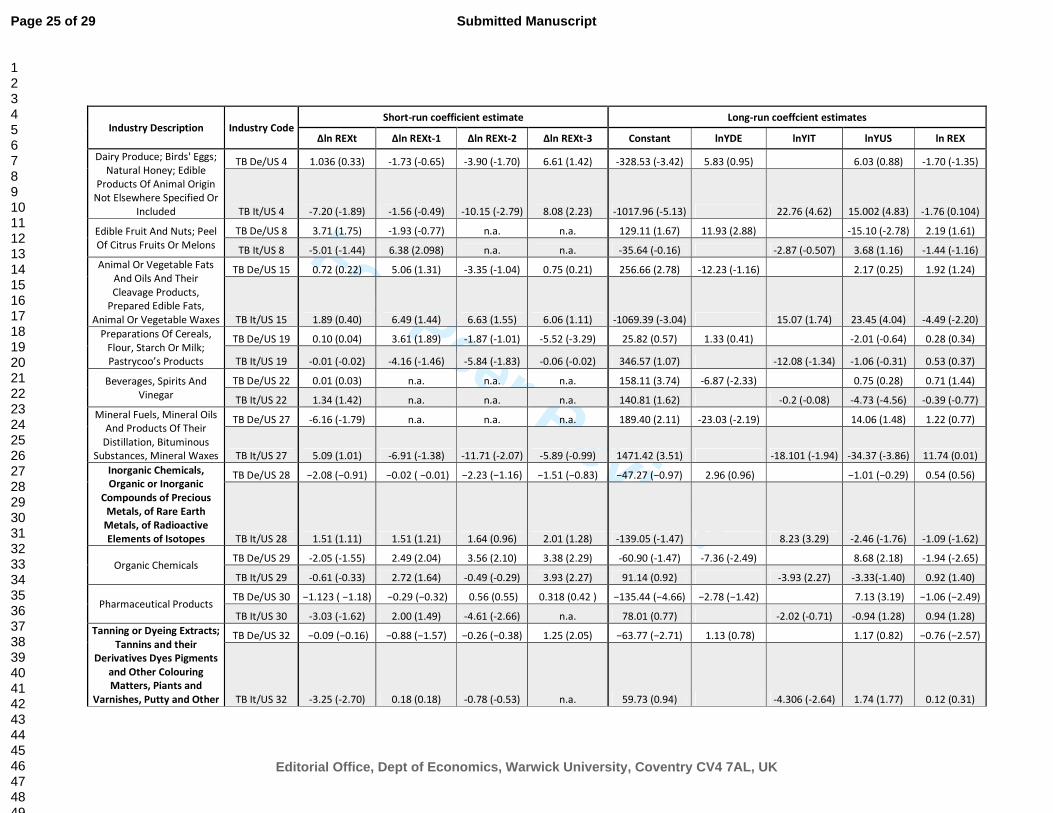
[insert Table 5]
Notes: Numbers inside parenthesis are the t-ratios. 3.2. Relationship between J-Curves, inverted J-Curve phenomena and industries.
Table 6. Top 10 industries for trade share in Germany and Italy.
[insert Table 6]
Examining table 6, which summarizes the first ten largest internationalized industries, both in Germany and Italy10, we found a meaningful improvement in trade balance only in two cases: “Pharmaceutical Products” (30) for Germany, and “Vehicles Other Than Railway Or Tramway Rolling-Stock, And Parts And Accessories Thereof” (87) for Italy. Our results are in line with Bahmani-Oskooee et al. (2013), indeed the largest industries (in terms of trade share), with
10 We considered the sum between import and export in order to weight the international trade share.
Page 7 of 29
Editorial Office, Dept of Economics, Warwick University, Coventry CV4 7AL, UK
Submitted Manuscript
123456789101112131415161718192021222324252627282930313233343536373839404142434445464748495051525354555657585960
For Peer Review
8
just two exceptions, do not respond positively to currency fluctuation, probably because they are better able to edge against them. More precisely the long-run RER is positive and significant in eleven cases, three for Germany (22, 41 and 72), and eight for Italy (27, 30, 40, 41, 48, 61, 68 and 87). As regard Germany the trade share of these industries varies from 0,032% to 0.636% i.e. they are not in the top 10. In the Italian case, only two industries (30 and 87) are part of the largest ones collected in table 4, while the other six industries present a trade share from 0,634 to 1.612. We cannot exclude a negative correlation between industry size and sensitivity of its trade balance to currency fluctuations. By analysing the industries that are interested to a inverted J-curve effect we found, both for Germany and Italy, those sectors that are traditionally characterized by a significant market power which allows them to be competitive without lowering prices: specifically, “Organic Chemicals” (29) and “Nuclear Reactors, Boilers, Machinery and Mechanical Appliance, Parts thereof” (84) for Germany; and “Essential Oils and Resinous, Perfumery, Cosmetic or Toilet Preparations” (33), “Articles of Leather, Saddlery and Harness, Travel Goods, Hand Bags and Similar Containers, Articles of Animal Gut (Other than Silkworm Gut)” (42) and “Articles of Apparel and Clothing Accessories, not Knitted” (62) for Italy. Among the industries that are particularly prone to a J-Curve effect we found the automobile (27 and 87) just in the case of Italy. Such result may be explained by considering that, as well know, German automobile industry is characterized by low price-elasticity of demand. We are left with another interesting result from this study: among the industries that are most responsive to currency depreciation there are not only manufactures, as knitted clothing or iron and steel, as found in Bahmani-Oskooee et al. (2013), but also “Pharmaceutical Products” for Italy (30) and “Beverages, Spirits and Vinegar” for Germany (22). 4. Conclusions.
The study of the effects of a currency depreciation on two important European countries’ trade flows represents an original way to verify the structural differences inside the Euro-area. Due to adjustment lags, countries trade balances are not always able to improve after a currency depreciation. The bounds testing approach by Pesaran et al. (2001) offers the opportunity to differentiate short-run pattern from the long-run response of the trade balance to depreciation. In our study, we focus both on Germany and Italy’s relationship with United States, which is the major importer that does not have a currency that is fixed to euro. We apply cointegration analysis on a monthly sample that runs from January 2010 to February 2016. We examine 68 industries, finding effects that a higher level of aggregation may hide. Our empirical results revealed that all the industries are characterized by cointegration. Contrary to Bahmani-Oskooee et al (2013) we do not find that the “fundamentals” (namely GDP) have a rather weak influence on industries trade balances: particularly, the data evidence shows that the German GDP is significantly negative in three industries and it is significantly positive for three industries as well, while the Italian GDP is significantly negative for eight industries and significantly positive for four. As regards the US GDP, it is characterized by a positive significance in seventeen cases, and a negative significance for eleven industries. A first difference between German and Italian trade is that the former is less sensitive to its GDP dynamics. A total of 11 industries have positive long-run pattern (8 for Italy and 3 for Germany) after the euro depreciation. However the J-Curve effect, according to Rose and Yellen (1989) definition, is only observed for 6 Italian industries. Measured by their trade shares these industries represent the 25.92% of the bilateral trade. The inverted J-curve effect characterizes the 27.25% of the German bilateral trade and the 6.24% for the Italian bilateral trade. The results seem statistically robust also considering new estimations on longer time series (September
Page 8 of 29
Editorial Office, Dept of Economics, Warwick University, Coventry CV4 7AL, UK
Submitted Manuscript
123456789101112131415161718192021222324252627282930313233343536373839404142434445464748495051525354555657585960
For Peer Review
9
2008 - September 2016): the J-curve phenomena are concentrated in the Italian case (eight cases) for industries that tend to be competitive by lowering prices, while the inverted J-curve phenomena are typical of the German economy (eight cases) in industries that tend to be competitive without lowering prices. These results seem to be an indirect demonstration that German economic system is able to be more competitive with a strong currency, than a weak one. In other words, Italian exporters’ ability to be competitive in international markets is more based on prices dynamics. Also Italian automotive industry seems to be particularly sensitive to price fluctuations. Finally, our results suggest that a euro depreciation rather weakly impact on largest industries. Our results are in line with Artus (2016) that illustrate that the sharp euro depreciation in reality has done little to boost the Euro-zone economy. References.
Artus P. (2012) Dévaluer en cas de besoin avait beaucoup d’avantages, Flash-Économie,
Natixis, 365, May the 26th. Artus P. (2016) The euro appears to have depreciated sharply, but in reality this has done
little to boost the euro-zone economy, Flash-Économie, Natixis, 100, February the 5th. Bahmani-Oskooee, M., Bolhassani, M. and Hegerty, S.W. (2011) Industry trade between
Canada and Mexico: will a weakening peso help Mexico manufacturing in the long run?, North American Journal of Economics and Finance, 22, 89-101.
Bahmani-Oskooee, M. and Brooks, T.J. (1999) Bilateral J-curve between U.S. and her trading partners, Weòtwirtschaftiliches Archiv, 135, 156-165.
Bahmani-Oskooee, M., Harvey, H. and Hegerty S.W. (2013) Currency depreciations and the U.S.-Italian trade balance: Industry-level estimates. Research in Economics, 67, 215-225.
Bahmani-Oskooee, M. and Hegerty, S. W. (2011) The J-curve and NAFTA: evidence from Commodity Trade between the U.S. and Mexico. Applied Economics, 43, 1579-1593.
Bahmani-Oskooee, M. and Wang, Y. (2008) The J-curve: evidence from commodity trade between U.S. and China, Applied Economics, 40, 2735-2747.
Bahmani-Oskooee, M. and Zhang, R. (2013) The J-curve: evidence from commodity trade between U.K. and China, Applied Economics, 45, 4369-4378.
Banerjee, A. Dolado, J. Mestre, R. (1998) Error-correction mechanism tests in a single equation framework, Journal of Time Series Analysis, 19, 267-285.
Böll, S. Hesse, M. Jung A., Mahler, A. and Reiermann C. (2015) Draghi’s Dangerous Bet: The Perils of a Weak Euro, Der Spiegel, January the 28th, http://www.spiegel.de/international/business/ecb-decision-to-weaken-euro-comes-with-pluses-and-minuses-a-1015322.html .
Botta, A. (2014) Structural Asymmetries at the Roots of the Eurozone Crisis: What’s New for Industrial Policy in the EU?, The Levy Economics Institute Working Paper Collection, 794, March.
Breuer, S. and Klose, J. (2015) Who Gains From Nominal Devaluation? An Empirical Assessment of Euro-area Export and Imports, The World Economy, 38, 1966-1989.
Brown, R.L., Durbin, J. and Evans, J.M. (1975). Techniques for Testing the Constancy of
Regression Relationships over Time, Journal of the Royal Statistical Society, Ser.B, 37, 149 –
192. Engle, R. F. and Granger, C.W.J. (1987) Co-Integration and Error Correction: Representation,
Estimation, and Testing, Econometrica, 55, 251-276. European Commission (2016) European Economic Forecast, European Economy Institutional
Papers, 20, http://ec.europa.eu/economy_finance/publications/eeip/pdf/ip020_en.pdf .
Page 9 of 29
Editorial Office, Dept of Economics, Warwick University, Coventry CV4 7AL, UK
Submitted Manuscript
123456789101112131415161718192021222324252627282930313233343536373839404142434445464748495051525354555657585960
For Peer Review
10
Gandolfo, G. (2002) International Finance and Open-Economy Macroeconomics, Springer. Goodhart, C. A. E. (2013) Lessons for monetary policy from euro-area crisis, Bank of Greece
Special Conference Paper, http://www.bankofgreece.gr/BogEkdoseis/SCP201317.pdf . Halicioglu, F. (2007) The J-curve dynamics of Turkish bilateral trade: a cointegration
approach, Journal of Economic Studies, 34, 103-119. Himarios, D. (1985) The Effects of Devaluation on the Trade Balance: A Critical View and Re-
examination of Miles’s ‘New Results’, Journal of International Money and Finance, 4, 553-563.
Langwasser, K. (2009) Global current account adjustment: trade implications for the Euro countries, International Economics and Economic Policy, 6, 115-133.
Magee, S. P. (1973) Currency contracts, pass through and devaluation, Brooking Papers on Economic Activity, 1, 303-325.
Meade, J. E. (1948) National Income, National Expenditure and the Balance of Payments. Part 1, The Economic Journal, 58, 483-505.
Meade, J. E. (1949) National Income, National Expenditure and the Balance of Payments. Part 1, The Economic Journal, 59, 17-39.
Miles, M. A. (1979) The Effects of Devaluation on the Trade Balance and the Balance of Payments: Some New Results, Journal of Political Economy, 87, 600–620.
Narayan, P.K. (2005) The saving and investment nexus for China: evidence from cointegration tests, Applied Economics, 37, 1979-1990.
Payne, J.E., 2008. Inflation and inflation uncertainty: Evidence from the Caribbean region, Journal of Economic Studies, 35, 501-511.
Pesaran, M. H and Pesaran, B. (1997) Working with Microfit 4.0: Interactive Econometric Analysis,
Oxford University Press. Pesaran, M. H., Shin, Y and Smith, R. J. (2001) Bounds testing approaches to the analysis of
level relationship, Journal of Applied Econometrics, 16, 289-326. Rose, A. K. and Yellen, J. L. (1989) Is there a J-curve?, Journal of Monetary Economics, 24, July,
53-68. Verheyen, F. (2013) The stability of German export demand equation – have German exports
suffered from the strength of the euro?, International Economics and Economic Policy, 11, 529-548.
Appendix. Data Definition and Sources.
In our work we used monthly data over the period January 2010 to February 2016 and September 2008 to September 2016 in the robustness checks. These data come from Eurostat. The variables used are the followings: TB i t that is the ratio between exports (X) and imports (M) for each industry (i) at time t. Yi,t is used as income measure for the country i at time t and it is proxied by the real GDP. The GDP is given quarterly, we used a specific filter based on relation to disaggregate the data in monthly observation. We weighted the disaggregation using the price index level dynamics and the industrial production that are given monthly. RER is the real exchange rate that is defined as NEX*(PUS/Pfc) where NEX is defined as the number of American dollars per euro and Px is the price level index. Eurostat database give 99 industries, we analyse just the industries that represent at least the 0.5% of the bilateral trade share (the trade share is calculated by the ratio between the sum of the imports and exports in a particular industry in the last month of our sample, and the total of the bilateral trade) for at least a bilateral relationship, this selection gives us 68 bilateral relationships (72 in the robustness checks).
Page 10 of 29
Editorial Office, Dept of Economics, Warwick University, Coventry CV4 7AL, UK
Submitted Manuscript
123456789101112131415161718192021222324252627282930313233343536373839404142434445464748495051525354555657585960
For Peer Review
11
Page 11 of 29
Editorial Office, Dept of Economics, Warwick University, Coventry CV4 7AL, UK
Submitted Manuscript
123456789101112131415161718192021222324252627282930313233343536373839404142434445464748495051525354555657585960
For Peer Review
Fig.1. Nominal value of the euro in terms of the dollar, US-Germany real exchange rate and US-
Italy real exchange rate. (January 2010- February 2016).
0.64
0.69
0.74
0.79
0.84
0.89
0.94
0.992
01
0.1
20
10
.4
20
10
.7
20
10
.1
20
11
.1
20
11
.4
20
11
.7
20
11
.1
20
12
.1
20
12
.4
20
12
.7
20
12
.1
20
13
.1
20
13
.4
20
13
.7
20
13
.1
20
14
.1
20
14
.4
20
14
.7
20
14
.1
20
15
.1
20
15
.4
20
15
.7
20
15
.1
20
16
.1
Nominal and Real Exchange Rate
ER $/€
REX De/US
REX It/US
Page 12 of 29
Editorial Office, Dept of Economics, Warwick University, Coventry CV4 7AL, UK
Submitted Manuscript
123456789101112131415161718192021222324252627282930313233343536373839404142434445464748495051525354555657585960
For Peer Review
Industry Description Industry Code F-Test ECM(t-1) Cointegrated?
Dairy Produce; Birds' Eggs; Natural Honey; Edible Products Of Animal Origin Not Elsewhere Specified Or Included
TB De/US 4 5.72 Yes
TB It/US 4 18.16 Yes
Edible Fruit And Nuts; Peel Of Citrus Fruits Or Melons TB De/US 8 4.67 Yes
TB It/US 8 9.24 Yes
Oil Seeds And Oleaginous Fruits; Miscellaneous Grains, Seeds And Fruit, Industrial Or Medicinal Plants, Straw And Fodder
TB De/US 12 3.49 -1.02 (-4.94) Yes
TB It/US 12 7.57 Yes
Animal Or Vegetable Fats And Oils And Their Cleavage Products, Prepared Edible Fats, Animal Or Vegetable Waxes
TB De/US 15 21.00 Yes
TB It/US 15 5.94 Yes
Preparations Of Cereals, Flour, Starch Or Milk; Pastrycoo’s Products
TB De/US 19 3.76 -0.62 (-5.64) Yes
TB It/US 19 27.03 Yes
Beverages, Spirits And Vinegar TB De/US 22 16.41 Yes
TB It/US 22 23.08 Yes
Mineral Fuels, Mineral Oils And Products Of Their Distillation, Bituminous Substances, Mineral Waxes
TB De/US 27 19.90 Yes
TB It/US 27 39.24 Yes
Organic Chemicals TB De/US 29 27.27 Yes
TB It/US 29 39.13 Yes
Pharmaceutical Products TB De/US 30 19.84 Yes
TB It/US 30 19.88 Yes
Essential Oils And Resinous; Perfumery, Cosmetic Or Toilet Preparations
TB De/US 33 18.84 Yes
TB It/US33 37.88 Yes
Miscellaneous Chemical Products TB De/US 38 10.17 Yes
TB It/US 38 15.85 Yes
Plastics And Articles Thereof TB De/US 39 21.47 Yes
TB It/US 39 23.10 Yes
Rubber And Articles Thereof TB De/US 40 11.73 Yes
TB It/US 40 22.81 Yes
Raw Hides And Skins (Other Than Furskins) And Leather TB De/US 41 26.16 Yes
TB It/US 41 35.32 Yes Articles Of Leather; Saddlery And Harness; Travel Goods, Hand Bags And Similar Containers, Articles Of Animal Gut (Other
Than Silkworm Gut)
TB De/US 42 23.21 Yes
TB It/US 42 22.79 Yes
Paper And Paperboard; Articles Of Paper Pulp, Of Paper Or Paperboard
TB De/US 48 16.79 Yes
TB It/US 48 47.99 Yes
Articles Of Apparel And Clothing Accessories, Knitted Or Crocheted.
TB De/US 61 21.87 Yes
TB It/US 61 13.11 Yes
Articles Of Apparel And Clothing Accessories, Not Knitted TB De/US 62 16.48 Yes
TB It/US 62 15.87 Yes
Footwear, Gaiters And The Like; Parts Of Such Articles TB De/US 64 23.38 Yes
TB It/US 64 9.35 Yes
Articles Of Stone, Plaster, Cement, Asbestos, Mica Or Similar Materials.
TB De/US 68 11.23 Yes
TB It/US 68 38.34 Yes
Glass And Glassware TB De/US 70 15.05 Yes
Page 13 of 29
Editorial Office, Dept of Economics, Warwick University, Coventry CV4 7AL, UK
Submitted Manuscript
123456789101112131415161718192021222324252627282930313233343536373839404142434445464748495051525354555657585960
For Peer Review
TB It/US 70 21.28 Yes Natural Or Cultured Pearls, Precious Or Semi-Precious Stones, Precious Metal, Metal Clad With Precious Metal, And Articles
Thereof, Imitation Jewellery Coin.
TB De/US 71 36.07 Yes
TB It/US 71 15.37 Yes
Iron And Steel TB De/US 72 21.31 Yes
TB It/US 72 24.50 Yes
Articles Of Iron Or Steel TB De/US 73 10.47 Yes
TB It/US 73 43.86 Yes
Aluminium And Articles Thereof TB De/US 76 9.55 Yes
TB It/US 76 5.08 Yes
Tools, Implements, Cutlery, Spoons And Forks, Of Base Metal, Parts Thereof Base Metal
TB De/US 82 16.94 Yes
TB It/US 82 31.51 Yes
Nuclear Reactors, Boilers, Machinery And Mechanical Appliance, Parts Thereof
TB De/US 84 13.07 Yes
TB It/US 84 18.10 Yes Electrical Machinery And Equipment And Parts Thereof; Sound Recorders And Reproducers, Television Image And Sound Recorders And Reproducers, And Parts And Accessories Of
Such Articles.
TB De/US 85 15.11 Yes
TB It/US 85 12.91 Yes
Vehicles Other Than Railway Or Tramway Rolling-Stock, And Parts And Accessories Thereof
TB De/US 87 8.55 Yes
TB It/US 87 17.31 Yes
Aircraft, Spacecraft, And Parts Thereof TB De/US 88 13.34 Yes
TB It/US 88 54.29 Yes Optical, Photographic, Cinematographic, Measuring, Checking, Precision, Medical Or Surgical Instruments And Apparatus;
Parts And Accessories Thereof
TB De/US 90 10.81 Yes
TB It/US 90 32.16 Yes
Arms And Ammunition; Parts And Accessories Thereof TB De/US 93 15.88 Yes
TB It/US 93 6.44 Yes Furniture; Bedding, Mattresses, Mattress Supports, Cushions And Similar Stuffed Furnishings, Lamps And Lighting Fittings,
Not Elsewhere Specified Or Included; Illuminated Signs, Illuminated Name-Plants And The Like; Prefabricated Buildings.
TB De/US 94 11.61 Yes
TB It/US 94 19.13 Yes
Other Products TB De/US 99 28.78 Yes
TB It/US 99 8.50 Yes
Table 1. Cointegration test statistics.
Notes: the upper bound critical value of the F-test for cointegration is 3.898 at the 10% level of
significance. Numbers inside parentheses are the t-ratios.
Page 14 of 29
Editorial Office, Dept of Economics, Warwick University, Coventry CV4 7AL, UK
Submitted Manuscript
123456789101112131415161718192021222324252627282930313233343536373839404142434445464748495051525354555657585960
For Peer Review
Industry Description Industry Code Short-run coefficient estimate Long-run coeffcient estimates
∆ln REXt ∆ln REXt-1 ∆ln REXt-2 ∆ln REXt-3 Constant lnYDE lnYIT lnYUS ln REX
Dairy Produce; Birds' Eggs; Natural Honey; Edible Products Of Animal Origin Not
Elsewhere Specified Or Included
TB De/US 4 1.53 (0.47) -0.52 (-0.19) -3.13 (-1.28) 0.85 (0.24) -27.36 (-0.68) 3.22 (0.33) 1.24 (0.14) -0.04 (-0.02)
TB It/US 4 -5.47 (-1.41) -1.46 (-0.4) -1.94 (-0.64) 5.43 (1.14) -314.8 (-2.6) 27.11 (2.68) 21.77 (2.5) -3.92 (-1.95)
Edible Fruit And Nuts; Peel Of Citrus Fruits
Or Melons
TB De/US 8 4.99 (2.55) n n n 50.65 (1.49) 13.29 (1.87) -14.44 (-2.18) 1.51 (0.98)
TB It/US 8 -3.81 (-1.13) 4.52 (1.16) -2.35 (-1.03) -4.25 (-1.17) 78.24 (1.05) -10.02 (-1.42) -3.55 (-0.71) 1.29 (0.9)
Oil Seeds And Oleaginous Fruits; Miscellaneous
Grains, Seeds And Fruit, Industrial Or Medicinal Plants, Straw And Fodder
TB De/US 12 -6.2 (-0.9) 5.55 (0.78) 2.33 (0.34) -5.53 (-0.76) 49.66 (0.84) 12.68 (0.54) -14.05 (-0.83) -0.09 (-0.03)
TB It/US 12 0.38 (0.12) -2.47 (-0.88) -4,08 (-1,39) -2.6 (-0.73) 168.02 (2.66) -4.87 (-0.88) -16.98 (-3.56) 0.38 (0.12)
Animal Or Vegetable Fats And Oils And Their Cleavage
Products, Prepared Edible Fats, Animal Or Vegetable Waxes
TB De/US 15 2.11 (0.45) 4.83 (0.81) -2.71 (-0.59) 3.91 (0.89) 46.57 (1.4) 9.92 (0.53) -11.67 (-0.86) 2.07 (1.17)
TB It/US 15 6.03 (1.31) n n n 35.94 (0.36) -7.61 (-0.81) 0.81 (0.11) 3.46 (1.67)
Preparations Of Cereals, Flour, Starch Or Milk; Pastrycoo’s
Products
TB De/US 19 0.59 (0.22) 2.4 (0.89) 0.45 (0.18) -3.6 (-1.35) 28.81 (1.35) -14.19 (-1.64) 5.83 (0.93) -0.04 (-0.04)
TB It/US 19 3.53 (0.7) -3.88 (-1.11) -7.8 (-1.38) -4.02 (-1.31) -0.28 (-0.002) -5.14 (-0.39) 3.63 (0.38) 0.22 (0.09)
Beverages, Spirits And Vinegar
TB De/US 22 1.27 (0.90) -0.10 (-0.08) -2.05 (-1.17) 0.92 (0.72) 48,51 (3.25) 8.84 (1.79) -11.20 (-3.10) 1.62 (2.47)
TB It/US 22 2.17 (1.07) n n n 0.84 (0.02) -2.39 (-0.66) 1.65 (0.63) 0.69 (0.96)
Mineral Fuels, Mineral Oils And Products Of Their
Distillation, Bituminous
Substances, Mineral Waxes
TB De/US 27 -0.26 (-0.07) -1.62 (-0.36) -2.93 (-0.60) 1.09 (0.32) -38.63 (-1.25) -11.53 (-0.73) 11.64 (1.00) 0.02 (0.01)
TB It/US 27 7.44 (1.27) -12.89 (-2.20) -13.75 (-1.81) -12-76 (-1.81) 594.81 (2.73) -31.76 (-1.85) -51.14(-3.04) 16.36 (3.18)
Organic Chemicals TB De/US 29 -2.32 (-1.55) 3.92 (3.37) 1.32 (1.10) 4.02 (2.70) -28.38 (-2.06) -8.40 (-1.66) 8.69 (1.98) -2.26 (-3.03)
TB It/US 29 -1.61 (-0.78) 4.09 (2.39) 1.64 (0.88) 4.69 (2.39) -50.99 (-1.48) 1.81 (0.63) 5.04 (1.93) 0.76 (0.83)
Pharmaceutical TB De/US 30 -1.56 (-2.07) n n n -56.02 (-6.09) 3.85 (1.33) 4.21 (1.82) -0.54 (-1.53)
Page 15 of 29
Editorial Office, Dept of Economics, Warwick University, Coventry CV4 7AL, UK
Submitted Manuscript
123456789101112131415161718192021222324252627282930313233343536373839404142434445464748495051525354555657585960
For Peer Review
Products TB It/US 30 -2.76 (-1.29) 1.36 (0.806) -4.76 (-2.15) -1.09 (-0.57) 113.65 (1.86) -9.51 (-2.705) -7.87 (-2.55) 2.12 (1.89)
Essential Oils And Resinous; Perfumery, Cosmetic Or Toilet
Preparations
TB De/US 33 0.12 (0.19) 0.40 (0.57) -1.10 (-1.86) -0.69 (-0.78) 15.14 (2.83) 6.93 (4.05) -6.15 (-4.54) -0.48 (-1.23)
TB It/US33 0.07 (0.05) 4.14 (2.79) -0.23 (-0.17) 3.86 (2.11) -141.41 (-4.49) 13.46 (4.76) 9.04 (3.88) -1.96 (-2.71)
Miscellaneous Chemical Products
TB De/US 38 0.53 (0.87) n n n 1.53 (0.30) 0.27 (0.12) -0.35 (-0.24) -0.19 (-0.77)
TB It/US 38 0.54 (0.66) 0.09 (0.11) -1.92 (-2.22) n 2.96 (0.19) -5.49 (-4.30) 2.76 (2.10) 0.43 (0.22)
Plastics And Articles Thereof
TB De/US 39 -0.04 (-0.11) -0.18 (-0.44) -0.34 (-1.52) 1.44 (5.13) -6,87 (-2.54) 0.63 (0.70) 0.41 (0.57) -0.35 (-2.94)
TB It/US 39 -0.03 (-0.05) 1.64 (2.00) 0.15 (0.19) 1.68 (2.46) 23.09 (1.16) -6.34 (-2.74) 0.96 (0.86) -0.80 (-2.79)
Rubber And Articles Thereof
TB De/US 40 0.25 (0.51) n n n -25.69 (-3.47) -0.96 (-0.57) 3.67 (2.13) -0.47 (-2.23)
TB It/US 40 -0.69 (-0.79) n n n -64.34 (-2.61) -0.07 (-0.04) 7.82 (3.93) 1.32 (3.02)
Raw Hides And Skins (Other Than Furskins) And
Leather
TB De/US 41 -2.51 (-0.98) n n n -11.04 (-0.51) -23.18 (-2.69) 16.00 (2.56) 2.58 (1.90)
TB It/US 41 -2.23 (-1.38) -3.56 (-1.40) -4.83 (-3.54) -3.62 (-1.87) 266,04 (6.72) -27.67 (-7.04) -15.23 (-5.88) 5.81 (7.50)
Articles Of Leather; Saddlery And Harness; Travel
Goods, Hand Bags And Similar
Containers, Articles Of Animal Gut (Other Than Silkworm Gut)
TB De/US 42 -0.90 (-0.72) 2.10 (2.36) n n -1.97 (-0.18) 1.82 (0.71) -0.82 (-0.34) -0.70 (-1.20)
TB It/US 42 2.98 (1.93) 2.50 (1.88) n n -51.17 (-1.76) -1.82 (-0.75) 7.57 (3.17) -1.92 (-2.54)
Paper And Paperboard; Articles Of Paper Pulp, Of
Paper Or Paperboard
TB De/US 48 1.22 (2.00) -0.27 (-0.33) 0.33 (0.54) 1.81 (3.00) -0.97 (-0.15) 0.61 (0.29) -0.20 (-0.11) 0.13 (0.31)
TB It/US 48 -1.08 (-1.14) 0.95 (0.97) n n -5.41 (-0.24) 0.31 (0.15) 0.42 (0.26) 1.74 (3.65)
Articles Of Apparel And Clothing
Accessories, Knitted Or Crocheted.
TB De/US 61 0.23 (0.27) -3.12 (-3.42) 1.57 (1.60) -2.31 (-1.88) -68.71 (-5.81) 5.68 (1.83) 4.43 (2.04) -0.08 (-0.23)
TB It/US 61 -0.31 (-0.13) 0.32 (0.17) -1.85 (-1.03) -4.64 (-2.99) 30.60 (0.72) -5.51 (-1.42) -0.05 (-0.02) 2.35 (2.91)
Articles Of Apparel And Clothing
Accessories, Not Knitted
TB De/US 62 0.93 (0.70) -0.12 (-0.07) 3.09 (2.62) n -37.97 (-3.41) 10.54 (2.40) -2.15 (-0.63) -0.20 (-0.51)
TB It/US 62 -0.15 (-0.13) 2.04 (1.93) n n -33.48 (-1.43) -2.54 (-1.17) 5.84 (3.41) -1.49 (-3.13)
Footwear, Gaiters And The Like; Parts Of Such Articles
TB De/US 64 0.71 (0.48) -0.36 (-0.30) 2.23 (1.26) n -58.46 (-4.56) -12.69 (-2.28) 15.18 (3.64) -1.77 (-3.04)
TB It/US 64 -0.28 (-0.13) n n n -149.95 (-2.97) 12.62 (2.72) 11.28 (3.10) -1.71 (-1.77)
Articles Of Stone, Plaster, Cement, Asbestos, Mica Or
TB De/US 68 -0.71 (-1.00) 0.18 (27) -1.67 (-1.86) n 11.34 (2.11) 1.68 (0.64) -2.39 (-1.20) -0.10 (-0.22)
TB It/US 68 -3.48 (-2.87) 1.84 (1.95) -4.01 (-2.39) n 42.93 (1.23) -0.63 (-0.20) -5.50 (-1.88) 1.16 (2.36)
Page 16 of 29
Editorial Office, Dept of Economics, Warwick University, Coventry CV4 7AL, UK
Submitted Manuscript
123456789101112131415161718192021222324252627282930313233343536373839404142434445464748495051525354555657585960
For Peer Review
Similar Materials.
Glass And Glassware TB De/US 70 -0.89 (-1.51) 0.90 (1.30) n n 4.77 (-0.83) 1.36 (0.75) -0.30 (0.18) -0.28 (-0.18)
TB It/US 70 -2.36 (-1.95) n n n 0.69 (0.03) 0.04 (0.02) 0.01 (0.00) 0.54 (1.14)
Natural Or Cultured Pearls, Precious Or Semi-Precious Stones, Precious Metal, Metal Clad
With Precious Metal, And Articles Thereof, Imitation Jewellery
Coin.
TB De/US 71 -0.52 (-0.26) 0.03 (0.04) -2.94 (-1.82) n 26.03 (2.44) -1.21 (-0.22) -2.27 (-0.54) 0.46 (0.92)
TB It/US 71 -0.95 (-0.61) n n n 21.47 (0.73) -7.76 (-2.62) 1.95 (0.92) 0.74 (1.26)
Iron And Steel TB De/US 72 2.62 (3.81) 1.50 (1.36) -1.96 (-3.00) 0.82 (1.18) -25.37 (-3.75) 3.58 (1.63) 0.92 (0.47) 0.70 (2.08)
TB It/US 72 -2.21 (-0.80) 1.65 (0.53) -4.91 (-1.97) 2.71 (1.28) -138.65 (-2.72) 5.20 (1.26) 13.42 (3.23) 1.17 (0.84)
Articles Of Iron Or Steel
TB De/US 73 -0.29 (-0.58) 0.72 (1.21) -0.37 (-0.80) 1.78 (2.67) -3.35 (-0.79) 2.27 (1.23) -1.04 (-0.74) -0.53 (-2.18)
TB It/US 73 0.70 (0.63) 3.70 (3.66) 0.77 (0.57) 3.35 (3.07) 111.18 (4.71) -15.27 (-6.47) -3.98 (-2.40) -0.19 (-0.41)
Aluminium And Articles Thereof
TB De/US 76 0.20 (0.15) n n n 5.35 (0.59) -3.63 (-1.45) 1.71 (0.83) -1.59 (-2.65)
TB It/US 76 0.38 (0.33) 1.46 (1.29) -1.36 (-1.75) 2.59 (2.25) -62.4 (-2.802) 5.65 (2.38) 4.09 (2.49) -0.27 (-0.51)
Tools, Implements, Cutlery, Spoons And Forks, Of Base Metal, Parts Thereof Base
Metal
TB De/US 82 -1.44 (-2.73) n n n -14.50 (-2.18) -1.49 (-0.81) 2.73 (1.91) -0.44 (-1.48)
TB It/US 82 -0.36 (-0.36) n n n -60.56 (-1.81) 2.04 (0.708) 6.11 (2.51) 0.76 (1.44)
Nuclear Reactors, Boilers, Machinery And Mechanical Appliance, Parts
Thereof
TB De/US 84 -0.03 (-0.07) 0.38 (0.88) 0.12 (0.37) 0.93 (1.90) -23.41 (-5.75) -1.46 (-1.60) 3.72 (5.35) -0.76 (-5.34)
TB It/US 84 -0.72 (-0.96) 1.71 (0.09) n n -83.19 (-3.97) 1.03 (0.74) 9.28 (5.01) -2.08 (-4.39)
Electrical Machinery And Equipment And Parts Thereof; Sound
Recorders And Reproducers,
Television Image And Sound Recorders And Reproducers, And Parts And
Accessories Of Such Articles.
TB De/US 85 0.02 (0.08) -0.04 (-0.16) 0.12 (0.38) 0.72 (2.34) -12.95 (-3.33) 1.70 (1.69) 0.47 (0.86) -0.39 (-3.40)
TB It/US 85 -1.66 (-1.79) 2.64 (2.89) -2.79 (-2.66) -2.42 (-2.18) -33.93 (-1.28) 2.203 (0.95) 2.75 (1.48) 0.05 (0.11)
Vehicles Other Than TB De/US 87 1.35 (1.18) 1.89 (1.38) n n -11.83 (-1.24) -7.69 (-3.31) 6.34 (2.88) -0.77 (-1.55)
Page 17 of 29
Editorial Office, Dept of Economics, Warwick University, Coventry CV4 7AL, UK
Submitted Manuscript
123456789101112131415161718192021222324252627282930313233343536373839404142434445464748495051525354555657585960
For Peer Review
Railway Or Tramway Rolling-Stock, And
Parts And Accessories Thereof TB It/US 87 1.55 (1.61) -3.604 (-2.16) n n 107.91 (2.92) -12.74 (-3.34) -5.13 (-2.27) 2.07 (3.98)
Aircraft, Spacecraft, And Parts Thereof
TB De/US 88 -4.81 (-0.85) n n n -182.81 (-4.79) -0.70 (-0.05) 27.77 (2.00) -1.44 (-0.79)
TB It/US 88 0.37 (0.13) -3.61 (-1.38) -7.38 (-2.42) n 160.502 (1.81) -15.91 (-1.82) -9.59 (-1.82) 1.75 (1.31)
Optical, Photographic,
Cinematographic, Measuring, Checking, Precision, Medical Or Surgical Instruments And Apparatus; Parts And Accessories
Thereof
TB De/US 90 0.03 (0.05) -0.22 (-0.41) -1.47 (-2.69) -0.37 (-0.76) 1.83 (0.48) 1.16 (0.77) -0.94 (-0.81) 0.23 (1.08)
TB It/US 90 -0.42 (-0.81) 0.19 (0.42) -1.201 (-1.99) n -28.57 (-1.63) -2.59 (-1.92) 4.84 (3.106) -0.24 (-0.96)
Arms And Ammunition; Parts And Accessories
Thereof
TB De/US 93 1.28 (0.56) -4.25 (-1.17) n n 1.16 (0.05) 8.86 (1.04) -5.66 (-0.93) -0.35 (-0.31)
TB It/US 93 -5.53 (-1.41) 7.98 (2.307) n n 27.13 (0.24) -2.04 (-0.17) -2.03 (-0.30) 0.109 (0.07)
Furniture; Bedding, Mattresses, Mattress Supports, Cushions And Similar Stuffed Furnishings, Lamps And Lighting Fittings,
Not Elsewhere Specified Or
Included; Illuminated Signs, Illuminated Name-Plants And
The Like; Prefabricated Buildings.
TB De/US 94 -0.43 (-0.60) -0.89 (-1.01) -1.56 (-1.63) n -15.88 (1.81) -5,09 (-1.75) 5.15 (2.00) -0.49 (-3.87)
TB It/US 94 -1.603 (-1.04) n n n -10.38 (-0.33) -5.59 (-1.78) 4.708 (1.97) -0.94 (-5.55)
Other Products TB De/US 99 -1.66 (-0.77) 4.02 (2.07) 3.19 (2.27) 3.95 (2.42) -26.06 (-1.39) -2.30 (-0.39) 4.44 (0.89) -1.52 (-1.34)
TB It/US 99 3.92 (2.17) -0.6 (-0.22) -1.85 (-1.01) 5.15 (2.22) 36.92 (0.78) -2.73 (-0.75) -2.82 (-.76) 0.33 (0.39)
Table 2. Short-run and long-run coefficients estimates.
Notes: Numbers inside parentheses are the t-ratios.
Page 18 of 29
Editorial Office, Dept of Economics, Warwick University, Coventry CV4 7AL, UK
Submitted Manuscript
123456789101112131415161718192021222324252627282930313233343536373839404142434445464748495051525354555657585960
For Peer Review
Description Industry Code RESET LM Cusum Cusumq
Adj
R^2
Dairy Produce; Birds' Eggs; Natural Honey; Edible Products Of Animal Origin Not Elsewhere
Specified Or Included
TB De/US 4 3.93 0.53 s s 0.17
TB It/US 4 3.61 9.11 s s 0.42
Edible Fruit And Nuts; Peel Of Citrus Fruits Or Melons
TB De/US 8 0.82 4.35 s us 0.17
TB It/US 8 2.20 2.85 us us 0.43
Oil Seeds And Oleaginous Fruits; Miscellaneous Grains, Seeds And Fruit, Industrial Or Medicinal
Plants, Straw And Fodder
TB De/US 12 1.75 0.94 s s 0.36
TB It/US 12 0.48 0.58 s s 0.40
Animal Or Vegetable Fats And Oils And Their Cleavage Products, Prepared Edible Fats, Animal
Or Vegetable Waxes
TB De/US 15 0.09 10.50 s s 0.60
TB It/US 15 2.28 5.32 us us 0.46
Preparations Of Cereals, Flour, Starch Or Milk; Pastrycoo’s Products
TB De/US 19 1.62 3.42 s s 0.39
TB It/US 19 11.46 12.80 s s 0.40
Beverages, Spirits And Vinegar TB De/US 22 0.86 3.28 s s 0.49
TB It/US 22 1.35 1.58 s s 0.61
Mineral Fuels, Mineral Oils And Products Of Their Distillation, Bituminous Substances, Mineral
Waxes
TB De/US 27 0.02 0.16 s s 0.37
TB It/US 27 1.73 2.49 s s 0.54
Organic Chemicals TB De/US 29 1.40 3.33 s s 0.57
TB It/US 29 0.40 2.74 s s 0.68
Pharmaceutical Products TB De/US 30 0.92 4.41 s s 0.49
TB It/US 30 1.75 4.99 s s 0.42
Essential Oils And Resinous; Perfumery, Cosmetic Or Toilet Preparations
TB De/US 33 0.52 2.10 s us 0.40
TB It/US33 0.68 0.06 s s 0.61
Miscellaneous Chemical Products TB De/US 38 1.81 4.73 s s 0.26
TB It/US 38 0.52 9.41 s s 0.42
Plastics And Articles Thereof TB De/US 39 0.80 12.43 s s 0.34
TB It/US 39 0.89 4.41 s s 0.55
Rubber And Articles Thereof TB De/US 40 0.09 7.92 us s 0.34
TB It/US 40 0.86 2.80 s s 0.68
Raw Hides And Skins (Other Than Furskins) And Leather
TB De/US 41 0.64 3.16 s s 0.58
TB It/US 41 3.23 2.77 s s 0.67
Articles Of Leather; Saddlery And Harness; Travel Goods, Hand Bags And Similar Containers,
Articles Of Animal Gut (Other Than Silkworm Gut)
TB De/US 42 0.84 4.34 s s 0.42
TB It/US 42 0.75 4.05 s s 0.62
Pulp Of Wood Or Of Other Fibrous Cellulosic Material; Recovered (Waste And Scrap) Paper Or
Paperboard
TB De/US 47 1.13 7.48 s s 0.33
TB It/US 47
Paper And Paperboard; Articles Of Paper Pulp, Of Paper Or Paperboard
TB De/US 48 1..88 12.88 s s 0.52
TB It/US 48 1.12 1.11 s s 0.69
Articles Of Apparel And Clothing Accessories, Knitted Or Crocheted.
TB De/US 61 0.63 1.95 s s 0.49
TB It/US 61 0.13 21.88 s s 0.39
Articles Of Apparel And Clothing Accessories, Not Knitted
TB De/US 62 0.82 5.63 s s 0.47
TB It/US 62 2.13 0.96 s s 0.52
Footwear, Gaiters And The Like; Parts Of Such Articles
TB De/US 64 1.52 1.40 s s 0.42
TB It/US 64 0.03 2.28 s s 0.59
Articles Of Stone, Plaster, Cement, Asbestos, TB De/US 68 2.90 3.10 s s 0.39
Page 19 of 29
Editorial Office, Dept of Economics, Warwick University, Coventry CV4 7AL, UK
Submitted Manuscript
123456789101112131415161718192021222324252627282930313233343536373839404142434445464748495051525354555657585960
For Peer Review
Mica Or Similar Materials. TB It/US 68 1.68 1.14 s s 0.59
Glass And Glassware TB De/US 70 0.66 9.70 s s 0.41
TB It/US 70 3.89 7.20 s s 0.49
Natural Or Cultured Pearls, Precious Or Semi-Precious Stones, Precious Metal, Metal Clad With Precious Metal, And Articles Thereof, Imitation
Jewellery Coin.
TB De/US 71 0.71 6.32 s s 0.56
TB It/US 71 0.99 7.98 s s 0.39
Iron And Steel TB De/US 72 0.25 0.77 s s 0.50
TB It/US 72 0.31 0.67 s s 0.58
Articles Of Iron Or Steel TB De/US 73 3.59 2.99 s s 0.47
TB It/US 73 0.81 4.02 s s 0.62
Aluminium And Articles Thereof TB De/US 76 5.06 0.61 s us 0.33
TB It/US 76 1.59 4.01 s s 0.48
Tools, Implements, Cutlery, Spoons And Forks, Of Base Metal, Parts Thereof Base Metal
TB De/US 82 0.61 7.40 s s 0.43
TB It/US 82 0.41 1.64 s s 0.48
Nuclear Reactors, Boilers, Machinery And Mechanical Appliance, Parts Thereof
TB De/US 84 2.79 3.68 s s 0.52
TB It/US 84 1.39 1.67 s s 0.68
Electrical Machinery And Equipment And Parts Thereof; Sound Recorders And Reproducers, Television Image And Sound Recorders And
Reproducers, And Parts And Accessories Of Such Articles.
TB De/US 85 0.13 10.23 s s 0.49
TB It/US 85 0.85 1.208 us us 0.501
Vehicles Other Than Railway Or Tramway Rolling-Stock, And Parts And Accessories Thereof
TB De/US 87 0.30 3.26 s s 0.40
TB It/US 87 0.44 4.405 s s 0.43
Aircraft, Spacecraft, And Parts Thereof TB De/US 88 0.48 4.77 s s 0.42
TB It/US 88 3.64 4.17 s s 0.58
Optical, Photographic, Cinematographic, Measuring, Checking, Precision, Medical Or
Surgical Instruments And Apparatus; Parts And Accessories Thereof
TB De/US 90 0.34 1.70 s s 0.42
TB It/US 90 0.13 2.65 s s 0.55
Arms And Ammunition; Parts And Accessories Thereof
TB De/US 93 2.67 6.25 s s 0.41
TB It/US 93 2.27 1.38 s us 0.36
Furniture; Bedding, Mattresses, Mattress Supports, Cushions And Similar Stuffed
Furnishings, Lamps And Lighting Fittings, Not Elsewhere Specified Or Included; Illuminated Signs, Illuminated Name-Plants And The Like;
Prefabricated Buildings.
TB De/US 94 0.55 3.24 s s 0.37
TB It/US 94 0.51 5.62 s s 0.49
Other Products TB De/US 99 0.76 5.21 s us 0.49
TB It/US 99 3.69 0.89 s s 0.27
Table 3. Diagnostic statistics.
Notes: Lagrange multiplier test of residual serial correlation; RESET, Ramsey’s test for functional
test. Both are distributed as a �� with one degree of freedom; CUSUM, cumulative sum of
residuals; CUSUMSQ, cumulative sum of squared residuals; S, ‘Stable’, US, ‘Unstable’.
Page 20 of 29
Editorial Office, Dept of Economics, Warwick University, Coventry CV4 7AL, UK
Submitted Manuscript
123456789101112131415161718192021222324252627282930313233343536373839404142434445464748495051525354555657585960
For Peer Review
Industry Description Industry Code F-Test ECM(t-1) Cointegrated?
Dairy Produce; Birds' Eggs; Natural Honey; Edible
Products Of Animal Origin Not Elsewhere Specified Or
Included
TB De/US 4 2.122 Yes
TB It/US 4 11.66 Yes
Edible Fruit And Nuts; Peel Of Citrus Fruits Or Melons TB De/US 8 6.316 Yes
TB It/US 8 14.87 Yes
Oil Seeds And Oleaginous Fruits; Miscellaneous Grains,
Seeds And Fruit, Industrial Or Medicinal Plants, Straw
And Fodder
TB De/US 12
TB It/US 12
Animal Or Vegetable Fats And Oils And Their Cleavage
Products, Prepared Edible Fats, Animal Or Vegetable
Waxes
TB De/US 15 32.03 Yes
TB It/US 15 16.24 Yes
Preparations Of Cereals, Flour, Starch Or Milk;
Pastrycoo’s Products
TB De/US 19 9.52 Yes
TB It/US 19 29.89 Yes
Beverages, Spirits And Vinegar TB De/US 22 10.73 Yes
TB It/US 22 201.68 Yes
Mineral Fuels, Mineral Oils And Products Of Their
Distillation, Bituminous Substances, Mineral Waxes
TB De/US 27 10.25 Yes
TB It/US 27 42.105 Yes
Inorganic Chemicals, Organic or Inorganic Compounds
of Precious Metals, of Rare Earth Metals, of Radioactive
Elements of Isotopes
TB De/US 28 20.157 Yes
TB It/US 28 17.16 Yes
Organic Chemicals TB De/US 29 35.49 Yes
TB It/US 29 21.07 Yes
Pharmaceutical Products TB De/US 30 17.62 Yes
TB It/US 30 19.27 Yes
Tanning or Dyeing Extracts; Tannins and their
Derivatives Dyes Pigments and Other Colouring
Matters, Piants and Varnishes, Putty and Other
Mastics, Inks
TB De/US 32 14.39 Yes
TB It/US 32 46.28 Yes
Essential Oils And Resinous; Perfumery, Cosmetic Or
Toilet Preparations
TB De/US 33 16.26 Yes
TB It/US 33 43,601 Yes
Page 21 of 29
Editorial Office, Dept of Economics, Warwick University, Coventry CV4 7AL, UK
Submitted Manuscript
123456789101112131415161718192021222324252627282930313233343536373839404142434445464748495051525354555657585960
For Peer Review
Miscellaneous Chemical Products TB De/US 38 7.61 Yes
TB It/US 38 23.802 Yes
Plastics And Articles Thereof TB De/US 39 17.57 Yes
TB It/US 39 26.47 Yes
Rubber And Articles Thereof TB De/US 40 25.40 Yes
TB It/US 40 36.01 Yes
Raw Hides And Skins (Other Than Furskins) And Leather TB De/US 41 47.15 Yes
TB It/US 41 15.52 Yes
Articles Of Leather; Saddlery And Harness; Travel Goods,
Hand Bags And Similar Containers, Articles Of Animal Gut
(Other Than Silkworm Gut)
TB De/US 42 21.28 Yes
TB It/US 42 24.97 Yes
Paper And Paperboard; Articles Of Paper Pulp, Of Paper
Or Paperboard
TB De/US 48 8.90 Yes
TB It/US 48 18.11 Yes
Articles Of Apparel And Clothing Accessories, Knitted Or
Crocheted.
TB De/US 61
TB It/US 61
Articles Of Apparel And Clothing Accessories, Not Knitted TB De/US 62 22.59 Yes
TB It/US 62 30.77 Yes
Footwear, Gaiters And The Like; Parts Of Such Articles TB De/US 64 18.03 Yes
TB It/US 64 Yes
Articles Of Stone, Plaster, Cement, Asbestos, Mica Or
Similar Materials.
TB De/US 68 15.19 Yes
TB It/US 68 36.84 Yes
Ceramic Products TB De/US 69 4.19 Yes
TB It/US 69 6.25 Yes
Glass And Glassware TB De/US 70 12.99 Yes
TB It/US 70 Yes
Natural Or Cultured Pearls, Precious Or Semi-Precious
Stones, Precious Metal, Metal Clad With Precious Metal,
And Articles Thereof, Imitation Jewellery Coin.
TB De/US 71 25.22 Yes
TB It/US 71 9.45 Yes
Iron And Steel TB De/US 72 18.05 Yes
Page 22 of 29
Editorial Office, Dept of Economics, Warwick University, Coventry CV4 7AL, UK
Submitted Manuscript
123456789101112131415161718192021222324252627282930313233343536373839404142434445464748495051525354555657585960
For Peer Review
TB It/US 72 31.42 Yes
Articles Of Iron Or Steel TB De/US 73 10.68 Yes
TB It/US 73 20.42 Yes
Copper and Artciles Thereof TB De/US 74 10.47 Yes
TB It/US 74 18.66 Yes
Aluminium And Articles Thereof TB De/US 76 10.75 Yes
TB It/US 76 33.79 Yes
Tools, Implements, Cutlery, Spoons And Forks, Of Base
Metal, Parts Thereof Base Metal
TB De/US 82 15.99 Yes
TB It/US 82 31.05 Yes
Nuclear Reactors, Boilers, Machinery And Mechanical
Appliance, Parts Thereof
TB De/US 84 14.25 Yes
TB It/US 84 15.94 Yes
Electrical Machinery And Equipment And Parts Thereof;
Sound Recorders And Reproducers, Television Image
And Sound Recorders And Reproducers, And Parts And
Accessories Of Such Articles.
TB De/US 85 24.57 Yes
TB It/US 85 29.74 Yes
Vehicles Other Than Railway Or Tramway Rolling-Stock,
And Parts And Accessories Thereof
TB De/US 87 14.76 Yes
TB It/US 87 17.46 Yes
Aircraft, Spacecraft, And Parts Thereof TB De/US 88 8.73 Yes
TB It/US 88 22.05 Yes
Ships, boats and floating structures TB De/US 89 34.72 Yes
TB It/US 89 9.64 Yes
Optical, Photographic, Cinematographic, Measuring,
Checking, Precision, Medical Or Surgical Instruments And
Apparatus; Parts And Accessories Thereof
TB De/US 90 24.03 Yes
TB It/US 90 28.5 Yes
Arms And Ammunition; Parts And Accessories Thereof TB De/US 93 11.22 Yes
TB It/US 93 17.55 Yes
Furniture; Bedding, Mattresses, Mattress Supports,
Cushions And Similar Stuffed Furnishings, Lamps And
Lighting Fittings, Not Elsewhere Specified Or Included;
Illuminated Signs, Illuminated Name-Plants And The Like;
Prefabricated Buildings.
TB De/US 94 28.05 Yes
TB It/US 94 20.7 Yes
Page 23 of 29
Editorial Office, Dept of Economics, Warwick University, Coventry CV4 7AL, UK
Submitted Manuscript
123456789101112131415161718192021222324252627282930313233343536373839404142434445464748495051525354555657585960
For Peer Review
Other Products TB De/US 99
TB It/US 99
Table 4. Cointegration test statistics (new sample).
Notes: the upper bound critical value of the F-test for cointegration is 3.898 at the 10% level of significance. Numbers inside parentheses are the t-
ratios. The new industries are written in bold.
Page 24 of 29
Editorial Office, Dept of Economics, Warwick University, Coventry CV4 7AL, UK
Submitted Manuscript
123456789101112131415161718192021222324252627282930313233343536373839404142434445464748495051525354555657585960
For Peer Review
Industry Description Industry Code Short-run coefficient estimate Long-run coeffcient estimates
Δln REXt Δln REXt-1 Δln REXt-2 Δln REXt-3 Constant lnYDE lnYIT lnYUS ln REX
Dairy Produce; Birds' Eggs;
Natural Honey; Edible
Products Of Animal Origin
Not Elsewhere Specified Or
Included
TB De/US 4 1.036 (0.33) -1.73 (-0.65) -3.90 (-1.70) 6.61 (1.42) -328.53 (-3.42) 5.83 (0.95) 6.03 (0.88) -1.70 (-1.35)
TB It/US 4 -7.20 (-1.89) -1.56 (-0.49) -10.15 (-2.79) 8.08 (2.23) -1017.96 (-5.13) 22.76 (4.62) 15.002 (4.83) -1.76 (0.104)
Edible Fruit And Nuts; Peel
Of Citrus Fruits Or Melons
TB De/US 8 3.71 (1.75) -1.93 (-0.77) n.a. n.a. 129.11 (1.67) 11.93 (2.88) -15.10 (-2.78) 2.19 (1.61)
TB It/US 8 -5.01 (-1.44) 6.38 (2.098) n.a. n.a. -35.64 (-0.16) -2.87 (-0.507) 3.68 (1.16) -1.44 (-1.16)
Animal Or Vegetable Fats
And Oils And Their
Cleavage Products,
Prepared Edible Fats,
Animal Or Vegetable Waxes
TB De/US 15 0.72 (0.22) 5.06 (1.31) -3.35 (-1.04) 0.75 (0.21) 256.66 (2.78) -12.23 (-1.16) 2.17 (0.25) 1.92 (1.24)
TB It/US 15 1.89 (0.40) 6.49 (1.44) 6.63 (1.55) 6.06 (1.11) -1069.39 (-3.04) 15.07 (1.74) 23.45 (4.04) -4.49 (-2.20)
Preparations Of Cereals,
Flour, Starch Or Milk;
Pastrycoo’s Products
TB De/US 19 0.10 (0.04) 3.61 (1.89) -1.87 (-1.01) -5.52 (-3.29) 25.82 (0.57) 1.33 (0.41) -2.01 (-0.64) 0.28 (0.34)
TB It/US 19 -0.01 (-0.02) -4.16 (-1.46) -5.84 (-1.83) -0.06 (-0.02) 346.57 (1.07) -12.08 (-1.34) -1.06 (-0.31) 0.53 (0.37)
Beverages, Spirits And
Vinegar
TB De/US 22 0.01 (0.03) n.a. n.a. n.a. 158.11 (3.74) -6.87 (-2.33) 0.75 (0.28) 0.71 (1.44)
TB It/US 22 1.34 (1.42) n.a. n.a. n.a. 140.81 (1.62) -0.2 (-0.08) -4.73 (-4.56) -0.39 (-0.77)
Mineral Fuels, Mineral Oils
And Products Of Their
Distillation, Bituminous
Substances, Mineral Waxes
TB De/US 27 -6.16 (-1.79) n.a. n.a. n.a. 189.40 (2.11) -23.03 (-2.19) 14.06 (1.48) 1.22 (0.77)
TB It/US 27 5.09 (1.01) -6.91 (-1.38) -11.71 (-2.07) -5.89 (-0.99) 1471.42 (3.51) -18.101 (-1.94) -34.37 (-3.86) 11.74 (0.01)
Inorganic Chemicals,
Organic or Inorganic
Compounds of Precious
Metals, of Rare Earth
Metals, of Radioactive
Elements of Isotopes
TB De/US 28 −2.08 (−0.91) −0.02 ( −0.01) −2.23 (−1.16) −1.51 (−0.83) −47.27 (−0.97) 2.96 (0.96) −1.01 (−0.29) 0.54 (0.56)
TB It/US 28 1.51 (1.11) 1.51 (1.21) 1.64 (0.96) 2.01 (1.28) -139.05 (-1.47) 8.23 (3.29) -2.46 (-1.76) -1.09 (-1.62)
Organic Chemicals TB De/US 29 -2.05 (-1.55) 2.49 (2.04) 3.56 (2.10) 3.38 (2.29) -60.90 (-1.47) -7.36 (-2.49) 8.68 (2.18) -1.94 (-2.65)
TB It/US 29 -0.61 (-0.33) 2.72 (1.64) -0.49 (-0.29) 3.93 (2.27) 91.14 (0.92) -3.93 (2.27) -3.33(-1.40) 0.92 (1.40)
Pharmaceutical Products TB De/US 30 −1.123 ( −1.18) −0.29 (−0.32) 0.56 (0.55) 0.318 (0.42 ) −135.44 (−4.66) −2.78 (−1.42) 7.13 (3.19) −1.06 (−2.49)
TB It/US 30 -3.03 (-1.62) 2.00 (1.49) -4.61 (-2.66) n.a. 78.01 (0.77) -2.02 (-0.71) -0.94 (1.28) 0.94 (1.28)
Tanning or Dyeing Extracts;
Tannins and their
Derivatives Dyes Pigments
and Other Colouring
Matters, Piants and
Varnishes, Putty and Other
TB De/US 32 −0.09 (−0.16) −0.88 (−1.57) −0.26 (−0.38) 1.25 (2.05) −63.77 (−2.71) 1.13 (0.78) 1.17 (0.82) −0.76 (−2.57)
TB It/US 32 -3.25 (-2.70) 0.18 (0.18) -0.78 (-0.53) n.a. 59.73 (0.94) -4.306 (-2.64) 1.74 (1.77) 0.12 (0.31)
Page 25 of 29
Editorial Office, Dept of Economics, Warwick University, Coventry CV4 7AL, UK
Submitted Manuscript
123456789101112131415161718192021222324252627282930313233343536373839404142434445464748495051525354555657585960
For Peer Review
Mastics, Inks
Essential Oils And Resinous;
Perfumery, Cosmetic Or
Toilet Preparations
TB De/US 33 0.56 (0.85) 0.84 (1.35) −1.27 (−2.48) −1.31 (−2.24) 7.00 (0.583) 5.11 (4.94) −4.79 (−4.57) −0.14 (−0.48)
TB It/US33 0.88 (0.81) 3.06 (2.44) -0.46 (-0.36) 2.96 (2.61) -332.9 (-5.62) 8.65 (4.63) 3.86 (3.76) -1.39 (-2.37)
Miscellaneous Chemical
Products
TB De/US 38 0.54 (0.98) 0.53 (1.01) −1.66 (−2.61) n.a. −22.59 (−1.41) 2.77 (2.53) −1.70 (−1.63) −0.17 (−0.62)
TB It/US 38 -0.039 (-0.05) n.a. n.a. n.a. -2.54 (-0.05) -4.18 (-3.18) 3.73 (4.72) 0.16 (0.61)
Plastics And Articles
Thereof
TB De/US 39 −0.33 (−0.98) −0.05 (−0.15) −0.54 (−2.10) 1.15 (3.98) −36.31 (−3.88) −0.47 (−0.74) 1.67 (2.09) −0.44 (−2.87)
TB It/US 39 -0.43 (-0.75) 1.58 (2.21) -0.31 (-0.48) 1.505 (2.81) 87.52 (1.97) -5.41 (-4.53) 1.76 (2.55) -0.68 (-2.57)
Rubber And Articles
Thereof
TB De/US 40 −0.29 (−0.52) 0.79 (1.35) 0.51 (1.01) 0.688 (1.97) −66.84 (−4.56) −1.08 (−1.51) 3.25 (3.73) −0.89 (−3.34)
TB It/US 40 -0.51 (-0.72) n.a. n.a. n.a. -149.37 (-2.85) -1.09 (-0.78) 6.13 (6.37) 1.41 (3.87)
Raw Hides And Skins (Other
Than Furskins) And Leather
TB De/US 41 −2.75 (−1.32) 1.15 (0.45) −6.20 (−2.82) n.a. 291.91 (4.68) −40.05 (−8.23) 25.81 (5.08) 4.17 (3.42)
TB It/US 41 -2.27 (-1.71) -1.13 (-0.53) -2.87 (-1.81) -2.08 (-1.32) 549.05 (4.07) -14.15 (-4.13) -6.35 (-3.49) 3.408 (5.82)
Articles Of Leather;
Saddlery And Harness;
Travel Goods, Hand Bags
And Similar Containers,
Articles Of Animal Gut
(Other Than Silkworm Gut)
TB De/US 42 −0.48 (−0.41) 1.85 (2.17) 0.37 (0.31) −0.50 (−0.51) 5.51 (0.18) 0.16 (0.10) −0.29 ( −0.14) −0.57 (−1.04)
TB It/US 42 1.05 (0.69) 2.47 (1.96) 1.89 (1.31) n.a. -427.71 (-4.93) 2.77 (1.53) 12.33 (5.94) -3.23 (-4.01)
Paper And Paperboard;
Articles Of Paper Pulp, Of
Paper Or Paperboard
TB De/US 48 0.21 (0.32) n.a. n.a. n.a. 1.52 (0.08) −1.62 (−1.16) 1.42 (0.97) 0.07 (0.23)
TB It/US 48 -1.49 (-1.52) 0.52 (0.55) -2.507 (-2.81) 1.83 (2.22) 90.94 (1.33) -1.81 (-1.02) -1.52 (-1.56) 1.68 (4.36)
Articles Of Apparel And
Clothing Accessories, Not
Knitted
TB De/US 62 1.26 (0.94) −0.30 (−0.18) 2.40 (1.97) n.a. −62.57 (−1.60) 3.20 (1.16) −0.70 (−0.26) 0.24 (0.52)
TB It/US 62 -0.55 (-0.64) n.a. n.a. n.a. -20.7 (-0.31) -4.107 (-2.43) 4.42 (4.44) -1.56 (-4.05)
Footwear, Gaiters And The
Like; Parts Of Such Articles
TB De/US 64 −0.43 (−0.32) 1.96 (1.91) 3.18 (2.78) −199.47 (−4.84) 1.64 (0.47) 1.64 (0.47) 5.42 (1.81) −1.31 (−2.64)
TB It/US 64 -0.45 (-0.21) 2.46 (1.27) 0.99 (0.78) -2.45 (-1.23) -640.64 (-4.95) 12.26 (4.04) 11.38 (5.42) -2.68 (-3.41)
Articles Of Stone, Plaster,
Cement, Asbestos, Mica Or
Similar Materials.
TB De/US 68 −0.40 (−0.72) −0.40 (−0.84) −1.32 (−1.94) n.a. 23.36 (1.67) 0.84 (0.72) −1.55 (−1.24) −0.20 (−0.61)
TB It/US 68 -3.37 (-2.76) 0.75 (0.67) -3.08 (-2.12) -2.08 (-1.99) 223.55 (2.91) -2.38 (-1.18) -5.502 (-5.09) 1.84 (3.68)
Ceramic Products TB De/US 69 0.28 (0.30) n.a. n.a. n.a. 75.24 (2.72) 0.77(0.56) −3.25 (−2.14) 0.32 (0.99)
TB It/US 69 -0.97 (-0.62) 1.48 (0.87) -2.69 (-1.99) n.a. 71.85 (0.66) -1.95 (-0.805) -0.62 (-0.34) 1.17 (2.06)
Glass And Glassware TB De/US 70 −0.22 (−0.41) n.a. n.a. n.a. −25.03 (−1.99) −3.91 (−2.01) 4.34 (2.21) −0.93 (−2.99)
TB It/US 70 -2.91 (-2.46) -1.63 (-1.22) n.a. n.a. 64.62 (0.72) -1.16 (-0.52) -1.15 (-0.88) 0.75 (1.68)
Natural Or Cultured Pearls,
Precious Or Semi-Precious
Stones, Precious Metal,
Metal Clad With Precious
TB De/US 71 −0.50 (−0.24) −0.96 (−1.09) −2.43 (−1.39) −2.98 (−3.44) 54.51 (2.09) 0.89 (0.32) −2.65 (−0.97) 0.67 (1.52)
TB It/US 71 0.12 (0.07) 0.66 (0.38) 0.26 (0.21) -0.29 (-0.19) 78.23(1.11) -6.42 (-3.3) 2.95 (2.02) 0.54 (0.78)
Page 26 of 29
Editorial Office, Dept of Economics, Warwick University, Coventry CV4 7AL, UK
Submitted Manuscript
123456789101112131415161718192021222324252627282930313233343536373839404142434445464748495051525354555657585960
For Peer Review
Metal, And Articles
Thereof, Imitation
Jewellery Coin.
Iron And Steel TB De/US 72 3.46 (4.28) 1.49842 (1.431) −1.88 (−2.63) 0.99 (1.39) −59.82 (−3.06) −1.01 (−0.63) 3.01(1.78) 0.65 (1.65)
TB It/US 72 -3.9 (-1.71) n.a. n.a. n.a. -218.104 (-1.79) 0.54 (0.17) 7.01 (2.82) 1.02 (0.91)
Articles Of Iron Or Steel TB De/US 73 −0.34 (−0.80) 0.81 (1.31) −0.39 (−0.83) 2.08 (3.51) −30.81 (−2.53) 3.01 (2.68) −1.62 (−1.44) −0.52 (−2.29)
TB It/US 73 0.98 (1.01) 3.902 (3.84) 1.73 (1.24) 3.21 (3.42) 161.92 (1.47) -7.45 (-2.61) 1.04 (0.72) -1.24 (-2.53)
Copper and Artciles
Thereof
TB De/US 74 0.01 (0.01) n.a. n.a. n.a. 60.99 (2.78) −4.56 (−2.36) 2.01 (1.21) 0.64 (1.95)
TB It/US 74 1.004 (0.37) -1.37 (-0.65) -4.58 (-1.902) 5.609 (3.01) 312.41 (1.97) -12.4 (-3.02) 0.22 (0.09) 1.89 (2.06)
Aluminium And Articles
Thereof
TB De/US 76 −0.78 (−0.77) 1.37 (1.41) 1.99 (1.39) n.a. 13.13 (0.48) 1.91 (0.85) −2.14 (−0.84) −1.73 (−2.90)
TB It/US 76 0.4 (0.41) 0.57 (0.63) -1.76 (-2.21) n.a. -31.12 (-0.56) 1.32 (0.79) -0.08 (-0.12) 0.46 (1.05)
Tools, Implements, Cutlery,
Spoons And Forks, Of Base
Metal, Parts Thereof Base
Metal
TB De/US 82 −0.26 (−0.41) −0.39 (−0.58) −0.50 (−0.75) n.a. −46.83 (−2.88) −0.28 (−0.24) 1.87 (1.57) −0.35 (−1.26)
TB It/US 82 -0.45 (-0.46) n.a. n.a. n.a. -45.74 (-0.61) -1.073 (-0.54) 2.54 (2.27) 0.58 (0.204)
Nuclear Reactors, Boilers,
Machinery And Mechanical
Appliance, Parts Thereof
TB De/US 84 −0.56 (−1.59) 0.41 (1.02) −0.66 (−1.67) 0.64 (1.67) −70.33 (−5.92) −1.07 (−1.30) 3.37 (3.88) −0.76 (−4.85)
TB It/US 84 -1.52 (-2.41) -0.303 (-0.34) -0.74 (-1.12) 1.57 (2.77) -237.41 (-4.30) 1.02 (0.90) 7.24 (6.43) -1.52 (-4.27)
Electrical Machinery And
Equipment And Parts
Thereof; Sound Recorders
And Reproducers,
Television Image And
Sound Recorders And
Reproducers, And Parts
And Accessories Of Such
Articles.
TB De/US 85 0.06 (0.22) −0.29 (−0.94) −0.10 (−0.30) 0.58 (1.58) −47.46 (−2.85) 2.09 (2.49) −0.24 (−0.39) −0.26 (−1.78)
TB It/US 85 -2.22 (-2.16) 2.36 (2.53) -1.37 (-1.42) -3.13 (-3.12) -144.29 (-2.08) 2.108 (1.26) 3.08 (2.71) -0.509 (0.22)
Vehicles Other Than
Railway Or Tramway
Rolling-Stock, And Parts
And Accessories Thereof
TB De/US 87 1.59 (1.50) 2.07 (1.66) n.a. n.a. −45.30 (−1.78) −1.69 (−1.08) 3.07 (1.73) −0.84 (−1.98)
TB It/US 87 2.72 (2.51) -2.08 (-1.67) -0.87 (-0.82) -0.29 (-0.28) 270.64 (3.43) -7.76 (-3.39) -2.39 (-2.26) 2.27 (4.18)
Aircraft, Spacecraft, And
Parts Thereof
TB De/US 88 −5.47 (−1.07) −7.21 (−1.36) 3.69 (0.83) 1.08 (0.31) −315.21 ( −3.09) −22.37 (−2.50) 30.74 (3.16) −0.44 (−0.24)
TB It/US 88 -2.82 (-1.11) -2.10 (-0.88) -2.70 (-0.99) 4.35 (2.12) 77.13 (0.43) -3.69 (-0.75) 0.59 (0.27) -0.56 (-0.59)
Ships, boats and floating
structures
TB De/US 89 12.57 (1.29) -8.43 (-0.76) 12.009 (1.36) -4.13 (-0.62) -470.30 (-1.71) 31.82 (1.64) -12.36 (-0.61) -9.17 (-1.85)
TB It/US 89 7.05 (0.85) -2.71 (-0.35) -3.96 (-0.55) -15.49 (-2.35) -600.27 (-1.53) -4.65 (-0.45) 24.68 (3.201) -1.12 (-0.31)
Optical, Photographic,
Cinematographic,
Measuring, Checking,
TB De/US 90 0.38 (1.43) −0.33 (−0.77) n.a. n.a. −18.70 (−1.88) −0.06 (−0.09) 0.70 (0.90) −0.31 ( −1.50)
TB It/US 90 -0.42 (-0.89) n.a. n.a. n.a. -144.35 (-3.54) -2.16 (-2.31) 6.82 (8.41) -0.606 (-3.62)
Page 27 of 29
Editorial Office, Dept of Economics, Warwick University, Coventry CV4 7AL, UK
Submitted Manuscript
123456789101112131415161718192021222324252627282930313233343536373839404142434445464748495051525354555657585960
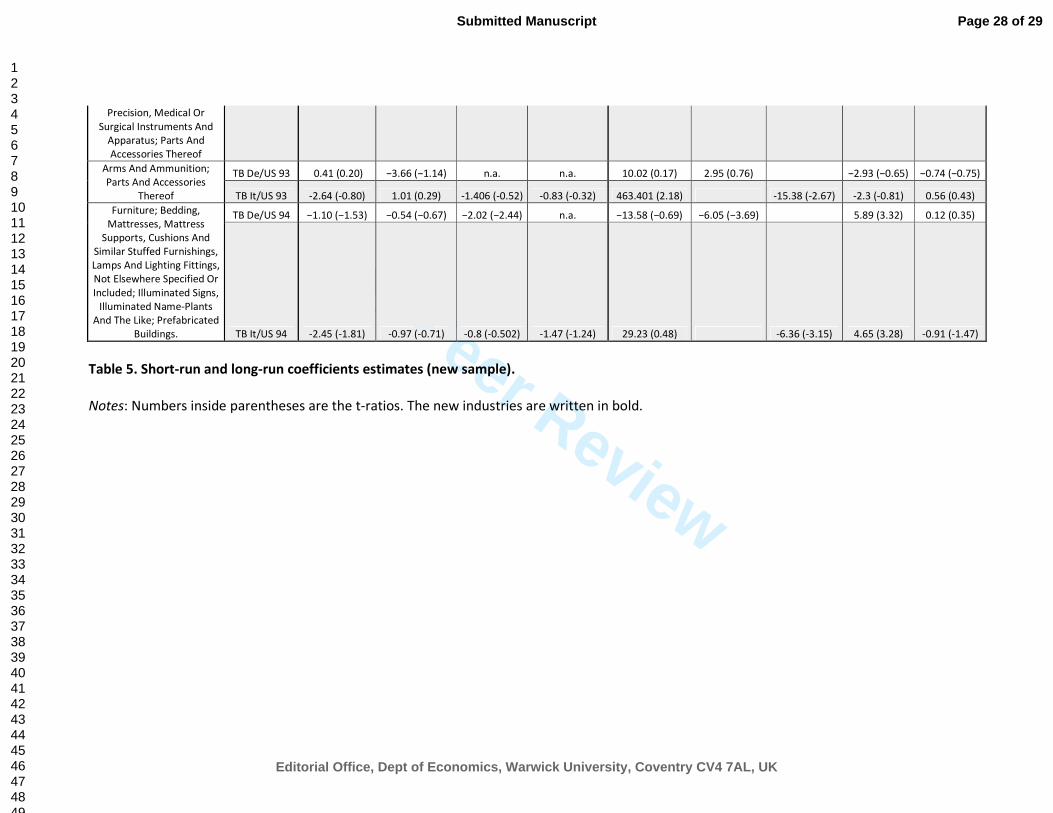
For Peer Review
Precision, Medical Or
Surgical Instruments And
Apparatus; Parts And
Accessories Thereof
Arms And Ammunition;
Parts And Accessories
Thereof
TB De/US 93 0.41 (0.20) −3.66 (−1.14) n.a. n.a. 10.02 (0.17) 2.95 (0.76) −2.93 (−0.65) −0.74 (−0.75)
TB It/US 93 -2.64 (-0.80) 1.01 (0.29) -1.406 (-0.52) -0.83 (-0.32) 463.401 (2.18) -15.38 (-2.67) -2.3 (-0.81) 0.56 (0.43)
Furniture; Bedding,
Mattresses, Mattress
Supports, Cushions And
Similar Stuffed Furnishings,
Lamps And Lighting Fittings,
Not Elsewhere Specified Or
Included; Illuminated Signs,
Illuminated Name-Plants
And The Like; Prefabricated
Buildings.
TB De/US 94 −1.10 (−1.53) −0.54 (−0.67) −2.02 (−2.44) n.a. −13.58 (−0.69) −6.05 (−3.69) 5.89 (3.32) 0.12 (0.35)
TB It/US 94 -2.45 (-1.81) -0.97 (-0.71) -0.8 (-0.502) -1.47 (-1.24) 29.23 (0.48) -6.36 (-3.15) 4.65 (3.28) -0.91 (-1.47)
Table 5. Short-run and long-run coefficients estimates (new sample).
Notes: Numbers inside parentheses are the t-ratios. The new industries are written in bold.
Page 28 of 29
Editorial Office, Dept of Economics, Warwick University, Coventry CV4 7AL, UK
Submitted Manuscript
123456789101112131415161718192021222324252627282930313233343536373839404142434445464748495051525354555657585960
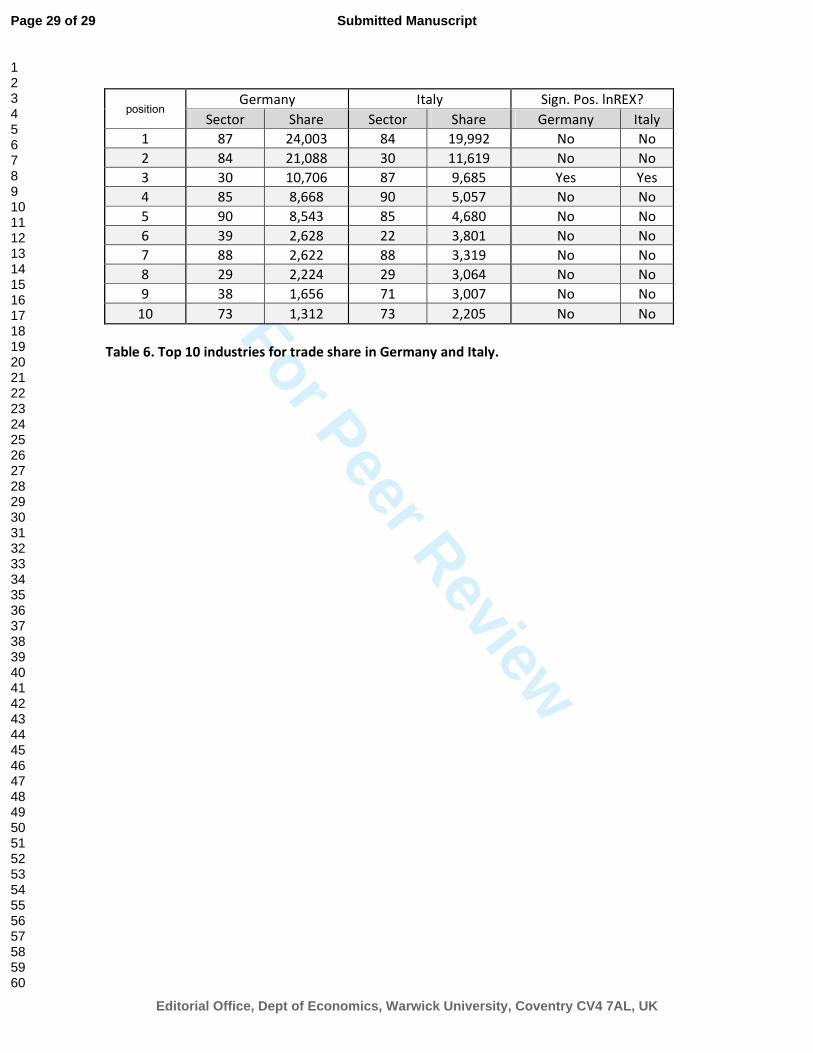
For Peer Review
position Germany Italy Sign. Pos. lnREX?
Sector Share Sector Share Germany Italy
1 87 24,003 84 19,992 No No
2 84 21,088 30 11,619 No No
3 30 10,706 87 9,685 Yes Yes
4 85 8,668 90 5,057 No No
5 90 8,543 85 4,680 No No
6 39 2,628 22 3,801 No No
7 88 2,622 88 3,319 No No
8 29 2,224 29 3,064 No No
9 38 1,656 71 3,007 No No
10 73 1,312 73 2,205 No No
Table 6. Top 10 industries for trade share in Germany and Italy.
Page 29 of 29
Editorial Office, Dept of Economics, Warwick University, Coventry CV4 7AL, UK
Submitted Manuscript
123456789101112131415161718192021222324252627282930313233343536373839404142434445464748495051525354555657585960