Embed Size (px)
Citation preview
FY19Results & Vision 2025
Clean Seas
Seafood
Limited (ASX: CSS)
SEPTEMBER 2019
For
per
sona
l use
onl
y
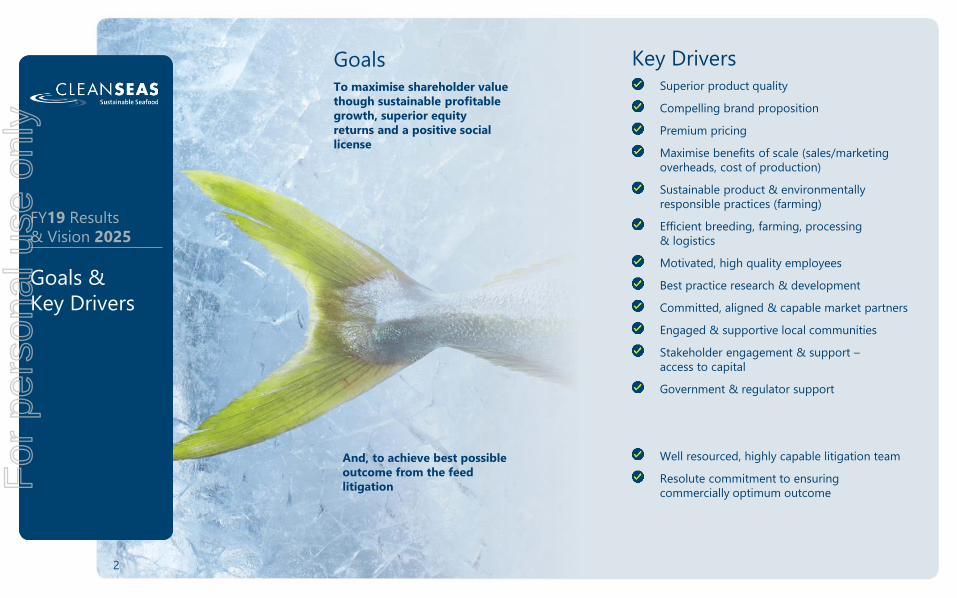
Goals To maximise shareholder value though sustainable profitable growth, superior equity returns and a positive social license
Goals &
Key Drivers
FY19 Results
& Vision 2025
And, to achieve best possible outcome from the feed litigation
Key Drivers Superior product quality
Compelling brand proposition
Premium pricing
Maximise benefits of scale (sales/marketing
overheads, cost of production)
Sustainable product & environmentally
responsible practices (farming)
Efficient breeding, farming, processing
& logistics
Motivated, high quality employees
Best practice research & development
Committed, aligned & capable market partners
Engaged & supportive local communities
Stakeholder engagement & support –
access to capital
Government & regulator support
Well resourced, highly capable litigation team
Resolute commitment to ensuring
commercially optimum outcome
2
For
per
sona
l use
onl
y
Ocean to
Plate
FY19 Results
& Vision 2025
https://www.youtube.com/watch?v=-uEa_rlsEgo
For
per
sona
l use
onl
y
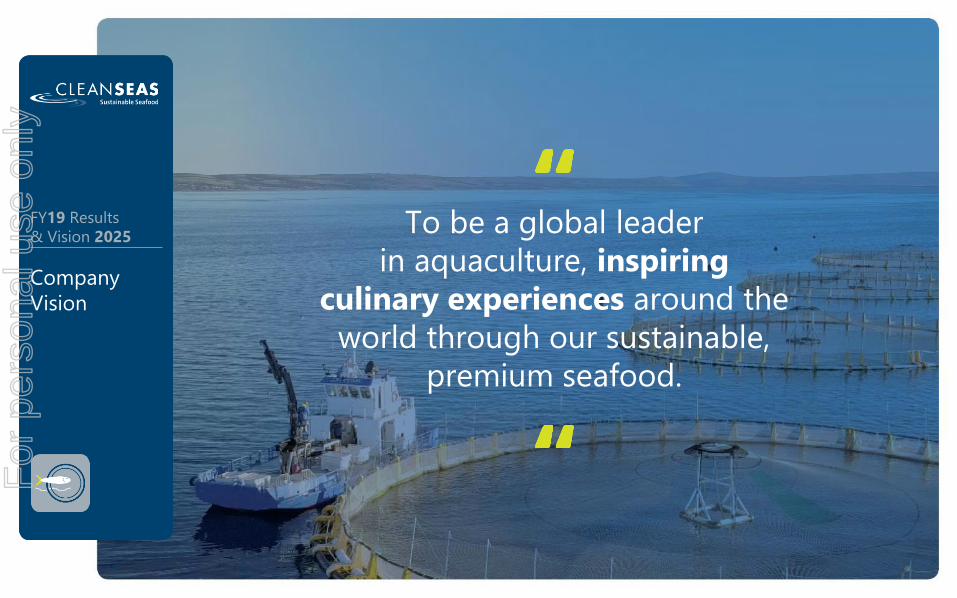
To be a global leader
in aquaculture, inspiring culinary experiences around the
world through our sustainable,
premium seafood.
Company
Vision
FY19 Results
& Vision 2025
4
For
per
sona
l use
onl
y
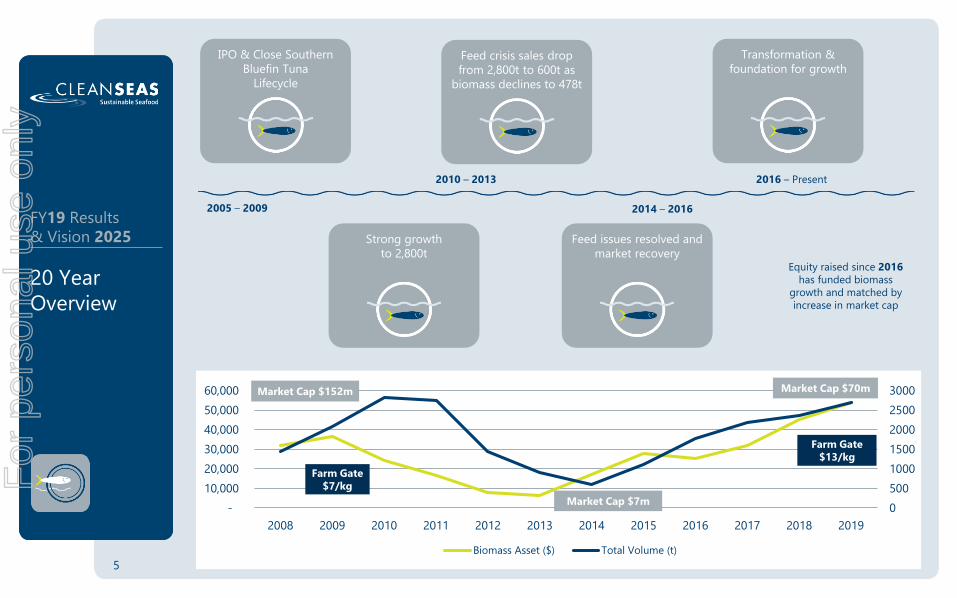
20 Year
Overview
FY19 Results
& Vision 2025
IPO & Close Southern
Bluefin Tuna
Lifecycle
Feed crisis sales drop
from 2,800t to 600t as
biomass declines to 478t
Transformation &
foundation for growth
Strong growth
to 2,800t
Feed issues resolved and
market recovery
2005 – 2009
2010 – 2013
2014 – 2016
2016 – Present
Equity raised since 2016has funded biomass
growth and matched by
increase in market cap
0
500
1000
1500
2000
2500
3000
-
10,000
20,000
30,000
40,000
50,000
60,000
2008 2009 2010 2011 2012 2013 2014 2015 2016 2017 2018 2019
Biomass Asset ($) Total Volume (t)
5
Market Cap $152m
Market Cap $7m
Market Cap $70m
Farm Gate $13/kg
Farm Gate $7/kgF
or p
erso
nal u
se o
nly
Recovery
2012 – 2016
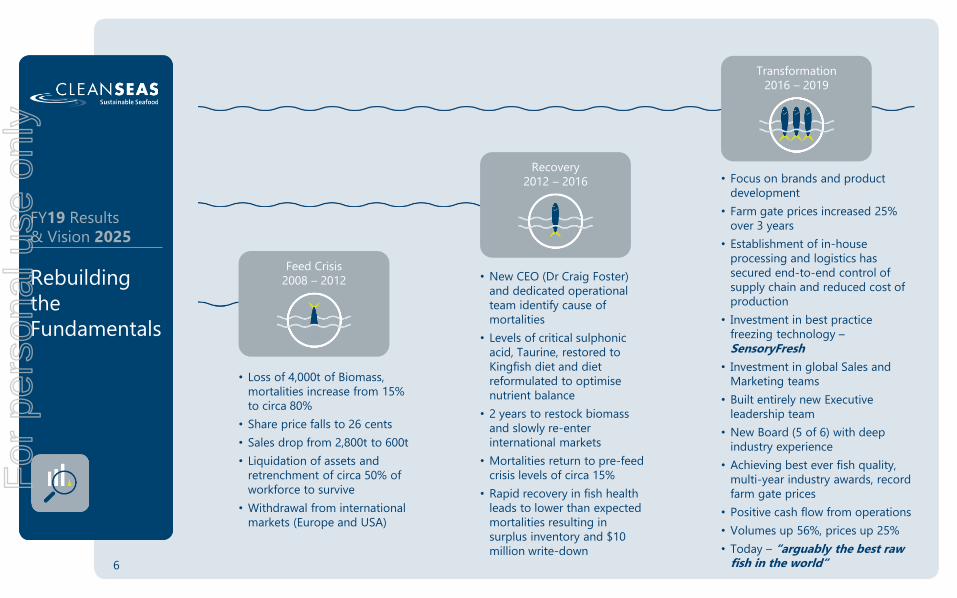
Rebuilding
the
Fundamentals
Feed Crisis
2008 – 2012
Transformation
2016 – 2019
• Loss of 4,000t of Biomass,
mortalities increase from 15%
to circa 80%
• Share price falls to 26 cents
• Sales drop from 2,800t to 600t
• Liquidation of assets and
retrenchment of circa 50% of
workforce to survive
• Withdrawal from international
markets (Europe and USA)
• New CEO (Dr Craig Foster)
and dedicated operational
team identify cause of
mortalities
• Levels of critical sulphonic
acid, Taurine, restored to
Kingfish diet and diet
reformulated to optimise
nutrient balance
• 2 years to restock biomass
and slowly re-enter
international markets
• Mortalities return to pre-feed
crisis levels of circa 15%
• Rapid recovery in fish health
leads to lower than expected
mortalities resulting in
surplus inventory and $10
million write-down
• Focus on brands and product
development
• Farm gate prices increased 25%
over 3 years
• Establishment of in-house
processing and logistics has
secured end-to-end control of
supply chain and reduced cost of
production
• Investment in best practice
freezing technology –
SensoryFresh
• Investment in global Sales and
Marketing teams
• Built entirely new Executive
leadership team
• New Board (5 of 6) with deep
industry experience
• Achieving best ever fish quality,
multi-year industry awards, record
farm gate prices
• Positive cash flow from operations
• Volumes up 56%, prices up 25%
• Today – “arguably the best raw fish in the world”
FY19 Results
& Vision 2025
6
For
per
sona
l use
onl
y
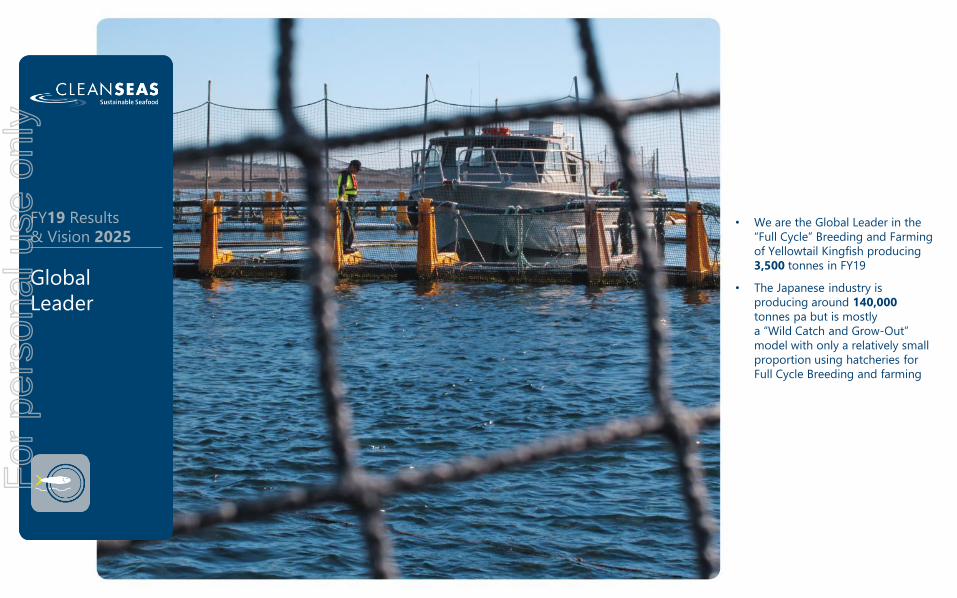
• We are the Global Leader in the
“Full Cycle” Breeding and Farming
of Yellowtail Kingfish producing
3,500 tonnes in FY19
• The Japanese industry is
producing around 140,000 tonnes pa but is mostly
a “Wild Catch and Grow-Out”
model with only a relatively small
proportion using hatcheries for
Full Cycle Breeding and farming
Global
Leader
FY19 Results
& Vision 2025
7
For
per
sona
l use
onl
y
Market
Position
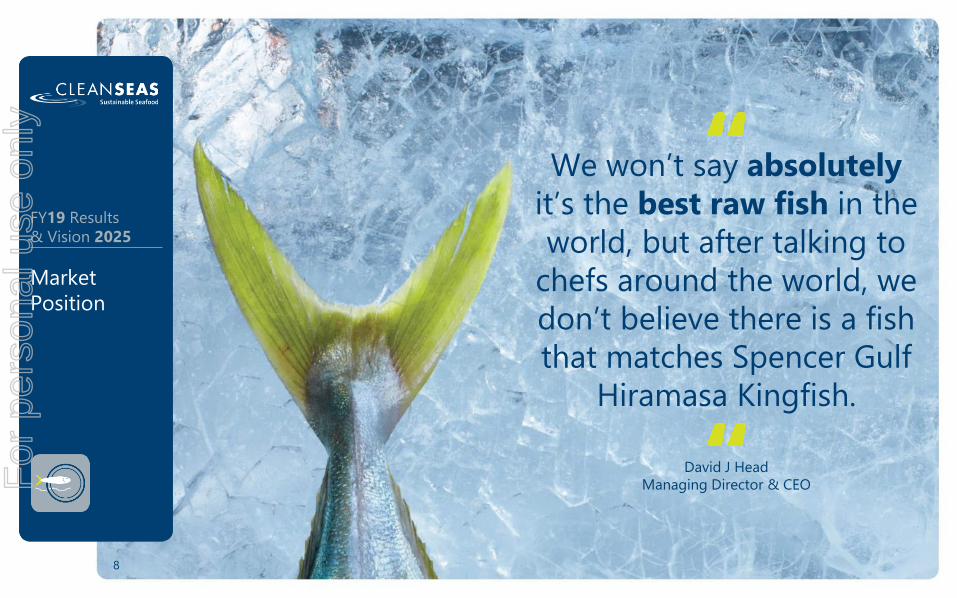
We won’t say absolutelyit’s the best raw fish in the
world, but after talking to
chefs around the world, we
don’t believe there is a fish
that matches Spencer Gulf
Hiramasa Kingfish.
David J Head
Managing Director & CEO
FY19 Results
& Vision 2025
8
For
per
sona
l use
onl
y
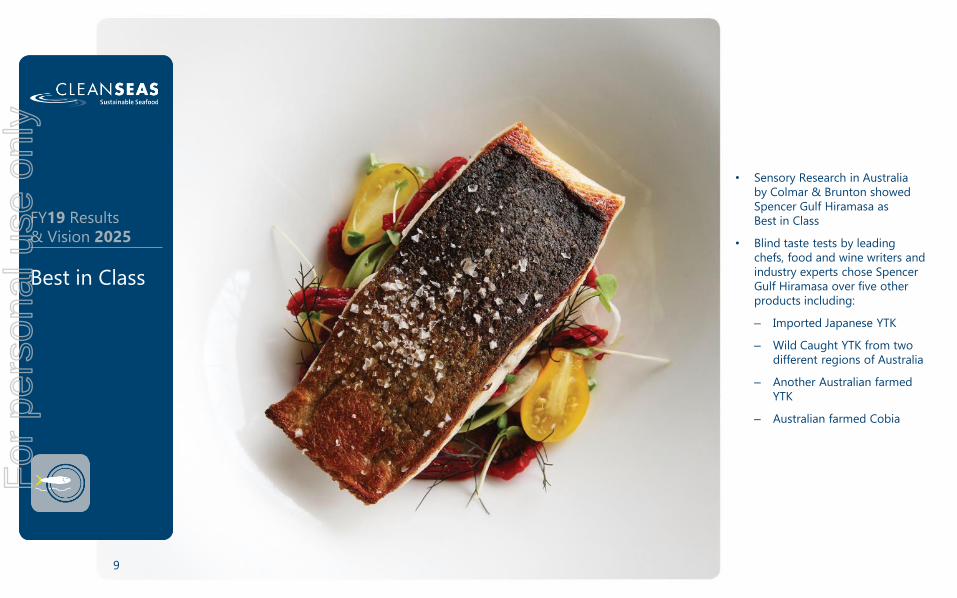
• Sensory Research in Australia
by Colmar & Brunton showed
Spencer Gulf Hiramasa as
Best in Class
• Blind taste tests by leading
chefs, food and wine writers and
industry experts chose Spencer
Gulf Hiramasa over five other
products including:
– Imported Japanese YTK
– Wild Caught YTK from two
different regions of Australia
– Another Australian farmed
YTK
– Australian farmed Cobia
Best in Class
FY19 Results
& Vision 2025
9
For
per
sona
l use
onl
y
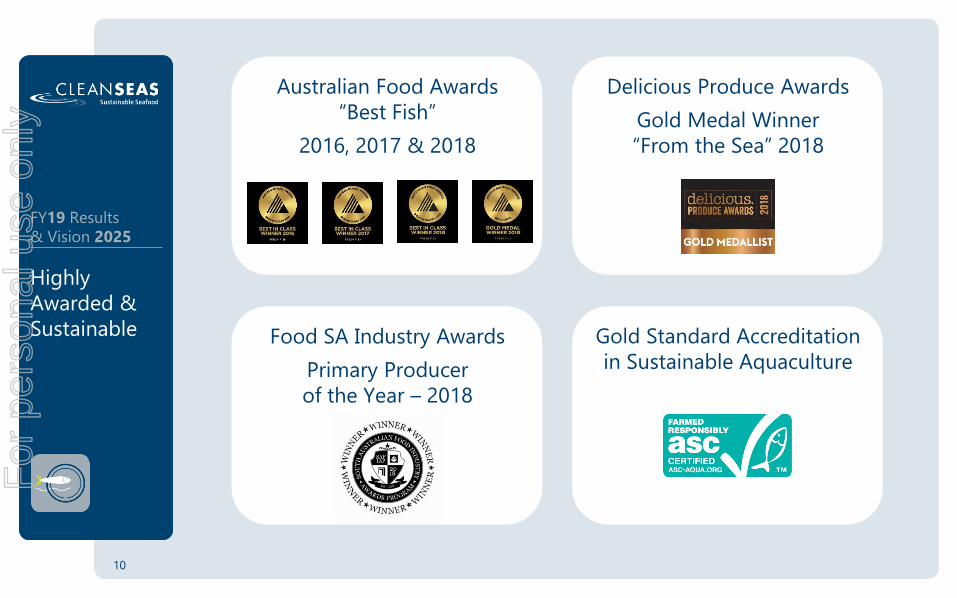
Australian Food Awards
“Best Fish”
2016, 2017 & 2018
Highly
Awarded &
Sustainable
FY19 Results
& Vision 2025
10
Delicious Produce Awards
Gold Medal Winner
“From the Sea” 2018
Food SA Industry Awards
Primary Producer
of the Year – 2018
Gold Standard Accreditation
in Sustainable Aquaculture
For
per
sona
l use
onl
y
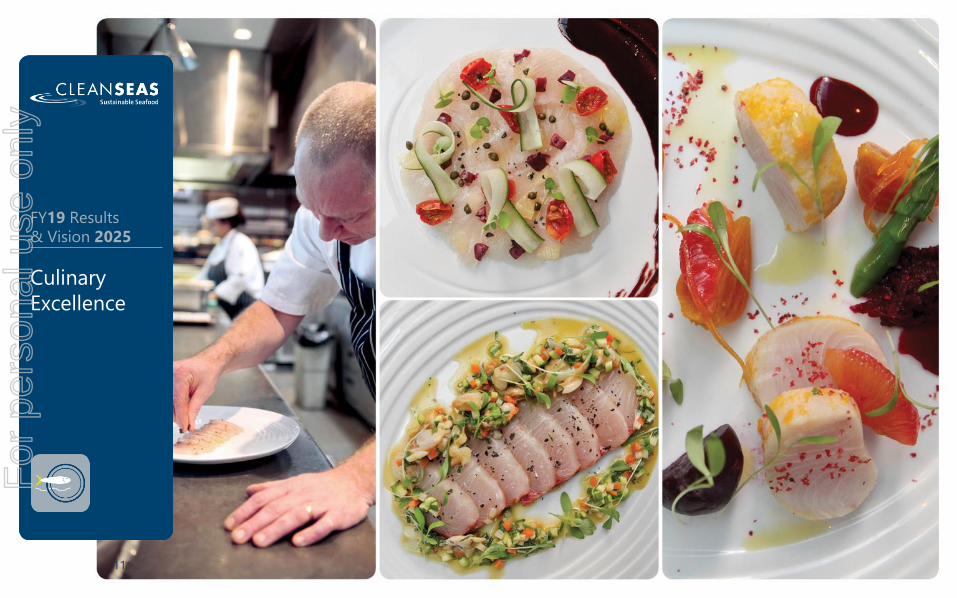
Culinary
Excellence
FY19 Results
& Vision 2025
11
For
per
sona
l use
onl
y
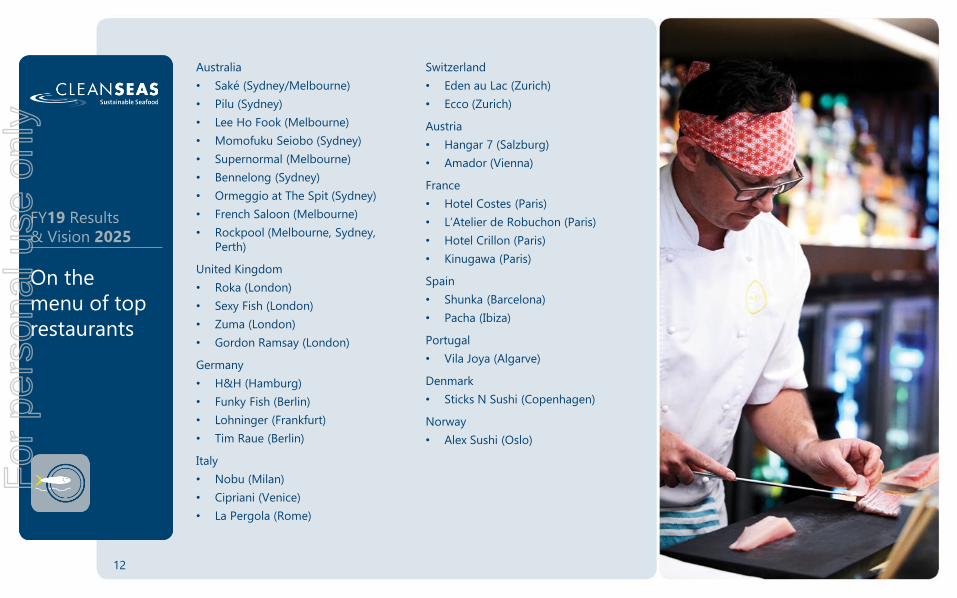
Australia
• Saké (Sydney/Melbourne)
• Pilu (Sydney)
• Lee Ho Fook (Melbourne)
• Momofuku Seiobo (Sydney)
• Supernormal (Melbourne)
• Bennelong (Sydney)
• Ormeggio at The Spit (Sydney)
• French Saloon (Melbourne)
• Rockpool (Melbourne, Sydney,
Perth)
United Kingdom
• Roka (London)
• Sexy Fish (London)
• Zuma (London)
• Gordon Ramsay (London)
Germany
• H&H (Hamburg)
• Funky Fish (Berlin)
• Lohninger (Frankfurt)
• Tim Raue (Berlin)
Italy
• Nobu (Milan)
• Cipriani (Venice)
• La Pergola (Rome)
Switzerland
• Eden au Lac (Zurich)
• Ecco (Zurich)
Austria
• Hangar 7 (Salzburg)
• Amador (Vienna)
France
• Hotel Costes (Paris)
• L’Atelier de Robuchon (Paris)
• Hotel Crillon (Paris)
• Kinugawa (Paris)
Spain
• Shunka (Barcelona)
• Pacha (Ibiza)
Portugal
• Vila Joya (Algarve)
Denmark
• Sticks N Sushi (Copenhagen)
Norway
• Alex Sushi (Oslo)
On the
menu of top
restaurants
FY19 Results
& Vision 2025
12
For
per
sona
l use
onl
y
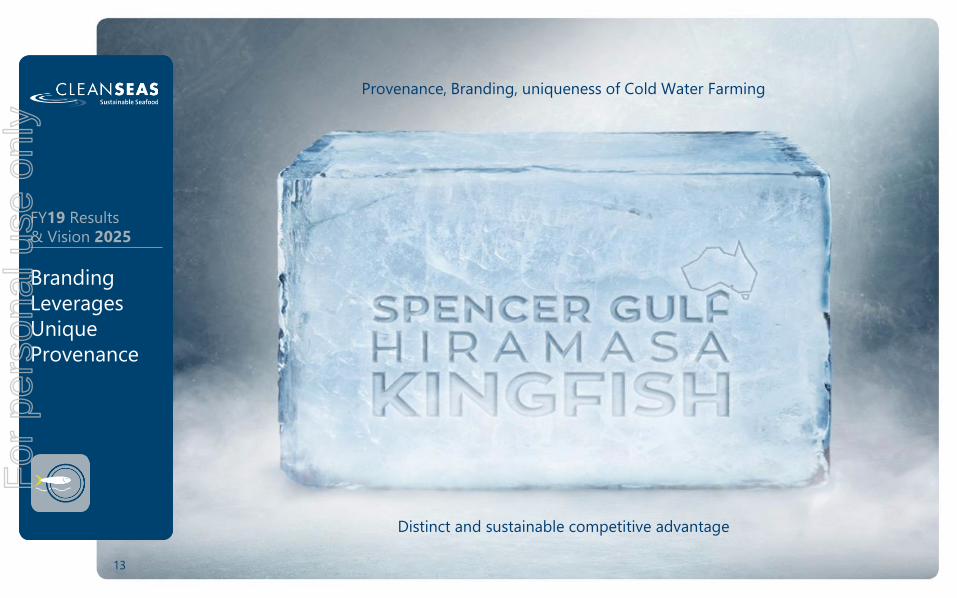
Provenance, Branding, uniqueness of Cold Water Farming
Branding
Leverages
Unique
Provenance
Distinct and sustainable competitive advantage
FY19 Results
& Vision 2025
13
For
per
sona
l use
onl
y
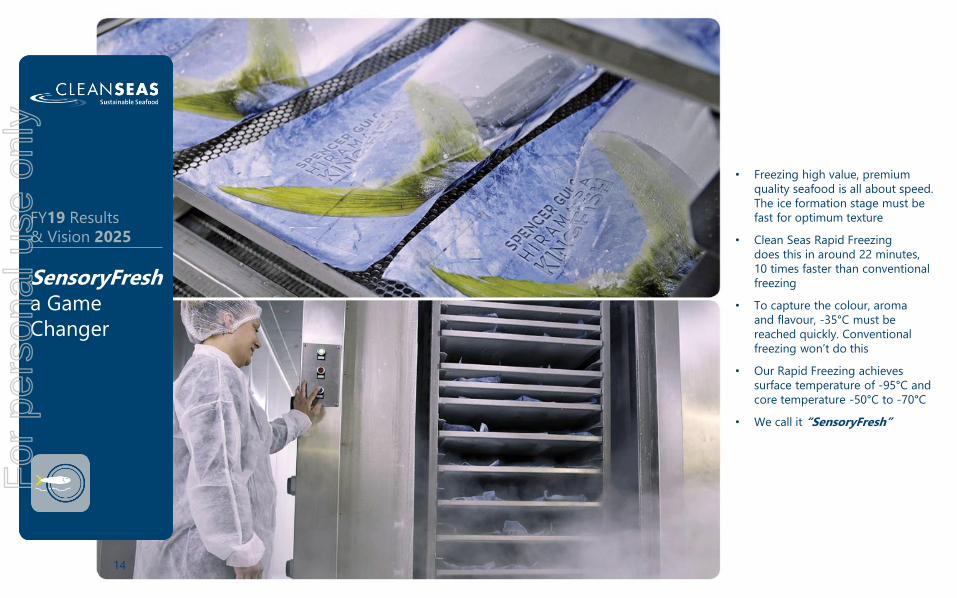
• Freezing high value, premium
quality seafood is all about speed.
The ice formation stage must be
fast for optimum texture
• Clean Seas Rapid Freezing
does this in around 22 minutes,
10 times faster than conventional
freezing
• To capture the colour, aroma
and flavour, -35°C must be
reached quickly. Conventional
freezing won’t do this
• Our Rapid Freezing achieves
surface temperature of -95°C and
core temperature -50°C to -70°C
• We call it “SensoryFresh”
SensoryFresha Game
Changer
FY19 Results
& Vision 2025
14
For
per
sona
l use
onl
y
SensoryFresh
FY19 Results
& Vision 2025
https://www.youtube.com/watch?v=MM_vEmTreRc
For
per
sona
l use
onl
y
FY19 Results
Overview
FY19 Results
& Vision 2025
For
per
sona
l use
onl
y
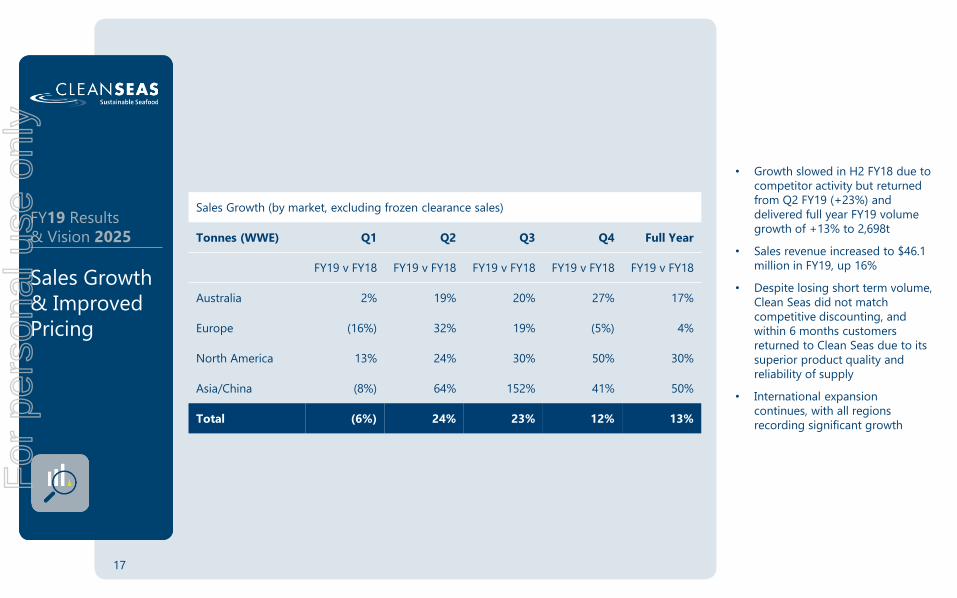
• Growth slowed in H2 FY18 due to
competitor activity but returned
from Q2 FY19 (+23%) and
delivered full year FY19 volume
growth of +13% to 2,698t
• Sales revenue increased to $46.1
million in FY19, up 16%
• Despite losing short term volume,
Clean Seas did not match
competitive discounting, and
within 6 months customers
returned to Clean Seas due to its
superior product quality and
reliability of supply
• International expansion
continues, with all regions
recording significant growth
Sales Growth (by market, excluding frozen clearance sales)
Tonnes (WWE) Q1 Q2 Q3 Q4 Full Year
FY19 v FY18 FY19 v FY18 FY19 v FY18 FY19 v FY18 FY19 v FY18
Australia 2% 19% 20% 27% 17%
Europe (16%) 32% 19% (5%) 4%
North America 13% 24% 30% 50% 30%
Asia/China (8%) 64% 152% 41% 50%
Total (6%) 24% 23% 12% 13%
Sales Growth
& Improved
Pricing
FY19 Results
& Vision 2025
17
For
per
sona
l use
onl
y
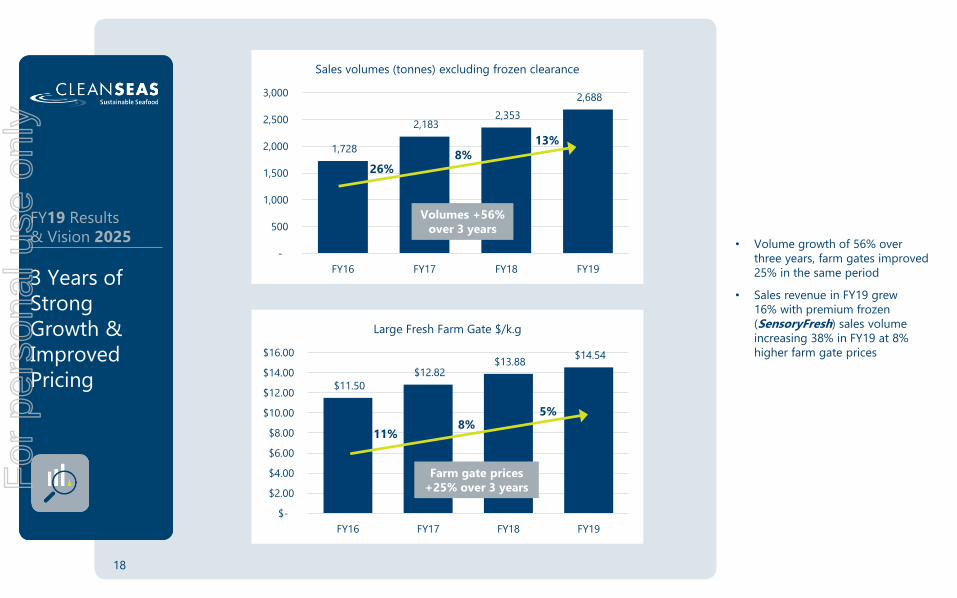
• Volume growth of 56% over
three years, farm gates improved
25% in the same period
• Sales revenue in FY19 grew
16% with premium frozen
(SensoryFresh) sales volume
increasing 38% in FY19 at 8%
higher farm gate prices
3 Years of
Strong
Growth &
Improved
Pricing
1,728
2,183 2,353
2,688
-
500
1,000
1,500
2,000
2,500
3,000
FY16 FY17 FY18 FY19
Sales volumes (tonnes) excluding frozen clearance
26%8%
13%
Volumes +56% over 3 years
$11.50
$12.82 $13.88
$14.54
$-
$2.00
$4.00
$6.00
$8.00
$10.00
$12.00
$14.00
$16.00
FY16 FY17 FY18 FY19
Large Fresh Farm Gate $/k.g
11%8%
5%
Farm gate prices +25% over 3 years
FY19 Results
& Vision 2025
18
For
per
sona
l use
onl
y
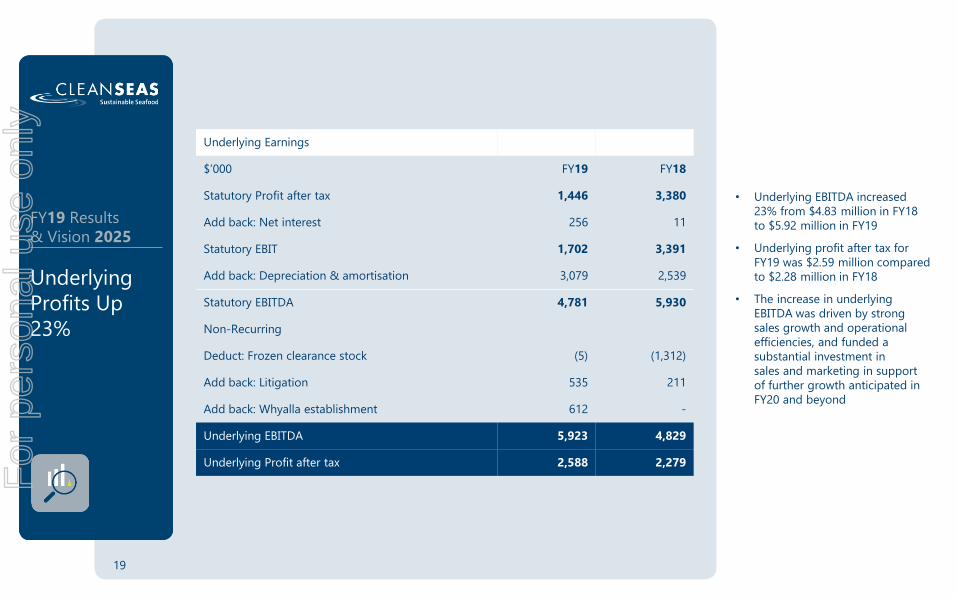
• Underlying EBITDA increased
23% from $4.83 million in FY18
to $5.92 million in FY19
• Underlying profit after tax for
FY19 was $2.59 million compared
to $2.28 million in FY18
• The increase in underlying
EBITDA was driven by strong
sales growth and operational
efficiencies, and funded a
substantial investment in
sales and marketing in support
of further growth anticipated in
FY20 and beyond
Underlying
Profits Up
23%
Underlying Earnings
$’000 FY19 FY18
Statutory Profit after tax 1,446 3,380
Add back: Net interest 256 11
Statutory EBIT 1,702 3,391
Add back: Depreciation & amortisation 3,079 2,539
Statutory EBITDA 4,781 5,930
Non-Recurring
Deduct: Frozen clearance stock (5) (1,312)
Add back: Litigation 535 211
Add back: Whyalla establishment 612 -
Underlying EBITDA 5,923 4,829
Underlying Profit after tax 2,588 2,279
FY19 Results
& Vision 2025
19
For
per
sona
l use
onl
y
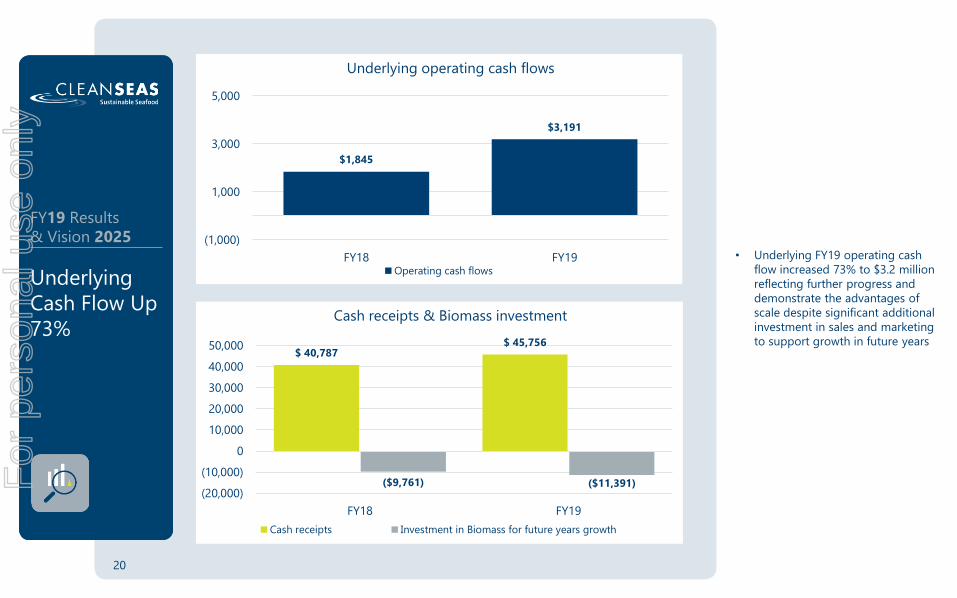
• Underlying FY19 operating cash
flow increased 73% to $3.2 million
reflecting further progress and
demonstrate the advantages of
scale despite significant additional
investment in sales and marketing
to support growth in future years
Underlying
Cash Flow Up
73%
$1,845
$3,191
(1,000)
1,000
3,000
5,000
FY18 FY19
Underlying operating cash flows
Operating cash flows
$ 40,787 $ 45,756
($9,761) ($11,391) (20,000)
(10,000)
0
10,000
20,000
30,000
40,000
50,000
FY18 FY19
Cash receipts & Biomass investment
Cash receipts Investment in Biomass for future years growth
FY19 Results
& Vision 2025
20
For
per
sona
l use
onl
y
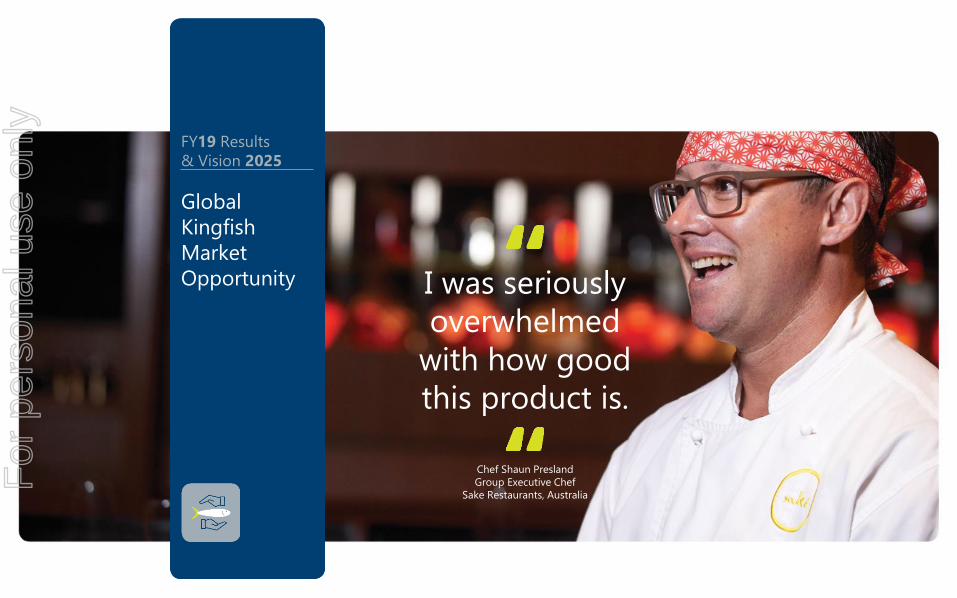
Global
Kingfish
Market
Opportunity
FY19 Results
& Vision 2025
I was seriously
overwhelmed
with how good
this product is.
Chef Shaun Presland
Group Executive Chef
Sake Restaurants, Australia
For
per
sona
l use
onl
y
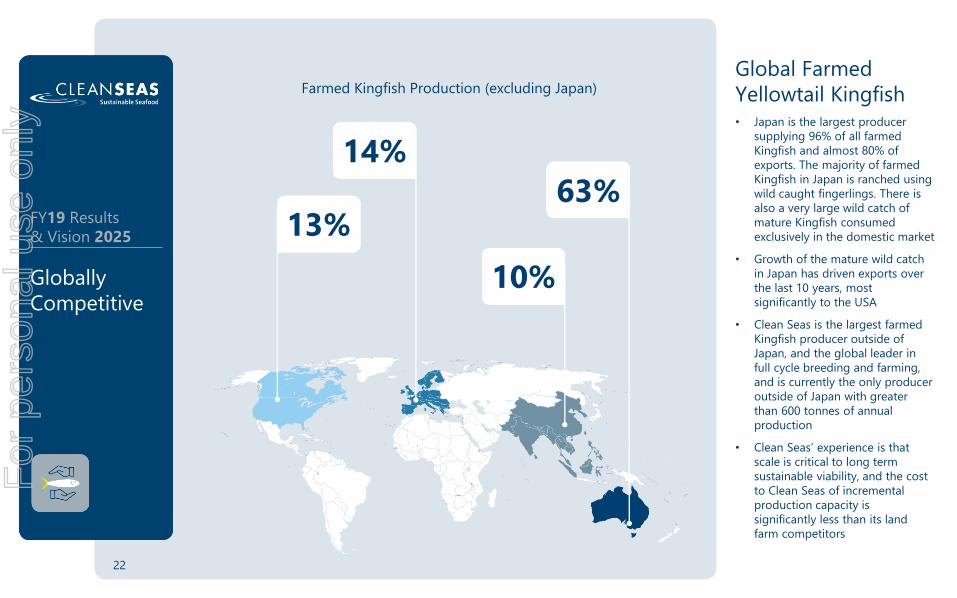
Global Farmed
Yellowtail Kingfish• Japan is the largest producer
supplying 96% of all farmed
Kingfish and almost 80% of
exports. The majority of farmed
Kingfish in Japan is ranched using
wild caught fingerlings. There is
also a very large wild catch of
mature Kingfish consumed
exclusively in the domestic market
• Growth of the mature wild catch
in Japan has driven exports over
the last 10 years, most
significantly to the USA
• Clean Seas is the largest farmed
Kingfish producer outside of
Japan, and the global leader in
full cycle breeding and farming,
and is currently the only producer
outside of Japan with greater
than 600 tonnes of annual
production
• Clean Seas’ experience is that
scale is critical to long term
sustainable viability, and the cost
to Clean Seas of incremental
production capacity is
significantly less than its land
farm competitors
Globally
Competitive
FY19 Results
& Vision 2025
Farmed Kingfish Production (excluding Japan)
14%
13%63%
10%
22
For
per
sona
l use
onl
y
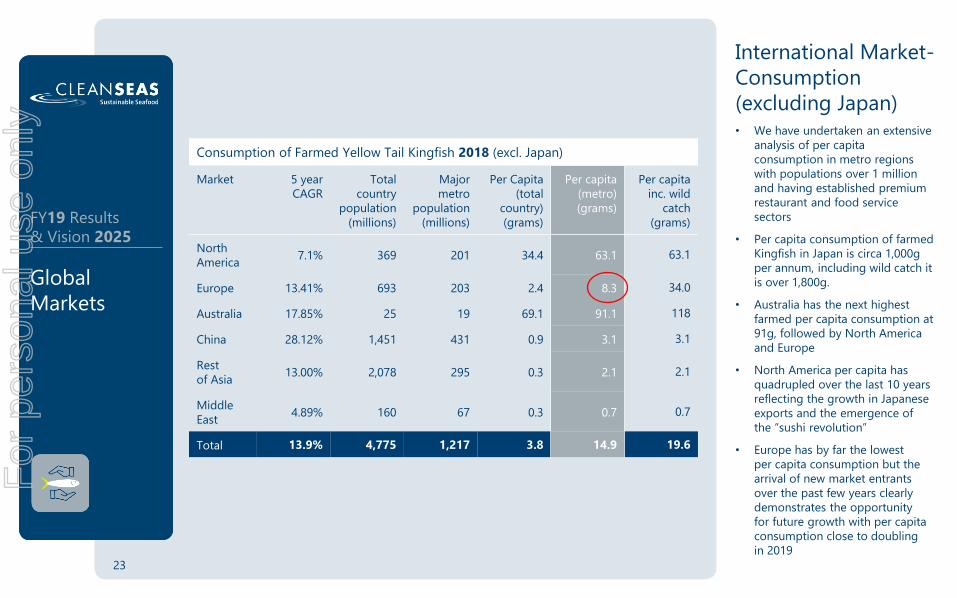
International Market-
Consumption
(excluding Japan)• We have undertaken an extensive
analysis of per capita
consumption in metro regions
with populations over 1 million
and having established premium
restaurant and food service
sectors
• Per capita consumption of farmed
Kingfish in Japan is circa 1,000g
per annum, including wild catch it
is over 1,800g.
• Australia has the next highest
farmed per capita consumption at
91g, followed by North America
and Europe
• North America per capita has
quadrupled over the last 10 years
reflecting the growth in Japanese
exports and the emergence of
the “sushi revolution”
• Europe has by far the lowest
per capita consumption but the
arrival of new market entrants
over the past few years clearly
demonstrates the opportunity
for future growth with per capita
consumption close to doubling
in 2019
Global
Markets
Consumption of Farmed Yellow Tail Kingfish 2018 (excl. Japan)
Market 5 year
CAGR
Total
country
population
(millions)
Major
metro
population
(millions)
Per Capita
(total
country)
(grams)
Per capita
(metro)
(grams)
Per capita
inc. wild
catch
(grams)
North
America7.1% 369 201 34.4 63.1 63.1
Europe 13.41% 693 203 2.4 8.3 34.0
Australia 17.85% 25 19 69.1 91.1 118
China 28.12% 1,451 431 0.9 3.1 3.1
Rest
of Asia13.00% 2,078 295 0.3 2.1 2.1
Middle
East4.89% 160 67 0.3 0.7 0.7
Total 13.9% 4,775 1,217 3.8 14.9 19.6
23
FY19 Results
& Vision 2025
For
per
sona
l use
onl
y
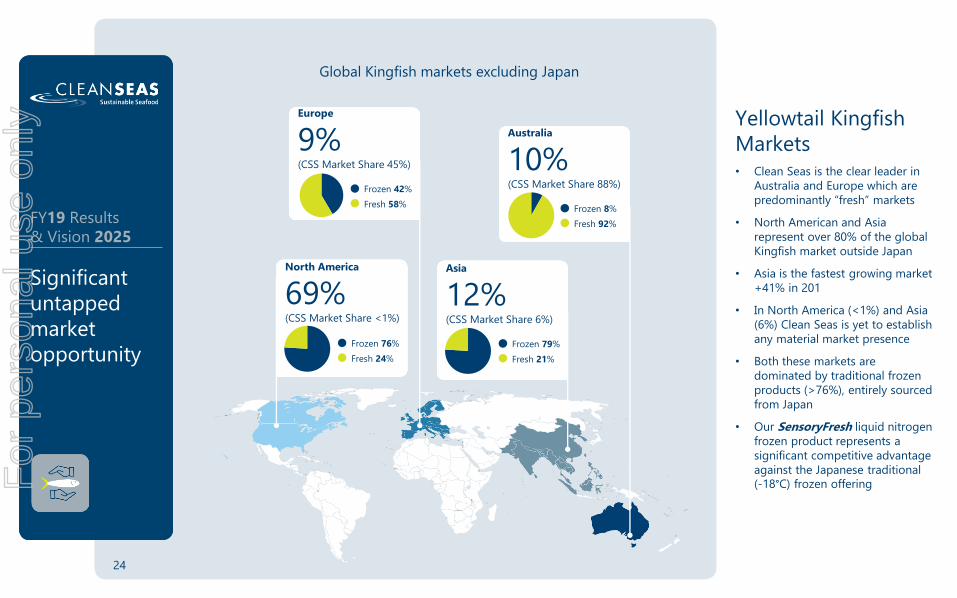
Yellowtail Kingfish
Markets• Clean Seas is the clear leader in
Australia and Europe which are
predominantly “fresh” markets
• North American and Asia
represent over 80% of the global
Kingfish market outside Japan
• Asia is the fastest growing market
+41% in 201
• In North America (<1%) and Asia
(6%) Clean Seas is yet to establish
any material market presence
• Both these markets are
dominated by traditional frozen
products (>76%), entirely sourced
from Japan
• Our SensoryFresh liquid nitrogen
frozen product represents a
significant competitive advantage
against the Japanese traditional
(-18°C) frozen offering
Significant
untapped
market
opportunity
FY19 Results
& Vision 2025
Global Kingfish markets excluding Japan
Australia
10%(CSS Market Share 88%)
Frozen 8%
Fresh 92%
Asia
12%(CSS Market Share 6%)
Frozen 79%
Fresh 21%
Europe
9%(CSS Market Share 45%)
Frozen 42%
Fresh 58%
North America
69%(CSS Market Share <1%)
Frozen 76%
Fresh 24%
24
For
per
sona
l use
onl
y
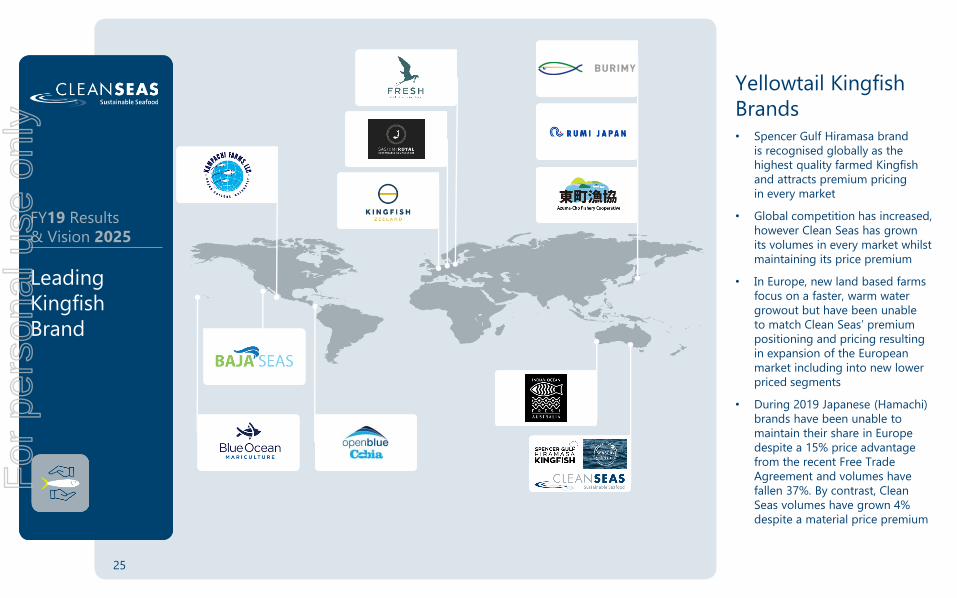
Yellowtail Kingfish
Brands• Spencer Gulf Hiramasa brand
is recognised globally as the
highest quality farmed Kingfish
and attracts premium pricing
in every market
• Global competition has increased,
however Clean Seas has grown
its volumes in every market whilst
maintaining its price premium
• In Europe, new land based farms
focus on a faster, warm water
growout but have been unable
to match Clean Seas’ premium
positioning and pricing resulting
in expansion of the European
market including into new lower
priced segments
• During 2019 Japanese (Hamachi)
brands have been unable to
maintain their share in Europe
despite a 15% price advantage
from the recent Free Trade
Agreement and volumes have
fallen 37%. By contrast, Clean
Seas volumes have grown 4%
despite a material price premium
Leading
Kingfish
Brand
FY19 Results
& Vision 2025
25
For
per
sona
l use
onl
y
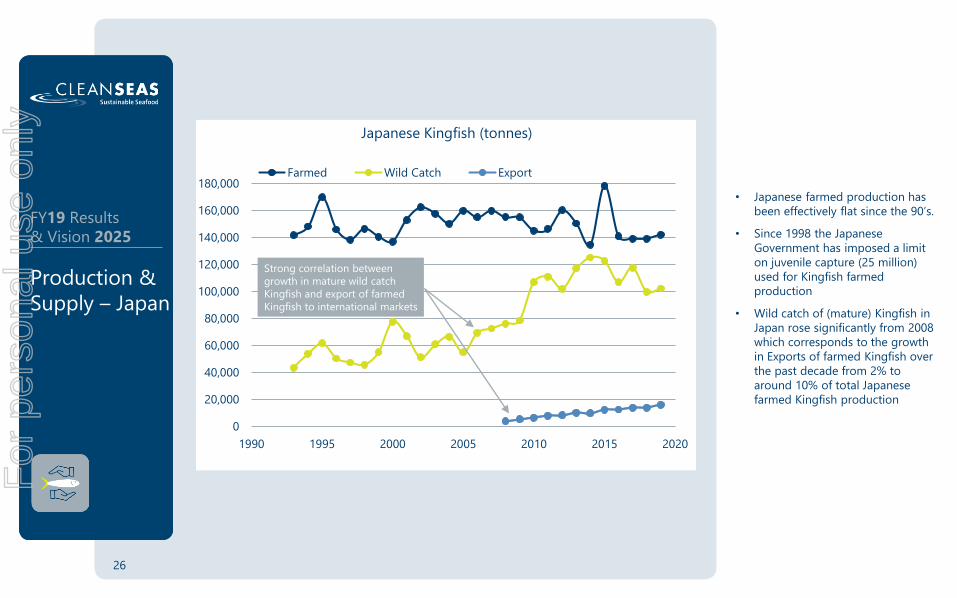
• Japanese farmed production has
been effectively flat since the 90’s.
• Since 1998 the Japanese
Government has imposed a limit
on juvenile capture (25 million)
used for Kingfish farmed
production
• Wild catch of (mature) Kingfish in
Japan rose significantly from 2008
which corresponds to the growth
in Exports of farmed Kingfish over
the past decade from 2% to
around 10% of total Japanese
farmed Kingfish production
Production &
Supply – Japan
0
20,000
40,000
60,000
80,000
100,000
120,000
140,000
160,000
180,000
1990 1995 2000 2005 2010 2015 2020
Japanese Kingfish (tonnes)
Farmed Wild Catch Export
Strong correlation between
growth in mature wild catch
Kingfish and export of farmed
Kingfish to international markets
26
FY19 Results
& Vision 2025
For
per
sona
l use
onl
y
Clean Seas
Competitive
Advantage &
Vision 2025
Strategic
Goals
FY19 Results
& Vision 2025
For
per
sona
l use
onl
y
Competitive
Advantage &
Opportunities
FY19 Results
& Vision 2025
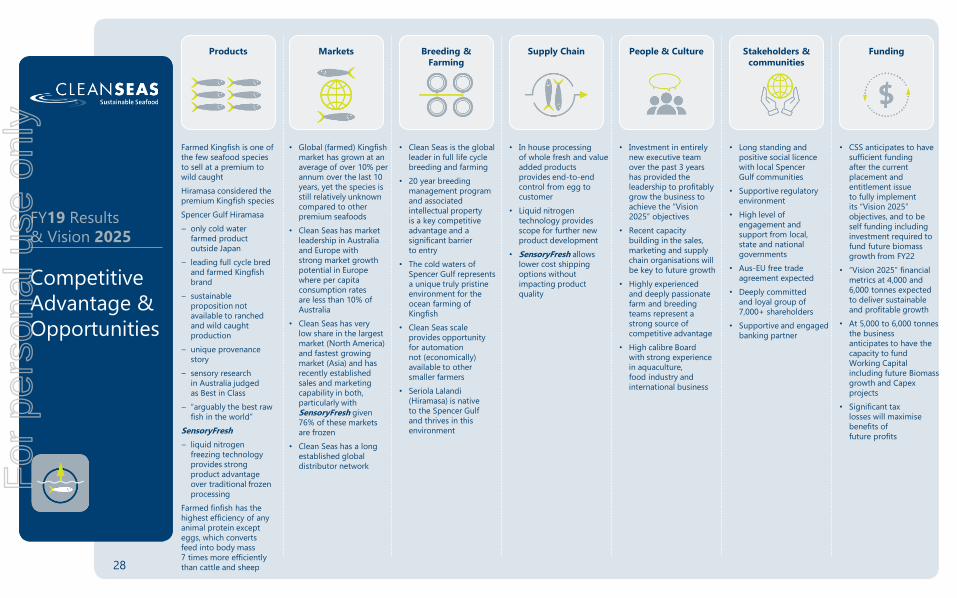
Products
Farmed Kingfish is one of
the few seafood species
to sell at a premium to
wild caught
Hiramasa considered the
premium Kingfish species
Spencer Gulf Hiramasa
– only cold water
farmed product
outside Japan
– leading full cycle bred
and farmed Kingfish
brand
– sustainable
proposition not
available to ranched
and wild caught
production
– unique provenance
story
– sensory research
in Australia judged
as Best in Class
– “arguably the best raw
fish in the world”
SensoryFresh
– liquid nitrogen
freezing technology
provides strong
product advantage
over traditional frozen
processing
Farmed finfish has the
highest efficiency of any
animal protein except
eggs, which converts
feed into body mass
7 times more efficiently
than cattle and sheep
Markets
• Global (farmed) Kingfish
market has grown at an
average of over 10% per
annum over the last 10
years, yet the species is
still relatively unknown
compared to other
premium seafoods
• Clean Seas has market
leadership in Australia
and Europe with
strong market growth
potential in Europe
where per capita
consumption rates
are less than 10% of
Australia
• Clean Seas has very
low share in the largest
market (North America)
and fastest growing
market (Asia) and has
recently established
sales and marketing
capability in both,
particularly with
SensoryFresh given
76% of these markets
are frozen
• Clean Seas has a long
established global
distributor network
Breeding & Farming
• Clean Seas is the global
leader in full life cycle
breeding and farming
• 20 year breeding
management program
and associated
intellectual property
is a key competitive
advantage and a
significant barrier
to entry
• The cold waters of
Spencer Gulf represents
a unique truly pristine
environment for the
ocean farming of
Kingfish
• Clean Seas scale
provides opportunity
for automation
not (economically)
available to other
smaller farmers
• Seriola Lalandi
(Hiramasa) is native
to the Spencer Gulf
and thrives in this
environment
Supply Chain
• In house processing
of whole fresh and value
added products
provides end-to-end
control from egg to
customer
• Liquid nitrogen
technology provides
scope for further new
product development
• SensoryFresh allows
lower cost shipping
options without
impacting product
quality
People & Culture
• Investment in entirely
new executive team
over the past 3 years
has provided the
leadership to profitably
grow the business to
achieve the “Vision
2025” objectives
• Recent capacity
building in the sales,
marketing and supply
chain organisations will
be key to future growth
• Highly experienced
and deeply passionate
farm and breeding
teams represent a
strong source of
competitive advantage
• High calibre Board
with strong experience
in aquaculture,
food industry and
international business
Stakeholders & communities
• Long standing and
positive social licence
with local Spencer
Gulf communities
• Supportive regulatory
environment
• High level of
engagement and
support from local,
state and national
governments
• Aus-EU free trade
agreement expected
• Deeply committed
and loyal group of
7,000+ shareholders
• Supportive and engaged
banking partner
Funding
• CSS anticipates to have
sufficient funding
after the current
placement and
entitlement issue
to fully implement
its “Vision 2025”
objectives, and to be
self funding including
investment required to
fund future biomass
growth from FY22
• “Vision 2025” financial
metrics at 4,000 and
6,000 tonnes expected
to deliver sustainable
and profitable growth
• At 5,000 to 6,000 tonnes
the business
anticipates to have the
capacity to fund
Working Capital
including future Biomass
growth and Capex
projects
• Significant tax
losses will maximise
benefits of
future profits
28
For
per
sona
l use
onl
y
Strategic
Objectives
FY19 Results
& Vision 2025
29
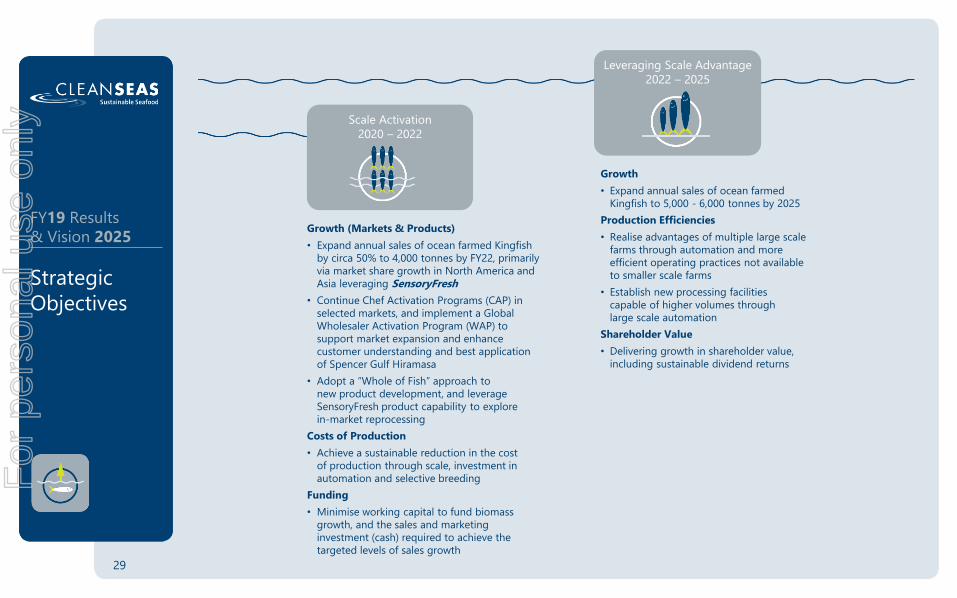
Leveraging Scale Advantage
2022 – 2025
Growth
• Expand annual sales of ocean farmed
Kingfish to 5,000 - 6,000 tonnes by 2025
Production Efficiencies
• Realise advantages of multiple large scale
farms through automation and more
efficient operating practices not available
to smaller scale farms
• Establish new processing facilities
capable of higher volumes through
large scale automation
Shareholder Value
• Delivering growth in shareholder value,
including sustainable dividend returns
Scale Activation
2020 – 2022
Growth (Markets & Products)
• Expand annual sales of ocean farmed Kingfish
by circa 50% to 4,000 tonnes by FY22, primarily
via market share growth in North America and
Asia leveraging SensoryFresh
• Continue Chef Activation Programs (CAP) in
selected markets, and implement a Global
Wholesaler Activation Program (WAP) to
support market expansion and enhance
customer understanding and best application
of Spencer Gulf Hiramasa
• Adopt a “Whole of Fish” approach to
new product development, and leverage
SensoryFresh product capability to explore
in-market reprocessing
Costs of Production
• Achieve a sustainable reduction in the cost
of production through scale, investment in
automation and selective breeding
Funding
• Minimise working capital to fund biomass
growth, and the sales and marketing
investment (cash) required to achieve the
targeted levels of sales growth
For
per
sona
l use
onl
y
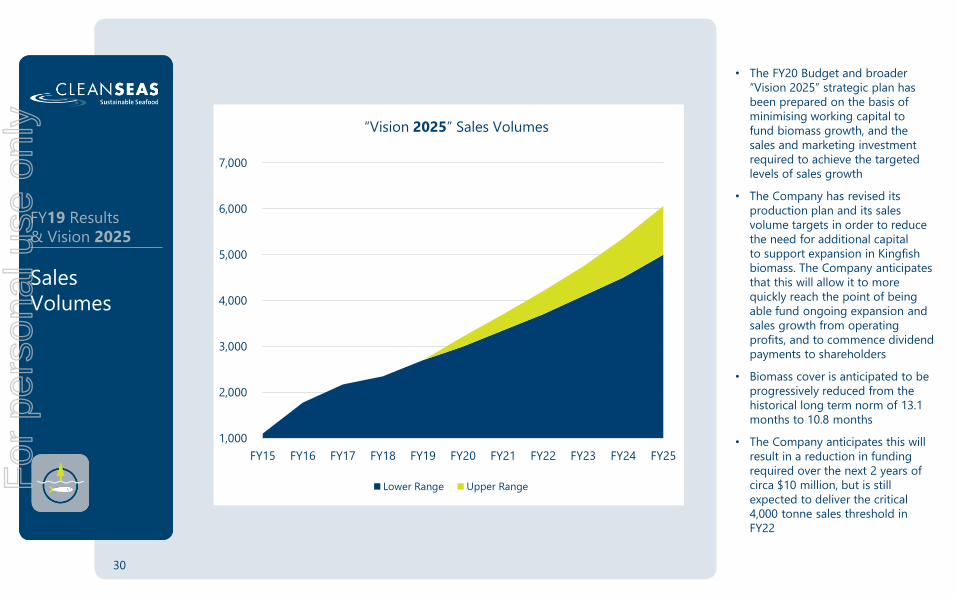
• The FY20 Budget and broader
“Vision 2025” strategic plan has
been prepared on the basis of
minimising working capital to
fund biomass growth, and the
sales and marketing investment
required to achieve the targeted
levels of sales growth
• The Company has revised its
production plan and its sales
volume targets in order to reduce
the need for additional capital
to support expansion in Kingfish
biomass. The Company anticipates
that this will allow it to more
quickly reach the point of being
able fund ongoing expansion and
sales growth from operating
profits, and to commence dividend
payments to shareholders
• Biomass cover is anticipated to be
progressively reduced from the
historical long term norm of 13.1
months to 10.8 months
• The Company anticipates this will
result in a reduction in funding
required over the next 2 years of
circa $10 million, but is still
expected to deliver the critical
4,000 tonne sales threshold in
FY22
30
Sales
Volumes
1,000
2,000
3,000
4,000
5,000
6,000
7,000
FY15 FY16 FY17 FY18 FY19 FY20 FY21 FY22 FY23 FY24 FY25
“Vision 2025” Sales Volumes
Lower Range Upper Range
FY19 Results
& Vision 2025
For
per
sona
l use
onl
y
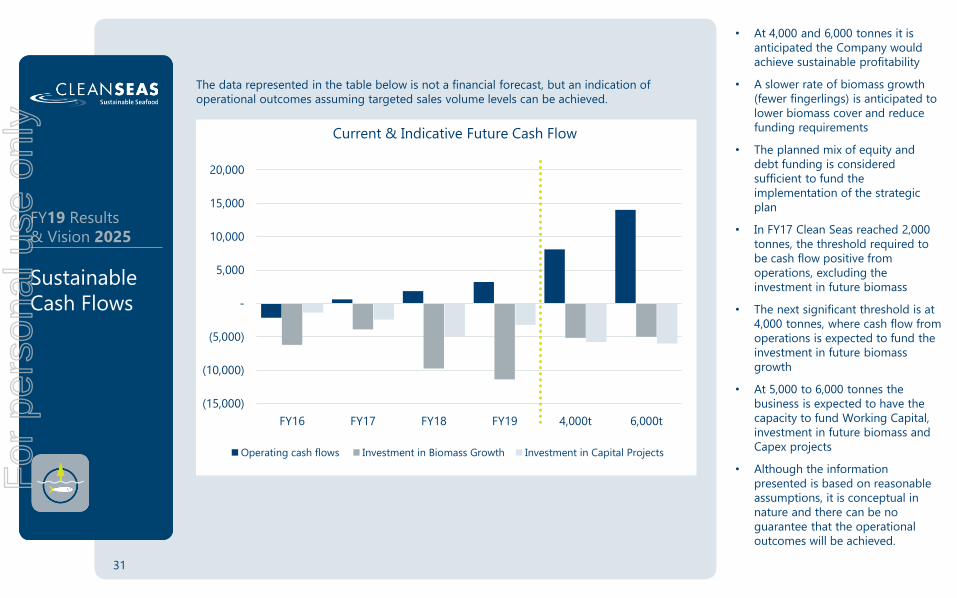
• At 4,000 and 6,000 tonnes it is
anticipated the Company would
achieve sustainable profitability
• A slower rate of biomass growth
(fewer fingerlings) is anticipated to
lower biomass cover and reduce
funding requirements
• The planned mix of equity and
debt funding is considered
sufficient to fund the
implementation of the strategic
plan
• In FY17 Clean Seas reached 2,000
tonnes, the threshold required to
be cash flow positive from
operations, excluding the
investment in future biomass
• The next significant threshold is at
4,000 tonnes, where cash flow from
operations is expected to fund the
investment in future biomass
growth
• At 5,000 to 6,000 tonnes the
business is expected to have the
capacity to fund Working Capital,
investment in future biomass and
Capex projects
• Although the information
presented is based on reasonable
assumptions, it is conceptual in
nature and there can be no
guarantee that the operational
outcomes will be achieved.
Sustainable
Cash Flows
(15,000)
(10,000)
(5,000)
-
5,000
10,000
15,000
20,000
FY16 FY17 FY18 FY19 4,000t 6,000t
Current & Indicative Future Cash Flow
Operating cash flows Investment in Biomass Growth Investment in Capital Projects
31
FY19 Results
& Vision 2025
The data represented in the table below is not a financial forecast, but an indication of
operational outcomes assuming targeted sales volume levels can be achieved.
For
per
sona
l use
onl
y
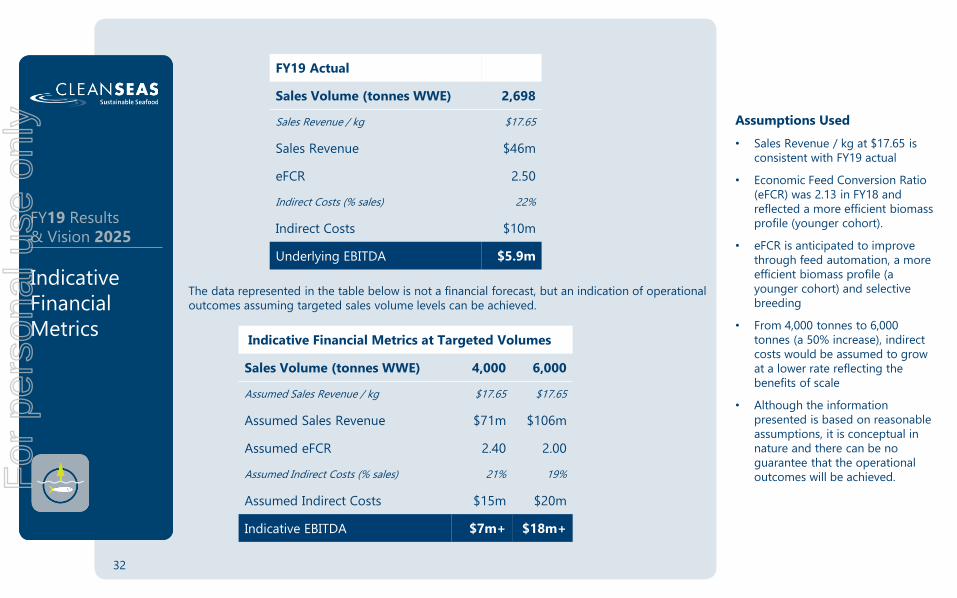
Assumptions Used
• Sales Revenue / kg at $17.65 is
consistent with FY19 actual
• Economic Feed Conversion Ratio
(eFCR) was 2.13 in FY18 and
reflected a more efficient biomass
profile (younger cohort).
• eFCR is anticipated to improve
through feed automation, a more
efficient biomass profile (a
younger cohort) and selective
breeding
• From 4,000 tonnes to 6,000
tonnes (a 50% increase), indirect
costs would be assumed to grow
at a lower rate reflecting the
benefits of scale
• Although the information
presented is based on reasonable
assumptions, it is conceptual in
nature and there can be no
guarantee that the operational
outcomes will be achieved.
32
Indicative
Financial
Metrics
The data represented in the table below is not a financial forecast, but an indication of operational
outcomes assuming targeted sales volume levels can be achieved.
FY19 Results
& Vision 2025
FY19 Actual
Sales Volume (tonnes WWE) 2,698
Sales Revenue / kg $17.65
Sales Revenue $46m
eFCR 2.50
Indirect Costs (% sales) 22%
Indirect Costs $10m
Underlying EBITDA $5.9m
Indicative Financial Metrics at Targeted Volumes
Sales Volume (tonnes WWE) 4,000 6,000
Assumed Sales Revenue / kg $17.65 $17.65
Assumed Sales Revenue $71m $106m
Assumed eFCR 2.40 2.00
Assumed Indirect Costs (% sales) 21% 19%
Assumed Indirect Costs $15m $20m
Indicative EBITDA $7m+ $18m+
For
per
sona
l use
onl
y
• In August 2019, Clean Seas
completed a $6.6m equity
placement to major shareholder
Bonafide, and announced a
proposed convertible note
entitlement offer to raise up
to a further $15.3m
• The convertible notes are
proposed to be offered on a
pro-rata basis to all qualifying
shareholders, with key terms
including interest payable at an
annual rate of 8%, an 8%
conversion discount and three-
year term to maturity
• By offering convertible notes
to existing shareholders,
Clean Seas is seeking to provide
a return to its loyal shareholder
base, and is less-dilutive than
alternative options
• On completion of the
convertible note issue, the
Company expects to be able to
fund and implement its “Vision
2025” Strategic Plan
• Full details of the entitlement
offer will be disclosed via a
prospectus, targeting
lodgement in September 2019
with offer closure expected by
the end of October 2019
33
Sources of
Funding
FY19 Results
& Vision 2025
For
per
sona
l use
onl
y
34
• Strong sales momentum taking an outstanding premium seafood species to the world,
fuelled by the Spencer Gulf’s unique and largely untold provenance story
• Profitable sales and positive underlying EBITDA with strong investment in future
growth
• Positive cash flow from Operations (excluding investment in Biomass growth)
• Clear pathway to sustainable profitability and cash flows
• Attractive supply and demand drivers give Clean Seas strong pricing in a market with
relatively high barriers to entry
• Huge global growth potential for Spencer Gulf Hiramasa Kingfish, with encouraging
progress in new markets (North America and Asia), material scope for improvements in
per capita consumption in Europe, North America and Asia, and attractive new products
enabled by innovative technology
• Significant scope to reduce cost of production and increase yields through
automation and selective breeding
• Untapped capacity to triple current farm production volumes
• Positive social license with engaged and supportive local stakeholders
• A sustainable and eco-friendly growth opportunity accredited by the world’s leading
aquaculture certifiers
• Outstanding product – “Arguably the best raw fish in the world”
Investment
Highlights
FY19 Results
& Vision 2025
For
per
sona
l use
onl
y
Certain statements contained in this presentation, including information as to the future financial or operating performance of
Clean Seas Seafood Limited (“CSS”), are forward looking statements.
Such forward looking statements may include, among other things, statements regarding targets, estimates and assumptions in
respect of CSS’ operations, production and prices, operating costs and results, capital expenditures, and are or may be based on
assumptions and estimates related to future technical, economic, market, political, social and other conditions; are necessarily
based upon a number of estimates and assumptions that, while considered reasonable by CSS, are inherently subject to
significant technical, business, economic, competitive, political and social uncertainties and contingencies; and involve known
and unknown risks and uncertainties that could cause actual events or results to differ materially from estimated or anticipated
events or results reflected in such forward looking statements.
CSS disclaims any intent or obligation to update publicly any forward looking statements, whether as a result of new
information, future events or results or otherwise. The words “believe”, “expect”, “anticipate”, “indicate”, “contemplate”, “target”,
“plan”, “intends”, “continue”, “budget”, “estimate”, “may”, “will”, “schedule” and similar expressions identify forward looking
statements.
All forward looking statements made in this presentation are qualified by the foregoing cautionary statements. Investors are
cautioned that forward looking statements are not guarantees of future performance and accordingly investors are cautioned
not to put undue reliance on forward looking statements due to the inherent uncertainty therein.
Contact &
Disclaimer
FY19 Results
& Vision 2025
35
CO N TAC T: D a v i d J H e a d | M a n a g i n g D i r e c t o r a n d C E Od a v i d . h e a d @ c l e a n s e a s . c o m . a u+ 6 1 ( 0 ) 4 1 9 2 2 1 1 9 6
R ob G r a t t o n | C h i e f F i n a n c i a l O f f i c e rr o b . g r a t t o n @ c l e a n s e a s . c o m . a u+ 6 1 ( 0 ) 4 3 4 1 4 8 9 7 9
For
per
sona
l use
onl
y


![From: Kevin Lewis [mailto:Kevin.Lewis@asx.com.au] … Kevin Lewis [mailto:Kevin.Lewis@asx.com.au] Sent: Tuesday, 6 February 2018 11:55 AM To: Gary Morgan Cc: Rick Holliday-Smith; Dominic](https://img.pdfslide.net/doc/110x75/5b00a7c47f8b9ad85d8cead6/from-kevin-lewis-mailtokevinlewisasxcomau-kevin-lewis-mailtokevinlewisasxcomau.jpg)