Embed Size (px)
Citation preview
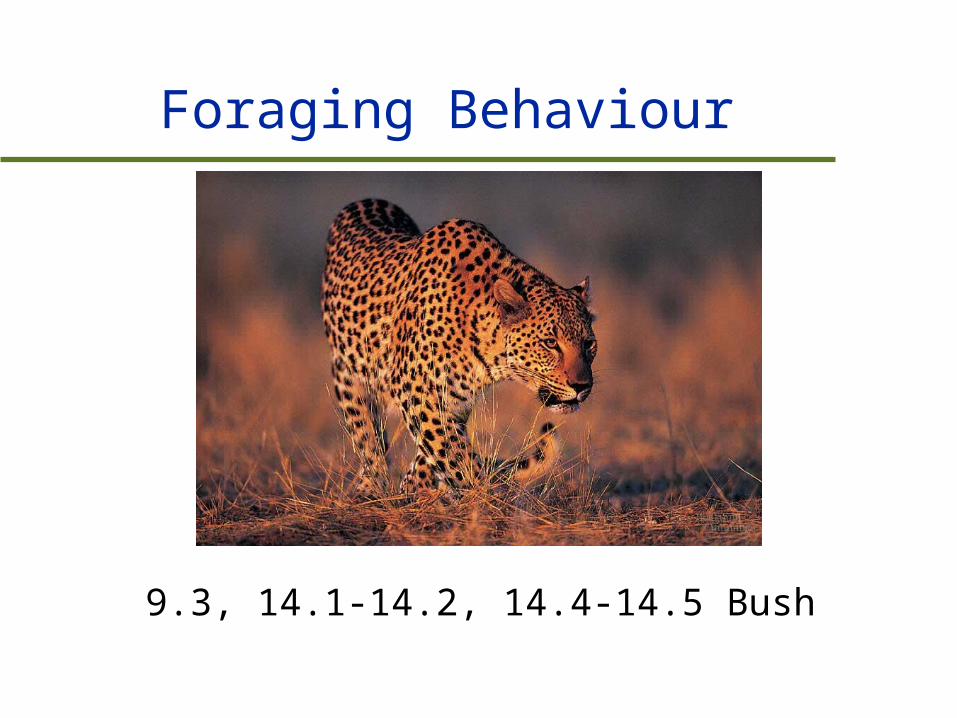
Foraging Behaviour
9.3, 14.1-14.2, 14.4-14.5 Bush
Outline
Optimal foraging models
The effect of prey and predator density
Human foraging and fisheries management
Outline
Optimal foraging models
The effect of prey and predator density
Human foraging and fisheries management
Foraging
One major activity of animals is foraging for nutrients and energy
What to eat, when and how?– food type– size/quality of prey items
energy/nutrient content– handling time– search time– presence of toxins
location of prey: mortality risk?
Maximizing energy gains
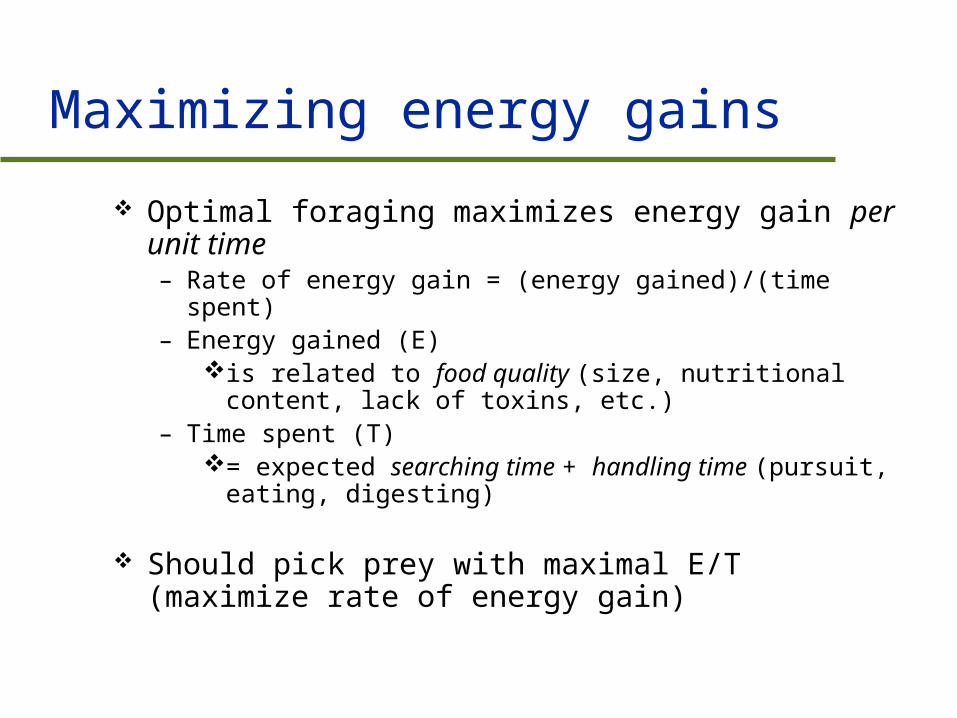
Optimal foraging maximizes energy gain per unit time– Rate of energy gain = (energy gained)/(time spent)– Energy gained (E)
is related to food quality (size, nutritional content, lack of toxins, etc.)
– Time spent (T) = expected searching time + handling time (pursuit,
eating, digesting)
Should pick prey with maximal E/T (maximize rate of energy gain)
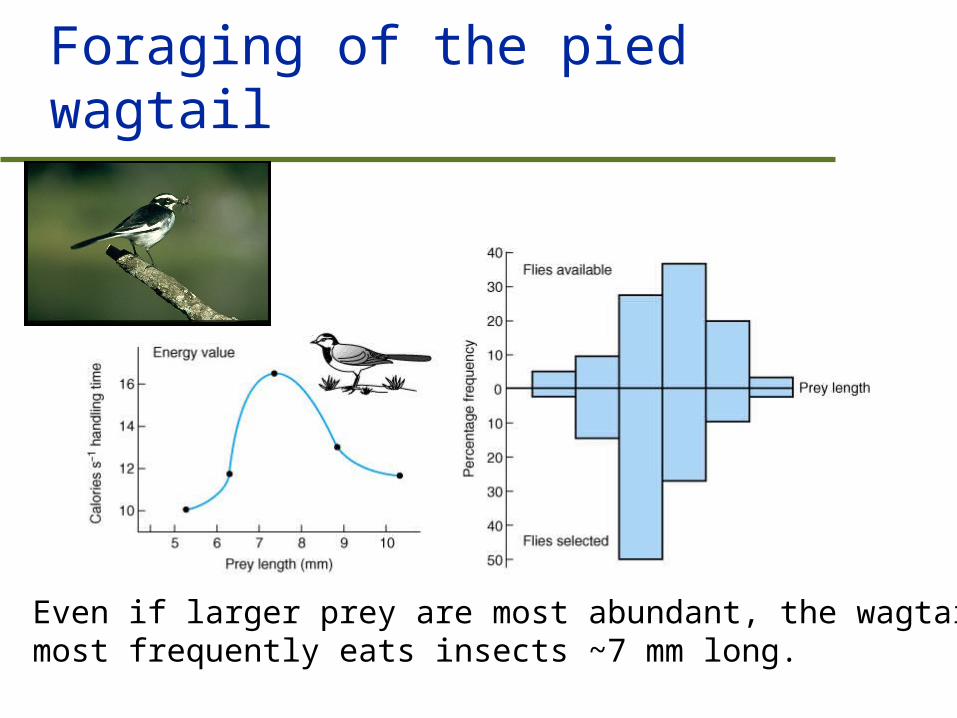
Foraging of the pied wagtail
Even if larger prey are most abundant, the wagtailmost frequently eats insects ~7 mm long.
Generalizations in optimal foraging
Searchers:– those that spend more energy on finding prey
then on overcoming them, should be generalists– e.g. insectivorous birds
Handlers:– those that spend more energy on overcoming
their prey, should be specialists as they will need specific adaptations for handling prey
– e.g. wolves, lions
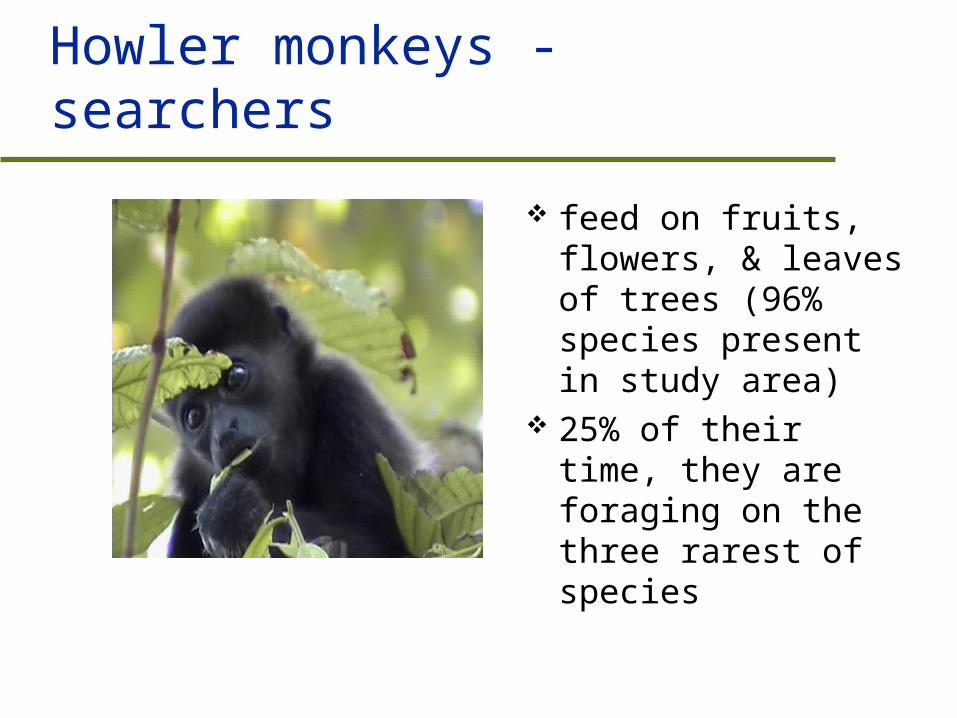
Howler monkeys - searchers
feed on fruits, flowers, & leaves of trees (96% species present in study area)
25% of their time, they are foraging on the three rarest of species
Outline
Optimal foraging models
The effect of prey and predator density
Human foraging and fisheries management
The effects of prey density
Expected searching time is proportional to 1/prey density
Choice should depend on handling time, energy gain, and search time
Should be less choosy when prey are scarce:– widen diet breadth
Organisms should ignore poor food no matter how abundant it is and start eating it when preferred items get sufficiently rare

Foraging of the Bluegill sunfish
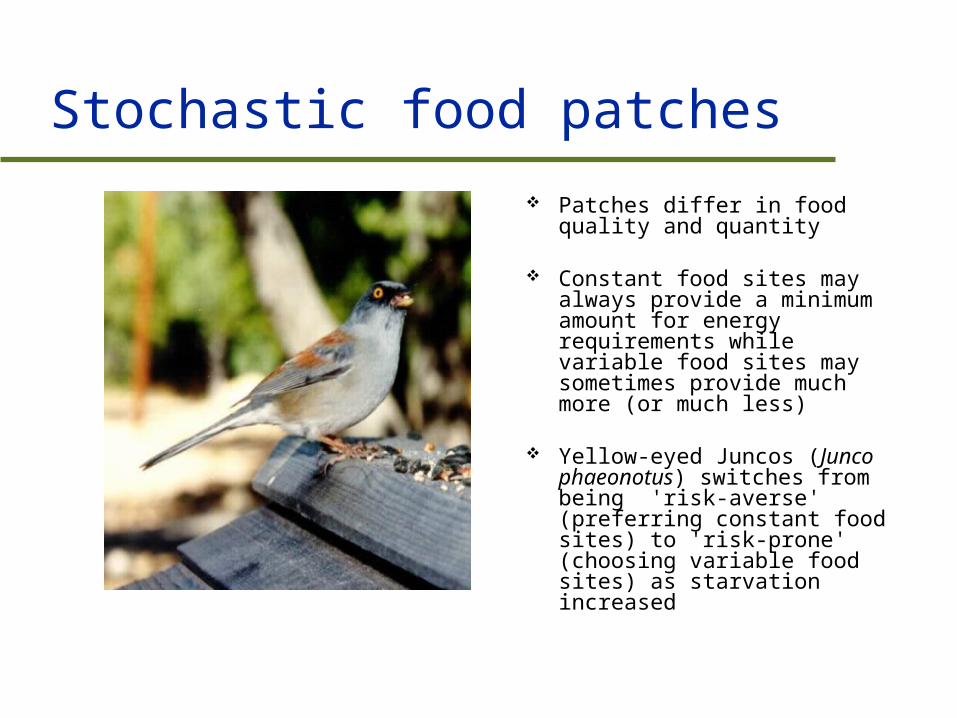
Stochastic food patches
Patches differ in food quality and quantity
Constant food sites may always provide a minimum amount for energy requirements while variable food sites may sometimes provide much more (or much less)
Yellow-eyed Juncos (Junco phaeonotus) switches from being 'risk-averse' (preferring constant food sites) to 'risk-prone' (choosing variable food sites) as starvation increased
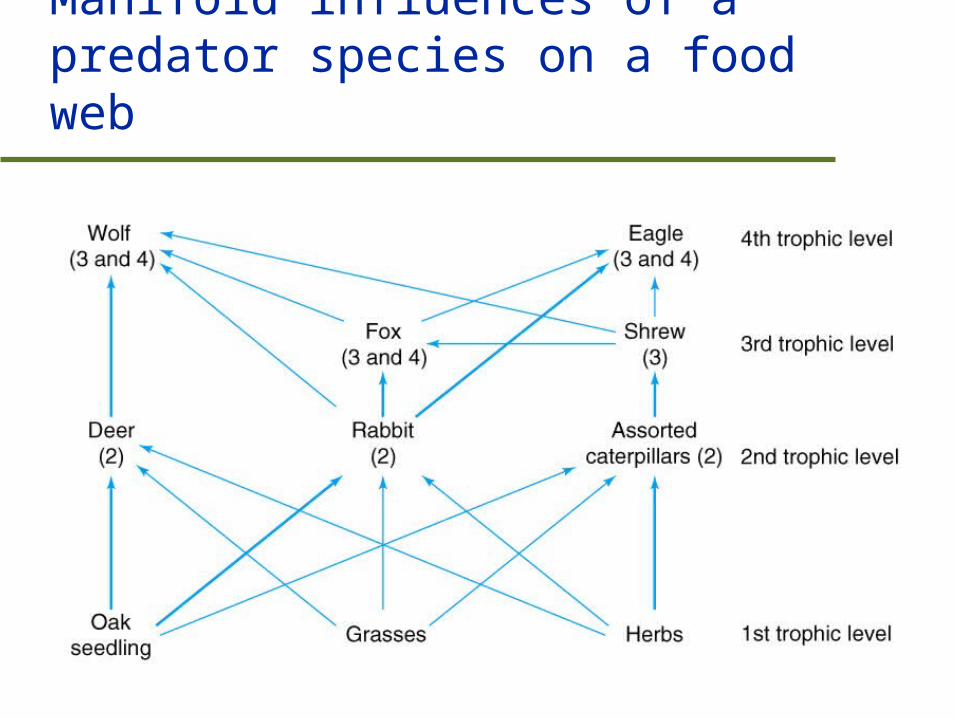
Manifold influences of a predator species on a food web
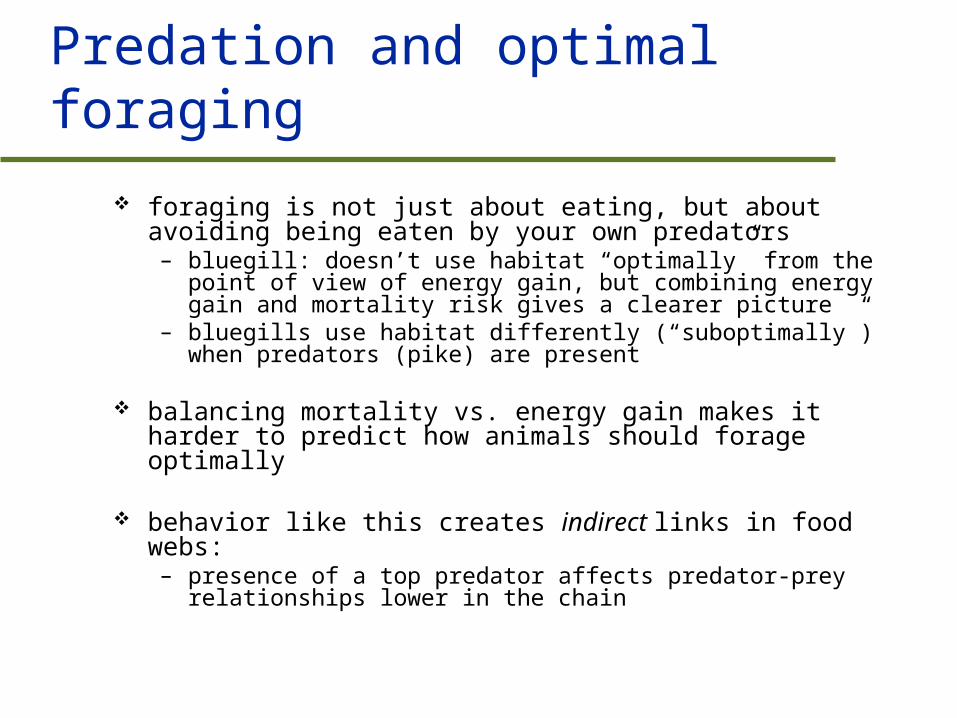
Predation and optimal foraging
foraging is not just about eating, but about avoiding being eaten by your own predators– bluegill: doesn’t use habitat “optimally” from the point of view of
energy gain, but combining energy gain and mortality risk gives a clearer picture
– bluegills use habitat differently (“suboptimally”) when predators (pike) are present
balancing mortality vs. energy gain makes it harder to predict how animals should forage optimally
behavior like this creates indirect links in food webs:– presence of a top predator affects predator-prey relationships lower
in the chain

Foraging of the Bluegill sunfish
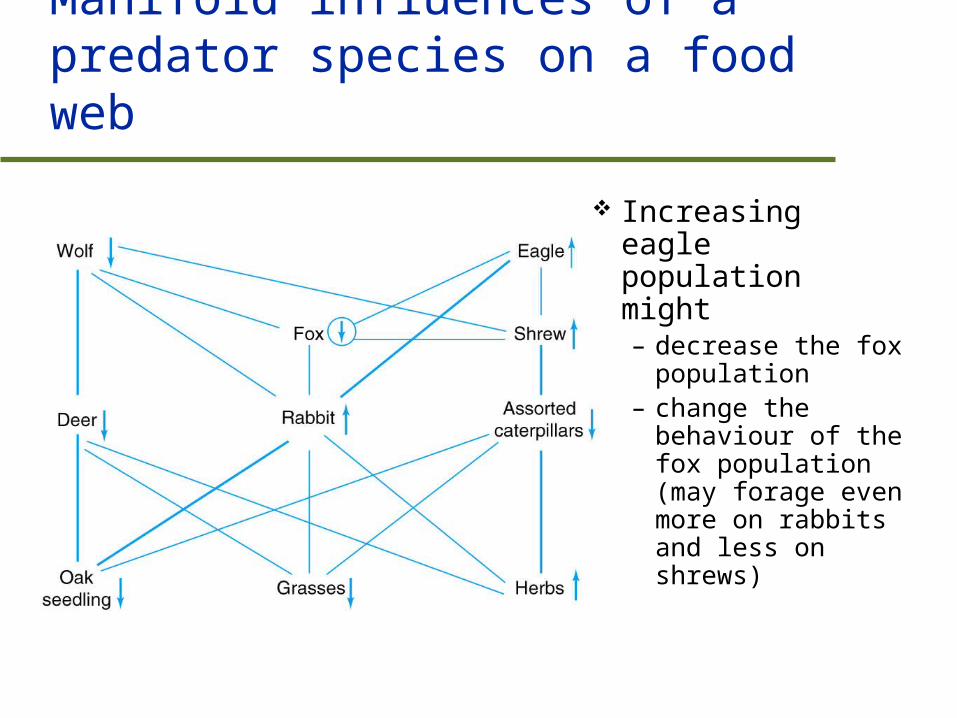
Manifold influences of a predator species on a food web
Increasing eagle population might – decrease the
fox population – change the
behaviour of the fox population (may forage even more on rabbits and less on shrews)
Outline
Optimal foraging models
The effect of prey and predator density
Human foraging and fisheries management
Human foraging
We are a top predator in most communities and so our effects can trickle down the food chain and affect many lower trophic levels
Our foraging of fish fits well into optimal foraging models– We are very choosy with the seafood we like to
eat– Switch our preferences only when our favorites
are nearly extinct
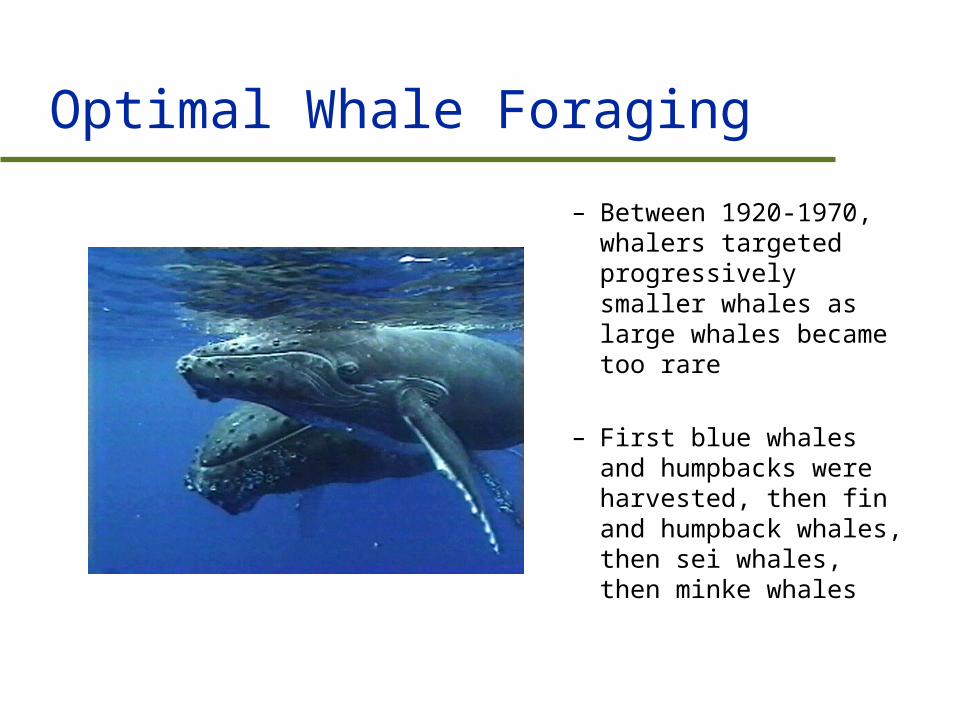
Optimal Whale Foraging
– Between 1920-1970, whalers targeted progressively smaller whales as large whales became too rare
– First blue whales and humpbacks were harvested, then fin and humpback whales, then sei whales, then minke whales
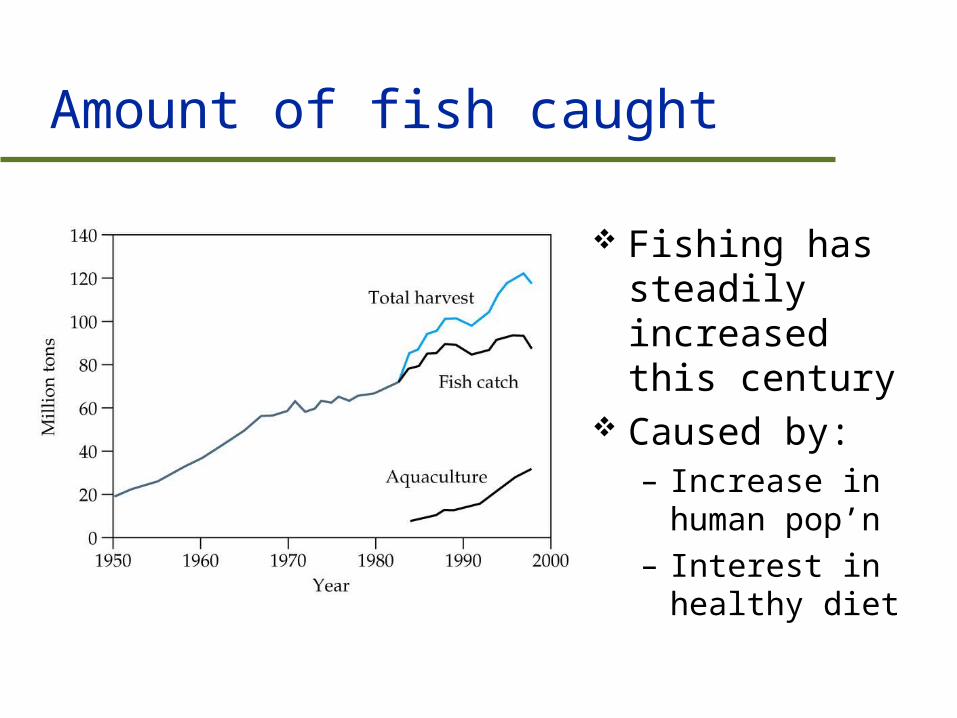
Amount of fish caught
Fishing has steadily increased this century
Caused by:– Increase in
human pop’n– Interest in healthy
diet
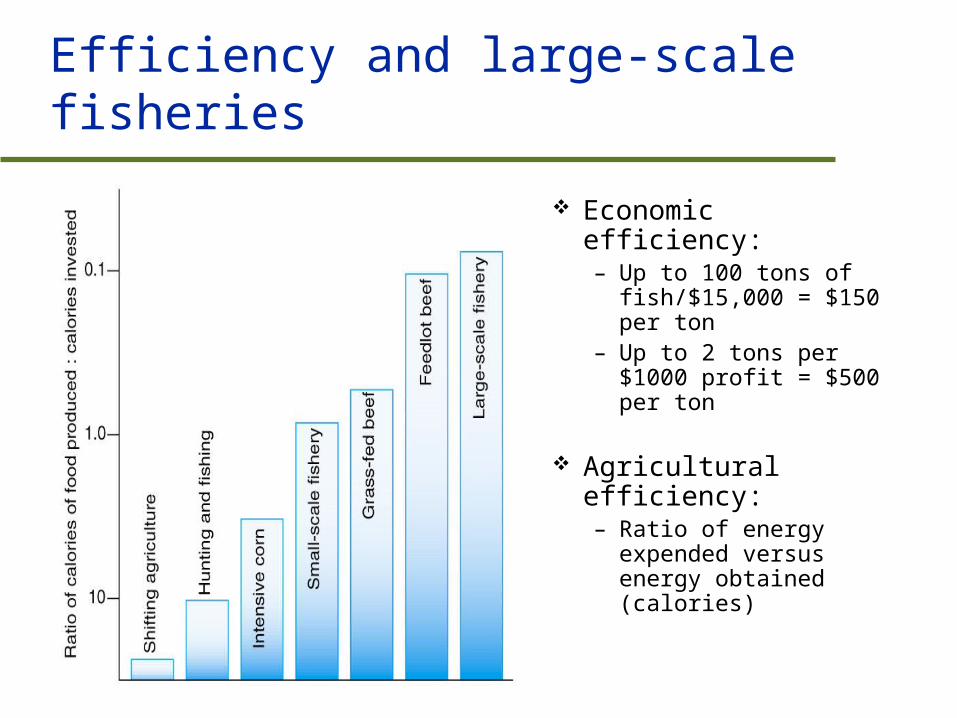
Efficiency and large-scale fisheries
Economic efficiency:– Up to 100 tons of
fish/$15,000 = $150 per ton
– Up to 2 tons per $1000 profit = $500 per ton
Agricultural efficiency:– Ratio of energy
expended versus energy obtained (calories)
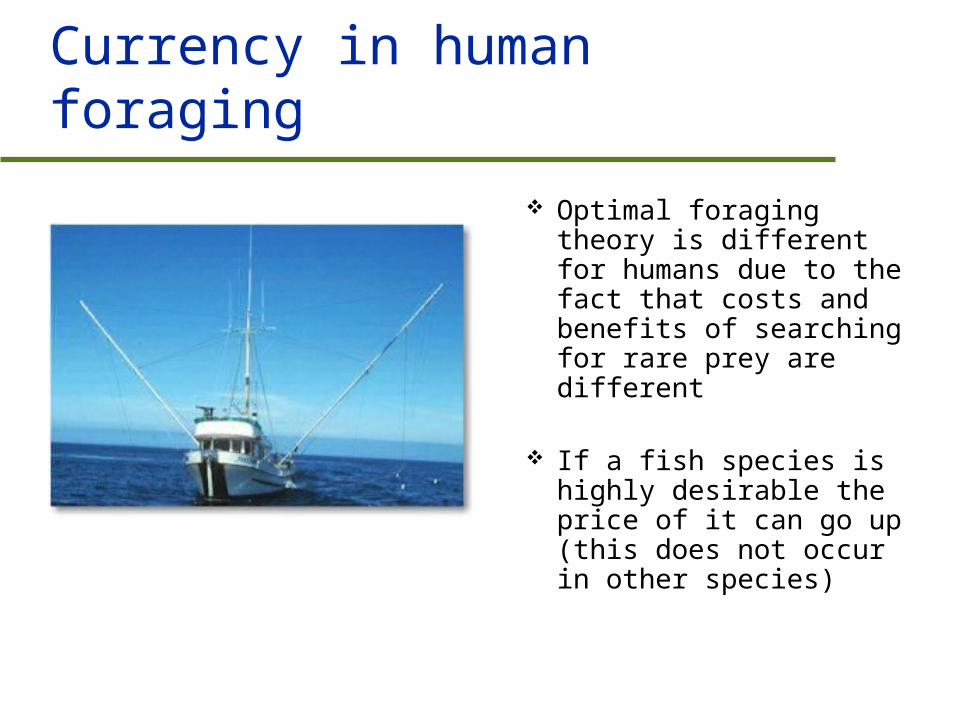
Currency in human foraging
Optimal foraging theory is different for humans due to the fact that costs and benefits of searching for rare prey are different
If a fish species is highly desirable the price of it can go up (this does not occur in other species)
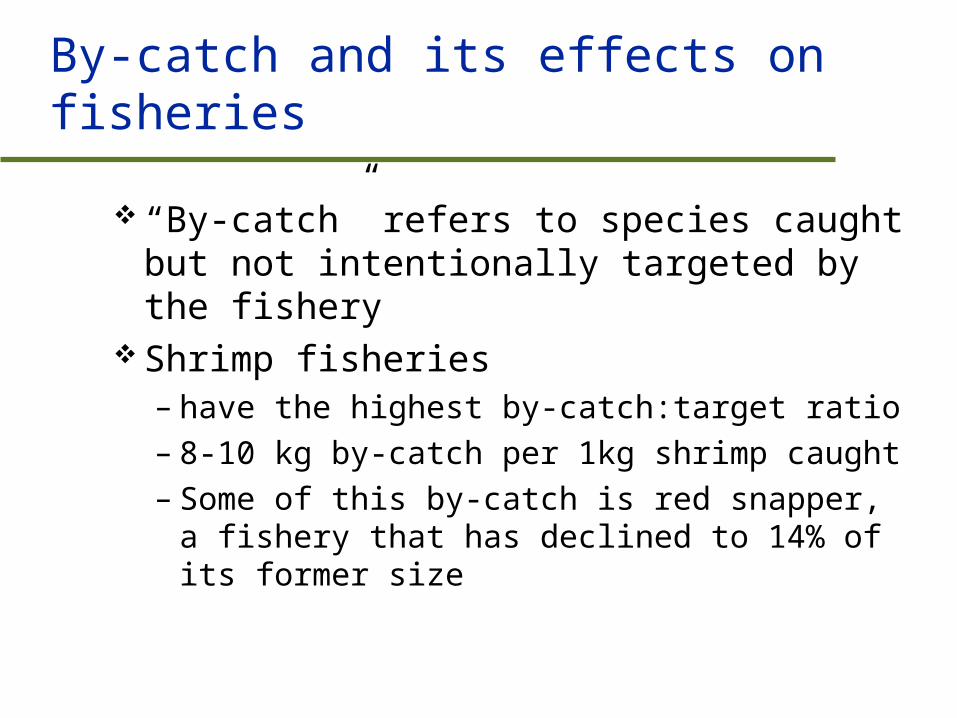
By-catch and its effects on fisheries
“By-catch” refers to species caught but not intentionally targeted by the fishery
Shrimp fisheries – have the highest by-catch:target ratio – 8-10 kg by-catch per 1kg shrimp caught– Some of this by-catch is red snapper, a
fishery that has declined to 14% of its former size
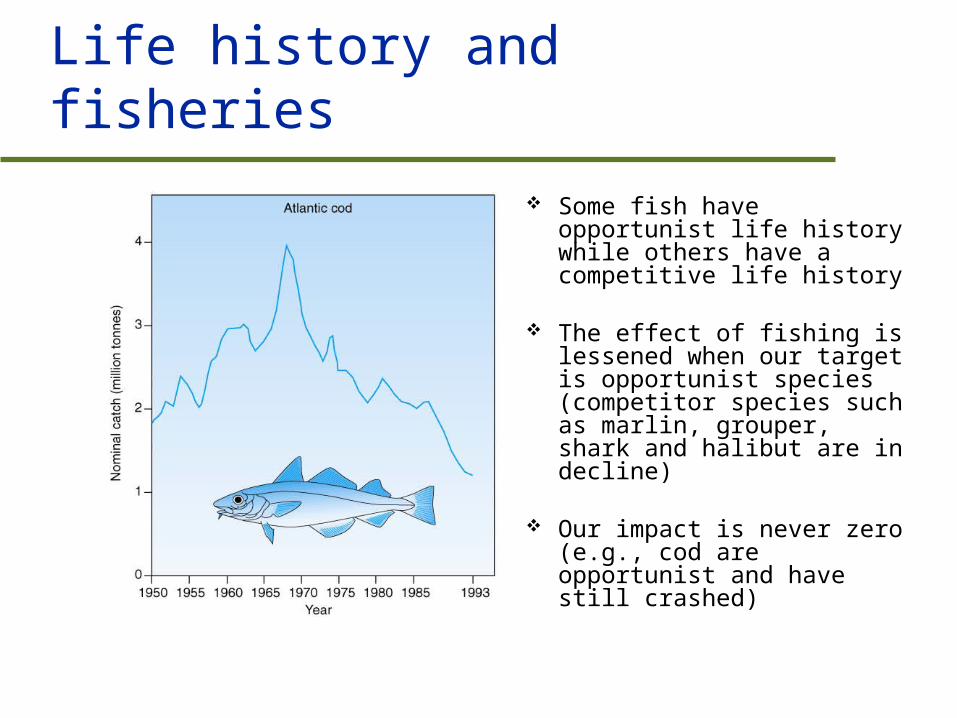
Life history and fisheries
Some fish have opportunist life history while others have a competitive life history
The effect of fishing is lessened when our target is opportunist species (competitor species such as marlin, grouper, shark and halibut are in decline)
Our impact is never zero (e.g., cod are opportunist and have still crashed)
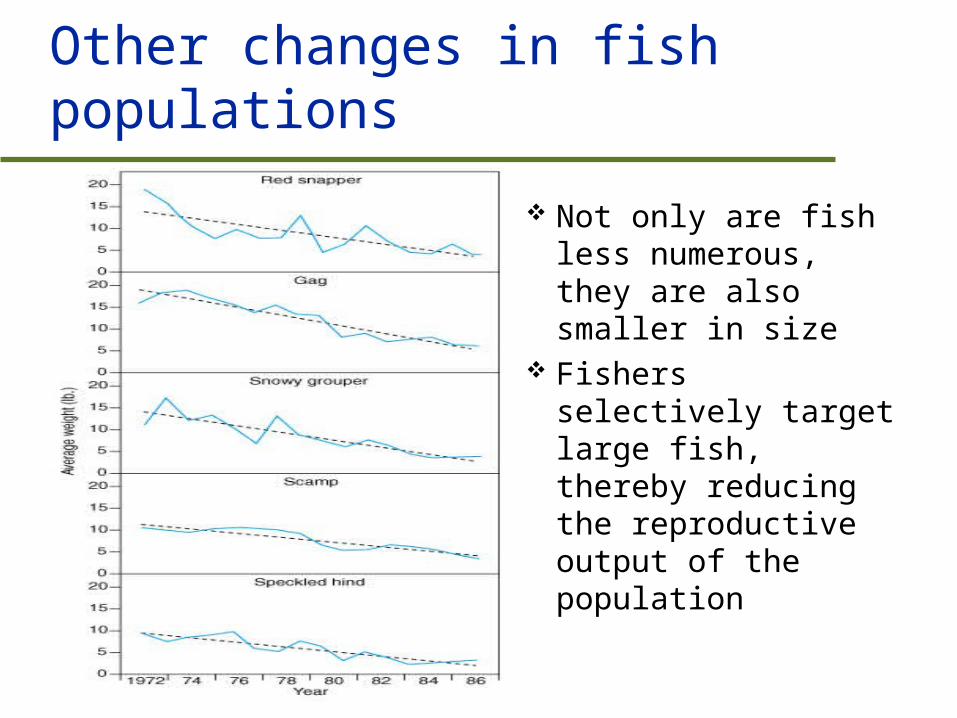
Other changes in fish populations
Not only are fish less numerous, they are also smaller in size
Fishers selectively target large fish, thereby reducing the reproductive output of the population
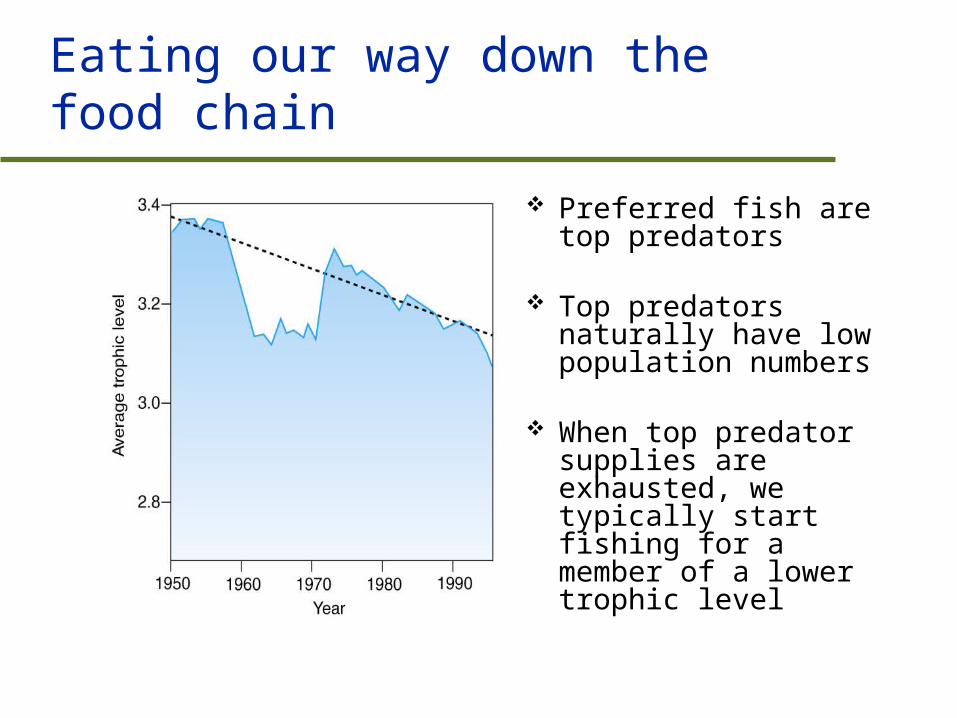
Eating our way down the food chain
Preferred fish are top predators
Top predators naturally have low population numbers
When top predator supplies are exhausted, we typically start fishing for a member of a lower trophic level
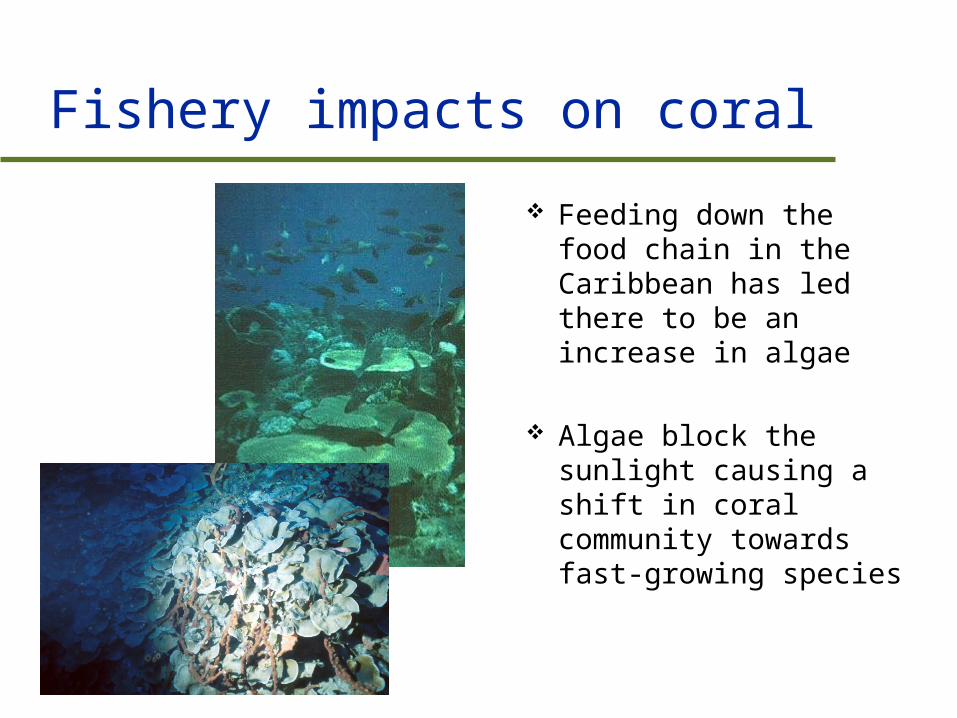
Fishery impacts on coral
Feeding down the food chain in the Caribbean has led there to be an increase in algae
Algae block the sunlight causing a shift in coral community towards fast-growing species
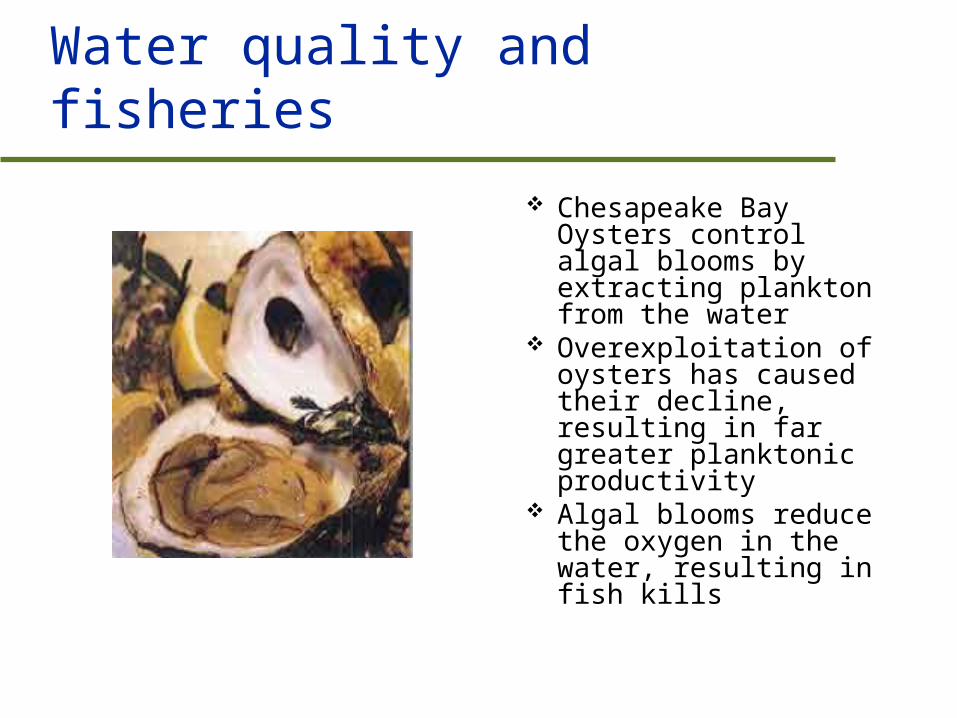
Water quality and fisheries
Chesapeake Bay Oysters control algal blooms by extracting plankton from the water
Overexploitation of oysters has caused their decline, resulting in far greater planktonic productivity
Algal blooms reduce the oxygen in the water, resulting in fish kills
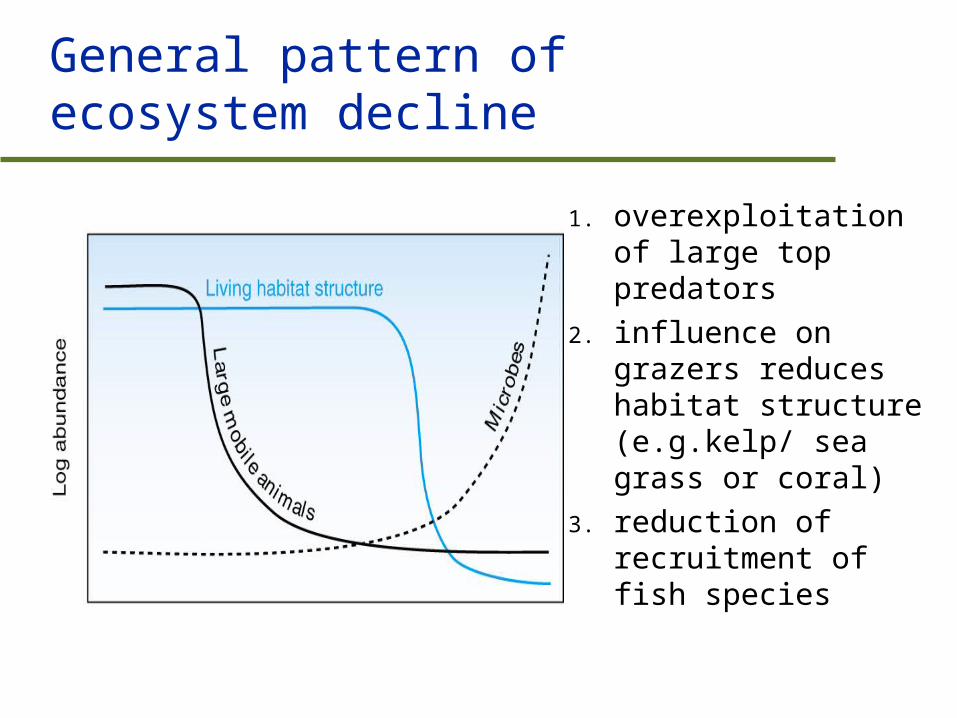
General pattern of ecosystem decline
1. overexploitation of large top predators
2. influence on grazers reduces habitat structure (e.g.kelp/ sea grass or coral)
3. reduction of recruitment of fish species
Summary
Optimal foraging models indicate that species must forage to maximize energy gain and minimize time spent
Density of both lower and higher trophic levels alter the optimal foraging dynamics of a species
Human beings are optimally foraging on fish species in the world and are threatening their existence

Review
Next lecture – Film: “Why sex?” Midterm is coming up! – Feb. 28th 6:30-
8:30 PM, Rooms ST140 & ST 141 Review questions are on the web! Readings summary:
– Chapters 1-4, 6-7, 9.3, 14.1-14.2,14.4-14.5, 17, 22.4-22.6
I am available for questions/tutorials!