Embed Size (px)
Citation preview
IOSR Journal Of Humanities And Social Science (IOSR-JHSS)
Volume 19, Issue 11, Ver. I (Nov. 2014), PP 22-30 e-ISSN: 2279-0837, p-ISSN: 2279-0845.
www.iosrjournals.org
www.iosrjournals.org 22 | Page
Forecasting the Demand for Medical Tourism in India
Anu Rai1, Premangshu Chakrabarty
2, Ashis Sarkar
3
1(Research Scholar, University of Kalyani, Nadia, West Bengal, India) 2(Associate Professor, Department of Geography, Vishwa Bharti University, Shantiniketan, West Bengal, India)
3(Professor, Department of Geography, Chandernagore College, Chandannagar, West Bengal, India)
Abstract: The purpose of this study is to predict as precisely as possible the medical tourism demand in India.
As tourist arrivals is the most frequently used measure of tourism demand, the present study considers FTAs and
their purpose of visit to India as a measure of inbound tourist to seek medical care. The medical tourism
demand and its potential market till 2015 are identified based on available appropriate model as suited to the
nature of data specific to individual country.
Keywords: Forecast, Opportunity, Medical Tourist, Tourist Arrivals.
I. Introduction
An amalgamation of two distinct service sector ‘healthcare’ and ‘tourism’ with niche service features,
medical tourism industry is one of the fastest growing service sectors of 21st century. The sector is growing
exponentially and has emerged as a major force for the growth of service exports worldwide. With the
availability of high quality healthcare services at affordable rate; increased role of information and communication channels; wider range of healthcare services from traditional to modern one, India is one of the
major players in this multi-billion industry. In fact India’s effort to promote medical tourism took off in the late
2002 after the Mckinsey – CII (2002) outlined immense potential of this sector. The following efforts were
made:
to modernize and expand airports in the country and to improve road connectivity and other
infrastructural facilities,
to promote many hospitals as centre of excellence in its tourism brochure,
to ease the medical tourist arrivals ‘M’ and ‘MX’ visa is introduced,
to avail tax concessions, medical tourism is declared as service sector,
National Accreditation Board for Hospitals established to promote quality care of healthcare
institutions,
at the state level Kerala, Karnataka, Maharashtra and Gujarat have made many concerned efforts to
promote healthcare tourism
As a result of such measures, the total FTAs in India of 6.57 million, 2.6 % were for medical treatments
in 2012. Its foreign exchange earnings from medical tourism are estimated to be around US $ 1.8 billion in 2010
(Shanmugam, 2013) [1]. In fact Medical Tourism Climate Survey Report 2014 conducted by IMTEC states that
India is second largest country after Thailand in accommodating foreign patients (IMTJ, 2014) [2]. Since 2000’s
the number of such travellers has been increasing by at least 25% every year. This situation shows that medical
tourism in India is passing through a process of dynamic change. The market has been growing rapidly and is
playing an increasingly important role in international tourism trade and trade relations. The forecasting of
tourism demand and mapping of the potential market is therefore an essential prerequisite for planners and
decision – makers that aims at cost efficient investments in the planning of capacity expansion and long term
decision making related to investments (Huang, 2012) [3]. In lieu of this the present study will try to project the number of medical tourist arrivals from various country of nationality till 2015 as precisely as possible based on
available models as suited to the nature of data specific to individual country. Since the data on the number of
medical tourist arrivals and their country of nationality is not readily available, this report will significantly help
decision makers for long term decision making for sustainability of medical tourism industry in India.
II. Database and Methodology
Tourism demand is usually regarded as a measure of visitors’ use of goods or services. The objective of
tourism demand forecasting is to predict the most probable level of demand that is likely to occur in the light of
known circumstances. Among many measures including variety of units like national currency, nights, days,
distances travelled, passengers seats occupied and accommodation facility used, tourist arrivals is the most frequently used measure of tourism demand (Fretchling, 2001) [4]. The present study considers Foreign Tourist
Arrivals (FTAs) and their purpose of visit as a measure inbound medical tourism demand forecasting for India.
Forecasting the Demand for Medical Tourism in India
www.iosrjournals.org 23 | Page
The number of quarterly and annual FTAs from different countries to India cover the period of first quarter of
2003 to last quarter of 2012 were used to predict total tourism demand up to 2015 as precisely as possible based
on available appropriate models as suited to the nature of data specific to individual country. Quarterly FTAs data are provided by Ministry of Tourism, Government of India [i]. Time Series Modeler of IBM - SPSS 19.0 is
used to build best – fit time series model to individual country covers following steps:
2.1. Building Models
The Time Series Modeler procedure creates models for time – series and produces forecast. It works on
an assumption that a model of the series that explained the past values may also predict whether and how much
the next few values will increase or decrease. It includes an Expert Modeler that automatically determines the
best model for each of your time series, thus eliminating the need to identify an appropriate model through trial
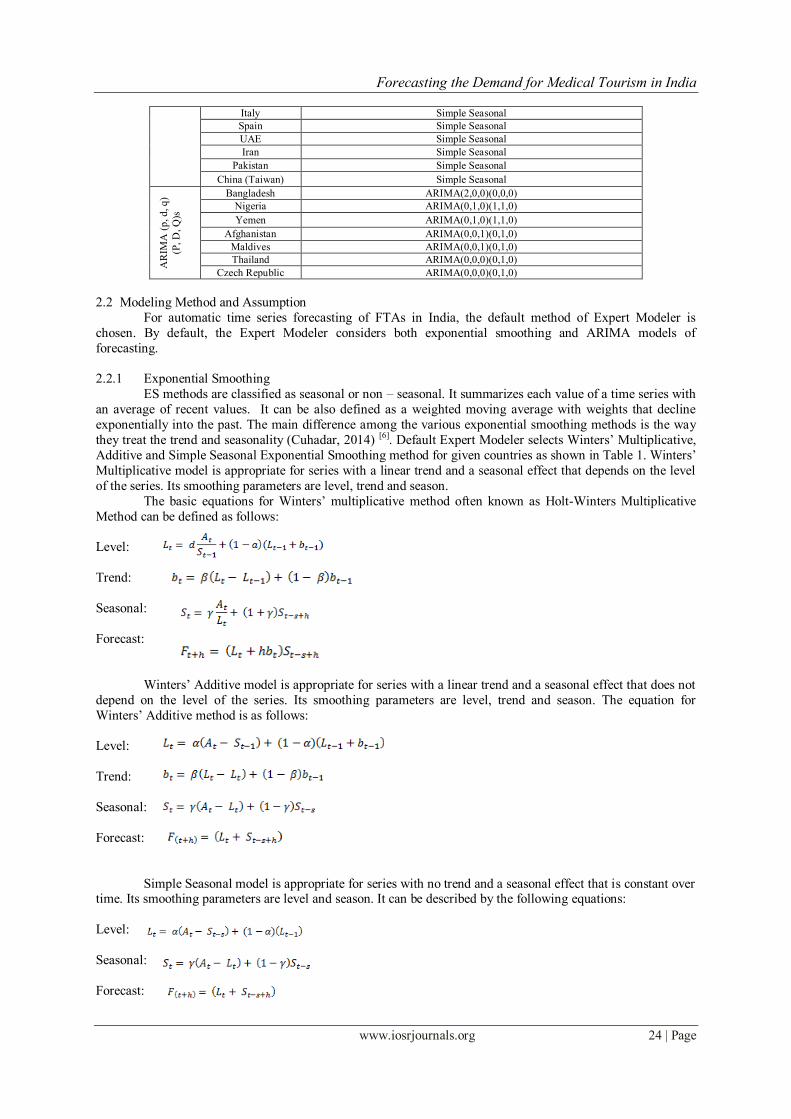
and error. Table 1 shows various best – fit models chosen by Expert Modeler for individual countries.
Table 1 Model Description
Model Country of
Nationality Model Type
Ex
po
nen
tial
Sm
oo
thin
g
Argentina Winters' Multiplicative
Brazil Winters' Multiplicative
Austria Winters' Multiplicative
Denmark Winters' Multiplicative
Finland Winters' Multiplicative
Germany Winters' Multiplicative
Ireland Winters' Multiplicative
Norway Winters' Multiplicative
Portugal Winters' Multiplicative
Sweden Winters' Multiplicative
Switzerland Winters' Multiplicative
UK Winters' Multiplicative
Kazakhstan Winters' Multiplicative
Poland Winters' Multiplicative
Ukraine Winters' Multiplicative
Egypt Winters' Multiplicative
Kenya Winters' Multiplicative
South Africa Winters' Multiplicative
Israel Winters' Multiplicative
Myanmar Winters' Multiplicative
Australia Winters' Multiplicative
New Zealand Winters' Multiplicative
Canada Winters' Additive
USA Winters' Additive
Mexico Winters' Additive
Belgium Winters' Additive
France Winters' Additive
Greece Winters' Additive
Netherlands Winters' Additive
Russian Fed. Winters' Additive
Sudan Winters' Additive
Ex
po
nen
tial
Sm
oo
thin
g
Tanzania Winters' Additive
Bahrain Winters' Additive
Iraq Winters' Additive
Oman Winters' Additive
Saudi Arabia Winters' Additive
Turkey Winters' Additive
Nepal Winters' Additive
Sri Lanka Winters' Additive
Bhutan Winters' Additive
Indonesia Winters' Additive
Malaysia Winters' Additive
Philippines Winters' Additive
Singapore Winters' Additive
Vietnam Winters' Additive
China (M) Winters' Additive
Japan Winters' Additive
Rep. of Korea Winters' Additive
Others Winters' Additive
Forecasting the Demand for Medical Tourism in India
www.iosrjournals.org 24 | Page
Italy Simple Seasonal
Spain Simple Seasonal
UAE Simple Seasonal
Iran Simple Seasonal
Pakistan Simple Seasonal
China (Taiwan) Simple Seasonal
AR
IMA
(p
, d
, q
)
(P, D
, Q
)s
Bangladesh ARIMA(2,0,0)(0,0,0)
Nigeria ARIMA(0,1,0)(1,1,0)
Yemen ARIMA(0,1,0)(1,1,0)
Afghanistan ARIMA(0,0,1)(0,1,0)
Maldives ARIMA(0,0,1)(0,1,0)
Thailand ARIMA(0,0,0)(0,1,0)
Czech Republic ARIMA(0,0,0)(0,1,0)
2.2 Modeling Method and Assumption
For automatic time series forecasting of FTAs in India, the default method of Expert Modeler is
chosen. By default, the Expert Modeler considers both exponential smoothing and ARIMA models of
forecasting.
2.2.1 Exponential Smoothing
ES methods are classified as seasonal or non – seasonal. It summarizes each value of a time series with
an average of recent values. It can be also defined as a weighted moving average with weights that decline
exponentially into the past. The main difference among the various exponential smoothing methods is the way
they treat the trend and seasonality (Cuhadar, 2014) [6]. Default Expert Modeler selects Winters’ Multiplicative,
Additive and Simple Seasonal Exponential Smoothing method for given countries as shown in Table 1. Winters’
Multiplicative model is appropriate for series with a linear trend and a seasonal effect that depends on the level
of the series. Its smoothing parameters are level, trend and season.
The basic equations for Winters’ multiplicative method often known as Holt-Winters Multiplicative
Method can be defined as follows:
Level:
Trend:
Seasonal:
Forecast:
Winters’ Additive model is appropriate for series with a linear trend and a seasonal effect that does not
depend on the level of the series. Its smoothing parameters are level, trend and season. The equation for
Winters’ Additive method is as follows:
Level:
Trend:
Seasonal:
Forecast:
Simple Seasonal model is appropriate for series with no trend and a seasonal effect that is constant over time. Its smoothing parameters are level and season. It can be described by the following equations:
Level:
Seasonal:
Forecast:
Forecasting the Demand for Medical Tourism in India
www.iosrjournals.org 25 | Page
Where, L = level of the series
α = level smoothing constant between 0 and 1
A = actual values s = number of seasonal periods in a year (as four quarters here)
b = trend of the series
β = seasonal smoothing constant between 0 and 1
S = seasonal component
γ = seasonal smoothing constant between 0 and 1
t = some time period
h = number of time periods ahead to be forecast
2.2.2 ARIMA Model
ARIMA model building method is an empirically driven methodology of systematically identifying,
estimating, diagnosing and forecasting time series (Cuhadar, 2014) [7]. Popularly known as the Box – Jenkins approach this method searches for the combination of two forecasting method and their parameters that
minimize the error in simulating the past series. The two methods are Auto-regression (AR) and Moving
Average (MA). The acronym ARIMA is used to identify the Autoregressive Integrated Moving Average
Method (Fretchling, 2001) [8], where ‘I’ indicate the ‘integration index’ which is a number of times a series must
be differenced to achieve stationarity. The general form of the ARIMA Model is written as the following
formulas – ARIMA (p, d, q) (P, D, Q)s which indicates as follows:
Autoregressive (p): the number of autoregressive orders in the model. Autoregressive orders specify which
previous values from the series are used to predict current values. For example, an autoregressive order of 2
specifies that the value of the series two time periods in the past be used to predict the current value.
Difference (d): specifies the order of differencing applied to the series before estimating models.
Differencing is necessary when trends are present (series with trends are typically non-stationary and ARIMA modeling assumes stationarity) and is used to remove their effect. The order of differencing
corresponds to the degree of series trend 1st order differencing accounts for linear trends, 2nd order
accounting for quadratic trends and so on.
Moving Average (q): the number of moving average orders in the model. Moving average orders specify
how deviations from the series mean for previous values are used to predict current values. For example,
moving average orders of 1 and 2 specify that deviations from the mean value of the series from each of the
last two time periods be considered when predicting current values of the series.
P: is the number of parameters in Autoregressive Seasonal Model
D: the seasonal differencing degree
Q: the number of parameters in moving average seasonal model and
s: the period of seasonality
It can be written as:
Where, Xt = the observed value at time point t (or transformed value)
p (B)= the AR or Autoregressive operator i.e. [(1 ― 1B― 2B2― … ― 2B
p)]
B = the backshift operator [BXt =Xt-1]
ΦPS (BS) = the seasonal AR Model [(1 – Φ1B
s – Φ2B2s ― … ― ΦPBPS)]
BS = the seasonal backshift operator [BSXt = Xt- s]
= the differencing operator [ Xt = (1 – B)dXt]
= the seasonal differencing operator [ Xt = (1 – BS)DXt]
at = the random error at time point ‘t’ [at ~ N(0, σ2a)]
= the moving average operator [1 ― 1B― 2B2― … ― 1B
q] and
(Bs) = seasonal moving average operator [(1― 1(BS) ― 2B
2S― … ― QBQS)]
2.3 Forecast Accuracy Evaluation
Accuracy testing is the most important tourist demand forecast evaluation criterion. The accuracy of a
forecasting model depends on how close the forecast values of Ft are to the actual value of At. The magnitude of
the forecasting error allows the analyst to evaluate the performance of the forecasting procedures across time periods in the series. Among many measures of forecast accuracy, MAPE or Mean Absolute Percentage Error is
Forecasting the Demand for Medical Tourism in India
www.iosrjournals.org 26 | Page
often used to test forecasting accuracy. It is the error magnitude measures compute percentage errors relative to
the values in the historical series. It is independent of the units used and can therefore be used to compare series
with different units. It can be expressed as –
MAPE =
Where, n = number of periods
e = forecast error i.e. [e = At – Ft]
A = actual value of the variable being forecast
t = some time period
F = forecast value
As a rule, lower MAPE values are preferred to higher ones because they indicate a forecasting model is
producing smaller percentage errors. Lewis (1982) has suggested the following interpretation of MAPE values
(Fretchling, 2001) [9]:
less than 10 per cent is highly accurate forecasting
between 10 and 20 per cent is good forecasting
between 20 and 50 per cent is reasonable forecasting
greater than 50 per cent is inaccurate forecasting
However demand of tourism is an outcome of highly complex human behavior but Lewis’s
interpretation is often used to judge MAPE values (Ḉuhadar, 2014) [10]. Therefore, comment on reliability of
forecasting accuracy is made on the basis of MAPE value following Lewis’s interpretation.
2.4. Generating Tourist Forecast and Estimating Potential Medical Tourist Arrivals to India
The aforesaid forecasting models are applied and projected number of FTAs till 2015 is generated.
Country – wise data on the proportion of FTAs for the medical treatment, compiled by the Ministry of Tourism
through disembarkation cards which have the provision for recording the purpose of the visit for each foreign
tourist is selected to estimate the number of medical tourists till 2015. It is believed that the proportion of FTAs
for medical treatment recorded for 2012 if extrapolated for the year 2014 & 2015, would give an estimated
number of tourists nationality wise who are visiting India to undergo various medical treatments.
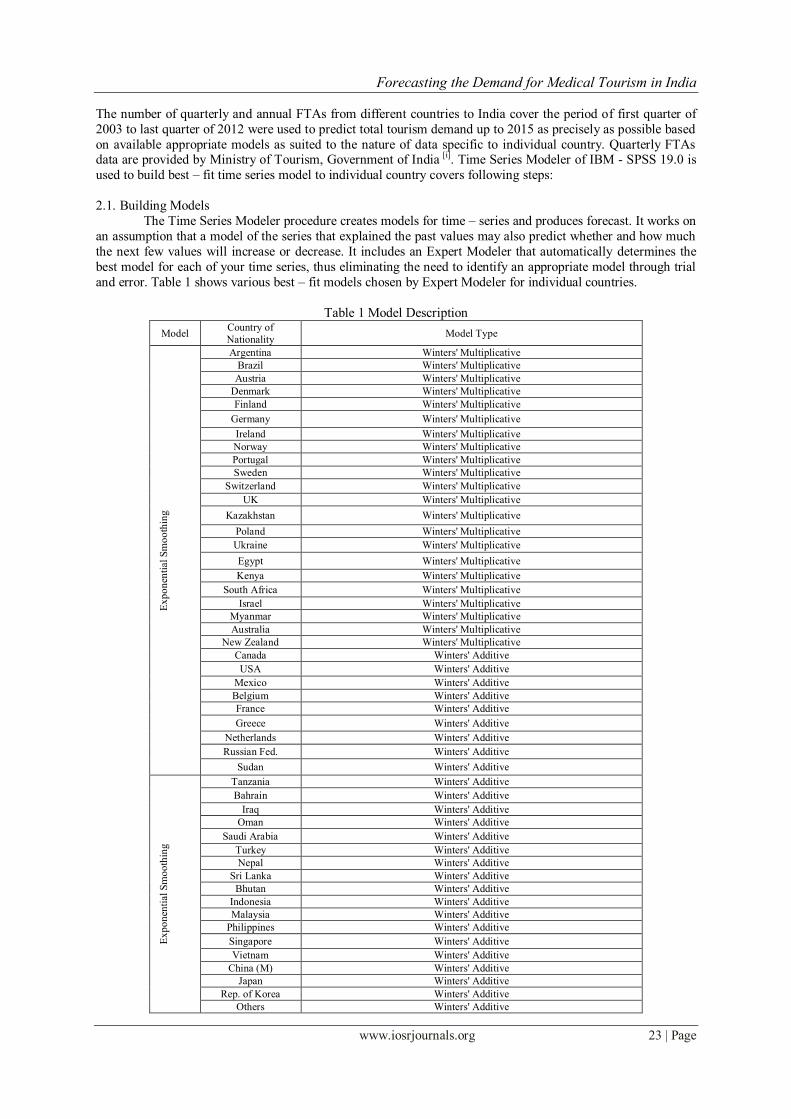
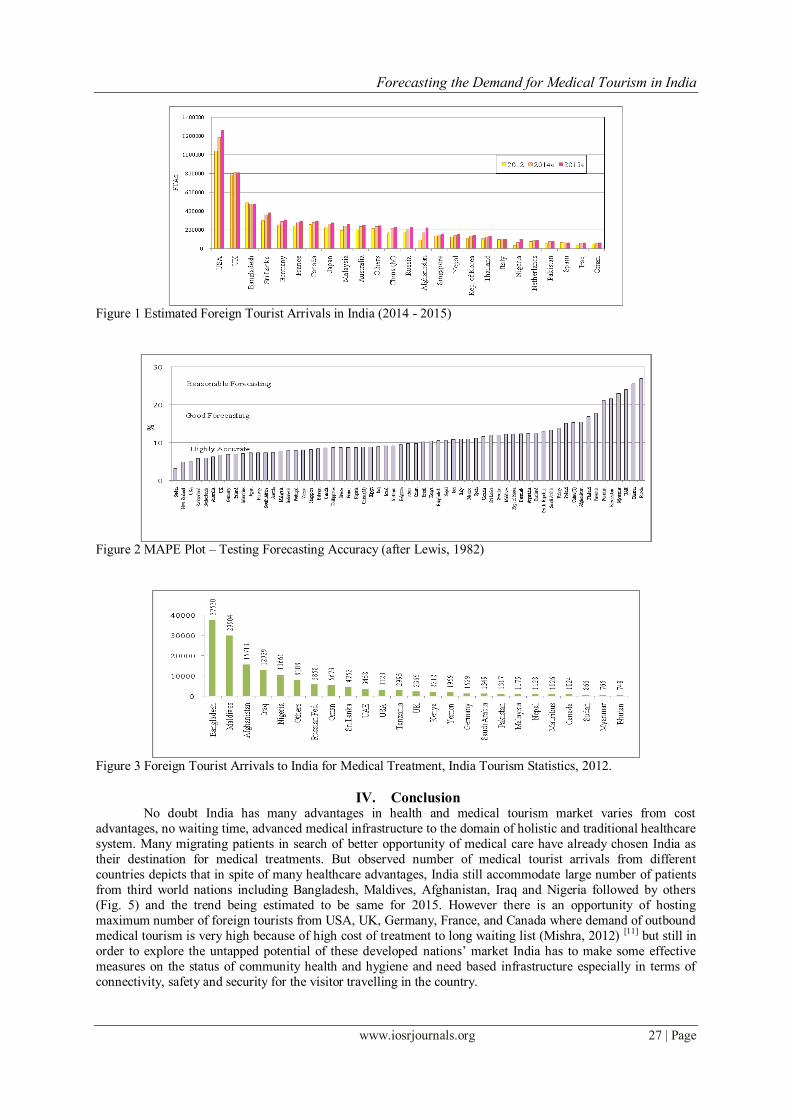
III. Projecting Demand for Medical Tourism in India The empirical results of applied forecasting models which depict the projected number of FTAs to
India up to 2015 have been shown in Table 2. It is projected that in 2015, India will host largest number of
foreign tourists from USA (1255959), UK (809262) and Bangladesh (475643) followed by Sri Lanka, Germany,
France, Canada and so on as shown in Fig. 1.
To measure forecast accuracy MAPE, the most widely used method is applied following Lewis’s
interpretation. Fig. 2 depicts reliability level of each forecasting model applied to individual country. It is
noticed that the MAPE varies from a minimum of 3.20 per cent to 26.88 per cent across all models. It depicts
that most of the forecasting models applied fall under good category of forecasting with less than 20 per cent of
forecasting error except Kazakhstan, Myanmar, Russia, Bhutan, UAE and Pakistan which are reasonable or
acceptable with more than 20 per cent of error.
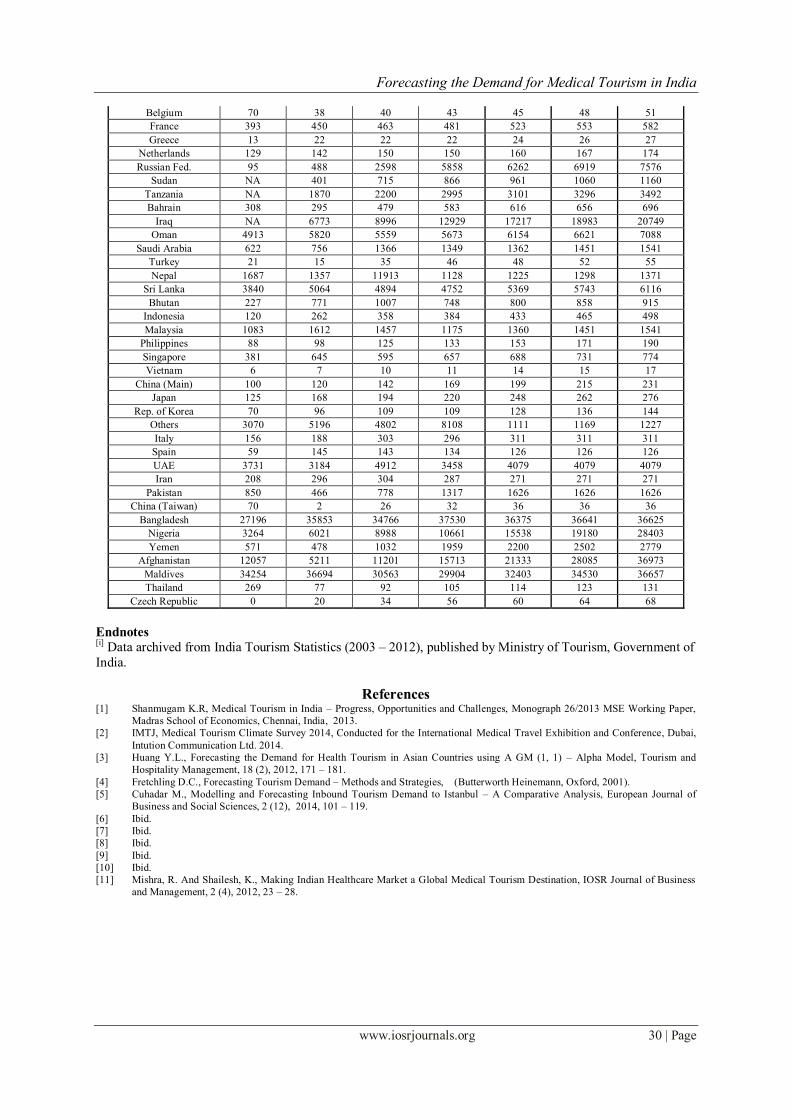
The observed and estimated number of tourist arrivals to India for medical treatment from different
country of nationality since 2009 to 2015 is shown in Table 3. Numerically, it is noticed that among different nationals the medical tourist arrivals in India is led by third world countries include Bangladesh, Maldives,
Afghanistan, Iraq, Nigeria together with Russia, Oman, Sri Lanka, UAE, USA and so on (Fig. 3)
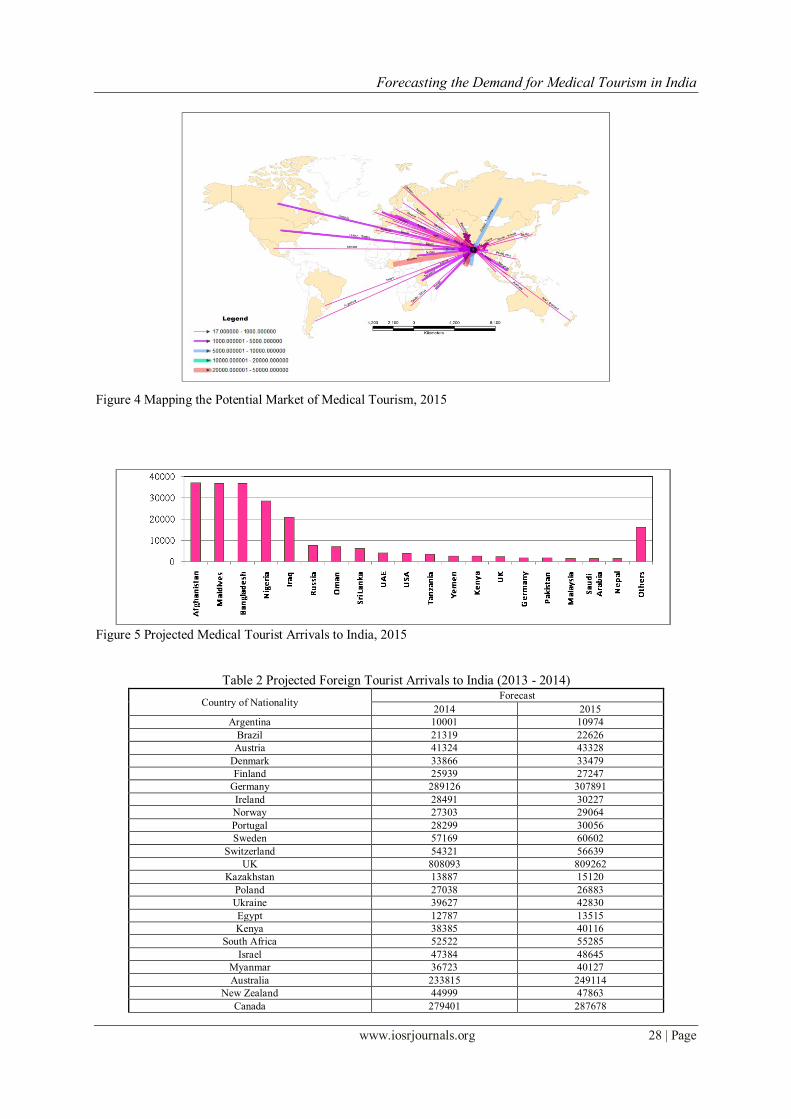
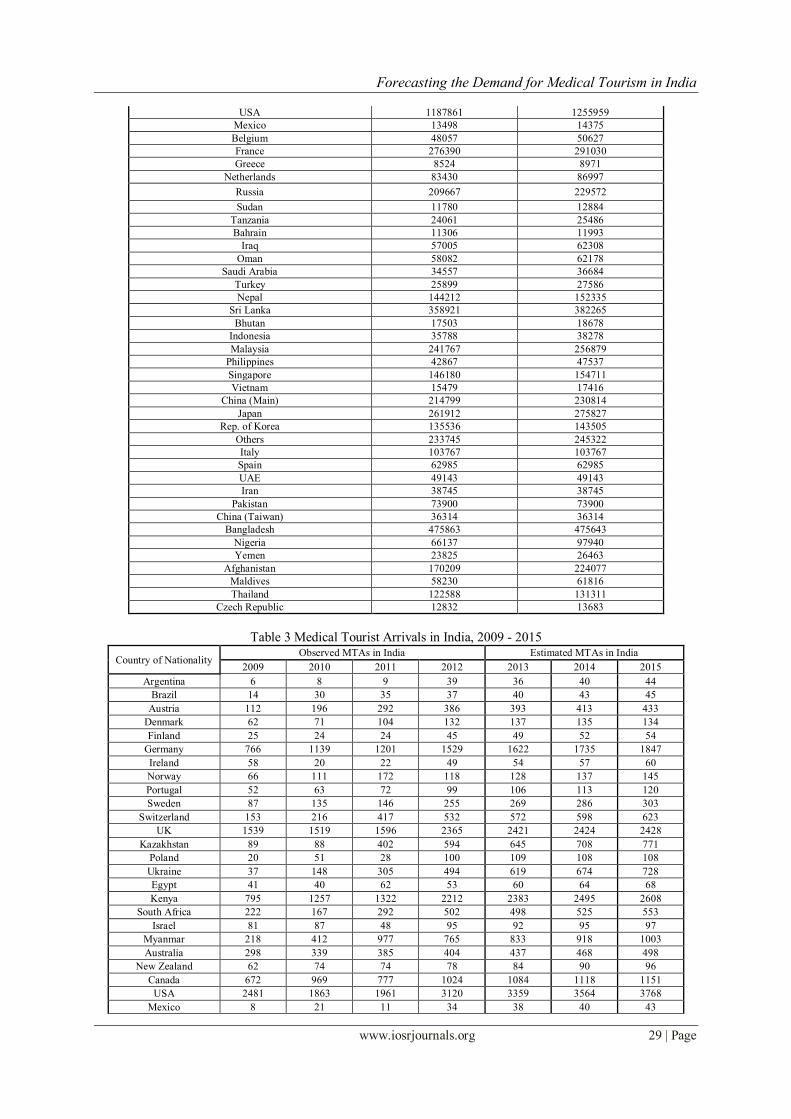
The estimated value depicts that in 2015 India will host maximum number of medical tourist arrivals
from Afghanistan (36973), Maldives (36657), and Bangladesh (36625) followed by Nigeria, Iraq, Russia,
Oman, Sri Lanka and so on (Fig. 4 and Fig. 5).
Forecasting the Demand for Medical Tourism in India
www.iosrjournals.org 27 | Page
Figure 1 Estimated Foreign Tourist Arrivals in India (2014 - 2015)
Figure 2 MAPE Plot – Testing Forecasting Accuracy (after Lewis, 1982)
Figure 3 Foreign Tourist Arrivals to India for Medical Treatment, India Tourism Statistics, 2012.
IV. Conclusion No doubt India has many advantages in health and medical tourism market varies from cost
advantages, no waiting time, advanced medical infrastructure to the domain of holistic and traditional healthcare
system. Many migrating patients in search of better opportunity of medical care have already chosen India as
their destination for medical treatments. But observed number of medical tourist arrivals from different
countries depicts that in spite of many healthcare advantages, India still accommodate large number of patients
from third world nations including Bangladesh, Maldives, Afghanistan, Iraq and Nigeria followed by others
(Fig. 5) and the trend being estimated to be same for 2015. However there is an opportunity of hosting
maximum number of foreign tourists from USA, UK, Germany, France, and Canada where demand of outbound
medical tourism is very high because of high cost of treatment to long waiting list (Mishra, 2012) [11] but still in
order to explore the untapped potential of these developed nations’ market India has to make some effective
measures on the status of community health and hygiene and need based infrastructure especially in terms of
connectivity, safety and security for the visitor travelling in the country.
Forecasting the Demand for Medical Tourism in India
www.iosrjournals.org 28 | Page
Figure 4 Mapping the Potential Market of Medical Tourism, 2015
Figure 5 Projected Medical Tourist Arrivals to India, 2015
Table 2 Projected Foreign Tourist Arrivals to India (2013 - 2014)
Country of Nationality Forecast
2014 2015
Argentina 10001 10974
Brazil 21319 22626
Austria 41324 43328
Denmark 33866 33479
Finland 25939 27247
Germany 289126 307891
Ireland 28491 30227
Norway 27303 29064
Portugal 28299 30056
Sweden 57169 60602
Switzerland 54321 56639
UK 808093 809262
Kazakhstan 13887 15120
Poland 27038 26883
Ukraine 39627 42830
Egypt 12787 13515
Kenya 38385 40116
South Africa 52522 55285
Israel 47384 48645
Myanmar 36723 40127
Australia 233815 249114
New Zealand 44999 47863
Canada 279401 287678
Forecasting the Demand for Medical Tourism in India
www.iosrjournals.org 29 | Page
USA 1187861 1255959
Mexico 13498 14375
Belgium 48057 50627
France 276390 291030
Greece 8524 8971
Netherlands 83430 86997
Russia 209667 229572
Sudan 11780 12884
Tanzania 24061 25486
Bahrain 11306 11993
Iraq 57005 62308
Oman 58082 62178
Saudi Arabia 34557 36684
Turkey 25899 27586
Nepal 144212 152335
Sri Lanka 358921 382265
Bhutan 17503 18678
Indonesia 35788 38278
Malaysia 241767 256879
Philippines 42867 47537
Singapore 146180 154711
Vietnam 15479 17416
China (Main) 214799 230814
Japan 261912 275827
Rep. of Korea 135536 143505
Others 233745 245322
Italy 103767 103767
Spain 62985 62985
UAE 49143 49143
Iran 38745 38745
Pakistan 73900 73900
China (Taiwan) 36314 36314
Bangladesh 475863 475643
Nigeria 66137 97940
Yemen 23825 26463
Afghanistan 170209 224077
Maldives 58230 61816
Thailand 122588 131311
Czech Republic 12832 13683
Table 3 Medical Tourist Arrivals in India, 2009 - 2015
Country of Nationality Observed MTAs in India Estimated MTAs in India
2009 2010 2011 2012 2013 2014 2015
Argentina 6 8 9 39 36 40 44
Brazil 14 30 35 37 40 43 45
Austria 112 196 292 386 393 413 433
Denmark 62 71 104 132 137 135 134
Finland 25 24 24 45 49 52 54
Germany 766 1139 1201 1529 1622 1735 1847
Ireland 58 20 22 49 54 57 60
Norway 66 111 172 118 128 137 145
Portugal 52 63 72 99 106 113 120
Sweden 87 135 146 255 269 286 303
Switzerland 153 216 417 532 572 598 623
UK 1539 1519 1596 2365 2421 2424 2428
Kazakhstan 89 88 402 594 645 708 771
Poland 20 51 28 100 109 108 108
Ukraine 37 148 305 494 619 674 728
Egypt 41 40 62 53 60 64 68
Kenya 795 1257 1322 2212 2383 2495 2608
South Africa 222 167 292 502 498 525 553
Israel 81 87 48 95 92 95 97
Myanmar 218 412 977 765 833 918 1003
Australia 298 339 385 404 437 468 498
New Zealand 62 74 74 78 84 90 96
Canada 672 969 777 1024 1084 1118 1151
USA 2481 1863 1961 3120 3359 3564 3768
Mexico 8 21 11 34 38 40 43
Forecasting the Demand for Medical Tourism in India
www.iosrjournals.org 30 | Page
Belgium 70 38 40 43 45 48 51
France 393 450 463 481 523 553 582
Greece 13 22 22 22 24 26 27
Netherlands 129 142 150 150 160 167 174
Russian Fed. 95 488 2598 5858 6262 6919 7576
Sudan NA 401 715 866 961 1060 1160
Tanzania NA 1870 2200 2995 3101 3296 3492
Bahrain 308 295 479 583 616 656 696
Iraq NA 6773 8996 12929 17217 18983 20749
Oman 4913 5820 5559 5673 6154 6621 7088
Saudi Arabia 622 756 1366 1349 1362 1451 1541
Turkey 21 15 35 46 48 52 55
Nepal 1687 1357 11913 1128 1225 1298 1371
Sri Lanka 3840 5064 4894 4752 5369 5743 6116
Bhutan 227 771 1007 748 800 858 915
Indonesia 120 262 358 384 433 465 498
Malaysia 1083 1612 1457 1175 1360 1451 1541
Philippines 88 98 125 133 153 171 190
Singapore 381 645 595 657 688 731 774
Vietnam 6 7 10 11 14 15 17
China (Main) 100 120 142 169 199 215 231
Japan 125 168 194 220 248 262 276
Rep. of Korea 70 96 109 109 128 136 144
Others 3070 5196 4802 8108 1111 1169 1227
Italy 156 188 303 296 311 311 311
Spain 59 145 143 134 126 126 126
UAE 3731 3184 4912 3458 4079 4079 4079
Iran 208 296 304 287 271 271 271
Pakistan 850 466 778 1317 1626 1626 1626
China (Taiwan) 70 2 26 32 36 36 36
Bangladesh 27196 35853 34766 37530 36375 36641 36625
Nigeria 3264 6021 8988 10661 15538 19180 28403
Yemen 571 478 1032 1959 2200 2502 2779
Afghanistan 12057 5211 11201 15713 21333 28085 36973
Maldives 34254 36694 30563 29904 32403 34530 36657
Thailand 269 77 92 105 114 123 131
Czech Republic 0 20 34 56 60 64 68
Endnotes [i] Data archived from India Tourism Statistics (2003 – 2012), published by Ministry of Tourism, Government of
India.
References [1] Shanmugam K.R, Medical Tourism in India – Progress, Opportunities and Challenges, Monograph 26/2013 MSE Working Paper,
Madras School of Economics, Chennai, India, 2013.
[2] IMTJ, Medical Tourism Climate Survey 2014, Conducted for the International Medical Travel Exhibition and Conference, Dubai,
Intution Communication Ltd. 2014.
[3] Huang Y.L., Forecasting the Demand for Health Tourism in Asian Countries using A GM (1, 1) – Alpha Model, Tourism and
Hospitality Management, 18 (2), 2012, 171 – 181.
[4] Fretchling D.C., Forecasting Tourism Demand – Methods and Strategies, (Butterworth Heinemann, Oxford, 2001).
[5] Cuhadar M., Modelling and Forecasting Inbound Tourism Demand to Istanbul – A Comparative Analysis, European Journal of
Business and Social Sciences, 2 (12), 2014, 101 – 119.
[6] Ibid.
[7] Ibid.
[8] Ibid.
[9] Ibid.
[10] Ibid.
[11] Mishra, R. And Shailesh, K., Making Indian Healthcare Market a Global Medical Tourism Destination, IOSR Journal of Business
and Management, 2 (4), 2012, 23 – 28.