Embed Size (px)
Citation preview
International Journal of Science and Research (IJSR) ISSN (Online): 2319-7064
Index Copernicus Value (2013): 6.14 | Impact Factor (2013): 4.438
Volume 4 Issue 8, August 2015
www.ijsr.net Licensed Under Creative Commons Attribution CC BY
Foreign Direct Investment Inflow in India
Krishan Kant Meena1, Dr. M.R.P Singh
2
1Assistant Professor, Central University of Rajasthan, India
2Associate Professor, Central University of Rajasthan, India
Abstract: The Foreign Direct Investmentplaysa important role in economic growth of developing countries like India. FDI contributes
for the Development of the country in the form of development of Multinational companies in India, which provides education training,
employment for major part of population of India and brings new skills, information and technology to host country. Government of
India allowed FDI in different sectors of Indian economy. With a view to infuse globally acceptable best practices, modern management
skills and latest technology, it has been decided to allow foreign investment in India. The objective of the study is to provide a view on
foreign direct investment inflow with the scene of different sectors. It also point out the sector-wise distribution of FDI inflow to know
about which has concerned with the chief share. The present research study is based on secondary data collected from different sources
and tries to find out the current scenario, Scope, and role of Foreign Direct Investment inflowin India.
Keywords: Economy, foreign direct investment, MNCs, FDI Inflow
1. Introduction
After the government allow the foreign direct investment in
India its stimulating economic growth is one of the
controversial issues in the development of country. The
growth able condition occurs with foreign direct investment
by multinational corporations is that capital will stimulate
dynamic growth in different sector of Indian industry. FDI is
a major factor of boosting income and employment in India
and the hope is that manufacturing FDI will bring
knowledge that indirectly effect in building skill and
technological capacities of local firms, catalyzing broad-
based economic growth. The part played by foreign direct
investment in the development process has undergone
several changes. Foreign investments add a great deal to
India‟s economy. The continuous inflow of foreign direct
investment, which is now allowed across several industries,
clearly shows the faith that overseas investors have in the
country's economy. FDI inflows to India increased 17 per
cent in 2013 to reach US$ 28 billion, as per a United Nations
report. The Indian government‟s policy regime and a robust
business environment have ensured that foreign capital keep
flowing into the country. The government has taken many
initiatives in recent years such as relaxing FDI norms in
2013, in sectors such as defense, PSU oil refineries, telecom,
power exchanges and stock exchanges, among others. The
same year, big global brands such as Tesco, Singapore
Airlines and Etihad lined up to invest in India as the
government opened more sectors to foreign investment.
2. Market Structure
FDI inflows into India in the period April 2000–August
2014 touched US$ 341,357 million. Total FDI inflows into
India during the period April–August FY15 was US$ 17,445
million.
The services sector (US$ 2,336 million) attracted the highest
FDI equity inflows in the period April–August 2014,
followed by the services (US$ 1,086 million) and drugs &
pharmaceuticals (US$ 903 million) sectors.
Mauritius led the share of top investing countries by FDI
equity inflows into India with US$ 3,934 million during
April-August FY15, followed by Singapore (US$ 1,892
million), the Netherlands (US$ 1,562 million) and Japan
(US$ 897 million).
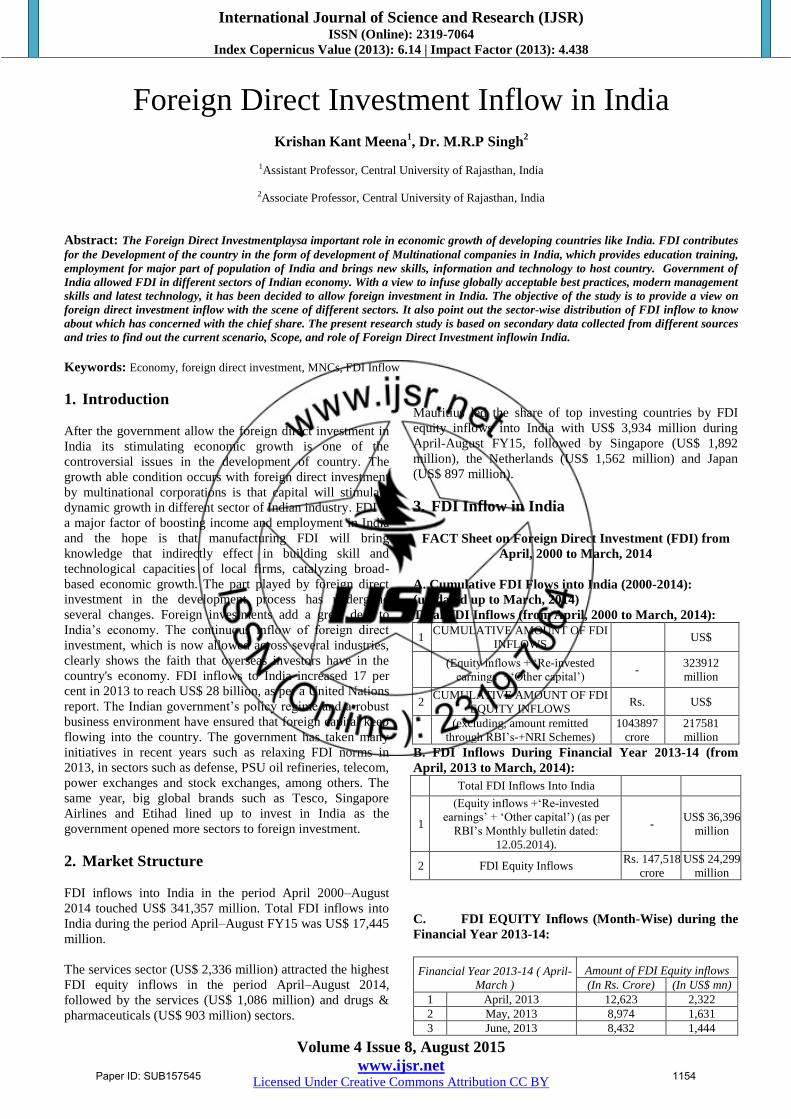
3. FDI Inflow in India
FACT Sheet on Foreign Direct Investment (FDI) from
April, 2000 to March, 2014
A. Cumulative FDI Flows into India (2000-2014):
(up dated up to March, 2014)
Total FDI Inflows (from April, 2000 to March, 2014):
1 CUMULATIVE AMOUNT OF FDI
INFLOWS US$
(Equity inflows + „Re-invested
earnings‟ +„Other capital‟) -
323912
million
2 CUMULATIVE AMOUNT OF FDI
EQUITY INFLOWS Rs. US$
(excluding, amount remitted
through RBI‟s-+NRI Schemes)
1043897
crore
217581
million
B. FDI Inflows During Financial Year 2013-14 (from
April, 2013 to March, 2014):
Total FDI Inflows Into India
1
(Equity inflows +„Re-invested
earnings‟ + „Other capital‟) (as per
RBI‟s Monthly bulletin dated:
12.05.2014).
- US$ 36,396
million
2 FDI Equity Inflows Rs. 147,518
crore
US$ 24,299
million
C. FDI EQUITY Inflows (Month-Wise) during the
Financial Year 2013-14:
Financial Year 2013-14 ( April-
March )
Amount of FDI Equity inflows
(In Rs. Crore) (In US$ mn)
1 April, 2013 12,623 2,322
2 May, 2013 8,974 1,631
3 June, 2013 8,432 1,444
Paper ID: SUB157545 1154
International Journal of Science and Research (IJSR) ISSN (Online): 2319-7064
Index Copernicus Value (2013): 6.14 | Impact Factor (2013): 4.438
Volume 4 Issue 8, August 2015
www.ijsr.net Licensed Under Creative Commons Attribution CC BY
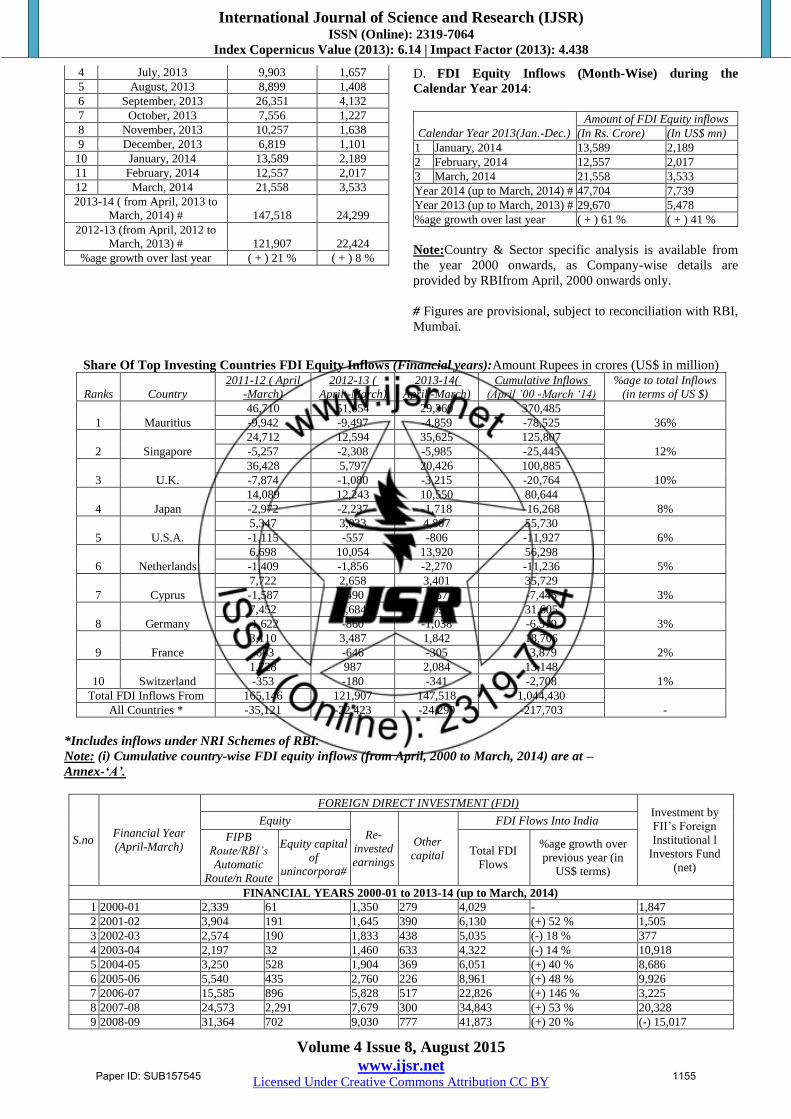
4 July, 2013 9,903 1,657
5 August, 2013 8,899 1,408
6 September, 2013 26,351 4,132
7 October, 2013 7,556 1,227
8 November, 2013 10,257 1,638
9 December, 2013 6,819 1,101
10 January, 2014 13,589 2,189
11 February, 2014 12,557 2,017
12 March, 2014 21,558 3,533
2013-14 ( from April, 2013 to
March, 2014) # 147,518 24,299
2012-13 (from April, 2012 to
March, 2013) # 121,907 22,424
%age growth over last year ( + ) 21 % ( + ) 8 %
D. FDI Equity Inflows (Month-Wise) during the
Calendar Year 2014:
Calendar Year 2013(Jan.-Dec.)
Amount of FDI Equity inflows
(In Rs. Crore) (In US$ mn)
1 January, 2014 13,589 2,189
2 February, 2014 12,557 2,017
3 March, 2014 21,558 3,533
Year 2014 (up to March, 2014) # 47,704 7,739
Year 2013 (up to March, 2013) # 29,670 5,478
%age growth over last year ( + ) 61 % ( + ) 41 %
Note:Country & Sector specific analysis is available from
the year 2000 onwards, as Company-wise details are
provided by RBIfrom April, 2000 onwards only.
# Figures are provisional, subject to reconciliation with RBI,
Mumbai.
Share Of Top Investing Countries FDI Equity Inflows (Financial years):Amount Rupees in crores (US$ in million)
Ranks Country
2011-12 ( April
-March)
2012-13 (
April -March)
2013-14(
April -March)
Cumulative Inflows
(April ’00 -March ‘14)
%age to total Inflows
(in terms of US $)
1 Mauritius
46,710 51,654 29,360 370,485
36% -9,942 -9,497 -4,859 -78,525
2 Singapore
24,712 12,594 35,625 125,807
12% -5,257 -2,308 -5,985 -25,445
3 U.K.
36,428 5,797 20,426 100,885
10% -7,874 -1,080 -3,215 -20,764
4 Japan
14,089 12,243 10,550 80,644
8% -2,972 -2,237 -1,718 -16,268
5 U.S.A.
5,347 3,033 4,807 55,730
6% -1,115 -557 -806 -11,927
6 Netherlands
6,698 10,054 13,920 56,298
5% -1,409 -1,856 -2,270 -11,236
7 Cyprus
7,722 2,658 3,401 35,729
3% -1,587 -490 -557 -7,446
8 Germany
7,452 4,684 6,093 31,605
3% -1,622 -860 -1,038 -6,519
9 France
3,110 3,487 1,842 18,706
2% -663 -646 -305 -3,879
10 Switzerland
1,728 987 2,084 13,148
1% -353 -180 -341 -2,708
Total FDI Inflows From 165,146 121,907 147,518 1,044,430
- All Countries * -35,121 -22,423 -24,299 -217,703
*Includes inflows under NRI Schemes of RBI.
Note: (i) Cumulative country-wise FDI equity inflows (from April, 2000 to March, 2014) are at –
Annex-„A‟.
S.no Financial Year
(April-March)
FOREIGN DIRECT INVESTMENT (FDI) Investment by
FII‟s Foreign
Institutional l
Investors Fund
(net)
Equity
Re-
invested
earnings
Other
capital
FDI Flows Into India
FIPB
Route/RBI’s
Automatic
Route/n Route
Equity capital
of
unincorpora#
Total FDI
Flows
%age growth over
previous year (in
US$ terms)
FINANCIAL YEARS 2000-01 to 2013-14 (up to March, 2014)
1 2000-01 2,339 61 1,350 279 4,029 - 1,847
2 2001-02 3,904 191 1,645 390 6,130 (+) 52 % 1,505
3 2002-03 2,574 190 1,833 438 5,035 (-) 18 % 377
4 2003-04 2,197 32 1,460 633 4,322 (-) 14 % 10,918
5 2004-05 3,250 528 1,904 369 6,051 (+) 40 % 8,686
6 2005-06 5,540 435 2,760 226 8,961 (+) 48 % 9,926
7 2006-07 15,585 896 5,828 517 22,826 (+) 146 % 3,225
8 2007-08 24,573 2,291 7,679 300 34,843 (+) 53 % 20,328
9 2008-09 31,364 702 9,030 777 41,873 (+) 20 % (-) 15,017
Paper ID: SUB157545 1155
International Journal of Science and Research (IJSR) ISSN (Online): 2319-7064
Index Copernicus Value (2013): 6.14 | Impact Factor (2013): 4.438
Volume 4 Issue 8, August 2015
www.ijsr.net Licensed Under Creative Commons Attribution CC BY
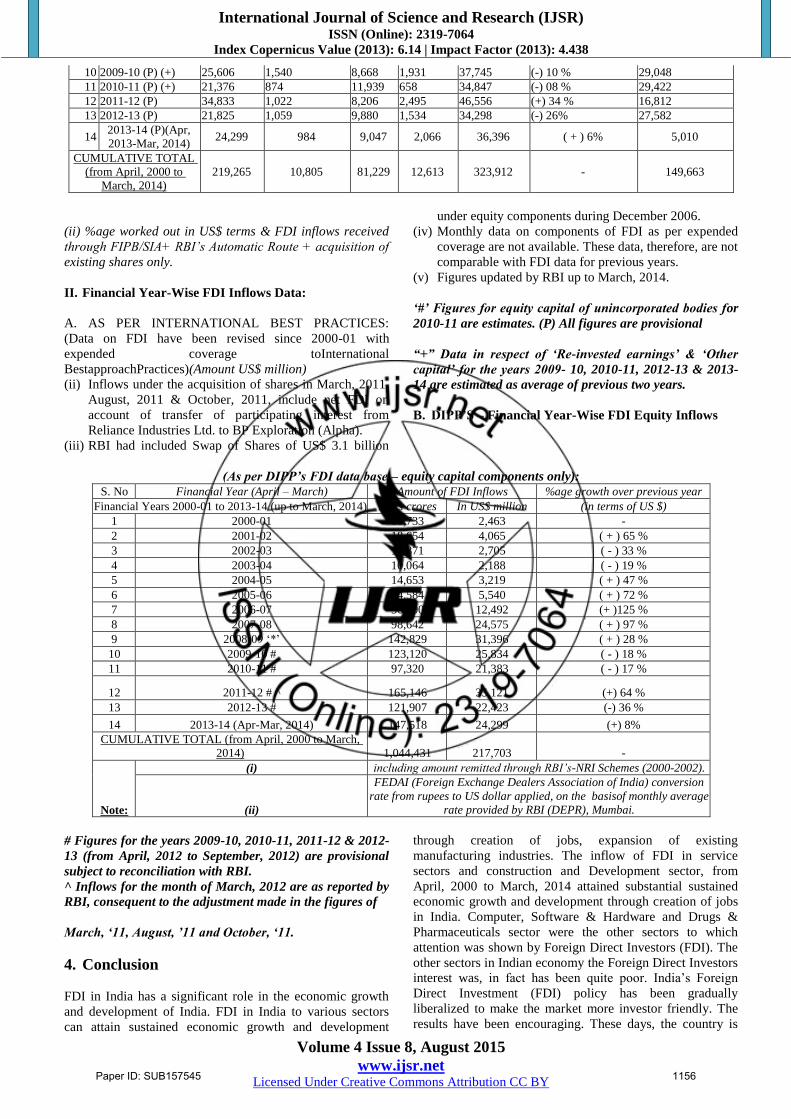
10 2009-10 (P) (+) 25,606 1,540 8,668 1,931 37,745 (-) 10 % 29,048
11 2010-11 (P) (+) 21,376 874 11,939 658 34,847 (-) 08 % 29,422
12 2011-12 (P) 34,833 1,022 8,206 2,495 46,556 (+) 34 % 16,812
13 2012-13 (P) 21,825 1,059 9,880 1,534 34,298 (-) 26% 27,582
14 2013-14 (P)(Apr,
2013-Mar, 2014) 24,299 984 9,047 2,066 36,396 ( + ) 6% 5,010
CUMULATIVE TOTAL
(from April, 2000 to
March, 2014)
219,265 10,805 81,229 12,613 323,912 - 149,663
(ii) %age worked out in US$ terms & FDI inflows received
through FIPB/SIA+ RBI’s Automatic Route + acquisition of
existing shares only.
II. Financial Year-Wise FDI Inflows Data:
A. AS PER INTERNATIONAL BEST PRACTICES:
(Data on FDI have been revised since 2000-01 with
expended coverage toInternational
BestapproachPractices)(Amount US$ million)
(ii) Inflows under the acquisition of shares in March, 2011,
August, 2011 & October, 2011, include net FDI on
account of transfer of participating interest from
Reliance Industries Ltd. to BP Exploration (Alpha).
(iii) RBI had included Swap of Shares of US$ 3.1 billion
under equity components during December 2006.
(iv) Monthly data on components of FDI as per expended
coverage are not available. These data, therefore, are not
comparable with FDI data for previous years.
(v) Figures updated by RBI up to March, 2014.
„#‟ Figures for equity capital of unincorporated bodies for
2010-11 are estimates. (P) All figures are provisional
“+” Data in respect of „Re-invested earnings‟ & „Other
capital‟ for the years 2009- 10, 2010-11, 2012-13 & 2013-
14 are estimated as average of previous two years.
B. DIPP’S – Financial Year-Wise FDI Equity Inflows
(As per DIPP‟s FDI data base – equity capital components only):
S. No Financial Year (April – March) Amount of FDI Inflows %age growth over previous year
Financial Years 2000-01 to 2013-14 (up to March, 2014) In Rs crores In US$ million (in terms of US $)
1 2000-01 10,733 2,463 -
2 2001-02 18,654 4,065 ( + ) 65 %
3 2002-03 12,871 2,705 ( - ) 33 %
4 2003-04 10,064 2,188 ( - ) 19 %
5 2004-05 14,653 3,219 ( + ) 47 %
6 2005-06 24,584 5,540 ( + ) 72 %
7 2006-07 56,390 12,492 (+ )125 %
8 2007-08 98,642 24,575 ( + ) 97 %
9 2008-09 „*‟ 142,829 31,396 ( + ) 28 %
10 2009-10 # 123,120 25,834 ( - ) 18 %
11 2010-11 # 97,320 21,383 ( - ) 17 %
12 2011-12 # ^ 165,146 35,121 (+) 64 %
13 2012-13 # 121,907 22,423 (-) 36 %
14 2013-14 (Apr-Mar, 2014) 147,518 24,299 (+) 8%
CUMULATIVE TOTAL (from April, 2000 to March,
2014) 1,044,431 217,703 -
Note:
(i) including amount remitted through RBI’s-NRI Schemes (2000-2002).
(ii)
FEDAI (Foreign Exchange Dealers Association of India) conversion
rate from rupees to US dollar applied, on the basisof monthly average
rate provided by RBI (DEPR), Mumbai.
# Figures for the years 2009-10, 2010-11, 2011-12 & 2012-
13 (from April, 2012 to September, 2012) are provisional
subject to reconciliation with RBI.
^ Inflows for the month of March, 2012 are as reported by
RBI, consequent to the adjustment made in the figures of
March, „11, August, ‟11 and October, „11.
4. Conclusion
FDI in India has a significant role in the economic growth
and development of India. FDI in India to various sectors
can attain sustained economic growth and development
through creation of jobs, expansion of existing
manufacturing industries. The inflow of FDI in service
sectors and construction and Development sector, from
April, 2000 to March, 2014 attained substantial sustained
economic growth and development through creation of jobs
in India. Computer, Software & Hardware and Drugs &
Pharmaceuticals sector were the other sectors to which
attention was shown by Foreign Direct Investors (FDI). The
other sectors in Indian economy the Foreign Direct Investors
interest was, in fact has been quite poor. India‟s Foreign
Direct Investment (FDI) policy has been gradually
liberalized to make the market more investor friendly. The
results have been encouraging. These days, the country is
Paper ID: SUB157545 1156
International Journal of Science and Research (IJSR) ISSN (Online): 2319-7064
Index Copernicus Value (2013): 6.14 | Impact Factor (2013): 4.438
Volume 4 Issue 8, August 2015
www.ijsr.net Licensed Under Creative Commons Attribution CC BY
consistently ranked among the top three global investment
destinations by all international bodies, including the World
Bank, according to a United Nations (UN) report. For Indian
economy which has tremendous potential, FDI has had a
positive impact. FDI inflow supplements domestic capital,
as well as technology and skills of existing companies. It
also helps to establish new companies. All of these
contribute to economic growth of the Indian Economy
Recently.
References
[1] Agarwal J, Khan MA (2011) Impact of FDI on GDP: A
comparative study of China and India, Int. J. Business
Management 6(10):71-79.
[2] Kumar Gajendran Lenin, Karthika S (2010) Sectoral
performance through inflows of foreign direct
investment (FDI).
[3] Singh, S (2009) Foreign direct investment (fdi) and
growth of states of india. VISION 2020 - Managerial
Strategies and Challenge, Wisdom Publications, Delhi.
[4] DevajitMahanta, (2012) Impact of foreign direct
investments on indian economy, Research J.
Management Sciences, 1(2):29-31.
[5] Basu P., Nayak N.C, Archana (2007): “Foreign Direct
Investment in
[6] India:Emerging
[7] Horizon”, Indian Economic Review, Vol. XXXXII.
No.2.
[8] http://fipbindia.com/FDI%20Policy.php
[9] www.imf.org
[10] www.rbi.org.
[11] www.dipp.gov.in.
[12] Reetu Sharma , Nikita Khurana(2013), Role of Foreign
Direct Investment (FDI) in Different Sectors,
International Journal of Advances in Management and
Economics, Jan-Feb 2013, Page-14-19
[13] Chien, Nguyen Dinh and Kezhong Zhang (2012) FDI of
vietnam; two-way linkages between FDI and GDP,
competition among provinces and effects of laws,
iBusiness, 4:157-163.
[14] Guruswamy Mohan, Sharma Kamal, MohantyJeevan
Prakash, Korah Thomas J (2005) FDI in India‟s Retail
Sector: More Bad than Good? Economic and Political
Weekly, pp.619-623
[15] Kulwinder Singh (2005) Foreign Direct Investment in
India: A Critical analysis of FDI from 1991-2005,
papers.ssrn.com/sol3/papers.cfm_id_822584
[16] FDI Policy mapping with NIC-2008 Department Of
Industrial
PolicyUrl: http://dipp.nic.in/English/acts_rules/Press_N
otes/Mapping_NIC2008_05January2015.pdf
6/1/1/1
[17] FDI In Commodity Exchanges Sector Of India Under
ConsolidatedUrl: http://perry4law.org/clii/?p=48
6/1/1/2
[18] Mapping of the sector specific FDI Policy – The
DollarBusiness Url: https://www.thedollarbusiness.com
/mapping-of-the-sector-specific-fdi-policy-in-
consolidated-fdi-policy-2014/6/1/1/3
[19] http://www.ijidt.com/index.php/ijidt/article/viewFile/3.4
.9/pdf
[20] http://seekdl.org/nm.php?id=3697
[21] http://www.ijarcce.com/upload/2014/march/IJARCCE9
B%20%20a%20%20anjan%20A%20Comparative%20
Analysis%20Grid%20Cluster%20and%20Cloud%20Co
mputing.pdf
[22] http://en.wikipedia.org/wiki?curid=31177875
[23] http://en.wikipedia.org/wiki?curid=40236851
[24] http://en.wikipedia.org/wiki?curid=19541494
[25] http://www.researchgate.net/publication/228313347_Se
ctoral_Performance_Through_Inflows_of_Foreign_Dire
ct_Investment_(FDI)
[26] http://papers.ssrn.com/sol3/papers.cfm?abstract_id=170
5946
[27] http://foreigndirectinvestmentcash.blogspot.com/
Paper ID: SUB157545 1157