Embed Size (px)
Citation preview
Foreign Portfolio Capital flows into India1 An Exploration into its Openness and basic motives
Nirmal Roy V P Doctoral Scholar MIDS, Chennai 9th December 2007
Abstract
This study attempts to join the debate on capital account convertibility by looking at a single, but dominant component of capital flows, the foreign portfolio flows. The basic idea is that, policy measures concerning capital account liberalisation should vary with the nature of the various components of capital flows. Without understanding the basic nature of capital flows, it would be a grave mistake to open the doors of our economy to these flows. Here an attempt is done to recognize the true nature of foreign portfolio flows. Effort is also taken to measure the present openness of our economy towards foreign portfolio flows. While most of the studies concerning capital account liberalisation uses openness to capital flows or capital market openness as an aggregate measure of capital flows, this study attempts to provide a disaggregated measure considering one of the components of capital flows; the portfolio flows. The study also argues that, it is essential to understand the basic motives underlying the financial flows before liberalizing them. In this case, an empirical analysis to identify whether the foreign portfolio flows to India are driven either by the capital gains motive or the income gains motive is attempted. The variables identified for the regression analysis are net foreign portfolio flows as dependent variable and the stock price change, exchange rate change of rupee in terms of US dollar and real interest rate differential as independent variables. It has been found out that the foreign portfolio flows to India are driven primarily due to the capital gains motive and in the Indian case it is the change in stock prices. Before the analysis the econometric methodology has confirmed the long lasting relationship between the variables. Moreover, the causality checks also reveal that stock prices are causing the net foreign portfolio flows and not vice versa.
Key Words: Short-term capital flows, Foreign Portfolio Investments, Openness, JEL Classification: F32, F36, F41,
1 This paper is from author’s MPhil dissertation titled “An Analysis of Foreign Portfolio Flows in the Context of Capital Account Convertibility in India” done at the Centre for Development Studies, Trivandrum during 2005-07. The author thankfully acknowledges the supervisors Dr. K N Harilal, and Dr. Hrushikesh Mallick and Athulan Guha for comments on this section.
INTRODUCTION
The link between financial developments and economic growth is well established. Financial development can be best considered as a facilitator of economic growth, but a feedback relationship can exist between these two2. The financial sector of most of the under-developed and developing economies were characterised by policies dubbed as financial repression until the seventies; i.e. they were often characterised by ceilings imposed upon interest rates, high reserve requirements on commercial banks and the presence of directed or preferential credit policies and by inflation taxes. It was McKinnon (1973) and Shaw (1973) who advocated the need for liberalizing the financial sector for augmenting growth3. The McKinnon-Shaw thesis was further extended by Cho (1986), who argued that financial liberalization may remain incomplete without an efficient market for equity capital4. As a result developing countries began to enact reforms in their financial sector especially in the capital market during the 1980s and 1990s. This has been in conformity with the theoretical rationale of allocative efficiency, which draws heavily on the predictions of the neoclassical model for capital account liberalization. This is based primarily on the argument that free capital mobility promotes an efficient global allocation of savings and a better diversification of risk, hence greater economic growth and welfare. This for a time became the watchword of IMF and World Bank who advocated capital market liberalisation to developing countries (Henry, 2006).
Developments like the breaking down of Breton Woods system, introduction of floating exchange system, world debt crisis of the eighties, decline in the official development assistance and increase in the private capital flows, aging in the major developed countries, institutionalization of the savings and recent developments in the information and communication technology all have influenced the international financial sector. The liberalization of capital account also gained momentum in the last decade, which in turn aided financial integration to a significant level. Over the past two decades, the volume and composition of international capital flows have changed altogether. While the official capital5 flowing to the developing countries has dwindled, the share of private capital flows has increased manifold. The net private capital flows reached an all time high of $358 billion in 2005 (IMF). Within the capital flows, the quantum of short-term capital flows6 has increasingly become important. But their sudden reversals have raised many doubts. However, the experience of East Asian and Latin American crisis has raised doubts regarding the viability of the capital market liberalization. The critics like
2 Demetriades P and S. Andrianova (2003) present a selected review of the empirical literature on the relationship between financial development and economic growth. 3 McKinnon and Shaw argued that interest rate ceiling, high reserve ratio and directed credit programmes are the source of financial repression which necessarily results in low savings, credit rationing, low investment and over all low growth. Removing interest rate ceilings, reducing reserve requirements and abolishing priority lending and freeing the domestic financial system was seen as critical in delivering financial development and, consequently more growth. 4 Cho (1986) argued that that to achieve efficient resource allocation, credit markets need to be supplemented by a well functioning equity market. This is because, unlike bank borrowings, equity finance is not subject to adverse selection and moral hazard effects under the conditions assumed. Cho, therefore, concluded that substantial development of equity markets is essential for successful financial liberalisation. 5 Official development assistances to developing countries. 6 Short-term capital flows includes portfolio flows, short-term international loans, commercial borrowings, NRI deposits etc.
Stiglitz7 are of the opinion that capital market liberalization produces instability and not growth and hence argued for intervening in short-term capital flows.
Of late, the institutionalization of savings by institutional investors8 in majority of developed countries acted as source for the short-term portfolio flows. Coupled with this, the low rates of returns also resulted in the export of financial savings from these developed nations. As the assets of institutional investors expanded, their diversification strategies increasingly resulted in an expansion of cross-border investments, especially to emerging markets9, which had high rates of return and was mainly in the form of equity finance. These portfolio investments have always been subject to controversies in terms of their motives, desirability, their impact on the domestic economy and stock market and their influence on domestic policy making. Presently the world’s portfolio flows’ stands at about US $ 60 billion10. Today India is a major recipient of world portfolio flows (Patnaik, 2005).
The increased relevance for the speculative capital flows arises firstly from the ongoing financial market liberalization in most of the developing countries. The dismantling of capital controls in many of the developing countries made it possible for the institutional investors from developed countries to invest in these emerging markets where previously they were restricted to invest. Currently, investors in major developed countries invest less than one percent of their assets in emerging markets. A one percent increase in this allocation corresponds to net capital flows of more than $120 billion11. Together with this, the 1990s saw an explosion in the global derivatives market. Financial derivatives became an important factor in the growth of cross-border capital flows, including emerging markets.
However, the portfolio capital is often characterised by several asymmetries like spread of information12, volatility, aiming for short-term profits and investment strategies often depending upon the rating agencies. Owing to these asymmetries, boom-bust cycles13 of capital flows have been particularly damaging for developing countries, where they both directly increase macroeconomic instability and reduce the room for maneuvers to adopt counter-cyclical macroeconomic policies, and generate strong biases towards adopting pro-cyclical macroeconomic policies14. Furthermore, there is now overwhelming evidence that pro-cyclical financial markets and pro-cyclical macroeconomic policies have not encouraged growth and, on the contrary, have increased growth volatility in those developing countries that have integrated to a larger extent into international financial markets15.
7See Stiglitz (2000), where he identifies the empirical and theoretical weakness of capital market liberalisation. He strongly argues for intervention in short-term capital flows. 8Pooled funds held by pension funds, life insurance companies, mutual funds and investment trusts as repositories for the majority of savings. 9 The term emerging markets is commonly used to describe business and market activity in industrializing or emerging regions of the world. Originally brought into fashion in the 1980s by then World Bank economist Antoine van Agtmael. 10 Report on Currency and Finance, RBI, 2005. 11 See Rene M. Stulz (1999). At present this can be of a larger dimension depending upon the size and shape. 12 Stiglitz, (2000) owing to the non-existence or the large asymmetries of information, financial agents rely to a large extent on the “information” provided by the actions of other market agents, leading to interdependence in their behavior, i.e., contagion and herding. 13 Refers to the movement of the economy through economic cycles due to changes in aggregate demand. 14 Kaminsky et al, 2004; Stiglitz and others, 2005 15 Prasad et al, 2003.
The major reason attributed to the cross border investments of institutional finance other than the differentials in the rate of return, is the gains accruing from the inter-temporal trade of capital. Transactions involving time naturally pose opportunities of returns, from changes in exchange rates and asset prices16. Since the basic motive of these flows is profit, they are always susceptible to sudden withdrawals. This is why these flows are often referred to as butterfly capital or hot capital17. This raises doubts regarding the sustainability of these types of capital flows for emerging economies. Moreover the inherent features of the emerging markets like the depth, size and development of domestic financial and capital market, also adds to the problems of the capital importing developing countries.
This happens at a time when most of our capital controls are dismantled. Experiences have shown that, capital market liberalization is most often preceded by surges in capital flows and crisis. There is consensus regarding the role of short-term flows in precipitating financial crisis. At present, the share of short-term flows in India’s capital account has risen tremendously, which itself has a greater macroeconomic implication. Now together with the debate of fuller capital account convertibility, the need for liberalizing portfolio flows has to be constructive. There are criticisms regarding the recommendations of the committee’s on capital account convertibility regarding its empirical soundness and is often considered guided by policy makers preferences and judgments. A better empirical understanding regarding the motives behind these types of flows, especially foreign portfolio flows also is helpful in framing appropriate policies. Also there is a severe need to understand the present degree of openness towards portfolio flows; since this can be helpful in the debates of capital account convertibility. This study tries to address these issues in detail
The Indian Experience
Indian equity markets joined the internationalization18 of capital markets with the opening up of the country’s securities market in 1992 to the direct participation of Foreign Institutional Investors. They were allowed to invest in all securities traded on primary and secondary markets, including the equity and other securities/ instruments of companies which were being listed /to be listed on the stock exchanges in India. In addition to this, Indian firms were allowed to raise funds from abroad by floating GDRs and ADRs. India has cautiously opened up its capital account since then and the state of capital controls in India today can be considered as the most liberalised it has ever been in its history since the late 1950s19.
The round of economic reforms in response to the balance of payments crisis in 1991 led to the publication of the Report of the Committee on Capital Account Convertibility in 1997. This report outlined the plan for achieving full capital account convertibility20 but
16 While the regime of floating exchange rate always bestows the opportunity of returns (price differential) from transactions involving foreign currency at different time points, the capital market provides scope of returns in the form asset price changes. 17 This are funds which flows into the country to take advantage of the favorable high returns in the domestic economy. These flows are volatile in nature since they are susceptible of moving avenues once the conditions reverse in the host country or even conditions becomes more favorable in another country. 18 Integrating the domestic capital markets with global capital markets. 19Report of the Committee on Fuller Capital Account Convertibility (FCAC), July 2006, RBI. 20 Capital Account Convertibility refers to the freedom to convert local financial assets into foreign financial assets and vice versa. It is associated with changes of ownership in foreign/domestic financial
had set several preconditions to be achieved in a span of three years21. Ironically, the report appeared on the eve of the East Asian financial crises. The issue of capital account convertibility in developing countries became more controversial in the wake of the Asian crises, and the absence of contagion effects on the Indian economy during these crises was taken as affirmation of the wisdom of India’s controls on outward capital flows (Kletzer, 2004).
However the liberalization of inward capital flows to the Indian economy has continued in the last few years, and the prospects for further capital account liberalization appear to be improving again after observing that the economy has posted impressive gains in the external sector22. Lately, the need for fuller capital account convertibility has been voiced by the Prime Minister23. His request to revisit the subject and come up with a roadmap has thus resulted in the setting up of the committee under the chairmanship of S.S Tarapore24. The report of the committee was submitted on July, 2006. The report recommended a five year time period for successfully implementing the road map towards fuller capital account convertibility. However, there have been criticisms from within the committee regarding the empirical validity of the recommendations of the report.
This brings to prominence the need for understanding the underlying nature of each of the financial flows before effecting the removal of restrictions in the Indian scenario. This seems to be true in the case of foreign portfolio flows. In a situation of increased importance of foreign portfolio flows in the capital account, it is of grave importance to understand the basic motives inspiring the foreign portfolio flows to India25. This study is an attempt in that direction.
Literature Review
As noted earlier, it was McKinnon (1973) and Shaw (1973) who firstly highlighted the need for liberalizing the financial sector against government interventions in the form of interest rate ceilings, high reserve requirements and directed credit programmes; for augmenting growth. Demetriades and Andrianova (2003) presents a reading of the McKinnon Shaw (M-S) hypothesis and this shows that M-S arguing for removing interest rate ceilings, reducing reserve requirements and abolishing priority lending–freeing the domestic financial system as critical in delivering financial development and, consequently more growth. In their seminal paper, Stiglitz and Weiss (198I) showed that under imperfect information, because of the 'adverse selection' and 'incentive' effects, credit-rationing may not just be due to financial repression but could also arise from the normal competitive operations of the credit markets. Accepting this criticism, M-S school therefore suggests that credit rationing reduces economic growth only if the 'financially
assets and liabilities and embodies the creation and liquidation of claims on, or by, the rest of the world. CAC can be, and is, coexistent with restrictions other than on external payments. 21 This committee was chaired by Tarapore and was hence known as Tarapore Committee (1997). The Tarapore committee recommended several preconditions for embarking upon capital account liberalisation. The requirements pertained to reduction in the fiscal deficit, maintaining a moderate inflation and reduction in key monetary variables like cash reserve ratio and the non-performing assets. 22 This was with respect to the rise in the investment and foreign exchange reserves. 23 In a speech delivered at the Reserve Bank of India, Mumbai on March 18, 2006. 24 Report of the Committee on Fuller Capital Account Convertibility (FCSC), July 2006, RBI. 25 Presently the foreign portfolio flows occupies a significant share in the nation’s capital account and in the GDP (RBI).
repressed' interest rate is below the competitive equilibrium credit-rationing rate. Cho (1986) showed analytically that to achieve efficient resource allocation, credit markets need to be supplemented by a well functioning equity market. This is because, unlike bank borrowings, equity finance is not subject to adverse selection and moral hazard effects under the conditions assumed. Cho, therefore, concluded that substantial development of equity markets is essential for successful financial liberalisation.
However, the voluminous literature in this area has shown inconclusive evidence of financial liberalisation affecting growth and is always associated with crises in developing countries26. Even, McKinnon (1991) was in favour of the sequencing of the liberalisation measures. He was of the opinion that, incorrect sequencing was the root cause of the financial crisis, and argued that financial sector reforms should always precede real sector reforms. Sen (2004) also confirms to this view by saying that, the boom in finance related activities has most often failed to infuse expansions in the real share of economies.
The case for capital market liberalisation was put by Fisher. Fischer suggests that, at a theoretical level, capital account liberalisation would lead to global economic efficiency, allocation of world savings to those who are able to use them most productively, and would thereby increase social welfare. Citizens of countries with free capital movements would be able to diversify their portfolios and thereby increase their risk-adjusted rates of return. It would enable corporations in these countries to raise capital in international markets at a lower cost. It is suggested, moreover, that such liberalisation leads to further development of a country's financial system, which in turn is thought to enhance productivity in the real economy by facilitating transactions and by better allocation of resources27.
Singh (1997) concentrates on one of the short-term components of capital flows called foreign portfolio flows in the context of Latin American economies and presents the following argument. Although at a microeconomic level, the portfolio inflows helped generate the stock market boom, he quotes Rodrik (1994) and Krugman (1995) to point out these portfolio flows to Latin America were not responding to fundamentals but represented a misplaced euphoria and a 'herd' instinct. They agues that even though the macroeconomic fundamentals of these countries were week, flow continued till the crisis broke out, which in fact had a very destabilizing effect on the growth of the economy. He further argues that portfolio capital was recommended to developing countries for being less vulnerable to external interest rate shocks than debt. However, in practice these inflows can be destabilizing to the real economy if external financial liberalisation is carried out in 'dis-equilibrium' conditions in the economy. Since the structural characteristics of developing countries makes them subject to more external and internal shocks than advanced economies, many of these unfavorable outcomes are likely to prevail even under 'normal' conditions, and even if there were a correct 'sequencing' of financial reforms.
Stiglitz (2000) offers insights into the financial crisis of 90’s as well as on other recent crises, including Russia and Latin America. He suggests that premature financial and capital market liberalisation was at the root of these crises. He also suggests that global economic arrangements are fundamentally weak. His analysis of why capital market
26 Prasad et al (2003) 27 As reviewed from Ajith Singh (2000)
liberalisation produces instability, not growth, identifies the following fallacy in the pro-liberalisation arguments, namely that ‘financial and capital markets are essentially different from markets for ordinary good and services’28. He also argues that capital flows are pro-cyclical; therefore the argument that the opening of capital markets would allow diversification and enhance stability is deficient. Finally, he challenges the notion that any destabilizing effects emanating from capital account liberalisation are transitory, while the benefits are permanent, by alluding to a vast econometric literature, which suggests that shocks to output can be long-lasting. Stiglitz emphasizes the destabilizing influence of short-term capital flows in his analysis, arguing that there is a fairly compelling case against full liberalization and stresses for the effective designing of interventions against short-term capital flows.
Rangarajan (2000) addresses the question of preferability of some forms of capital flows to others, from the angle of volatility and capital formation. In the after math of the Asian crisis he has tried to look in to the extent and forms of controls to be exercised on capital flows. To him, the opening up of capital account need not preclude the imposition of moderate controls either price based or regulatory on capital flows. He argues for selective controls designed to achieve the specific objective of containing speculative flows and comments upon the fact that capital account liberalization should be done in stages.
The Indian literature of capital account liberalisation officially as mentioned earlier, started with the Report on the Committee on Capital Account Convertibility in 1997. This report outlined India’s roadmap to achieve capital convertibility in a span of three years. But the recommendations of this report were criticized for its lack of good data base, sound empirical methodology and testing and analytics29. Vasudevan (2006) argues that the report was substantially implemented. Now, that a second committee is set up to revisit the theme and recommend the path towards fuller capital account convertibility it is necessary to understand the empirical validity of liberalisation carried out so far. Vasudevan further expects that the recommendations of this committee will be theoretically sound and the realism behind the road map will be empirically established. But the validity of the report has been questioned in the backdrop of the criticisms from within the committee. Members like A.V.Rajwade and S.S Bhalla have openly questioned the empirical substance of the report.
In this context, a study to empirically analyse the basic characteristics of the capital flows is necessitated. This work is an attempt in that direction and will be focusing only on the foreign portfolio flows.
Objectives of the Study
The major aim of the study is to analyze the basic motives underlying one of the capital flows; i.e., the foreign portfolio flows to India, in the context of greater capital account convertibility. As it is essential to understand the present scenario of the capital account since the introduction of reforms, the first objective is
• To provide an overview regarding the trends in capital account and various related monetary and financial indicators since the reform period.
28 This view was also raised by the staunch supporter of free trade like, Bhagavati. 29 Vasudevan, (2006).
Earlier studies have measured the financial openness as an aggregate of all financial flows. Attempts to separate out openness with regard to each of the financial flows are virtually rare. The study also wants to raise the question of the present nature of the openness of our economy with regard to portfolio flows. This is necessary since it provides a true picture of the nature of reforms and sequencing carried out with regard to these flows.
Therefore the second objective is to
• Measure the present openness towards foreign portfolio flows in the Indian context.
It is necessary to understand the basic motivation for the flow of foreign portfolio flows to India. Finally, the core objective is
• To identify the significant motive behind the flow of portfolio capital to India, i.e to examine whether foreign portfolio flows to India is led by income gain or capital gain motive.
Data and Methodology
In order to focus more deeply into the issue of foreign portfolio flows into India, one has to understand the basic nuances underlying the capital account transactions in the balance of payments account of the country. So, before moving onto the methodology of analysing the basics that motivate the foreign portfolio flows into India and estimating the present status of openness towards these flows a broad outline regarding the capital accounts will be provided. Data are available in monthly, quarterly and annual basis from the Reserve Bank of India, India’s central bank regarding all balance of payments transactions. Information regarding the capital account, the foreign portfolio flows, the various components of foreign portfolio flows, other monetary indicators which are essential for this study is available with the Reserve Bank of India website and its publications30. The data regarding the number of foreign institutional investors in the Indian security markets and the country wise origin is available with the Securities and Exchange Board of India (SEBI)31.
For examining the second objective of measuring the degree of openness of the portfolio flows, following Quinn a measure based on the official restrictions on portfolio flows is developed. This binary indicator will capture the degree of openness of controls or extend of liberalisation. For the calculation of the qualitative variable; i.e. the index of openness of portfolio flows the de-regulating measures is available in a chronological order with various issues of the Annual reports of the RBI32.
Finally the basic motives underlying the foreign portfolio flows are estimated. The idea is to understand which motive influences the foreign portfolio flows most significantly. Is it the income gains motive or is it the capital gains motive, in the Indian context? This
30 Data is available for the RBI publications like Annual Reports, Handbook of Statistics on the Indian Economy and Report on Currency and Finance. 31 The information regarding the origin of FII’s is in alphabetical order and shows the places where they have registered. It requires data mining to disaggregate into country wise composition of FII’s. 32 Kohli (2005) from the various Annual reports has also provided a chronological order of the liberalizing measures pertaining to the various forms of capital flows in the capital account till 2001.
can provide clues regarding the true nature of these flows. For example those flows that are primarily driven by income motive33 is said to be stable and long-term in nature because they will be attracted by the differences in the rate of return. On the other hand, if these flows are driven by the capital gains motive34, then these flows will be short-term in nature. For understanding the motives, causality tests and regression analysis involving the foreign portfolio flows, stock prices, exchange rates and interest rate differential will be carried out. The proposed method is to analyse the determinants of foreign portfolio flows. While data regarding the foreign portfolio flows, exchange rates, interest rates and inflation is available from the various publications of the Reserve Bank of India, information regarding the stock prices35 is available with the BSE. This information is also available online. The Reserve Bank of India provides most of the data including the Balance of Payment statistics in an annual, quarterly, monthly, fortnightly and weekly basis. However the non-availability of data on capital flows in less than quarterly frequency is a problem for data analysis.
Organization of the work
The first and second objectives of the study are done in the next section. Before touching upon the actual openness to foreign portfolio flows from the data and subsequently measuring the openness from the measures, time will be devoted to represent the internationalization of finance followed by internationalization of the Indian capital markets. The issue for developing a suitable measurement of openness towards portfolio flows is dwelt in detail. This section measures the openness towards foreign portfolio flows and computes an index from the de-regulating measures following Quinn’s methodology in the Indian context.
Analysing the third and the core objective is done in the last section. Before the econometric analysis, the theoretical underpinnings related to the capital mobility are discussed. The focus is to understand the basic motives underlying these flows. Econometric analysis is done to understand the true nature of portfolio flows into India.
2. Process of Internationalization of Indian Capital Market
The report of the High-level Committee on Balance of Payments (BOPC), 1993 marks the origins of capital account liberalization in India. This report reviewed the existing policies with respect to foreign investment, external aid and commercial borrowings, exchange rates, foreign exchange reserves, and the balance of payments in the light of the 1991 crisis. The central objectives of the policy according to the report were to prevent the occurrences of crisis in the future, bring foreign exchange via foreign investments rather that foreign debt and assistance and to reduce the emphasis on expensive sources of external financing like the NRI deposits. In fact, a major policy departure was the decision to phase out the favorable interest rate differentials and exchange risk guarantees. The key elements of the report of the High-level Committee on Balance of Payments can be summarized as follows; preference for foreign investments over foreign aid or debt, strict monitoring and reduction in both the borrowings for private commercial purposes and with respect to NRI deposits.
33 This is to be captured by the interest rate differential between India and the rest of the world. 34 Gains from the inter-temporal trade involving currency and assets. 35 The sensitivity index of the Bombay Stock Exchange (BSE).
All these measures can be considered as a conscious post crisis response to restructure the capital account rather than liberalizing the capital account as such36. Even though a complete strategy towards liberalizing capital account was considered absent, some deregulating measures like allowing foreign institutional investment into the Indian equity markets were taken. In the Indian case, portfolio flows were allowed within a year of liberalisation in the FDI. But reforms in the area of foreign portfolio flows can however be considered as a major departure from the commonly observed pattern, because reforms in portfolio investments usually takes place at a later stage, particularly after the domestic financial markets were developed. However, this was justified on the view that our capital markets were sufficiently developed than most of the developing countries. A comprehensive policy outlining the course of capital account convertibility was however brought into light by the committee appointed the RBI in 1997 under the chairmanship of S.S Tarapore.
Capital Account Convertibility
The Tarapore Committee’s Report 1997 details a planned roadmap towards Capital account convertibility. The Tarapore committee recommended several preconditions for embarking upon capital account liberalisation and set out a three year programme for meeting these essential preconditions. These requirements pertained to reduction in the fiscal deficit, maintaining the inflation at a moderate level (3 to 5 percent) and reduction in key monetary variables like cash reserve ratio and the non-performing assets. The committee taking cue from the various international financial crises also identified four attendant variables, the current account deficit, the Real Effective Exchange Rate (REER) monitoring brand, the foreign exchange reserves and the domestic financial system37. However the timing of the report in the wake of the Asian crisis delayed its implementation and has resulted in a more cautious approach towards capital account convertibility. The liberalisation of the capital account progressed in a gradualistic approach since then.
The pattern of reforms carried out in the capital account was summarized by Reddy (2000) as follows. He notes that capital account liberalisation in India followed a distinct and asymmetric pattern. It distinguished between inflows, outflows associated with inflows, and other outflows; these have been correspondingly less restricted, completely free and more restricted. Secondly, discriminatory treatment was accorded between residents and non-residents, who have been respectively more and less restricted. Finally he notes the hierarchical approach towards individuals, corporates, and financial intermediaries such as institutional investors and banks. These have been correspondingly highly restrictive, restrictive, less restrictive and more restrictive. In general, the deregulation of every control has progressed from outright prohibition to an intermediate status (prior approval on individual case or automatic basis) to total freeing of the related transactions. Many transactions have also relied upon gradual increases in the size of the transaction or purpose activity or parties concerned. But comparatively the Indian experience with capital account liberalisation in a sense, that these gradual reforms were also cautious. What was liberalised was specified. Everything else remained restricted or prohibited38.
What have been presented constitutes only a broad outline on liberalisation carried out in the capital account. However given the focus of this study there is a need to provide a
36 Kohli, (2005). 37 Tarapore, S.S, (1998). 38 Nayyar, (2003) notes that this was in fact the opposite of the more common approach to capital account liberalisation, elsewhere in which restricted or prohibited transactions were specified while everything else was liberalised
clear cut picture regarding the portfolio component of the foreign investment flows. This is also important in the light of its dominant share in total capital flows into India.
Liberalizing Foreign Portfolio flows into India
Even though there were concerns regarding the volatility of portfolio flows, this reality does not seem to have exercised any influence on the mix of capital account liberalisation and controls in India39. The liberalisation policy regime for portfolio flows begun in September 1992, with the opening up of domestic capital market to foreign institutional investors subject to registration with the SEBI40. Similar access was provided to foreign institutional investors in the secondary market for debt. Soon thereafter foreign institutional investors were also allowed investment or placement in the primary market, subject to approval from the reserve bank of India with a maximum limit of 15 percent of the new issue. Later foreign institutional investors were permitted to invest in government securities in the primary and secondary markets. This was done in 1996-97 and was treated as part of the overall limit on external commercial borrowing. Subsequently, in 1998-99, foreign institutional investors were also permitted to invest in treasury bills. The option of portfolio investment was also made available to domestic corporate entities from September 1992. Indian firms were allowed access to international capital markets through Global Depository Receipts or Euro convertible bonds which converted debt into equity after a stipulated period. However, the reforms in the portfolio flows also followed a distinct and asymmetric treatment as noted by Reddy41. Overall, it can be seen that most of the channels have been liberalised but restrictions in the form of quantitative controls is still persisting.
One and a half decade into reforms, it now becomes essential to understand the trajectory of capital market liberalisation carried out in India. It is also essential to understand whether the objectives for internationalization of the capital market, formalized as a response to the 1991 crisis have been achieved. For this, it is important to understand the composition and trends in India’s capital account in the post reform scenario.
Emphasis on Non-debt creating flows
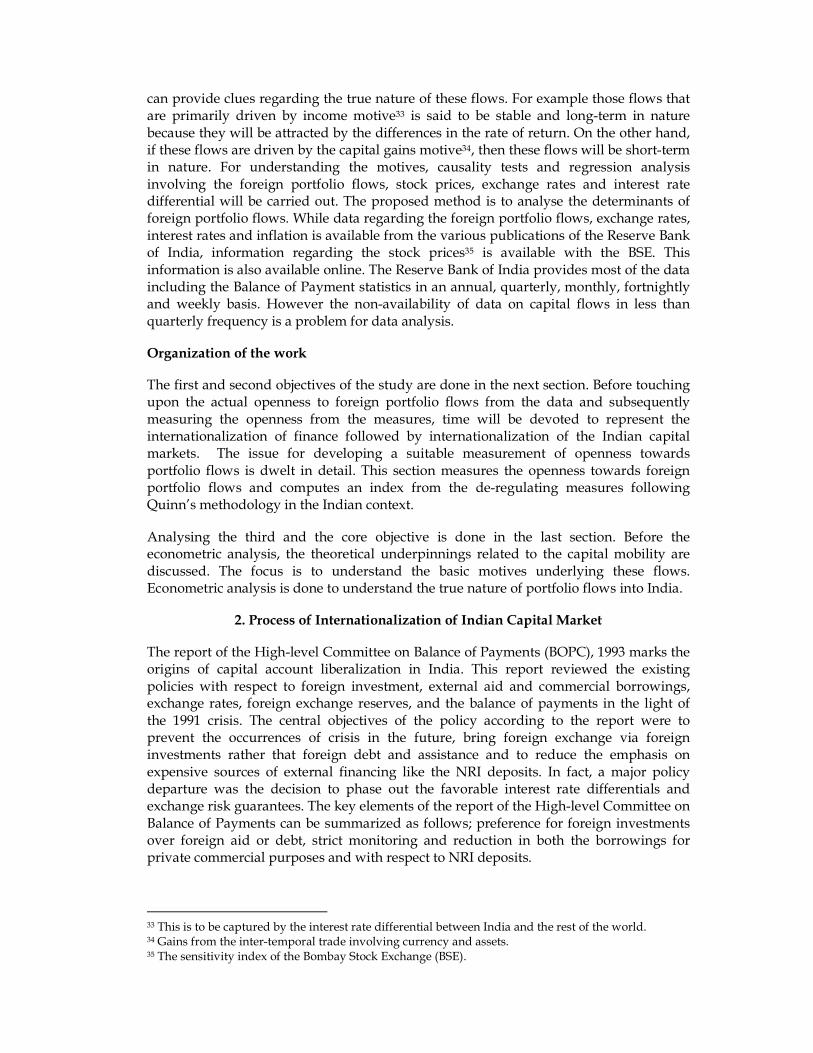
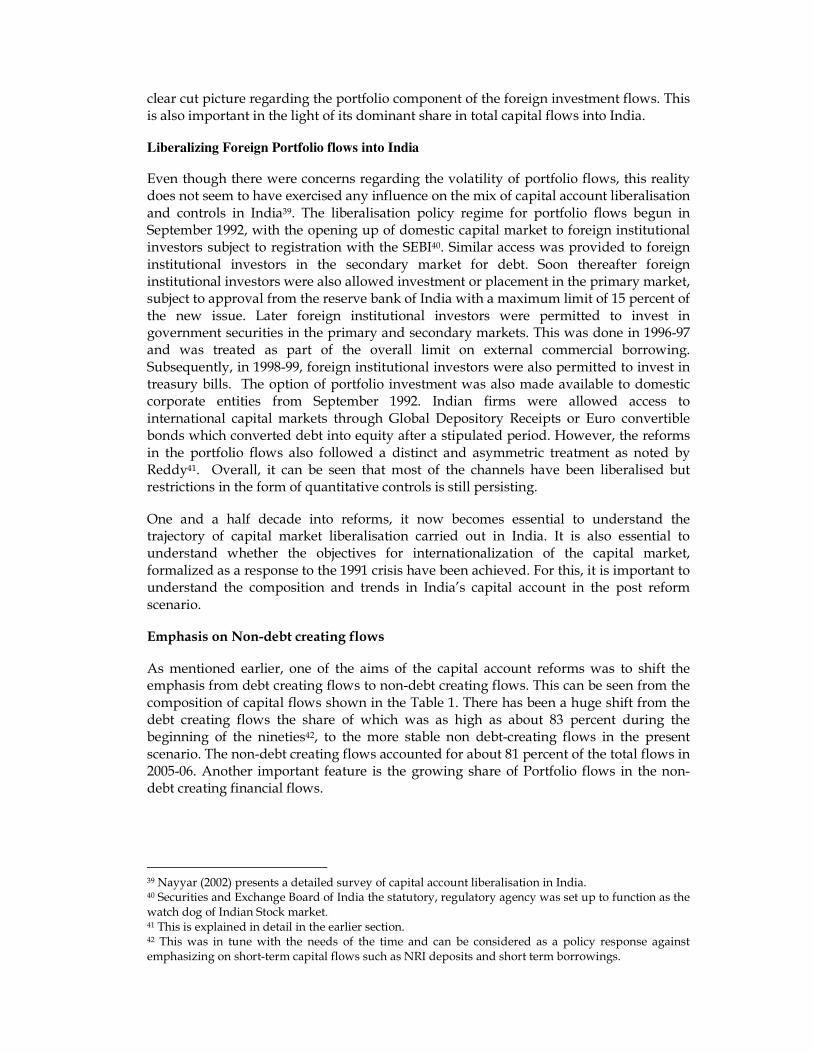
As mentioned earlier, one of the aims of the capital account reforms was to shift the emphasis from debt creating flows to non-debt creating flows. This can be seen from the composition of capital flows shown in the Table 1. There has been a huge shift from the debt creating flows the share of which was as high as about 83 percent during the beginning of the nineties42, to the more stable non debt-creating flows in the present scenario. The non-debt creating flows accounted for about 81 percent of the total flows in 2005-06. Another important feature is the growing share of Portfolio flows in the non- debt creating financial flows.
39 Nayyar (2002) presents a detailed survey of capital account liberalisation in India. 40 Securities and Exchange Board of India the statutory, regulatory agency was set up to function as the watch dog of Indian Stock market. 41 This is explained in detail in the earlier section. 42 This was in tune with the needs of the time and can be considered as a policy response against emphasizing on short-term capital flows such as NRI deposits and short term borrowings.
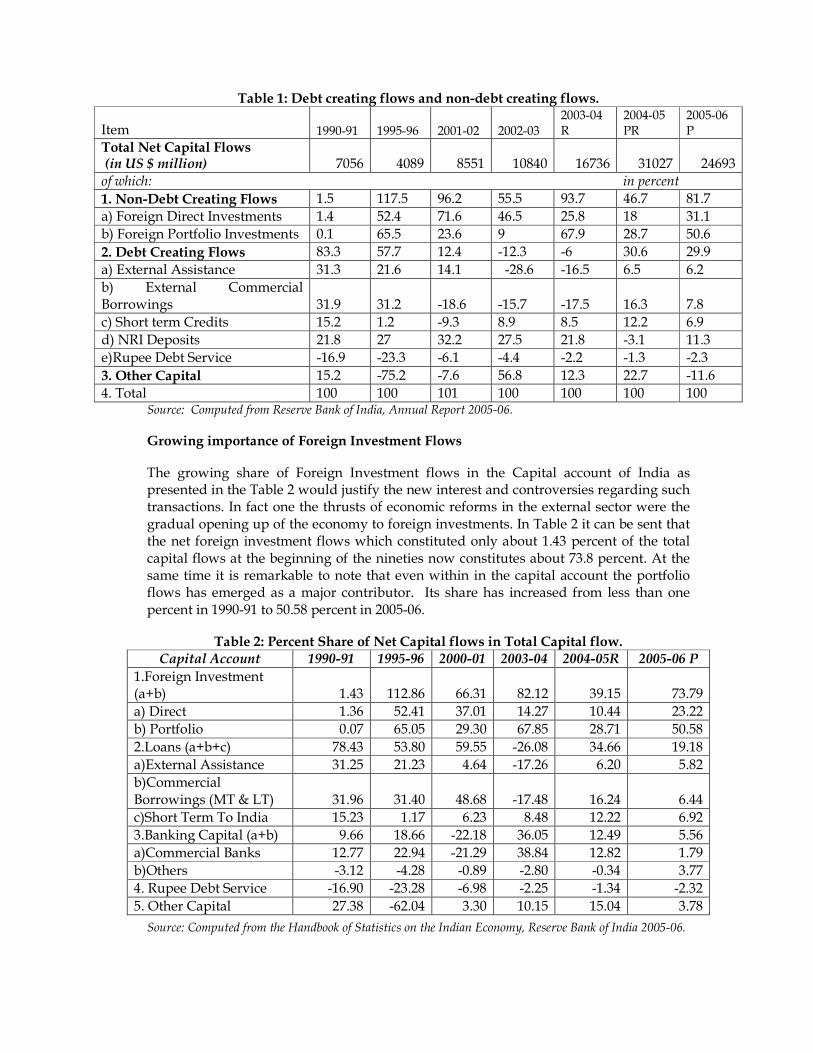
Table 1: Debt creating flows and non-debt creating flows.
Item 1990-91 1995-96 2001-02 2002-03 2003-04 R
2004-05 PR
2005-06 P
Total Net Capital Flows (in US $ million) 7056 4089 8551 10840 16736 31027 24693 of which: in percent
1. Non-Debt Creating Flows 1.5 117.5 96.2 55.5 93.7 46.7 81.7 a) Foreign Direct Investments 1.4 52.4 71.6 46.5 25.8 18 31.1 b) Foreign Portfolio Investments 0.1 65.5 23.6 9 67.9 28.7 50.6
2. Debt Creating Flows 83.3 57.7 12.4 -12.3 -6 30.6 29.9
a) External Assistance 31.3 21.6 14.1 -28.6 -16.5 6.5 6.2 b) External Commercial Borrowings 31.9 31.2 -18.6 -15.7 -17.5 16.3 7.8 c) Short term Credits 15.2 1.2 -9.3 8.9 8.5 12.2 6.9 d) NRI Deposits 21.8 27 32.2 27.5 21.8 -3.1 11.3 e)Rupee Debt Service -16.9 -23.3 -6.1 -4.4 -2.2 -1.3 -2.3
3. Other Capital 15.2 -75.2 -7.6 56.8 12.3 22.7 -11.6 4. Total 100 100 101 100 100 100 100
Source: Computed from Reserve Bank of India, Annual Report 2005-06.
Growing importance of Foreign Investment Flows
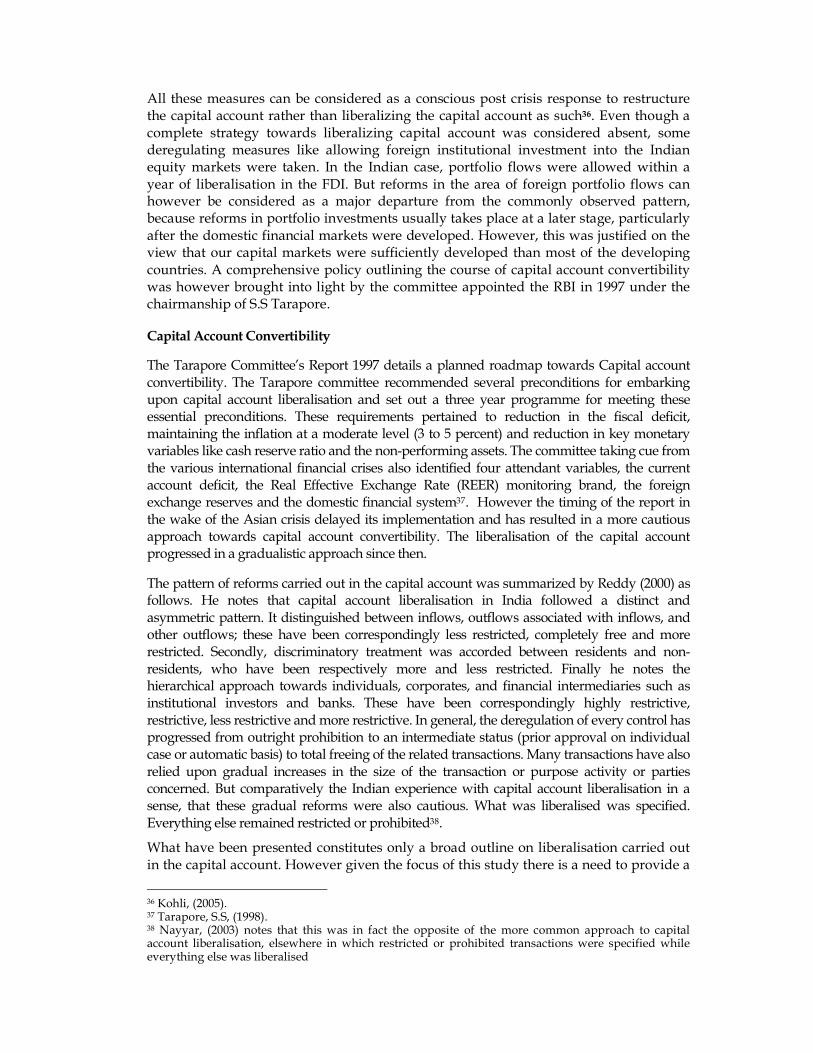
The growing share of Foreign Investment flows in the Capital account of India as presented in the Table 2 would justify the new interest and controversies regarding such transactions. In fact one the thrusts of economic reforms in the external sector were the gradual opening up of the economy to foreign investments. In Table 2 it can be sent that the net foreign investment flows which constituted only about 1.43 percent of the total capital flows at the beginning of the nineties now constitutes about 73.8 percent. At the same time it is remarkable to note that even within in the capital account the portfolio flows has emerged as a major contributor. Its share has increased from less than one percent in 1990-91 to 50.58 percent in 2005-06.
Table 2: Percent Share of Net Capital flows in Total Capital flow. Capital Account 1990-91 1995-96 2000-01 2003-04 2004-05R 2005-06 P
1.Foreign Investment (a+b) 1.43 112.86 66.31 82.12 39.15 73.79 a) Direct 1.36 52.41 37.01 14.27 10.44 23.22 b) Portfolio 0.07 65.05 29.30 67.85 28.71 50.58
2.Loans (a+b+c) 78.43 53.80 59.55 -26.08 34.66 19.18 a)External Assistance 31.25 21.23 4.64 -17.26 6.20 5.82 b)Commercial Borrowings (MT & LT) 31.96 31.40 48.68 -17.48 16.24 6.44 c)Short Term To India 15.23 1.17 6.23 8.48 12.22 6.92 3.Banking Capital (a+b) 9.66 18.66 -22.18 36.05 12.49 5.56 a)Commercial Banks 12.77 22.94 -21.29 38.84 12.82 1.79 b)Others -3.12 -4.28 -0.89 -2.80 -0.34 3.77 4. Rupee Debt Service -16.90 -23.28 -6.98 -2.25 -1.34 -2.32
5. Other Capital 27.38 -62.04 3.30 10.15 15.04 3.78
Source: Computed from the Handbook of Statistics on the Indian Economy, Reserve Bank of India 2005-06.
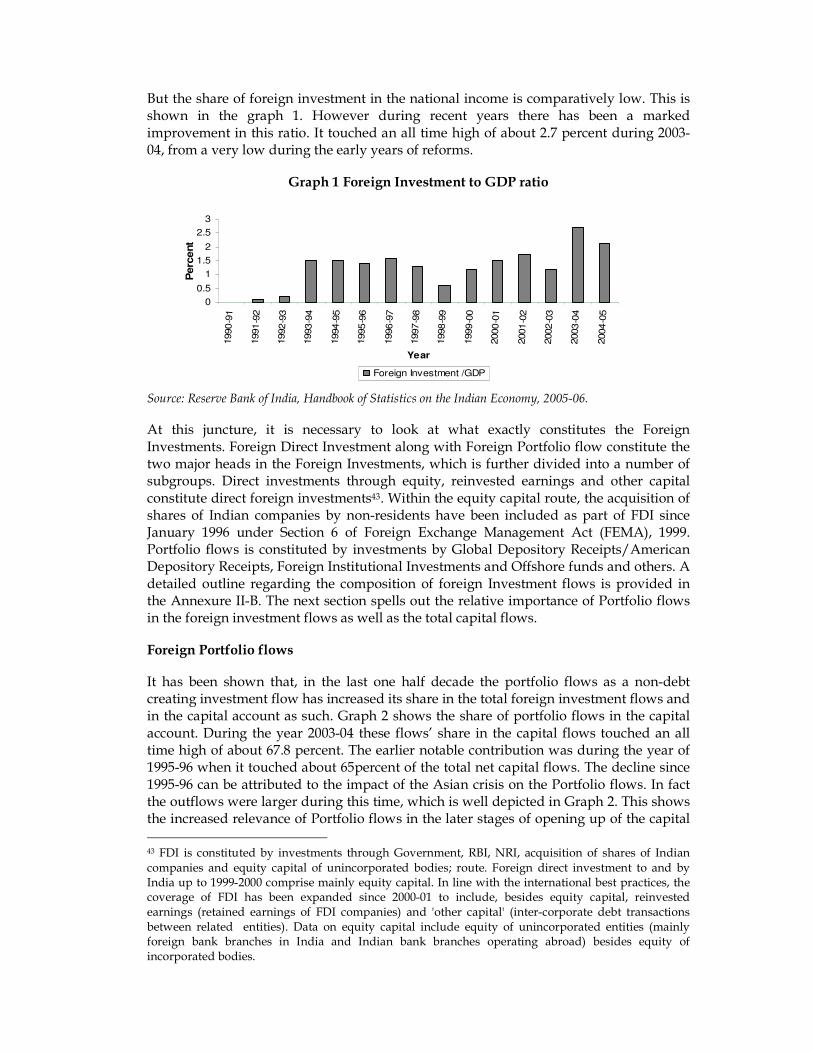
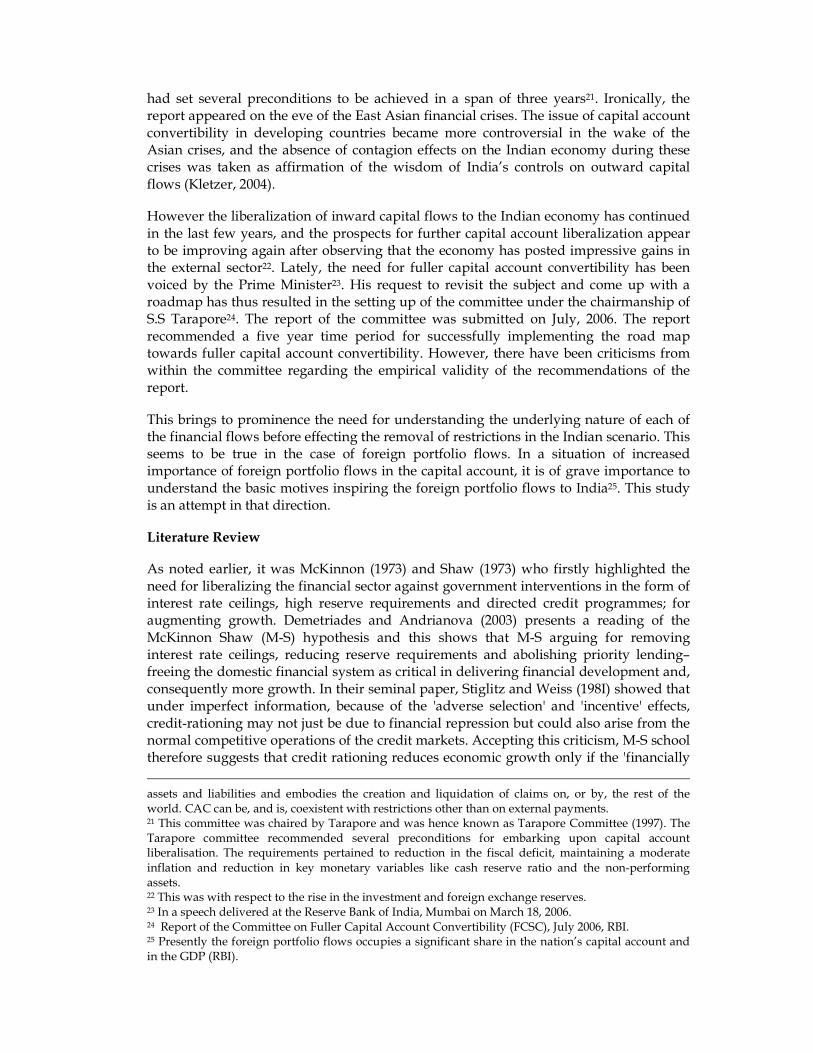
But the share of foreign investment in the national income is comparatively low. This is shown in the graph 1. However during recent years there has been a marked improvement in this ratio. It touched an all time high of about 2.7 percent during 2003-04, from a very low during the early years of reforms.
Graph 1 Foreign Investment to GDP ratio
0
0.5
1
1.5
2
2.5
31990
-91
1991
-92
1992
-93
1993
-94
1994
-95
1995
-96
1996
-97
1997
-98
1998
-99
1999
-00
2000
-01
2001
-02
2002
-03
2003
-04
2004
-05
Year
Percent
Foreign Investment /GDP
Source: Reserve Bank of India, Handbook of Statistics on the Indian Economy, 2005-06.
At this juncture, it is necessary to look at what exactly constitutes the Foreign Investments. Foreign Direct Investment along with Foreign Portfolio flow constitute the two major heads in the Foreign Investments, which is further divided into a number of subgroups. Direct investments through equity, reinvested earnings and other capital constitute direct foreign investments43. Within the equity capital route, the acquisition of shares of Indian companies by non-residents have been included as part of FDI since January 1996 under Section 6 of Foreign Exchange Management Act (FEMA), 1999. Portfolio flows is constituted by investments by Global Depository Receipts/American Depository Receipts, Foreign Institutional Investments and Offshore funds and others. A detailed outline regarding the composition of foreign Investment flows is provided in the Annexure II-B. The next section spells out the relative importance of Portfolio flows in the foreign investment flows as well as the total capital flows.
Foreign Portfolio flows
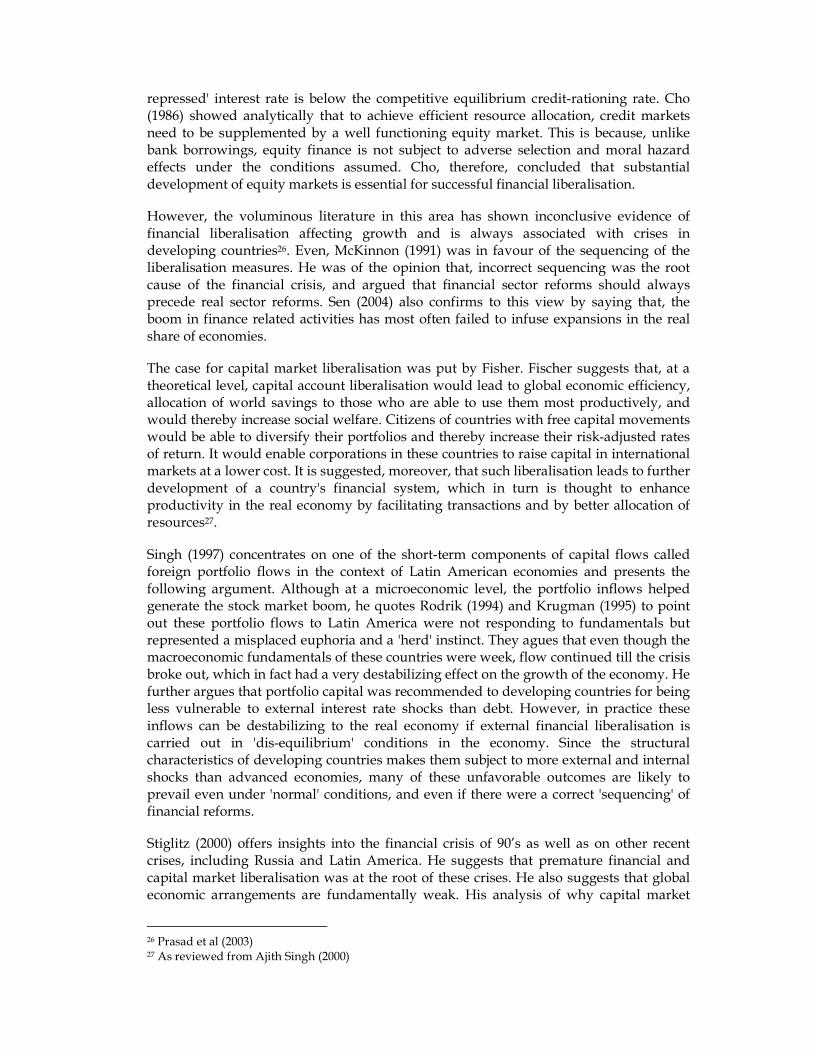
It has been shown that, in the last one half decade the portfolio flows as a non-debt creating investment flow has increased its share in the total foreign investment flows and in the capital account as such. Graph 2 shows the share of portfolio flows in the capital account. During the year 2003-04 these flows’ share in the capital flows touched an all time high of about 67.8 percent. The earlier notable contribution was during the year of 1995-96 when it touched about 65percent of the total net capital flows. The decline since 1995-96 can be attributed to the impact of the Asian crisis on the Portfolio flows. In fact the outflows were larger during this time, which is well depicted in Graph 2. This shows the increased relevance of Portfolio flows in the later stages of opening up of the capital
43 FDI is constituted by investments through Government, RBI, NRI, acquisition of shares of Indian companies and equity capital of unincorporated bodies; route. Foreign direct investment to and by India up to 1999-2000 comprise mainly equity capital. In line with the international best practices, the coverage of FDI has been expanded since 2000-01 to include, besides equity capital, reinvested earnings (retained earnings of FDI companies) and 'other capital' (inter-corporate debt transactions between related entities). Data on equity capital include equity of unincorporated entities (mainly foreign bank branches in India and Indian bank branches operating abroad) besides equity of incorporated bodies.
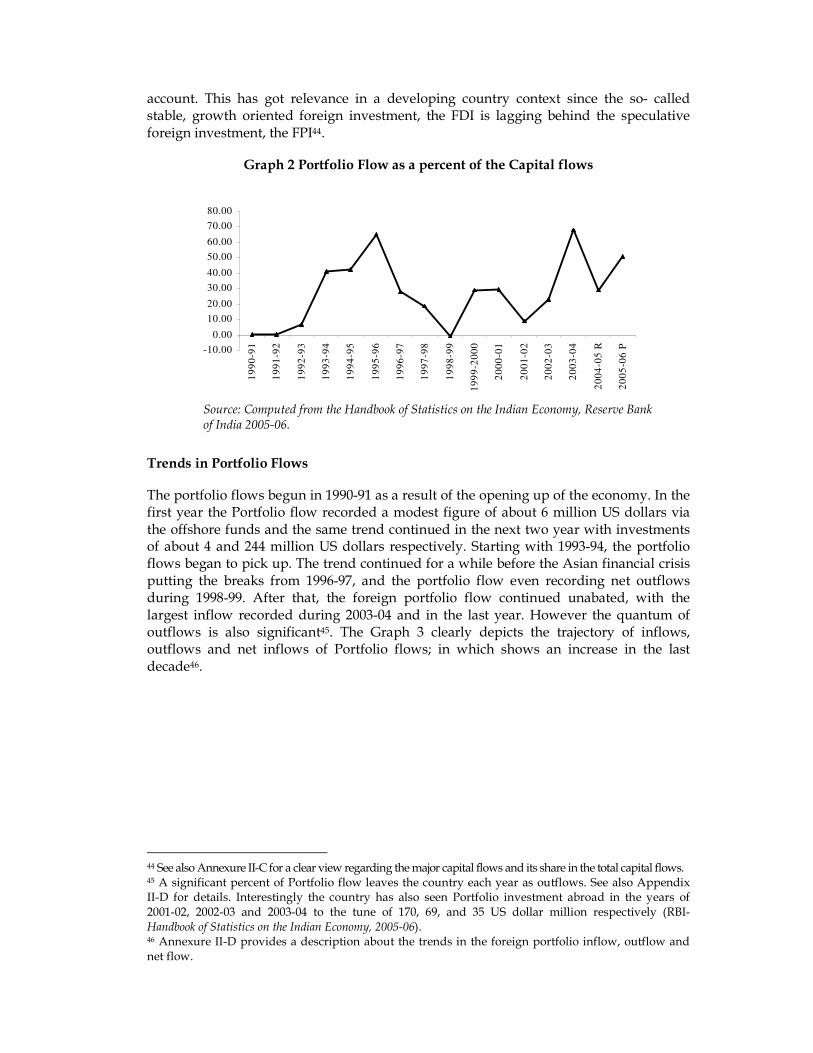
account. This has got relevance in a developing country context since the so- called stable, growth oriented foreign investment, the FDI is lagging behind the speculative foreign investment, the FPI44.
Graph 2 Portfolio Flow as a percent of the Capital flows
-10.00
0.00
10.00
20.00
30.00
40.00
50.00
60.00
70.00
80.00
19
90
-91
19
91
-92
19
92
-93
19
93
-94
19
94
-95
19
95
-96
19
96
-97
19
97
-98
19
98
-99
19
99
-20
00
20
00
-01
20
01
-02
20
02
-03
20
03
-04
20
04
-05
R
20
05
-06
P
Source: Computed from the Handbook of Statistics on the Indian Economy, Reserve Bank of India 2005-06.
Trends in Portfolio Flows
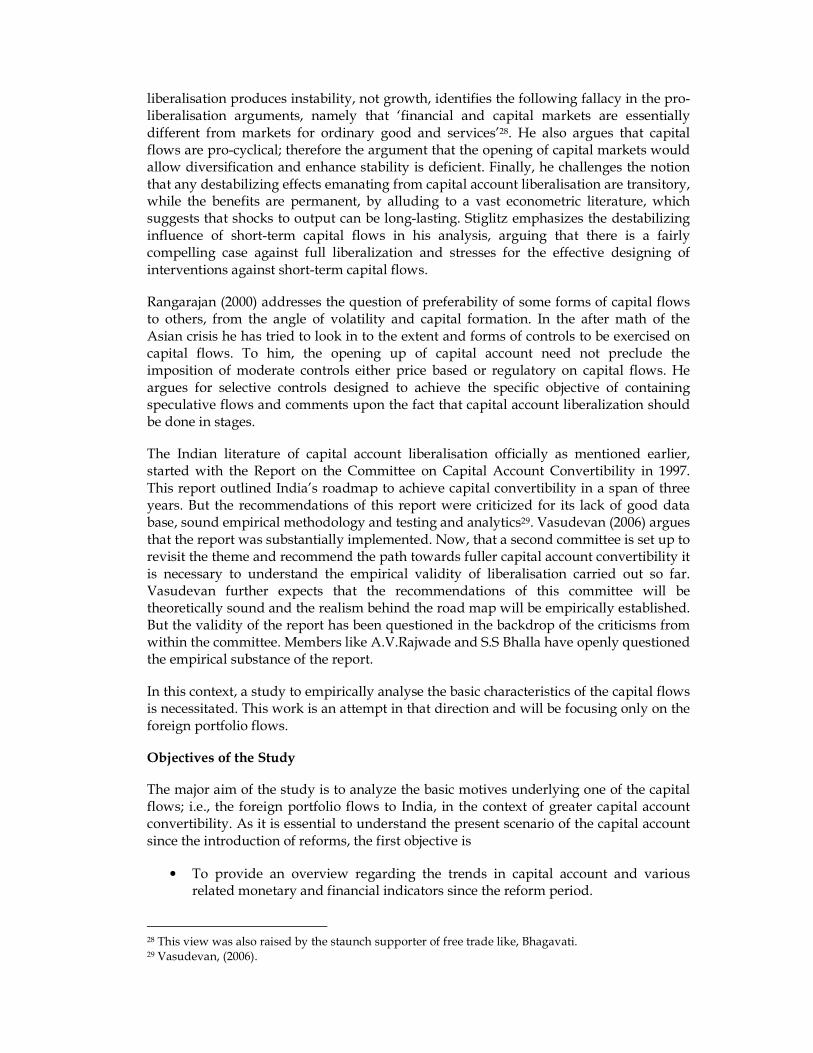
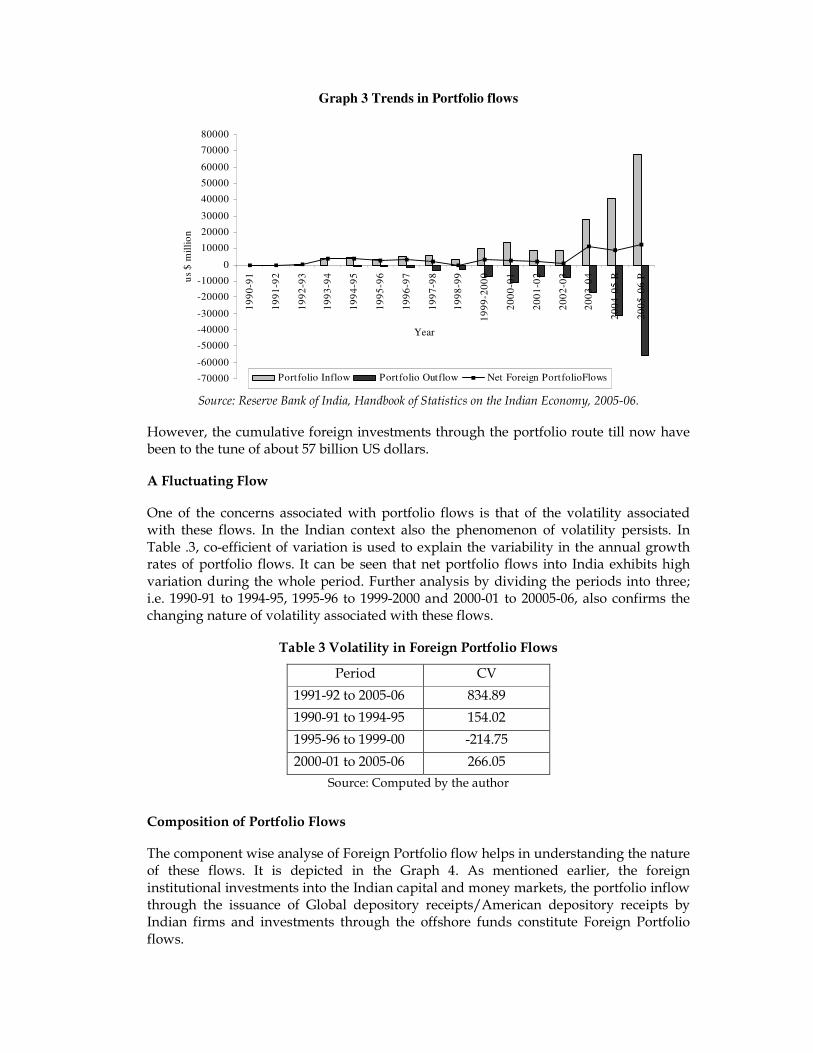
The portfolio flows begun in 1990-91 as a result of the opening up of the economy. In the first year the Portfolio flow recorded a modest figure of about 6 million US dollars via the offshore funds and the same trend continued in the next two year with investments of about 4 and 244 million US dollars respectively. Starting with 1993-94, the portfolio flows began to pick up. The trend continued for a while before the Asian financial crisis putting the breaks from 1996-97, and the portfolio flow even recording net outflows during 1998-99. After that, the foreign portfolio flow continued unabated, with the largest inflow recorded during 2003-04 and in the last year. However the quantum of outflows is also significant45. The Graph 3 clearly depicts the trajectory of inflows, outflows and net inflows of Portfolio flows; in which shows an increase in the last decade46.
44 See also Annexure II-C for a clear view regarding the major capital flows and its share in the total capital flows. 45 A significant percent of Portfolio flow leaves the country each year as outflows. See also Appendix II-D for details. Interestingly the country has also seen Portfolio investment abroad in the years of 2001-02, 2002-03 and 2003-04 to the tune of 170, 69, and 35 US dollar million respectively (RBI- Handbook of Statistics on the Indian Economy, 2005-06). 46 Annexure II-D provides a description about the trends in the foreign portfolio inflow, outflow and net flow.
Graph 3 Trends in Portfolio flows
-70000
-60000
-50000
-40000
-30000
-20000
-10000
0
10000
20000
30000
40000
50000
60000
70000
80000
19
90
-91
19
91
-92
19
92
-93
19
93
-94
19
94
-95
19
95
-96
19
96
-97
19
97
-98
19
98
-99
19
99
-20
00
20
00
-01
20
01
-02
20
02
-03
20
03
-04
20
04
-05
R
20
05
-06
P
Year
us
$ m
illi
on
Portfolio Inflow Portfolio Outflow Net Foreign PortfolioFlows
Source: Reserve Bank of India, Handbook of Statistics on the Indian Economy, 2005-06.
However, the cumulative foreign investments through the portfolio route till now have been to the tune of about 57 billion US dollars.
A Fluctuating Flow
One of the concerns associated with portfolio flows is that of the volatility associated with these flows. In the Indian context also the phenomenon of volatility persists. In Table .3, co-efficient of variation is used to explain the variability in the annual growth rates of portfolio flows. It can be seen that net portfolio flows into India exhibits high variation during the whole period. Further analysis by dividing the periods into three; i.e. 1990-91 to 1994-95, 1995-96 to 1999-2000 and 2000-01 to 20005-06, also confirms the changing nature of volatility associated with these flows.
Table 3 Volatility in Foreign Portfolio Flows
Period CV
1991-92 to 2005-06 834.89
1990-91 to 1994-95 154.02
1995-96 to 1999-00 -214.75
2000-01 to 2005-06 266.05
Source: Computed by the author
Composition of Portfolio Flows
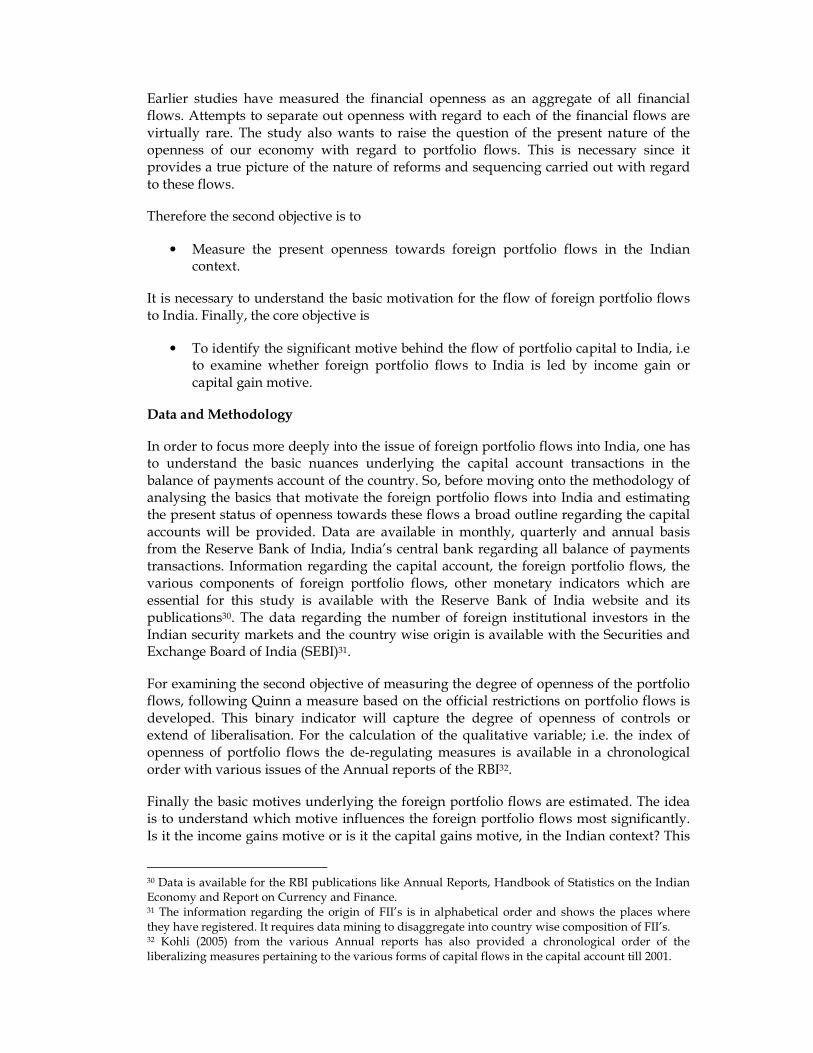
The component wise analyse of Foreign Portfolio flow helps in understanding the nature of these flows. It is depicted in the Graph 4. As mentioned earlier, the foreign institutional investments into the Indian capital and money markets, the portfolio inflow through the issuance of Global depository receipts/American depository receipts by Indian firms and investments through the offshore funds constitute Foreign Portfolio flows.
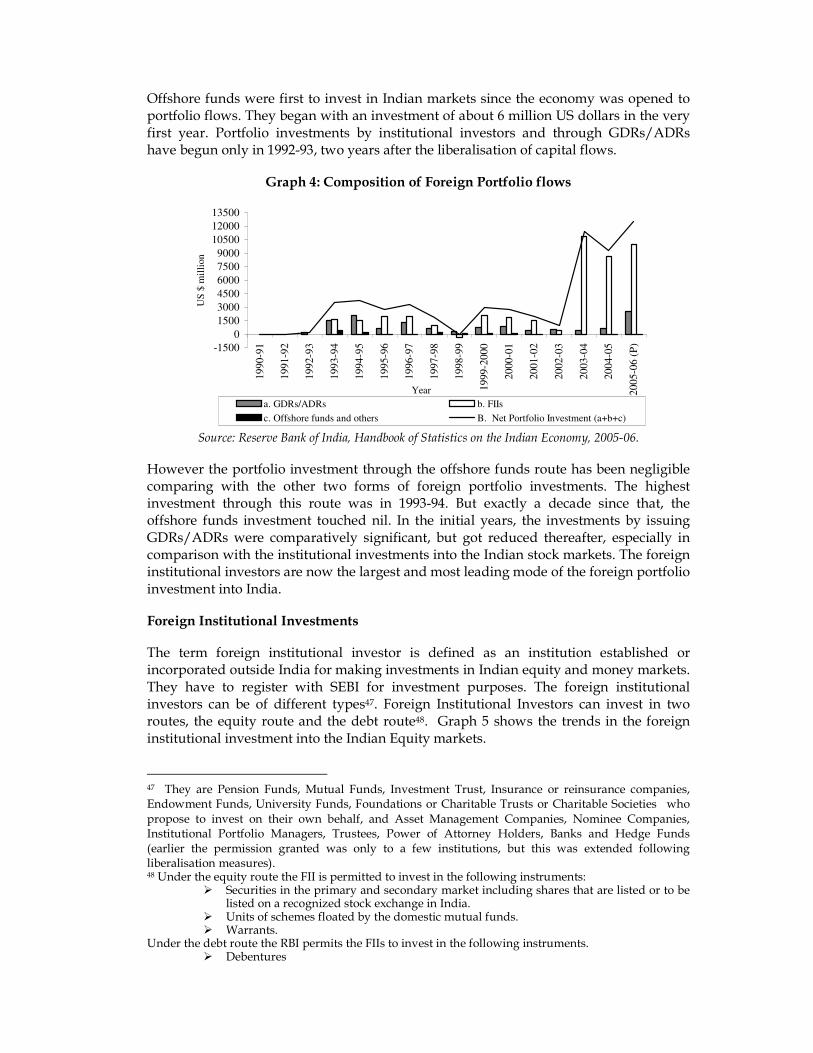
Offshore funds were first to invest in Indian markets since the economy was opened to portfolio flows. They began with an investment of about 6 million US dollars in the very first year. Portfolio investments by institutional investors and through GDRs/ADRs have begun only in 1992-93, two years after the liberalisation of capital flows.
Graph 4: Composition of Foreign Portfolio flows
-1500
0
1500
3000
4500
6000
7500
9000
10500
12000
13500
1990-9
1
1991-9
2
1992-9
3
1993-9
4
1994-9
5
1995-9
6
1996-9
7
1997-9
8
1998-9
9
1999-2
000
2000-0
1
2001-0
2
2002-0
3
2003-0
4
2004-0
5
2005-0
6 (
P)
Year
US
$ m
illi
on
a. GDRs/ADRs b. FIIs
c. Offshore funds and others B. Net Portfolio Investment (a+b+c)
Source: Reserve Bank of India, Handbook of Statistics on the Indian Economy, 2005-06.
However the portfolio investment through the offshore funds route has been negligible comparing with the other two forms of foreign portfolio investments. The highest investment through this route was in 1993-94. But exactly a decade since that, the offshore funds investment touched nil. In the initial years, the investments by issuing GDRs/ADRs were comparatively significant, but got reduced thereafter, especially in comparison with the institutional investments into the Indian stock markets. The foreign institutional investors are now the largest and most leading mode of the foreign portfolio investment into India.
Foreign Institutional Investments
The term foreign institutional investor is defined as an institution established or incorporated outside India for making investments in Indian equity and money markets. They have to register with SEBI for investment purposes. The foreign institutional investors can be of different types47. Foreign Institutional Investors can invest in two routes, the equity route and the debt route48. Graph 5 shows the trends in the foreign institutional investment into the Indian Equity markets.
47 They are Pension Funds, Mutual Funds, Investment Trust, Insurance or reinsurance companies, Endowment Funds, University Funds, Foundations or Charitable Trusts or Charitable Societies who propose to invest on their own behalf, and Asset Management Companies, Nominee Companies, Institutional Portfolio Managers, Trustees, Power of Attorney Holders, Banks and Hedge Funds (earlier the permission granted was only to a few institutions, but this was extended following liberalisation measures). 48 Under the equity route the FII is permitted to invest in the following instruments:
� Securities in the primary and secondary market including shares that are listed or to be listed on a recognized stock exchange in India.
� Units of schemes floated by the domestic mutual funds. � Warrants.
Under the debt route the RBI permits the FIIs to invest in the following instruments. � Debentures
Graph 5: Trends in Foreign Institutional Investments
-10000
100020003000400050006000700080009000
100001100012000
19
90
-91
19
91
-92
19
92
-93
19
93
-94
19
94
-95
19
95
-96
19
96
-97
19
97
-98
19
98
-99
19
99
-20
00
20
00
-01
20
01
-02
20
02
-03
20
03
-04
20
04
-05
20
05
-06
(P
)
Year
US
$ m
illi
on
Source: Reserve Bank of India, Handbook of Statistics on the Indian Economy, 2005-06.
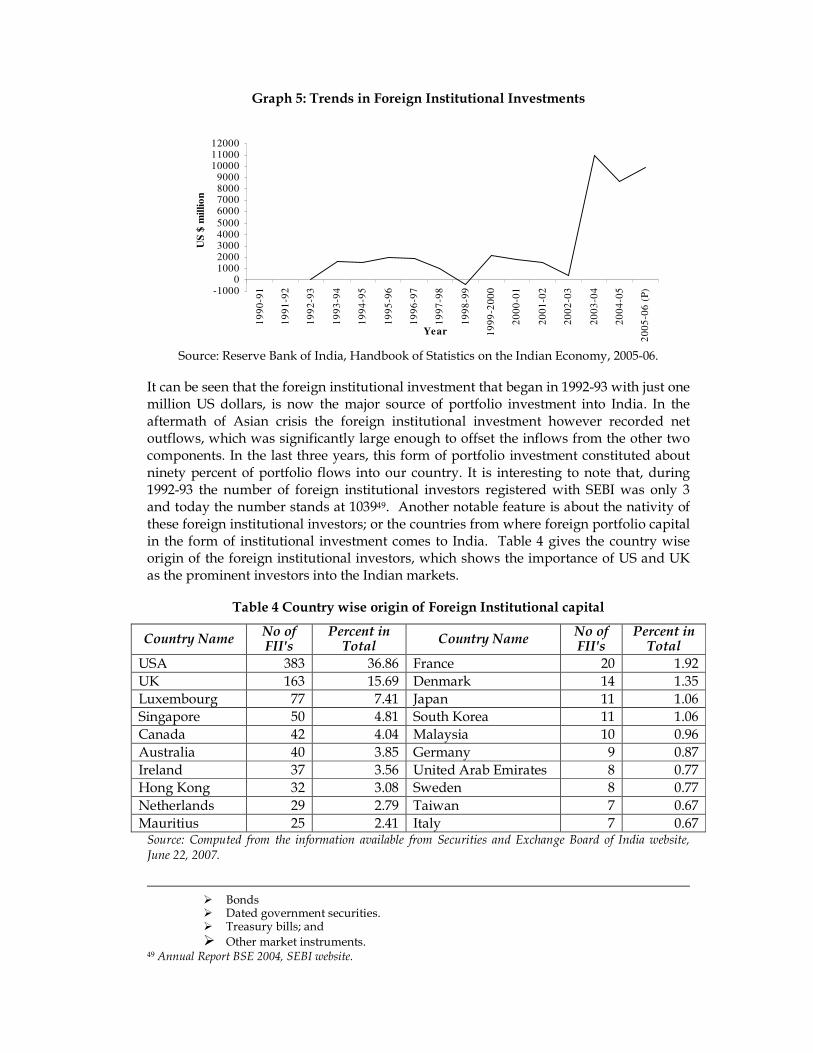
It can be seen that the foreign institutional investment that began in 1992-93 with just one million US dollars, is now the major source of portfolio investment into India. In the aftermath of Asian crisis the foreign institutional investment however recorded net outflows, which was significantly large enough to offset the inflows from the other two components. In the last three years, this form of portfolio investment constituted about ninety percent of portfolio flows into our country. It is interesting to note that, during 1992-93 the number of foreign institutional investors registered with SEBI was only 3 and today the number stands at 103949. Another notable feature is about the nativity of these foreign institutional investors; or the countries from where foreign portfolio capital in the form of institutional investment comes to India. Table 4 gives the country wise origin of the foreign institutional investors, which shows the importance of US and UK as the prominent investors into the Indian markets.
Table 4 Country wise origin of Foreign Institutional capital
Country Name No of FII's
Percent in Total
Country Name No of FII's
Percent in Total
USA 383 36.86 France 20 1.92 UK 163 15.69 Denmark 14 1.35 Luxembourg 77 7.41 Japan 11 1.06 Singapore 50 4.81 South Korea 11 1.06 Canada 42 4.04 Malaysia 10 0.96
Australia 40 3.85 Germany 9 0.87 Ireland 37 3.56 United Arab Emirates 8 0.77 Hong Kong 32 3.08 Sweden 8 0.77
Netherlands 29 2.79 Taiwan 7 0.67 Mauritius 25 2.41 Italy 7 0.67
Source: Computed from the information available from Securities and Exchange Board of India website, June 22, 2007.
� Bonds � Dated government securities. � Treasury bills; and
� Other market instruments. 49 Annual Report BSE 2004, SEBI website.
3. MEASURING OPENNESS TO FOREIGN PORTFOLIO FLOWS
The above section highlighted the internationalization of India’s Capital market with particular reference to Foreign Portfolio investments. This in a sense represented the actual openness of our economy to these flows since the economy was opened up. This actual openness towards foreign financial flows was facilitated by the relaxation of the vast array of controls and regulations governing the external account transactions. Economies are considered fully open financially, when there are no controls governing financial flows. So analysing how much controls have been dismantled will provide a view regarding the potential openness of our economy towards international capital transactions. In this section, an analysis is attempted to understand the present openness of our economy towards foreign portfolio flows.
Need for disaggregating Openness of Foreign Portfolio Flows
It is important for developing economies looking forward to fully liberalizing their capital account to understand the openness in each of the components of capital account before attempting any further liberalisation measures. This becomes grave, when the capital flows are dominated by the short-term flows, against which there is a growing consensus for imposing controls. As shown earlier, the Indian capital account scenario is characterised by the dominance of foreign portfolio flows50. The debate of capital account convertibility assumes significance in this context. Full capital convertibility refers to fully liberalizing/opening the doors of the economy to all forms of capital flows, without leaving any hindrances51. So in order to know the financial or capital account openness one has to document and analyse policy measures with respect to the whole of these capital flows. The financial market openness refers to the openness vis-à-vis all these different capital flows. Moreover, there are very few attempts to disaggregate the financial openness among its various components. Liberati (2006) has used the combination of foreign direct investment and portfolio investment as a measure for financial openness but, it is only a proxy for representing financial openness.
Understanding Financial Openness
Before moving explicitly into the construction the openness index for portfolio flows, it is essential to understand the issue of financial openness. While financial openness refers to an aggregate concept of increasing global linkages through the cross border financial flows, capital account openness/capital market openness refers to an individual country’s linkage with international capital markets/flows52.
Brune et.al (2001), presents a review of the measures of financial openness. Some of the widely used measure of openness estimates the importance of the variable in question
50 This throws up some interesting questions regarding the pace and sequence of reforms in the capital account. Either the reforms initiated is more favorable for the portfolio flows, or the macro-economic essentials that determines the capital flows are more encouraging for the portfolio flows than the other forms of financial flows. 51 This includes capital flows in the form of foreign direct investment, portfolio investment, loans, banking flows, external commercial borrowings, other capital etc. 52 Prasad. et al, 2003.
relative to the size of the economy53. For measuring the capital mobility, the convergence between the rate of return across borders (Frankel, 1993) or to the extent to which domestic saving affect domestic investment (Feldstein and Horioka 1980) can also be taken. However, measurement of capital market openness has been usually fraught with difficulties54. Prasad et al (2003) provides a broad picture regarding the measures of financial openness. Measures of de jure55 restrictions on capital flows and de facto56 or actual capital flows across national borders are two indicators of the extent of a country’s capital market openness with the global economy. Understanding the differences between them is important when evaluating the effects of capital market openness. Most formal empirical work analyzing the effects of capital account liberalization has used a measure based on the official restrictions on capital flows as reported to the IMF by national authorities. A more direct measure of capital market openness is based on the estimated gross stocks of foreign assets and liabilities as shares of GDP. Although these two measures of financial integration are related, they denote two distinct aspects. The capital account restrictions measure reflects the existence of ‘de jure’ restrictions on capital flows while the financial openness measure captures ‘de facto’ financial integration in terms of realized capital flows57. A debated question is whether capital market openness should be measured as either actual or potential mobility. However since the basic idea underlying the analysis attempted here is to understand how much open is our economy to foreign portfolio flows or how much liberalised our economy is towards portfolio flows; the measure based on ‘de jure’ restrictions can be used.
Measuring Openness
The problems related to the measuring of degree of financial openness makes it a difficult research work58. The IMF’s Annual Report on Exchange Arrangements and Exchange Restrictions (AREAER) addresses these problems, where the presence of capital controls is labeled59. This information serves as the basis for generating the indicator of capital market openness. Brune et al (2001), provides a brief description of the various studies on capital account liberalisation measures. They reports that these measures however
53 The financial openness is analogous to the trade measure in that it seeks to estimate the size (or importance) of external financial transactions (gross financial flows) relative to the size of the domestic economy (Gross domestic Product). 54 Liberati, (2006) after extensive survey says that most of the empirical literature has converged towards the idea that financial openness indicators should indicate either actual or potential capital mobility. 55 Having a right or existence as sated by law. 56 Existing in fact, although not necessarily legal or accepted in reality. 57 The actual flow can occur even without capital market liberalisation. Prasad et al (2003), shows that episodes of capital flight from some Latin American countries in the 1970s and 1980s are examples of such involuntary de facto financial integration in economies that are de jure closed to financial flows (that is, where integration has occurred without capital account liberalization). On the other hand, some countries in Africa have few capital account restrictions but have experienced only minimal levels of capital flows (that is, where liberalization has occurred without integration). 58 To Brune (2001), there are several problems. First, should foreign direct investments or portfolio investments be considered or both? Second, are inflows or outflows that best measure financial openness? Third, are financial flows a more reliable indicator of capital mobility than stocks? Fourth, should flows and stock be disregarded in favour of alternative indicators 59 Jayadev, (2007) notes that most efforts to identify the presence of capital account restrictions have relied primarily on the annual publication of the IMF Exchange Arrangements and Exchange Restrictions which provides details on various regulations on capital account transactions across countries. To him, it has been the central source for various constructions of financial openness like Quinn, 1997; Rodrik, 1998; Kraay, 1998; Klein and Olivei, 1999; Edwards 2001; Chinn and Ito, 2003.
were cross national in nature; and gives the openness for a number of countries that were liberalizing there capital account. They reviews that, the first systematic attempt to analyze capital account policy was undertaken by Alesina et al, (1994). Using data reported in the International Monetary Fund’s AREAER, they coded policy among the OECD countries for the decade of the 1980s using a 0-1 dummy variable. Subsequent studies have used the same variable but extended the country and year coverage (Leblang 1997, Simmons and Elkins (2000)). Dennis Quinn (1997) and Quinn and Inclan (1997) then went beyond this dummy variable approach by creating a 0-4 scale for restrictions on the capital account during two time periods (the mid-1970s and the mid- to late-1980s) for a sample of developed and developing countries. Beginning in 1996, the AREAER began explicitly to note the degree of openness on different categories of capital controls. Johnston and Tamirisa (1998) used this data to code nine categories of capital controls for the single year of 1996. Among the studies using simplistic dummies such as the binary variable from the International Monetary Fund annual report on exchange restrictions, the index created by Quinn (1997) remains the first and most popular”60. Quinn’s index makes careful use of the text of the IMF report to code an index with a value from 0 to 4 with a scale of 0.5.
The Methodology
The analysis of measuring the openness towards portfolio flows in the Indian context can be attempted using the methodology of Quinn (1997). Quinn has used simplistic dummies in terms of binary variables in coding the capital controls. His coding for capital inflows and outflows is as follows.
If approval is rare and surrender of receipts is required, then X = 0.
If approval is required and sometimes granted, then X = 0.5.
If approval is required and frequently granted, then X = 1.
If approval is not required and receipts are heavily taxed, then X = 1.5.
If approval is not required and receipts are not taxed, then X = 2.
However, the Index of Openness of Portfolio flows (IOP) differ from that of Quinn in the index measure. First of all this study considers the case of foreign portfolio flows only. Secondly, while Quinn codes the liberalisation measures between 0 and 4, this study codes the measures between 0 and 1. The value of zero denotes fully closed and the value of one shows fully open towards portfolio flows. The liberalisation measures pertaining to the foreign portfolio flows have to be chronologically arranged for the coding purpose. Annexure II-E provides a detailed review of the opening up measures of the foreign portfolio flows in a chronological order.
For coding in this way, appropriate weights have to be assigned. A curious limitation of this method is that, it has provided only a crude form of the methodology developed by Quinn. Firstly all the items within the foreign portfolio flows were taken. These items can be broadly denoted in the form of share and debentures, bonds and debentures,
60 Brune et al further extends this analysis both forward and backward in their Capital Account Openness Index (CAOI).
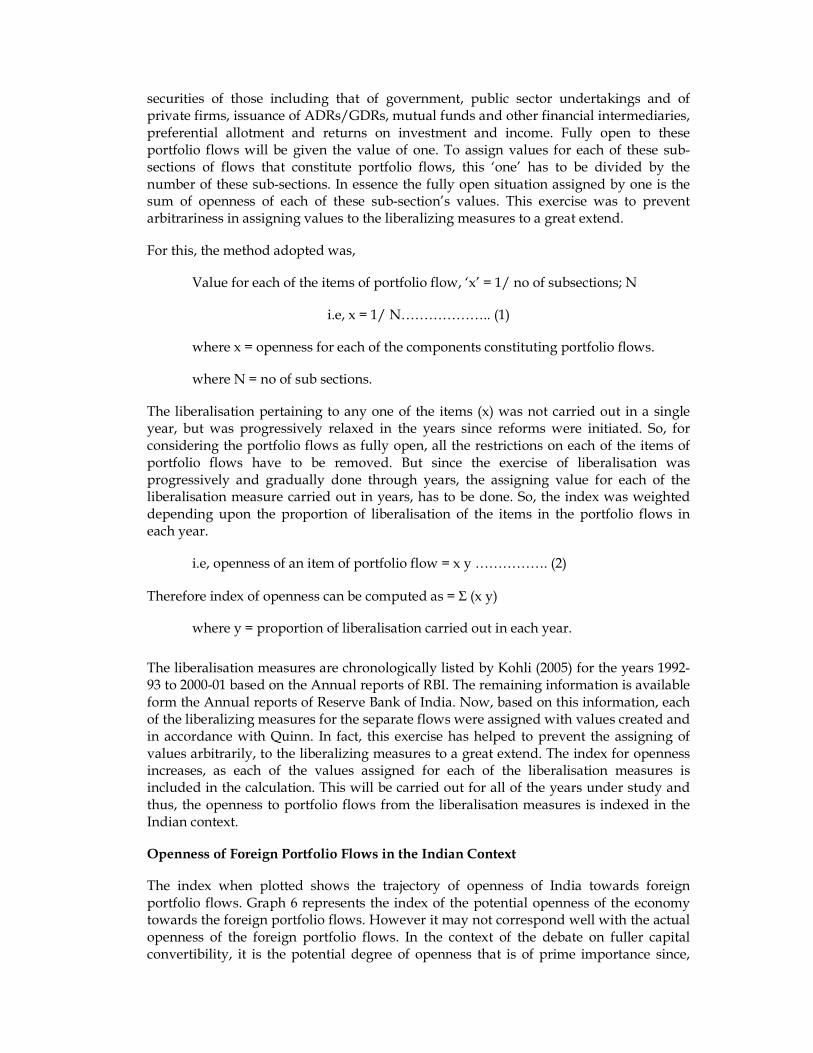
securities of those including that of government, public sector undertakings and of private firms, issuance of ADRs/GDRs, mutual funds and other financial intermediaries, preferential allotment and returns on investment and income. Fully open to these portfolio flows will be given the value of one. To assign values for each of these sub-sections of flows that constitute portfolio flows, this ‘one’ has to be divided by the number of these sub-sections. In essence the fully open situation assigned by one is the sum of openness of each of these sub-section’s values. This exercise was to prevent arbitrariness in assigning values to the liberalizing measures to a great extend.
For this, the method adopted was,
Value for each of the items of portfolio flow, ‘x’ = 1/ no of subsections; N
i.e, x = 1/ N……………….. (1)
where x = openness for each of the components constituting portfolio flows.
where N = no of sub sections.
The liberalisation pertaining to any one of the items (x) was not carried out in a single year, but was progressively relaxed in the years since reforms were initiated. So, for considering the portfolio flows as fully open, all the restrictions on each of the items of portfolio flows have to be removed. But since the exercise of liberalisation was progressively and gradually done through years, the assigning value for each of the liberalisation measure carried out in years, has to be done. So, the index was weighted depending upon the proportion of liberalisation of the items in the portfolio flows in each year.
i.e, openness of an item of portfolio flow = x y ……………. (2)
Therefore index of openness can be computed as = Σ (x y)
where y = proportion of liberalisation carried out in each year.
The liberalisation measures are chronologically listed by Kohli (2005) for the years 1992-93 to 2000-01 based on the Annual reports of RBI. The remaining information is available form the Annual reports of Reserve Bank of India. Now, based on this information, each of the liberalizing measures for the separate flows were assigned with values created and in accordance with Quinn. In fact, this exercise has helped to prevent the assigning of values arbitrarily, to the liberalizing measures to a great extend. The index for openness increases, as each of the values assigned for each of the liberalisation measures is included in the calculation. This will be carried out for all of the years under study and thus, the openness to portfolio flows from the liberalisation measures is indexed in the Indian context.
Openness of Foreign Portfolio Flows in the Indian Context
The index when plotted shows the trajectory of openness of India towards foreign portfolio flows. Graph 6 represents the index of the potential openness of the economy towards the foreign portfolio flows. However it may not correspond well with the actual openness of the foreign portfolio flows. In the context of the debate on fuller capital convertibility, it is the potential degree of openness that is of prime importance since,
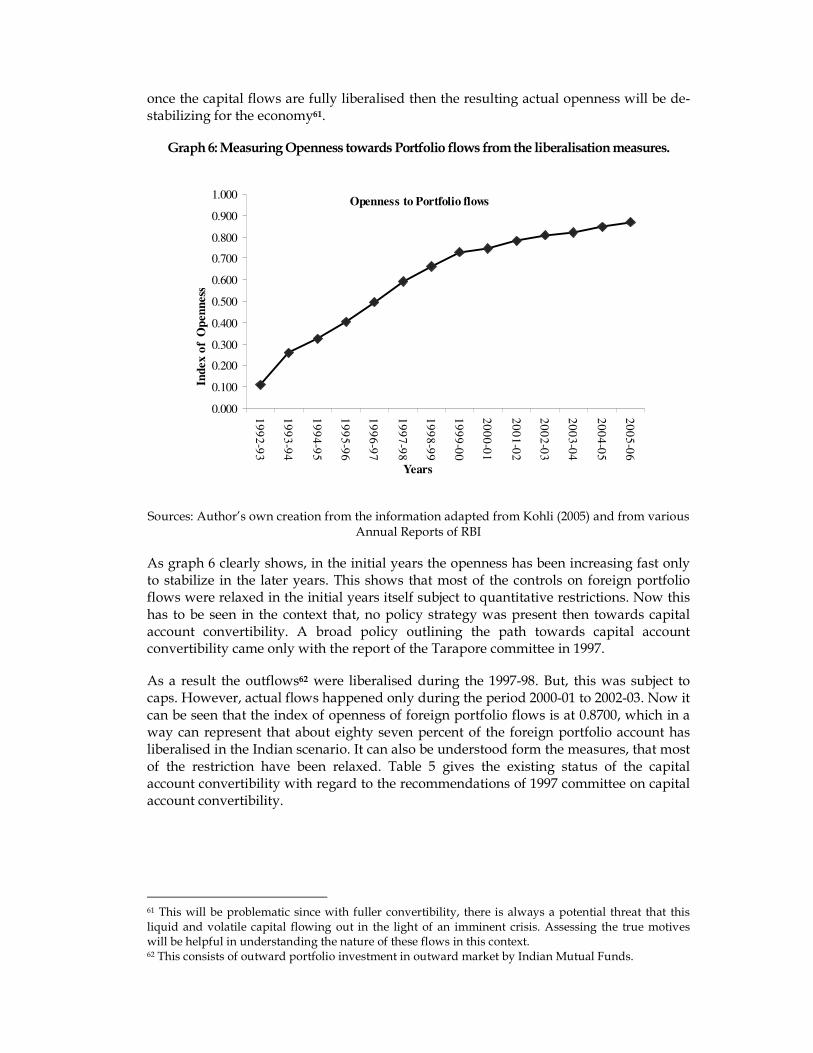
once the capital flows are fully liberalised then the resulting actual openness will be de-stabilizing for the economy61.
Graph 6: Measuring Openness towards Portfolio flows from the liberalisation measures.
Openness to Portfolio flows
0.000
0.100
0.200
0.300
0.400
0.500
0.600
0.700
0.800
0.900
1.000
19
92
-93
19
93
-94
19
94
-95
19
95
-96
19
96
-97
19
97
-98
19
98
-99
19
99
-00
20
00
-01
20
01
-02
20
02
-03
20
03
-04
20
04
-05
20
05
-06
Years
Ind
ex o
f O
pen
nes
s
Sources: Author’s own creation from the information adapted from Kohli (2005) and from various Annual Reports of RBI
As graph 6 clearly shows, in the initial years the openness has been increasing fast only to stabilize in the later years. This shows that most of the controls on foreign portfolio flows were relaxed in the initial years itself subject to quantitative restrictions. Now this has to be seen in the context that, no policy strategy was present then towards capital account convertibility. A broad policy outlining the path towards capital account convertibility came only with the report of the Tarapore committee in 1997.
As a result the outflows62 were liberalised during the 1997-98. But, this was subject to caps. However, actual flows happened only during the period 2000-01 to 2002-03. Now it can be seen that the index of openness of foreign portfolio flows is at 0.8700, which in a way can represent that about eighty seven percent of the foreign portfolio account has liberalised in the Indian scenario. It can also be understood form the measures, that most of the restriction have been relaxed. Table 5 gives the existing status of the capital account convertibility with regard to the recommendations of 1997 committee on capital account convertibility.
61 This will be problematic since with fuller convertibility, there is always a potential threat that this liquid and volatile capital flowing out in the light of an imminent crisis. Assessing the true motives will be helpful in understanding the nature of these flows in this context. 62 This consists of outward portfolio investment in outward market by Indian Mutual Funds.
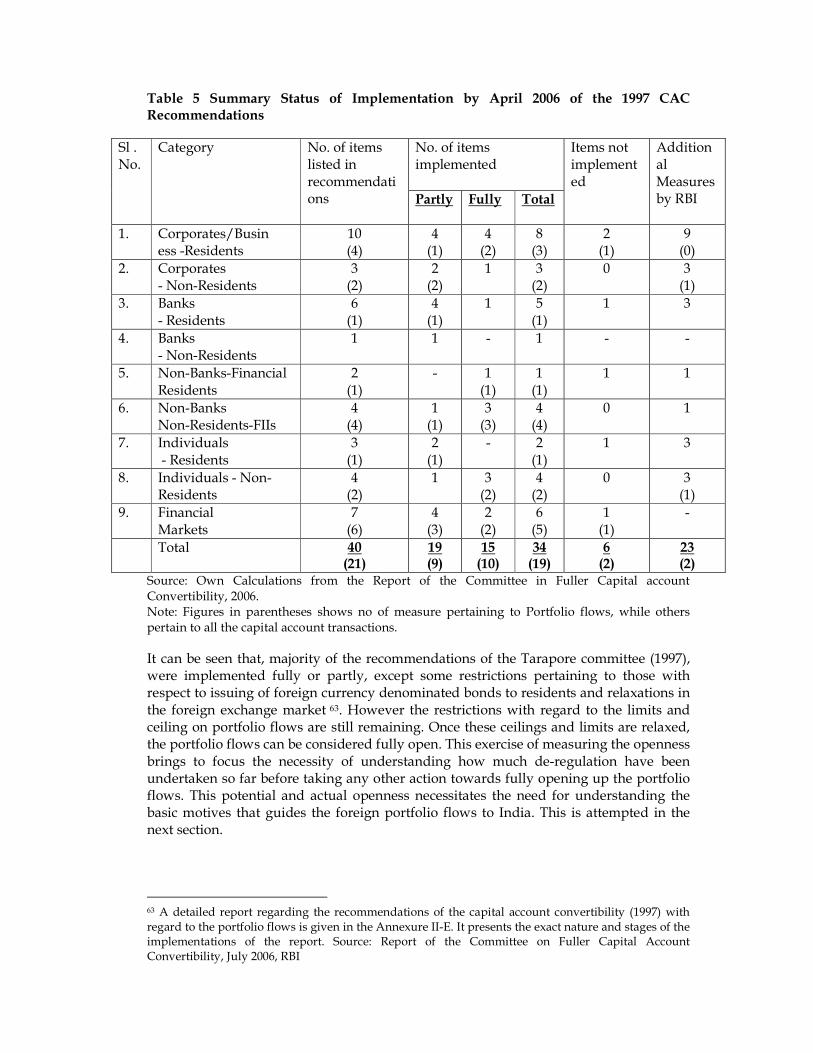
Table 5 Summary Status of Implementation by April 2006 of the 1997 CAC Recommendations
No. of items implemented
Sl . No.
Category
No. of items listed in recommendations
Partly Fully Total
Items not implemented
Additional Measures by RBI
1. Corporates/Busin ess -Residents
10 (4)
4 (1)
4 (2)
8 (3)
2 (1)
9 (0)
2. Corporates - Non-Residents
3 (2)
2 (2)
1 3 (2)
0 3 (1)
3. Banks - Residents
6 (1)
4 (1)
1 5 (1)
1 3
4. Banks - Non-Residents
1 1 - 1 - -
5. Non-Banks-Financial Residents
2 (1)
- 1 (1)
1 (1)
1 1
6. Non-Banks Non-Residents-FIIs
4 (4)
1 (1)
3 (3)
4 (4)
0 1
7. Individuals - Residents
3 (1)
2 (1)
- 2 (1)
1 3
8. Individuals - Non-Residents
4 (2)
1 3 (2)
4 (2)
0 3 (1)
9. Financial Markets
7 (6)
4 (3)
2 (2)
6 (5)
1 (1)
-
Total 40 (21)
19 (9)
15 (10)
34 (19)
6 (2)
23 (2)
Source: Own Calculations from the Report of the Committee in Fuller Capital account Convertibility, 2006. Note: Figures in parentheses shows no of measure pertaining to Portfolio flows, while others pertain to all the capital account transactions.
It can be seen that, majority of the recommendations of the Tarapore committee (1997), were implemented fully or partly, except some restrictions pertaining to those with respect to issuing of foreign currency denominated bonds to residents and relaxations in the foreign exchange market 63. However the restrictions with regard to the limits and ceiling on portfolio flows are still remaining. Once these ceilings and limits are relaxed, the portfolio flows can be considered fully open. This exercise of measuring the openness brings to focus the necessity of understanding how much de-regulation have been undertaken so far before taking any other action towards fully opening up the portfolio flows. This potential and actual openness necessitates the need for understanding the basic motives that guides the foreign portfolio flows to India. This is attempted in the next section.
63 A detailed report regarding the recommendations of the capital account convertibility (1997) with regard to the portfolio flows is given in the Annexure II-E. It presents the exact nature and stages of the implementations of the report. Source: Report of the Committee on Fuller Capital Account Convertibility, July 2006, RBI
3. THEORETICAL UNDERPINNINGS
The theoretical support for international portfolio flows can be seen in the literature of global capital markets. Obstfeld and Taylor (2004) provide an excellent review of theoretical aspects favoring global trading of financial assets. They argue that at the global level, the international capital market channels world savings to their most productive uses, irrespective of location. Thus, international diversification of risk is also made possible through the globalization of capital markets64. Further, the capital markets also reallocate resources over time in ways that raise efficiency, i.e., an international capital market allows countries to smooth out over time the dynamic consumption effects of predictable income fluctuations65. The other main potential role of international capital market is to introduce discipline against the exploitation of captive domestic capital market. Unsound policies-for example, excessive government borrowing, or inadequate bank regulation would spark speculative capital outflows and higher domestic interest rates under conditions of financial openness. In theory, at least a government’s fear of these effects makes its behavior less attractive towards taking any such policy measure66. However, these theoretical propositions seem to hold good in a world with perfect capital mobility and a fully flexible exchange rate regime. It has to be understood that, practically these conditions are difficult to fulfill for developing economies that are in the process of opening up their economies.
At the beginning of the twenty-first century the merits of the capital mobility were under forceful attack. Such a revival of concerns about free flow of capital came to the forefront of policy discussion due to multiple crises faced in Western Europe, Latin America, East Asia, Russia and elsewhere. These recent international financial crises have submerged the entire economies and threatened their trading partners, inflicting losses all around. The case for various risks of global capital movements has been made by a number of economists belonging to different schools of thought. Within the neoclassical tradition, Obstfeld and Taylor (2005) argue that the international financial transactions rely inherently on the expectation that counterparties will fulfill future contractual commitments; they therefore place confidence and possibly volatile expectations at the centre stage. Furthermore, problems of oversight, adjudication, and enforcement all are orders of magnitude more difficult among sovereign nations with distinct national currencies than within a single national jurisdiction. The literature also explains the theoretical proposition of ‘Trilemma’ or the ‘impossible trinity’67, which is hindering the independence of policy choices. In an economy having free capital mobility, it will be difficult to follow the other two objectives of fixed exchange rates and an independent monetary policy for achieving domestic policy goals.
64 This pooling of risks can be accomplished through a diversity of financial instruments: stock shares, foreign direct investments, insurance contracts. 65 They argue that a country that has rich investment opportunities but that generates little saving of its own, can tap the international capital market to exploit its investment potential without massive short-run consumption cutbacks. Conversely, countries with abundant saving but more limited investment prospects at home can earn higher returns to wealth than they would domestically. 66 The prospect of rising interest rats and capital flight may discourage large public sector deficits; the sharp reaction of exchange rates to investor expectations and interest rates may restrain inflationary monetary moves. 67 This term was invoked firstly by Obstfeld and Rogoff (1998). The chosen macroeconomic policy regime can include at the most two elements of the ‘inconsistent trinity’ of three policy goals: Free capital mobility, fixed exchange rate and an independent monetary policy.
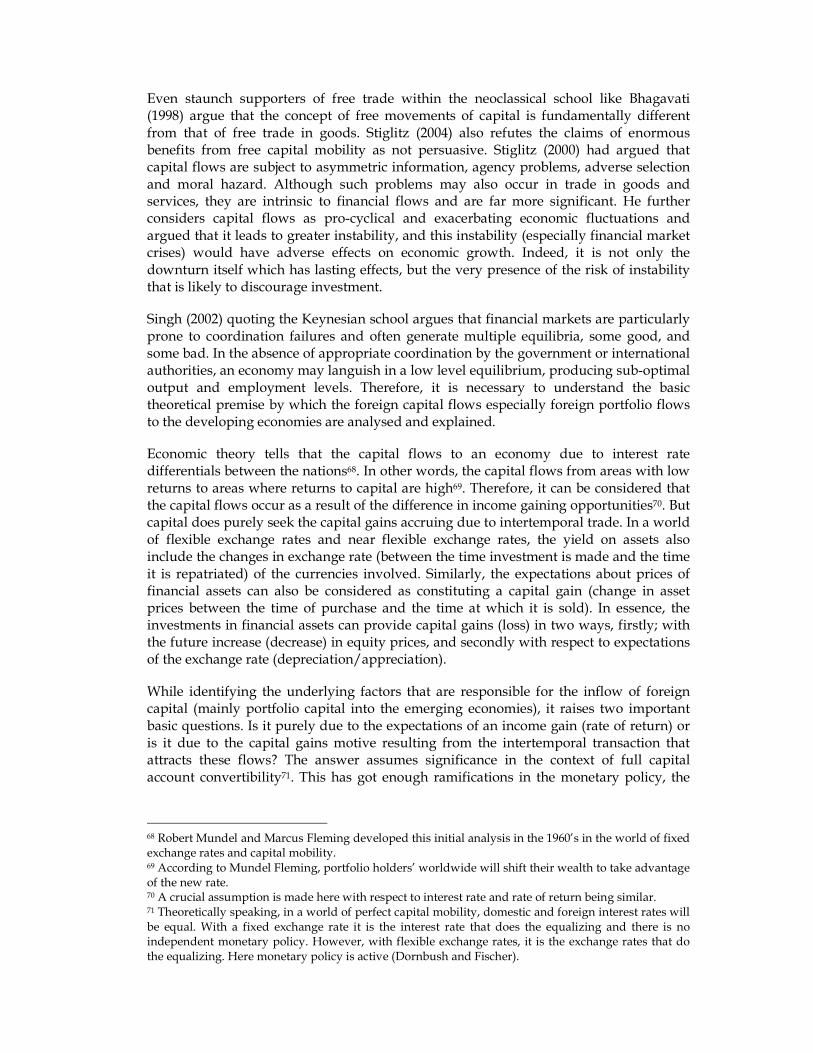
Even staunch supporters of free trade within the neoclassical school like Bhagavati (1998) argue that the concept of free movements of capital is fundamentally different from that of free trade in goods. Stiglitz (2004) also refutes the claims of enormous benefits from free capital mobility as not persuasive. Stiglitz (2000) had argued that capital flows are subject to asymmetric information, agency problems, adverse selection and moral hazard. Although such problems may also occur in trade in goods and services, they are intrinsic to financial flows and are far more significant. He further considers capital flows as pro-cyclical and exacerbating economic fluctuations and argued that it leads to greater instability, and this instability (especially financial market crises) would have adverse effects on economic growth. Indeed, it is not only the downturn itself which has lasting effects, but the very presence of the risk of instability that is likely to discourage investment.
Singh (2002) quoting the Keynesian school argues that financial markets are particularly prone to coordination failures and often generate multiple equilibria, some good, and some bad. In the absence of appropriate coordination by the government or international authorities, an economy may languish in a low level equilibrium, producing sub-optimal output and employment levels. Therefore, it is necessary to understand the basic theoretical premise by which the foreign capital flows especially foreign portfolio flows to the developing economies are analysed and explained.
Economic theory tells that the capital flows to an economy due to interest rate differentials between the nations68. In other words, the capital flows from areas with low returns to areas where returns to capital are high69. Therefore, it can be considered that the capital flows occur as a result of the difference in income gaining opportunities70. But capital does purely seek the capital gains accruing due to intertemporal trade. In a world of flexible exchange rates and near flexible exchange rates, the yield on assets also include the changes in exchange rate (between the time investment is made and the time it is repatriated) of the currencies involved. Similarly, the expectations about prices of financial assets can also be considered as constituting a capital gain (change in asset prices between the time of purchase and the time at which it is sold). In essence, the investments in financial assets can provide capital gains (loss) in two ways, firstly; with the future increase (decrease) in equity prices, and secondly with respect to expectations of the exchange rate (depreciation/appreciation).
While identifying the underlying factors that are responsible for the inflow of foreign capital (mainly portfolio capital into the emerging economies), it raises two important basic questions. Is it purely due to the expectations of an income gain (rate of return) or is it due to the capital gains motive resulting from the intertemporal transaction that attracts these flows? The answer assumes significance in the context of full capital account convertibility71. This has got enough ramifications in the monetary policy, the
68 Robert Mundel and Marcus Fleming developed this initial analysis in the 1960’s in the world of fixed exchange rates and capital mobility. 69 According to Mundel Fleming, portfolio holders’ worldwide will shift their wealth to take advantage of the new rate. 70 A crucial assumption is made here with respect to interest rate and rate of return being similar. 71 Theoretically speaking, in a world of perfect capital mobility, domestic and foreign interest rates will be equal. With a fixed exchange rate it is the interest rate that does the equalizing and there is no independent monetary policy. However, with flexible exchange rates, it is the exchange rates that do the equalizing. Here monetary policy is active (Dornbush and Fischer).
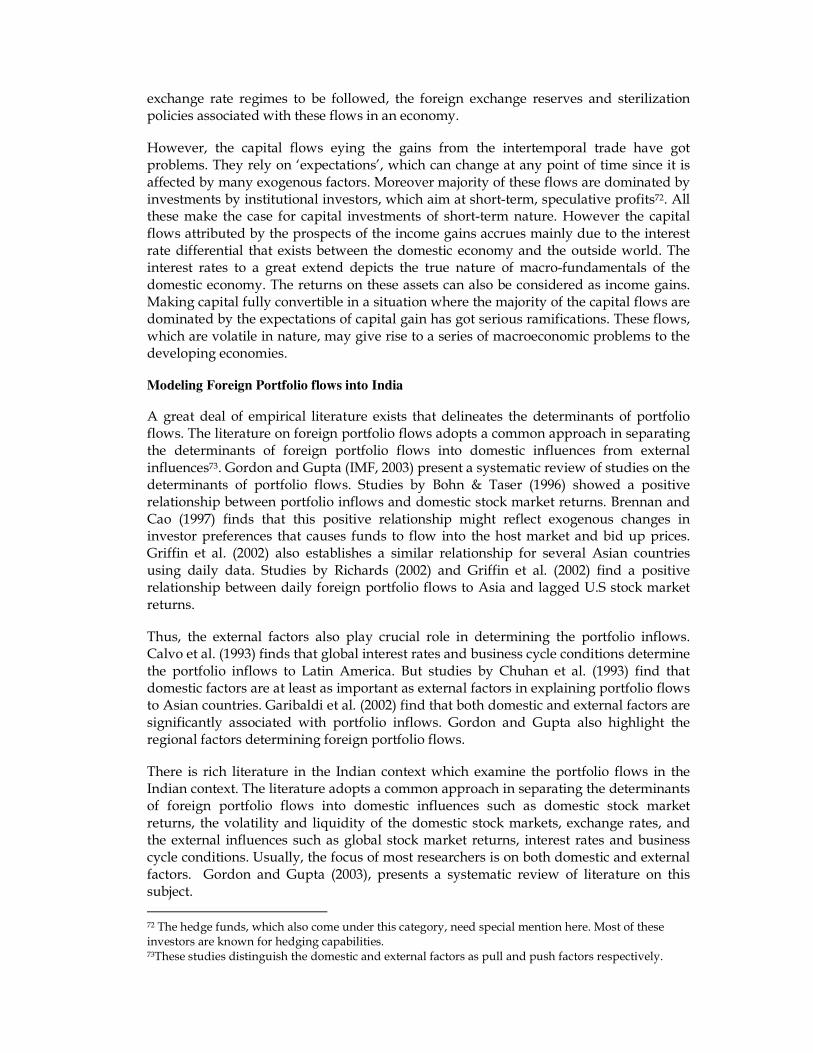
exchange rate regimes to be followed, the foreign exchange reserves and sterilization policies associated with these flows in an economy.
However, the capital flows eying the gains from the intertemporal trade have got problems. They rely on ‘expectations’, which can change at any point of time since it is affected by many exogenous factors. Moreover majority of these flows are dominated by investments by institutional investors, which aim at short-term, speculative profits72. All these make the case for capital investments of short-term nature. However the capital flows attributed by the prospects of the income gains accrues mainly due to the interest rate differential that exists between the domestic economy and the outside world. The interest rates to a great extend depicts the true nature of macro-fundamentals of the domestic economy. The returns on these assets can also be considered as income gains. Making capital fully convertible in a situation where the majority of the capital flows are dominated by the expectations of capital gain has got serious ramifications. These flows, which are volatile in nature, may give rise to a series of macroeconomic problems to the developing economies.
Modeling Foreign Portfolio flows into India
A great deal of empirical literature exists that delineates the determinants of portfolio flows. The literature on foreign portfolio flows adopts a common approach in separating the determinants of foreign portfolio flows into domestic influences from external influences73. Gordon and Gupta (IMF, 2003) present a systematic review of studies on the determinants of portfolio flows. Studies by Bohn & Taser (1996) showed a positive relationship between portfolio inflows and domestic stock market returns. Brennan and Cao (1997) finds that this positive relationship might reflect exogenous changes in investor preferences that causes funds to flow into the host market and bid up prices. Griffin et al. (2002) also establishes a similar relationship for several Asian countries using daily data. Studies by Richards (2002) and Griffin et al. (2002) find a positive relationship between daily foreign portfolio flows to Asia and lagged U.S stock market returns.
Thus, the external factors also play crucial role in determining the portfolio inflows. Calvo et al. (1993) finds that global interest rates and business cycle conditions determine the portfolio inflows to Latin America. But studies by Chuhan et al. (1993) find that domestic factors are at least as important as external factors in explaining portfolio flows to Asian countries. Garibaldi et al. (2002) find that both domestic and external factors are significantly associated with portfolio inflows. Gordon and Gupta also highlight the regional factors determining foreign portfolio flows.
There is rich literature in the Indian context which examine the portfolio flows in the Indian context. The literature adopts a common approach in separating the determinants of foreign portfolio flows into domestic influences such as domestic stock market returns, the volatility and liquidity of the domestic stock markets, exchange rates, and the external influences such as global stock market returns, interest rates and business cycle conditions. Usually, the focus of most researchers is on both domestic and external factors. Gordon and Gupta (2003), presents a systematic review of literature on this subject.
72 The hedge funds, which also come under this category, need special mention here. Most of these investors are known for hedging capabilities. 73These studies distinguish the domestic and external factors as pull and push factors respectively.
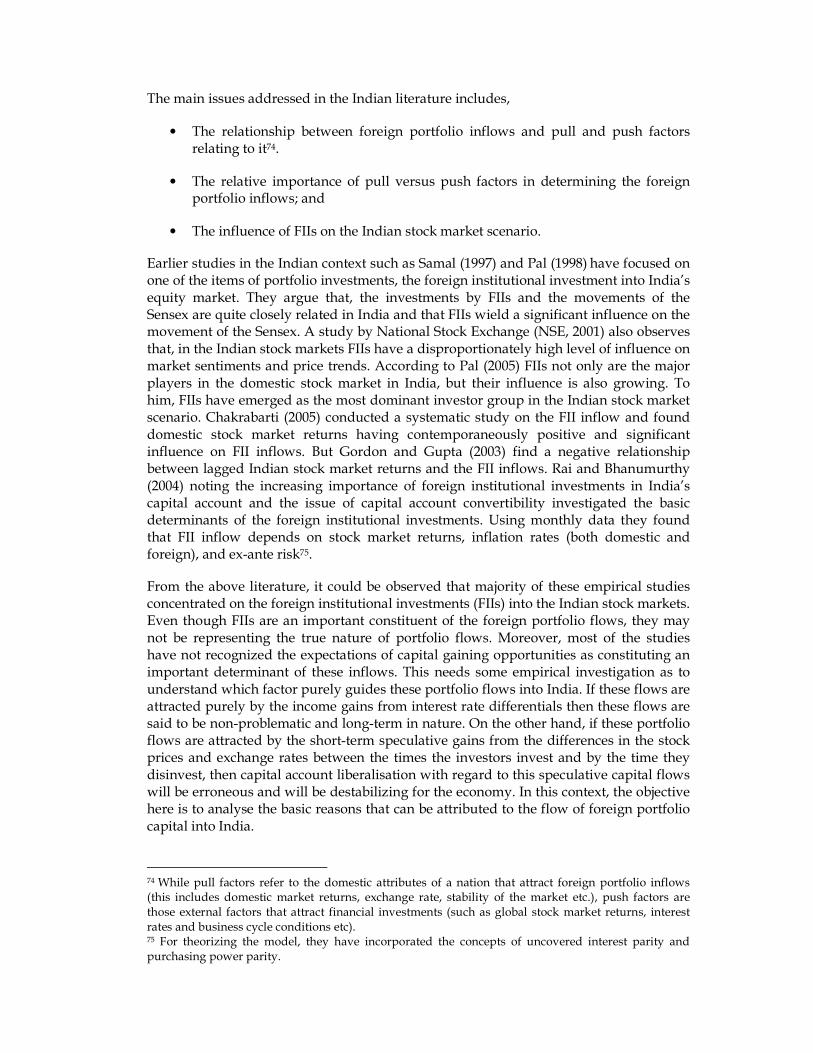
The main issues addressed in the Indian literature includes,
• The relationship between foreign portfolio inflows and pull and push factors relating to it74.
• The relative importance of pull versus push factors in determining the foreign portfolio inflows; and
• The influence of FIIs on the Indian stock market scenario.
Earlier studies in the Indian context such as Samal (1997) and Pal (1998) have focused on one of the items of portfolio investments, the foreign institutional investment into India’s equity market. They argue that, the investments by FIIs and the movements of the Sensex are quite closely related in India and that FIIs wield a significant influence on the movement of the Sensex. A study by National Stock Exchange (NSE, 2001) also observes that, in the Indian stock markets FIIs have a disproportionately high level of influence on market sentiments and price trends. According to Pal (2005) FIIs not only are the major players in the domestic stock market in India, but their influence is also growing. To him, FIIs have emerged as the most dominant investor group in the Indian stock market scenario. Chakrabarti (2005) conducted a systematic study on the FII inflow and found domestic stock market returns having contemporaneously positive and significant influence on FII inflows. But Gordon and Gupta (2003) find a negative relationship between lagged Indian stock market returns and the FII inflows. Rai and Bhanumurthy (2004) noting the increasing importance of foreign institutional investments in India’s capital account and the issue of capital account convertibility investigated the basic determinants of the foreign institutional investments. Using monthly data they found that FII inflow depends on stock market returns, inflation rates (both domestic and foreign), and ex-ante risk75.
From the above literature, it could be observed that majority of these empirical studies concentrated on the foreign institutional investments (FIIs) into the Indian stock markets. Even though FIIs are an important constituent of the foreign portfolio flows, they may not be representing the true nature of portfolio flows. Moreover, most of the studies have not recognized the expectations of capital gaining opportunities as constituting an important determinant of these inflows. This needs some empirical investigation as to understand which factor purely guides these portfolio flows into India. If these flows are attracted purely by the income gains from interest rate differentials then these flows are said to be non-problematic and long-term in nature. On the other hand, if these portfolio flows are attracted by the short-term speculative gains from the differences in the stock prices and exchange rates between the times the investors invest and by the time they disinvest, then capital account liberalisation with regard to this speculative capital flows will be erroneous and will be destabilizing for the economy. In this context, the objective here is to analyse the basic reasons that can be attributed to the flow of foreign portfolio capital into India.
74 While pull factors refer to the domestic attributes of a nation that attract foreign portfolio inflows (this includes domestic market returns, exchange rate, stability of the market etc.), push factors are those external factors that attract financial investments (such as global stock market returns, interest rates and business cycle conditions etc). 75 For theorizing the model, they have incorporated the concepts of uncovered interest parity and purchasing power parity.
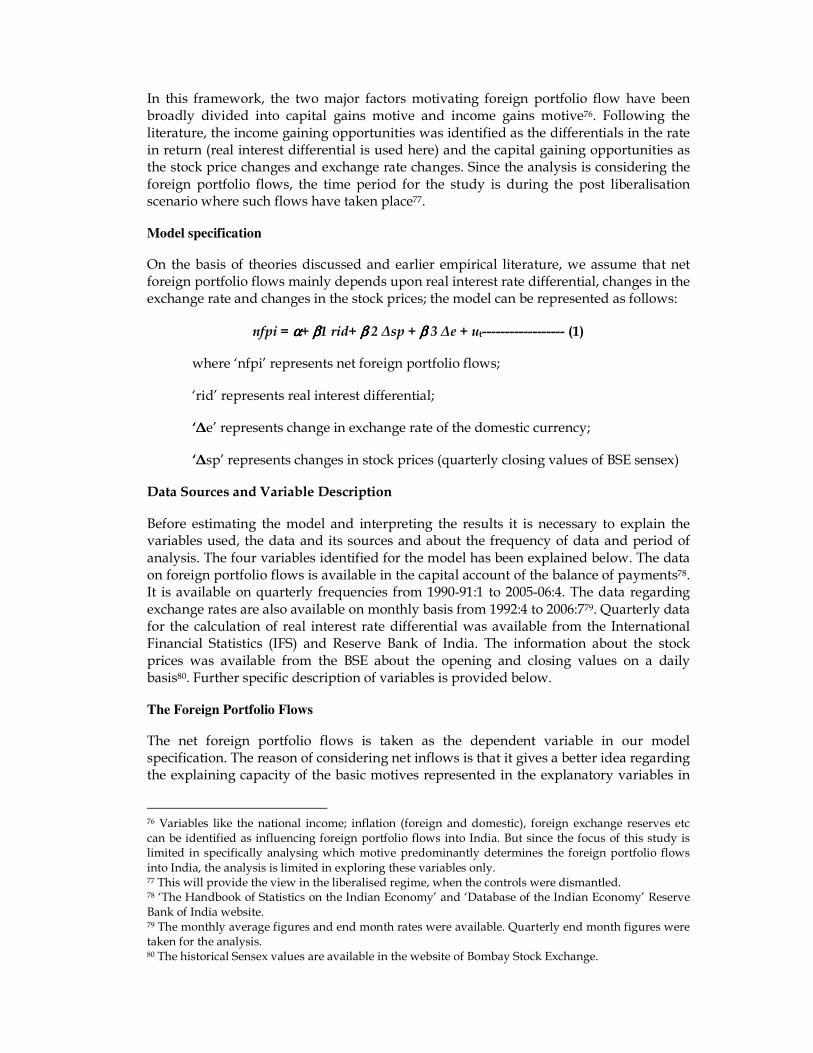
In this framework, the two major factors motivating foreign portfolio flow have been broadly divided into capital gains motive and income gains motive76. Following the literature, the income gaining opportunities was identified as the differentials in the rate in return (real interest differential is used here) and the capital gaining opportunities as the stock price changes and exchange rate changes. Since the analysis is considering the foreign portfolio flows, the time period for the study is during the post liberalisation scenario where such flows have taken place77.
Model specification
On the basis of theories discussed and earlier empirical literature, we assume that net foreign portfolio flows mainly depends upon real interest rate differential, changes in the exchange rate and changes in the stock prices; the model can be represented as follows:
nfpi = αααα+ ββββ1 rid+ ββββ 2 ∆sp + ββββ 3 ∆e + ut------------------ (1)
where ‘nfpi’ represents net foreign portfolio flows;
‘rid’ represents real interest differential;
‘∆e’ represents change in exchange rate of the domestic currency;
‘∆sp’ represents changes in stock prices (quarterly closing values of BSE sensex)
Data Sources and Variable Description
Before estimating the model and interpreting the results it is necessary to explain the variables used, the data and its sources and about the frequency of data and period of analysis. The four variables identified for the model has been explained below. The data on foreign portfolio flows is available in the capital account of the balance of payments78. It is available on quarterly frequencies from 1990-91:1 to 2005-06:4. The data regarding exchange rates are also available on monthly basis from 1992:4 to 2006:779. Quarterly data for the calculation of real interest rate differential was available from the International Financial Statistics (IFS) and Reserve Bank of India. The information about the stock prices was available from the BSE about the opening and closing values on a daily basis80. Further specific description of variables is provided below.
The Foreign Portfolio Flows
The net foreign portfolio flows is taken as the dependent variable in our model specification. The reason of considering net inflows is that it gives a better idea regarding the explaining capacity of the basic motives represented in the explanatory variables in
76 Variables like the national income; inflation (foreign and domestic), foreign exchange reserves etc can be identified as influencing foreign portfolio flows into India. But since the focus of this study is limited in specifically analysing which motive predominantly determines the foreign portfolio flows into India, the analysis is limited in exploring these variables only. 77 This will provide the view in the liberalised regime, when the controls were dismantled. 78 ‘The Handbook of Statistics on the Indian Economy’ and ‘Database of the Indian Economy’ Reserve Bank of India website. 79 The monthly average figures and end month rates were available. Quarterly end month figures were taken for the analysis. 80 The historical Sensex values are available in the website of Bombay Stock Exchange.
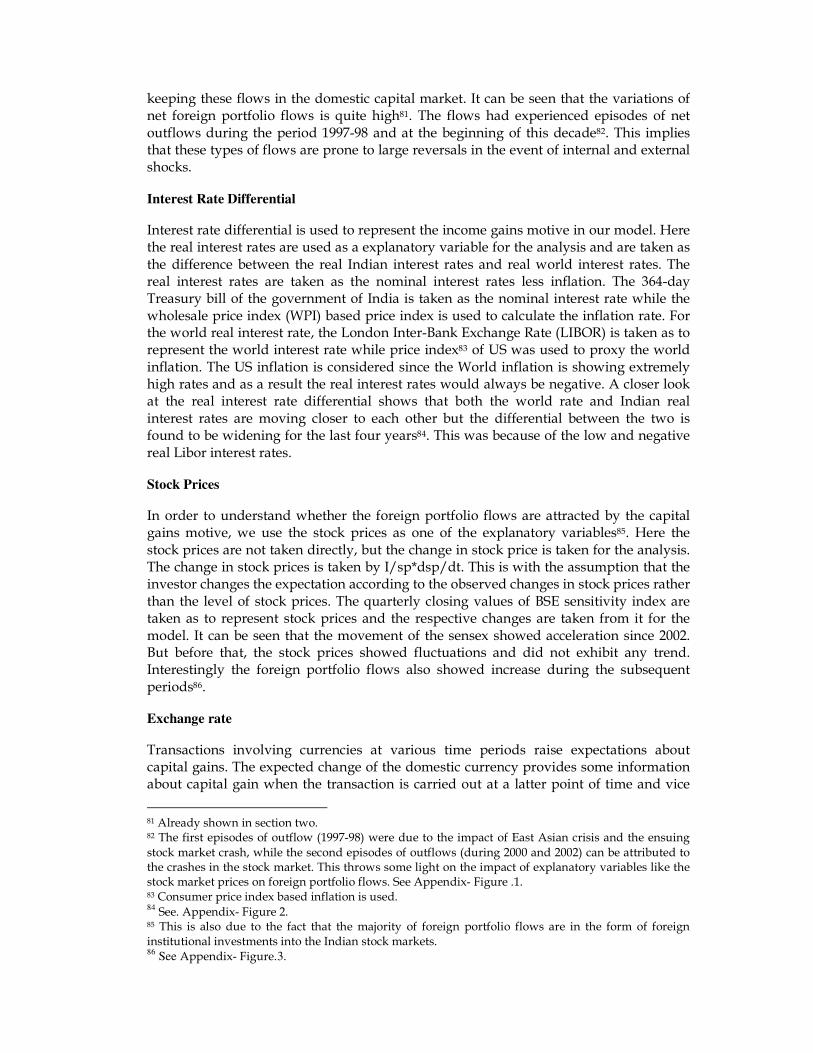
keeping these flows in the domestic capital market. It can be seen that the variations of net foreign portfolio flows is quite high81. The flows had experienced episodes of net outflows during the period 1997-98 and at the beginning of this decade82. This implies that these types of flows are prone to large reversals in the event of internal and external shocks.
Interest Rate Differential
Interest rate differential is used to represent the income gains motive in our model. Here the real interest rates are used as a explanatory variable for the analysis and are taken as the difference between the real Indian interest rates and real world interest rates. The real interest rates are taken as the nominal interest rates less inflation. The 364-day Treasury bill of the government of India is taken as the nominal interest rate while the wholesale price index (WPI) based price index is used to calculate the inflation rate. For the world real interest rate, the London Inter-Bank Exchange Rate (LIBOR) is taken as to represent the world interest rate while price index83 of US was used to proxy the world inflation. The US inflation is considered since the World inflation is showing extremely high rates and as a result the real interest rates would always be negative. A closer look at the real interest rate differential shows that both the world rate and Indian real interest rates are moving closer to each other but the differential between the two is found to be widening for the last four years84. This was because of the low and negative real Libor interest rates.
Stock Prices
In order to understand whether the foreign portfolio flows are attracted by the capital gains motive, we use the stock prices as one of the explanatory variables85. Here the stock prices are not taken directly, but the change in stock price is taken for the analysis. The change in stock prices is taken by I/sp*dsp/dt. This is with the assumption that the investor changes the expectation according to the observed changes in stock prices rather than the level of stock prices. The quarterly closing values of BSE sensitivity index are taken as to represent stock prices and the respective changes are taken from it for the model. It can be seen that the movement of the sensex showed acceleration since 2002. But before that, the stock prices showed fluctuations and did not exhibit any trend. Interestingly the foreign portfolio flows also showed increase during the subsequent periods86.
Exchange rate
Transactions involving currencies at various time periods raise expectations about capital gains. The expected change of the domestic currency provides some information about capital gain when the transaction is carried out at a latter point of time and vice
81 Already shown in section two. 82 The first episodes of outflow (1997-98) were due to the impact of East Asian crisis and the ensuing stock market crash, while the second episodes of outflows (during 2000 and 2002) can be attributed to the crashes in the stock market. This throws some light on the impact of explanatory variables like the stock market prices on foreign portfolio flows. See Appendix- Figure .1. 83 Consumer price index based inflation is used. 84 See. Appendix- Figure 2. 85 This is also due to the fact that the majority of foreign portfolio flows are in the form of foreign institutional investments into the Indian stock markets. 86 See Appendix- Figure.3.
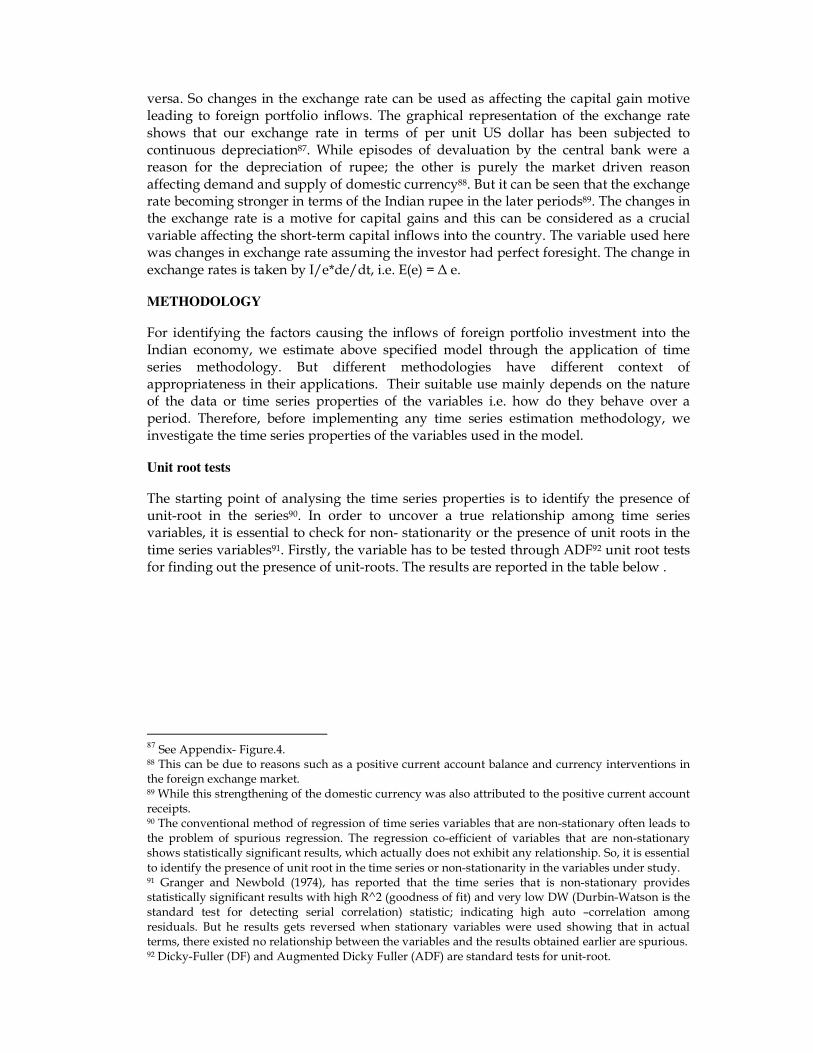
versa. So changes in the exchange rate can be used as affecting the capital gain motive leading to foreign portfolio inflows. The graphical representation of the exchange rate shows that our exchange rate in terms of per unit US dollar has been subjected to continuous depreciation87. While episodes of devaluation by the central bank were a reason for the depreciation of rupee; the other is purely the market driven reason affecting demand and supply of domestic currency88. But it can be seen that the exchange rate becoming stronger in terms of the Indian rupee in the later periods89. The changes in the exchange rate is a motive for capital gains and this can be considered as a crucial variable affecting the short-term capital inflows into the country. The variable used here was changes in exchange rate assuming the investor had perfect foresight. The change in exchange rates is taken by I/e*de/dt, i.e. E(e) = ∆ e.
METHODOLOGY
For identifying the factors causing the inflows of foreign portfolio investment into the Indian economy, we estimate above specified model through the application of time series methodology. But different methodologies have different context of appropriateness in their applications. Their suitable use mainly depends on the nature of the data or time series properties of the variables i.e. how do they behave over a period. Therefore, before implementing any time series estimation methodology, we investigate the time series properties of the variables used in the model.
Unit root tests
The starting point of analysing the time series properties is to identify the presence of unit-root in the series90. In order to uncover a true relationship among time series variables, it is essential to check for non- stationarity or the presence of unit roots in the time series variables91. Firstly, the variable has to be tested through ADF92 unit root tests for finding out the presence of unit-roots. The results are reported in the table below .
87 See Appendix- Figure.4. 88 This can be due to reasons such as a positive current account balance and currency interventions in the foreign exchange market. 89 While this strengthening of the domestic currency was also attributed to the positive current account receipts. 90 The conventional method of regression of time series variables that are non-stationary often leads to the problem of spurious regression. The regression co-efficient of variables that are non-stationary shows statistically significant results, which actually does not exhibit any relationship. So, it is essential to identify the presence of unit root in the time series or non-stationarity in the variables under study. 91 Granger and Newbold (1974), has reported that the time series that is non-stationary provides statistically significant results with high R^2 (goodness of fit) and very low DW (Durbin-Watson is the standard test for detecting serial correlation) statistic; indicating high auto –correlation among residuals. But he results gets reversed when stationary variables were used showing that in actual terms, there existed no relationship between the variables and the results obtained earlier are spurious. 92 Dicky-Fuller (DF) and Augmented Dicky Fuller (ADF) are standard tests for unit-root.
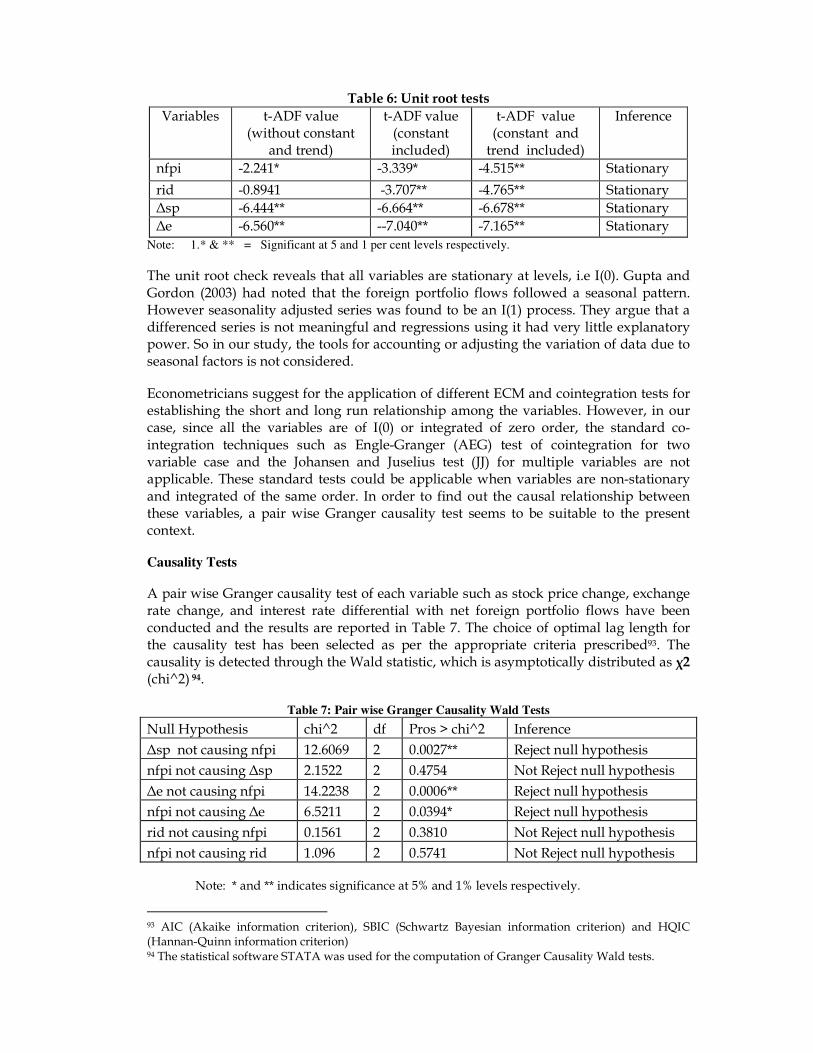
Table 6: Unit root tests
Variables t-ADF value (without constant and trend)
t-ADF value (constant included)
t-ADF value (constant and trend included)
Inference
nfpi -2.241* -3.339* -4.515** Stationary
rid -0.8941 -3.707** -4.765** Stationary
∆sp -6.444** -6.664** -6.678** Stationary
∆e -6.560** --7.040** -7.165** Stationary
Note: 1.* & ** = Significant at 5 and 1 per cent levels respectively.
The unit root check reveals that all variables are stationary at levels, i.e I(0). Gupta and Gordon (2003) had noted that the foreign portfolio flows followed a seasonal pattern. However seasonality adjusted series was found to be an I(1) process. They argue that a differenced series is not meaningful and regressions using it had very little explanatory power. So in our study, the tools for accounting or adjusting the variation of data due to seasonal factors is not considered.
Econometricians suggest for the application of different ECM and cointegration tests for establishing the short and long run relationship among the variables. However, in our case, since all the variables are of I(0) or integrated of zero order, the standard co-integration techniques such as Engle-Granger (AEG) test of cointegration for two variable case and the Johansen and Juselius test (JJ) for multiple variables are not applicable. These standard tests could be applicable when variables are non-stationary and integrated of the same order. In order to find out the causal relationship between these variables, a pair wise Granger causality test seems to be suitable to the present context.
Causality Tests
A pair wise Granger causality test of each variable such as stock price change, exchange rate change, and interest rate differential with net foreign portfolio flows have been conducted and the results are reported in Table 7. The choice of optimal lag length for the causality test has been selected as per the appropriate criteria prescribed93. The causality is detected through the Wald statistic, which is asymptotically distributed as χ2 (chi^2) 94.
Table 7: Pair wise Granger Causality Wald Tests
Null Hypothesis chi^2 df Pros > chi^2 Inference
∆sp not causing nfpi 12.6069 2 0.0027** Reject null hypothesis
nfpi not causing ∆sp 2.1522 2 0.4754 Not Reject null hypothesis
∆e not causing nfpi 14.2238 2 0.0006** Reject null hypothesis
nfpi not causing ∆e 6.5211 2 0.0394* Reject null hypothesis
rid not causing nfpi 0.1561 2 0.3810 Not Reject null hypothesis
nfpi not causing rid 1.096 2 0.5741 Not Reject null hypothesis
Note: * and ** indicates significance at 5% and 1% levels respectively.
93 AIC (Akaike information criterion), SBIC (Schwartz Bayesian information criterion) and HQIC (Hannan-Quinn information criterion) 94 The statistical software STATA was used for the computation of Granger Causality Wald tests.
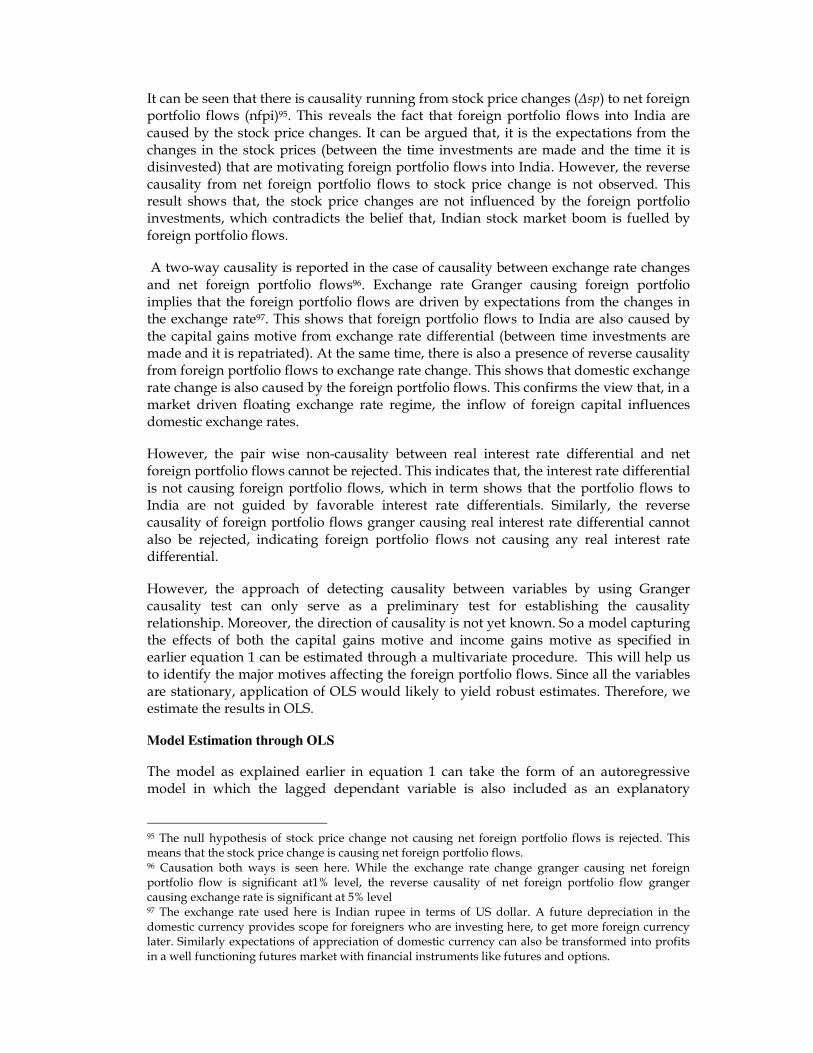
It can be seen that there is causality running from stock price changes (∆sp) to net foreign portfolio flows (nfpi)95. This reveals the fact that foreign portfolio flows into India are caused by the stock price changes. It can be argued that, it is the expectations from the changes in the stock prices (between the time investments are made and the time it is disinvested) that are motivating foreign portfolio flows into India. However, the reverse causality from net foreign portfolio flows to stock price change is not observed. This result shows that, the stock price changes are not influenced by the foreign portfolio investments, which contradicts the belief that, Indian stock market boom is fuelled by foreign portfolio flows.
A two-way causality is reported in the case of causality between exchange rate changes and net foreign portfolio flows96. Exchange rate Granger causing foreign portfolio implies that the foreign portfolio flows are driven by expectations from the changes in the exchange rate97. This shows that foreign portfolio flows to India are also caused by the capital gains motive from exchange rate differential (between time investments are made and it is repatriated). At the same time, there is also a presence of reverse causality from foreign portfolio flows to exchange rate change. This shows that domestic exchange rate change is also caused by the foreign portfolio flows. This confirms the view that, in a market driven floating exchange rate regime, the inflow of foreign capital influences domestic exchange rates.
However, the pair wise non-causality between real interest rate differential and net foreign portfolio flows cannot be rejected. This indicates that, the interest rate differential is not causing foreign portfolio flows, which in term shows that the portfolio flows to India are not guided by favorable interest rate differentials. Similarly, the reverse causality of foreign portfolio flows granger causing real interest rate differential cannot also be rejected, indicating foreign portfolio flows not causing any real interest rate differential.
However, the approach of detecting causality between variables by using Granger causality test can only serve as a preliminary test for establishing the causality relationship. Moreover, the direction of causality is not yet known. So a model capturing the effects of both the capital gains motive and income gains motive as specified in earlier equation 1 can be estimated through a multivariate procedure. This will help us to identify the major motives affecting the foreign portfolio flows. Since all the variables are stationary, application of OLS would likely to yield robust estimates. Therefore, we estimate the results in OLS.
Model Estimation through OLS
The model as explained earlier in equation 1 can take the form of an autoregressive model in which the lagged dependant variable is also included as an explanatory
95 The null hypothesis of stock price change not causing net foreign portfolio flows is rejected. This means that the stock price change is causing net foreign portfolio flows. 96 Causation both ways is seen here. While the exchange rate change granger causing net foreign portfolio flow is significant at1% level, the reverse causality of net foreign portfolio flow granger causing exchange rate is significant at 5% level 97 The exchange rate used here is Indian rupee in terms of US dollar. A future depreciation in the domestic currency provides scope for foreigners who are investing here, to get more foreign currency later. Similarly expectations of appreciation of domestic currency can also be transformed into profits in a well functioning futures market with financial instruments like futures and options.
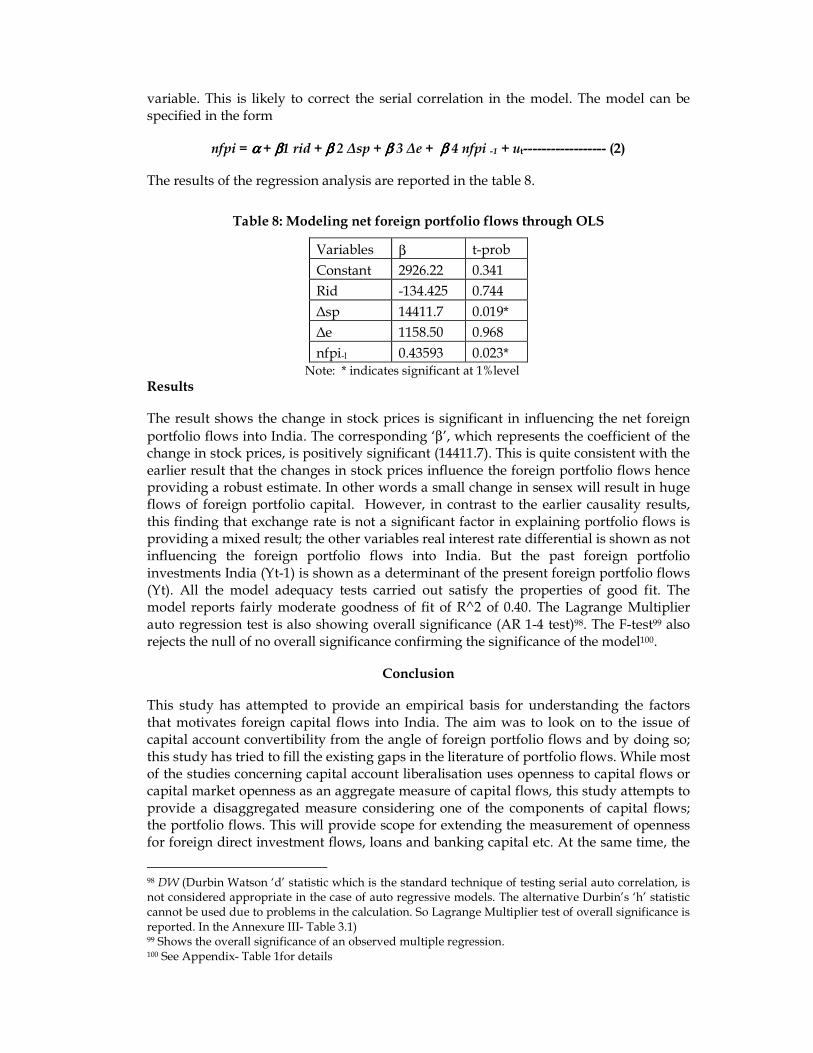
variable. This is likely to correct the serial correlation in the model. The model can be specified in the form
nfpi = αααα + ββββ1 rid + ββββ 2 ∆sp + ββββ 3 ∆e + ββββ 4 nfpi -1 + ut------------------ (2)
The results of the regression analysis are reported in the table 8.
Table 8: Modeling net foreign portfolio flows through OLS
Variables β t-prob
Constant 2926.22 0.341
Rid -134.425 0.744
∆sp 14411.7 0.019*
∆e 1158.50 0.968
nfpi-l 0.43593 0.023* Note: * indicates significant at 1%level
Results
The result shows the change in stock prices is significant in influencing the net foreign
portfolio flows into India. The corresponding ‘β’, which represents the coefficient of the change in stock prices, is positively significant (14411.7). This is quite consistent with the earlier result that the changes in stock prices influence the foreign portfolio flows hence providing a robust estimate. In other words a small change in sensex will result in huge flows of foreign portfolio capital. However, in contrast to the earlier causality results, this finding that exchange rate is not a significant factor in explaining portfolio flows is providing a mixed result; the other variables real interest rate differential is shown as not influencing the foreign portfolio flows into India. But the past foreign portfolio investments India (Yt-1) is shown as a determinant of the present foreign portfolio flows (Yt). All the model adequacy tests carried out satisfy the properties of good fit. The model reports fairly moderate goodness of fit of R^2 of 0.40. The Lagrange Multiplier auto regression test is also showing overall significance (AR 1-4 test)98. The F-test99 also rejects the null of no overall significance confirming the significance of the model100.
Conclusion
This study has attempted to provide an empirical basis for understanding the factors that motivates foreign capital flows into India. The aim was to look on to the issue of capital account convertibility from the angle of foreign portfolio flows and by doing so; this study has tried to fill the existing gaps in the literature of portfolio flows. While most of the studies concerning capital account liberalisation uses openness to capital flows or capital market openness as an aggregate measure of capital flows, this study attempts to provide a disaggregated measure considering one of the components of capital flows; the portfolio flows. This will provide scope for extending the measurement of openness for foreign direct investment flows, loans and banking capital etc. At the same time, the
98 DW (Durbin Watson ‘d’ statistic which is the standard technique of testing serial auto correlation, is not considered appropriate in the case of auto regressive models. The alternative Durbin’s ‘h’ statistic cannot be used due to problems in the calculation. So Lagrange Multiplier test of overall significance is reported. In the Annexure III- Table 3.1) 99 Shows the overall significance of an observed multiple regression. 100 See Appendix- Table 1for details
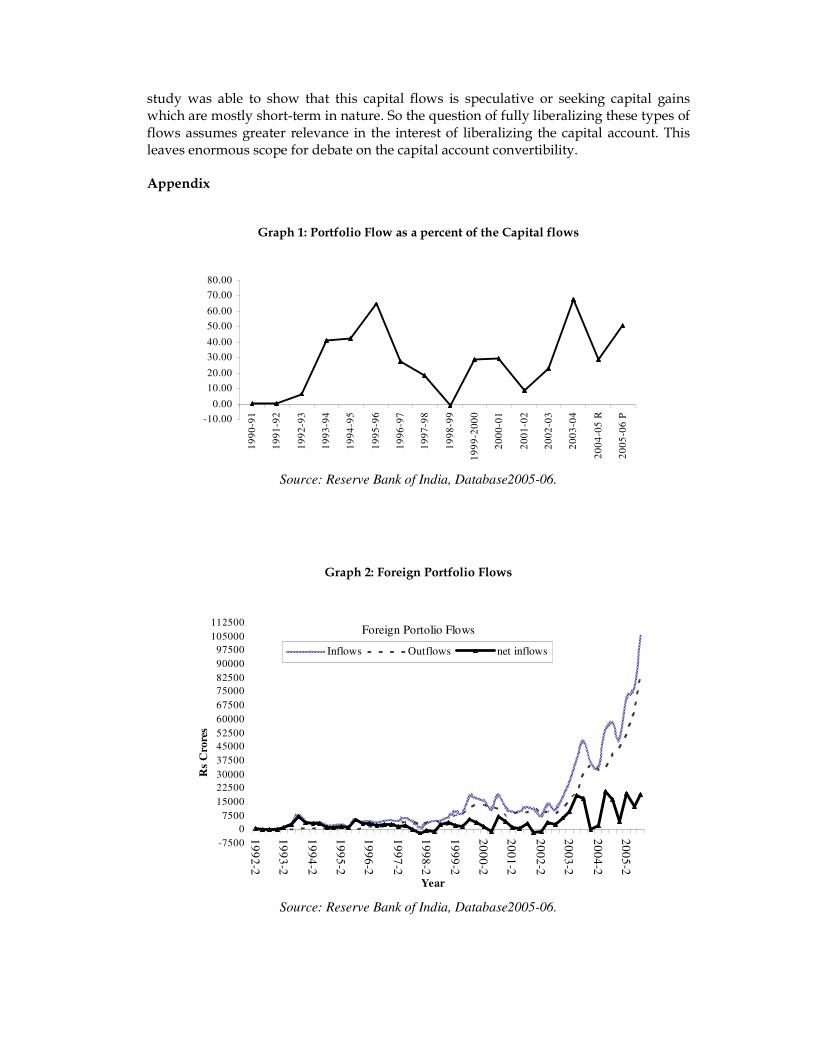
study was able to show that this capital flows is speculative or seeking capital gains which are mostly short-term in nature. So the question of fully liberalizing these types of flows assumes greater relevance in the interest of liberalizing the capital account. This leaves enormous scope for debate on the capital account convertibility. Appendix
Graph 1: Portfolio Flow as a percent of the Capital flows
-10.00
0.00
10.00
20.00
30.00
40.00
50.00
60.00
70.00
80.00
19
90
-91
19
91
-92
19
92
-93
19
93
-94
19
94
-95
19
95
-96
19
96
-97
19
97
-98
19
98
-99
19
99
-20
00
20
00
-01
20
01
-02
20
02
-03
20
03
-04
20
04
-05
R
20
05
-06
P
Source: Reserve Bank of India, Database2005-06.
Graph 2: Foreign Portfolio Flows
Foreign Portolio Flows
-7500
0
7500
15000
22500
30000
37500
45000
52500
60000
67500
75000
82500
90000
97500
105000
112500
19
92
-2
19
93
-2
19
94
-2
19
95
-2
19
96
-2
19
97
-2
19
98
-2
19
99
-2
20
00
-2
20
01
-2
20
02
-2
20
03
-2
20
04
-2
20
05
-2
Year
Rs
Cro
res
Inflows Outflows net inflows
Source: Reserve Bank of India, Database2005-06.
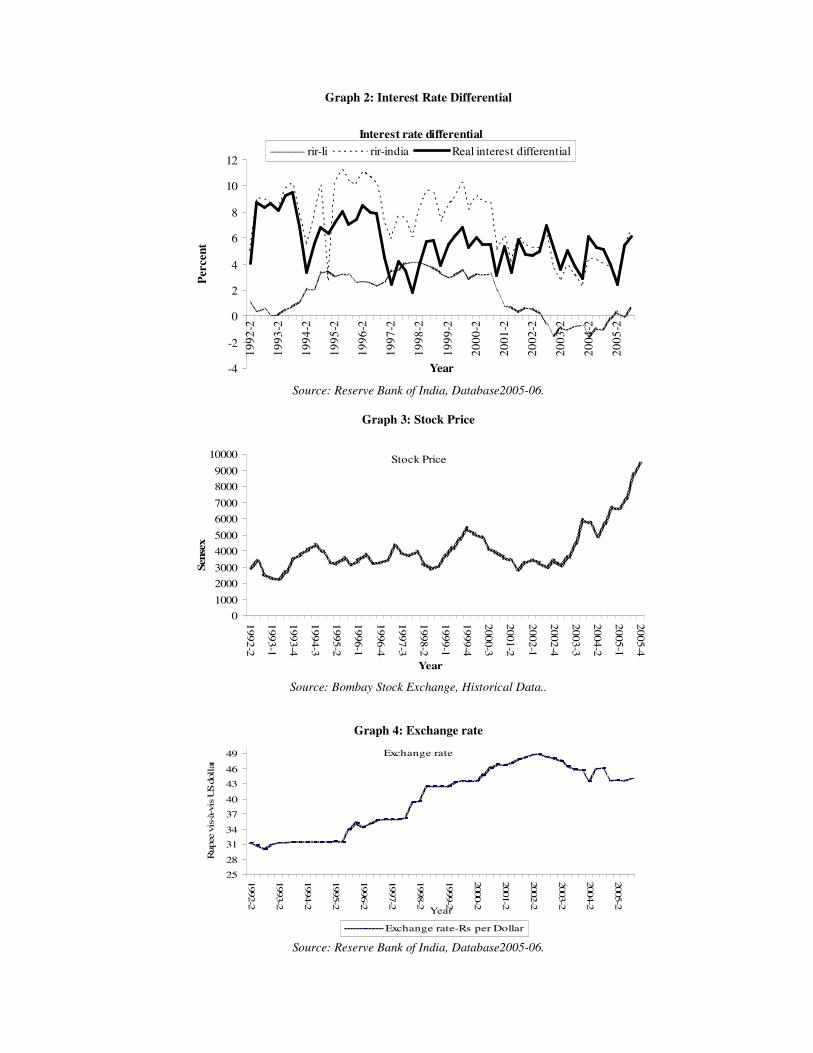
Graph 2: Interest Rate Differential
Interest rate differential
-4
-2
0
2
4
6
8
10
12
19
92
-2
19
93
-2
19
94
-2
19
95
-2
19
96
-2
19
97
-2
19
98
-2
19
99
-2
20
00
-2
20
01
-2
20
02
-2
20
03
-2
20
04
-2
20
05
-2
Year
Per
cen
t
rir-li rir-india Real interest differential
Source: Reserve Bank of India, Database2005-06.
Graph 3: Stock Price
Stock Price
0
1000
2000
3000
4000
5000
6000
7000
8000
9000
10000
1992-2
1993-1
1993-4
1994-3
1995-2
1996-1
1996-4
1997-3
1998-2
1999-1
1999-4
2000-3
2001-2
2002-1
2002-4
2003-3
2004-2
2005-1
2005-4
Year
Sen
sex
Source: Bombay Stock Exchange, Historical Data..
Graph 4: Exchange rate
Exchange rate
25
28
31
34
37
40
43
46
49
1992-2
1993-2
1994-2
1995-2
1996-2
1997-2
1998-2
1999-2
2000-2
2001-2
2002-2
2003-2
2004-2
2005-2
Year
Rupee
vis
-à-v
is U
S d
ollar
Exchange rate-Rs per Dollar
Source: Reserve Bank of India, Database2005-06.
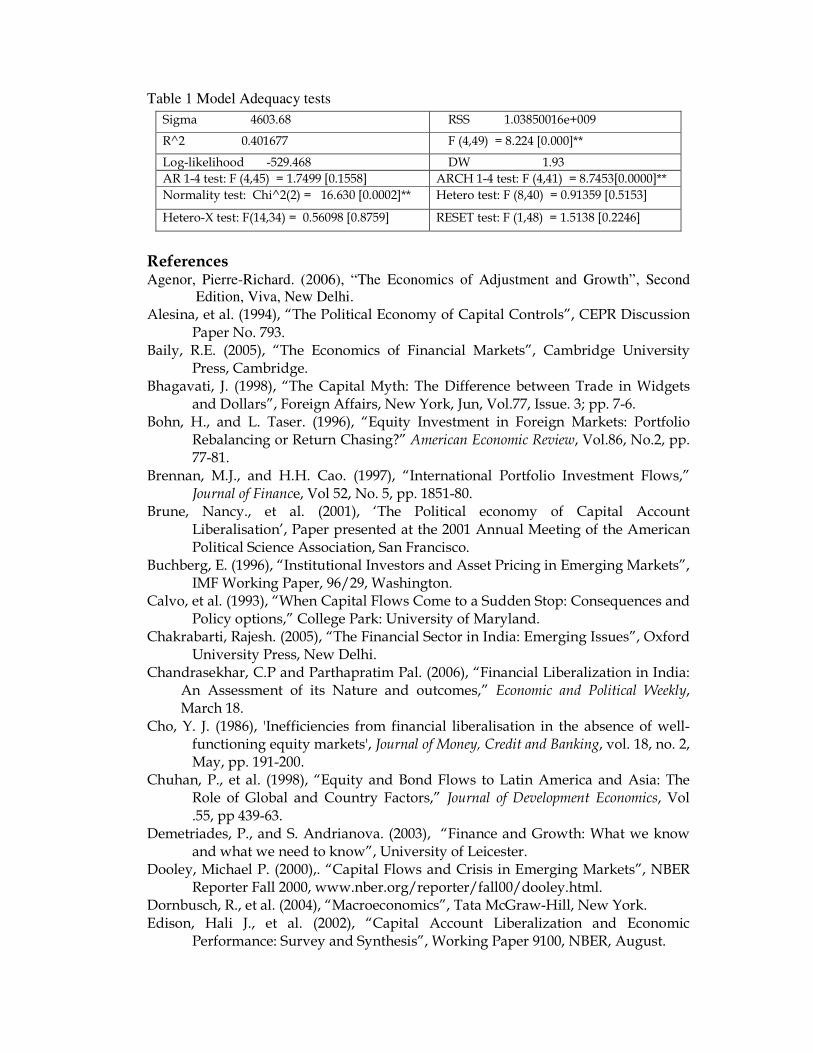
Table 1 Model Adequacy tests
Sigma 4603.68 RSS 1.03850016e+009
R^2 0.401677 F (4,49) = 8.224 [0.000]**
Log-likelihood -529.468 DW 1.93
AR 1-4 test: F (4,45) = 1.7499 [0.1558] ARCH 1-4 test: F (4,41) = 8.7453[0.0000]**
Normality test: Chi^2(2) = 16.630 [0.0002]** Hetero test: F (8,40) = 0.91359 [0.5153]
Hetero-X test: F(14,34) = 0.56098 [0.8759] RESET test: F (1,48) = 1.5138 [0.2246]
References Agenor, Pierre-Richard. (2006), “The Economics of Adjustment and Growth”, Second
Edition, Viva, New Delhi. Alesina, et al. (1994), “The Political Economy of Capital Controls”, CEPR Discussion
Paper No. 793. Baily, R.E. (2005), “The Economics of Financial Markets”, Cambridge University
Press, Cambridge. Bhagavati, J. (1998), “The Capital Myth: The Difference between Trade in Widgets
and Dollars”, Foreign Affairs, New York, Jun, Vol.77, Issue. 3; pp. 7-6. Bohn, H., and L. Taser. (1996), “Equity Investment in Foreign Markets: Portfolio
Rebalancing or Return Chasing?” American Economic Review, Vol.86, No.2, pp. 77-81.
Brennan, M.J., and H.H. Cao. (1997), “International Portfolio Investment Flows,” Journal of Finance, Vol 52, No. 5, pp. 1851-80.
Brune, Nancy., et al. (2001), ‘The Political economy of Capital Account Liberalisation’, Paper presented at the 2001 Annual Meeting of the American Political Science Association, San Francisco.
Buchberg, E. (1996), “Institutional Investors and Asset Pricing in Emerging Markets”, IMF Working Paper, 96/29, Washington.
Calvo, et al. (1993), “When Capital Flows Come to a Sudden Stop: Consequences and Policy options,” College Park: University of Maryland.
Chakrabarti, Rajesh. (2005), “The Financial Sector in India: Emerging Issues”, Oxford University Press, New Delhi.
Chandrasekhar, C.P and Parthapratim Pal. (2006), “Financial Liberalization in India: An Assessment of its Nature and outcomes,” Economic and Political Weekly, March 18.
Cho, Y. J. (1986), 'Inefficiencies from financial liberalisation in the absence of well-functioning equity markets', Journal of Money, Credit and Banking, vol. 18, no. 2, May, pp. 191-200.
Chuhan, P., et al. (1998), “Equity and Bond Flows to Latin America and Asia: The Role of Global and Country Factors,” Journal of Development Economics, Vol .55, pp 439-63.
Demetriades, P., and S. Andrianova. (2003), “Finance and Growth: What we know and what we need to know”, University of Leicester.
Dooley, Michael P. (2000),. “Capital Flows and Crisis in Emerging Markets”, NBER Reporter Fall 2000, www.nber.org/reporter/fall00/dooley.html.
Dornbusch, R., et al. (2004), “Macroeconomics”, Tata McGraw-Hill, New York. Edison, Hali J., et al. (2002), “Capital Account Liberalization and Economic
Performance: Survey and Synthesis”, Working Paper 9100, NBER, August.
Edwards, S and M.S Khan. (1985), “Interest Rate Determination in Developing Countries: A conceptual Framework”, Working Paper No.1531, National Bureau of Economic Research.
Edwards, S. (2007), “Capital Controls, Capital Flow Contractions and Macroeconomic Vulnerability”, NBER Working Paper No. 12852, January 2007.
Fischer, S. (1997), "'Capital Account Liberalization and the Role of the IMF," Paper presented at the seminar Asia and the IMF, held in Hong Kong, China, on September 19, 1997, International Monetary Front.
Garibaldi. P, et al. (2002), “What Moves Capital to Transition Economies?” I.M.F Working Paper, 20/64, Washington.
Global Development Finance. (2006), “The Development Potential of Surging Capital Flows”, The World Bank.
Gordon, J., and Poonam Gupta. (2003), “Portfolio Flows into India: Do Domestic Fundamentals Matter?”, I.M.F Working Paper 03/20, Washington.
Granger, C.W.J. and Newbold, P. (1974), ’Spurious Regressions in Econometrics’, Journal of Econometrics 2, 1974, pp. 111-120.
Griffin, J.M. et al. (2002), “Daily Cross-Border Equity Flows: Pushed or Pulled?”, Tempe, Arizona State University.
Henry, Peter Blair. (2006), “Capital Account Liberalization: Theory, Evidence, and Speculation”, Stanford University, Brookings Institution, and NBER.
Hernandez, L., et al. (2001), “Determinants of Private capital Flows in the 1970’s and 1990’s: Is There Evidence of Contagion?” IMF Working Paper, 01/64, 2001 Washington.
IMF. (2005), “IMF’s Approach to Capital Account Liberalisation”, Evaluation Report, International Monetary Front.
Jadhav, Narendra. (2006), “Monetary Policy Financial Stability and Central Banking in India”, Mcmillan, New Delhi,.
Jayadev, Arjun. (2007), ‘Capital Account Openness and Labour Share of Income’, Cambridge Journal of Economics, January 20.
Kletzer, K. (2004), “Liberalizing Capital Flows in India, Financial Repression, Macroeconomic Policy and Gradual Reforms”, Paper, Brookings/NCAER Conference on the Indian Economy, New Delhi, March.
Kohli, Renu. (2005), “Liberalizing Capital Flows, India’s Experiences and Policy issues”, Oxford University Press, 2005.
Liberati, Paolo. (2006), ‘Trade Openness, Financial Openness and Government Size’. Università di Urbino “Carlo Bo”, Revised Edition ISE, 2006.
Mallick. Hrushi and Udaya Shankar Misra. “Paradox of Full Capital Account Convertibility in India”, Forthcoming Article.
Mazumdar, Tanusree. (2005), “Capital Flows into India: Implications for economic growth,” Economic and Political Weekly, May 21 2005.
Nayyar, Deepak. (2003), “Capital controls and World Financial Authority: What Can we Learn from the Indian Experience?” in International Capital Markets Systems in Transition edited by John Eatwel and Lance Taylor, Oxford University Press.
Obstfeld. M, A. Taylor. (2004),“Global Capital Markets”, Cambridge University Press, New York.
Obstfeld. M. (1998), “The Global Capital Market: Benefactor or Menace?”, prepared Journal of Economic Perspectives, April 27.
Pal, P. (1998), “Foreign Portfolio in Indian Stock Markets, Has the Economy Benefited?” Economic and Political Weekly, March14, pp.589-98.
Pal, P. (2005), “Volatility in the Stock Market in India and Foreign Institutional Investors” Economic and Political Weekly, February 19, pp.765-772.
Patnaik, Prabhat and Vikas Rawal. (2005), “Level of Activity in an Economy with Free Capital Mobility”, Economic and Political Weekly, April 2.
Patnaik, Prabhat. (2006), “Financial Flows and Open Economy Macroeconomics” IDEAS and UNDP conference on Post Liberalization Constraints on Macroeconomic Policies, Chennai, January.
Pillai, Vijayamohan. (2001), “Electricity Demand and Forecasting- The Tradition is Questioned”, Centre for Development Studies Working Paper no. 321, Trivandrum.
Prasad. et al. (2003), “Effects of Financial Globalization on Developing Countries: Some Empirical Evidence”, Occasional Papers, No 220, IMF.
Quinn and Carla Inclan. (1997), “The Origins of Financial Openness: A Study of Current and Capital Account Liberalization,” American Journal of Political Science Vol 41, pp 771-813.
Rai, Kulwant and N.R Banumoorthy. (2004), “Determinants of Foreign Institutional Investment in India: The Role of Return, Risk, and Inflation”, The Developing Economies, Volume XLII-4, December, pp 479–93
Rakshit, Mihir. (2006), “On liberalizing Foreign Institutional Investments”, Economic and Political Weekly, March 18, pp 991-998.
Rangarajan, C. (20000, “Capital Flows: Another Look,” Economic and Political Weekly, December 9, 2000, pp 4421-4427.
Rao, Chalapati K.S., et al. (1999), “Foreign Institutional Investments and the Indian Stock Market”, Journal of Indian School of Political Economy, Oct-Dec 1999, pp.623-647.
RBI, Data Base on the Indian Economy, https://reservebank.org.in/cdbmsi/servlet/login/
RBI, Handbook of Statistics on Indian Economy,http://www.rbi.org.in/scripts/AnnualPublications. RBI, Report on Currency and Finance, http://www.rbi.org.in/scripts/PublicationReportDetails.
RBI. (1997). Report of the Committee on Capital Account Convertibility, May. RBI. (2006). Report of the Committee on Fuller Capital Account Convertibility, July. RBI. Annual Reports, http://www.rbi.org.in/scripts/Annualreportarchives.aspx
Richards, A. (2002), “Big Fish in Small Ponds: The Momentum Investing and Price Impact of Foreign Investors in Asian Emerging Markets”, Reserve Bank of Australia, Sydney.
Rodrik, D., Andres Velasco. (1999), “Short-Term Capital Flows”, Annual World Bank Conference on Development Economics.
Rodrik. D. (1994), "Who Needs Capital-Account Convertibility?", in Should the IMF Pursue Capital Account Convertibility, Essays in International Finance, No 207, Princeton University, New Jersey.
Samal, K.C. (1997), “Emerging Equity Market in India, Role of Foreign Institutional Investors”, Economic and Political Weekly, October18, pp. 2729-2732.
Securities and Exchange Board of India, Annual Report, http://www.sebi.gov.in Sen, Partha. (2006), “Case against Rushing into Full Capital Account Convertibility”,
Economic and Political Weekly, May 13, pp. 1853-1857.
Sen, Sunanda. (2004), “Global Finance at Risk, On Real Stagnation and Instability”, Oxford University Press.
Singh, Ajith. (1997), “Financial Liberalisation, Stock markets and Economic Development”, The Economic Journal, Vol. 107, No. 442, May, pp. 771-782.
Singh, Ajith. (2002), “Capital Account Liberalization, Free Long-Term Capital Flows, Financial Crises and Economic Development”, EEA, Boston.
Stiglitz, J. E, and Weiss, A. (1981), 'Credit Rationing in Markets with Imperfect Information.' American Economic Review, vol. 71, no. 3, June, pp. 393-410.
Stiglitz, J.E, et al. (2006), “Stability with Growth Macroeconomics, Liberalisation and Development”, Oxford University Press, New Delhi.
Stiglitz, J.E. (2000), “Capital Market Liberalisation, economic growth and Instability”, World Development Vol. 28, No. 6, pp. 1075±1086.
Stiglitz, J.E. (2004), “Capital Market Liberalisation, Globalization and the IMF”, Oxford Review of economic Policy, Vol 1, 2004.
Stulz, Rene M. (1999), “International Portfolio flows and Security Markets”, Revised version, NBER.
Sundaram, Jomo. (2004), Malaysia’s Pathway through Financial Crisis”, Working Paper 2004/08, Global Economic Governance Programme.
Tarapore, S.S. (1998), “An Indian Approach to Capital Account Convertibility”, in Should the IMF Pursue Capital Account Convertibility, Essays in International Finance, No 207, Princeton University, New Jersey, 1998.
Vasudevan, A. (2006), “Great Indian Story of Convertibility”, Economic and Political Weekly, May 13, pp 1881-1884.
Weller, Christian E and Radha Chaurushiya. (2006), “Managing Portfolio Flows”, Journal of Economic Issues, Vol XL, No 2, June 2006.
Williamson, John. (2006), “Why Capital Account Convertibility in Indian is Premature”, Economic and Political Weekly, May, pp 1848-1850.