Embed Size (px)
Citation preview
Foreign Portfolio Holdings of U.S. Securities
as of June 30, 2012
Department of the Treasury
Federal Reserve Bank of New York
Board of Governors of the Federal Reserve System
April 2013
i
Introduction ....................................................................................................................................1
Chapter 1. Results of the June 30, 2012 Survey .........................................................................3
Primary Findings from the Survey ...................................................................................................3 Table 1. Foreign holdings of U.S. securities, by type of security, as of selected
survey dates ......................................................................................................3
Shares of U.S. Long-Term Securities that are Foreign-Owned .......................................................4 Table 2. Value of foreign-owned U.S. long-term securities and share of the total
outstanding, by asset class, as of selected survey dates ...................................5
Comparison of Survey Results with Estimated Holdings ................................................................5 Table 3. Measured and estimated value of foreign holdings of U.S. long-term
securities, by type of security, as of June 30, 2012 ...........................................6
Table 4. Foreign holdings of U.S. securities as measured by the survey of portfolio holdings and the TIC SLT, by type of security, as of June 2012 ..................................................................................................................7
Comparison with U.S. Holdings of Foreign Long-Term Securities ................................................8 Table 5. U.S. holdings of foreign long-term securities and foreign holdings of
U.S. long-term securities, as of selected survey dates ......................................8
Foreign Holdings of U.S. Securities by Country of Holder .............................................................9 Table 6. Value of foreign holdings of U.S. securities, by major investing country
and type of security, as of June 30, 2012 ..........................................................9
Holdings by Country as of the Dates of the Two Most Recent Surveys .......................................11 Table 7. Value of foreign holdings of U.S. long- and short-term securities, by
major investing country, as of June 30, 2011, and June 30, 2012 .................11
Comparison with the TIC SLT by Country ...................................................................................12 Table 8. Foreign holdings of U.S. long-term securities as measured by the
survey of portfolio holdings and the TIC SLT, by country and security type, as of June 2012 ......................................................................................13
Holdings of U.S. Securities by Foreign Official Institutions .........................................................13 Table 9. Value of long-term securities held by foreign official institutions, and
the percentage of total foreign holdings these represent, by type of security, as of selected survey dates ...............................................................15
Table 10. Value of short-term securities held by foreign official institutions, and the percentage of total foreign holdings these represent, by type of security, as of selected survey dates ...............................................................16
Table 11. Market value of foreign official holdings of U.S. long-term Treasury securities: comparison of survey results with estimated values, for survey dates, 2000-2012 .................................................................................17
ii
Details on Foreign Holdings of Different Types of U.S. Securities as of June 2012 ....................18
Foreign Holdings of U.S. Treasury Securities, by Type of Security ......................................18
Table 12. Value of foreign holdings of U.S. Treasury debt securities, by major investing country, as of June 30, 2012 ...........................................................18
Foreign Holdings of Equity, by Type of Equity .....................................................................19
Table 13. Value of foreign holdings of U.S. equity, by major investing country and type of equity, as of June 30, 2012 ...........................................................19
Foreign Holdings of Corporate Mortgage-Backed Securities ...............................................20
Table 14. Value of foreign holdings of U.S. long-term corporate asset-backed securities, by country and type of asset, as of June 30, 2012 .........................20
Foreign Holdings of U.S. Short-Term Asset-Backed Commercial Paper .............................21
Table 15. Value of foreign holdings of U.S. commercial paper, by country and type of commercial paper, as of June 30, 2012 ..............................................21
Portfolio Investment by Region of Investor Country and Survey Year ..................................21
Table 16a. Foreign holdings of U.S. long-term securities, by region, as of selected survey dates .......................................................................................22
Table 16b. Foreign holdings of U.S. equity, by region, as of selected survey dates ................................................................................................................23
Table 16c. Foreign holdings of U.S. long-term debt securities, by region, as of selected survey dates .......................................................................................24
Table 16d. Foreign holdings of U.S. short-term securities, by region, as of selected survey dates .......................................................................................25
Maturity Structure of Foreign Holdings of U.S. Long-Term Debt Securities .......................25
Table 17a. Maturity structure of foreign holdings of U.S. long-term debt securities, as of June 30, 2012 ........................................................................26
Table 17b. Maturity structure of foreign official holdings of U.S. long-term debt securities, as of June 30, 2012 ........................................................................27
Table 17c. Maturity structure of foreign private holdings of U.S. long-term debt securities, as of June 30, 2012 ........................................................................28
Currency Composition of Foreign Holdings of U.S. Debt Securities ....................................28
Table 18a. Foreign holdings of U.S. long-term debt securities, by currency, as of June 30, 2012 ..............................................................................................29
Table 18b. Foreign holdings of U.S. short-term debt securities, by currency, as of June 30, 2012 ..............................................................................................29
iii
Table 19. Foreign holdings of U.S. long-term debt securities, by currency, as of selected survey dates .......................................................................................30
Foreign Holdings of U.S. Securities by Industry of Issuer ....................................................30
Table 20. Foreign holdings of U.S. securities, by industry, as of June 30, 2012 ...........31
Comparison of Different Types of Foreign Portfolio Investment in the United States as of Selected Dates ...............................................................................................................31
Table 21. Forms of foreign portfolio investment in the United States, as of selected survey ................................................................................................32
Chapter 2. Survey Methodology ................................................................................................33
Data Analysis and Editing ..............................................................................................................33
Adjustments and Calculation of Total Foreign Holdings of U.S. Securities .................................34 Table 22. Adjustments to data to account for over-reporting and for reporters
omitted from annual panel as of June 30, 2012..............................................34
Treatment of Repurchase and Securities Lending Agreements ......................................................35
Acknowledgments ..........................................................................................................................35
Statistical Appendix .....................................................................................................................37 Table A1. Value of foreign holdings of U.S. securities, by country and type of
security, as of June 30, 2012 ..........................................................................38
Table A2. Value of foreign holdings of U.S. long-term securities, by country and type of security, as of June 30, 2012 ...............................................................44
Table A3. Value of foreign holdings of U.S. Treasury debt securities, by country and type of Treasury security, as of June 30, 2012 ........................................50
Table A4. Value of foreign holdings of U.S. equity, by country and type of equity, as of June 30, 2012 .............................................................................55
Table A5. Foreign holdings of U.S. long-term asset-backed securities, by country and type of security, as of June 30, 2012 ..........................................61
Table A6. Foreign holdings of U.S. short-term securities, by country and type of security, as of June 30, 2012 ..........................................................................65
Table A7. Foreign holdings of U.S. securities, by country, as of selected survey dates ................................................................................................................69
Table A8. Foreign holdings of U.S. equity, by country, as of selected survey dates ................................................................................................................75
Table A9. Foreign holdings of U.S. long-term debt securities, by country, as of selected survey dates .......................................................................................81
Table A10. Foreign holdings of U.S. short-term debt securities, by country, as of selected survey dates ..................................................................................87
iv
Table A11. Foreign holdings of U.S. securities, by industry, as of June 30, 2012 ........92
Table A12. Value of foreign holdings of U.S. Treasury Inflation-Protected Securities (TIPS), by country, as of selected survey dates .............................94
Forms and Instructions ...............................................................................................................99
1
Introduction
This report presents data and analysis of foreign portfolio investment in U.S. securities based primarily on the Treasury International Capital (TIC) survey of foreign holdings of U.S. securities as of June 30, 2012.1 TIC is a joint undertaking of the U.S. Treasury Department, the Federal Reserve Bank of New York, and the Board of Governors of the Federal Reserve System. The report includes data from surveys dating back to June 2004. Earlier survey reports can be found on the Department of the Treasury’s website at http://www.treasury.gov/resource-center/data-chart-center/tic/Pages/fpis.aspx. A file containing data from earlier surveys conducted beginning in 1974 can be found at http://www.treasury.gov/resource-center/data-chart-center/tic/Documents/shlhistdat.html.2
From 1974 to 2000, benchmark surveys of foreign portfolio investment in U.S. securities were conducted at approximately five-year intervals. Those surveys, collected from a comprehensive panel of reporters, measured only foreign holdings of U.S. long-term securities.3 Since 2002, the surveys have improved in two ways. First, in addition to the benchmark surveys, which have continued at five-year intervals, annual surveys have been conducted as of the end of June. Second, surveys now measure foreign holdings of U.S. short-term securities as well as those of long-term securities. In the four years following each benchmark survey, the annual surveys collect data primarily from the largest reporters, who collectively reported at least 90 percent of the market value of foreign holdings as measured by the preceding benchmark survey. Information from the annual surveys is “grossed up” (adjusted upward) to present holdings that are representative of the data that would have been collected from a full benchmark panel of data reporters. The last full benchmark survey was conducted in June 2009. Details on the procedures used to adjust the 2012 survey data upwards to account for the smaller 2012 panel are discussed in Chapter 2. All figures presented in this report reflect the final “grossed up” values.
The surveys collect data at the individual security level, allowing analysis in a variety of ways, such as by country of foreign holder, currency, security type, remaining maturity, type of foreign holder, and industry. In addition, the security-level detail allows for extensive data review and for correction of errors that might otherwise go undetected. Chapter 2 also discusses details of the survey collection methodology and the procedures used for data review and analysis. The surveys are conducted under the authority of the International Investment and Trade in Services Survey Act (22 U.S.C. 3101 et seq.). Reporting is mandatory for all institutions meeting the survey's reporting criteria, and significant penalties can be imposed for failure to report. All holdings are measured at market value as of the survey dates. With the exception of zero-coupon
1 Foreign portfolio investment in U.S. securities, for the purposes of this report, includes all U.S. securities owned
by foreign residents except where the owner has a direct investment relationship with the U.S. issuer of the securities. Direct investment means the ownership or control, directly or indirectly, by one person or by a group of affiliated persons, of 10 percent or more of the voting stock of an incorporated business enterprise, or an equivalent interest in an unincorporated enterprise.
2 Prior to 1974, surveys were conducted in 1853, 1869, and 1941 by the Department of the Treasury and in 1934 and 1937 by the Department of Commerce.
3 Long-term securities are defined as those without a stated maturity date (such as equities) or with an original term-to-maturity greater than one year.
2
debt securities, all market values reflect “clean prices,” that is, values computed exclusive of accrued interest.
The surveys are part of the U.S. system to measure portfolio investment into and out of the United States, known as the Treasury International Capital (TIC) reporting system. In addition to surveys of foreign ownership of U.S. securities conducted annually as of the end of June, the TIC system also conducts annual surveys of U.S. holdings of foreign securities as of the end of December. On a monthly basis, the TIC system collects data on foreign purchases and sales of U.S. long-term securities and U.S. purchases and sales of foreign securities (the TIC S form). The monthly data provide timely aggregate information on cross-border transactions in securities, while the surveys provide detailed annual information on holdings of securities. Finally, the new TIC form SLT, “Aggregate Holdings of Long-Term Securities by U.S. and Foreign Residents,” collects monthly aggregate data on both foreign holdings of U.S securities and U.S. holdings of foreign securities. The TIC data are on the Department of the Treasury’s website at http://www.treasury.gov/resource-center/data-chartcenter/tic/Pages/index.aspx. Detailed information on the methodologies employed by the monthly transactions system and the annual surveys, as well as a discussion of the introduction of the TIC form SLT can be found in articles posted on the same website (http://www.treasury.gov/resource-center/data-chart-center/tic/Pages/articles.aspx).4
This report includes two new tables that compare results of the June 2012 annual survey with results reported for June 2012 on TIC form SLT (Table 4 and Table 8); other tables in the text have been renumbered accordingly. In addition, a new appendix table (A12) presents information on foreign holdings of Treasury Inflation-Protected Securities (TIPS) for the years 2009, 2010, 2011, and 2012.
Acknowledgments The Department of the Treasury, the Federal Reserve Bank of New York and the Federal Reserve Board of Governors wish to express their appreciation to all survey respondents whose efforts and information have made this report possible.
4 C. Bertaut, W. Griever, and R. Tryon, “Understanding U.S. Cross-Border Securities Data,” Federal Reserve
Bulletin, May 2006, 59-75; E. Brandner, F. Cai, and R. Judson, “Improving the Measurement of Cross-Border Securities Holdings: The Treasury International Capital SLT,” Federal Reserve Bulletin, May 2012, 1-28.
3
Chapter 1. Results of the June 30, 2012 Survey
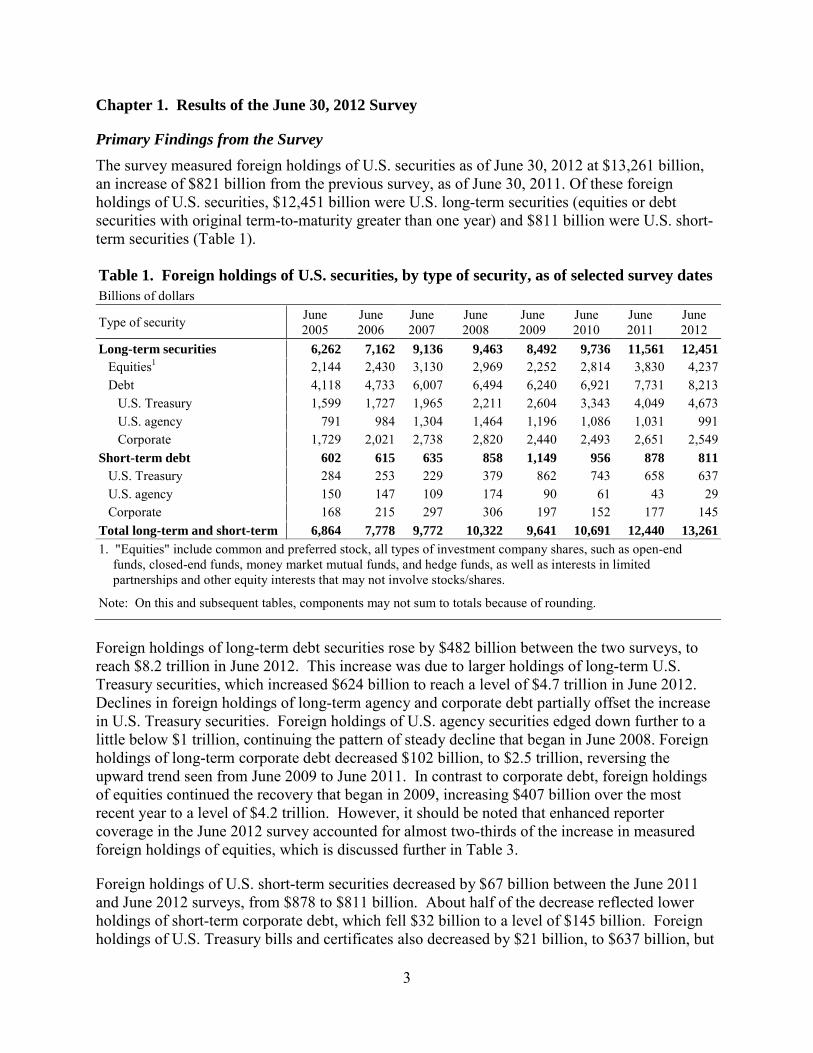
Primary Findings from the Survey The survey measured foreign holdings of U.S. securities as of June 30, 2012 at $13,261 billion, an increase of $821 billion from the previous survey, as of June 30, 2011. Of these foreign holdings of U.S. securities, $12,451 billion were U.S. long-term securities (equities or debt securities with original term-to-maturity greater than one year) and $811 billion were U.S. short-term securities (Table 1).
Table 1. Foreign holdings of U.S. securities, by type of security, as of selected survey dates Billions of dollars
Type of security June 2005
June 2006
June 2007
June 2008
June 2009
June 2010
June 2011
June 2012
Long-term securities 6,262 7,162 9,136 9,463 8,492 9,736 11,561 12,451 Equities1 2,144 2,430 3,130 2,969 2,252 2,814 3,830 4,237 Debt 4,118 4,733 6,007 6,494 6,240 6,921 7,731 8,213
U.S. Treasury 1,599 1,727 1,965 2,211 2,604 3,343 4,049 4,673 U.S. agency 791 984 1,304 1,464 1,196 1,086 1,031 991 Corporate 1,729 2,021 2,738 2,820 2,440 2,493 2,651 2,549
Short-term debt 602 615 635 858 1,149 956 878 811 U.S. Treasury 284 253 229 379 862 743 658 637 U.S. agency 150 147 109 174 90 61 43 29 Corporate 168 215 297 306 197 152 177 145
Total long-term and short-term 6,864 7,778 9,772 10,322 9,641 10,691 12,440 13,261 1. "Equities" include common and preferred stock, all types of investment company shares, such as open-end
funds, closed-end funds, money market mutual funds, and hedge funds, as well as interests in limited partnerships and other equity interests that may not involve stocks/shares.
Note: On this and subsequent tables, components may not sum to totals because of rounding.
Foreign holdings of long-term debt securities rose by $482 billion between the two surveys, to reach $8.2 trillion in June 2012. This increase was due to larger holdings of long-term U.S. Treasury securities, which increased $624 billion to reach a level of $4.7 trillion in June 2012. Declines in foreign holdings of long-term agency and corporate debt partially offset the increase in U.S. Treasury securities. Foreign holdings of U.S. agency securities edged down further to a little below $1 trillion, continuing the pattern of steady decline that began in June 2008. Foreign holdings of long-term corporate debt decreased $102 billion, to $2.5 trillion, reversing the upward trend seen from June 2009 to June 2011. In contrast to corporate debt, foreign holdings of equities continued the recovery that began in 2009, increasing $407 billion over the most recent year to a level of $4.2 trillion. However, it should be noted that enhanced reporter coverage in the June 2012 survey accounted for almost two-thirds of the increase in measured foreign holdings of equities, which is discussed further in Table 3.
Foreign holdings of U.S. short-term securities decreased by $67 billion between the June 2011 and June 2012 surveys, from $878 to $811 billion. About half of the decrease reflected lower holdings of short-term corporate debt, which fell $32 billion to a level of $145 billion. Foreign holdings of U.S. Treasury bills and certificates also decreased by $21 billion, to $637 billion, but
4
remained elevated compared to levels prior to the 2008-09 global financial crisis. Short-term U.S. agency securities declined further to $29 billion.
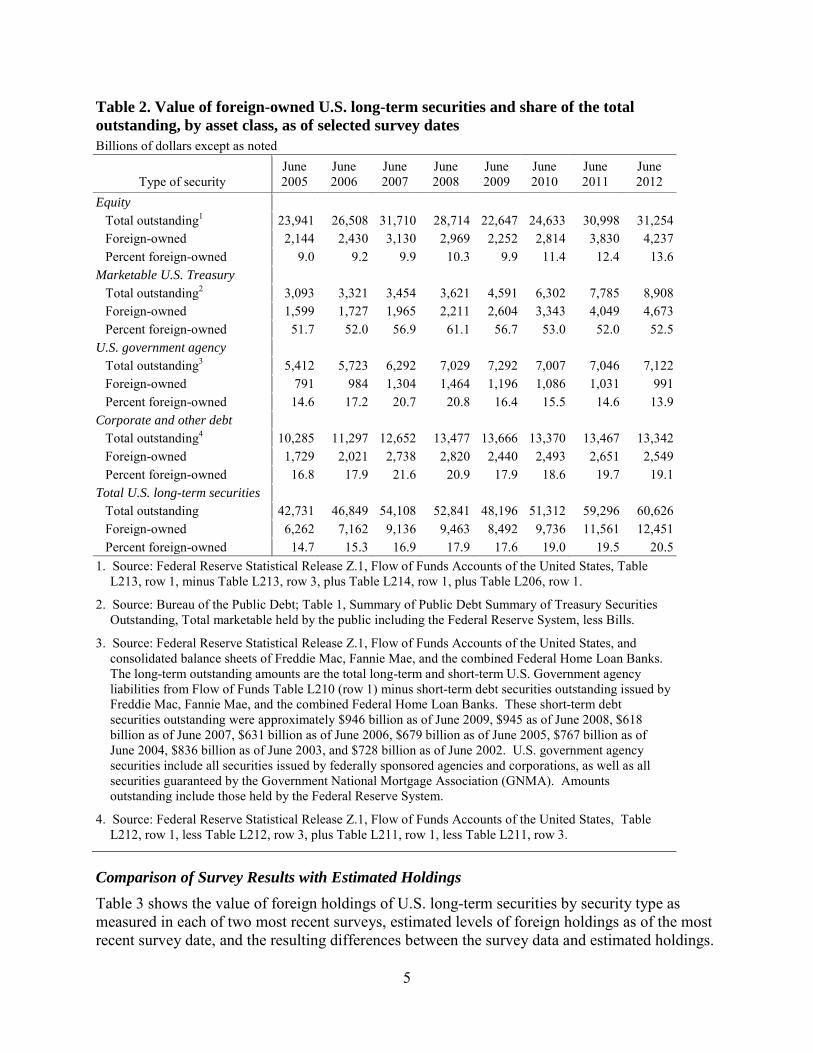
Shares of U.S. Long-Term Securities that are Foreign-Owned Table 2 reports foreign holdings of U.S. long-term securities as an estimated share of the total stock outstanding of each security type as of the survey dates. These figures should be viewed as rough indicators, as it is not possible to obtain data on the total value outstanding by security type on exactly the same basis as the survey data are collected. For example, while the table shows the face values of totals outstanding of each type of U.S. long-term debt security, foreign ownership of these U.S. long-term debt securities are presented at market value. It also should be noted that the "Equity" category includes foreign holdings of common and preferred stock, all types of investment company shares, such as open-end funds, closed-end funds, money market mutual funds, and hedge funds, as well as interests in limited partnerships and other equity interests that may not involve stocks or shares. Thus, although the following comparisons will be somewhat imprecise, they do indicate long-term trends.
The proportion of U.S. long-term securities outstanding held by foreigners has trended gently upward since 2005; between June 2011 and June 2012, the total proportion increased further to about 21 percent. Although foreign holdings of U.S. Treasury securities rose strongly after the onset of the global financial crisis, issuance of these securities has also been unusually large, so the share held by foreign investors edged down from June 2009 to June 2011. In the June 2012 survey, the share of U.S. Treasury securities outstanding held by foreigners remained almost the same at about 53 percent, which is similar to the shares held in the pre-crisis years. In large part, the continued high proportion of foreign ownership of U.S. Treasury securities is explained by holdings of foreign official institutions, discussed in greater detail below and shown in Table 9. The proportion of U.S. corporate and other debt securities outstanding held by foreigners remained fairly steady, at 19 percent in June 2012, after trending gently upward since the crisis. Foreigners held nearly 14 percent of U.S. equities outstanding in June 2012, part of an ongoing upward trend. In contrast, the share of U.S. agency securities held by foreigners has been decreasing since the crisis and was about 14 percent as of June 2012.
Of the $2,549 billion held by foreigners in the “Corporate and other debt” category, about $11 billion consists of certificates of deposit with a maturity of over one year, and about $64 billion represents foreign holdings of municipal debt securities. Foreign investors also held small amounts of debt of nonprofit organizations. In this report, this category frequently will be referred to simply as “corporate debt.”
5
Table 2. Value of foreign-owned U.S. long-term securities and share of the total outstanding, by asset class, as of selected survey dates Billions of dollars except as noted
Type of security
June 2005
June 2006
June 2007
June 2008
June 2009
June 2010
June 2011
June 2012
Equity Total outstanding1 23,941 26,508 31,710 28,714 22,647 24,633 30,998 31,254 Foreign-owned 2,144 2,430 3,130 2,969 2,252 2,814 3,830 4,237 Percent foreign-owned 9.0 9.2 9.9 10.3 9.9 11.4 12.4 13.6
Marketable U.S. Treasury Total outstanding2 3,093 3,321 3,454 3,621 4,591 6,302 7,785 8,908 Foreign-owned 1,599 1,727 1,965 2,211 2,604 3,343 4,049 4,673 Percent foreign-owned 51.7 52.0 56.9 61.1 56.7 53.0 52.0 52.5
U.S. government agency Total outstanding3 5,412 5,723 6,292 7,029 7,292 7,007 7,046 7,122 Foreign-owned 791 984 1,304 1,464 1,196 1,086 1,031 991 Percent foreign-owned 14.6 17.2 20.7 20.8 16.4 15.5 14.6 13.9
Corporate and other debt Total outstanding4 10,285 11,297 12,652 13,477 13,666 13,370 13,467 13,342 Foreign-owned 1,729 2,021 2,738 2,820 2,440 2,493 2,651 2,549 Percent foreign-owned 16.8 17.9 21.6 20.9 17.9 18.6 19.7 19.1
Total U.S. long-term securities Total outstanding 42,731 46,849 54,108 52,841 48,196 51,312 59,296 60,626 Foreign-owned 6,262 7,162 9,136 9,463 8,492 9,736 11,561 12,451 Percent foreign-owned 14.7 15.3 16.9 17.9 17.6 19.0 19.5 20.5
1. Source: Federal Reserve Statistical Release Z.1, Flow of Funds Accounts of the United States, Table L213, row 1, minus Table L213, row 3, plus Table L214, row 1, plus Table L206, row 1.
2. Source: Bureau of the Public Debt; Table 1, Summary of Public Debt Summary of Treasury Securities Outstanding, Total marketable held by the public including the Federal Reserve System, less Bills.
3. Source: Federal Reserve Statistical Release Z.1, Flow of Funds Accounts of the United States, and consolidated balance sheets of Freddie Mac, Fannie Mae, and the combined Federal Home Loan Banks. The long-term outstanding amounts are the total long-term and short-term U.S. Government agency liabilities from Flow of Funds Table L210 (row 1) minus short-term debt securities outstanding issued by Freddie Mac, Fannie Mae, and the combined Federal Home Loan Banks. These short-term debt securities outstanding were approximately $946 billion as of June 2009, $945 as of June 2008, $618 billion as of June 2007, $631 billion as of June 2006, $679 billion as of June 2005, $767 billion as of June 2004, $836 billion as of June 2003, and $728 billion as of June 2002. U.S. government agency securities include all securities issued by federally sponsored agencies and corporations, as well as all securities guaranteed by the Government National Mortgage Association (GNMA). Amounts outstanding include those held by the Federal Reserve System.
4. Source: Federal Reserve Statistical Release Z.1, Flow of Funds Accounts of the United States, Table L212, row 1, less Table L212, row 3, plus Table L211, row 1, less Table L211, row 3.
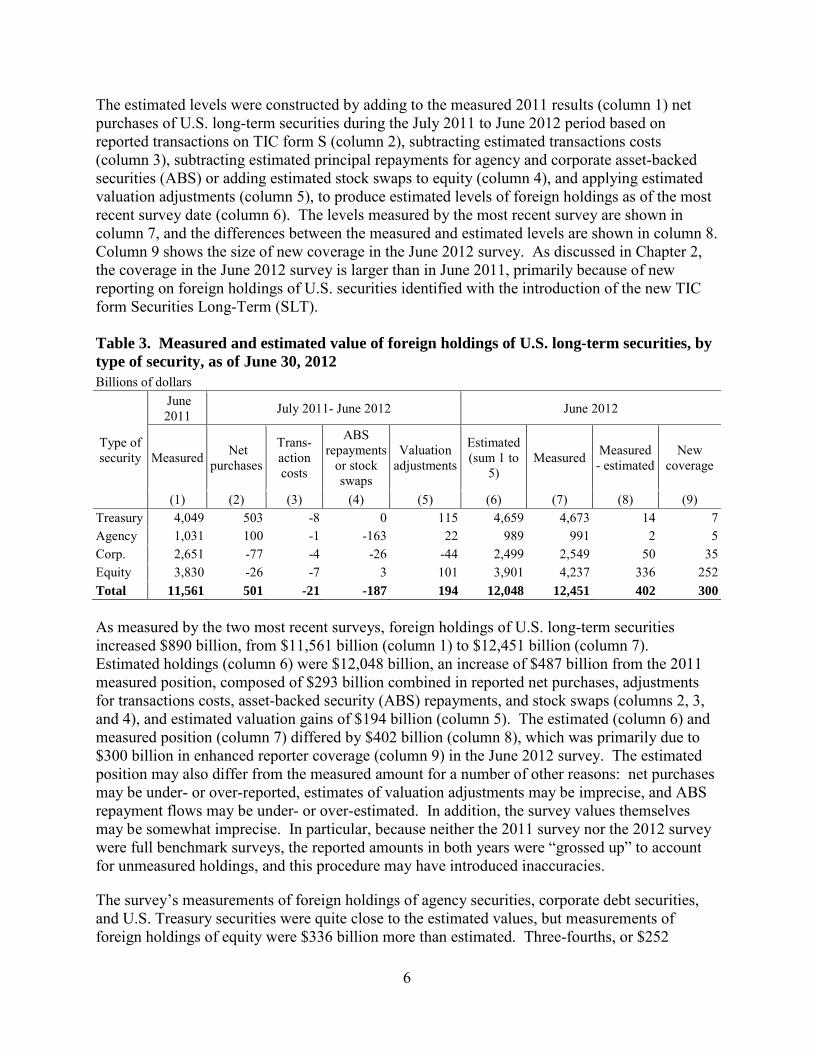
Comparison of Survey Results with Estimated Holdings Table 3 shows the value of foreign holdings of U.S. long-term securities by security type as measured in each of two most recent surveys, estimated levels of foreign holdings as of the most recent survey date, and the resulting differences between the survey data and estimated holdings.
6
The estimated levels were constructed by adding to the measured 2011 results (column 1) net purchases of U.S. long-term securities during the July 2011 to June 2012 period based on reported transactions on TIC form S (column 2), subtracting estimated transactions costs (column 3), subtracting estimated principal repayments for agency and corporate asset-backed securities (ABS) or adding estimated stock swaps to equity (column 4), and applying estimated valuation adjustments (column 5), to produce estimated levels of foreign holdings as of the most recent survey date (column 6). The levels measured by the most recent survey are shown in column 7, and the differences between the measured and estimated levels are shown in column 8. Column 9 shows the size of new coverage in the June 2012 survey. As discussed in Chapter 2, the coverage in the June 2012 survey is larger than in June 2011, primarily because of new reporting on foreign holdings of U.S. securities identified with the introduction of the new TIC form Securities Long-Term (SLT).
Table 3. Measured and estimated value of foreign holdings of U.S. long-term securities, by type of security, as of June 30, 2012 Billions of dollars
Type of security
June 2011 July 2011- June 2012 June 2012
Measured Net purchases
Trans-action costs
ABS repayments
or stock swaps
Valuation adjustments
Estimated (sum 1 to
5) Measured Measured
- estimated New
coverage
(1) (2) (3) (4) (5) (6) (7) (8) (9) Treasury 4,049 503 -8 0 115 4,659 4,673 14 7 Agency 1,031 100 -1 -163 22 989 991 2 5 Corp. 2,651 -77 -4 -26 -44 2,499 2,549 50 35 Equity 3,830 -26 -7 3 101 3,901 4,237 336 252 Total 11,561 501 -21 -187 194 12,048 12,451 402 300 As measured by the two most recent surveys, foreign holdings of U.S. long-term securities increased $890 billion, from $11,561 billion (column 1) to $12,451 billion (column 7). Estimated holdings (column 6) were $12,048 billion, an increase of $487 billion from the 2011 measured position, composed of $293 billion combined in reported net purchases, adjustments for transactions costs, asset-backed security (ABS) repayments, and stock swaps (columns 2, 3, and 4), and estimated valuation gains of $194 billion (column 5). The estimated (column 6) and measured position (column 7) differed by $402 billion (column 8), which was primarily due to $300 billion in enhanced reporter coverage (column 9) in the June 2012 survey. The estimated position may also differ from the measured amount for a number of other reasons: net purchases may be under- or over-reported, estimates of valuation adjustments may be imprecise, and ABS repayment flows may be under- or over-estimated. In addition, the survey values themselves may be somewhat imprecise. In particular, because neither the 2011 survey nor the 2012 survey were full benchmark surveys, the reported amounts in both years were “grossed up” to account for unmeasured holdings, and this procedure may have introduced inaccuracies.
The survey’s measurements of foreign holdings of agency securities, corporate debt securities, and U.S. Treasury securities were quite close to the estimated values, but measurements of foreign holdings of equity were $336 billion more than estimated. Three-fourths, or $252
7
billion, of the difference between the estimated position and the amount measured by the survey is due to enhanced reporter coverage in June 2012.
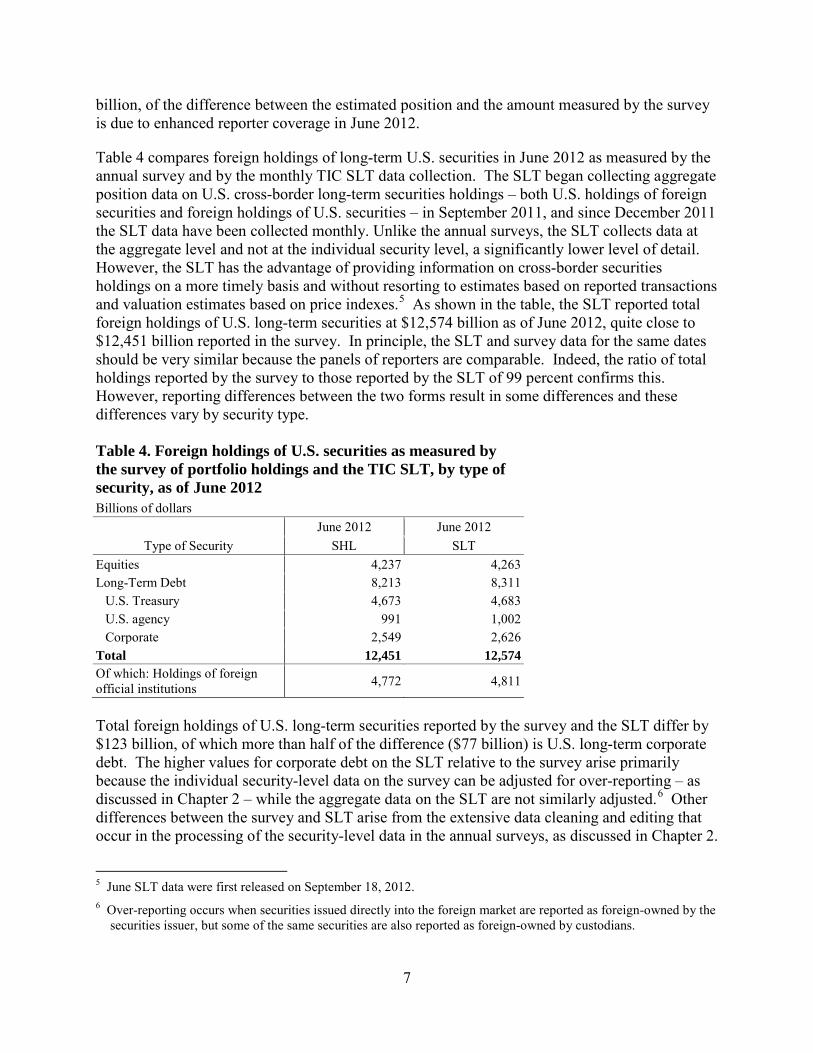
Table 4 compares foreign holdings of long-term U.S. securities in June 2012 as measured by the annual survey and by the monthly TIC SLT data collection. The SLT began collecting aggregate position data on U.S. cross-border long-term securities holdings – both U.S. holdings of foreign securities and foreign holdings of U.S. securities – in September 2011, and since December 2011 the SLT data have been collected monthly. Unlike the annual surveys, the SLT collects data at the aggregate level and not at the individual security level, a significantly lower level of detail. However, the SLT has the advantage of providing information on cross-border securities holdings on a more timely basis and without resorting to estimates based on reported transactions and valuation estimates based on price indexes.5 As shown in the table, the SLT reported total foreign holdings of U.S. long-term securities at $12,574 billion as of June 2012, quite close to $12,451 billion reported in the survey. In principle, the SLT and survey data for the same dates should be very similar because the panels of reporters are comparable. Indeed, the ratio of total holdings reported by the survey to those reported by the SLT of 99 percent confirms this. However, reporting differences between the two forms result in some differences and these differences vary by security type.
Table 4. Foreign holdings of U.S. securities as measured by the survey of portfolio holdings and the TIC SLT, by type of security, as of June 2012 Billions of dollars
Type of Security June 2012 June 2012
SHL SLT Equities 4,237 4,263 Long-Term Debt 8,213 8,311
U.S. Treasury 4,673 4,683 U.S. agency 991 1,002 Corporate 2,549 2,626
Total 12,451 12,574 Of which: Holdings of foreign official institutions 4,772 4,811
Total foreign holdings of U.S. long-term securities reported by the survey and the SLT differ by $123 billion, of which more than half of the difference ($77 billion) is U.S. long-term corporate debt. The higher values for corporate debt on the SLT relative to the survey arise primarily because the individual security-level data on the survey can be adjusted for over-reporting – as discussed in Chapter 2 – while the aggregate data on the SLT are not similarly adjusted.6 Other differences between the survey and SLT arise from the extensive data cleaning and editing that occur in the processing of the security-level data in the annual surveys, as discussed in Chapter 2.
5 June SLT data were first released on September 18, 2012. 6 Over-reporting occurs when securities issued directly into the foreign market are reported as foreign-owned by the
securities issuer, but some of the same securities are also reported as foreign-owned by custodians.
8
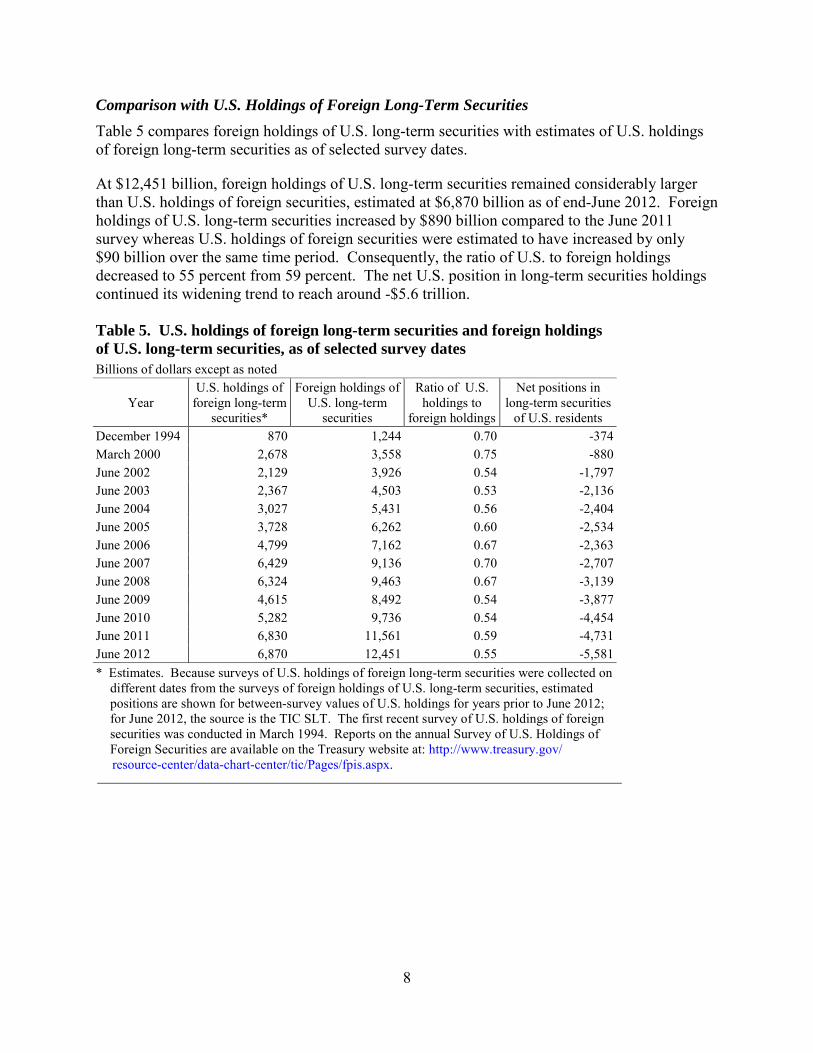
Comparison with U.S. Holdings of Foreign Long-Term Securities Table 5 compares foreign holdings of U.S. long-term securities with estimates of U.S. holdings of foreign long-term securities as of selected survey dates.
At $12,451 billion, foreign holdings of U.S. long-term securities remained considerably larger than U.S. holdings of foreign securities, estimated at $6,870 billion as of end-June 2012. Foreign holdings of U.S. long-term securities increased by $890 billion compared to the June 2011 survey whereas U.S. holdings of foreign securities were estimated to have increased by only $90 billion over the same time period. Consequently, the ratio of U.S. to foreign holdings decreased to 55 percent from 59 percent. The net U.S. position in long-term securities holdings continued its widening trend to reach around -$5.6 trillion.
Table 5. U.S. holdings of foreign long-term securities and foreign holdings of U.S. long-term securities, as of selected survey dates Billions of dollars except as noted
Year U.S. holdings of
foreign long-term securities*
Foreign holdings of U.S. long-term
securities
Ratio of U.S. holdings to
foreign holdings
Net positions in long-term securities
of U.S. residents December 1994 870 1,244 0.70 -374 March 2000 2,678 3,558 0.75 -880 June 2002 2,129 3,926 0.54 -1,797 June 2003 2,367 4,503 0.53 -2,136 June 2004 3,027 5,431 0.56 -2,404 June 2005 3,728 6,262 0.60 -2,534 June 2006 4,799 7,162 0.67 -2,363 June 2007 6,429 9,136 0.70 -2,707 June 2008 6,324 9,463 0.67 -3,139 June 2009 4,615 8,492 0.54 -3,877 June 2010 5,282 9,736 0.54 -4,454 June 2011 6,830 11,561 0.59 -4,731 June 2012 6,870 12,451 0.55 -5,581 * Estimates. Because surveys of U.S. holdings of foreign long-term securities were collected on
different dates from the surveys of foreign holdings of U.S. long-term securities, estimated positions are shown for between-survey values of U.S. holdings for years prior to June 2012; for June 2012, the source is the TIC SLT. The first recent survey of U.S. holdings of foreign securities was conducted in March 1994. Reports on the annual Survey of U.S. Holdings of Foreign Securities are available on the Treasury website at: http://www.treasury.gov/
resource-center/data-chart-center/tic/Pages/fpis.aspx.
9
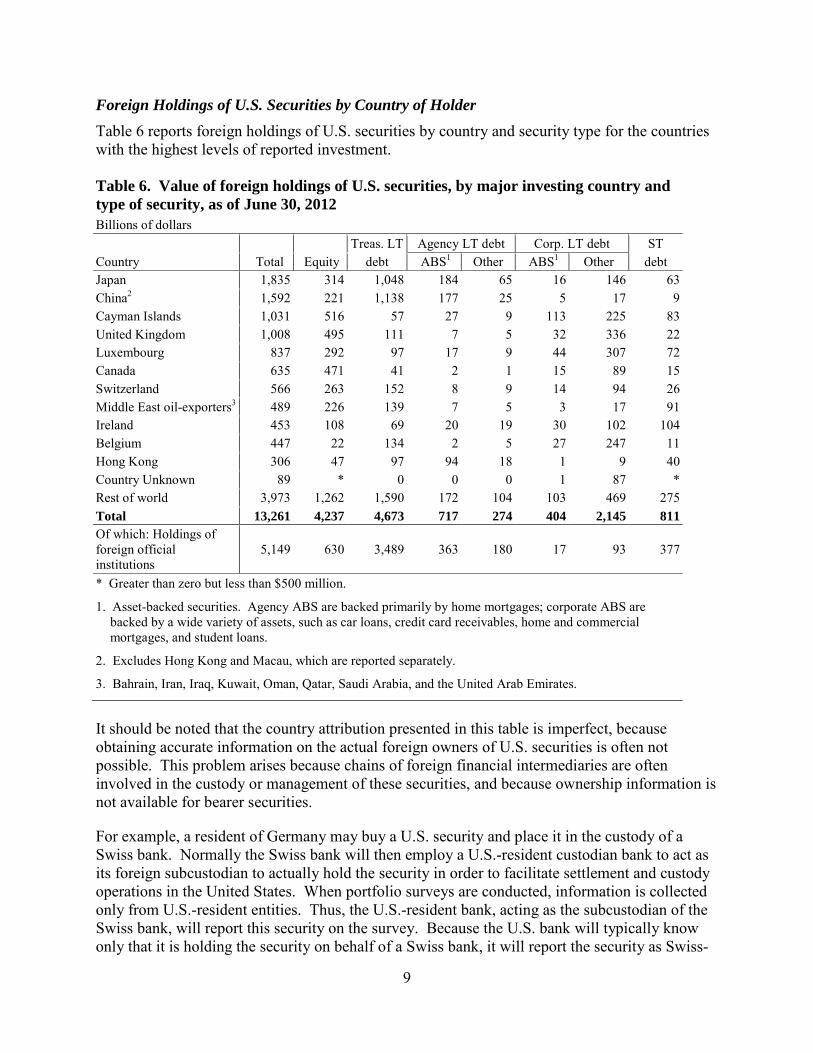
Foreign Holdings of U.S. Securities by Country of Holder Table 6 reports foreign holdings of U.S. securities by country and security type for the countries with the highest levels of reported investment.
Table 6. Value of foreign holdings of U.S. securities, by major investing country and type of security, as of June 30, 2012 Billions of dollars Treas. LT Agency LT debt Corp. LT debt ST Country Total Equity debt ABS1 Other ABS1 Other debt Japan 1,835 314 1,048 184 65 16 146 63 China2 1,592 221 1,138 177 25 5 17 9 Cayman Islands 1,031 516 57 27 9 113 225 83 United Kingdom 1,008 495 111 7 5 32 336 22 Luxembourg 837 292 97 17 9 44 307 72 Canada 635 471 41 2 1 15 89 15 Switzerland 566 263 152 8 9 14 94 26 Middle East oil-exporters3 489 226 139 7 5 3 17 91 Ireland 453 108 69 20 19 30 102 104 Belgium 447 22 134 2 5 27 247 11 Hong Kong 306 47 97 94 18 1 9 40 Country Unknown 89 * 0 0 0 1 87 * Rest of world 3,973 1,262 1,590 172 104 103 469 275 Total 13,261 4,237 4,673 717 274 404 2,145 811 Of which: Holdings of foreign official institutions
5,149 630 3,489 363 180 17 93 377
* Greater than zero but less than $500 million.
1. Asset-backed securities. Agency ABS are backed primarily by home mortgages; corporate ABS are backed by a wide variety of assets, such as car loans, credit card receivables, home and commercial mortgages, and student loans.
2. Excludes Hong Kong and Macau, which are reported separately.
3. Bahrain, Iran, Iraq, Kuwait, Oman, Qatar, Saudi Arabia, and the United Arab Emirates.
It should be noted that the country attribution presented in this table is imperfect, because obtaining accurate information on the actual foreign owners of U.S. securities is often not possible. This problem arises because chains of foreign financial intermediaries are often involved in the custody or management of these securities, and because ownership information is not available for bearer securities.
For example, a resident of Germany may buy a U.S. security and place it in the custody of a Swiss bank. Normally the Swiss bank will then employ a U.S.-resident custodian bank to act as its foreign subcustodian to actually hold the security in order to facilitate settlement and custody operations in the United States. When portfolio surveys are conducted, information is collected only from U.S.-resident entities. Thus, the U.S.-resident bank, acting as the subcustodian of the Swiss bank, will report this security on the survey. Because the U.S. bank will typically know only that it is holding the security on behalf of a Swiss bank, it will report the security as Swiss-
10
held. This “custodial bias” tends to overstate the amounts for countries with major custodial activities.
Another problem in country attribution is that many U.S. securities are issued directly abroad. Such securities can be issued in either registered or bearer form. Registered securities issued abroad typically trade in book-entry form with settlement and custody occurring at international central securities depositories (ICSD), such as Euroclear or Clearstream. U.S. survey reporters can typically only report the country in which the ICSD is located; as a result, large foreign holdings are attributed to these countries. Among the ten countries with the largest holdings of U.S. securities on the most recent survey, five—Belgium, the Cayman Islands, Luxembourg, Switzerland, and the United Kingdom—are financial centers in which substantial amounts of securities owned by residents of other countries are managed or held in custody.7 If securities are issued in bearer, or unregistered, form, the owners of such securities do not need to make themselves known, and typically little or no information is available about them. Long-term bearer securities cannot be issued in the United States, but U.S. firms can and do issue such securities abroad. Almost all of the $89 billion in securities attributed to “Country unknown” in Table 6 are bearer securities.
Given these caveats, the data show that at $1,835 billion, total holdings attributed to Japan exceeded those attributed to any other country, surpassing holdings by mainland China ($1,592 billion) in the June 2012 survey. Japan held the largest amount of U.S. long-term debt until June 2009, when China surpassed it with the largest holdings. The Cayman Islands were third at $1,031 billion, and the United Kingdom was fourth at $1,008 billion. The United Kingdom had been one of the top two investing countries in U.S. securities since country-level data became available (1978), but it fell into the third position behind the rapidly growing stock of holdings of China in the 2006 survey. The Cayman Islands held the most U.S. equity in 2012, and Japan held the most debt. Larger holdings attributed to the Cayman Islands, especially of equity, in large part reflect increased reporting from managed funds effective with the June 2012 survey.
Table 6 splits foreign holdings of agency and corporate long-term debt securities into ABS and other debt securities. ABS are securities backed by pools of assets, such as residential home mortgages or car loans, and include collateralized debt obligations (CDOs). ABS give investors claims against the cash flows generated by the underlying assets. Unlike most other debt securities, ABS often repay both principal and interest on a regular basis, thus reducing the principal outstanding with each payment cycle. However, some classes of ABS replace repaid principal with additional assets for a set period of time, thus holding constant the total principal outstanding.
7 Although liabilities surveys, such as this one, cannot always determine the countries of foreign owners of U.S.
securities, the complementary asset surveys can obtain accurate country attribution, since those surveys need only to determine the country of foreign security issuers, a relatively straightforward task. Thus, it may be possible to better understand the country attribution of liabilities by examining information in other countries' asset surveys. This subject is explored in the article cited in footnote 4, “Understanding U.S. Cross-Border Securities Data.”
11
In total, $717 billion, or approximately 72 percent, of foreign holdings of long-term U.S. agency debt securities in June 2012 were in the form of ABS. In the previous survey, foreign investors held almost the same amount of agency ABS ($714 billion), but these holdings accounted for a slightly smaller proportion (69 percent) of their agency debt holdings. Prior to the 2009 survey, both the dollar amounts and shares of U.S. agency ABS held by foreigners had grown each year since data on such holdings were first published for the June 2002 survey. At that time, foreign holdings of U.S. agency ABS amounted to $125 billion, or 34 percent of holdings of long-term agency debt. Foreign holdings of agency ABS peaked at $773 billion in June 2008. At $404 billion, corporate ABS accounted for slightly less than 16 percent of total corporate debt held, compared with $426 billion, or 16 percent in June 2011, and well below the peak of $760 billion, or 27 percent, in June 2008. Japan surpassed mainland China and became the largest holder of asset-backed U.S. agency long-term debt securities in the 2012 survey, and the Cayman Islands remained the largest holder of asset-backed corporate debt securities. Tables A1 through A6 in the Statistical Appendix show holdings of different types of U.S. securities for all countries as of June 2012.
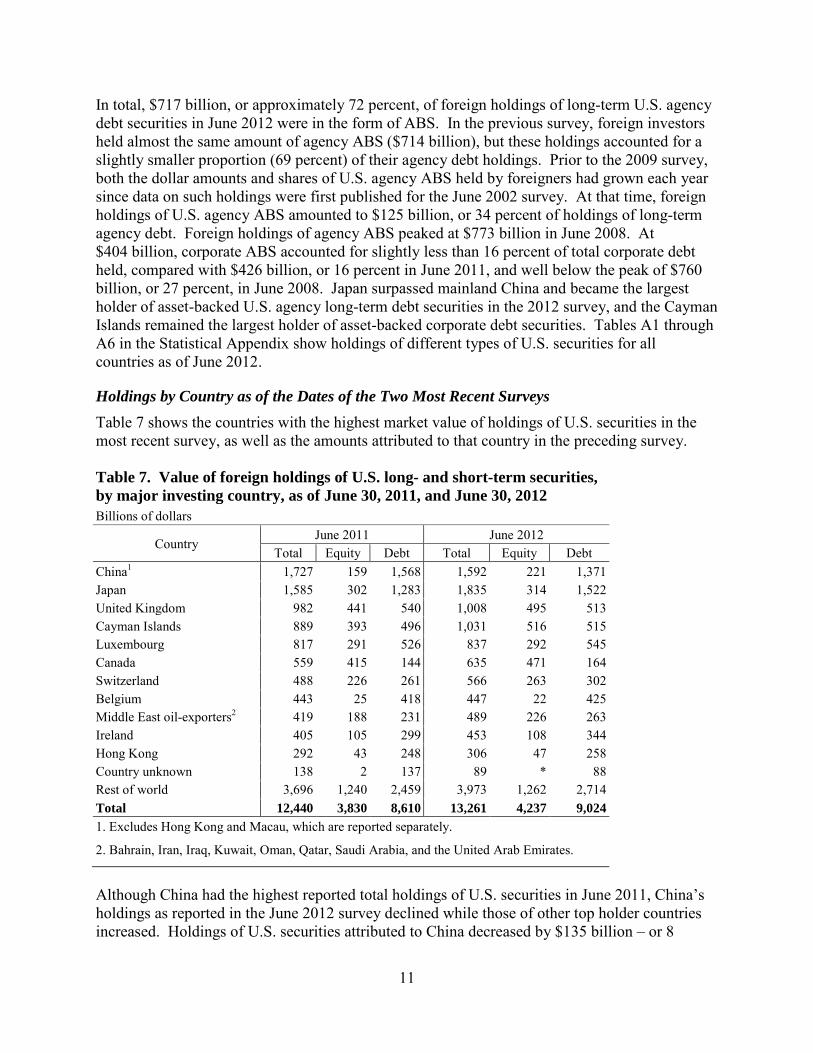
Holdings by Country as of the Dates of the Two Most Recent Surveys Table 7 shows the countries with the highest market value of holdings of U.S. securities in the most recent survey, as well as the amounts attributed to that country in the preceding survey.
Table 7. Value of foreign holdings of U.S. long- and short-term securities, by major investing country, as of June 30, 2011, and June 30, 2012 Billions of dollars
Country June 2011 June 2012
Total Equity Debt Total Equity Debt China1 1,727 159 1,568 1,592 221 1,371 Japan 1,585 302 1,283 1,835 314 1,522 United Kingdom 982 441 540 1,008 495 513 Cayman Islands 889 393 496 1,031 516 515 Luxembourg 817 291 526 837 292 545 Canada 559 415 144 635 471 164 Switzerland 488 226 261 566 263 302 Belgium 443 25 418 447 22 425 Middle East oil-exporters2 419 188 231 489 226 263 Ireland 405 105 299 453 108 344 Hong Kong 292 43 248 306 47 258 Country unknown 138 2 137 89 * 88 Rest of world 3,696 1,240 2,459 3,973 1,262 2,714 Total 12,440 3,830 8,610 13,261 4,237 9,024 1. Excludes Hong Kong and Macau, which are reported separately.
2. Bahrain, Iran, Iraq, Kuwait, Oman, Qatar, Saudi Arabia, and the United Arab Emirates.
Although China had the highest reported total holdings of U.S. securities in June 2011, China’s holdings as reported in the June 2012 survey declined while those of other top holder countries increased. Holdings of U.S. securities attributed to China decreased by $135 billion – or 8
12
percent – while holdings attributed to Japan, the Cayman Islands, Switzerland, Middle East oil-exporters, and Canada all increased by 14 to 17 percent. For the Cayman Islands, Switzerland, Middle East oil-exporters, and Canada, the majority of the growth in their holdings of U.S. securities was in holdings of equities. Increased reporter coverage was an important factor explaining the increase in equity holdings from June 2011, especially for the Cayman Islands. Japan, on the other hand, had the largest rise in holdings of U.S. debt securities, which increased by $239 billion to total $1,522 billion in June 2012. Interpreting these movements, however, is complicated by the difficulties in identifying the ultimate foreign owner of securities held in foreign custodial centers (custodial bias). For example, if a foreign investor shifts holdings of its securities from a U.S. custodian in one year to a foreign custodian in the next, the securities may appear as an increase in holdings of the country of the custodian and a decrease in holdings of the country of the beneficial owner.
Tables A7, A8, A9 and A10 in the Statistical Appendix show, respectively, holdings of total securities, equities, long-term debt securities, and short-term securities, for all countries as of the dates of recent surveys.
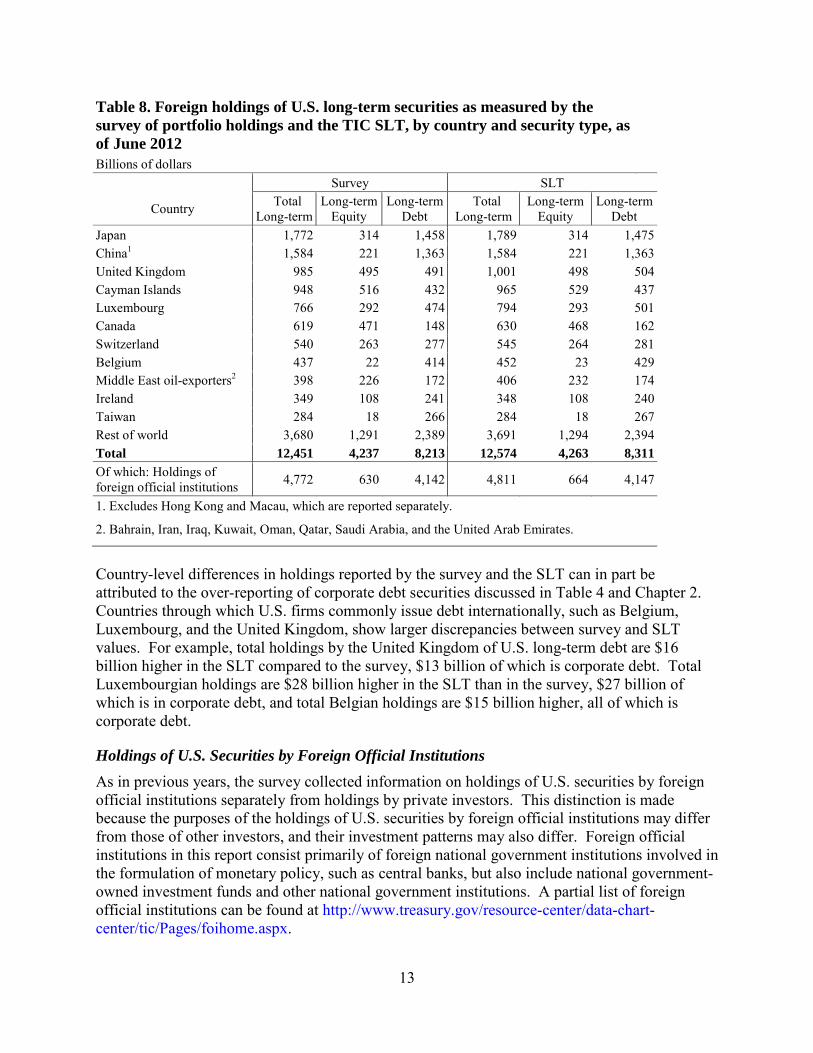
Comparison with the TIC SLT by Country The country distribution of U.S. long-term securities as reported by the annual survey very closely matched the country distribution as reported earlier in the monthly SLT. Table 8 shows that in the survey, as in the SLT, Japan is the largest holder of U.S. long-term securities, with similar holdings reported in the survey ($1,772 billion) and the SLT ($1,789 billion). Japan is followed by China as the second-largest holder with $1,584 billion total holdings of U.S. long-term securities in the survey and exactly the same amount in the SLT. As shown in Table 8, the similarities between the survey and SLT hold for other countries as well.8
8 SLT data for all countries are accessible through the Treasury’s TIC website for Holdings of Long-Term
Securities: http://www.treasury.gov/resource-center/data-chart-center/tic/Pages/ticsec3.aspx
13
Table 8. Foreign holdings of U.S. long-term securities as measured by the survey of portfolio holdings and the TIC SLT, by country and security type, as of June 2012 Billions of dollars
Survey SLT
Country Total Long-term
Long-term Equity
Long-term Debt
Total Long-term
Long-term Equity
Long-term Debt
Japan 1,772 314 1,458 1,789 314 1,475 China1 1,584 221 1,363 1,584 221 1,363 United Kingdom 985 495 491 1,001 498 504 Cayman Islands 948 516 432 965 529 437 Luxembourg 766 292 474 794 293 501 Canada 619 471 148 630 468 162 Switzerland 540 263 277 545 264 281 Belgium 437 22 414 452 23 429 Middle East oil-exporters2 398 226 172 406 232 174 Ireland 349 108 241 348 108 240 Taiwan 284 18 266 284 18 267 Rest of world 3,680 1,291 2,389 3,691 1,294 2,394 Total 12,451 4,237 8,213 12,574 4,263 8,311 Of which: Holdings of foreign official institutions 4,772 630 4,142 4,811 664 4,147
1. Excludes Hong Kong and Macau, which are reported separately.
2. Bahrain, Iran, Iraq, Kuwait, Oman, Qatar, Saudi Arabia, and the United Arab Emirates.
Country-level differences in holdings reported by the survey and the SLT can in part be attributed to the over-reporting of corporate debt securities discussed in Table 4 and Chapter 2. Countries through which U.S. firms commonly issue debt internationally, such as Belgium, Luxembourg, and the United Kingdom, show larger discrepancies between survey and SLT values. For example, total holdings by the United Kingdom of U.S. long-term debt are $16 billion higher in the SLT compared to the survey, $13 billion of which is corporate debt. Total Luxembourgian holdings are $28 billion higher in the SLT than in the survey, $27 billion of which is in corporate debt, and total Belgian holdings are $15 billion higher, all of which is corporate debt.
Holdings of U.S. Securities by Foreign Official Institutions As in previous years, the survey collected information on holdings of U.S. securities by foreign official institutions separately from holdings by private investors. This distinction is made because the purposes of the holdings of U.S. securities by foreign official institutions may differ from those of other investors, and their investment patterns may also differ. Foreign official institutions in this report consist primarily of foreign national government institutions involved in the formulation of monetary policy, such as central banks, but also include national government-owned investment funds and other national government institutions. A partial list of foreign official institutions can be found at http://www.treasury.gov/resource-center/data-chart-center/tic/Pages/foihome.aspx.
14
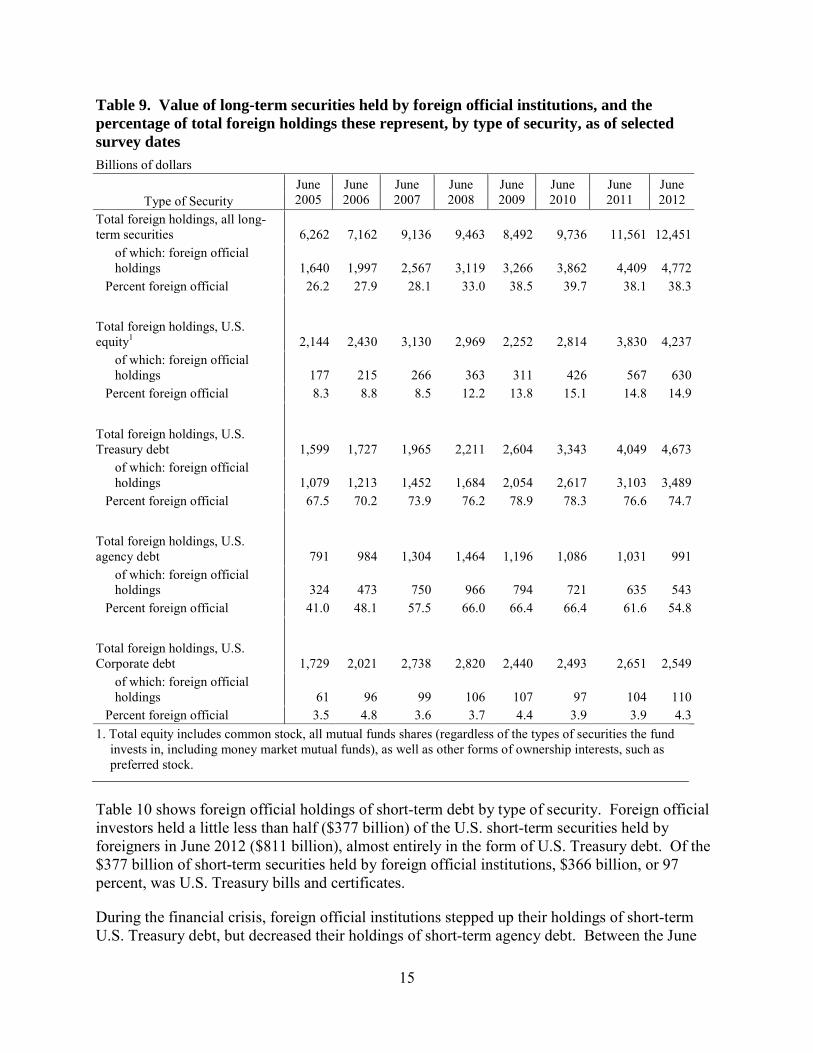
The percentage of U.S. long-term securities held by foreign official institutions as a share of the total amount held by foreign investors between the June 2011 and June 2012 surveys edged up slightly to 38 percent (Table 9). From June 2005 to June 2010, this percentage increased steadily from 26 percent to around 40 percent. The share held by official investors had been even higher in earlier years, however. From 1974 to 1984 (not shown) foreign official investors accounted for about 40 percent of foreign holdings of U.S. long-term securities.
From June 2005 to June 2010, foreign official investors were responsible for almost all of the increase in total foreign holdings of long-term U.S. Treasury securities. Total foreign holdings of U.S. long-term Treasuries increased by $1,744 billion, of which foreign official investors contributed $1,538 billion, or 88 percent. However, foreign official investors have accounted for a somewhat smaller share of foreign purchases of U.S. long-term Treasury security purchases since then. From June 2010 to June 2012, total foreign holdings increased by $1,330 billion, of which foreign official holdings were $872 billion, or about 66 percent.
Foreign official institutions invested primarily in long-term U.S. Treasury securities over the June 2005 to June 2012 period, but they also increasingly purchased agency securities in the years before the 2008 financial crisis. Between the 2005 and 2008 surveys, foreign official holdings of long-term U.S. agency debt securities grew from roughly 40 percent of all foreign holdings of long-term agency securities to two-thirds of all foreign holdings of agencies. Although foreign official holdings of agency securities have declined since then, they continue to account more than half of foreign holdings of long-term agency debt.
15
Table 9. Value of long-term securities held by foreign official institutions, and the percentage of total foreign holdings these represent, by type of security, as of selected survey dates Billions of dollars
June 2005
June 2006
June 2007
June 2008
June 2009
June 2010
June 2011
June 2012 Type of Security
Total foreign holdings, all long-term securities 6,262 7,162 9,136 9,463 8,492 9,736 11,561 12,451
of which: foreign official holdings 1,640 1,997 2,567 3,119 3,266 3,862 4,409 4,772
Percent foreign official 26.2 27.9 28.1 33.0 38.5 39.7 38.1 38.3
Total foreign holdings, U.S. equity1 2,144 2,430 3,130 2,969 2,252 2,814 3,830 4,237
of which: foreign official holdings 177 215 266 363 311 426 567 630
Percent foreign official 8.3 8.8 8.5 12.2 13.8 15.1 14.8 14.9
Total foreign holdings, U.S. Treasury debt 1,599 1,727 1,965 2,211 2,604 3,343 4,049 4,673
of which: foreign official holdings 1,079 1,213 1,452 1,684 2,054 2,617 3,103 3,489
Percent foreign official 67.5 70.2 73.9 76.2 78.9 78.3 76.6 74.7
Total foreign holdings, U.S. agency debt 791 984 1,304 1,464 1,196 1,086 1,031 991
of which: foreign official holdings 324 473 750 966 794 721 635 543
Percent foreign official 41.0 48.1 57.5 66.0 66.4 66.4 61.6 54.8
Total foreign holdings, U.S. Corporate debt 1,729 2,021 2,738 2,820 2,440 2,493 2,651 2,549
of which: foreign official holdings 61 96 99 106 107 97 104 110
Percent foreign official 3.5 4.8 3.6 3.7 4.4 3.9 3.9 4.3 1. Total equity includes common stock, all mutual funds shares (regardless of the types of securities the fund
invests in, including money market mutual funds), as well as other forms of ownership interests, such as preferred stock.
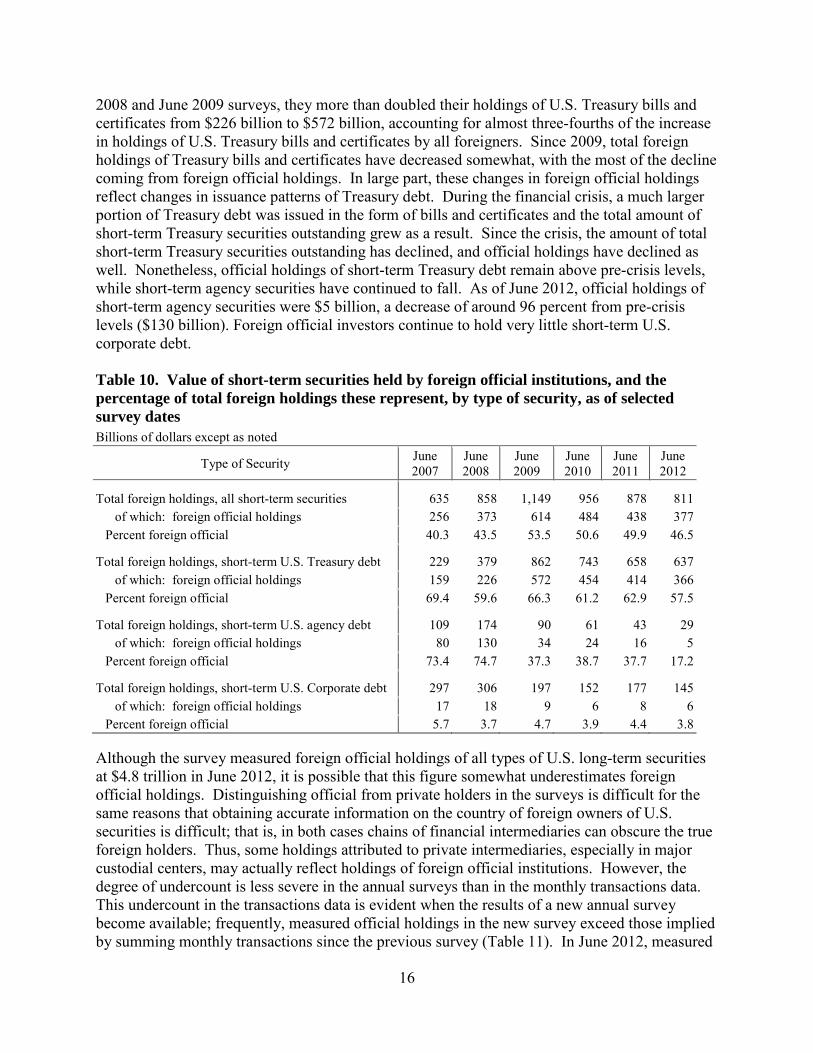
Table 10 shows foreign official holdings of short-term debt by type of security. Foreign official investors held a little less than half ($377 billion) of the U.S. short-term securities held by foreigners in June 2012 ($811 billion), almost entirely in the form of U.S. Treasury debt. Of the $377 billion of short-term securities held by foreign official institutions, $366 billion, or 97 percent, was U.S. Treasury bills and certificates.
During the financial crisis, foreign official institutions stepped up their holdings of short-term U.S. Treasury debt, but decreased their holdings of short-term agency debt. Between the June
16
2008 and June 2009 surveys, they more than doubled their holdings of U.S. Treasury bills and certificates from $226 billion to $572 billion, accounting for almost three-fourths of the increase in holdings of U.S. Treasury bills and certificates by all foreigners. Since 2009, total foreign holdings of Treasury bills and certificates have decreased somewhat, with the most of the decline coming from foreign official holdings. In large part, these changes in foreign official holdings reflect changes in issuance patterns of Treasury debt. During the financial crisis, a much larger portion of Treasury debt was issued in the form of bills and certificates and the total amount of short-term Treasury securities outstanding grew as a result. Since the crisis, the amount of total short-term Treasury securities outstanding has declined, and official holdings have declined as well. Nonetheless, official holdings of short-term Treasury debt remain above pre-crisis levels, while short-term agency securities have continued to fall. As of June 2012, official holdings of short-term agency securities were $5 billion, a decrease of around 96 percent from pre-crisis levels ($130 billion). Foreign official investors continue to hold very little short-term U.S. corporate debt.
Table 10. Value of short-term securities held by foreign official institutions, and the percentage of total foreign holdings these represent, by type of security, as of selected survey dates Billions of dollars except as noted
Type of Security June 2007
June 2008
June 2009
June 2010
June 2011
June 2012
Total foreign holdings, all short-term securities 635 858 1,149 956 878 811 of which: foreign official holdings 256 373 614 484 438 377
Percent foreign official 40.3 43.5 53.5 50.6 49.9 46.5
Total foreign holdings, short-term U.S. Treasury debt 229 379 862 743 658 637 of which: foreign official holdings 159 226 572 454 414 366
Percent foreign official 69.4 59.6 66.3 61.2 62.9 57.5
Total foreign holdings, short-term U.S. agency debt 109 174 90 61 43 29 of which: foreign official holdings 80 130 34 24 16 5
Percent foreign official 73.4 74.7 37.3 38.7 37.7 17.2
Total foreign holdings, short-term U.S. Corporate debt 297 306 197 152 177 145 of which: foreign official holdings 17 18 9 6 8 6
Percent foreign official 5.7 3.7 4.7 3.9 4.4 3.8
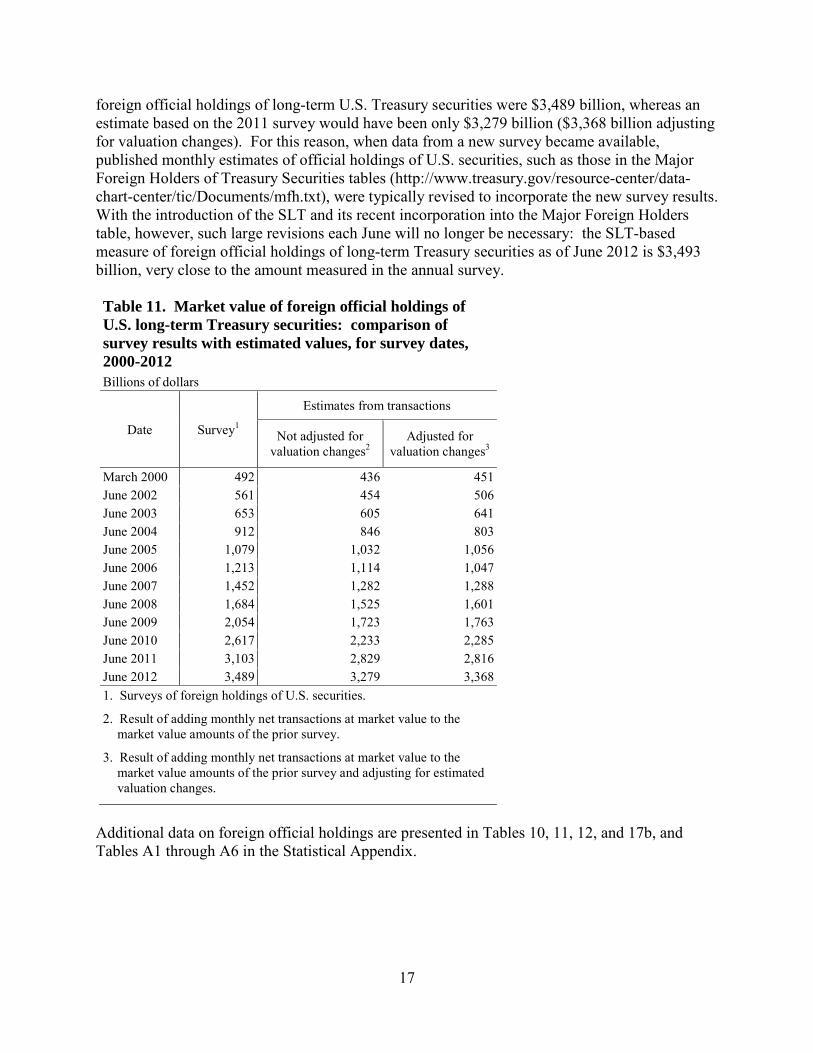
Although the survey measured foreign official holdings of all types of U.S. long-term securities at $4.8 trillion in June 2012, it is possible that this figure somewhat underestimates foreign official holdings. Distinguishing official from private holders in the surveys is difficult for the same reasons that obtaining accurate information on the country of foreign owners of U.S. securities is difficult; that is, in both cases chains of financial intermediaries can obscure the true foreign holders. Thus, some holdings attributed to private intermediaries, especially in major custodial centers, may actually reflect holdings of foreign official institutions. However, the degree of undercount is less severe in the annual surveys than in the monthly transactions data. This undercount in the transactions data is evident when the results of a new annual survey become available; frequently, measured official holdings in the new survey exceed those implied by summing monthly transactions since the previous survey (Table 11). In June 2012, measured
17
foreign official holdings of long-term U.S. Treasury securities were $3,489 billion, whereas an estimate based on the 2011 survey would have been only $3,279 billion ($3,368 billion adjusting for valuation changes). For this reason, when data from a new survey became available, published monthly estimates of official holdings of U.S. securities, such as those in the Major Foreign Holders of Treasury Securities tables (http://www.treasury.gov/resource-center/data-chart-center/tic/Documents/mfh.txt), were typically revised to incorporate the new survey results. With the introduction of the SLT and its recent incorporation into the Major Foreign Holders table, however, such large revisions each June will no longer be necessary: the SLT-based measure of foreign official holdings of long-term Treasury securities as of June 2012 is $3,493 billion, very close to the amount measured in the annual survey.
Table 11. Market value of foreign official holdings of U.S. long-term Treasury securities: comparison of survey results with estimated values, for survey dates, 2000-2012 Billions of dollars
Date Survey1
Estimates from transactions
Not adjusted for valuation changes2
Adjusted for valuation changes3
March 2000 492 436 451 June 2002 561 454 506 June 2003 653 605 641 June 2004 912 846 803 June 2005 1,079 1,032 1,056 June 2006 1,213 1,114 1,047 June 2007 1,452 1,282 1,288 June 2008 1,684 1,525 1,601 June 2009 2,054 1,723 1,763 June 2010 2,617 2,233 2,285 June 2011 3,103 2,829 2,816 June 2012 3,489 3,279 3,368 1. Surveys of foreign holdings of U.S. securities.
2. Result of adding monthly net transactions at market value to the market value amounts of the prior survey.
3. Result of adding monthly net transactions at market value to the market value amounts of the prior survey and adjusting for estimated valuation changes.
Additional data on foreign official holdings are presented in Tables 10, 11, 12, and 17b, and Tables A1 through A6 in the Statistical Appendix.
18
Details on Foreign Holdings of Different Types of U.S. Securities as of June 2012
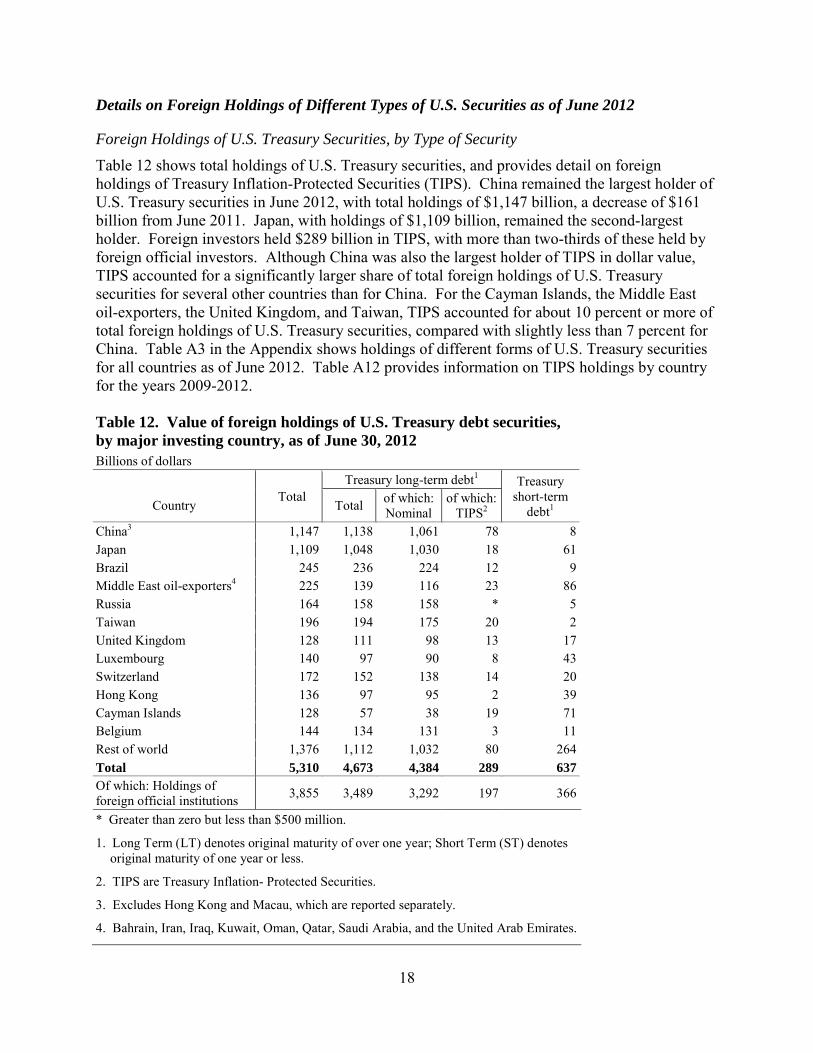
Foreign Holdings of U.S. Treasury Securities, by Type of Security Table 12 shows total holdings of U.S. Treasury securities, and provides detail on foreign holdings of Treasury Inflation-Protected Securities (TIPS). China remained the largest holder of U.S. Treasury securities in June 2012, with total holdings of $1,147 billion, a decrease of $161 billion from June 2011. Japan, with holdings of $1,109 billion, remained the second-largest holder. Foreign investors held $289 billion in TIPS, with more than two-thirds of these held by foreign official investors. Although China was also the largest holder of TIPS in dollar value, TIPS accounted for a significantly larger share of total foreign holdings of U.S. Treasury securities for several other countries than for China. For the Cayman Islands, the Middle East oil-exporters, the United Kingdom, and Taiwan, TIPS accounted for about 10 percent or more of total foreign holdings of U.S. Treasury securities, compared with slightly less than 7 percent for China. Table A3 in the Appendix shows holdings of different forms of U.S. Treasury securities for all countries as of June 2012. Table A12 provides information on TIPS holdings by country for the years 2009-2012.
Table 12. Value of foreign holdings of U.S. Treasury debt securities, by major investing country, as of June 30, 2012 Billions of dollars
Total
Treasury long-term debt1 Treasury short-term
debt1 Country Total of which: Nominal
of which: TIPS2
China3 1,147 1,138 1,061 78 8 Japan 1,109 1,048 1,030 18 61 Brazil 245 236 224 12 9 Middle East oil-exporters4 225 139 116 23 86 Russia 164 158 158 * 5 Taiwan 196 194 175 20 2 United Kingdom 128 111 98 13 17 Luxembourg 140 97 90 8 43 Switzerland 172 152 138 14 20 Hong Kong 136 97 95 2 39 Cayman Islands 128 57 38 19 71 Belgium 144 134 131 3 11 Rest of world 1,376 1,112 1,032 80 264 Total 5,310 4,673 4,384 289 637 Of which: Holdings of foreign official institutions 3,855 3,489 3,292 197 366
* Greater than zero but less than $500 million.
1. Long Term (LT) denotes original maturity of over one year; Short Term (ST) denotes original maturity of one year or less.
2. TIPS are Treasury Inflation- Protected Securities.
3. Excludes Hong Kong and Macau, which are reported separately.
4. Bahrain, Iran, Iraq, Kuwait, Oman, Qatar, Saudi Arabia, and the United Arab Emirates.
19
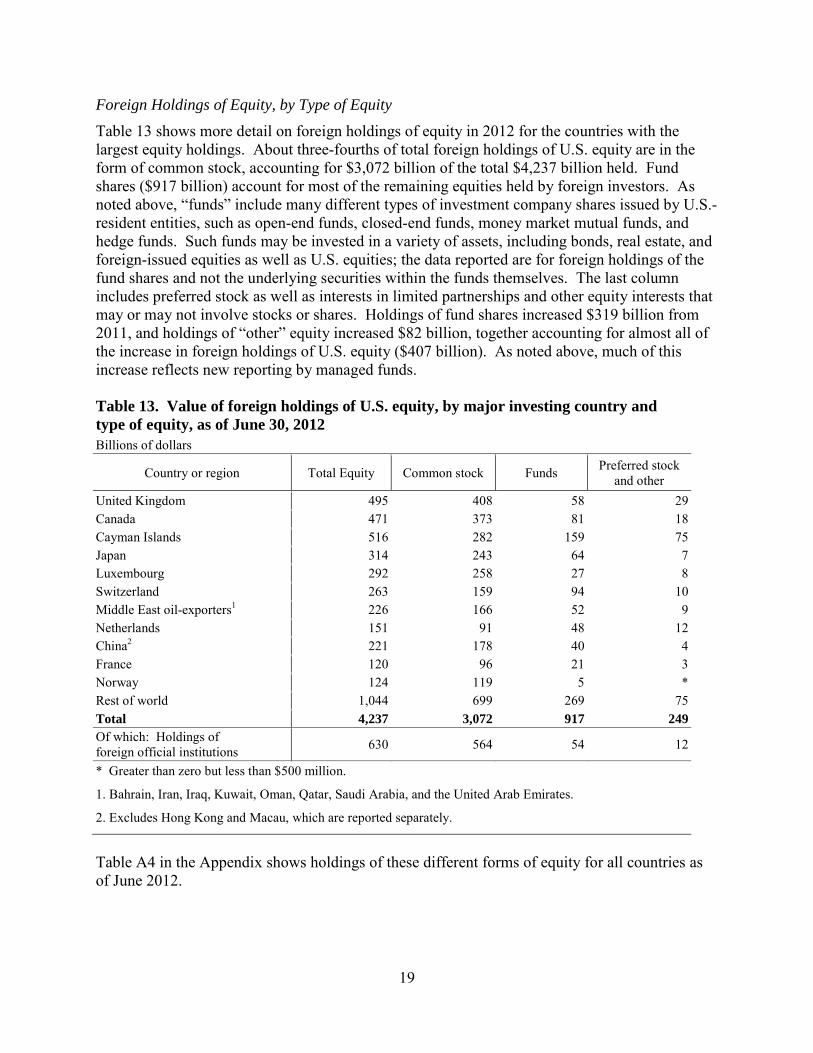
Foreign Holdings of Equity, by Type of Equity Table 13 shows more detail on foreign holdings of equity in 2012 for the countries with the largest equity holdings. About three-fourths of total foreign holdings of U.S. equity are in the form of common stock, accounting for $3,072 billion of the total $4,237 billion held. Fund shares ($917 billion) account for most of the remaining equities held by foreign investors. As noted above, “funds” include many different types of investment company shares issued by U.S.-resident entities, such as open-end funds, closed-end funds, money market mutual funds, and hedge funds. Such funds may be invested in a variety of assets, including bonds, real estate, and foreign-issued equities as well as U.S. equities; the data reported are for foreign holdings of the fund shares and not the underlying securities within the funds themselves. The last column includes preferred stock as well as interests in limited partnerships and other equity interests that may or may not involve stocks or shares. Holdings of fund shares increased $319 billion from 2011, and holdings of “other” equity increased $82 billion, together accounting for almost all of the increase in foreign holdings of U.S. equity ($407 billion). As noted above, much of this increase reflects new reporting by managed funds.
Table 13. Value of foreign holdings of U.S. equity, by major investing country and type of equity, as of June 30, 2012 Billions of dollars
Country or region Total Equity Common stock Funds Preferred stock and other
United Kingdom 495 408 58 29 Canada 471 373 81 18 Cayman Islands 516 282 159 75 Japan 314 243 64 7 Luxembourg 292 258 27 8 Switzerland 263 159 94 10 Middle East oil-exporters1 226 166 52 9 Netherlands 151 91 48 12 China2 221 178 40 4 France 120 96 21 3 Norway 124 119 5 * Rest of world 1,044 699 269 75 Total 4,237 3,072 917 249 Of which: Holdings of foreign official institutions 630 564 54 12
* Greater than zero but less than $500 million.
1. Bahrain, Iran, Iraq, Kuwait, Oman, Qatar, Saudi Arabia, and the United Arab Emirates.
2. Excludes Hong Kong and Macau, which are reported separately.
Table A4 in the Appendix shows holdings of these different forms of equity for all countries as of June 2012.
20
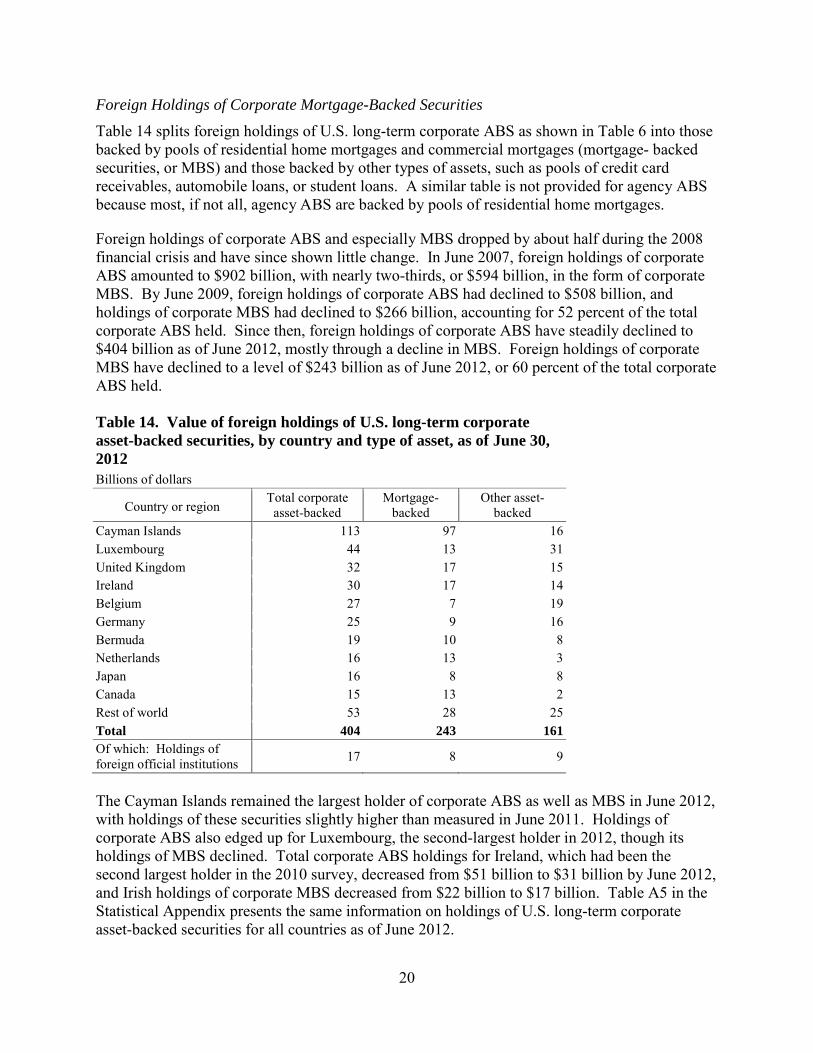
Foreign Holdings of Corporate Mortgage-Backed Securities Table 14 splits foreign holdings of U.S. long-term corporate ABS as shown in Table 6 into those backed by pools of residential home mortgages and commercial mortgages (mortgage- backed securities, or MBS) and those backed by other types of assets, such as pools of credit card receivables, automobile loans, or student loans. A similar table is not provided for agency ABS because most, if not all, agency ABS are backed by pools of residential home mortgages.
Foreign holdings of corporate ABS and especially MBS dropped by about half during the 2008 financial crisis and have since shown little change. In June 2007, foreign holdings of corporate ABS amounted to $902 billion, with nearly two-thirds, or $594 billion, in the form of corporate MBS. By June 2009, foreign holdings of corporate ABS had declined to $508 billion, and holdings of corporate MBS had declined to $266 billion, accounting for 52 percent of the total corporate ABS held. Since then, foreign holdings of corporate ABS have steadily declined to $404 billion as of June 2012, mostly through a decline in MBS. Foreign holdings of corporate MBS have declined to a level of $243 billion as of June 2012, or 60 percent of the total corporate ABS held.
Table 14. Value of foreign holdings of U.S. long-term corporate asset-backed securities, by country and type of asset, as of June 30, 2012 Billions of dollars
Total corporate asset-backed
Mortgage-backed
Other asset-backed Country or region
Cayman Islands 113 97 16 Luxembourg 44 13 31 United Kingdom 32 17 15 Ireland 30 17 14 Belgium 27 7 19 Germany 25 9 16 Bermuda 19 10 8 Netherlands 16 13 3 Japan 16 8 8 Canada 15 13 2 Rest of world 53 28 25 Total 404 243 161 Of which: Holdings of foreign official institutions 17 8 9
The Cayman Islands remained the largest holder of corporate ABS as well as MBS in June 2012, with holdings of these securities slightly higher than measured in June 2011. Holdings of corporate ABS also edged up for Luxembourg, the second-largest holder in 2012, though its holdings of MBS declined. Total corporate ABS holdings for Ireland, which had been the second largest holder in the 2010 survey, decreased from $51 billion to $31 billion by June 2012, and Irish holdings of corporate MBS decreased from $22 billion to $17 billion. Table A5 in the Statistical Appendix presents the same information on holdings of U.S. long-term corporate asset-backed securities for all countries as of June 2012.
21
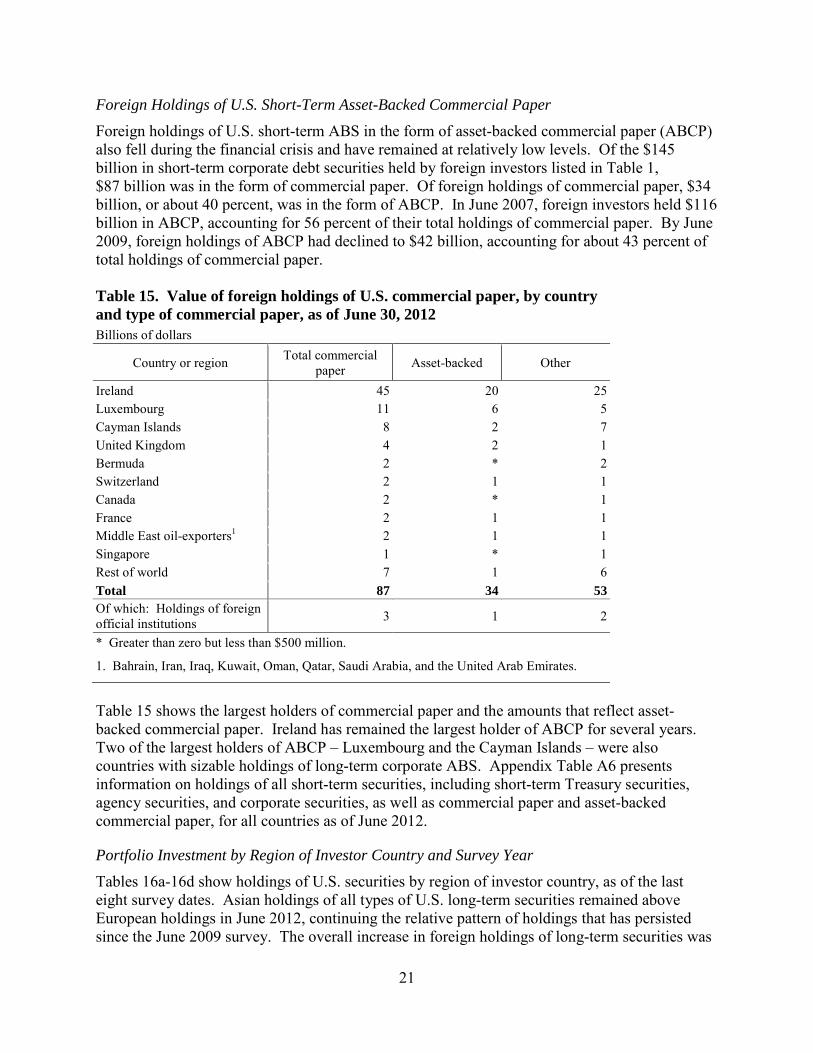
Foreign Holdings of U.S. Short-Term Asset-Backed Commercial Paper Foreign holdings of U.S. short-term ABS in the form of asset-backed commercial paper (ABCP) also fell during the financial crisis and have remained at relatively low levels. Of the $145 billion in short-term corporate debt securities held by foreign investors listed in Table 1, $87 billion was in the form of commercial paper. Of foreign holdings of commercial paper, $34 billion, or about 40 percent, was in the form of ABCP. In June 2007, foreign investors held $116 billion in ABCP, accounting for 56 percent of their total holdings of commercial paper. By June 2009, foreign holdings of ABCP had declined to $42 billion, accounting for about 43 percent of total holdings of commercial paper.
Table 15. Value of foreign holdings of U.S. commercial paper, by country and type of commercial paper, as of June 30, 2012 Billions of dollars
Country or region Total commercial paper Asset-backed Other
Ireland 45 20 25 Luxembourg 11 6 5 Cayman Islands 8 2 7 United Kingdom 4 2 1 Bermuda 2 * 2 Switzerland 2 1 1 Canada 2 * 1 France 2 1 1 Middle East oil-exporters1 2 1 1 Singapore 1 * 1 Rest of world 7 1 6 Total 87 34 53 Of which: Holdings of foreign official institutions 3 1 2
* Greater than zero but less than $500 million.
1. Bahrain, Iran, Iraq, Kuwait, Oman, Qatar, Saudi Arabia, and the United Arab Emirates.
Table 15 shows the largest holders of commercial paper and the amounts that reflect asset-backed commercial paper. Ireland has remained the largest holder of ABCP for several years. Two of the largest holders of ABCP – Luxembourg and the Cayman Islands – were also countries with sizable holdings of long-term corporate ABS. Appendix Table A6 presents information on holdings of all short-term securities, including short-term Treasury securities, agency securities, and corporate securities, as well as commercial paper and asset-backed commercial paper, for all countries as of June 2012.
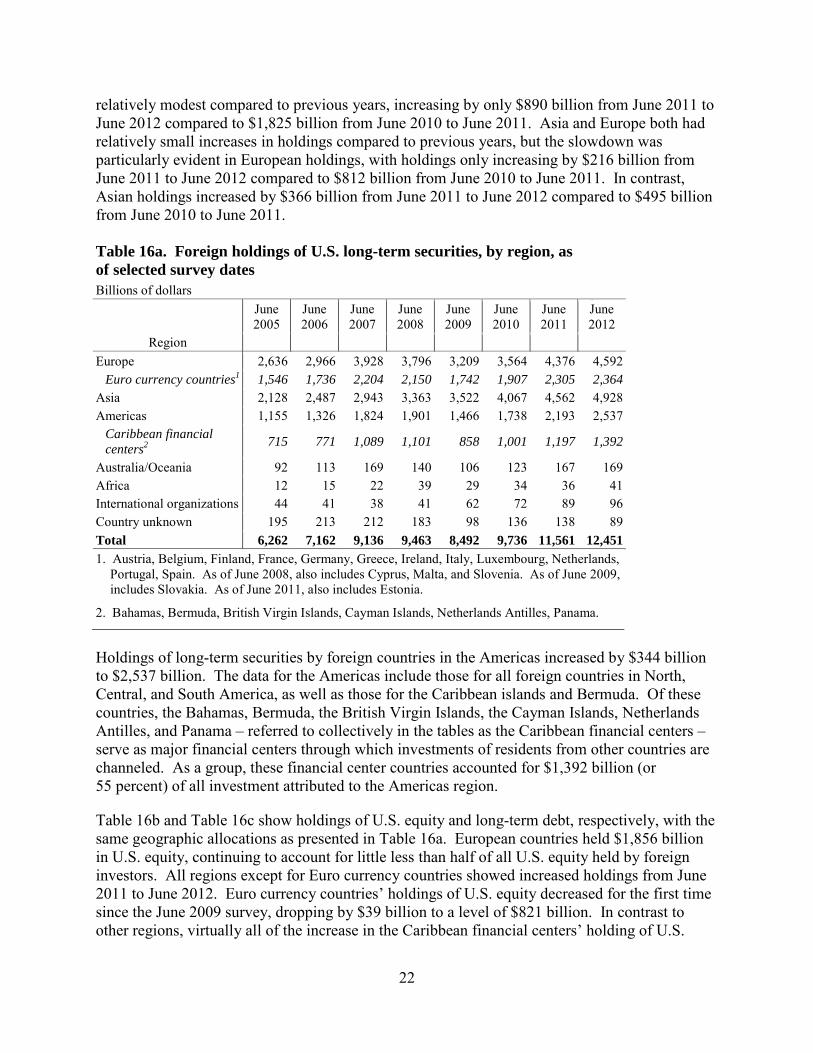
Portfolio Investment by Region of Investor Country and Survey Year Tables 16a-16d show holdings of U.S. securities by region of investor country, as of the last eight survey dates. Asian holdings of all types of U.S. long-term securities remained above European holdings in June 2012, continuing the relative pattern of holdings that has persisted since the June 2009 survey. The overall increase in foreign holdings of long-term securities was
22
relatively modest compared to previous years, increasing by only $890 billion from June 2011 to June 2012 compared to $1,825 billion from June 2010 to June 2011. Asia and Europe both had relatively small increases in holdings compared to previous years, but the slowdown was particularly evident in European holdings, with holdings only increasing by $216 billion from June 2011 to June 2012 compared to $812 billion from June 2010 to June 2011. In contrast, Asian holdings increased by $366 billion from June 2011 to June 2012 compared to $495 billion from June 2010 to June 2011.
Table 16a. Foreign holdings of U.S. long-term securities, by region, as of selected survey dates Billions of dollars
June 2005
June 2006
June 2007
June 2008
June 2009
June 2010
June 2011
June 2012
Region Europe 2,636 2,966 3,928 3,796 3,209 3,564 4,376 4,592
Euro currency countries1 1,546 1,736 2,204 2,150 1,742 1,907 2,305 2,364 Asia 2,128 2,487 2,943 3,363 3,522 4,067 4,562 4,928 Americas 1,155 1,326 1,824 1,901 1,466 1,738 2,193 2,537
Caribbean financial centers2 715 771 1,089 1,101 858 1,001 1,197 1,392
Australia/Oceania 92 113 169 140 106 123 167 169 Africa 12 15 22 39 29 34 36 41 International organizations 44 41 38 41 62 72 89 96 Country unknown 195 213 212 183 98 136 138 89 Total 6,262 7,162 9,136 9,463 8,492 9,736 11,561 12,451 1. Austria, Belgium, Finland, France, Germany, Greece, Ireland, Italy, Luxembourg, Netherlands,
Portugal, Spain. As of June 2008, also includes Cyprus, Malta, and Slovenia. As of June 2009, includes Slovakia. As of June 2011, also includes Estonia.
2. Bahamas, Bermuda, British Virgin Islands, Cayman Islands, Netherlands Antilles, Panama.
Holdings of long-term securities by foreign countries in the Americas increased by $344 billion to $2,537 billion. The data for the Americas include those for all foreign countries in North, Central, and South America, as well as those for the Caribbean islands and Bermuda. Of these countries, the Bahamas, Bermuda, the British Virgin Islands, the Cayman Islands, Netherlands Antilles, and Panama – referred to collectively in the tables as the Caribbean financial centers – serve as major financial centers through which investments of residents from other countries are channeled. As a group, these financial center countries accounted for $1,392 billion (or 55 percent) of all investment attributed to the Americas region.
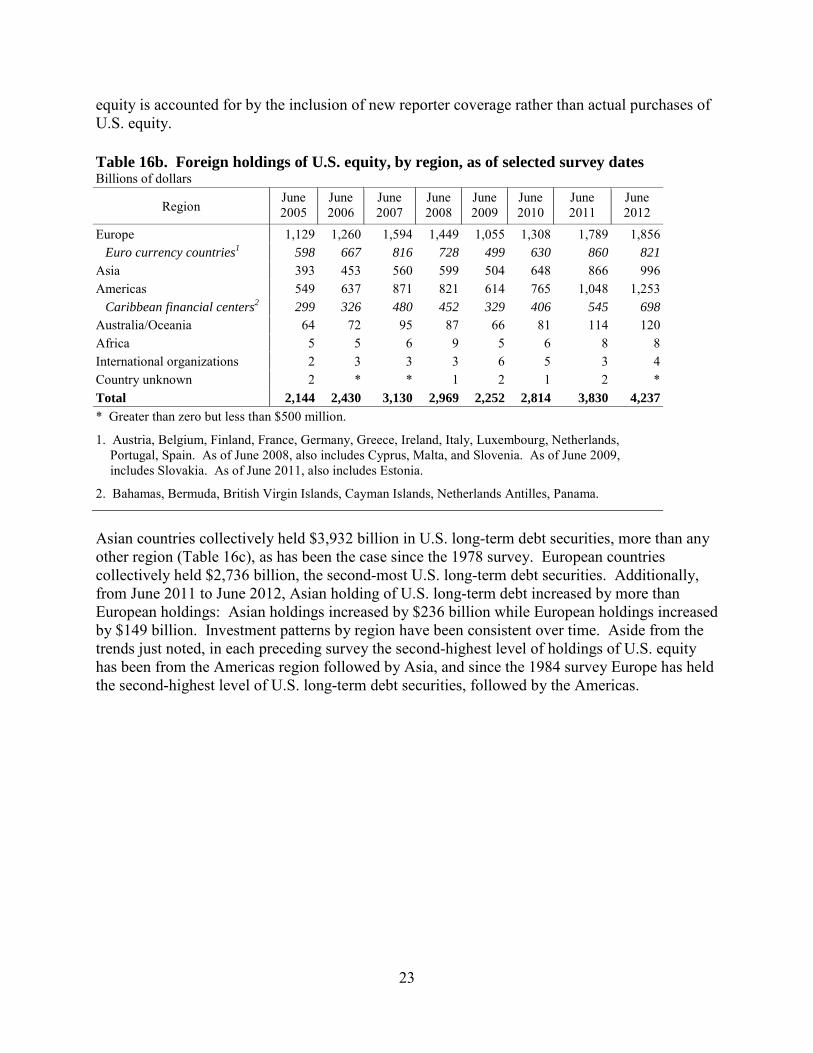
Table 16b and Table 16c show holdings of U.S. equity and long-term debt, respectively, with the same geographic allocations as presented in Table 16a. European countries held $1,856 billion in U.S. equity, continuing to account for little less than half of all U.S. equity held by foreign investors. All regions except for Euro currency countries showed increased holdings from June 2011 to June 2012. Euro currency countries’ holdings of U.S. equity decreased for the first time since the June 2009 survey, dropping by $39 billion to a level of $821 billion. In contrast to other regions, virtually all of the increase in the Caribbean financial centers’ holding of U.S.
23
equity is accounted for by the inclusion of new reporter coverage rather than actual purchases of U.S. equity. Table 16b. Foreign holdings of U.S. equity, by region, as of selected survey dates Billions of dollars
Region June 2005
June 2006
June 2007
June 2008
June 2009
June 2010
June 2011
June 2012
Europe 1,129 1,260 1,594 1,449 1,055 1,308 1,789 1,856 Euro currency countries1 598 667 816 728 499 630 860 821
Asia 393 453 560 599 504 648 866 996 Americas 549 637 871 821 614 765 1,048 1,253
Caribbean financial centers2 299 326 480 452 329 406 545 698 Australia/Oceania 64 72 95 87 66 81 114 120 Africa 5 5 6 9 5 6 8 8 International organizations 2 3 3 3 6 5 3 4 Country unknown 2 * * 1 2 1 2 * Total 2,144 2,430 3,130 2,969 2,252 2,814 3,830 4,237 * Greater than zero but less than $500 million.
1. Austria, Belgium, Finland, France, Germany, Greece, Ireland, Italy, Luxembourg, Netherlands, Portugal, Spain. As of June 2008, also includes Cyprus, Malta, and Slovenia. As of June 2009, includes Slovakia. As of June 2011, also includes Estonia.
2. Bahamas, Bermuda, British Virgin Islands, Cayman Islands, Netherlands Antilles, Panama.
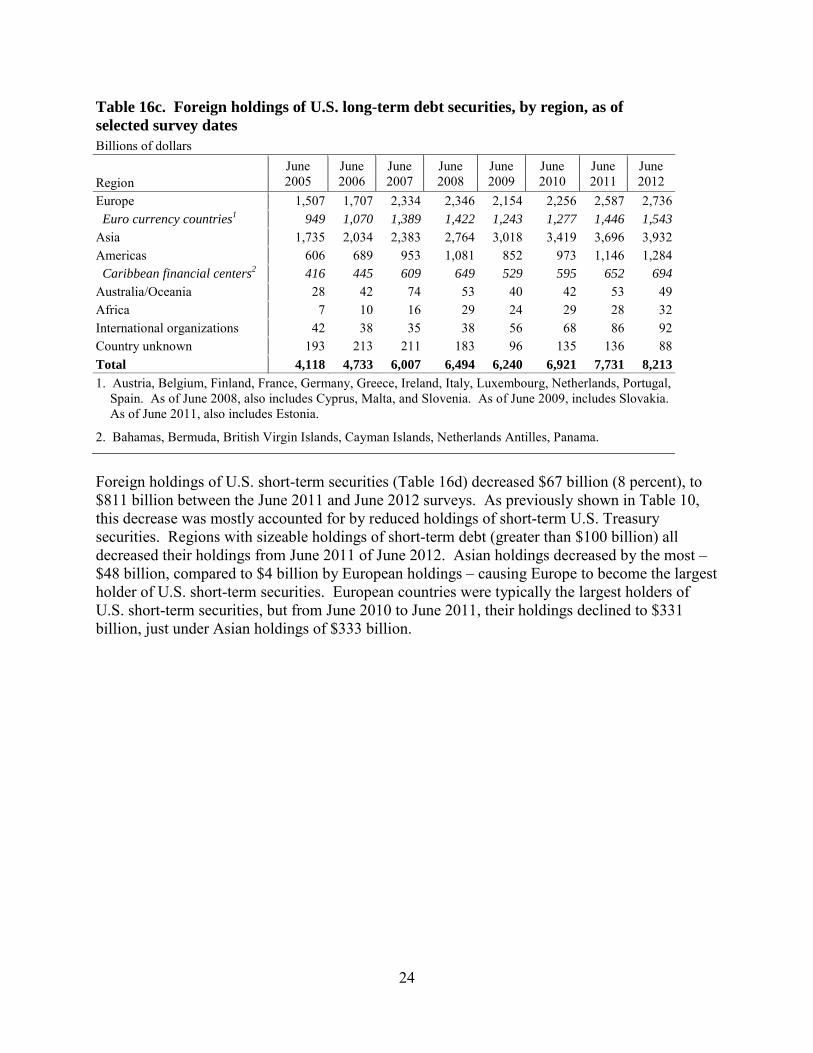
Asian countries collectively held $3,932 billion in U.S. long-term debt securities, more than any other region (Table 16c), as has been the case since the 1978 survey. European countries collectively held $2,736 billion, the second-most U.S. long-term debt securities. Additionally, from June 2011 to June 2012, Asian holding of U.S. long-term debt increased by more than European holdings: Asian holdings increased by $236 billion while European holdings increased by $149 billion. Investment patterns by region have been consistent over time. Aside from the trends just noted, in each preceding survey the second-highest level of holdings of U.S. equity has been from the Americas region followed by Asia, and since the 1984 survey Europe has held the second-highest level of U.S. long-term debt securities, followed by the Americas.
24
Table 16c. Foreign holdings of U.S. long-term debt securities, by region, as of selected survey dates Billions of dollars June
2005 June 2006
June 2007
June 2008
June 2009
June 2010
June 2011
June 2012 Region
Europe 1,507 1,707 2,334 2,346 2,154 2,256 2,587 2,736 Euro currency countries1 949 1,070 1,389 1,422 1,243 1,277 1,446 1,543 Asia 1,735 2,034 2,383 2,764 3,018 3,419 3,696 3,932 Americas 606 689 953 1,081 852 973 1,146 1,284 Caribbean financial centers2 416 445 609 649 529 595 652 694 Australia/Oceania 28 42 74 53 40 42 53 49 Africa 7 10 16 29 24 29 28 32 International organizations 42 38 35 38 56 68 86 92 Country unknown 193 213 211 183 96 135 136 88 Total 4,118 4,733 6,007 6,494 6,240 6,921 7,731 8,213 1. Austria, Belgium, Finland, France, Germany, Greece, Ireland, Italy, Luxembourg, Netherlands, Portugal,
Spain. As of June 2008, also includes Cyprus, Malta, and Slovenia. As of June 2009, includes Slovakia. As of June 2011, also includes Estonia.
2. Bahamas, Bermuda, British Virgin Islands, Cayman Islands, Netherlands Antilles, Panama.
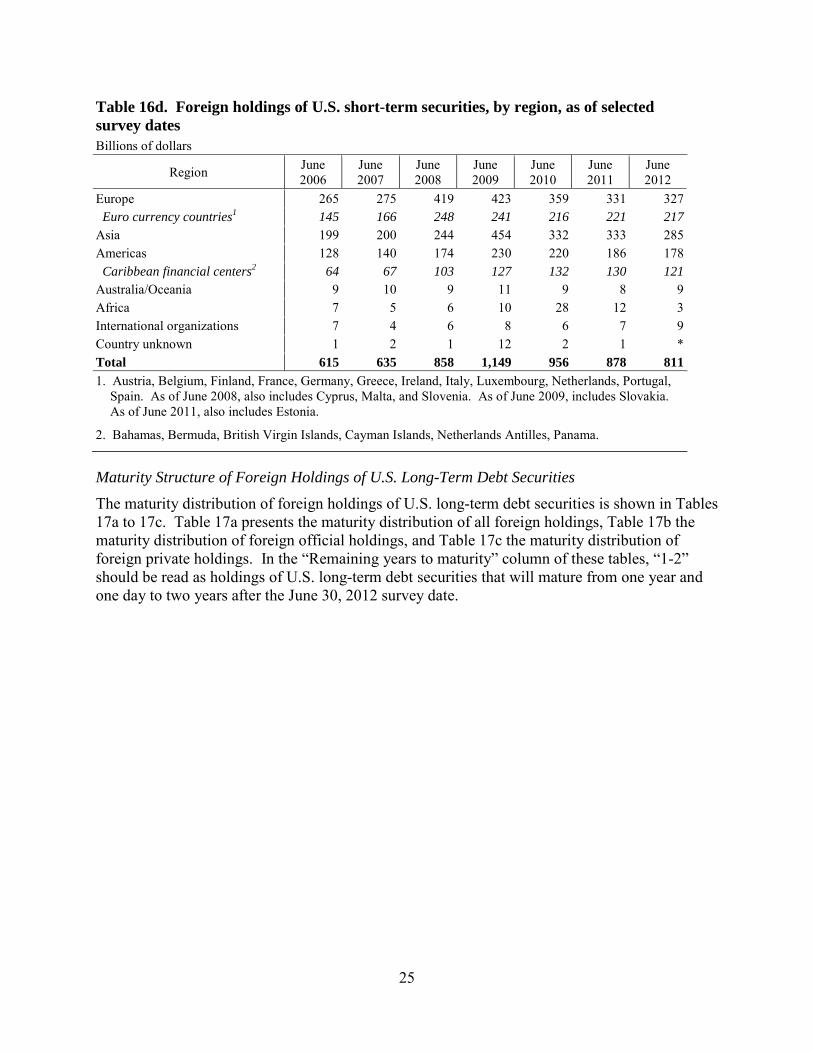
Foreign holdings of U.S. short-term securities (Table 16d) decreased $67 billion (8 percent), to $811 billion between the June 2011 and June 2012 surveys. As previously shown in Table 10, this decrease was mostly accounted for by reduced holdings of short-term U.S. Treasury securities. Regions with sizeable holdings of short-term debt (greater than $100 billion) all decreased their holdings from June 2011 of June 2012. Asian holdings decreased by the most – $48 billion, compared to $4 billion by European holdings – causing Europe to become the largest holder of U.S. short-term securities. European countries were typically the largest holders of U.S. short-term securities, but from June 2010 to June 2011, their holdings declined to $331 billion, just under Asian holdings of $333 billion.
25
Table 16d. Foreign holdings of U.S. short-term securities, by region, as of selected survey dates Billions of dollars
Region June 2006
June 2007
June 2008
June 2009
June 2010
June 2011
June 2012
Europe 265 275 419 423 359 331 327 Euro currency countries1 145 166 248 241 216 221 217 Asia 199 200 244 454 332 333 285 Americas 128 140 174 230 220 186 178 Caribbean financial centers2 64 67 103 127 132 130 121 Australia/Oceania 9 10 9 11 9 8 9 Africa 7 5 6 10 28 12 3 International organizations 7 4 6 8 6 7 9 Country unknown 1 2 1 12 2 1 * Total 615 635 858 1,149 956 878 811 1. Austria, Belgium, Finland, France, Germany, Greece, Ireland, Italy, Luxembourg, Netherlands, Portugal,
Spain. As of June 2008, also includes Cyprus, Malta, and Slovenia. As of June 2009, includes Slovakia. As of June 2011, also includes Estonia.
2. Bahamas, Bermuda, British Virgin Islands, Cayman Islands, Netherlands Antilles, Panama.
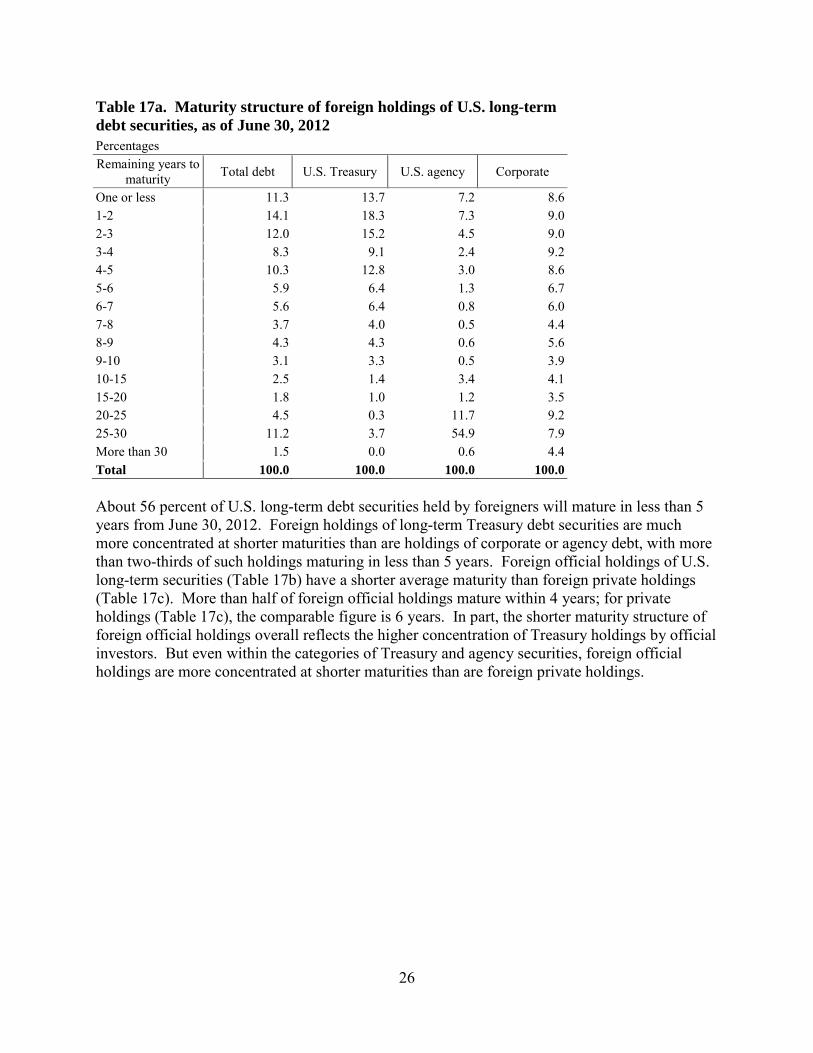
Maturity Structure of Foreign Holdings of U.S. Long-Term Debt Securities The maturity distribution of foreign holdings of U.S. long-term debt securities is shown in Tables 17a to 17c. Table 17a presents the maturity distribution of all foreign holdings, Table 17b the maturity distribution of foreign official holdings, and Table 17c the maturity distribution of foreign private holdings. In the “Remaining years to maturity” column of these tables, “1-2” should be read as holdings of U.S. long-term debt securities that will mature from one year and one day to two years after the June 30, 2012 survey date.
26
Table 17a. Maturity structure of foreign holdings of U.S. long-term debt securities, as of June 30, 2012 Percentages Remaining years to
maturity Total debt U.S. Treasury U.S. agency Corporate
One or less 11.3 13.7 7.2 8.6 1-2 14.1 18.3 7.3 9.0 2-3 12.0 15.2 4.5 9.0 3-4 8.3 9.1 2.4 9.2 4-5 10.3 12.8 3.0 8.6 5-6 5.9 6.4 1.3 6.7 6-7 5.6 6.4 0.8 6.0 7-8 3.7 4.0 0.5 4.4 8-9 4.3 4.3 0.6 5.6 9-10 3.1 3.3 0.5 3.9 10-15 2.5 1.4 3.4 4.1 15-20 1.8 1.0 1.2 3.5 20-25 4.5 0.3 11.7 9.2 25-30 11.2 3.7 54.9 7.9 More than 30 1.5 0.0 0.6 4.4 Total 100.0 100.0 100.0 100.0 About 56 percent of U.S. long-term debt securities held by foreigners will mature in less than 5 years from June 30, 2012. Foreign holdings of long-term Treasury debt securities are much more concentrated at shorter maturities than are holdings of corporate or agency debt, with more than two-thirds of such holdings maturing in less than 5 years. Foreign official holdings of U.S. long-term securities (Table 17b) have a shorter average maturity than foreign private holdings (Table 17c). More than half of foreign official holdings mature within 4 years; for private holdings (Table 17c), the comparable figure is 6 years. In part, the shorter maturity structure of foreign official holdings overall reflects the higher concentration of Treasury holdings by official investors. But even within the categories of Treasury and agency securities, foreign official holdings are more concentrated at shorter maturities than are foreign private holdings.
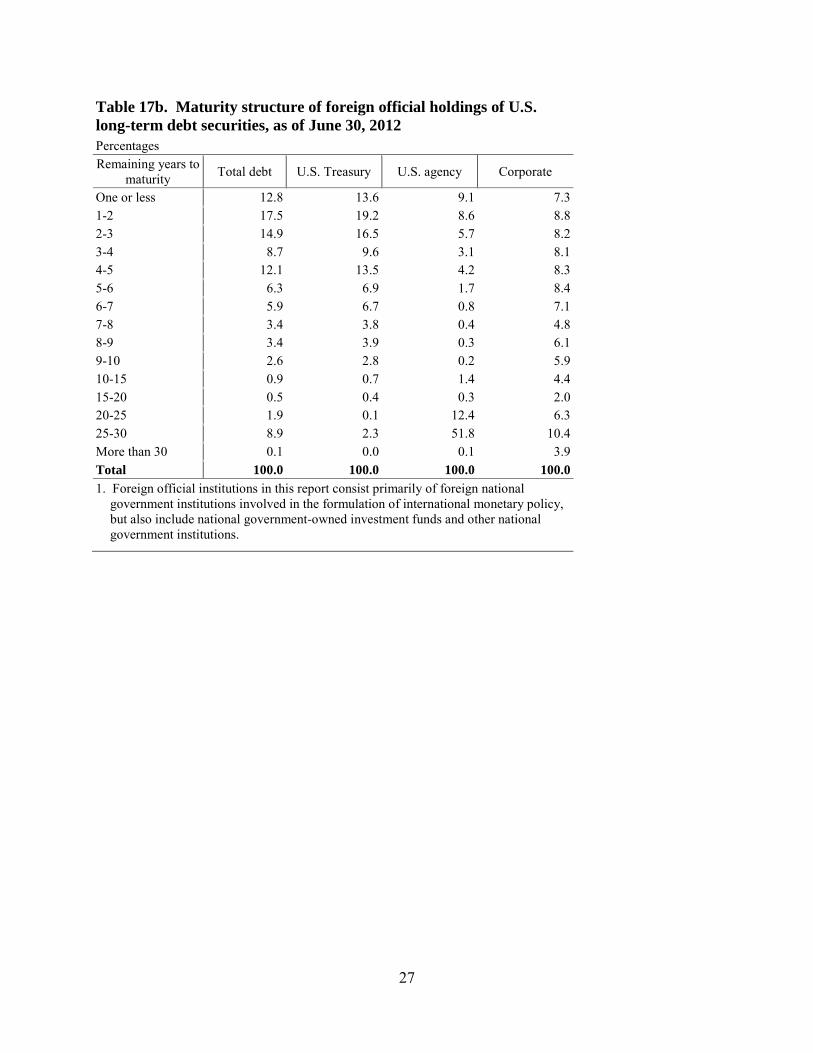
27
Table 17b. Maturity structure of foreign official holdings of U.S. long-term debt securities, as of June 30, 2012 Percentages Remaining years to
maturity Total debt U.S. Treasury U.S. agency Corporate
One or less 12.8 13.6 9.1 7.3 1-2 17.5 19.2 8.6 8.8 2-3 14.9 16.5 5.7 8.2 3-4 8.7 9.6 3.1 8.1 4-5 12.1 13.5 4.2 8.3 5-6 6.3 6.9 1.7 8.4 6-7 5.9 6.7 0.8 7.1 7-8 3.4 3.8 0.4 4.8 8-9 3.4 3.9 0.3 6.1 9-10 2.6 2.8 0.2 5.9 10-15 0.9 0.7 1.4 4.4 15-20 0.5 0.4 0.3 2.0 20-25 1.9 0.1 12.4 6.3 25-30 8.9 2.3 51.8 10.4 More than 30 0.1 0.0 0.1 3.9 Total 100.0 100.0 100.0 100.0 1. Foreign official institutions in this report consist primarily of foreign national
government institutions involved in the formulation of international monetary policy, but also include national government-owned investment funds and other national government institutions.
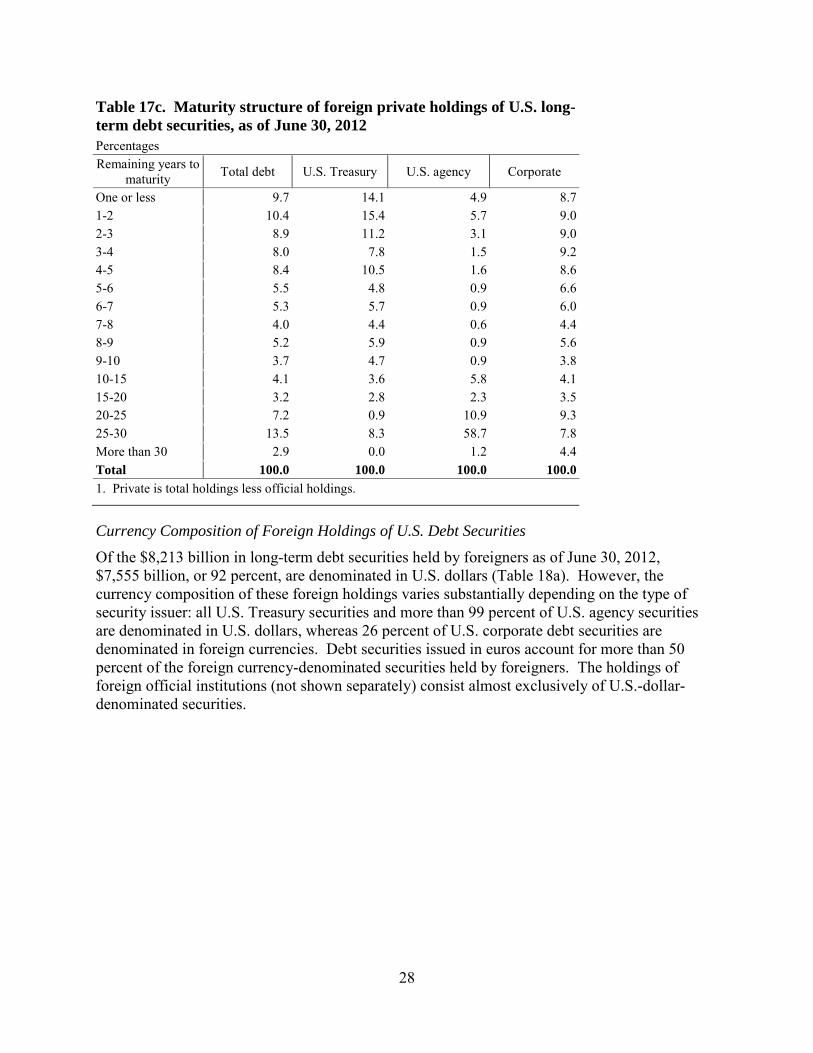
28
Table 17c. Maturity structure of foreign private holdings of U.S. long-term debt securities, as of June 30, 2012 Percentages Remaining years to
maturity Total debt U.S. Treasury U.S. agency Corporate
One or less 9.7 14.1 4.9 8.7 1-2 10.4 15.4 5.7 9.0 2-3 8.9 11.2 3.1 9.0 3-4 8.0 7.8 1.5 9.2 4-5 8.4 10.5 1.6 8.6 5-6 5.5 4.8 0.9 6.6 6-7 5.3 5.7 0.9 6.0 7-8 4.0 4.4 0.6 4.4 8-9 5.2 5.9 0.9 5.6 9-10 3.7 4.7 0.9 3.8 10-15 4.1 3.6 5.8 4.1 15-20 3.2 2.8 2.3 3.5 20-25 7.2 0.9 10.9 9.3 25-30 13.5 8.3 58.7 7.8 More than 30 2.9 0.0 1.2 4.4 Total 100.0 100.0 100.0 100.0 1. Private is total holdings less official holdings.
Currency Composition of Foreign Holdings of U.S. Debt Securities Of the $8,213 billion in long-term debt securities held by foreigners as of June 30, 2012, $7,555 billion, or 92 percent, are denominated in U.S. dollars (Table 18a). However, the currency composition of these foreign holdings varies substantially depending on the type of security issuer: all U.S. Treasury securities and more than 99 percent of U.S. agency securities are denominated in U.S. dollars, whereas 26 percent of U.S. corporate debt securities are denominated in foreign currencies. Debt securities issued in euros account for more than 50 percent of the foreign currency-denominated securities held by foreigners. The holdings of foreign official institutions (not shown separately) consist almost exclusively of U.S.-dollar-denominated securities.
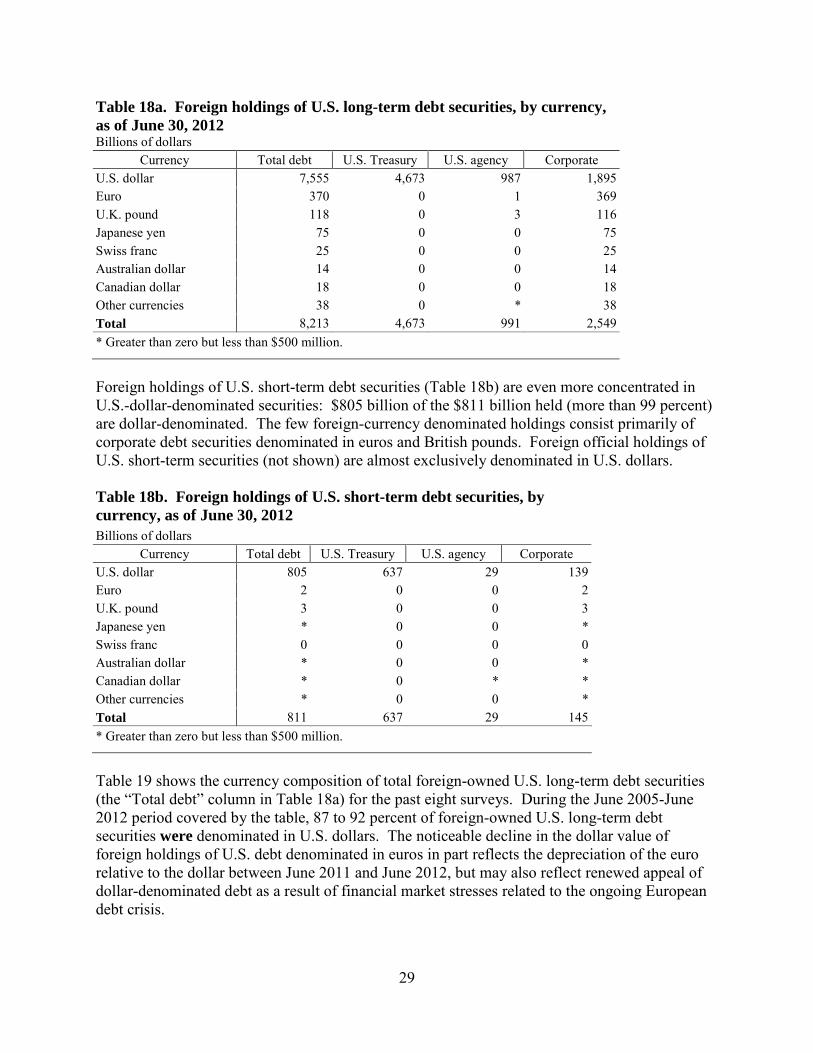
29
Table 18a. Foreign holdings of U.S. long-term debt securities, by currency, as of June 30, 2012 Billions of dollars
Currency Total debt U.S. Treasury U.S. agency Corporate U.S. dollar 7,555 4,673 987 1,895 Euro 370 0 1 369 U.K. pound 118 0 3 116 Japanese yen 75 0 0 75 Swiss franc 25 0 0 25 Australian dollar 14 0 0 14 Canadian dollar 18 0 0 18 Other currencies 38 0 * 38 Total 8,213 4,673 991 2,549 * Greater than zero but less than $500 million.
Foreign holdings of U.S. short-term debt securities (Table 18b) are even more concentrated in U.S.-dollar-denominated securities: $805 billion of the $811 billion held (more than 99 percent) are dollar-denominated. The few foreign-currency denominated holdings consist primarily of corporate debt securities denominated in euros and British pounds. Foreign official holdings of U.S. short-term securities (not shown) are almost exclusively denominated in U.S. dollars.
Table 18b. Foreign holdings of U.S. short-term debt securities, by currency, as of June 30, 2012 Billions of dollars
Currency Total debt U.S. Treasury U.S. agency Corporate U.S. dollar 805 637 29 139 Euro 2 0 0 2 U.K. pound 3 0 0 3 Japanese yen * 0 0 * Swiss franc 0 0 0 0 Australian dollar * 0 0 * Canadian dollar * 0 * * Other currencies * 0 0 * Total 811 637 29 145 * Greater than zero but less than $500 million.
Table 19 shows the currency composition of total foreign-owned U.S. long-term debt securities (the “Total debt” column in Table 18a) for the past eight surveys. During the June 2005-June 2012 period covered by the table, 87 to 92 percent of foreign-owned U.S. long-term debt securities were denominated in U.S. dollars. The noticeable decline in the dollar value of foreign holdings of U.S. debt denominated in euros in part reflects the depreciation of the euro relative to the dollar between June 2011 and June 2012, but may also reflect renewed appeal of dollar-denominated debt as a result of financial market stresses related to the ongoing European debt crisis.
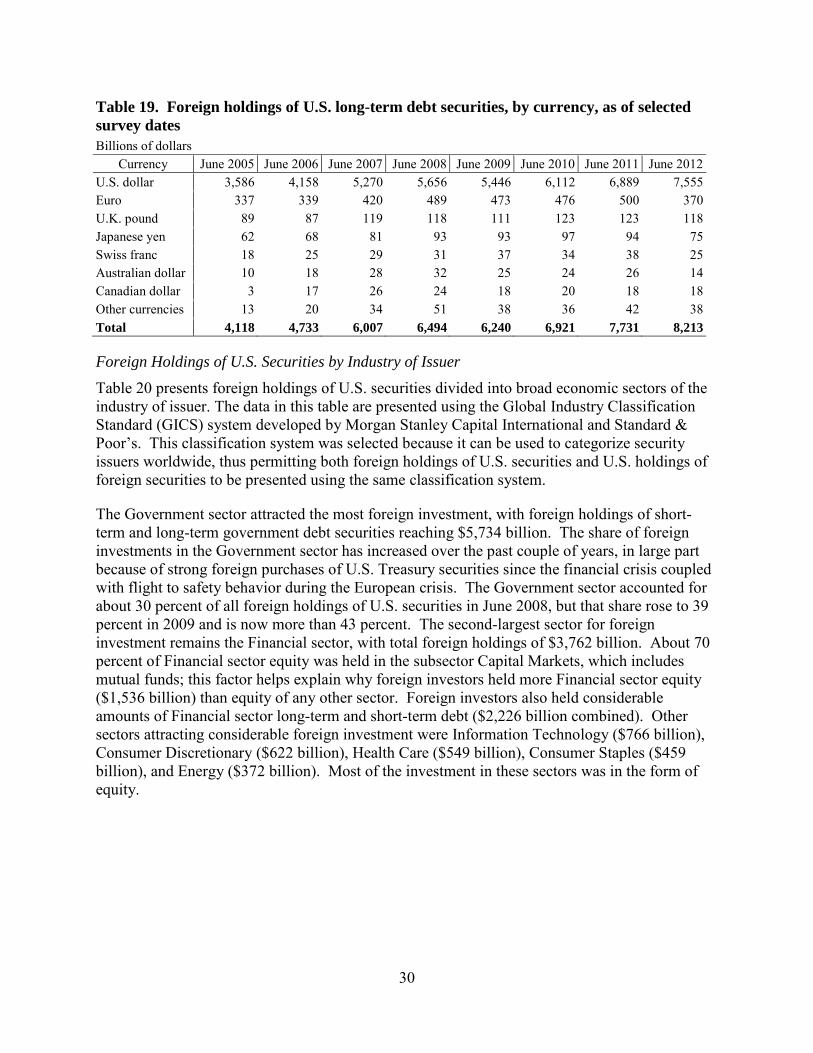
30
Table 19. Foreign holdings of U.S. long-term debt securities, by currency, as of selected survey dates Billions of dollars
Currency June 2005 June 2006 June 2007 June 2008 June 2009 June 2010 June 2011 June 2012 U.S. dollar 3,586 4,158 5,270 5,656 5,446 6,112 6,889 7,555 Euro 337 339 420 489 473 476 500 370 U.K. pound 89 87 119 118 111 123 123 118 Japanese yen 62 68 81 93 93 97 94 75 Swiss franc 18 25 29 31 37 34 38 25 Australian dollar 10 18 28 32 25 24 26 14 Canadian dollar 3 17 26 24 18 20 18 18 Other currencies 13 20 34 51 38 36 42 38 Total 4,118 4,733 6,007 6,494 6,240 6,921 7,731 8,213
Foreign Holdings of U.S. Securities by Industry of Issuer Table 20 presents foreign holdings of U.S. securities divided into broad economic sectors of the industry of issuer. The data in this table are presented using the Global Industry Classification Standard (GICS) system developed by Morgan Stanley Capital International and Standard & Poor’s. This classification system was selected because it can be used to categorize security issuers worldwide, thus permitting both foreign holdings of U.S. securities and U.S. holdings of foreign securities to be presented using the same classification system.
The Government sector attracted the most foreign investment, with foreign holdings of short-term and long-term government debt securities reaching $5,734 billion. The share of foreign investments in the Government sector has increased over the past couple of years, in large part because of strong foreign purchases of U.S. Treasury securities since the financial crisis coupled with flight to safety behavior during the European crisis. The Government sector accounted for about 30 percent of all foreign holdings of U.S. securities in June 2008, but that share rose to 39 percent in 2009 and is now more than 43 percent. The second-largest sector for foreign investment remains the Financial sector, with total foreign holdings of $3,762 billion. About 70 percent of Financial sector equity was held in the subsector Capital Markets, which includes mutual funds; this factor helps explain why foreign investors held more Financial sector equity ($1,536 billion) than equity of any other sector. Foreign investors also held considerable amounts of Financial sector long-term and short-term debt ($2,226 billion combined). Other sectors attracting considerable foreign investment were Information Technology ($766 billion), Consumer Discretionary ($622 billion), Health Care ($549 billion), Consumer Staples ($459 billion), and Energy ($372 billion). Most of the investment in these sectors was in the form of equity.
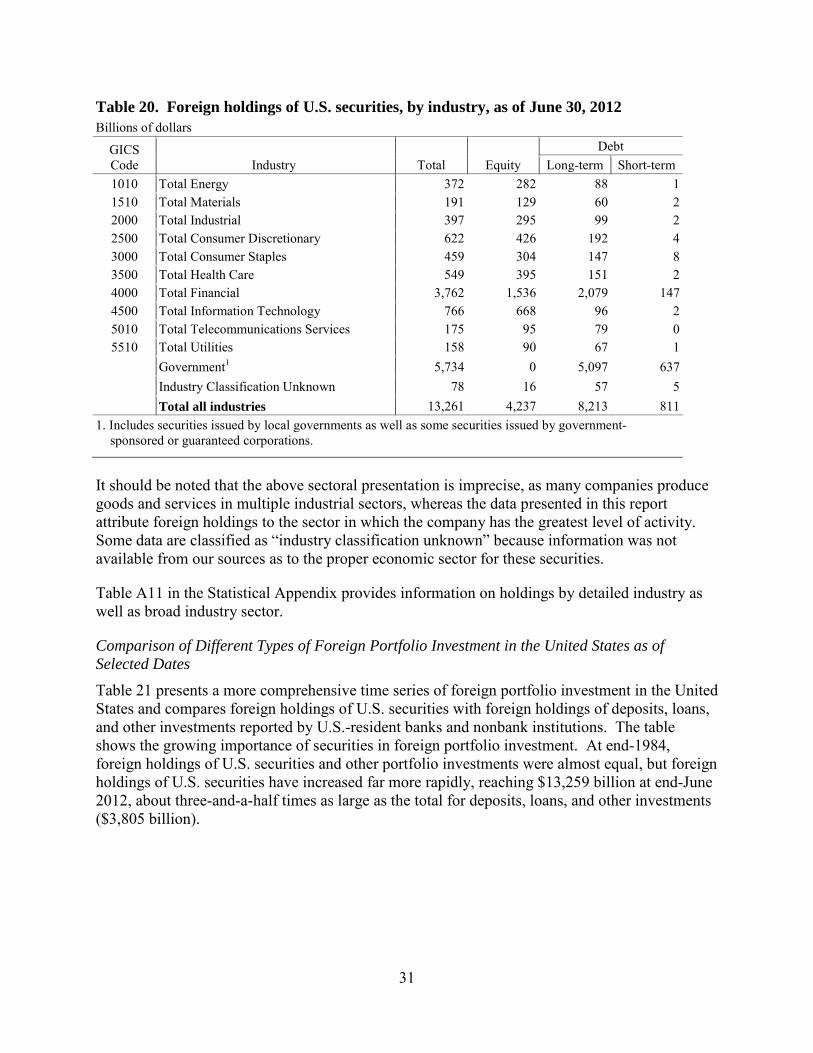
31
Table 20. Foreign holdings of U.S. securities, by industry, as of June 30, 2012 Billions of dollars
GICS Code Industry Total Equity
Debt Long-term Short-term
1010 Total Energy 372 282 88 1 1510 Total Materials 191 129 60 2 2000 Total Industrial 397 295 99 2 2500 Total Consumer Discretionary 622 426 192 4 3000 Total Consumer Staples 459 304 147 8 3500 Total Health Care 549 395 151 2 4000 Total Financial 3,762 1,536 2,079 147 4500 Total Information Technology 766 668 96 2 5010 Total Telecommunications Services 175 95 79 0 5510 Total Utilities 158 90 67 1
Government1 5,734 0 5,097 637 Industry Classification Unknown 78 16 57 5 Total all industries 13,261 4,237 8,213 811 1. Includes securities issued by local governments as well as some securities issued by government-
sponsored or guaranteed corporations.
It should be noted that the above sectoral presentation is imprecise, as many companies produce goods and services in multiple industrial sectors, whereas the data presented in this report attribute foreign holdings to the sector in which the company has the greatest level of activity. Some data are classified as “industry classification unknown” because information was not available from our sources as to the proper economic sector for these securities.
Table A11 in the Statistical Appendix provides information on holdings by detailed industry as well as broad industry sector.
Comparison of Different Types of Foreign Portfolio Investment in the United States as of Selected Dates Table 21 presents a more comprehensive time series of foreign portfolio investment in the United States and compares foreign holdings of U.S. securities with foreign holdings of deposits, loans, and other investments reported by U.S.-resident banks and nonbank institutions. The table shows the growing importance of securities in foreign portfolio investment. At end-1984, foreign holdings of U.S. securities and other portfolio investments were almost equal, but foreign holdings of U.S. securities have increased far more rapidly, reaching $13,259 billion at end-June 2012, about three-and-a-half times as large as the total for deposits, loans, and other investments ($3,805 billion).
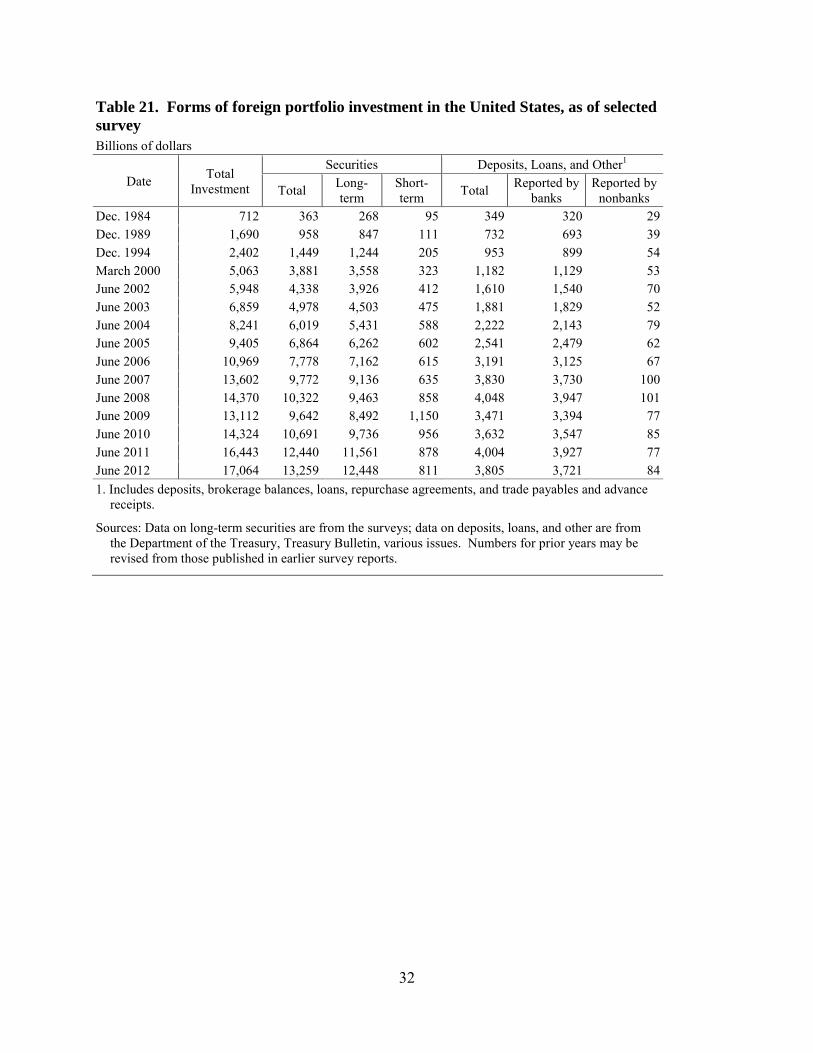
32
Table 21. Forms of foreign portfolio investment in the United States, as of selected survey Billions of dollars
Date Total Investment
Securities Deposits, Loans, and Other1
Total Long-term
Short-term Total Reported by
banks Reported by
nonbanks Dec. 1984 712 363 268 95 349 320 29 Dec. 1989 1,690 958 847 111 732 693 39 Dec. 1994 2,402 1,449 1,244 205 953 899 54 March 2000 5,063 3,881 3,558 323 1,182 1,129 53 June 2002 5,948 4,338 3,926 412 1,610 1,540 70 June 2003 6,859 4,978 4,503 475 1,881 1,829 52 June 2004 8,241 6,019 5,431 588 2,222 2,143 79 June 2005 9,405 6,864 6,262 602 2,541 2,479 62 June 2006 10,969 7,778 7,162 615 3,191 3,125 67 June 2007 13,602 9,772 9,136 635 3,830 3,730 100 June 2008 14,370 10,322 9,463 858 4,048 3,947 101 June 2009 13,112 9,642 8,492 1,150 3,471 3,394 77 June 2010 14,324 10,691 9,736 956 3,632 3,547 85 June 2011 16,443 12,440 11,561 878 4,004 3,927 77 June 2012 17,064 13,259 12,448 811 3,805 3,721 84 1. Includes deposits, brokerage balances, loans, repurchase agreements, and trade payables and advance
receipts.
Sources: Data on long-term securities are from the surveys; data on deposits, loans, and other are from the Department of the Treasury, Treasury Bulletin, various issues. Numbers for prior years may be revised from those published in earlier survey reports.
33
Chapter 2. Survey Methodology
The U.S. system for measuring foreign-resident holdings of U.S. securities consists of “benchmark” surveys conducted at five-year intervals and annual surveys conducted from a smaller panel during “non-benchmark” years. The benchmark survey collects cross-border portfolio investment data from a large number of institutions (custodians and issuers) in an attempt to capture total foreign-resident ownership of domestically-issued securities. In the four years succeeding the benchmark survey, data are collected primarily from those respondents that collectively accounted for the bulk of the holdings reported in the previous benchmark survey. In order for the annual survey to approximate the coverage of the larger benchmark survey, the data are adjusted upwards to reflect security holdings by institutions not required to report annually.
The 2012 survey was conducted during a non-benchmark year. Data were submitted by U.S.-resident issuers and custodians (including securities depositories) who were required to report detailed information on each U.S. security issued directly to a foreign-resident or entrusted to their safekeeping on behalf of a foreign-resident client. A total of 99 institutions reported such holdings on Schedule 2 of the survey report. The ten largest custodians comprised 88 percent of the total market value of security holdings data submitted, with each reporting foreign holdings in excess of $170 billion.
The survey was conducted under the authority of the International Investment and Trade in Services Survey Act (22 U.S.C. 3101 et seq.). Reporting was mandatory, and subject to penalties for noncompliance. Data were collected for holdings as of June 30, 2012, and were to be reported to the Federal Reserve Bank of New York, acting as agent for the Department of the Treasury, no later than September 3, 2012. A copy of the forms and instructions are included in Appendix B.
Data Analysis and Editing The data reported by respondents were subjected to extensive analysis and editing. The first step in the process was to analyze data at the reporter level to identify systematic errors within each respondent’s submission. When available, respondent data filed for the current year were analyzed individually and compared to the data submitted in the prior year. Aggregate holdings reported in the survey were also measured against holdings reported in the monthly Aggregate Holdings of Long-Term Securities by U.S. and Foreign Residents (Treasury International Capital (TIC) Form SLT) to identify and reconcile any major discrepancies between the respondents’ reports as of June 30, 2012.
Once the analysis of the data for each respondent was complete, the second step was to analyze the data on a security-by-security basis, across all reporters. Securities subject to particular attention included those reported with a large market value or quantity, those with particularly high or low prices, and those comprising a large percentage of the total amount outstanding. Reported securities were also analyzed in the aggregate to identify common types of reporting errors.
The third step was to analyze the data according to various cumulative, or “macro” groupings. At this level, the data were aggregated by categories such as country of foreign owner, type of issuer, and type of industry. This review was especially useful in eliminating cases in which the
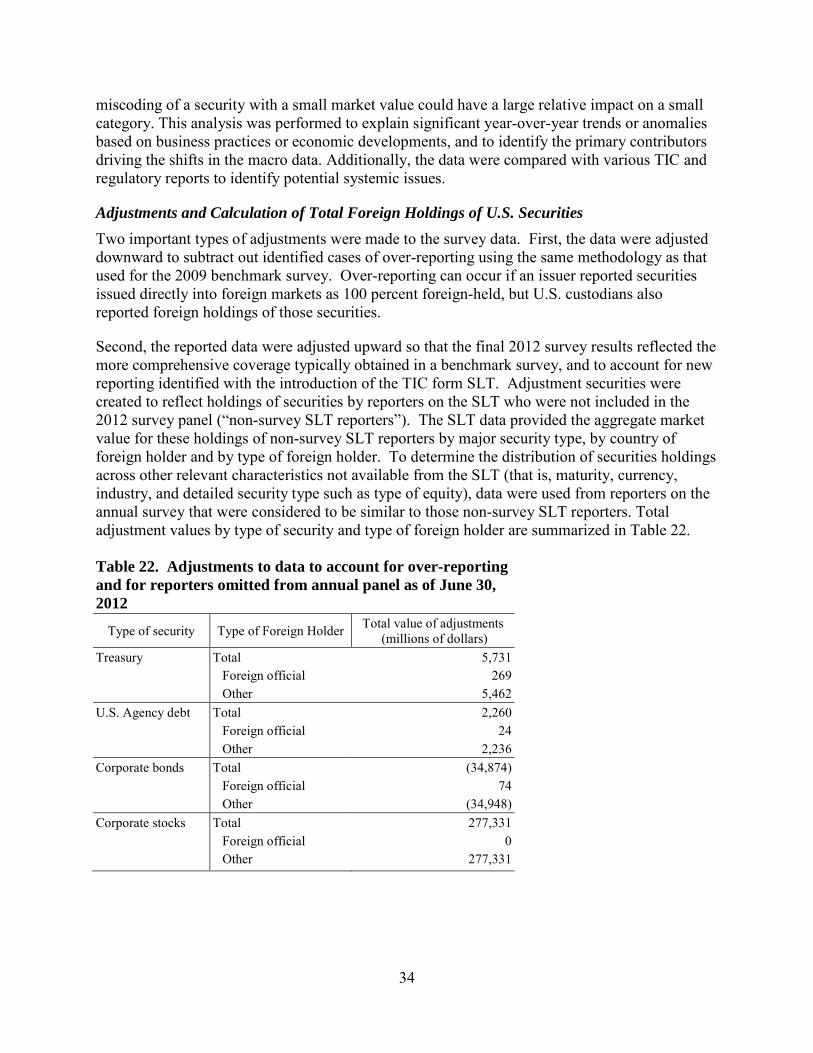
34
miscoding of a security with a small market value could have a large relative impact on a small category. This analysis was performed to explain significant year-over-year trends or anomalies based on business practices or economic developments, and to identify the primary contributors driving the shifts in the macro data. Additionally, the data were compared with various TIC and regulatory reports to identify potential systemic issues.
Adjustments and Calculation of Total Foreign Holdings of U.S. Securities Two important types of adjustments were made to the survey data. First, the data were adjusted downward to subtract out identified cases of over-reporting using the same methodology as that used for the 2009 benchmark survey. Over-reporting can occur if an issuer reported securities issued directly into foreign markets as 100 percent foreign-held, but U.S. custodians also reported foreign holdings of those securities.
Second, the reported data were adjusted upward so that the final 2012 survey results reflected the more comprehensive coverage typically obtained in a benchmark survey, and to account for new reporting identified with the introduction of the TIC form SLT. Adjustment securities were created to reflect holdings of securities by reporters on the SLT who were not included in the 2012 survey panel (“non-survey SLT reporters”). The SLT data provided the aggregate market value for these holdings of non-survey SLT reporters by major security type, by country of foreign holder and by type of foreign holder. To determine the distribution of securities holdings across other relevant characteristics not available from the SLT (that is, maturity, currency, industry, and detailed security type such as type of equity), data were used from reporters on the annual survey that were considered to be similar to those non-survey SLT reporters. Total adjustment values by type of security and type of foreign holder are summarized in Table 22.
Table 22. Adjustments to data to account for over-reporting and for reporters omitted from annual panel as of June 30, 2012
Type of security Type of Foreign Holder Total value of adjustments (millions of dollars)
Treasury Total 5,731 Foreign official 269 Other 5,462 U.S. Agency debt Total 2,260 Foreign official 24 Other 2,236 Corporate bonds Total (34,874) Foreign official 74 Other (34,948) Corporate stocks Total 277,331 Foreign official 0
Other 277,331
35
Treatment of Repurchase and Securities Lending Agreements Repurchase and securities lending agreements pose a challenge for accurately measuring cross-border holdings of securities. Following international standards, repurchase and securities lending agreements are treated as collateralized loans because the return of the same or similar securities at a set price is agreed upon in advance, and thus, the economic risk of changes in the value of the securities continues to reside with the securities lender (the economic owner) even though the lender is no longer the legal owner (the securities borrower is the legal owner). Lenders (or their custodians) are instructed to report securities involved in such agreements as continuously held by the lender, and borrowers (or their custodians) are instructed not to report such securities as holdings of the borrower.
Despite these instructions, reporting entities may not always have sufficient information to report as intended. That is, custodians may not always be able to distinguish between, on the one hand, securities transferred in or transferred out through repurchase and lending activity and, on the other hand, securities holdings originating from outright purchases and sales. Thus, correct reporting by custodians based on information available to them can result in reporting “errors” from the viewpoint of data collectors and those compiling Balance of Payment and International Investment Position statistics. This type of reporting error could result in measured foreign holdings being either over- or under-reported. For instance, under-reporting might occur if a foreign entity (or its agent) lends a U.S. security to a U.S. resident without either counter-party informing their custodian that the transaction is a loan rather than a sale. After the change in legal ownership, the U.S. custodian of the foreign resident delivers the security and thus would not report the security as foreign-held. The custodian for the U.S. resident would also not report the security, because it holds a U.S. security on behalf of a U.S. resident and not a foreign resident. On the other hand, over-reporting might occur if a U.S. resident lends a U.S. security to a foreign entity and again neither custodian is informed that the transaction is a loan rather than a sale. In this case the U.S. custodian for the foreign resident would report foreign ownership of the U.S. security when in fact it is still U.S.-owned (in the sense of economic ownership).
Another challenge is that a security borrower (the legal owner) has the right to resell a borrowed security. If a U.S. resident borrows a U.S. security from a foreign entity and subsequently sells the security to another foreign resident, this can result in two different foreign residents reporting as holding the same U.S. security. In this case, reporting is correct according to the instructions, but it can lead to the overstatement of certain statistics, such as the percentage of U.S. Treasury securities that are foreign-owned.
Acknowledgments The Department of the Treasury, the Federal Reserve Bank of New York, and the Federal Reserve Board of Governors wish to express their appreciation to the Securities Reports Division of the Federal Reserve Bank of New York for preparation of the U.S. portfolio investment data. Under the direction of Vadim Tovshteyn, staff members responsible for the data analysis were: Katherine Cullinane; Amanda Eng; Anthony Fagbeyiro; Caroline Fernandez; Aaron Gononsky; Hansy Hernandez; Alex Karas; Brian Mullarkey; Peter Odell; Edward Sapozhnikov; Gillian Stowe; Dawn Sullivan; and Paula Webster. Under the direction of Michele Waldman, Automation staff responsible for obtaining properly formatted data files and for facilitating data loads and updates were: Frank Innocenti; David Carley; Jim Chan; Susan Gibson; Mike Hasell;
36
Navin Persaud; Sophia Shi; and Cecelia Valentin-Doval. Under the direction of Julie SunJannes, Application Development staff responsible for the development and enhancement of the database and reports were: Yee Ying Chan. Under the direction of Laura Iannolino, staff responsible for timely data entry and file-loading support were: Mary Ann Campano; Natasha Fair; and Rita Cek-Dagostin. Nyssa Kim, Gary Maguire, Hugh Montag, and Vivian Wong at the Board of Governors provided programming and research assistance. Kim and Wong also drafted large sections of the report.

37
Statistical Appendix
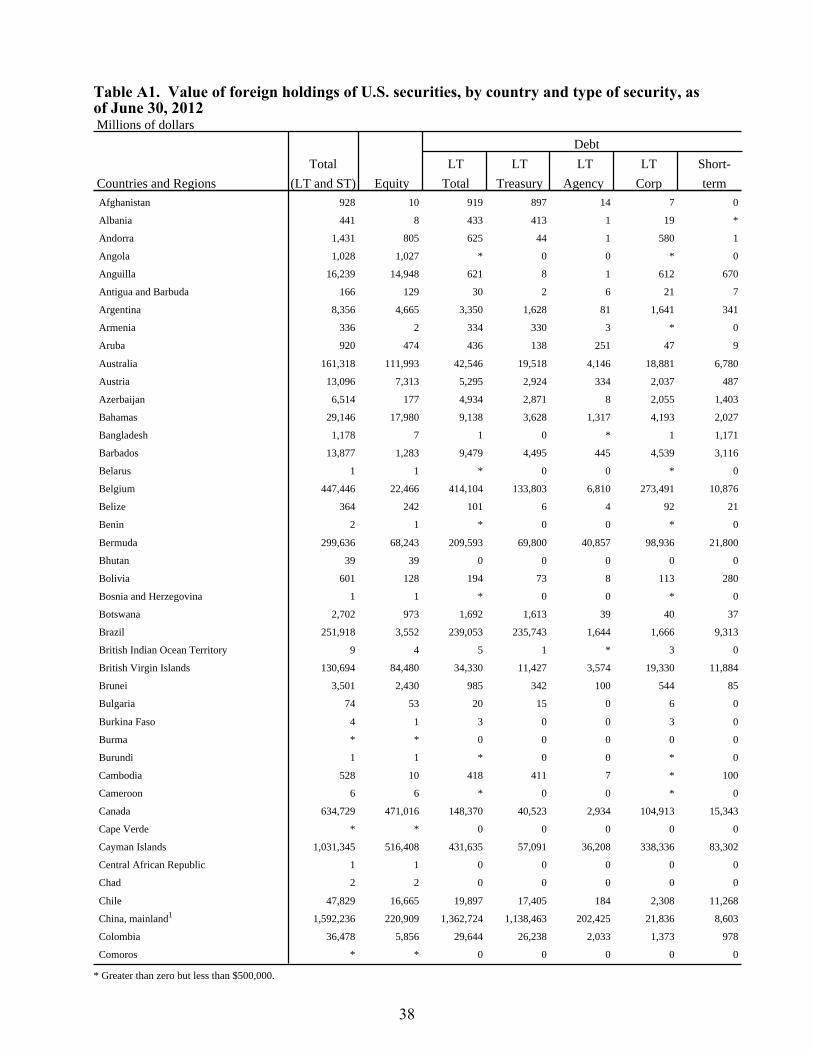
Table A1. Value of foreign holdings of U.S. securities, by country and type of security, asof June 30, 2012 Millions of dollars
Debt
Total LT LT LT LT Short-
Countries and Regions (LT and ST) Equity Total Treasury Agency Corp term Afghanistan 928 10 919 897 14 7 0
Albania 441 8 433 413 1 19 *
Andorra 1,431 805 625 44 1 580 1
Angola 1,028 1,027 * 0 0 * 0
Anguilla 16,239 14,948 621 8 1 612 670
Antigua and Barbuda 166 129 30 2 6 21 7
Argentina 8,356 4,665 3,350 1,628 81 1,641 341
Armenia 336 2 334 330 3 * 0
Aruba 920 474 436 138 251 47 9
Australia 161,318 111,993 42,546 19,518 4,146 18,881 6,780
Austria 13,096 7,313 5,295 2,924 334 2,037 487
Azerbaijan 6,514 177 4,934 2,871 8 2,055 1,403
Bahamas 29,146 17,980 9,138 3,628 1,317 4,193 2,027
Bangladesh 1,178 7 1 0 * 1 1,171
Barbados 13,877 1,283 9,479 4,495 445 4,539 3,116
Belarus 1 1 * 0 0 * 0
Belgium 447,446 22,466 414,104 133,803 6,810 273,491 10,876
Belize 364 242 101 6 4 92 21
Benin 2 1 * 0 0 * 0
Bermuda 299,636 68,243 209,593 69,800 40,857 98,936 21,800
Bhutan 39 39 0 0 0 0 0
Bolivia 601 128 194 73 8 113 280
Bosnia and Herzegovina 1 1 * 0 0 * 0
Botswana 2,702 973 1,692 1,613 39 40 37
Brazil 251,918 3,552 239,053 235,743 1,644 1,666 9,313
British Indian Ocean Territory 9 4 5 1 * 3 0
British Virgin Islands 130,694 84,480 34,330 11,427 3,574 19,330 11,884
Brunei 3,501 2,430 985 342 100 544 85
Bulgaria 74 53 20 15 0 6 0
Burkina Faso 4 1 3 0 0 3 0
Burma * * 0 0 0 0 0
Burundi 1 1 * 0 0 * 0
Cambodia 528 10 418 411 7 * 100
Cameroon 6 6 * 0 0 * 0
Canada 634,729 471,016 148,370 40,523 2,934 104,913 15,343
Cape Verde * * 0 0 0 0 0
Cayman Islands 1,031,345 516,408 431,635 57,091 36,208 338,336 83,302
Central African Republic 1 1 0 0 0 0 0
Chad 2 2 0 0 0 0 0
Chile 47,829 16,665 19,897 17,405 184 2,308 11,268
China, mainland1 1,592,236 220,909 1,362,724 1,138,463 202,425 21,836 8,603
Colombia 36,478 5,856 29,644 26,238 2,033 1,373 978
Comoros * * 0 0 0 0 0
* Greater than zero but less than $500,000.
38
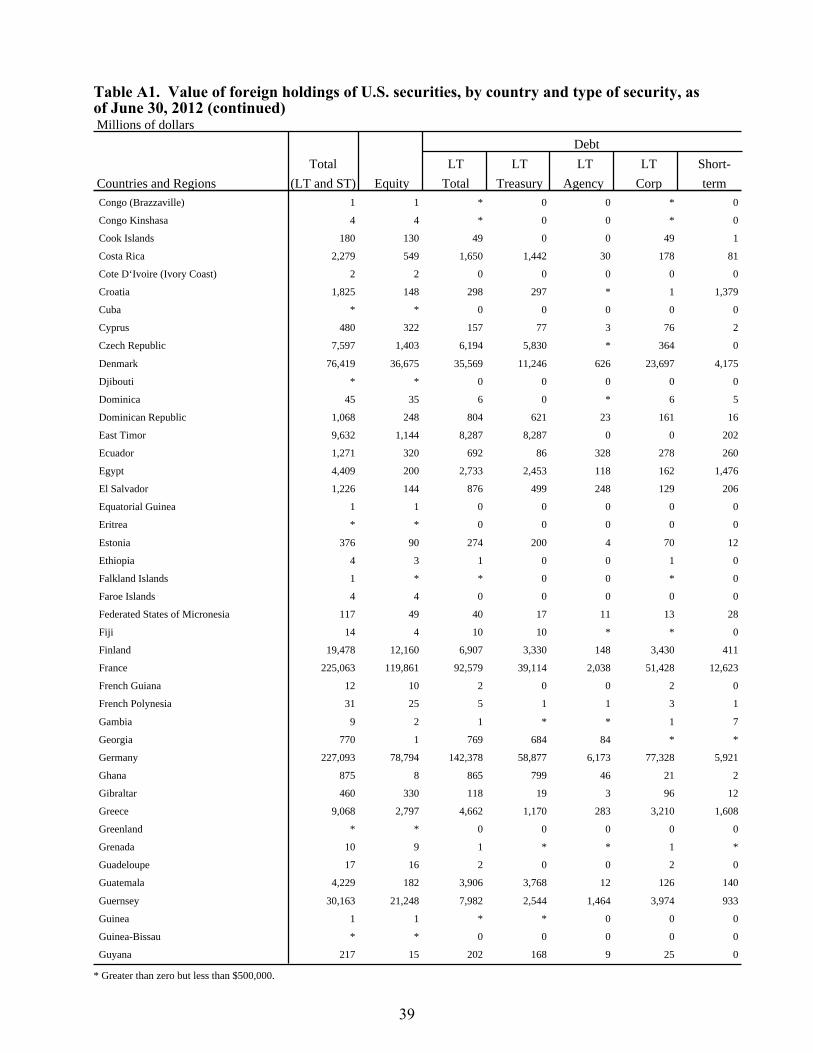
Table A1. Value of foreign holdings of U.S. securities, by country and type of security, asof June 30, 2012 (continued) Millions of dollars
Debt
Total LT LT LT LT Short-
Countries and Regions (LT and ST) Equity Total Treasury Agency Corp term Congo (Brazzaville) 1 1 * 0 0 * 0
Congo Kinshasa 4 4 * 0 0 * 0
Cook Islands 180 130 49 0 0 49 1
Costa Rica 2,279 549 1,650 1,442 30 178 81
Cote D‘Ivoire (Ivory Coast) 2 2 0 0 0 0 0
Croatia 1,825 148 298 297 * 1 1,379
Cuba * * 0 0 0 0 0
Cyprus 480 322 157 77 3 76 2
Czech Republic 7,597 1,403 6,194 5,830 * 364 0
Denmark 76,419 36,675 35,569 11,246 626 23,697 4,175
Djibouti * * 0 0 0 0 0
Dominica 45 35 6 0 * 6 5
Dominican Republic 1,068 248 804 621 23 161 16
East Timor 9,632 1,144 8,287 8,287 0 0 202
Ecuador 1,271 320 692 86 328 278 260
Egypt 4,409 200 2,733 2,453 118 162 1,476
El Salvador 1,226 144 876 499 248 129 206
Equatorial Guinea 1 1 0 0 0 0 0
Eritrea * * 0 0 0 0 0
Estonia 376 90 274 200 4 70 12
Ethiopia 4 3 1 0 0 1 0
Falkland Islands 1 * * 0 0 * 0
Faroe Islands 4 4 0 0 0 0 0
Federated States of Micronesia 117 49 40 17 11 13 28
Fiji 14 4 10 10 * * 0
Finland 19,478 12,160 6,907 3,330 148 3,430 411
France 225,063 119,861 92,579 39,114 2,038 51,428 12,623
French Guiana 12 10 2 0 0 2 0
French Polynesia 31 25 5 1 1 3 1
Gambia 9 2 1 * * 1 7
Georgia 770 1 769 684 84 * *
Germany 227,093 78,794 142,378 58,877 6,173 77,328 5,921
Ghana 875 8 865 799 46 21 2
Gibraltar 460 330 118 19 3 96 12
Greece 9,068 2,797 4,662 1,170 283 3,210 1,608
Greenland * * 0 0 0 0 0
Grenada 10 9 1 * * 1 *
Guadeloupe 17 16 2 0 0 2 0
Guatemala 4,229 182 3,906 3,768 12 126 140
Guernsey 30,163 21,248 7,982 2,544 1,464 3,974 933
Guinea 1 1 * * 0 0 0
Guinea-Bissau * * 0 0 0 0 0
Guyana 217 15 202 168 9 25 0
* Greater than zero but less than $500,000.
39
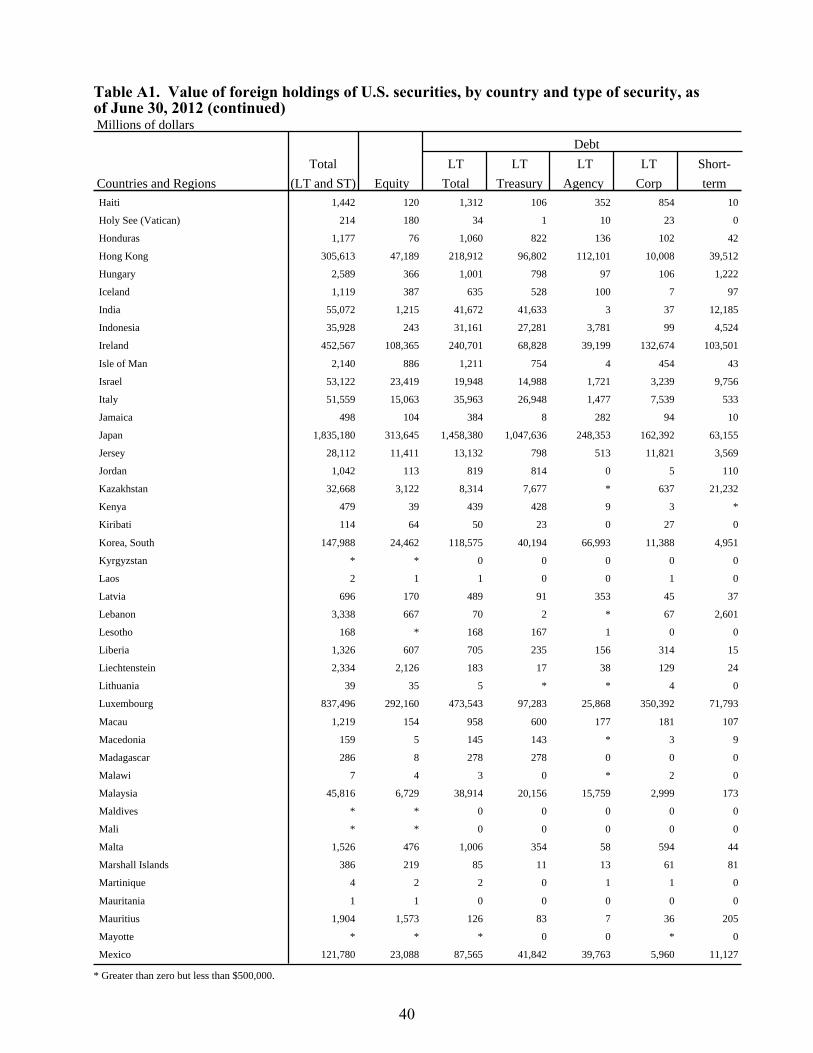
Table A1. Value of foreign holdings of U.S. securities, by country and type of security, asof June 30, 2012 (continued) Millions of dollars
Debt
Total LT LT LT LT Short-
Countries and Regions (LT and ST) Equity Total Treasury Agency Corp term Haiti 1,442 120 1,312 106 352 854 10
Holy See (Vatican) 214 180 34 1 10 23 0
Honduras 1,177 76 1,060 822 136 102 42
Hong Kong 305,613 47,189 218,912 96,802 112,101 10,008 39,512
Hungary 2,589 366 1,001 798 97 106 1,222
Iceland 1,119 387 635 528 100 7 97
India 55,072 1,215 41,672 41,633 3 37 12,185
Indonesia 35,928 243 31,161 27,281 3,781 99 4,524
Ireland 452,567 108,365 240,701 68,828 39,199 132,674 103,501
Isle of Man 2,140 886 1,211 754 4 454 43
Israel 53,122 23,419 19,948 14,988 1,721 3,239 9,756
Italy 51,559 15,063 35,963 26,948 1,477 7,539 533
Jamaica 498 104 384 8 282 94 10
Japan 1,835,180 313,645 1,458,380 1,047,636 248,353 162,392 63,155
Jersey 28,112 11,411 13,132 798 513 11,821 3,569
Jordan 1,042 113 819 814 0 5 110
Kazakhstan 32,668 3,122 8,314 7,677 * 637 21,232
Kenya 479 39 439 428 9 3 *
Kiribati 114 64 50 23 0 27 0
Korea, South 147,988 24,462 118,575 40,194 66,993 11,388 4,951
Kyrgyzstan * * 0 0 0 0 0
Laos 2 1 1 0 0 1 0
Latvia 696 170 489 91 353 45 37
Lebanon 3,338 667 70 2 * 67 2,601
Lesotho 168 * 168 167 1 0 0
Liberia 1,326 607 705 235 156 314 15
Liechtenstein 2,334 2,126 183 17 38 129 24
Lithuania 39 35 5 * * 4 0
Luxembourg 837,496 292,160 473,543 97,283 25,868 350,392 71,793
Macau 1,219 154 958 600 177 181 107
Macedonia 159 5 145 143 * 3 9
Madagascar 286 8 278 278 0 0 0
Malawi 7 4 3 0 * 2 0
Malaysia 45,816 6,729 38,914 20,156 15,759 2,999 173
Maldives * * 0 0 0 0 0
Mali * * 0 0 0 0 0
Malta 1,526 476 1,006 354 58 594 44
Marshall Islands 386 219 85 11 13 61 81
Martinique 4 2 2 0 1 1 0
Mauritania 1 1 0 0 0 0 0
Mauritius 1,904 1,573 126 83 7 36 205
Mayotte * * * 0 0 * 0
Mexico 121,780 23,088 87,565 41,842 39,763 5,960 11,127
* Greater than zero but less than $500,000.
40
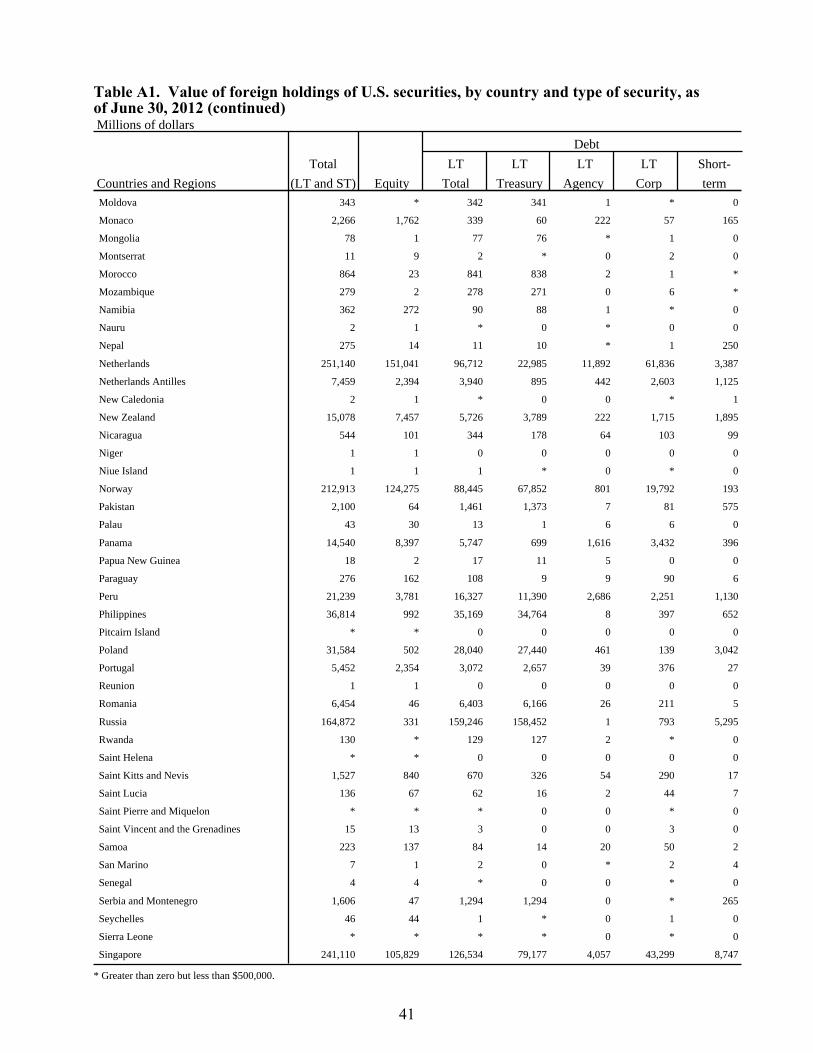
Table A1. Value of foreign holdings of U.S. securities, by country and type of security, asof June 30, 2012 (continued) Millions of dollars
Debt
Total LT LT LT LT Short-
Countries and Regions (LT and ST) Equity Total Treasury Agency Corp term Moldova 343 * 342 341 1 * 0
Monaco 2,266 1,762 339 60 222 57 165
Mongolia 78 1 77 76 * 1 0
Montserrat 11 9 2 * 0 2 0
Morocco 864 23 841 838 2 1 *
Mozambique 279 2 278 271 0 6 *
Namibia 362 272 90 88 1 * 0
Nauru 2 1 * 0 * 0 0
Nepal 275 14 11 10 * 1 250
Netherlands 251,140 151,041 96,712 22,985 11,892 61,836 3,387
Netherlands Antilles 7,459 2,394 3,940 895 442 2,603 1,125
New Caledonia 2 1 * 0 0 * 1
New Zealand 15,078 7,457 5,726 3,789 222 1,715 1,895
Nicaragua 544 101 344 178 64 103 99
Niger 1 1 0 0 0 0 0
Niue Island 1 1 1 * 0 * 0
Norway 212,913 124,275 88,445 67,852 801 19,792 193
Pakistan 2,100 64 1,461 1,373 7 81 575
Palau 43 30 13 1 6 6 0
Panama 14,540 8,397 5,747 699 1,616 3,432 396
Papua New Guinea 18 2 17 11 5 0 0
Paraguay 276 162 108 9 9 90 6
Peru 21,239 3,781 16,327 11,390 2,686 2,251 1,130
Philippines 36,814 992 35,169 34,764 8 397 652
Pitcairn Island * * 0 0 0 0 0
Poland 31,584 502 28,040 27,440 461 139 3,042
Portugal 5,452 2,354 3,072 2,657 39 376 27
Reunion 1 1 0 0 0 0 0
Romania 6,454 46 6,403 6,166 26 211 5
Russia 164,872 331 159,246 158,452 1 793 5,295
Rwanda 130 * 129 127 2 * 0
Saint Helena * * 0 0 0 0 0
Saint Kitts and Nevis 1,527 840 670 326 54 290 17
Saint Lucia 136 67 62 16 2 44 7
Saint Pierre and Miquelon * * * 0 0 * 0
Saint Vincent and the Grenadines 15 13 3 0 0 3 0
Samoa 223 137 84 14 20 50 2
San Marino 7 1 2 0 * 2 4
Senegal 4 4 * 0 0 * 0
Serbia and Montenegro 1,606 47 1,294 1,294 0 * 265
Seychelles 46 44 1 * 0 1 0
Sierra Leone * * * * 0 * 0
Singapore 241,110 105,829 126,534 79,177 4,057 43,299 8,747
* Greater than zero but less than $500,000.
41
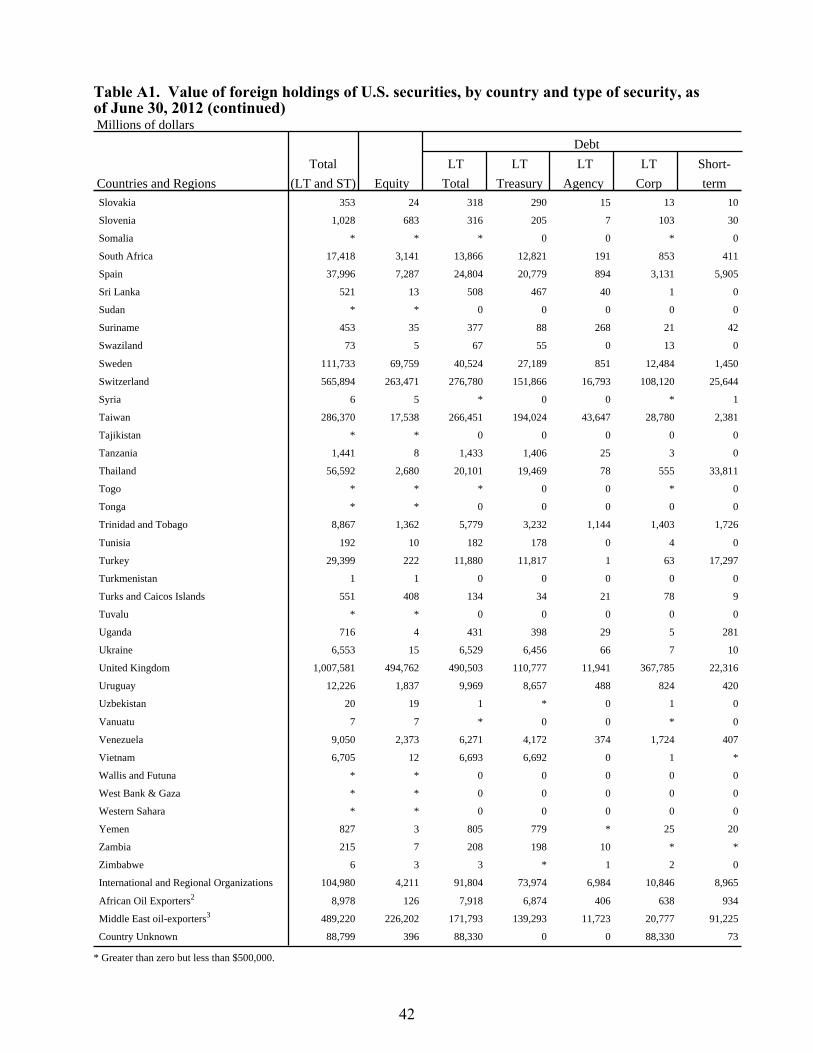
Table A1. Value of foreign holdings of U.S. securities, by country and type of security, asof June 30, 2012 (continued) Millions of dollars
Debt
Total LT LT LT LT Short-
Countries and Regions (LT and ST) Equity Total Treasury Agency Corp term Slovakia 353 24 318 290 15 13 10
Slovenia 1,028 683 316 205 7 103 30
Somalia * * * 0 0 * 0
South Africa 17,418 3,141 13,866 12,821 191 853 411
Spain 37,996 7,287 24,804 20,779 894 3,131 5,905
Sri Lanka 521 13 508 467 40 1 0
Sudan * * 0 0 0 0 0
Suriname 453 35 377 88 268 21 42
Swaziland 73 5 67 55 0 13 0
Sweden 111,733 69,759 40,524 27,189 851 12,484 1,450
Switzerland 565,894 263,471 276,780 151,866 16,793 108,120 25,644
Syria 6 5 * 0 0 * 1
Taiwan 286,370 17,538 266,451 194,024 43,647 28,780 2,381
Tajikistan * * 0 0 0 0 0
Tanzania 1,441 8 1,433 1,406 25 3 0
Thailand 56,592 2,680 20,101 19,469 78 555 33,811
Togo * * * 0 0 * 0
Tonga * * 0 0 0 0 0
Trinidad and Tobago 8,867 1,362 5,779 3,232 1,144 1,403 1,726
Tunisia 192 10 182 178 0 4 0
Turkey 29,399 222 11,880 11,817 1 63 17,297
Turkmenistan 1 1 0 0 0 0 0
Turks and Caicos Islands 551 408 134 34 21 78 9
Tuvalu * * 0 0 0 0 0
Uganda 716 4 431 398 29 5 281
Ukraine 6,553 15 6,529 6,456 66 7 10
United Kingdom 1,007,581 494,762 490,503 110,777 11,941 367,785 22,316
Uruguay 12,226 1,837 9,969 8,657 488 824 420
Uzbekistan 20 19 1 * 0 1 0
Vanuatu 7 7 * 0 0 * 0
Venezuela 9,050 2,373 6,271 4,172 374 1,724 407
Vietnam 6,705 12 6,693 6,692 0 1 *
Wallis and Futuna * * 0 0 0 0 0
West Bank & Gaza * * 0 0 0 0 0
Western Sahara * * 0 0 0 0 0
Yemen 827 3 805 779 * 25 20
Zambia 215 7 208 198 10 * *
Zimbabwe 6 3 3 * 1 2 0
International and Regional Organizations 104,980 4,211 91,804 73,974 6,984 10,846 8,965
African Oil Exporters2 8,978 126 7,918 6,874 406 638 934
Middle East oil-exporters3 489,220 226,202 171,793 139,293 11,723 20,777 91,225
Country Unknown 88,799 396 88,330 0 0 88,330 73
* Greater than zero but less than $500,000.
42
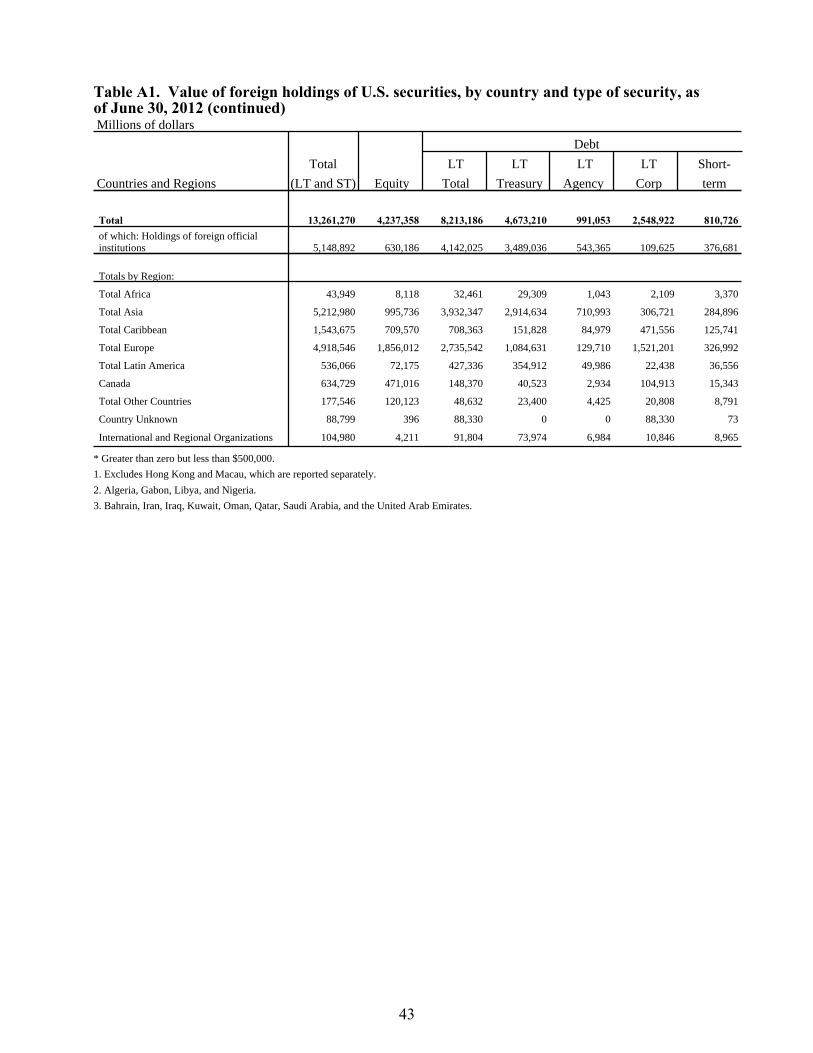
Table A1. Value of foreign holdings of U.S. securities, by country and type of security, asof June 30, 2012 (continued) Millions of dollars
Debt
Total LT LT LT LT Short-
Countries and Regions (LT and ST) Equity Total Treasury Agency Corp term
Total 13,261,270 4,237,358 8,213,186 4,673,210 991,053 2,548,922 810,726 of which: Holdings of foreign official institutions 5,148,892 630,186 4,142,025 3,489,036 543,365 109,625 376,681
Totals by Region:
Total Africa 43,949 8,118 32,461 29,309 1,043 2,109 3,370
Total Asia 5,212,980 995,736 3,932,347 2,914,634 710,993 306,721 284,896
Total Caribbean 1,543,675 709,570 708,363 151,828 84,979 471,556 125,741
Total Europe 4,918,546 1,856,012 2,735,542 1,084,631 129,710 1,521,201 326,992
Total Latin America 536,066 72,175 427,336 354,912 49,986 22,438 36,556
Canada 634,729 471,016 148,370 40,523 2,934 104,913 15,343
Total Other Countries 177,546 120,123 48,632 23,400 4,425 20,808 8,791
Country Unknown 88,799 396 88,330 0 0 88,330 73
International and Regional Organizations 104,980 4,211 91,804 73,974 6,984 10,846 8,965
* Greater than zero but less than $500,000.
1. Excludes Hong Kong and Macau, which are reported separately.
2. Algeria, Gabon, Libya, and Nigeria.
3. Bahrain, Iran, Iraq, Kuwait, Oman, Qatar, Saudi Arabia, and the United Arab Emirates.
43
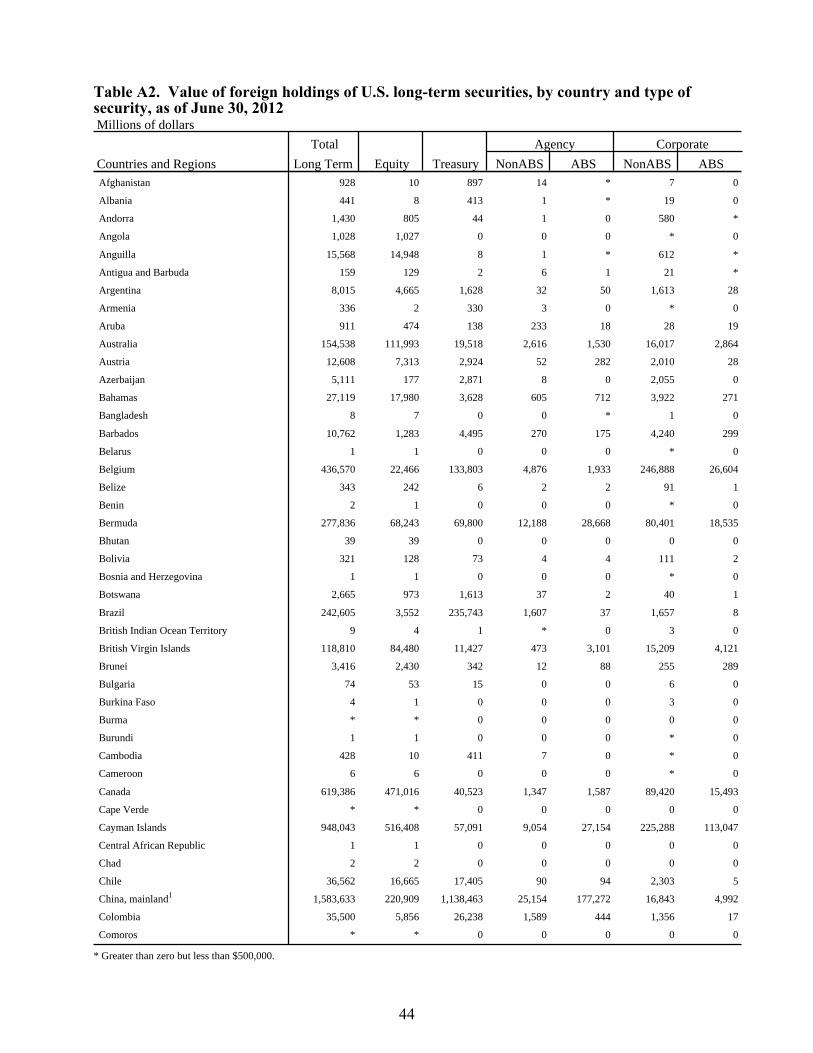
Table A2. Value of foreign holdings of U.S. long-term securities, by country and type ofsecurity, as of June 30, 2012 Millions of dollars
Total Agency Corporate
Countries and Regions Long Term Equity Treasury NonABS ABS NonABS ABS Afghanistan 928 10 897 14 * 7 0
Albania 441 8 413 1 * 19 0
Andorra 1,430 805 44 1 0 580 *
Angola 1,028 1,027 0 0 0 * 0
Anguilla 15,568 14,948 8 1 * 612 *
Antigua and Barbuda 159 129 2 6 1 21 *
Argentina 8,015 4,665 1,628 32 50 1,613 28
Armenia 336 2 330 3 0 * 0
Aruba 911 474 138 233 18 28 19
Australia 154,538 111,993 19,518 2,616 1,530 16,017 2,864
Austria 12,608 7,313 2,924 52 282 2,010 28
Azerbaijan 5,111 177 2,871 8 0 2,055 0
Bahamas 27,119 17,980 3,628 605 712 3,922 271
Bangladesh 8 7 0 0 * 1 0
Barbados 10,762 1,283 4,495 270 175 4,240 299
Belarus 1 1 0 0 0 * 0
Belgium 436,570 22,466 133,803 4,876 1,933 246,888 26,604
Belize 343 242 6 2 2 91 1
Benin 2 1 0 0 0 * 0
Bermuda 277,836 68,243 69,800 12,188 28,668 80,401 18,535
Bhutan 39 39 0 0 0 0 0
Bolivia 321 128 73 4 4 111 2
Bosnia and Herzegovina 1 1 0 0 0 * 0
Botswana 2,665 973 1,613 37 2 40 1
Brazil 242,605 3,552 235,743 1,607 37 1,657 8
British Indian Ocean Territory 9 4 1 * 0 3 0
British Virgin Islands 118,810 84,480 11,427 473 3,101 15,209 4,121
Brunei 3,416 2,430 342 12 88 255 289
Bulgaria 74 53 15 0 0 6 0
Burkina Faso 4 1 0 0 0 3 0
Burma * * 0 0 0 0 0
Burundi 1 1 0 0 0 * 0
Cambodia 428 10 411 7 0 * 0
Cameroon 6 6 0 0 0 * 0
Canada 619,386 471,016 40,523 1,347 1,587 89,420 15,493
Cape Verde * * 0 0 0 0 0
Cayman Islands 948,043 516,408 57,091 9,054 27,154 225,288 113,047
Central African Republic 1 1 0 0 0 0 0
Chad 2 2 0 0 0 0 0
Chile 36,562 16,665 17,405 90 94 2,303 5
China, mainland1 1,583,633 220,909 1,138,463 25,154 177,272 16,843 4,992
Colombia 35,500 5,856 26,238 1,589 444 1,356 17
Comoros * * 0 0 0 0 0
* Greater than zero but less than $500,000.
44
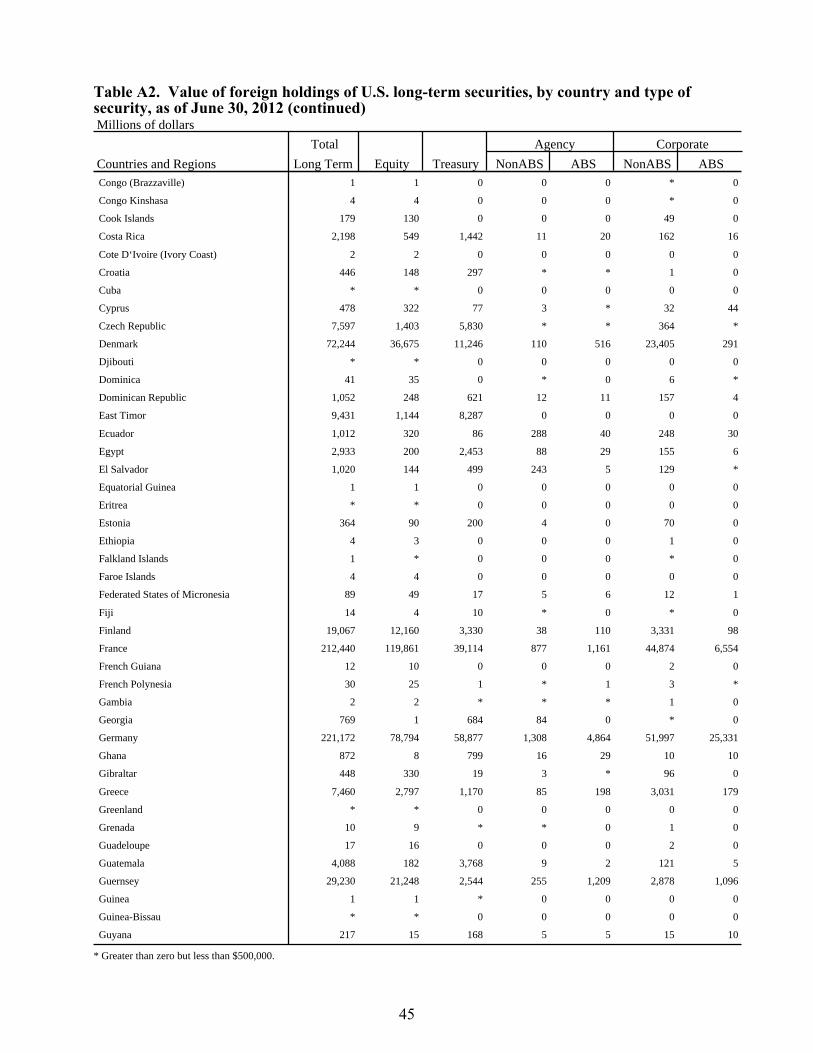
Table A2. Value of foreign holdings of U.S. long-term securities, by country and type ofsecurity, as of June 30, 2012 (continued) Millions of dollars
Total Agency Corporate
Countries and Regions Long Term Equity Treasury NonABS ABS NonABS ABS Congo (Brazzaville) 1 1 0 0 0 * 0
Congo Kinshasa 4 4 0 0 0 * 0
Cook Islands 179 130 0 0 0 49 0
Costa Rica 2,198 549 1,442 11 20 162 16
Cote D‘Ivoire (Ivory Coast) 2 2 0 0 0 0 0
Croatia 446 148 297 * * 1 0
Cuba * * 0 0 0 0 0
Cyprus 478 322 77 3 * 32 44
Czech Republic 7,597 1,403 5,830 * * 364 *
Denmark 72,244 36,675 11,246 110 516 23,405 291
Djibouti * * 0 0 0 0 0
Dominica 41 35 0 * 0 6 *
Dominican Republic 1,052 248 621 12 11 157 4
East Timor 9,431 1,144 8,287 0 0 0 0
Ecuador 1,012 320 86 288 40 248 30
Egypt 2,933 200 2,453 88 29 155 6
El Salvador 1,020 144 499 243 5 129 *
Equatorial Guinea 1 1 0 0 0 0 0
Eritrea * * 0 0 0 0 0
Estonia 364 90 200 4 0 70 0
Ethiopia 4 3 0 0 0 1 0
Falkland Islands 1 * 0 0 0 * 0
Faroe Islands 4 4 0 0 0 0 0
Federated States of Micronesia 89 49 17 5 6 12 1
Fiji 14 4 10 * 0 * 0
Finland 19,067 12,160 3,330 38 110 3,331 98
France 212,440 119,861 39,114 877 1,161 44,874 6,554
French Guiana 12 10 0 0 0 2 0
French Polynesia 30 25 1 * 1 3 *
Gambia 2 2 * * * 1 0
Georgia 769 1 684 84 0 * 0
Germany 221,172 78,794 58,877 1,308 4,864 51,997 25,331
Ghana 872 8 799 16 29 10 10
Gibraltar 448 330 19 3 * 96 0
Greece 7,460 2,797 1,170 85 198 3,031 179
Greenland * * 0 0 0 0 0
Grenada 10 9 * * 0 1 0
Guadeloupe 17 16 0 0 0 2 0
Guatemala 4,088 182 3,768 9 2 121 5
Guernsey 29,230 21,248 2,544 255 1,209 2,878 1,096
Guinea 1 1 * 0 0 0 0
Guinea-Bissau * * 0 0 0 0 0
Guyana 217 15 168 5 5 15 10
* Greater than zero but less than $500,000.
45
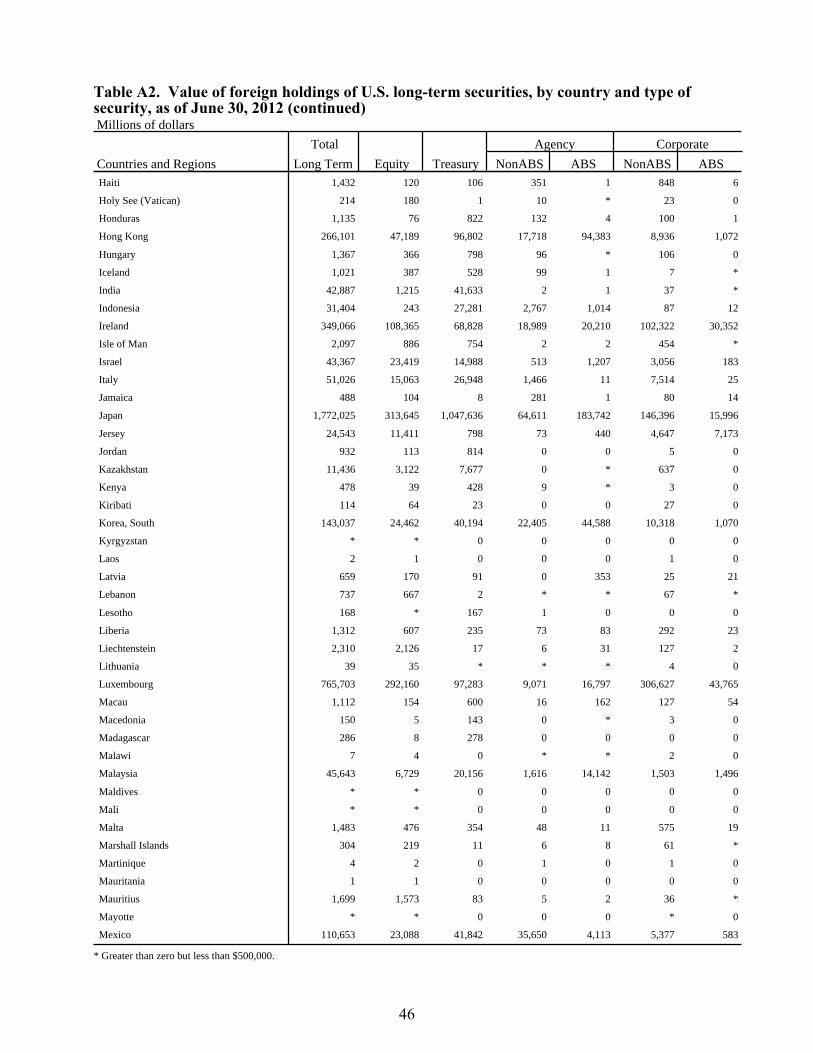
Table A2. Value of foreign holdings of U.S. long-term securities, by country and type ofsecurity, as of June 30, 2012 (continued) Millions of dollars
Total Agency Corporate
Countries and Regions Long Term Equity Treasury NonABS ABS NonABS ABS Haiti 1,432 120 106 351 1 848 6
Holy See (Vatican) 214 180 1 10 * 23 0
Honduras 1,135 76 822 132 4 100 1
Hong Kong 266,101 47,189 96,802 17,718 94,383 8,936 1,072
Hungary 1,367 366 798 96 * 106 0
Iceland 1,021 387 528 99 1 7 *
India 42,887 1,215 41,633 2 1 37 *
Indonesia 31,404 243 27,281 2,767 1,014 87 12
Ireland 349,066 108,365 68,828 18,989 20,210 102,322 30,352
Isle of Man 2,097 886 754 2 2 454 *
Israel 43,367 23,419 14,988 513 1,207 3,056 183
Italy 51,026 15,063 26,948 1,466 11 7,514 25
Jamaica 488 104 8 281 1 80 14
Japan 1,772,025 313,645 1,047,636 64,611 183,742 146,396 15,996
Jersey 24,543 11,411 798 73 440 4,647 7,173
Jordan 932 113 814 0 0 5 0
Kazakhstan 11,436 3,122 7,677 0 * 637 0
Kenya 478 39 428 9 * 3 0
Kiribati 114 64 23 0 0 27 0
Korea, South 143,037 24,462 40,194 22,405 44,588 10,318 1,070
Kyrgyzstan * * 0 0 0 0 0
Laos 2 1 0 0 0 1 0
Latvia 659 170 91 0 353 25 21
Lebanon 737 667 2 * * 67 *
Lesotho 168 * 167 1 0 0 0
Liberia 1,312 607 235 73 83 292 23
Liechtenstein 2,310 2,126 17 6 31 127 2
Lithuania 39 35 * * * 4 0
Luxembourg 765,703 292,160 97,283 9,071 16,797 306,627 43,765
Macau 1,112 154 600 16 162 127 54
Macedonia 150 5 143 0 * 3 0
Madagascar 286 8 278 0 0 0 0
Malawi 7 4 0 * * 2 0
Malaysia 45,643 6,729 20,156 1,616 14,142 1,503 1,496
Maldives * * 0 0 0 0 0
Mali * * 0 0 0 0 0
Malta 1,483 476 354 48 11 575 19
Marshall Islands 304 219 11 6 8 61 *
Martinique 4 2 0 1 0 1 0
Mauritania 1 1 0 0 0 0 0
Mauritius 1,699 1,573 83 5 2 36 *
Mayotte * * 0 0 0 * 0
Mexico 110,653 23,088 41,842 35,650 4,113 5,377 583
* Greater than zero but less than $500,000.
46
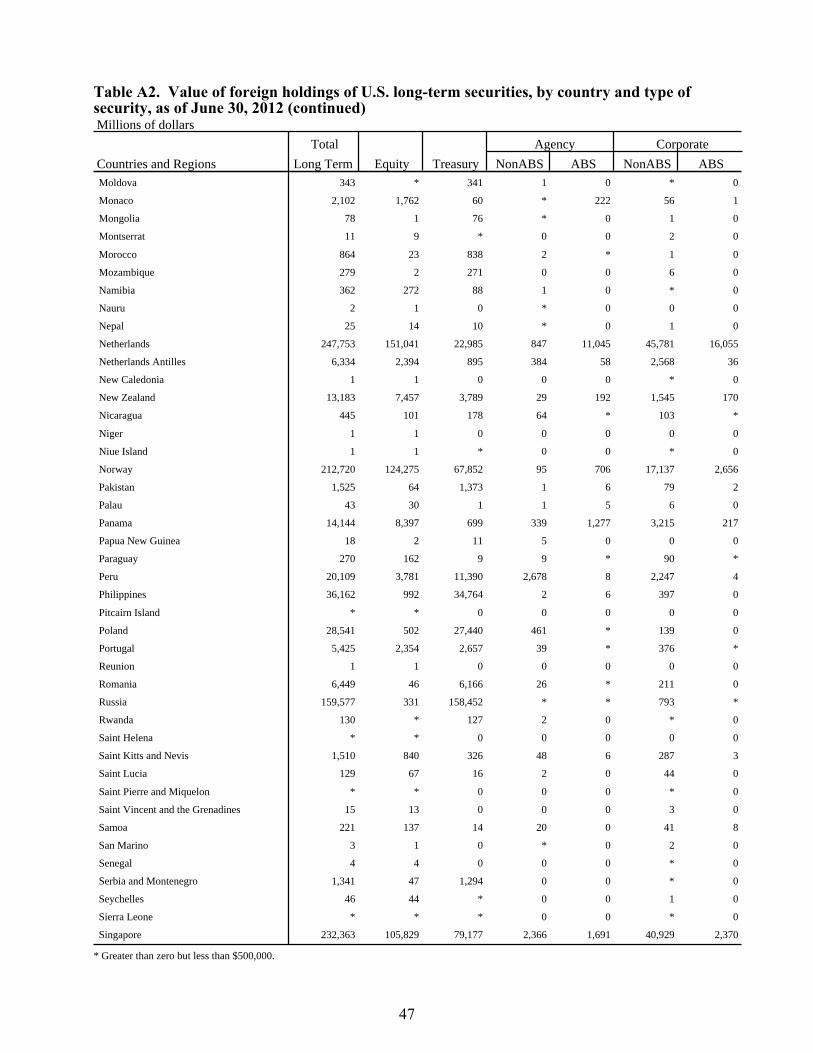
Table A2. Value of foreign holdings of U.S. long-term securities, by country and type ofsecurity, as of June 30, 2012 (continued) Millions of dollars
Total Agency Corporate
Countries and Regions Long Term Equity Treasury NonABS ABS NonABS ABS Moldova 343 * 341 1 0 * 0
Monaco 2,102 1,762 60 * 222 56 1
Mongolia 78 1 76 * 0 1 0
Montserrat 11 9 * 0 0 2 0
Morocco 864 23 838 2 * 1 0
Mozambique 279 2 271 0 0 6 0
Namibia 362 272 88 1 0 * 0
Nauru 2 1 0 * 0 0 0
Nepal 25 14 10 * 0 1 0
Netherlands 247,753 151,041 22,985 847 11,045 45,781 16,055
Netherlands Antilles 6,334 2,394 895 384 58 2,568 36
New Caledonia 1 1 0 0 0 * 0
New Zealand 13,183 7,457 3,789 29 192 1,545 170
Nicaragua 445 101 178 64 * 103 *
Niger 1 1 0 0 0 0 0
Niue Island 1 1 * 0 0 * 0
Norway 212,720 124,275 67,852 95 706 17,137 2,656
Pakistan 1,525 64 1,373 1 6 79 2
Palau 43 30 1 1 5 6 0
Panama 14,144 8,397 699 339 1,277 3,215 217
Papua New Guinea 18 2 11 5 0 0 0
Paraguay 270 162 9 9 * 90 *
Peru 20,109 3,781 11,390 2,678 8 2,247 4
Philippines 36,162 992 34,764 2 6 397 0
Pitcairn Island * * 0 0 0 0 0
Poland 28,541 502 27,440 461 * 139 0
Portugal 5,425 2,354 2,657 39 * 376 *
Reunion 1 1 0 0 0 0 0
Romania 6,449 46 6,166 26 * 211 0
Russia 159,577 331 158,452 * * 793 *
Rwanda 130 * 127 2 0 * 0
Saint Helena * * 0 0 0 0 0
Saint Kitts and Nevis 1,510 840 326 48 6 287 3
Saint Lucia 129 67 16 2 0 44 0
Saint Pierre and Miquelon * * 0 0 0 * 0
Saint Vincent and the Grenadines 15 13 0 0 0 3 0
Samoa 221 137 14 20 0 41 8
San Marino 3 1 0 * 0 2 0
Senegal 4 4 0 0 0 * 0
Serbia and Montenegro 1,341 47 1,294 0 0 * 0
Seychelles 46 44 * 0 0 1 0
Sierra Leone * * * 0 0 * 0
Singapore 232,363 105,829 79,177 2,366 1,691 40,929 2,370
* Greater than zero but less than $500,000.
47
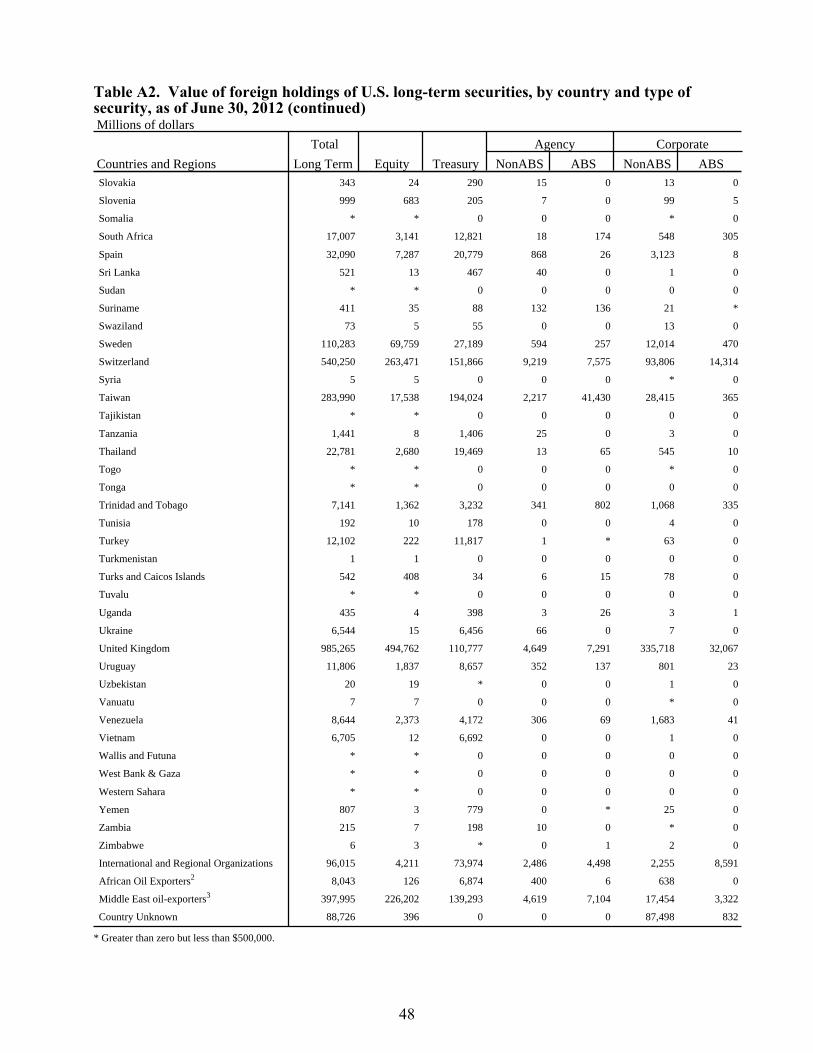
Table A2. Value of foreign holdings of U.S. long-term securities, by country and type ofsecurity, as of June 30, 2012 (continued) Millions of dollars
Total Agency Corporate
Countries and Regions Long Term Equity Treasury NonABS ABS NonABS ABS Slovakia 343 24 290 15 0 13 0
Slovenia 999 683 205 7 0 99 5
Somalia * * 0 0 0 * 0
South Africa 17,007 3,141 12,821 18 174 548 305
Spain 32,090 7,287 20,779 868 26 3,123 8
Sri Lanka 521 13 467 40 0 1 0
Sudan * * 0 0 0 0 0
Suriname 411 35 88 132 136 21 *
Swaziland 73 5 55 0 0 13 0
Sweden 110,283 69,759 27,189 594 257 12,014 470
Switzerland 540,250 263,471 151,866 9,219 7,575 93,806 14,314
Syria 5 5 0 0 0 * 0
Taiwan 283,990 17,538 194,024 2,217 41,430 28,415 365
Tajikistan * * 0 0 0 0 0
Tanzania 1,441 8 1,406 25 0 3 0
Thailand 22,781 2,680 19,469 13 65 545 10
Togo * * 0 0 0 * 0
Tonga * * 0 0 0 0 0
Trinidad and Tobago 7,141 1,362 3,232 341 802 1,068 335
Tunisia 192 10 178 0 0 4 0
Turkey 12,102 222 11,817 1 * 63 0
Turkmenistan 1 1 0 0 0 0 0
Turks and Caicos Islands 542 408 34 6 15 78 0
Tuvalu * * 0 0 0 0 0
Uganda 435 4 398 3 26 3 1
Ukraine 6,544 15 6,456 66 0 7 0
United Kingdom 985,265 494,762 110,777 4,649 7,291 335,718 32,067
Uruguay 11,806 1,837 8,657 352 137 801 23
Uzbekistan 20 19 * 0 0 1 0
Vanuatu 7 7 0 0 0 * 0
Venezuela 8,644 2,373 4,172 306 69 1,683 41
Vietnam 6,705 12 6,692 0 0 1 0
Wallis and Futuna * * 0 0 0 0 0
West Bank & Gaza * * 0 0 0 0 0
Western Sahara * * 0 0 0 0 0
Yemen 807 3 779 0 * 25 0
Zambia 215 7 198 10 0 * 0
Zimbabwe 6 3 * 0 1 2 0
International and Regional Organizations 96,015 4,211 73,974 2,486 4,498 2,255 8,591
African Oil Exporters2 8,043 126 6,874 400 6 638 0
Middle East oil-exporters3 397,995 226,202 139,293 4,619 7,104 17,454 3,322
Country Unknown 88,726 396 0 0 0 87,498 832
* Greater than zero but less than $500,000.
48
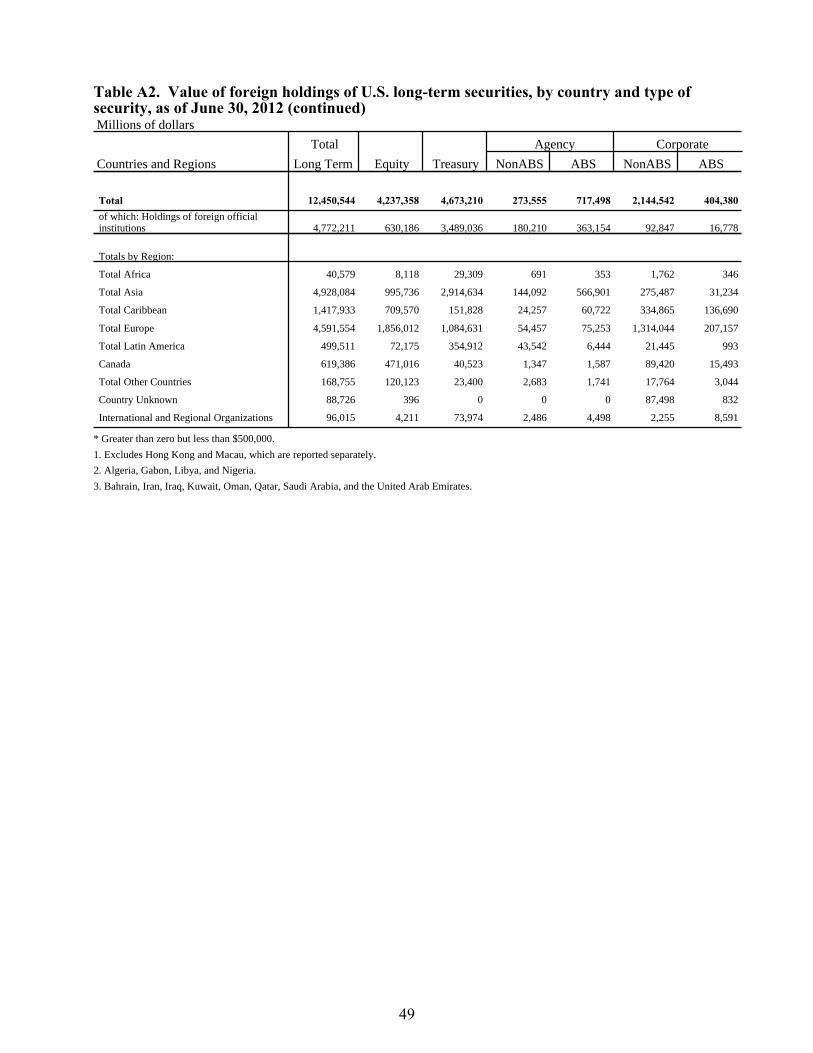
Table A2. Value of foreign holdings of U.S. long-term securities, by country and type ofsecurity, as of June 30, 2012 (continued) Millions of dollars
Total Agency Corporate
Countries and Regions Long Term Equity Treasury NonABS ABS NonABS ABS
Total 12,450,544 4,237,358 4,673,210 273,555 717,498 2,144,542 404,380 of which: Holdings of foreign official institutions 4,772,211 630,186 3,489,036 180,210 363,154 92,847 16,778
Totals by Region:
Total Africa 40,579 8,118 29,309 691 353 1,762 346
Total Asia 4,928,084 995,736 2,914,634 144,092 566,901 275,487 31,234
Total Caribbean 1,417,933 709,570 151,828 24,257 60,722 334,865 136,690
Total Europe 4,591,554 1,856,012 1,084,631 54,457 75,253 1,314,044 207,157
Total Latin America 499,511 72,175 354,912 43,542 6,444 21,445 993
Canada 619,386 471,016 40,523 1,347 1,587 89,420 15,493
Total Other Countries 168,755 120,123 23,400 2,683 1,741 17,764 3,044
Country Unknown 88,726 396 0 0 0 87,498 832
International and Regional Organizations 96,015 4,211 73,974 2,486 4,498 2,255 8,591
* Greater than zero but less than $500,000.
1. Excludes Hong Kong and Macau, which are reported separately.
2. Algeria, Gabon, Libya, and Nigeria.
3. Bahrain, Iran, Iraq, Kuwait, Oman, Qatar, Saudi Arabia, and the United Arab Emirates.
49
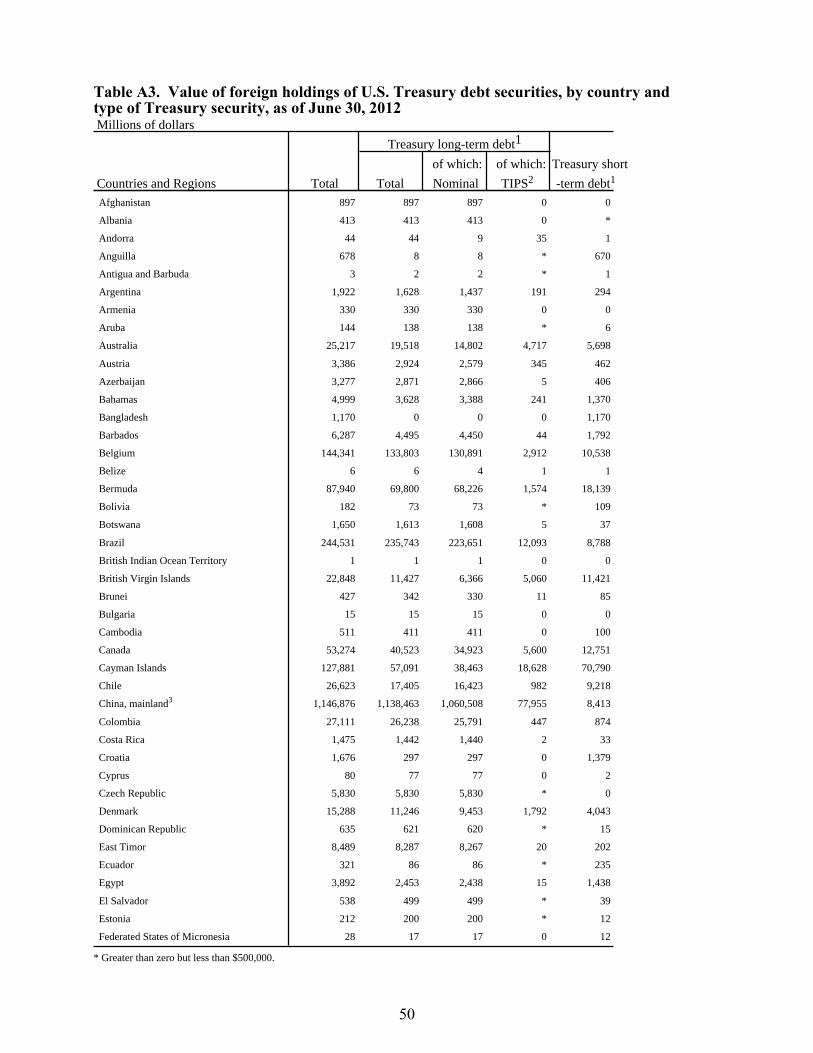
Table A3. Value of foreign holdings of U.S. Treasury debt securities, by country andtype of Treasury security, as of June 30, 2012 Millions of dollars
Treasury long-term debt1
of which: of which: Treasury short
Countries and Regions Total Total Nominal TIPS2 -term debt1
Afghanistan 897 897 897 0 0
Albania 413 413 413 0 *
Andorra 44 44 9 35 1
Anguilla 678 8 8 * 670
Antigua and Barbuda 3 2 2 * 1
Argentina 1,922 1,628 1,437 191 294
Armenia 330 330 330 0 0
Aruba 144 138 138 * 6
Australia 25,217 19,518 14,802 4,717 5,698
Austria 3,386 2,924 2,579 345 462
Azerbaijan 3,277 2,871 2,866 5 406
Bahamas 4,999 3,628 3,388 241 1,370
Bangladesh 1,170 0 0 0 1,170
Barbados 6,287 4,495 4,450 44 1,792
Belgium 144,341 133,803 130,891 2,912 10,538
Belize 6 6 4 1 1
Bermuda 87,940 69,800 68,226 1,574 18,139
Bolivia 182 73 73 * 109
Botswana 1,650 1,613 1,608 5 37
Brazil 244,531 235,743 223,651 12,093 8,788
British Indian Ocean Territory 1 1 1 0 0
British Virgin Islands 22,848 11,427 6,366 5,060 11,421
Brunei 427 342 330 11 85
Bulgaria 15 15 15 0 0
Cambodia 511 411 411 0 100
Canada 53,274 40,523 34,923 5,600 12,751
Cayman Islands 127,881 57,091 38,463 18,628 70,790
Chile 26,623 17,405 16,423 982 9,218
China, mainland3 1,146,876 1,138,463 1,060,508 77,955 8,413
Colombia 27,111 26,238 25,791 447 874
Costa Rica 1,475 1,442 1,440 2 33
Croatia 1,676 297 297 0 1,379
Cyprus 80 77 77 0 2
Czech Republic 5,830 5,830 5,830 * 0
Denmark 15,288 11,246 9,453 1,792 4,043
Dominican Republic 635 621 620 * 15
East Timor 8,489 8,287 8,267 20 202
Ecuador 321 86 86 * 235
Egypt 3,892 2,453 2,438 15 1,438
El Salvador 538 499 499 * 39
Estonia 212 200 200 * 12
Federated States of Micronesia 28 17 17 0 12
* Greater than zero but less than $500,000.
50
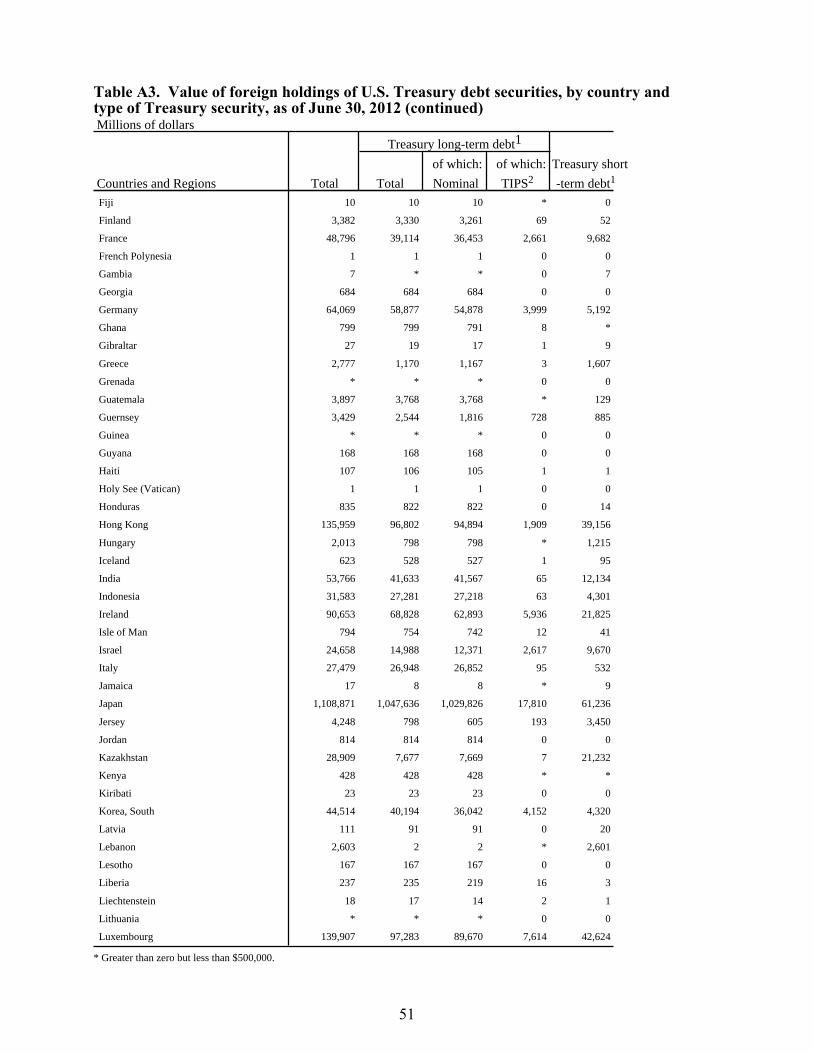
Table A3. Value of foreign holdings of U.S. Treasury debt securities, by country andtype of Treasury security, as of June 30, 2012 (continued) Millions of dollars
Treasury long-term debt1
of which: of which: Treasury short
Countries and Regions Total Total Nominal TIPS2 -term debt1
Fiji 10 10 10 * 0
Finland 3,382 3,330 3,261 69 52
France 48,796 39,114 36,453 2,661 9,682
French Polynesia 1 1 1 0 0
Gambia 7 * * 0 7
Georgia 684 684 684 0 0
Germany 64,069 58,877 54,878 3,999 5,192
Ghana 799 799 791 8 *
Gibraltar 27 19 17 1 9
Greece 2,777 1,170 1,167 3 1,607
Grenada * * * 0 0
Guatemala 3,897 3,768 3,768 * 129
Guernsey 3,429 2,544 1,816 728 885
Guinea * * * 0 0
Guyana 168 168 168 0 0
Haiti 107 106 105 1 1
Holy See (Vatican) 1 1 1 0 0
Honduras 835 822 822 0 14
Hong Kong 135,959 96,802 94,894 1,909 39,156
Hungary 2,013 798 798 * 1,215
Iceland 623 528 527 1 95
India 53,766 41,633 41,567 65 12,134
Indonesia 31,583 27,281 27,218 63 4,301
Ireland 90,653 68,828 62,893 5,936 21,825
Isle of Man 794 754 742 12 41
Israel 24,658 14,988 12,371 2,617 9,670
Italy 27,479 26,948 26,852 95 532
Jamaica 17 8 8 * 9
Japan 1,108,871 1,047,636 1,029,826 17,810 61,236
Jersey 4,248 798 605 193 3,450
Jordan 814 814 814 0 0
Kazakhstan 28,909 7,677 7,669 7 21,232
Kenya 428 428 428 * *
Kiribati 23 23 23 0 0
Korea, South 44,514 40,194 36,042 4,152 4,320
Latvia 111 91 91 0 20
Lebanon 2,603 2 2 * 2,601
Lesotho 167 167 167 0 0
Liberia 237 235 219 16 3
Liechtenstein 18 17 14 2 1
Lithuania * * * 0 0
Luxembourg 139,907 97,283 89,670 7,614 42,624
* Greater than zero but less than $500,000.
51
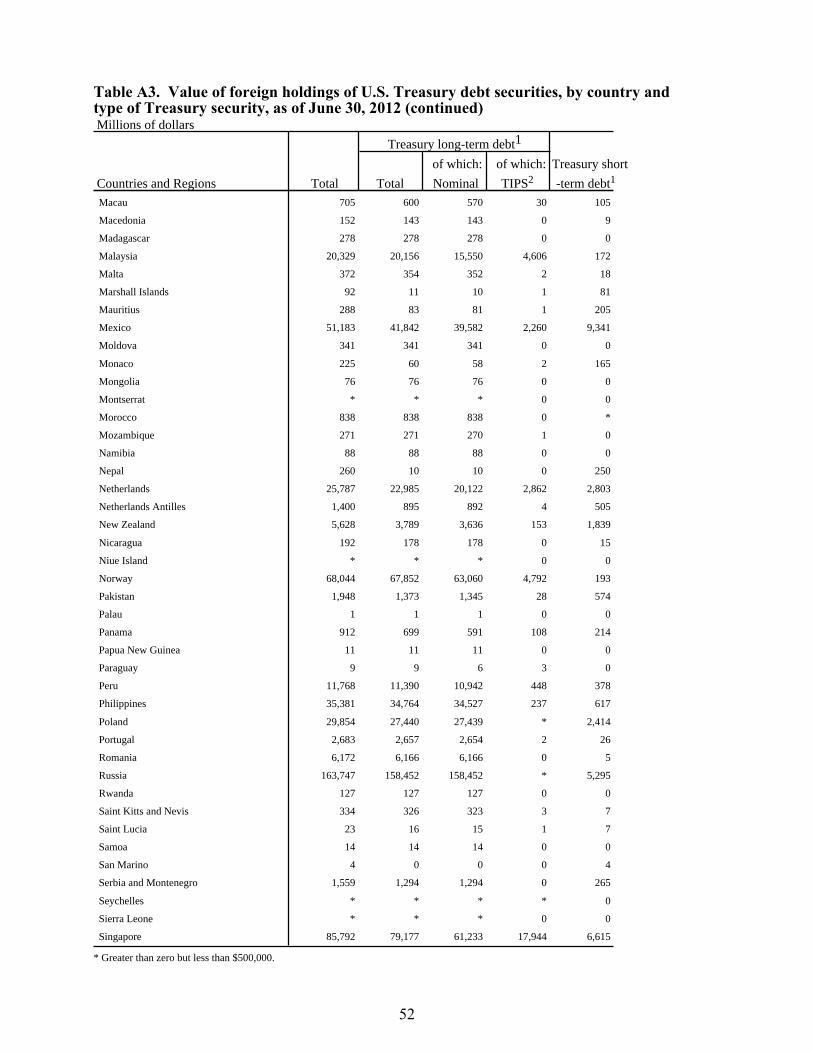
Table A3. Value of foreign holdings of U.S. Treasury debt securities, by country andtype of Treasury security, as of June 30, 2012 (continued) Millions of dollars
Treasury long-term debt1
of which: of which: Treasury short
Countries and Regions Total Total Nominal TIPS2 -term debt1
Macau 705 600 570 30 105
Macedonia 152 143 143 0 9
Madagascar 278 278 278 0 0
Malaysia 20,329 20,156 15,550 4,606 172
Malta 372 354 352 2 18
Marshall Islands 92 11 10 1 81
Mauritius 288 83 81 1 205
Mexico 51,183 41,842 39,582 2,260 9,341
Moldova 341 341 341 0 0
Monaco 225 60 58 2 165
Mongolia 76 76 76 0 0
Montserrat * * * 0 0
Morocco 838 838 838 0 *
Mozambique 271 271 270 1 0
Namibia 88 88 88 0 0
Nepal 260 10 10 0 250
Netherlands 25,787 22,985 20,122 2,862 2,803
Netherlands Antilles 1,400 895 892 4 505
New Zealand 5,628 3,789 3,636 153 1,839
Nicaragua 192 178 178 0 15
Niue Island * * * 0 0
Norway 68,044 67,852 63,060 4,792 193
Pakistan 1,948 1,373 1,345 28 574
Palau 1 1 1 0 0
Panama 912 699 591 108 214
Papua New Guinea 11 11 11 0 0
Paraguay 9 9 6 3 0
Peru 11,768 11,390 10,942 448 378
Philippines 35,381 34,764 34,527 237 617
Poland 29,854 27,440 27,439 * 2,414
Portugal 2,683 2,657 2,654 2 26
Romania 6,172 6,166 6,166 0 5
Russia 163,747 158,452 158,452 * 5,295
Rwanda 127 127 127 0 0
Saint Kitts and Nevis 334 326 323 3 7
Saint Lucia 23 16 15 1 7
Samoa 14 14 14 0 0
San Marino 4 0 0 0 4
Serbia and Montenegro 1,559 1,294 1,294 0 265
Seychelles * * * * 0
Sierra Leone * * * 0 0
Singapore 85,792 79,177 61,233 17,944 6,615
* Greater than zero but less than $500,000.
52
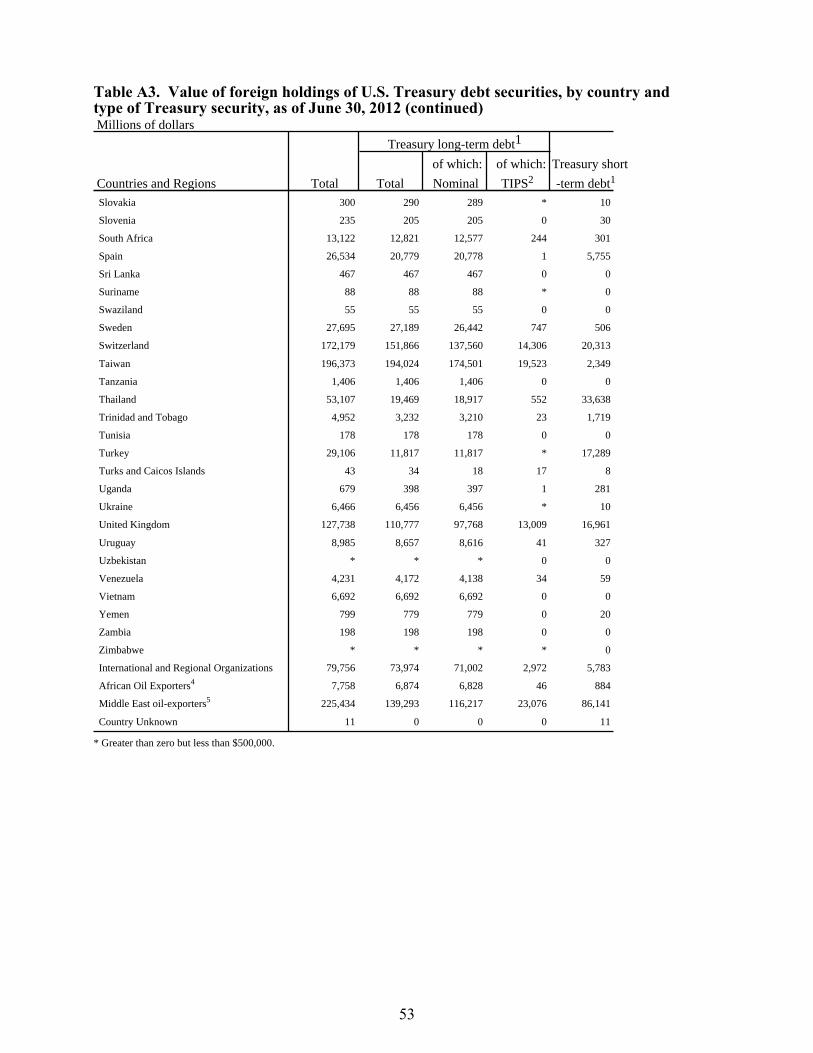
Table A3. Value of foreign holdings of U.S. Treasury debt securities, by country andtype of Treasury security, as of June 30, 2012 (continued) Millions of dollars
Treasury long-term debt1
of which: of which: Treasury short
Countries and Regions Total Total Nominal TIPS2 -term debt1
Slovakia 300 290 289 * 10
Slovenia 235 205 205 0 30
South Africa 13,122 12,821 12,577 244 301
Spain 26,534 20,779 20,778 1 5,755
Sri Lanka 467 467 467 0 0
Suriname 88 88 88 * 0
Swaziland 55 55 55 0 0
Sweden 27,695 27,189 26,442 747 506
Switzerland 172,179 151,866 137,560 14,306 20,313
Taiwan 196,373 194,024 174,501 19,523 2,349
Tanzania 1,406 1,406 1,406 0 0
Thailand 53,107 19,469 18,917 552 33,638
Trinidad and Tobago 4,952 3,232 3,210 23 1,719
Tunisia 178 178 178 0 0
Turkey 29,106 11,817 11,817 * 17,289
Turks and Caicos Islands 43 34 18 17 8
Uganda 679 398 397 1 281
Ukraine 6,466 6,456 6,456 * 10
United Kingdom 127,738 110,777 97,768 13,009 16,961
Uruguay 8,985 8,657 8,616 41 327
Uzbekistan * * * 0 0
Venezuela 4,231 4,172 4,138 34 59
Vietnam 6,692 6,692 6,692 0 0
Yemen 799 779 779 0 20
Zambia 198 198 198 0 0
Zimbabwe * * * * 0
International and Regional Organizations 79,756 73,974 71,002 2,972 5,783
African Oil Exporters4 7,758 6,874 6,828 46 884
Middle East oil-exporters5 225,434 139,293 116,217 23,076 86,141
Country Unknown 11 0 0 0 11
* Greater than zero but less than $500,000.
53
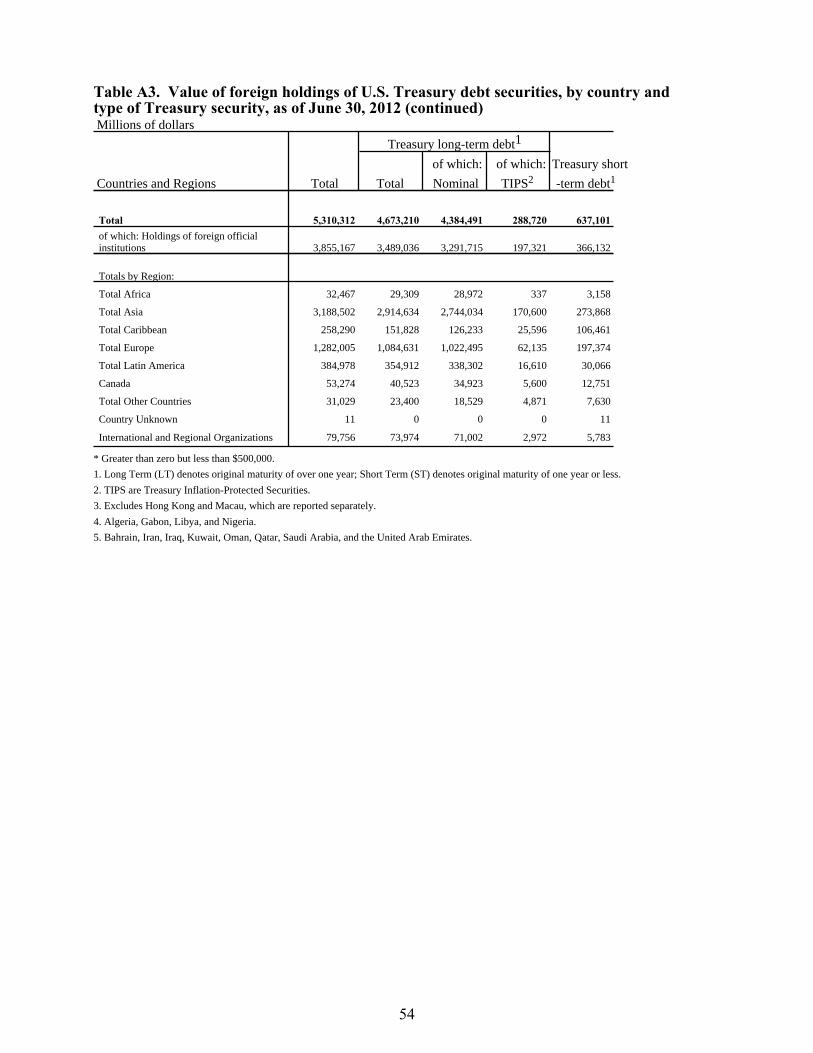
Table A3. Value of foreign holdings of U.S. Treasury debt securities, by country andtype of Treasury security, as of June 30, 2012 (continued) Millions of dollars
Treasury long-term debt1
of which: of which: Treasury short
Countries and Regions Total Total Nominal TIPS2 -term debt1
Total 5,310,312 4,673,210 4,384,491 288,720 637,101 of which: Holdings of foreign official institutions 3,855,167 3,489,036 3,291,715 197,321 366,132
Totals by Region:
Total Africa 32,467 29,309 28,972 337 3,158
Total Asia 3,188,502 2,914,634 2,744,034 170,600 273,868
Total Caribbean 258,290 151,828 126,233 25,596 106,461
Total Europe 1,282,005 1,084,631 1,022,495 62,135 197,374
Total Latin America 384,978 354,912 338,302 16,610 30,066
Canada 53,274 40,523 34,923 5,600 12,751
Total Other Countries 31,029 23,400 18,529 4,871 7,630
Country Unknown 11 0 0 0 11
International and Regional Organizations 79,756 73,974 71,002 2,972 5,783
* Greater than zero but less than $500,000.
1. Long Term (LT) denotes original maturity of over one year; Short Term (ST) denotes original maturity of one year or less.
2. TIPS are Treasury Inflation-Protected Securities.
3. Excludes Hong Kong and Macau, which are reported separately.
4. Algeria, Gabon, Libya, and Nigeria.
5. Bahrain, Iran, Iraq, Kuwait, Oman, Qatar, Saudi Arabia, and the United Arab Emirates.
54
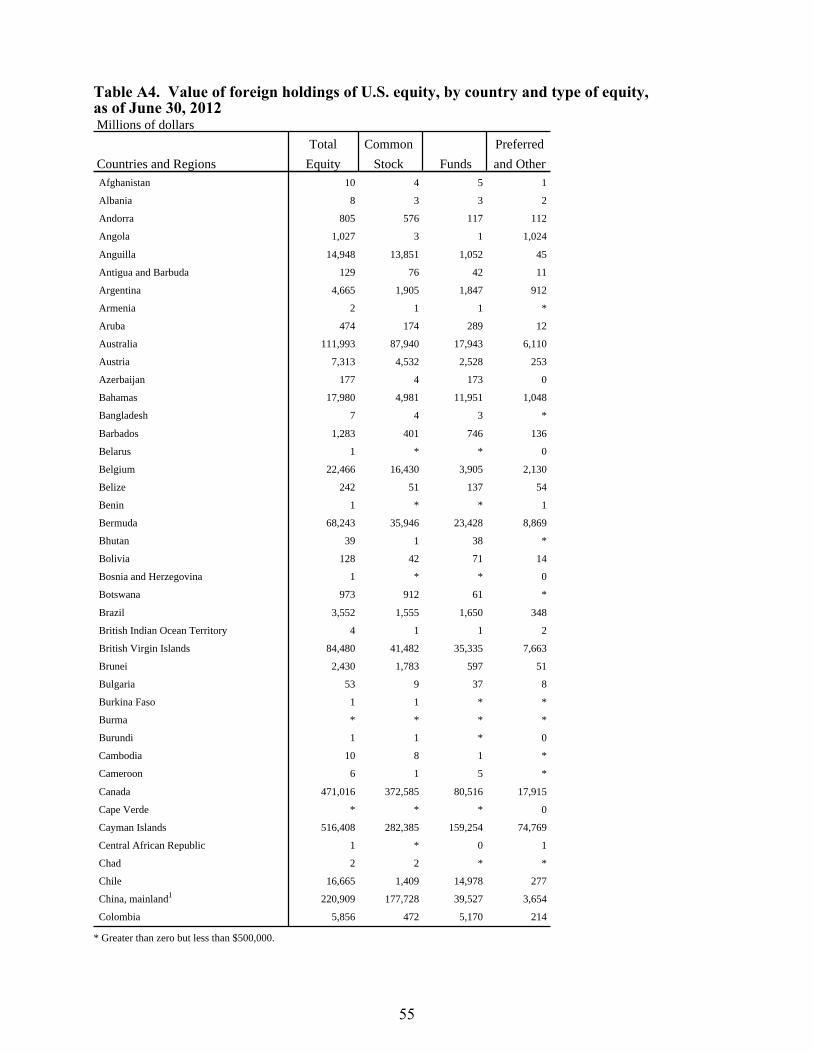
Table A4. Value of foreign holdings of U.S. equity, by country and type of equity,as of June 30, 2012 Millions of dollars
Total Common Preferred
Countries and Regions Equity Stock Funds and Other Afghanistan 10 4 5 1
Albania 8 3 3 2
Andorra 805 576 117 112
Angola 1,027 3 1 1,024
Anguilla 14,948 13,851 1,052 45
Antigua and Barbuda 129 76 42 11
Argentina 4,665 1,905 1,847 912
Armenia 2 1 1 *
Aruba 474 174 289 12
Australia 111,993 87,940 17,943 6,110
Austria 7,313 4,532 2,528 253
Azerbaijan 177 4 173 0
Bahamas 17,980 4,981 11,951 1,048
Bangladesh 7 4 3 *
Barbados 1,283 401 746 136
Belarus 1 * * 0
Belgium 22,466 16,430 3,905 2,130
Belize 242 51 137 54
Benin 1 * * 1
Bermuda 68,243 35,946 23,428 8,869
Bhutan 39 1 38 *
Bolivia 128 42 71 14
Bosnia and Herzegovina 1 * * 0
Botswana 973 912 61 *
Brazil 3,552 1,555 1,650 348
British Indian Ocean Territory 4 1 1 2
British Virgin Islands 84,480 41,482 35,335 7,663
Brunei 2,430 1,783 597 51
Bulgaria 53 9 37 8
Burkina Faso 1 1 * *
Burma * * * *
Burundi 1 1 * 0
Cambodia 10 8 1 *
Cameroon 6 1 5 *
Canada 471,016 372,585 80,516 17,915
Cape Verde * * * 0
Cayman Islands 516,408 282,385 159,254 74,769
Central African Republic 1 * 0 1
Chad 2 2 * *
Chile 16,665 1,409 14,978 277
China, mainland1 220,909 177,728 39,527 3,654
Colombia 5,856 472 5,170 214
* Greater than zero but less than $500,000.
55
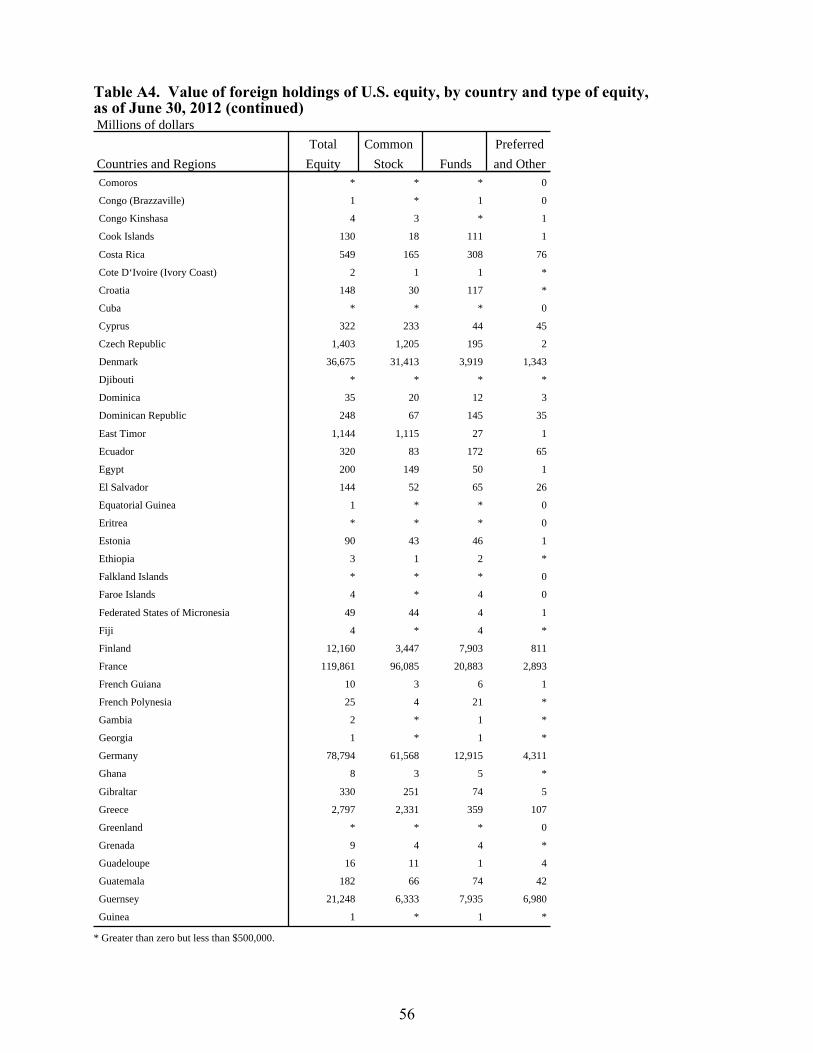
Table A4. Value of foreign holdings of U.S. equity, by country and type of equity,as of June 30, 2012 (continued) Millions of dollars
Total Common Preferred
Countries and Regions Equity Stock Funds and Other Comoros * * * 0
Congo (Brazzaville) 1 * 1 0
Congo Kinshasa 4 3 * 1
Cook Islands 130 18 111 1
Costa Rica 549 165 308 76
Cote D‘Ivoire (Ivory Coast) 2 1 1 *
Croatia 148 30 117 *
Cuba * * * 0
Cyprus 322 233 44 45
Czech Republic 1,403 1,205 195 2
Denmark 36,675 31,413 3,919 1,343
Djibouti * * * *
Dominica 35 20 12 3
Dominican Republic 248 67 145 35
East Timor 1,144 1,115 27 1
Ecuador 320 83 172 65
Egypt 200 149 50 1
El Salvador 144 52 65 26
Equatorial Guinea 1 * * 0
Eritrea * * * 0
Estonia 90 43 46 1
Ethiopia 3 1 2 *
Falkland Islands * * * 0
Faroe Islands 4 * 4 0
Federated States of Micronesia 49 44 4 1
Fiji 4 * 4 *
Finland 12,160 3,447 7,903 811
France 119,861 96,085 20,883 2,893
French Guiana 10 3 6 1
French Polynesia 25 4 21 *
Gambia 2 * 1 *
Georgia 1 * 1 *
Germany 78,794 61,568 12,915 4,311
Ghana 8 3 5 *
Gibraltar 330 251 74 5
Greece 2,797 2,331 359 107
Greenland * * * 0
Grenada 9 4 4 *
Guadeloupe 16 11 1 4
Guatemala 182 66 74 42
Guernsey 21,248 6,333 7,935 6,980
Guinea 1 * 1 *
* Greater than zero but less than $500,000.
56
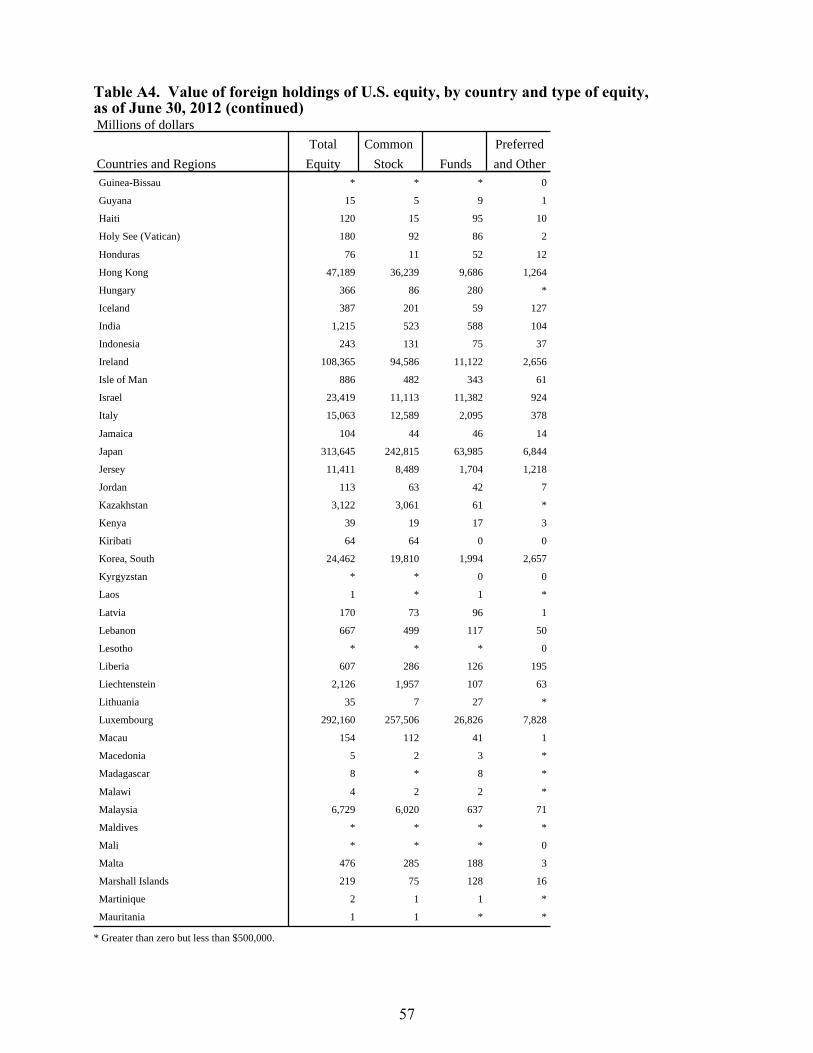
Table A4. Value of foreign holdings of U.S. equity, by country and type of equity,as of June 30, 2012 (continued) Millions of dollars
Total Common Preferred
Countries and Regions Equity Stock Funds and Other Guinea-Bissau * * * 0
Guyana 15 5 9 1
Haiti 120 15 95 10
Holy See (Vatican) 180 92 86 2
Honduras 76 11 52 12
Hong Kong 47,189 36,239 9,686 1,264
Hungary 366 86 280 *
Iceland 387 201 59 127
India 1,215 523 588 104
Indonesia 243 131 75 37
Ireland 108,365 94,586 11,122 2,656
Isle of Man 886 482 343 61
Israel 23,419 11,113 11,382 924
Italy 15,063 12,589 2,095 378
Jamaica 104 44 46 14
Japan 313,645 242,815 63,985 6,844
Jersey 11,411 8,489 1,704 1,218
Jordan 113 63 42 7
Kazakhstan 3,122 3,061 61 *
Kenya 39 19 17 3
Kiribati 64 64 0 0
Korea, South 24,462 19,810 1,994 2,657
Kyrgyzstan * * 0 0
Laos 1 * 1 *
Latvia 170 73 96 1
Lebanon 667 499 117 50
Lesotho * * * 0
Liberia 607 286 126 195
Liechtenstein 2,126 1,957 107 63
Lithuania 35 7 27 *
Luxembourg 292,160 257,506 26,826 7,828
Macau 154 112 41 1
Macedonia 5 2 3 *
Madagascar 8 * 8 *
Malawi 4 2 2 *
Malaysia 6,729 6,020 637 71
Maldives * * * *
Mali * * * 0
Malta 476 285 188 3
Marshall Islands 219 75 128 16
Martinique 2 1 1 *
Mauritania 1 1 * *
* Greater than zero but less than $500,000.
57
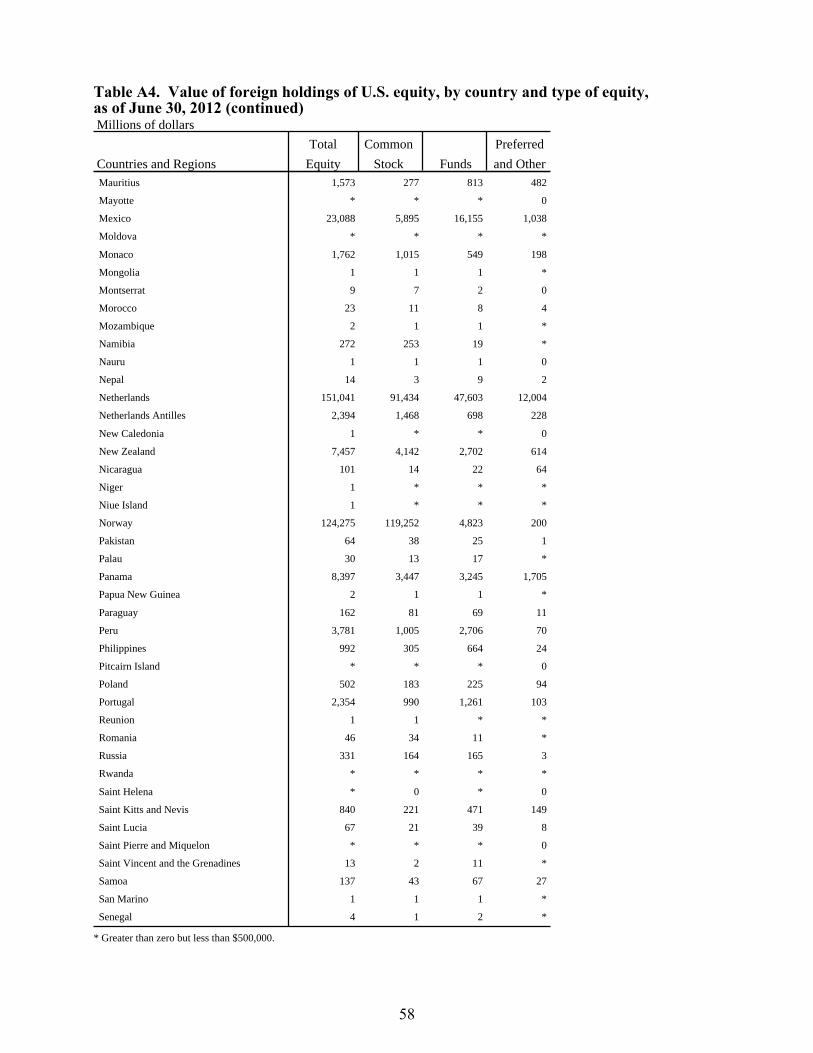
Table A4. Value of foreign holdings of U.S. equity, by country and type of equity,as of June 30, 2012 (continued) Millions of dollars
Total Common Preferred
Countries and Regions Equity Stock Funds and Other Mauritius 1,573 277 813 482
Mayotte * * * 0
Mexico 23,088 5,895 16,155 1,038
Moldova * * * *
Monaco 1,762 1,015 549 198
Mongolia 1 1 1 *
Montserrat 9 7 2 0
Morocco 23 11 8 4
Mozambique 2 1 1 *
Namibia 272 253 19 *
Nauru 1 1 1 0
Nepal 14 3 9 2
Netherlands 151,041 91,434 47,603 12,004
Netherlands Antilles 2,394 1,468 698 228
New Caledonia 1 * * 0
New Zealand 7,457 4,142 2,702 614
Nicaragua 101 14 22 64
Niger 1 * * *
Niue Island 1 * * *
Norway 124,275 119,252 4,823 200
Pakistan 64 38 25 1
Palau 30 13 17 *
Panama 8,397 3,447 3,245 1,705
Papua New Guinea 2 1 1 *
Paraguay 162 81 69 11
Peru 3,781 1,005 2,706 70
Philippines 992 305 664 24
Pitcairn Island * * * 0
Poland 502 183 225 94
Portugal 2,354 990 1,261 103
Reunion 1 1 * *
Romania 46 34 11 *
Russia 331 164 165 3
Rwanda * * * *
Saint Helena * 0 * 0
Saint Kitts and Nevis 840 221 471 149
Saint Lucia 67 21 39 8
Saint Pierre and Miquelon * * * 0
Saint Vincent and the Grenadines 13 2 11 *
Samoa 137 43 67 27
San Marino 1 1 1 *
Senegal 4 1 2 *
* Greater than zero but less than $500,000.
58
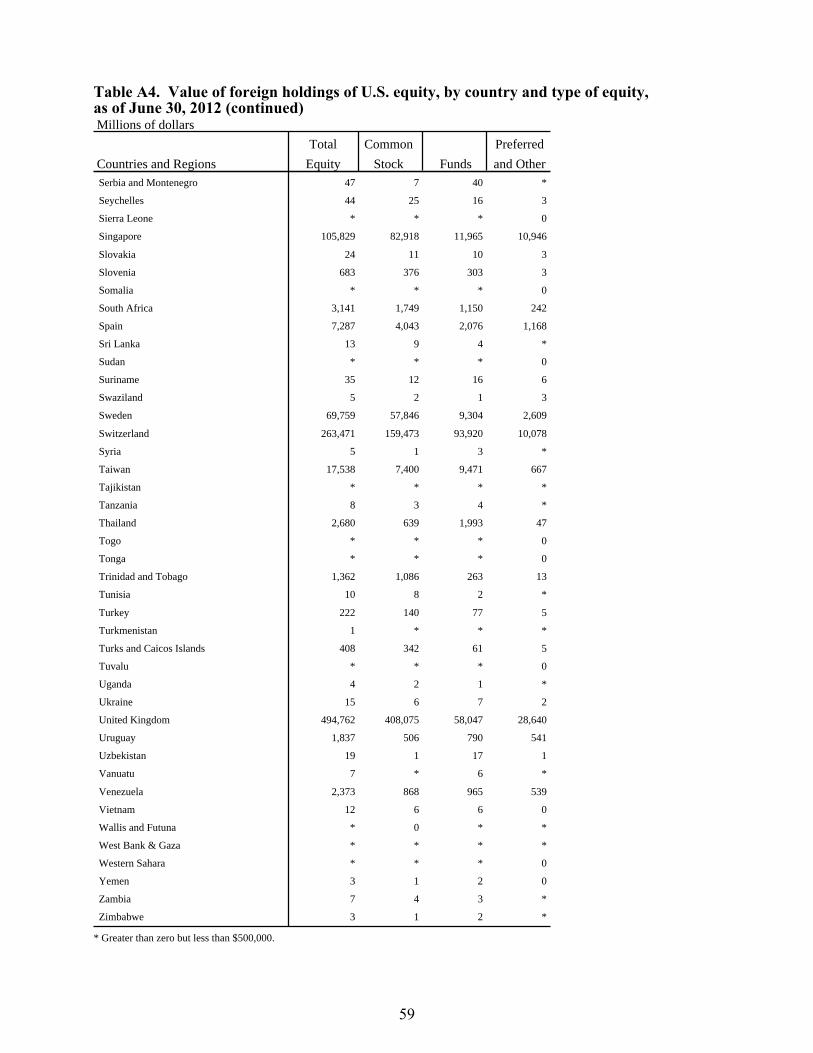
Table A4. Value of foreign holdings of U.S. equity, by country and type of equity,as of June 30, 2012 (continued) Millions of dollars
Total Common Preferred
Countries and Regions Equity Stock Funds and Other Serbia and Montenegro 47 7 40 *
Seychelles 44 25 16 3
Sierra Leone * * * 0
Singapore 105,829 82,918 11,965 10,946
Slovakia 24 11 10 3
Slovenia 683 376 303 3
Somalia * * * 0
South Africa 3,141 1,749 1,150 242
Spain 7,287 4,043 2,076 1,168
Sri Lanka 13 9 4 *
Sudan * * * 0
Suriname 35 12 16 6
Swaziland 5 2 1 3
Sweden 69,759 57,846 9,304 2,609
Switzerland 263,471 159,473 93,920 10,078
Syria 5 1 3 *
Taiwan 17,538 7,400 9,471 667
Tajikistan * * * *
Tanzania 8 3 4 *
Thailand 2,680 639 1,993 47
Togo * * * 0
Tonga * * * 0
Trinidad and Tobago 1,362 1,086 263 13
Tunisia 10 8 2 *
Turkey 222 140 77 5
Turkmenistan 1 * * *
Turks and Caicos Islands 408 342 61 5
Tuvalu * * * 0
Uganda 4 2 1 *
Ukraine 15 6 7 2
United Kingdom 494,762 408,075 58,047 28,640
Uruguay 1,837 506 790 541
Uzbekistan 19 1 17 1
Vanuatu 7 * 6 *
Venezuela 2,373 868 965 539
Vietnam 12 6 6 0
Wallis and Futuna * 0 * *
West Bank & Gaza * * * *
Western Sahara * * * 0
Yemen 3 1 2 0
Zambia 7 4 3 *
Zimbabwe 3 1 2 *
* Greater than zero but less than $500,000.
59
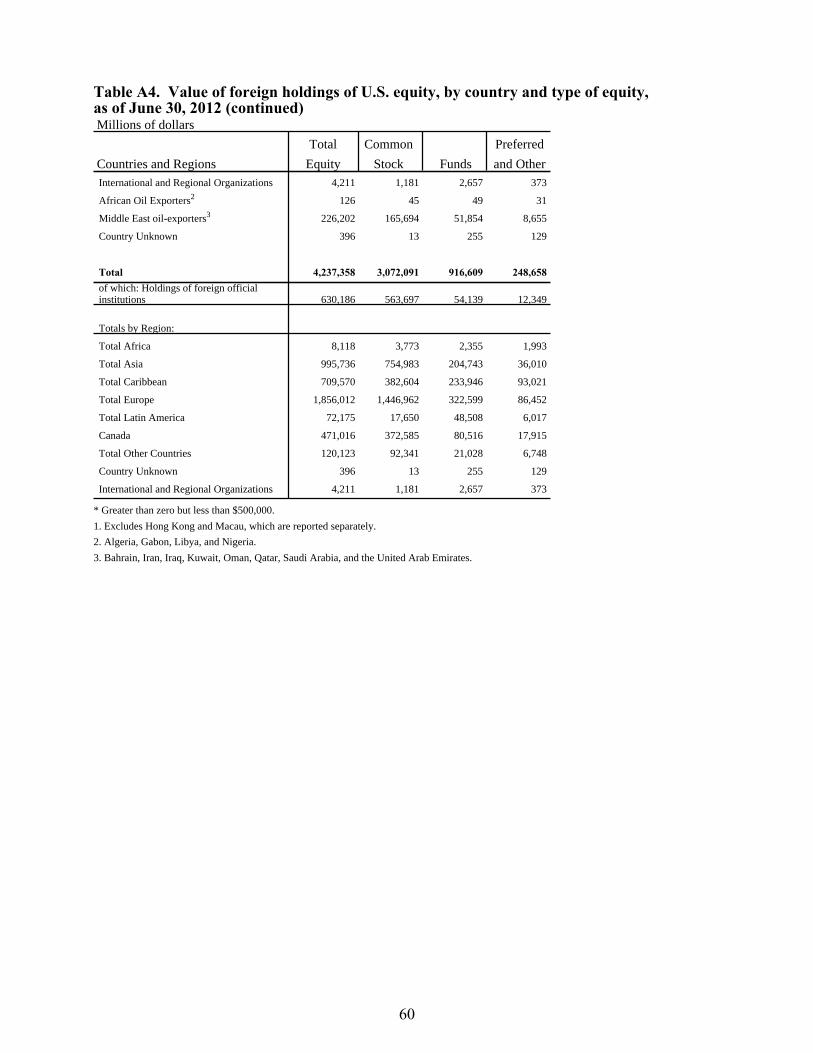
Table A4. Value of foreign holdings of U.S. equity, by country and type of equity,as of June 30, 2012 (continued) Millions of dollars
Total Common Preferred
Countries and Regions Equity Stock Funds and Other International and Regional Organizations 4,211 1,181 2,657 373
African Oil Exporters2 126 45 49 31
Middle East oil-exporters3 226,202 165,694 51,854 8,655
Country Unknown 396 13 255 129
Total 4,237,358 3,072,091 916,609 248,658 of which: Holdings of foreign official institutions 630,186 563,697 54,139 12,349
Totals by Region:
Total Africa 8,118 3,773 2,355 1,993
Total Asia 995,736 754,983 204,743 36,010
Total Caribbean 709,570 382,604 233,946 93,021
Total Europe 1,856,012 1,446,962 322,599 86,452
Total Latin America 72,175 17,650 48,508 6,017
Canada 471,016 372,585 80,516 17,915
Total Other Countries 120,123 92,341 21,028 6,748
Country Unknown 396 13 255 129
International and Regional Organizations 4,211 1,181 2,657 373
* Greater than zero but less than $500,000.
1. Excludes Hong Kong and Macau, which are reported separately.
2. Algeria, Gabon, Libya, and Nigeria.
3. Bahrain, Iran, Iraq, Kuwait, Oman, Qatar, Saudi Arabia, and the United Arab Emirates.
60
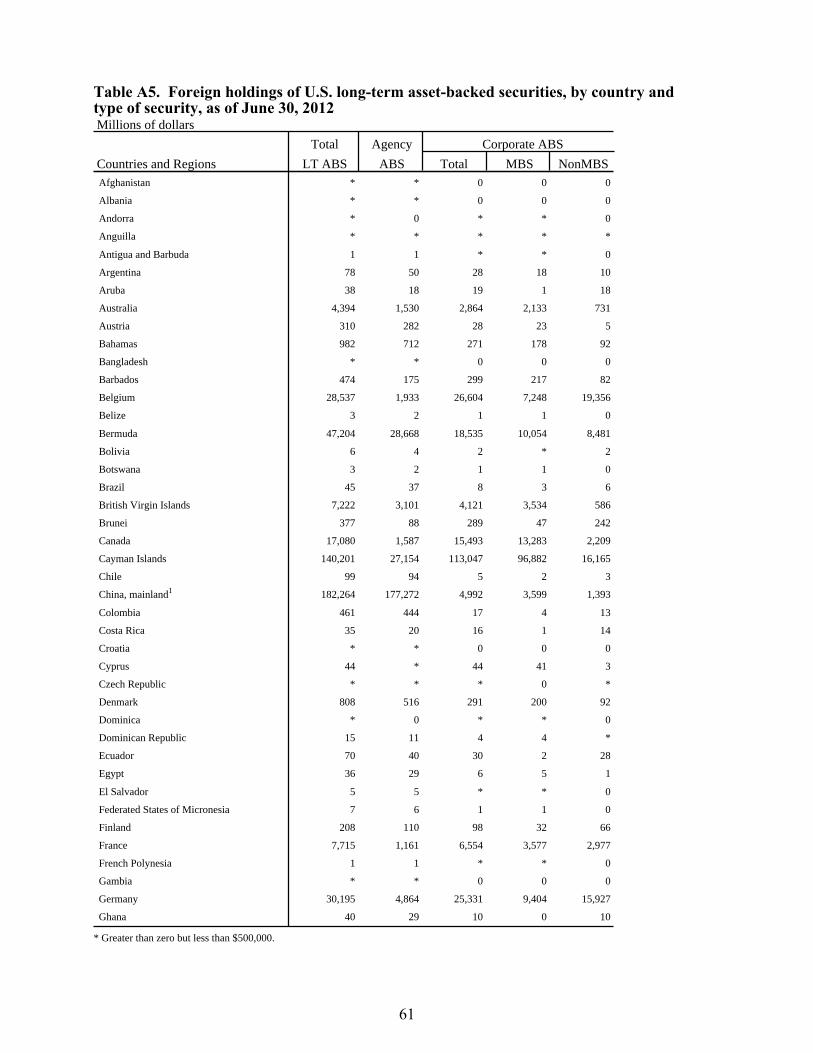
Table A5. Foreign holdings of U.S. long-term asset-backed securities, by country andtype of security, as of June 30, 2012 Millions of dollars
Total Agency Corporate ABS
Countries and Regions LT ABS ABS Total MBS NonMBS Afghanistan * * 0 0 0
Albania * * 0 0 0
Andorra * 0 * * 0
Anguilla * * * * *
Antigua and Barbuda 1 1 * * 0
Argentina 78 50 28 18 10
Aruba 38 18 19 1 18
Australia 4,394 1,530 2,864 2,133 731
Austria 310 282 28 23 5
Bahamas 982 712 271 178 92
Bangladesh * * 0 0 0
Barbados 474 175 299 217 82
Belgium 28,537 1,933 26,604 7,248 19,356
Belize 3 2 1 1 0
Bermuda 47,204 28,668 18,535 10,054 8,481
Bolivia 6 4 2 * 2
Botswana 3 2 1 1 0
Brazil 45 37 8 3 6
British Virgin Islands 7,222 3,101 4,121 3,534 586
Brunei 377 88 289 47 242
Canada 17,080 1,587 15,493 13,283 2,209
Cayman Islands 140,201 27,154 113,047 96,882 16,165
Chile 99 94 5 2 3
China, mainland1 182,264 177,272 4,992 3,599 1,393
Colombia 461 444 17 4 13
Costa Rica 35 20 16 1 14
Croatia * * 0 0 0
Cyprus 44 * 44 41 3
Czech Republic * * * 0 *
Denmark 808 516 291 200 92
Dominica * 0 * * 0
Dominican Republic 15 11 4 4 *
Ecuador 70 40 30 2 28
Egypt 36 29 6 5 1
El Salvador 5 5 * * 0
Federated States of Micronesia 7 6 1 1 0
Finland 208 110 98 32 66
France 7,715 1,161 6,554 3,577 2,977
French Polynesia 1 1 * * 0
Gambia * * 0 0 0
Germany 30,195 4,864 25,331 9,404 15,927
Ghana 40 29 10 0 10
* Greater than zero but less than $500,000.
61
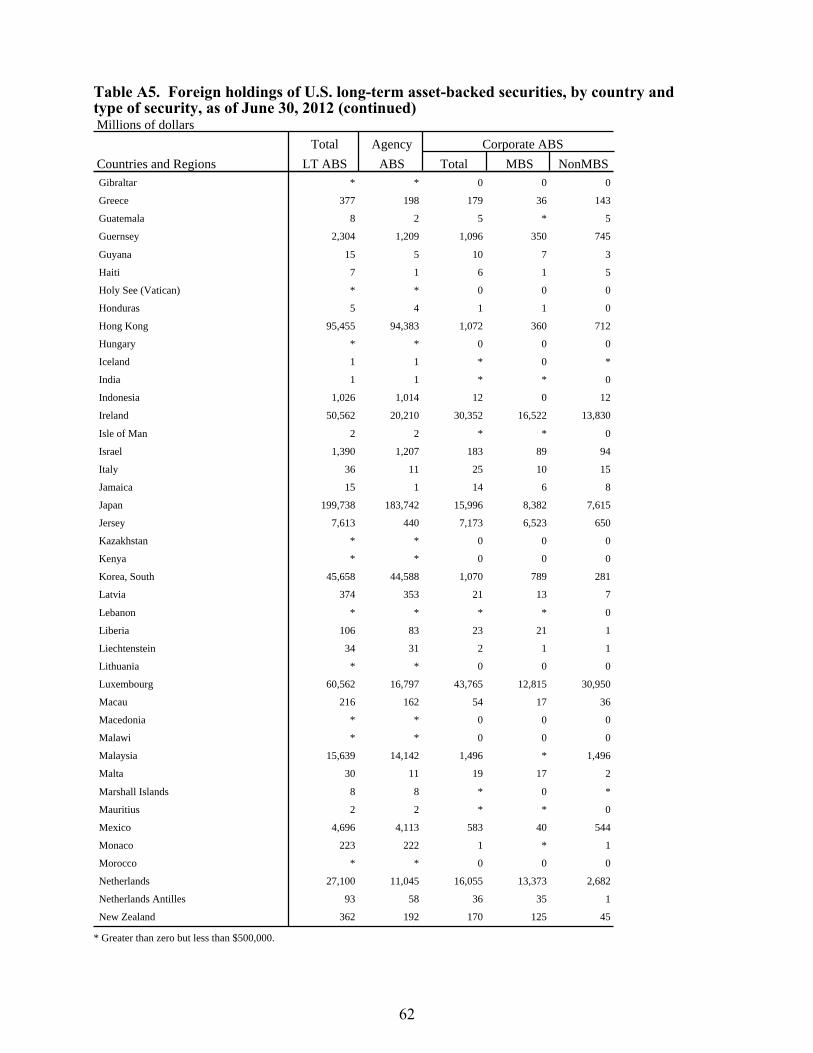
Table A5. Foreign holdings of U.S. long-term asset-backed securities, by country andtype of security, as of June 30, 2012 (continued) Millions of dollars
Total Agency Corporate ABS
Countries and Regions LT ABS ABS Total MBS NonMBS Gibraltar * * 0 0 0
Greece 377 198 179 36 143
Guatemala 8 2 5 * 5
Guernsey 2,304 1,209 1,096 350 745
Guyana 15 5 10 7 3
Haiti 7 1 6 1 5
Holy See (Vatican) * * 0 0 0
Honduras 5 4 1 1 0
Hong Kong 95,455 94,383 1,072 360 712
Hungary * * 0 0 0
Iceland 1 1 * 0 *
India 1 1 * * 0
Indonesia 1,026 1,014 12 0 12
Ireland 50,562 20,210 30,352 16,522 13,830
Isle of Man 2 2 * * 0
Israel 1,390 1,207 183 89 94
Italy 36 11 25 10 15
Jamaica 15 1 14 6 8
Japan 199,738 183,742 15,996 8,382 7,615
Jersey 7,613 440 7,173 6,523 650
Kazakhstan * * 0 0 0
Kenya * * 0 0 0
Korea, South 45,658 44,588 1,070 789 281
Latvia 374 353 21 13 7
Lebanon * * * * 0
Liberia 106 83 23 21 1
Liechtenstein 34 31 2 1 1
Lithuania * * 0 0 0
Luxembourg 60,562 16,797 43,765 12,815 30,950
Macau 216 162 54 17 36
Macedonia * * 0 0 0
Malawi * * 0 0 0
Malaysia 15,639 14,142 1,496 * 1,496
Malta 30 11 19 17 2
Marshall Islands 8 8 * 0 *
Mauritius 2 2 * * 0
Mexico 4,696 4,113 583 40 544
Monaco 223 222 1 * 1
Morocco * * 0 0 0
Netherlands 27,100 11,045 16,055 13,373 2,682
Netherlands Antilles 93 58 36 35 1
New Zealand 362 192 170 125 45
* Greater than zero but less than $500,000.
62
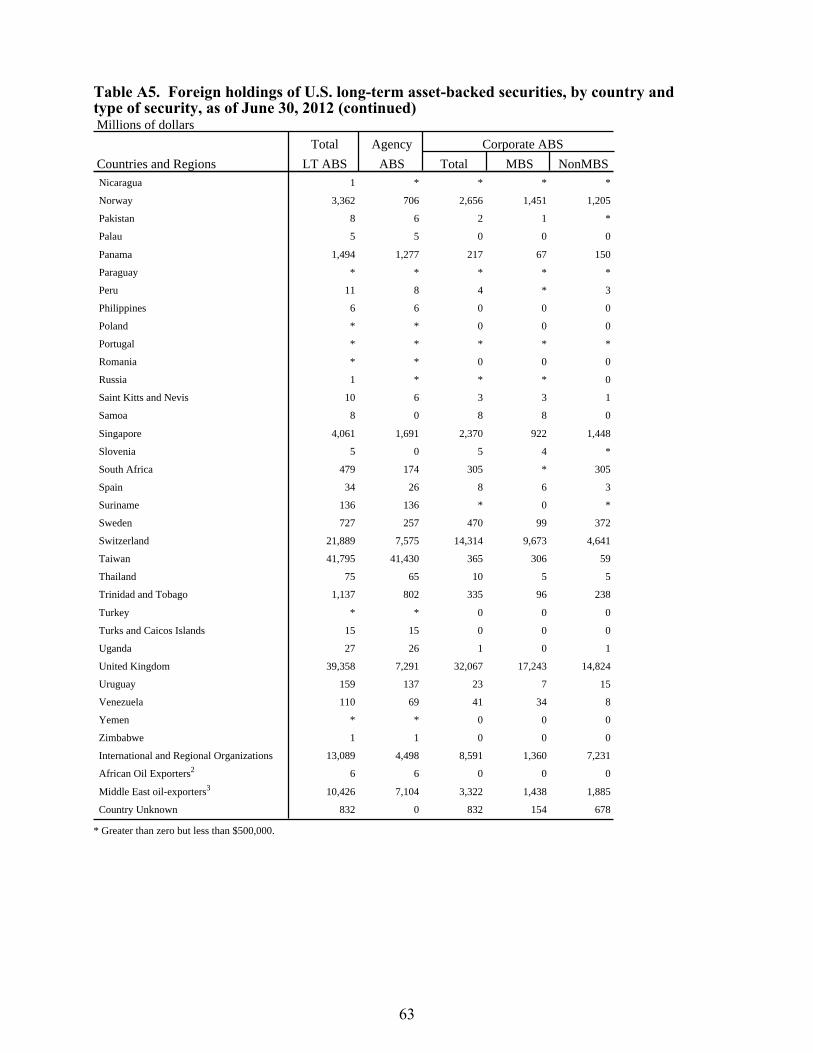
Table A5. Foreign holdings of U.S. long-term asset-backed securities, by country andtype of security, as of June 30, 2012 (continued) Millions of dollars
Total Agency Corporate ABS
Countries and Regions LT ABS ABS Total MBS NonMBS Nicaragua 1 * * * *
Norway 3,362 706 2,656 1,451 1,205
Pakistan 8 6 2 1 *
Palau 5 5 0 0 0
Panama 1,494 1,277 217 67 150
Paraguay * * * * *
Peru 11 8 4 * 3
Philippines 6 6 0 0 0
Poland * * 0 0 0
Portugal * * * * *
Romania * * 0 0 0
Russia 1 * * * 0
Saint Kitts and Nevis 10 6 3 3 1
Samoa 8 0 8 8 0
Singapore 4,061 1,691 2,370 922 1,448
Slovenia 5 0 5 4 *
South Africa 479 174 305 * 305
Spain 34 26 8 6 3
Suriname 136 136 * 0 *
Sweden 727 257 470 99 372
Switzerland 21,889 7,575 14,314 9,673 4,641
Taiwan 41,795 41,430 365 306 59
Thailand 75 65 10 5 5
Trinidad and Tobago 1,137 802 335 96 238
Turkey * * 0 0 0
Turks and Caicos Islands 15 15 0 0 0
Uganda 27 26 1 0 1
United Kingdom 39,358 7,291 32,067 17,243 14,824
Uruguay 159 137 23 7 15
Venezuela 110 69 41 34 8
Yemen * * 0 0 0
Zimbabwe 1 1 0 0 0
International and Regional Organizations 13,089 4,498 8,591 1,360 7,231
African Oil Exporters2 6 6 0 0 0
Middle East oil-exporters3 10,426 7,104 3,322 1,438 1,885
Country Unknown 832 0 832 154 678
* Greater than zero but less than $500,000.
63
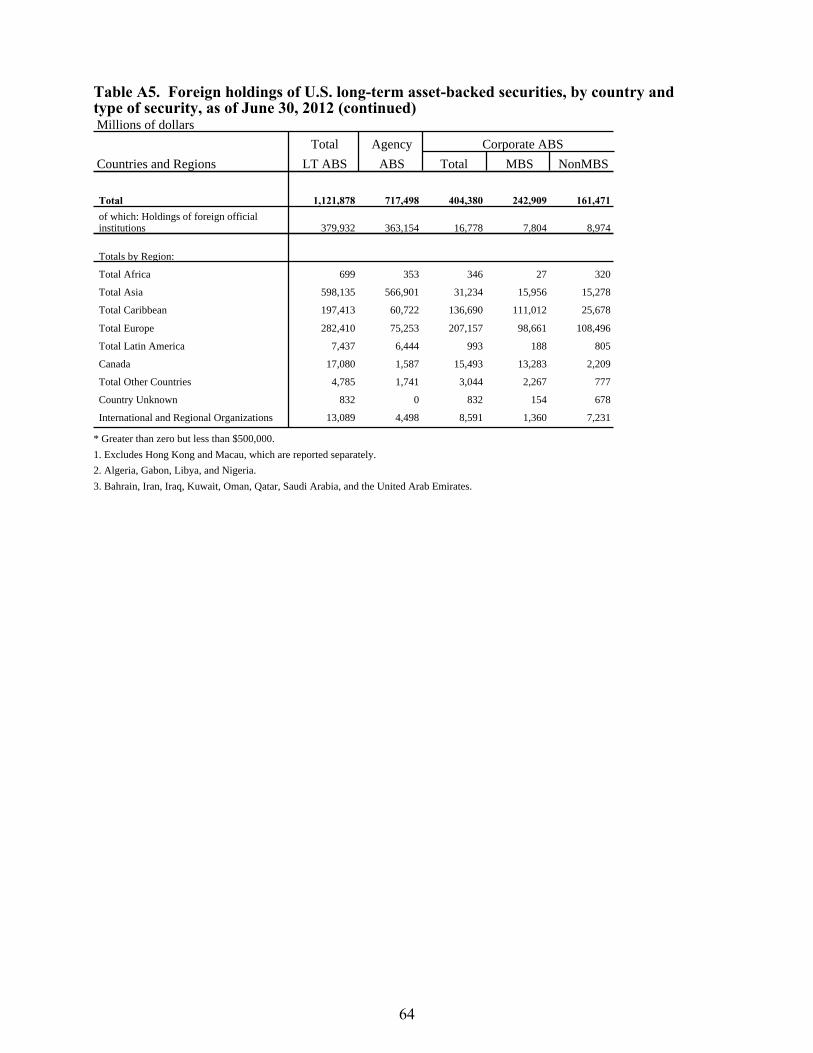
Table A5. Foreign holdings of U.S. long-term asset-backed securities, by country andtype of security, as of June 30, 2012 (continued) Millions of dollars
Total Agency Corporate ABS
Countries and Regions LT ABS ABS Total MBS NonMBS
Total 1,121,878 717,498 404,380 242,909 161,471 of which: Holdings of foreign official institutions 379,932 363,154 16,778 7,804 8,974
Totals by Region:
Total Africa 699 353 346 27 320
Total Asia 598,135 566,901 31,234 15,956 15,278
Total Caribbean 197,413 60,722 136,690 111,012 25,678
Total Europe 282,410 75,253 207,157 98,661 108,496
Total Latin America 7,437 6,444 993 188 805
Canada 17,080 1,587 15,493 13,283 2,209
Total Other Countries 4,785 1,741 3,044 2,267 777
Country Unknown 832 0 832 154 678
International and Regional Organizations 13,089 4,498 8,591 1,360 7,231
* Greater than zero but less than $500,000.
1. Excludes Hong Kong and Macau, which are reported separately.
2. Algeria, Gabon, Libya, and Nigeria.
3. Bahrain, Iran, Iraq, Kuwait, Oman, Qatar, Saudi Arabia, and the United Arab Emirates.
64
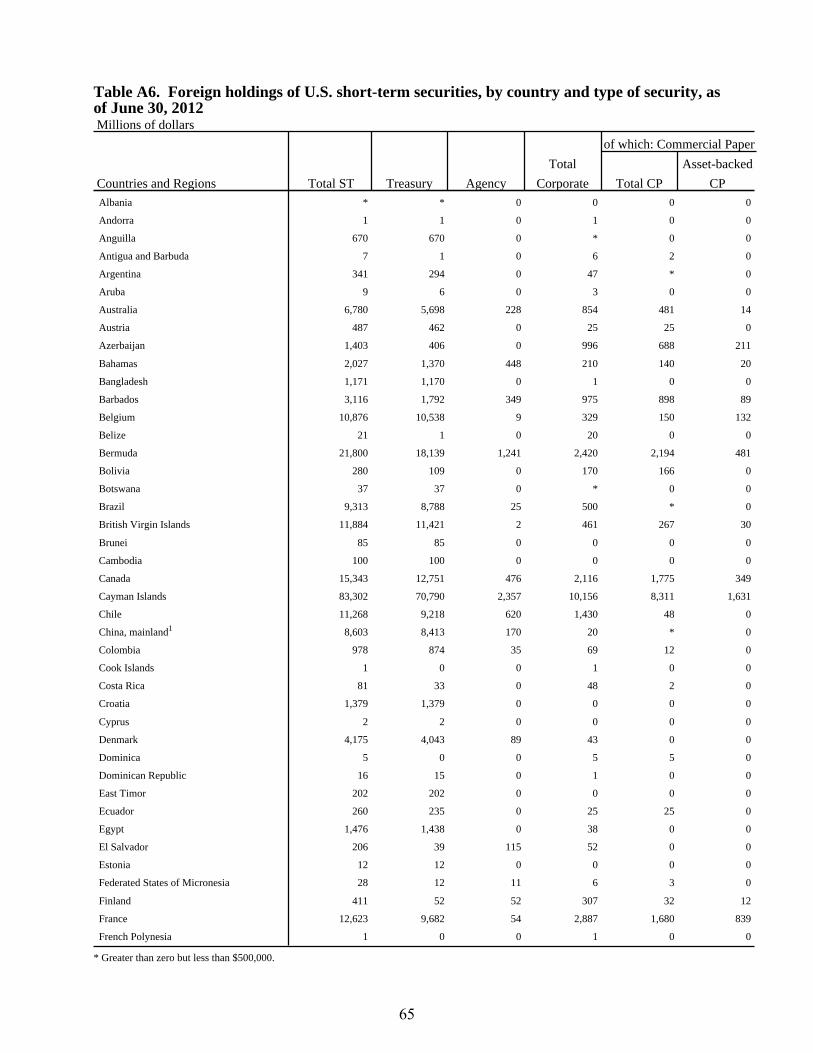
Table A6. Foreign holdings of U.S. short-term securities, by country and type of security, asof June 30, 2012 Millions of dollars
of which: Commercial Paper
Total Asset-backed
Countries and Regions Total ST Treasury Agency Corporate Total CP CP Albania * * 0 0 0 0
Andorra 1 1 0 1 0 0
Anguilla 670 670 0 * 0 0
Antigua and Barbuda 7 1 0 6 2 0
Argentina 341 294 0 47 * 0
Aruba 9 6 0 3 0 0
Australia 6,780 5,698 228 854 481 14
Austria 487 462 0 25 25 0
Azerbaijan 1,403 406 0 996 688 211
Bahamas 2,027 1,370 448 210 140 20
Bangladesh 1,171 1,170 0 1 0 0
Barbados 3,116 1,792 349 975 898 89
Belgium 10,876 10,538 9 329 150 132
Belize 21 1 0 20 0 0
Bermuda 21,800 18,139 1,241 2,420 2,194 481
Bolivia 280 109 0 170 166 0
Botswana 37 37 0 * 0 0
Brazil 9,313 8,788 25 500 * 0
British Virgin Islands 11,884 11,421 2 461 267 30
Brunei 85 85 0 0 0 0
Cambodia 100 100 0 0 0 0
Canada 15,343 12,751 476 2,116 1,775 349
Cayman Islands 83,302 70,790 2,357 10,156 8,311 1,631
Chile 11,268 9,218 620 1,430 48 0
China, mainland1 8,603 8,413 170 20 * 0
Colombia 978 874 35 69 12 0
Cook Islands 1 0 0 1 0 0
Costa Rica 81 33 0 48 2 0
Croatia 1,379 1,379 0 0 0 0
Cyprus 2 2 0 0 0 0
Denmark 4,175 4,043 89 43 0 0
Dominica 5 0 0 5 5 0
Dominican Republic 16 15 0 1 0 0
East Timor 202 202 0 0 0 0
Ecuador 260 235 0 25 25 0
Egypt 1,476 1,438 0 38 0 0
El Salvador 206 39 115 52 0 0
Estonia 12 12 0 0 0 0
Federated States of Micronesia 28 12 11 6 3 0
Finland 411 52 52 307 32 12
France 12,623 9,682 54 2,887 1,680 839
French Polynesia 1 0 0 1 0 0
* Greater than zero but less than $500,000.
65
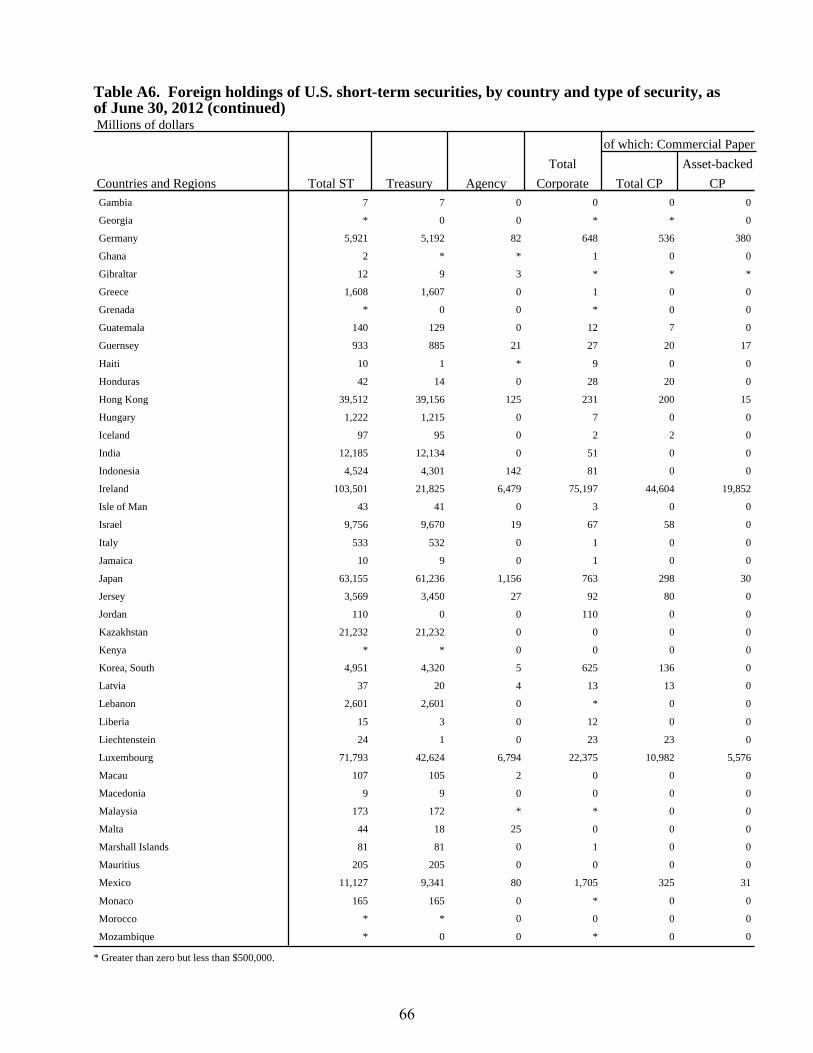
Table A6. Foreign holdings of U.S. short-term securities, by country and type of security, asof June 30, 2012 (continued) Millions of dollars
of which: Commercial Paper
Total Asset-backed
Countries and Regions Total ST Treasury Agency Corporate Total CP CP Gambia 7 7 0 0 0 0
Georgia * 0 0 * * 0
Germany 5,921 5,192 82 648 536 380
Ghana 2 * * 1 0 0
Gibraltar 12 9 3 * * *
Greece 1,608 1,607 0 1 0 0
Grenada * 0 0 * 0 0
Guatemala 140 129 0 12 7 0
Guernsey 933 885 21 27 20 17
Haiti 10 1 * 9 0 0
Honduras 42 14 0 28 20 0
Hong Kong 39,512 39,156 125 231 200 15
Hungary 1,222 1,215 0 7 0 0
Iceland 97 95 0 2 2 0
India 12,185 12,134 0 51 0 0
Indonesia 4,524 4,301 142 81 0 0
Ireland 103,501 21,825 6,479 75,197 44,604 19,852
Isle of Man 43 41 0 3 0 0
Israel 9,756 9,670 19 67 58 0
Italy 533 532 0 1 0 0
Jamaica 10 9 0 1 0 0
Japan 63,155 61,236 1,156 763 298 30
Jersey 3,569 3,450 27 92 80 0
Jordan 110 0 0 110 0 0
Kazakhstan 21,232 21,232 0 0 0 0
Kenya * * 0 0 0 0
Korea, South 4,951 4,320 5 625 136 0
Latvia 37 20 4 13 13 0
Lebanon 2,601 2,601 0 * 0 0
Liberia 15 3 0 12 0 0
Liechtenstein 24 1 0 23 23 0
Luxembourg 71,793 42,624 6,794 22,375 10,982 5,576
Macau 107 105 2 0 0 0
Macedonia 9 9 0 0 0 0
Malaysia 173 172 * * 0 0
Malta 44 18 25 0 0 0
Marshall Islands 81 81 0 1 0 0
Mauritius 205 205 0 0 0 0
Mexico 11,127 9,341 80 1,705 325 31
Monaco 165 165 0 * 0 0
Morocco * * 0 0 0 0
Mozambique * 0 0 * 0 0
* Greater than zero but less than $500,000.
66
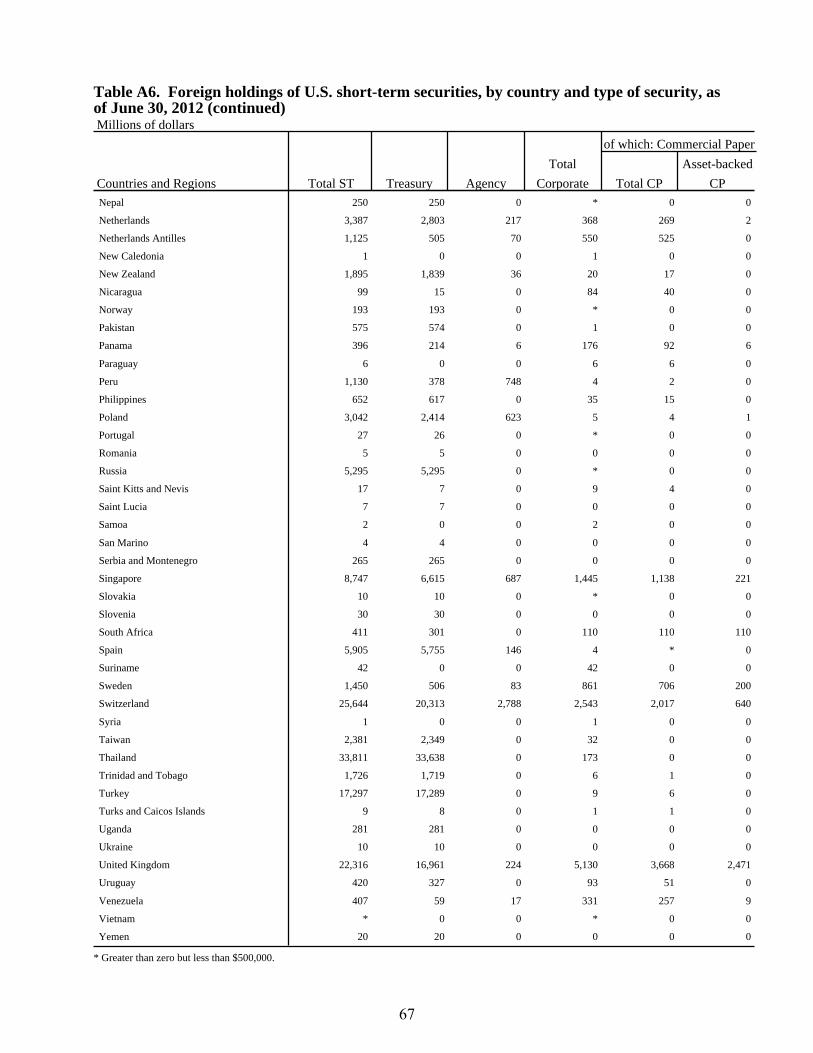
Table A6. Foreign holdings of U.S. short-term securities, by country and type of security, asof June 30, 2012 (continued) Millions of dollars
of which: Commercial Paper
Total Asset-backed
Countries and Regions Total ST Treasury Agency Corporate Total CP CP Nepal 250 250 0 * 0 0
Netherlands 3,387 2,803 217 368 269 2
Netherlands Antilles 1,125 505 70 550 525 0
New Caledonia 1 0 0 1 0 0
New Zealand 1,895 1,839 36 20 17 0
Nicaragua 99 15 0 84 40 0
Norway 193 193 0 * 0 0
Pakistan 575 574 0 1 0 0
Panama 396 214 6 176 92 6
Paraguay 6 0 0 6 6 0
Peru 1,130 378 748 4 2 0
Philippines 652 617 0 35 15 0
Poland 3,042 2,414 623 5 4 1
Portugal 27 26 0 * 0 0
Romania 5 5 0 0 0 0
Russia 5,295 5,295 0 * 0 0
Saint Kitts and Nevis 17 7 0 9 4 0
Saint Lucia 7 7 0 0 0 0
Samoa 2 0 0 2 0 0
San Marino 4 4 0 0 0 0
Serbia and Montenegro 265 265 0 0 0 0
Singapore 8,747 6,615 687 1,445 1,138 221
Slovakia 10 10 0 * 0 0
Slovenia 30 30 0 0 0 0
South Africa 411 301 0 110 110 110
Spain 5,905 5,755 146 4 * 0
Suriname 42 0 0 42 0 0
Sweden 1,450 506 83 861 706 200
Switzerland 25,644 20,313 2,788 2,543 2,017 640
Syria 1 0 0 1 0 0
Taiwan 2,381 2,349 0 32 0 0
Thailand 33,811 33,638 0 173 0 0
Trinidad and Tobago 1,726 1,719 0 6 1 0
Turkey 17,297 17,289 0 9 6 0
Turks and Caicos Islands 9 8 0 1 1 0
Uganda 281 281 0 0 0 0
Ukraine 10 10 0 0 0 0
United Kingdom 22,316 16,961 224 5,130 3,668 2,471
Uruguay 420 327 0 93 51 0
Venezuela 407 59 17 331 257 9
Vietnam * 0 0 * 0 0
Yemen 20 20 0 0 0 0
* Greater than zero but less than $500,000.
67
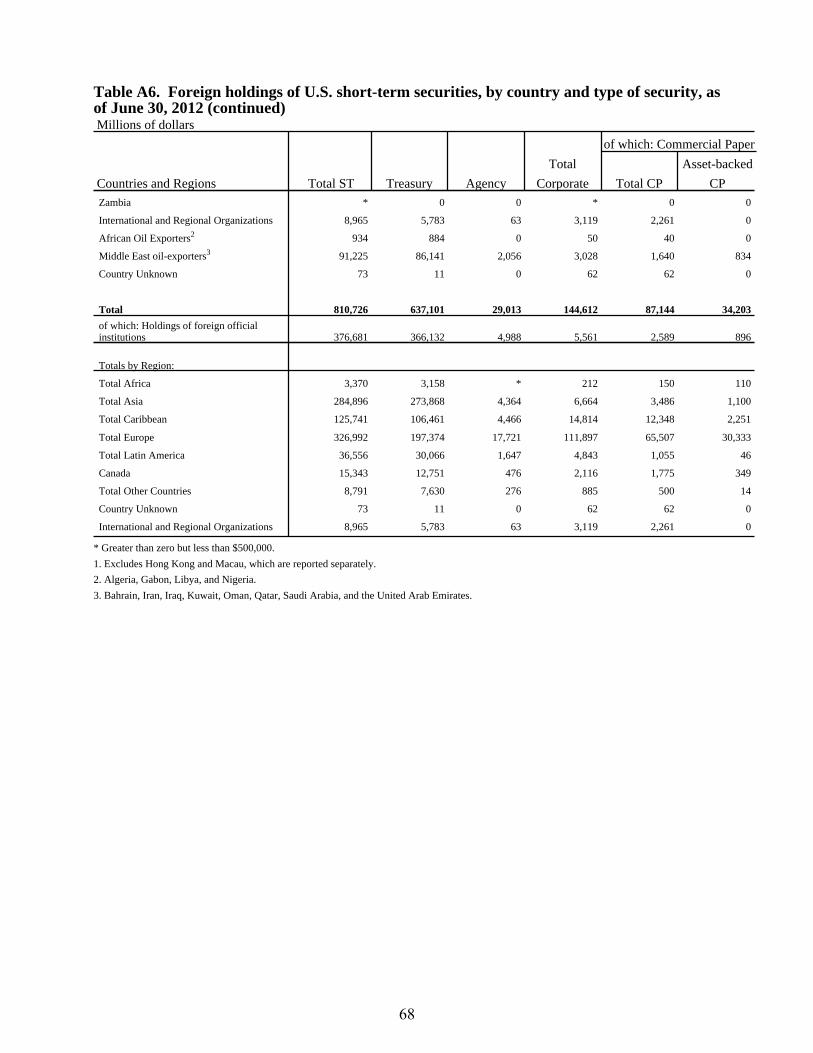
Table A6. Foreign holdings of U.S. short-term securities, by country and type of security, asof June 30, 2012 (continued) Millions of dollars
of which: Commercial Paper
Total Asset-backed
Countries and Regions Total ST Treasury Agency Corporate Total CP CP Zambia * 0 0 * 0 0
International and Regional Organizations 8,965 5,783 63 3,119 2,261 0
African Oil Exporters2 934 884 0 50 40 0
Middle East oil-exporters3 91,225 86,141 2,056 3,028 1,640 834
Country Unknown 73 11 0 62 62 0
Total 810,726 637,101 29,013 144,612 87,144 34,203
of which: Holdings of foreign official institutions 376,681 366,132 4,988 5,561 2,589 896
Totals by Region:
Total Africa 3,370 3,158 * 212 150 110
Total Asia 284,896 273,868 4,364 6,664 3,486 1,100
Total Caribbean 125,741 106,461 4,466 14,814 12,348 2,251
Total Europe 326,992 197,374 17,721 111,897 65,507 30,333
Total Latin America 36,556 30,066 1,647 4,843 1,055 46
Canada 15,343 12,751 476 2,116 1,775 349
Total Other Countries 8,791 7,630 276 885 500 14
Country Unknown 73 11 0 62 62 0
International and Regional Organizations 8,965 5,783 63 3,119 2,261 0
* Greater than zero but less than $500,000.
1. Excludes Hong Kong and Macau, which are reported separately.
2. Algeria, Gabon, Libya, and Nigeria.
3. Bahrain, Iran, Iraq, Kuwait, Oman, Qatar, Saudi Arabia, and the United Arab Emirates.
68
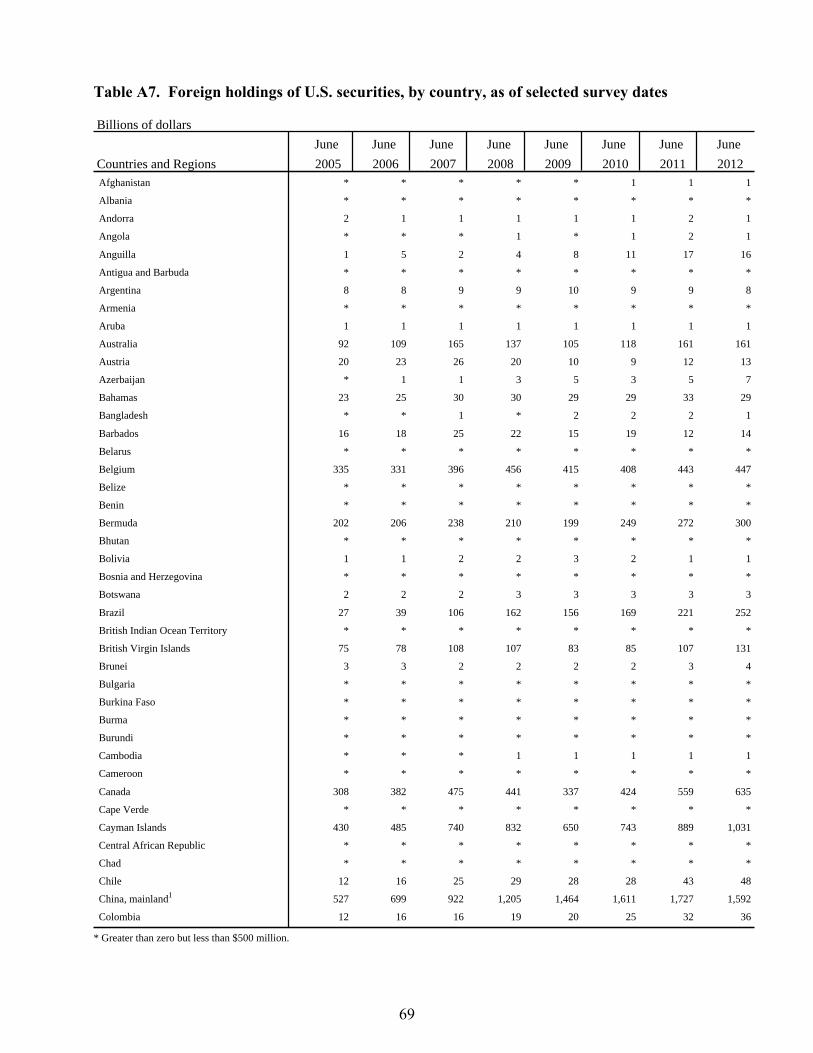
Table A7. Foreign holdings of U.S. securities, by country, as of selected survey dates
Billions of dollars
June June June June June June June June
Countries and Regions 2005 2006 2007 2008 2009 2010 2011 2012 Afghanistan * * * * * 1 1 1
Albania * * * * * * * *
Andorra 2 1 1 1 1 1 2 1
Angola * * * 1 * 1 2 1
Anguilla 1 5 2 4 8 11 17 16
Antigua and Barbuda * * * * * * * *
Argentina 8 8 9 9 10 9 9 8
Armenia * * * * * * * *
Aruba 1 1 1 1 1 1 1 1
Australia 92 109 165 137 105 118 161 161
Austria 20 23 26 20 10 9 12 13
Azerbaijan * 1 1 3 5 3 5 7
Bahamas 23 25 30 30 29 29 33 29
Bangladesh * * 1 * 2 2 2 1
Barbados 16 18 25 22 15 19 12 14
Belarus * * * * * * * *
Belgium 335 331 396 456 415 408 443 447
Belize * * * * * * * *
Benin * * * * * * * *
Bermuda 202 206 238 210 199 249 272 300
Bhutan * * * * * * * *
Bolivia 1 1 2 2 3 2 1 1
Bosnia and Herzegovina * * * * * * * *
Botswana 2 2 2 3 3 3 3 3
Brazil 27 39 106 162 156 169 221 252
British Indian Ocean Territory * * * * * * * *
British Virgin Islands 75 78 108 107 83 85 107 131
Brunei 3 3 2 2 2 2 3 4
Bulgaria * * * * * * * *
Burkina Faso * * * * * * * *
Burma * * * * * * * *
Burundi * * * * * * * *
Cambodia * * * 1 1 1 1 1
Cameroon * * * * * * * *
Canada 308 382 475 441 337 424 559 635
Cape Verde * * * * * * * *
Cayman Islands 430 485 740 832 650 743 889 1,031
Central African Republic * * * * * * * *
Chad * * * * * * * *
Chile 12 16 25 29 28 28 43 48
China, mainland1 527 699 922 1,205 1,464 1,611 1,727 1,592
Colombia 12 16 16 19 20 25 32 36
* Greater than zero but less than $500 million.
69

Table A7. Foreign holdings of U.S. securities, by country, as of selected survey dates (continued) Billions of dollars
June June June June June June June June
Countries and Regions 2005 2006 2007 2008 2009 2010 2011 2012 Comoros * * * * * * * *
Congo (Brazzaville) * * * * * * * *
Congo Kinshasa * * * * * * * *
Cook Islands * * * * * * * *
Costa Rica 1 2 2 3 2 2 2 2
Cote D‘Ivoire (Ivory Coast) * * * * * * * *
Croatia 1 1 1 1 2 2 2 2
Cuba * * * * * * * *
Cyprus * * 1 1 * * * *
Czech Republic 6 7 5 5 6 7 7 8
Denmark 48 46 50 46 38 49 63 76
Djibouti * * * * * * * *
Dominica * * * * * * * *
Dominican Republic 1 1 2 2 2 1 1 1
East Timor * 1 2 3 5 6 8 10
Ecuador 1 1 2 1 2 2 2 1
Egypt 2 6 11 16 13 27 13 4
El Salvador 1 1 1 2 2 2 2 1
Equatorial Guinea * * * * * * * *
Eritrea * * * * * * * *
Estonia * * * * * * * *
Ethiopia * * * * * * * *
Falkland Islands * * * * * * * *
Faroe Islands * * * * * * * *
Federated States of Micronesia * * * * * * * *
Fiji * * * * * * * *
Finland 9 10 12 13 11 14 19 19
France 122 164 221 222 139 194 249 225
French Guiana * * * * * * * *
French Polynesia * * * * * * * *
Gambia * * * * * * * *
Georgia * * * * * * 1 1
Germany 200 211 266 247 182 195 238 227
Ghana * * * * * * * 1
Gibraltar 1 1 1 1 * 1 1 *
Greece 2 2 2 2 2 2 5 9
Greenland * * * * * * * *
Grenada * * * * * * * *
Guadeloupe * * * * * * * *
Guatemala 2 4 4 4 4 4 4 4
Guernsey 19 16 14 11 18 22 22 30
Guinea * * * * * * * *
* Greater than zero but less than $500 million.
70

Table A7. Foreign holdings of U.S. securities, by country, as of selected survey dates (continued) Billions of dollars
June June June June June June June June
Countries and Regions 2005 2006 2007 2008 2009 2010 2011 2012 Guinea-Bissau * * * * * * * *
Guyana * * * * * * * *
Haiti * 1 1 1 * 1 1 1
Holy See (Vatican) * * * * * * * *
Honduras * * * 1 1 1 1 1
Hong Kong 96 110 138 147 222 293 292 306
Hungary 1 2 1 2 2 1 3 3
Iceland 1 1 2 1 1 1 1 1
India 16 18 21 26 57 41 45 55
Indonesia 12 12 19 12 25 33 47 36
Ireland 191 232 342 400 348 356 405 453
Isle of Man 3 2 2 1 5 4 3 2
Israel 22 21 25 26 30 37 47 53
Italy 50 53 50 35 35 41 42 52
Jamaica 1 1 1 1 1 1 * *
Japan 1,091 1,106 1,197 1,250 1,269 1,393 1,585 1,835
Jersey 39 42 67 38 34 29 34 28
Jordan 1 1 1 1 4 2 2 1
Kazakhstan 5 9 14 18 18 23 24 33
Kenya * * * * * * * *
Kiribati * * * * * * * *
Korea, South 118 124 138 131 113 122 133 148
Kyrgyzstan * * * * * * * *
Laos * * * * * * * *
Latvia * 1 2 1 1 1 1 1
Lebanon * * * * * 1 1 3
Lesotho * * * * * * * *
Liberia 2 2 2 2 2 2 2 1
Liechtenstein 4 4 4 5 2 2 3 2
Lithuania * * * * * * * *
Luxembourg 460 549 703 656 578 622 817 837
Macau 1 1 2 3 1 1 1 1
Macedonia * * * * * * * *
Madagascar * * * * * * * *
Malawi * * * * * * * *
Malaysia 12 16 27 35 32 31 41 46
Maldives * * * * * * * *
Mali * * * * * * * *
Malta * 1 1 1 * 1 1 2
Marshall Islands * * * * * * * *
Martinique * * * * * * * *
Mauritania * * * * * * * *
* Greater than zero but less than $500 million.
71
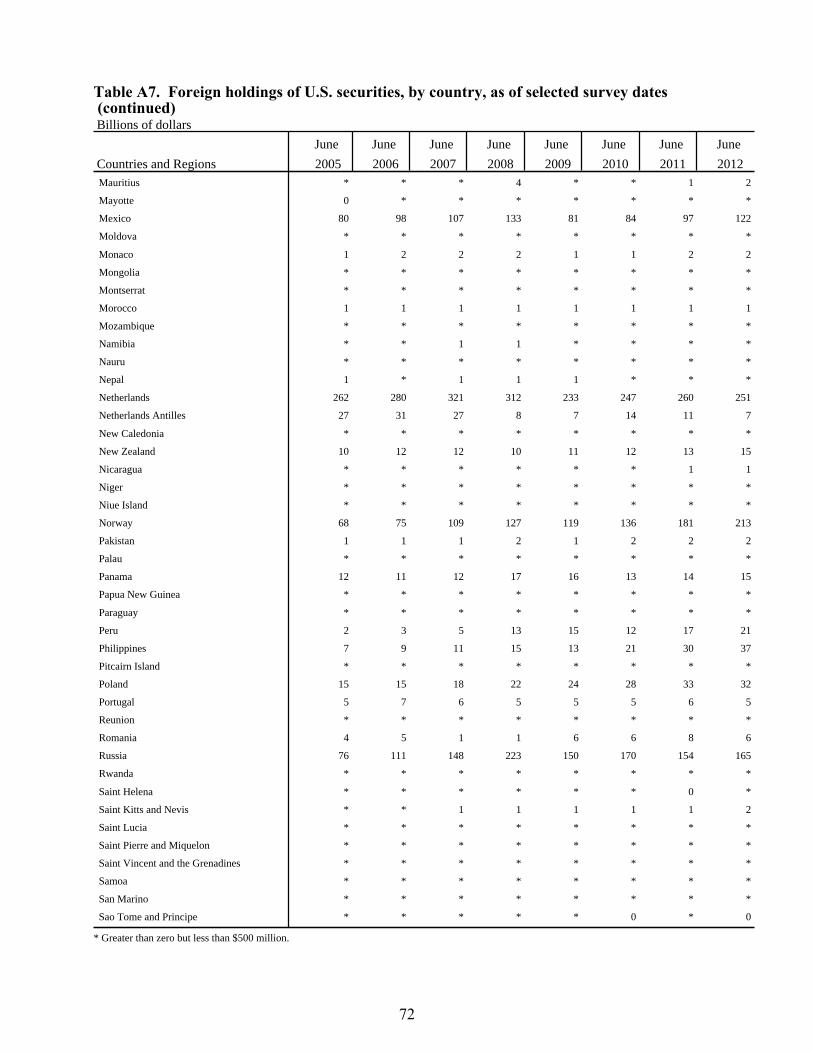
Table A7. Foreign holdings of U.S. securities, by country, as of selected survey dates (continued) Billions of dollars
June June June June June June June June
Countries and Regions 2005 2006 2007 2008 2009 2010 2011 2012 Mauritius * * * 4 * * 1 2
Mayotte 0 * * * * * * *
Mexico 80 98 107 133 81 84 97 122
Moldova * * * * * * * *
Monaco 1 2 2 2 1 1 2 2
Mongolia * * * * * * * *
Montserrat * * * * * * * *
Morocco 1 1 1 1 1 1 1 1
Mozambique * * * * * * * *
Namibia * * 1 1 * * * *
Nauru * * * * * * * *
Nepal 1 * 1 1 1 * * *
Netherlands 262 280 321 312 233 247 260 251
Netherlands Antilles 27 31 27 8 7 14 11 7
New Caledonia * * * * * * * *
New Zealand 10 12 12 10 11 12 13 15
Nicaragua * * * * * * 1 1
Niger * * * * * * * *
Niue Island * * * * * * * *
Norway 68 75 109 127 119 136 181 213
Pakistan 1 1 1 2 1 2 2 2
Palau * * * * * * * *
Panama 12 11 12 17 16 13 14 15
Papua New Guinea * * * * * * * *
Paraguay * * * * * * * *
Peru 2 3 5 13 15 12 17 21
Philippines 7 9 11 15 13 21 30 37
Pitcairn Island * * * * * * * *
Poland 15 15 18 22 24 28 33 32
Portugal 5 7 6 5 5 5 6 5
Reunion * * * * * * * *
Romania 4 5 1 1 6 6 8 6
Russia 76 111 148 223 150 170 154 165
Rwanda * * * * * * * *
Saint Helena * * * * * * 0 *
Saint Kitts and Nevis * * 1 1 1 1 1 2
Saint Lucia * * * * * * * *
Saint Pierre and Miquelon * * * * * * * *
Saint Vincent and the Grenadines * * * * * * * *
Samoa * * * * * * * *
San Marino * * * * * * * *
Sao Tome and Principe * * * * * 0 * 0
* Greater than zero but less than $500 million.
72
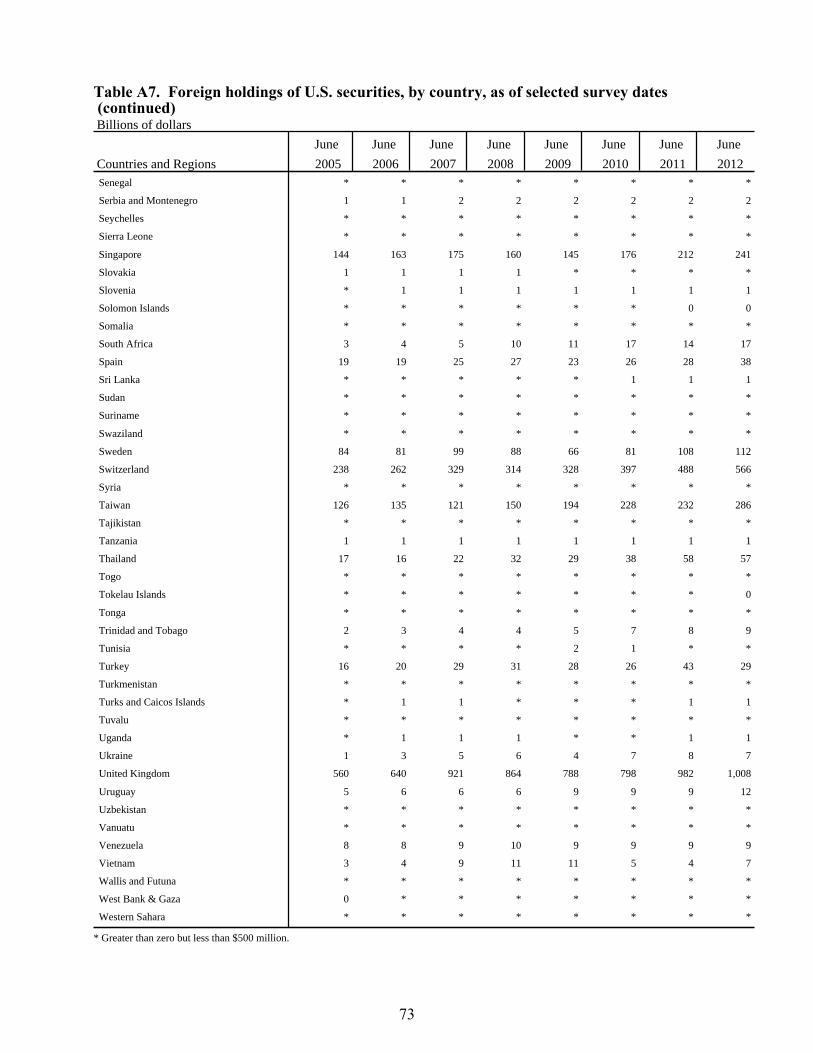
Table A7. Foreign holdings of U.S. securities, by country, as of selected survey dates (continued) Billions of dollars
June June June June June June June June
Countries and Regions 2005 2006 2007 2008 2009 2010 2011 2012 Senegal * * * * * * * *
Serbia and Montenegro 1 1 2 2 2 2 2 2
Seychelles * * * * * * * *
Sierra Leone * * * * * * * *
Singapore 144 163 175 160 145 176 212 241
Slovakia 1 1 1 1 * * * *
Slovenia * 1 1 1 1 1 1 1
Solomon Islands * * * * * * 0 0
Somalia * * * * * * * *
South Africa 3 4 5 10 11 17 14 17
Spain 19 19 25 27 23 26 28 38
Sri Lanka * * * * * 1 1 1
Sudan * * * * * * * *
Suriname * * * * * * * *
Swaziland * * * * * * * *
Sweden 84 81 99 88 66 81 108 112
Switzerland 238 262 329 314 328 397 488 566
Syria * * * * * * * *
Taiwan 126 135 121 150 194 228 232 286
Tajikistan * * * * * * * *
Tanzania 1 1 1 1 1 1 1 1
Thailand 17 16 22 32 29 38 58 57
Togo * * * * * * * *
Tokelau Islands * * * * * * * 0
Tonga * * * * * * * *
Trinidad and Tobago 2 3 4 4 5 7 8 9
Tunisia * * * * 2 1 * *
Turkey 16 20 29 31 28 26 43 29
Turkmenistan * * * * * * * *
Turks and Caicos Islands * 1 1 * * * 1 1
Tuvalu * * * * * * * *
Uganda * 1 1 1 * * 1 1
Ukraine 1 3 5 6 4 7 8 7
United Kingdom 560 640 921 864 788 798 982 1,008
Uruguay 5 6 6 6 9 9 9 12
Uzbekistan * * * * * * * *
Vanuatu * * * * * * * *
Venezuela 8 8 9 10 9 9 9 9
Vietnam 3 4 9 11 11 5 4 7
Wallis and Futuna * * * * * * * *
West Bank & Gaza 0 * * * * * * *
Western Sahara * * * * * * * *
* Greater than zero but less than $500 million.
73
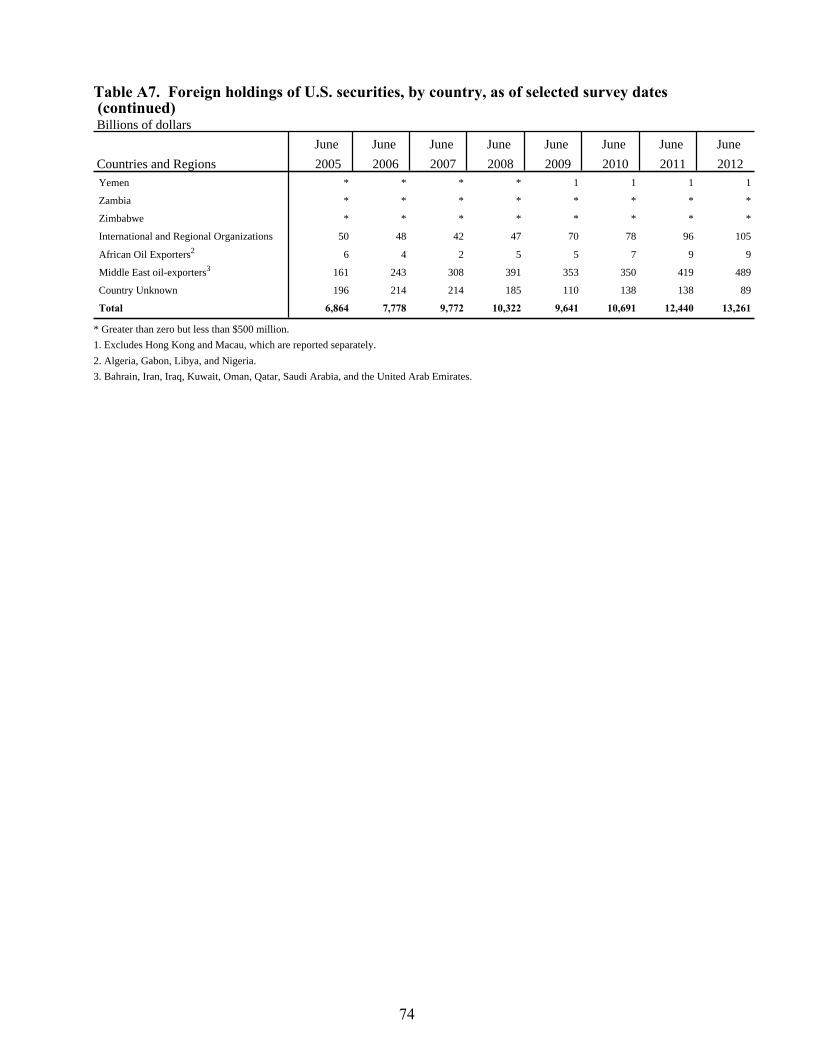
Table A7. Foreign holdings of U.S. securities, by country, as of selected survey dates (continued) Billions of dollars
June June June June June June June June
Countries and Regions 2005 2006 2007 2008 2009 2010 2011 2012 Yemen * * * * 1 1 1 1
Zambia * * * * * * * *
Zimbabwe * * * * * * * *
International and Regional Organizations 50 48 42 47 70 78 96 105
African Oil Exporters2 6 4 2 5 5 7 9 9
Middle East oil-exporters3 161 243 308 391 353 350 419 489
Country Unknown 196 214 214 185 110 138 138 89
Total 6,864 7,778 9,772 10,322 9,641 10,691 12,440 13,261
* Greater than zero but less than $500 million.
1. Excludes Hong Kong and Macau, which are reported separately.
2. Algeria, Gabon, Libya, and Nigeria.
3. Bahrain, Iran, Iraq, Kuwait, Oman, Qatar, Saudi Arabia, and the United Arab Emirates.
74
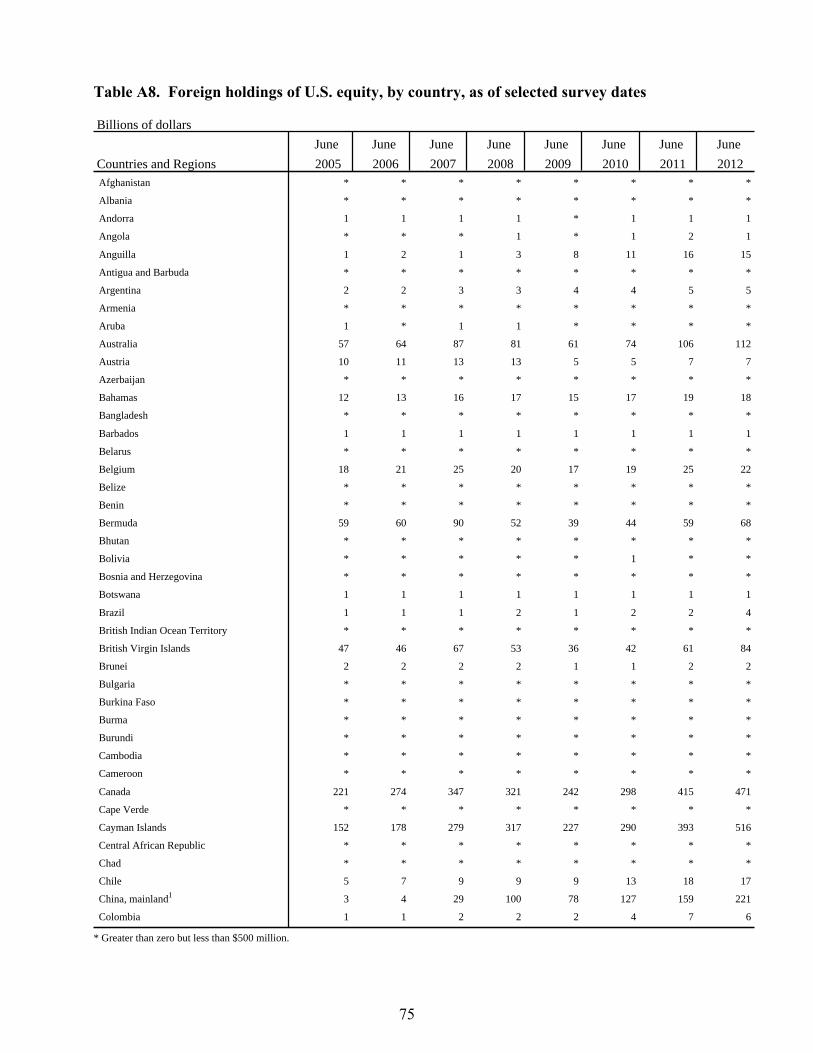
Table A8. Foreign holdings of U.S. equity, by country, as of selected survey dates
Billions of dollars
June June June June June June June June
Countries and Regions 2005 2006 2007 2008 2009 2010 2011 2012 Afghanistan * * * * * * * *
Albania * * * * * * * *
Andorra 1 1 1 1 * 1 1 1
Angola * * * 1 * 1 2 1
Anguilla 1 2 1 3 8 11 16 15
Antigua and Barbuda * * * * * * * *
Argentina 2 2 3 3 4 4 5 5
Armenia * * * * * * * *
Aruba 1 * 1 1 * * * *
Australia 57 64 87 81 61 74 106 112
Austria 10 11 13 13 5 5 7 7
Azerbaijan * * * * * * * *
Bahamas 12 13 16 17 15 17 19 18
Bangladesh * * * * * * * *
Barbados 1 1 1 1 1 1 1 1
Belarus * * * * * * * *
Belgium 18 21 25 20 17 19 25 22
Belize * * * * * * * *
Benin * * * * * * * *
Bermuda 59 60 90 52 39 44 59 68
Bhutan * * * * * * * *
Bolivia * * * * * 1 * *
Bosnia and Herzegovina * * * * * * * *
Botswana 1 1 1 1 1 1 1 1
Brazil 1 1 1 2 1 2 2 4
British Indian Ocean Territory * * * * * * * *
British Virgin Islands 47 46 67 53 36 42 61 84
Brunei 2 2 2 2 1 1 2 2
Bulgaria * * * * * * * *
Burkina Faso * * * * * * * *
Burma * * * * * * * *
Burundi * * * * * * * *
Cambodia * * * * * * * *
Cameroon * * * * * * * *
Canada 221 274 347 321 242 298 415 471
Cape Verde * * * * * * * *
Cayman Islands 152 178 279 317 227 290 393 516
Central African Republic * * * * * * * *
Chad * * * * * * * *
Chile 5 7 9 9 9 13 18 17
China, mainland1 3 4 29 100 78 127 159 221
Colombia 1 1 2 2 2 4 7 6
* Greater than zero but less than $500 million.
75
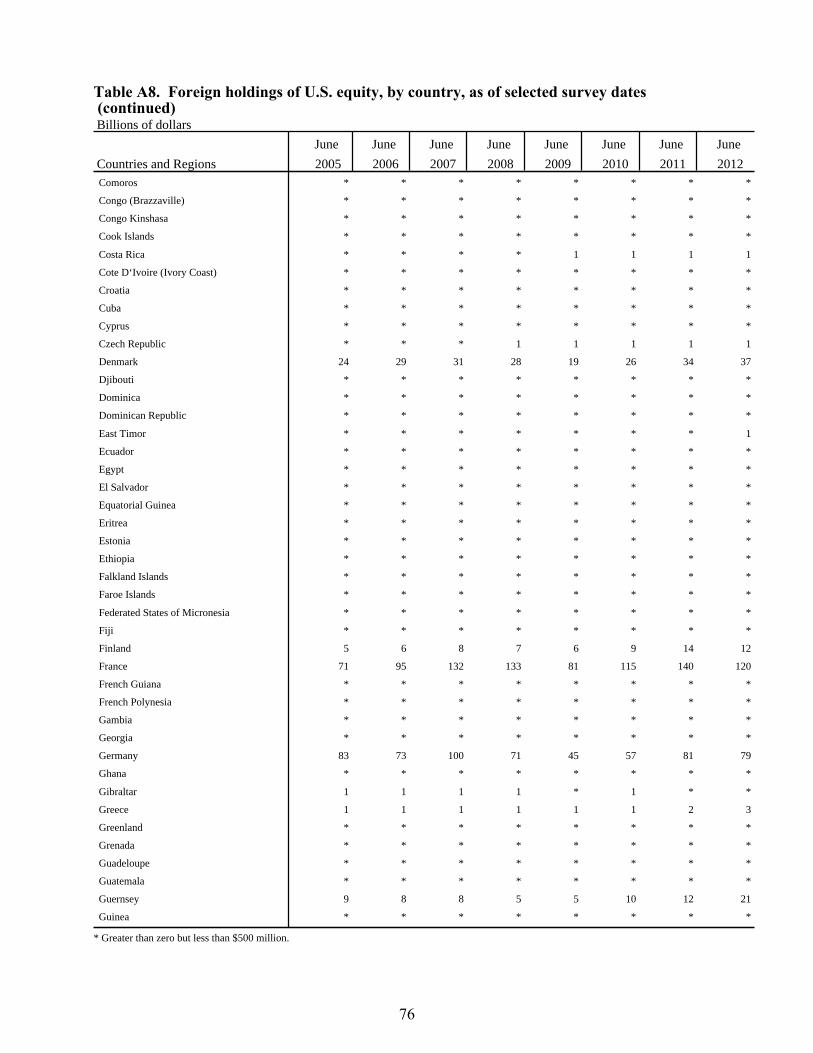
Table A8. Foreign holdings of U.S. equity, by country, as of selected survey dates (continued) Billions of dollars
June June June June June June June June
Countries and Regions 2005 2006 2007 2008 2009 2010 2011 2012 Comoros * * * * * * * *
Congo (Brazzaville) * * * * * * * *
Congo Kinshasa * * * * * * * *
Cook Islands * * * * * * * *
Costa Rica * * * * 1 1 1 1
Cote D‘Ivoire (Ivory Coast) * * * * * * * *
Croatia * * * * * * * *
Cuba * * * * * * * *
Cyprus * * * * * * * *
Czech Republic * * * 1 1 1 1 1
Denmark 24 29 31 28 19 26 34 37
Djibouti * * * * * * * *
Dominica * * * * * * * *
Dominican Republic * * * * * * * *
East Timor * * * * * * * 1
Ecuador * * * * * * * *
Egypt * * * * * * * *
El Salvador * * * * * * * *
Equatorial Guinea * * * * * * * *
Eritrea * * * * * * * *
Estonia * * * * * * * *
Ethiopia * * * * * * * *
Falkland Islands * * * * * * * *
Faroe Islands * * * * * * * *
Federated States of Micronesia * * * * * * * *
Fiji * * * * * * * *
Finland 5 6 8 7 6 9 14 12
France 71 95 132 133 81 115 140 120
French Guiana * * * * * * * *
French Polynesia * * * * * * * *
Gambia * * * * * * * *
Georgia * * * * * * * *
Germany 83 73 100 71 45 57 81 79
Ghana * * * * * * * *
Gibraltar 1 1 1 1 * 1 * *
Greece 1 1 1 1 1 1 2 3
Greenland * * * * * * * *
Grenada * * * * * * * *
Guadeloupe * * * * * * * *
Guatemala * * * * * * * *
Guernsey 9 8 8 5 5 10 12 21
Guinea * * * * * * * *
* Greater than zero but less than $500 million.
76
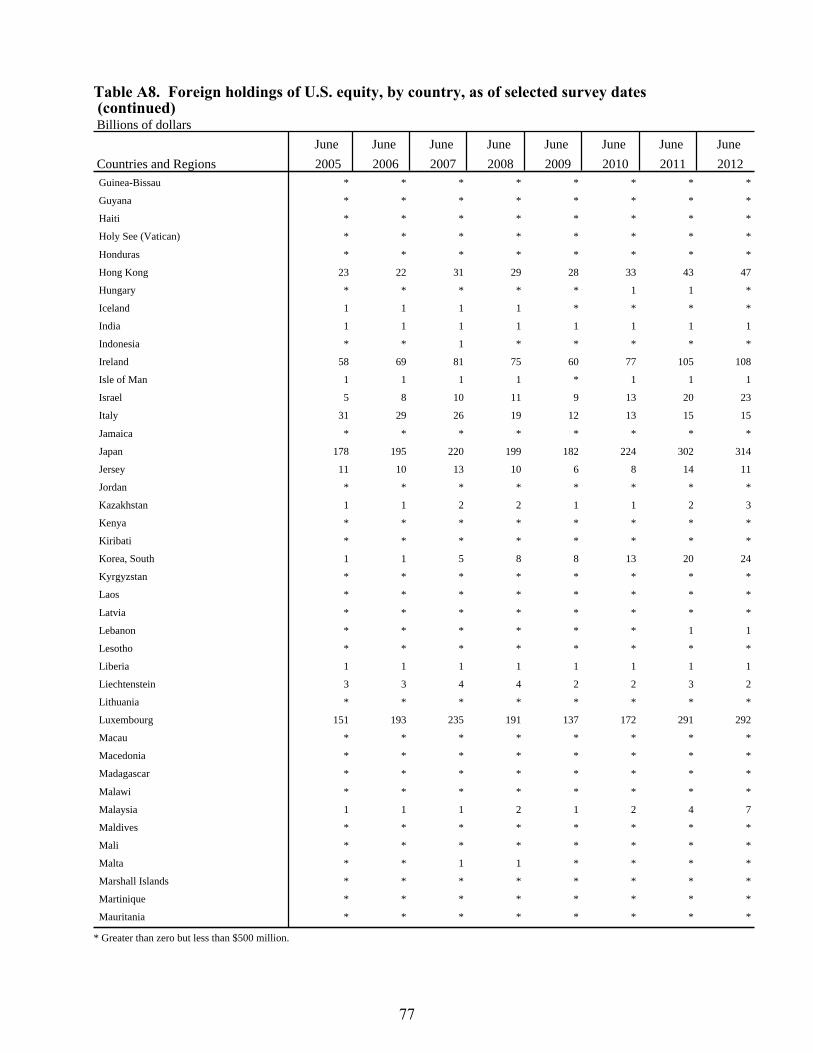
Table A8. Foreign holdings of U.S. equity, by country, as of selected survey dates (continued) Billions of dollars
June June June June June June June June
Countries and Regions 2005 2006 2007 2008 2009 2010 2011 2012 Guinea-Bissau * * * * * * * *
Guyana * * * * * * * *
Haiti * * * * * * * *
Holy See (Vatican) * * * * * * * *
Honduras * * * * * * * *
Hong Kong 23 22 31 29 28 33 43 47
Hungary * * * * * 1 1 *
Iceland 1 1 1 1 * * * *
India 1 1 1 1 1 1 1 1
Indonesia * * 1 * * * * *
Ireland 58 69 81 75 60 77 105 108
Isle of Man 1 1 1 1 * 1 1 1
Israel 5 8 10 11 9 13 20 23
Italy 31 29 26 19 12 13 15 15
Jamaica * * * * * * * *
Japan 178 195 220 199 182 224 302 314
Jersey 11 10 13 10 6 8 14 11
Jordan * * * * * * * *
Kazakhstan 1 1 2 2 1 1 2 3
Kenya * * * * * * * *
Kiribati * * * * * * * *
Korea, South 1 1 5 8 8 13 20 24
Kyrgyzstan * * * * * * * *
Laos * * * * * * * *
Latvia * * * * * * * *
Lebanon * * * * * * 1 1
Lesotho * * * * * * * *
Liberia 1 1 1 1 1 1 1 1
Liechtenstein 3 3 4 4 2 2 3 2
Lithuania * * * * * * * *
Luxembourg 151 193 235 191 137 172 291 292
Macau * * * * * * * *
Macedonia * * * * * * * *
Madagascar * * * * * * * *
Malawi * * * * * * * *
Malaysia 1 1 1 2 1 2 4 7
Maldives * * * * * * * *
Mali * * * * * * * *
Malta * * 1 1 * * * *
Marshall Islands * * * * * * * *
Martinique * * * * * * * *
Mauritania * * * * * * * *
* Greater than zero but less than $500 million.
77
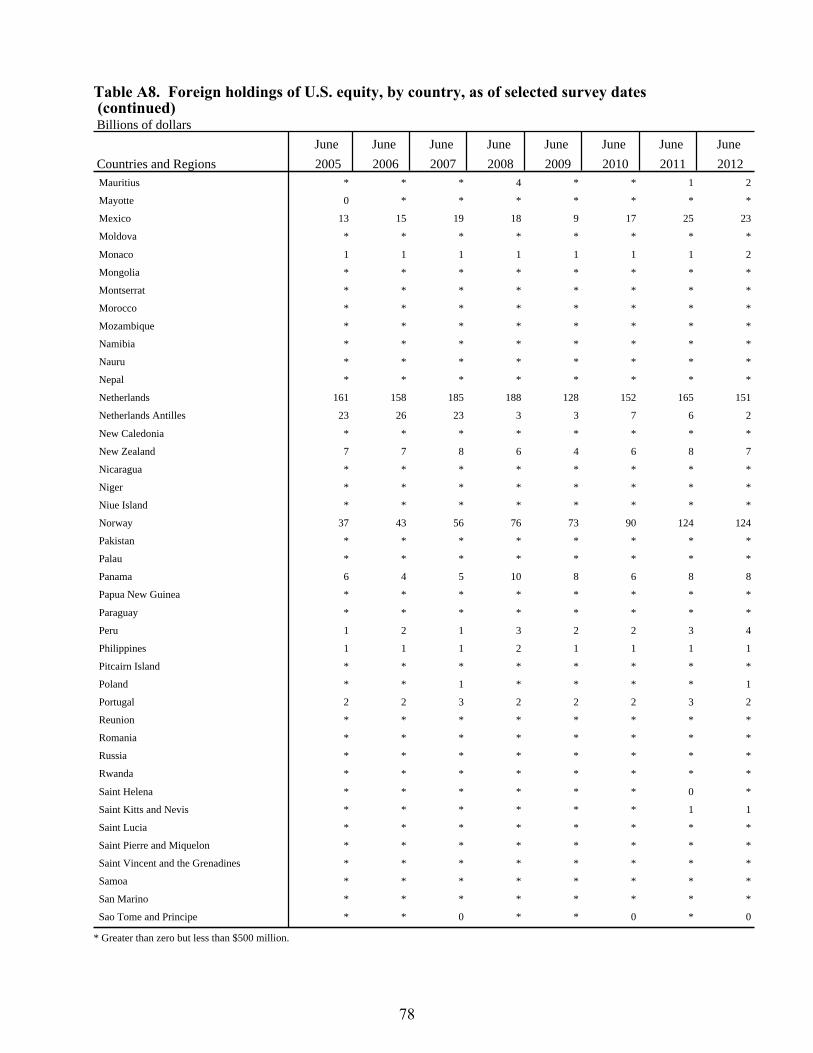
Table A8. Foreign holdings of U.S. equity, by country, as of selected survey dates (continued) Billions of dollars
June June June June June June June June
Countries and Regions 2005 2006 2007 2008 2009 2010 2011 2012 Mauritius * * * 4 * * 1 2
Mayotte 0 * * * * * * *
Mexico 13 15 19 18 9 17 25 23
Moldova * * * * * * * *
Monaco 1 1 1 1 1 1 1 2
Mongolia * * * * * * * *
Montserrat * * * * * * * *
Morocco * * * * * * * *
Mozambique * * * * * * * *
Namibia * * * * * * * *
Nauru * * * * * * * *
Nepal * * * * * * * *
Netherlands 161 158 185 188 128 152 165 151
Netherlands Antilles 23 26 23 3 3 7 6 2
New Caledonia * * * * * * * *
New Zealand 7 7 8 6 4 6 8 7
Nicaragua * * * * * * * *
Niger * * * * * * * *
Niue Island * * * * * * * *
Norway 37 43 56 76 73 90 124 124
Pakistan * * * * * * * *
Palau * * * * * * * *
Panama 6 4 5 10 8 6 8 8
Papua New Guinea * * * * * * * *
Paraguay * * * * * * * *
Peru 1 2 1 3 2 2 3 4
Philippines 1 1 1 2 1 1 1 1
Pitcairn Island * * * * * * * *
Poland * * 1 * * * * 1
Portugal 2 2 3 2 2 2 3 2
Reunion * * * * * * * *
Romania * * * * * * * *
Russia * * * * * * * *
Rwanda * * * * * * * *
Saint Helena * * * * * * 0 *
Saint Kitts and Nevis * * * * * * 1 1
Saint Lucia * * * * * * * *
Saint Pierre and Miquelon * * * * * * * *
Saint Vincent and the Grenadines * * * * * * * *
Samoa * * * * * * * *
San Marino * * * * * * * *
Sao Tome and Principe * * 0 * * 0 * 0
* Greater than zero but less than $500 million.
78
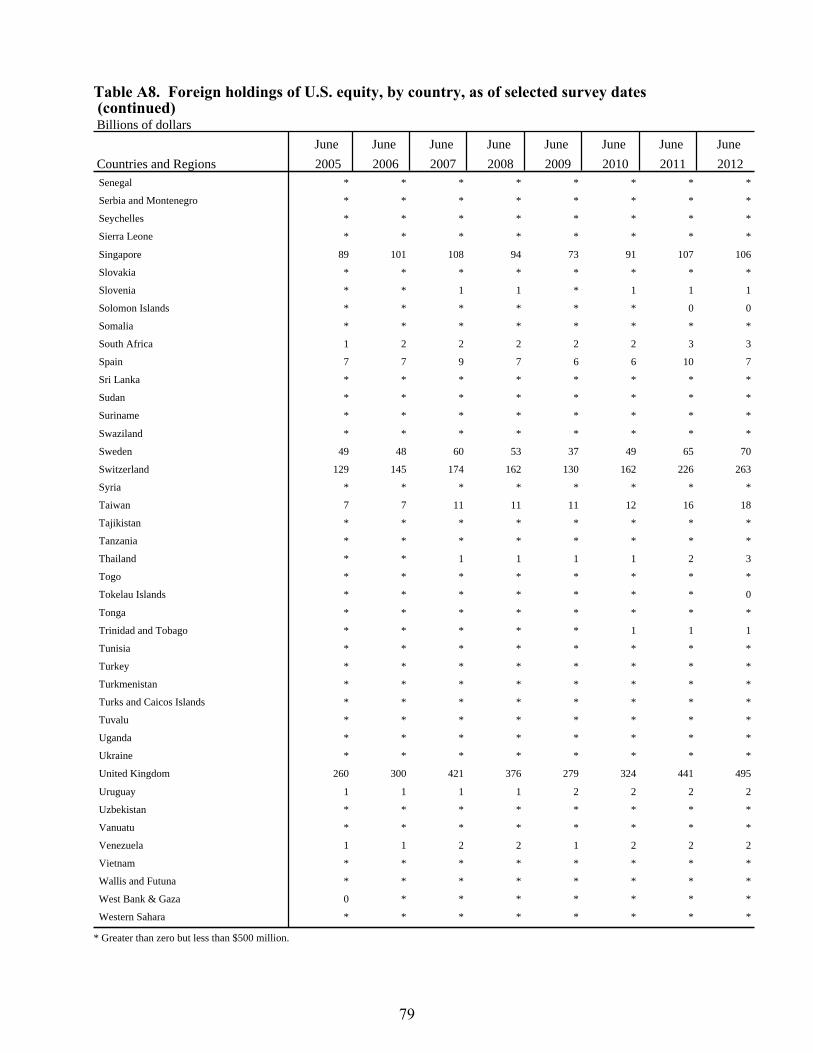
Table A8. Foreign holdings of U.S. equity, by country, as of selected survey dates (continued) Billions of dollars
June June June June June June June June
Countries and Regions 2005 2006 2007 2008 2009 2010 2011 2012 Senegal * * * * * * * *
Serbia and Montenegro * * * * * * * *
Seychelles * * * * * * * *
Sierra Leone * * * * * * * *
Singapore 89 101 108 94 73 91 107 106
Slovakia * * * * * * * *
Slovenia * * 1 1 * 1 1 1
Solomon Islands * * * * * * 0 0
Somalia * * * * * * * *
South Africa 1 2 2 2 2 2 3 3
Spain 7 7 9 7 6 6 10 7
Sri Lanka * * * * * * * *
Sudan * * * * * * * *
Suriname * * * * * * * *
Swaziland * * * * * * * *
Sweden 49 48 60 53 37 49 65 70
Switzerland 129 145 174 162 130 162 226 263
Syria * * * * * * * *
Taiwan 7 7 11 11 11 12 16 18
Tajikistan * * * * * * * *
Tanzania * * * * * * * *
Thailand * * 1 1 1 1 2 3
Togo * * * * * * * *
Tokelau Islands * * * * * * * 0
Tonga * * * * * * * *
Trinidad and Tobago * * * * * 1 1 1
Tunisia * * * * * * * *
Turkey * * * * * * * *
Turkmenistan * * * * * * * *
Turks and Caicos Islands * * * * * * * *
Tuvalu * * * * * * * *
Uganda * * * * * * * *
Ukraine * * * * * * * *
United Kingdom 260 300 421 376 279 324 441 495
Uruguay 1 1 1 1 2 2 2 2
Uzbekistan * * * * * * * *
Vanuatu * * * * * * * *
Venezuela 1 1 2 2 1 2 2 2
Vietnam * * * * * * * *
Wallis and Futuna * * * * * * * *
West Bank & Gaza 0 * * * * * * *
Western Sahara * * * * * * * *
* Greater than zero but less than $500 million.
79

Table A8. Foreign holdings of U.S. equity, by country, as of selected survey dates (continued) Billions of dollars
June June June June June June June June
Countries and Regions 2005 2006 2007 2008 2009 2010 2011 2012 Yemen * * * * * * * *
Zambia * * * * * * * *
Zimbabwe * * * * * * * *
International and Regional Organizations 2 3 3 3 6 5 3 4
African Oil Exporters2 1 * * * * * * *
Middle East oil-exporters3 82 111 139 141 110 128 188 226
Country Unknown 2 * * 1 2 1 2 *
Total 2,144 2,430 3,130 2,969 2,252 2,814 3,830 4,237
* Greater than zero but less than $500 million.
1. Excludes Hong Kong and Macau, which are reported separately.
2. Algeria, Gabon, Libya, and Nigeria.
3. Bahrain, Iran, Iraq, Kuwait, Oman, Qatar, Saudi Arabia, and the United Arab Emirates.
80
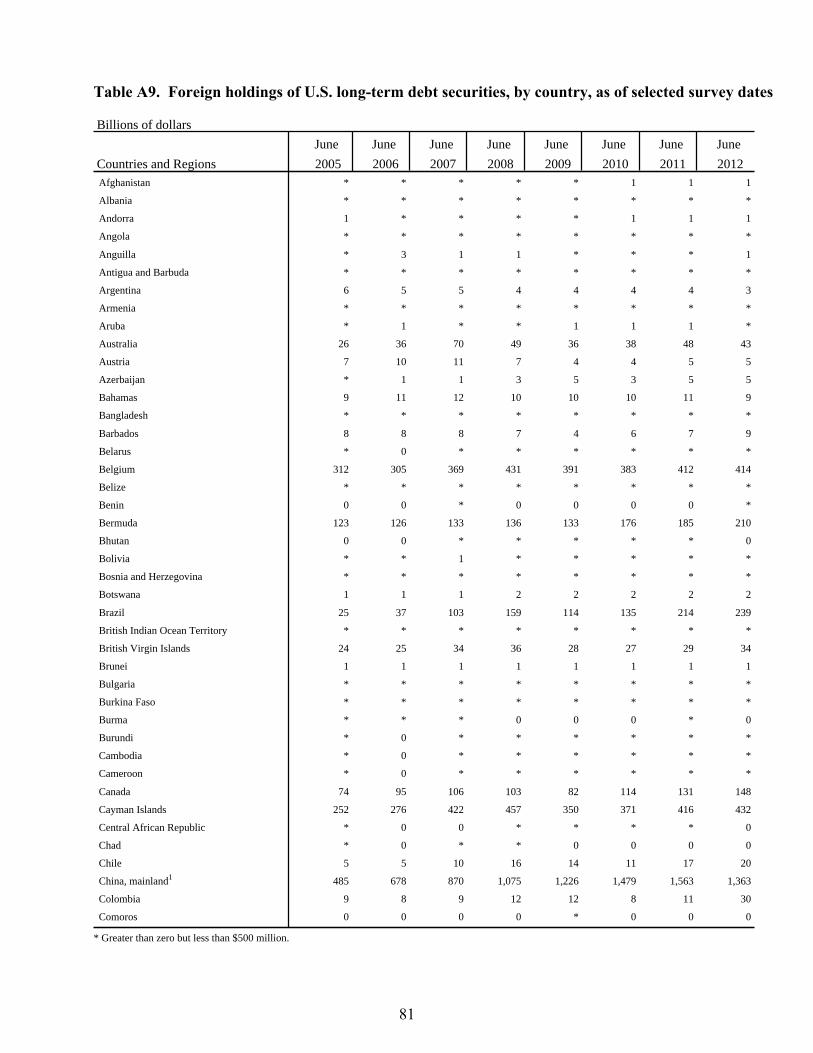
Table A9. Foreign holdings of U.S. long-term debt securities, by country, as of selected survey dates
Billions of dollars
June June June June June June June June
Countries and Regions 2005 2006 2007 2008 2009 2010 2011 2012 Afghanistan * * * * * 1 1 1
Albania * * * * * * * *
Andorra 1 * * * * 1 1 1
Angola * * * * * * * *
Anguilla * 3 1 1 * * * 1
Antigua and Barbuda * * * * * * * *
Argentina 6 5 5 4 4 4 4 3
Armenia * * * * * * * *
Aruba * 1 * * 1 1 1 *
Australia 26 36 70 49 36 38 48 43
Austria 7 10 11 7 4 4 5 5
Azerbaijan * 1 1 3 5 3 5 5
Bahamas 9 11 12 10 10 10 11 9
Bangladesh * * * * * * * *
Barbados 8 8 8 7 4 6 7 9
Belarus * 0 * * * * * *
Belgium 312 305 369 431 391 383 412 414
Belize * * * * * * * *
Benin 0 0 * 0 0 0 0 *
Bermuda 123 126 133 136 133 176 185 210
Bhutan 0 0 * * * * * 0
Bolivia * * 1 * * * * *
Bosnia and Herzegovina * * * * * * * *
Botswana 1 1 1 2 2 2 2 2
Brazil 25 37 103 159 114 135 214 239
British Indian Ocean Territory * * * * * * * *
British Virgin Islands 24 25 34 36 28 27 29 34
Brunei 1 1 1 1 1 1 1 1
Bulgaria * * * * * * * *
Burkina Faso * * * * * * * *
Burma * * * 0 0 0 * 0
Burundi * 0 * * * * * *
Cambodia * 0 * * * * * *
Cameroon * 0 * * * * * *
Canada 74 95 106 103 82 114 131 148
Cayman Islands 252 276 422 457 350 371 416 432
Central African Republic * 0 0 * * * * 0
Chad * 0 * * 0 0 0 0
Chile 5 5 10 16 14 11 17 20
China, mainland1 485 678 870 1,075 1,226 1,479 1,563 1,363
Colombia 9 8 9 12 12 8 11 30
Comoros 0 0 0 0 * 0 0 0
* Greater than zero but less than $500 million.
81
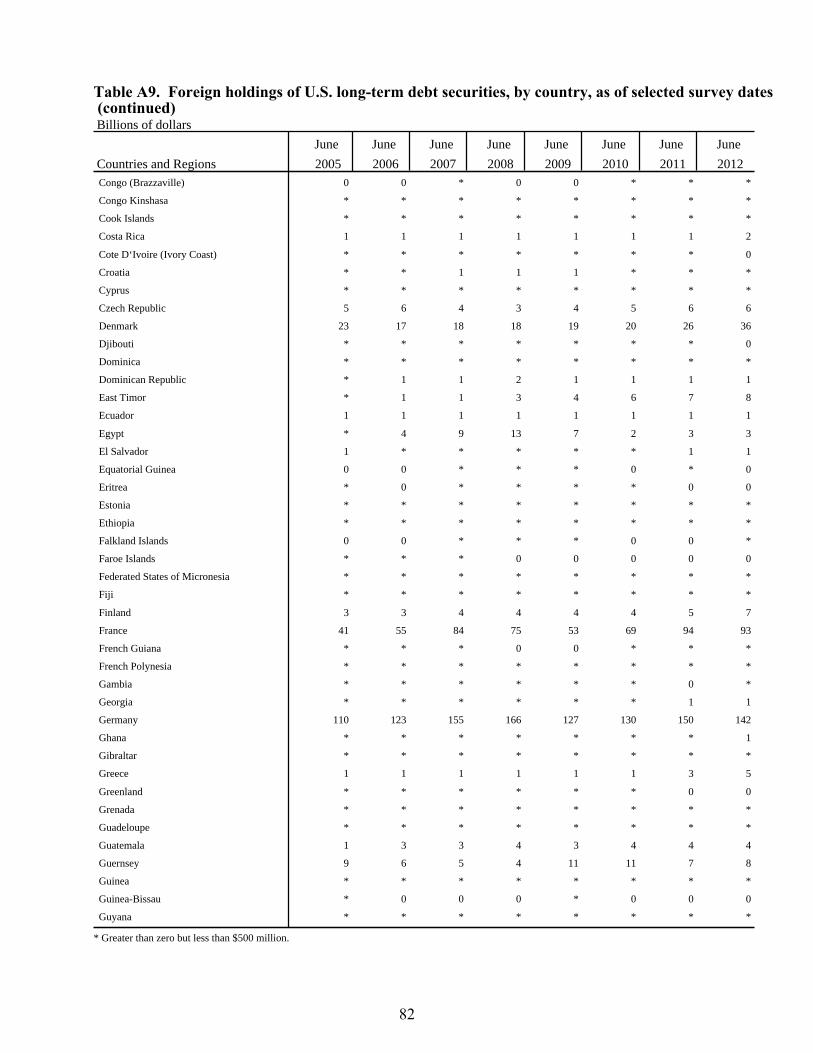
Table A9. Foreign holdings of U.S. long-term debt securities, by country, as of selected survey dates (continued) Billions of dollars
June June June June June June June June
Countries and Regions 2005 2006 2007 2008 2009 2010 2011 2012 Congo (Brazzaville) 0 0 * 0 0 * * *
Congo Kinshasa * * * * * * * *
Cook Islands * * * * * * * *
Costa Rica 1 1 1 1 1 1 1 2
Cote D‘Ivoire (Ivory Coast) * * * * * * * 0
Croatia * * 1 1 1 * * *
Cyprus * * * * * * * *
Czech Republic 5 6 4 3 4 5 6 6
Denmark 23 17 18 18 19 20 26 36
Djibouti * * * * * * * 0
Dominica * * * * * * * *
Dominican Republic * 1 1 2 1 1 1 1
East Timor * 1 1 3 4 6 7 8
Ecuador 1 1 1 1 1 1 1 1
Egypt * 4 9 13 7 2 3 3
El Salvador 1 * * * * * 1 1
Equatorial Guinea 0 0 * * * 0 * 0
Eritrea * 0 * * * * 0 0
Estonia * * * * * * * *
Ethiopia * * * * * * * *
Falkland Islands 0 0 * * * 0 0 *
Faroe Islands * * * 0 0 0 0 0
Federated States of Micronesia * * * * * * * *
Fiji * * * * * * * *
Finland 3 3 4 4 4 4 5 7
France 41 55 84 75 53 69 94 93
French Guiana * * * 0 0 * * *
French Polynesia * * * * * * * *
Gambia * * * * * * 0 *
Georgia * * * * * * 1 1
Germany 110 123 155 166 127 130 150 142
Ghana * * * * * * * 1
Gibraltar * * * * * * * *
Greece 1 1 1 1 1 1 3 5
Greenland * * * * * * 0 0
Grenada * * * * * * * *
Guadeloupe * * * * * * * *
Guatemala 1 3 3 4 3 4 4 4
Guernsey 9 6 5 4 11 11 7 8
Guinea * * * * * * * *
Guinea-Bissau * 0 0 0 * 0 0 0
Guyana * * * * * * * *
* Greater than zero but less than $500 million.
82
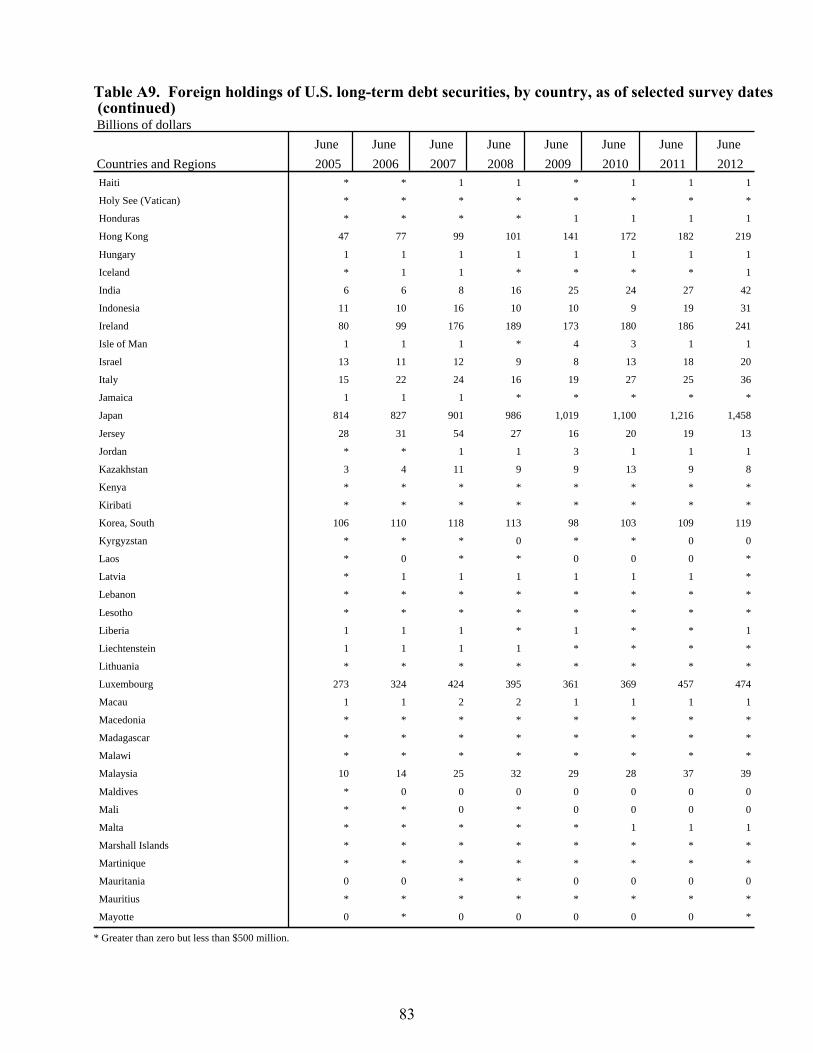
Table A9. Foreign holdings of U.S. long-term debt securities, by country, as of selected survey dates (continued) Billions of dollars
June June June June June June June June
Countries and Regions 2005 2006 2007 2008 2009 2010 2011 2012 Haiti * * 1 1 * 1 1 1
Holy See (Vatican) * * * * * * * *
Honduras * * * * 1 1 1 1
Hong Kong 47 77 99 101 141 172 182 219
Hungary 1 1 1 1 1 1 1 1
Iceland * 1 1 * * * * 1
India 6 6 8 16 25 24 27 42
Indonesia 11 10 16 10 10 9 19 31
Ireland 80 99 176 189 173 180 186 241
Isle of Man 1 1 1 * 4 3 1 1
Israel 13 11 12 9 8 13 18 20
Italy 15 22 24 16 19 27 25 36
Jamaica 1 1 1 * * * * *
Japan 814 827 901 986 1,019 1,100 1,216 1,458
Jersey 28 31 54 27 16 20 19 13
Jordan * * 1 1 3 1 1 1
Kazakhstan 3 4 11 9 9 13 9 8
Kenya * * * * * * * *
Kiribati * * * * * * * *
Korea, South 106 110 118 113 98 103 109 119
Kyrgyzstan * * * 0 * * 0 0
Laos * 0 * * 0 0 0 *
Latvia * 1 1 1 1 1 1 *
Lebanon * * * * * * * *
Lesotho * * * * * * * *
Liberia 1 1 1 * 1 * * 1
Liechtenstein 1 1 1 1 * * * *
Lithuania * * * * * * * *
Luxembourg 273 324 424 395 361 369 457 474
Macau 1 1 2 2 1 1 1 1
Macedonia * * * * * * * *
Madagascar * * * * * * * *
Malawi * * * * * * * *
Malaysia 10 14 25 32 29 28 37 39
Maldives * 0 0 0 0 0 0 0
Mali * * 0 * 0 0 0 0
Malta * * * * * 1 1 1
Marshall Islands * * * * * * * *
Martinique * * * * * * * *
Mauritania 0 0 * * 0 0 0 0
Mauritius * * * * * * * *
Mayotte 0 * 0 0 0 0 0 *
* Greater than zero but less than $500 million.
83
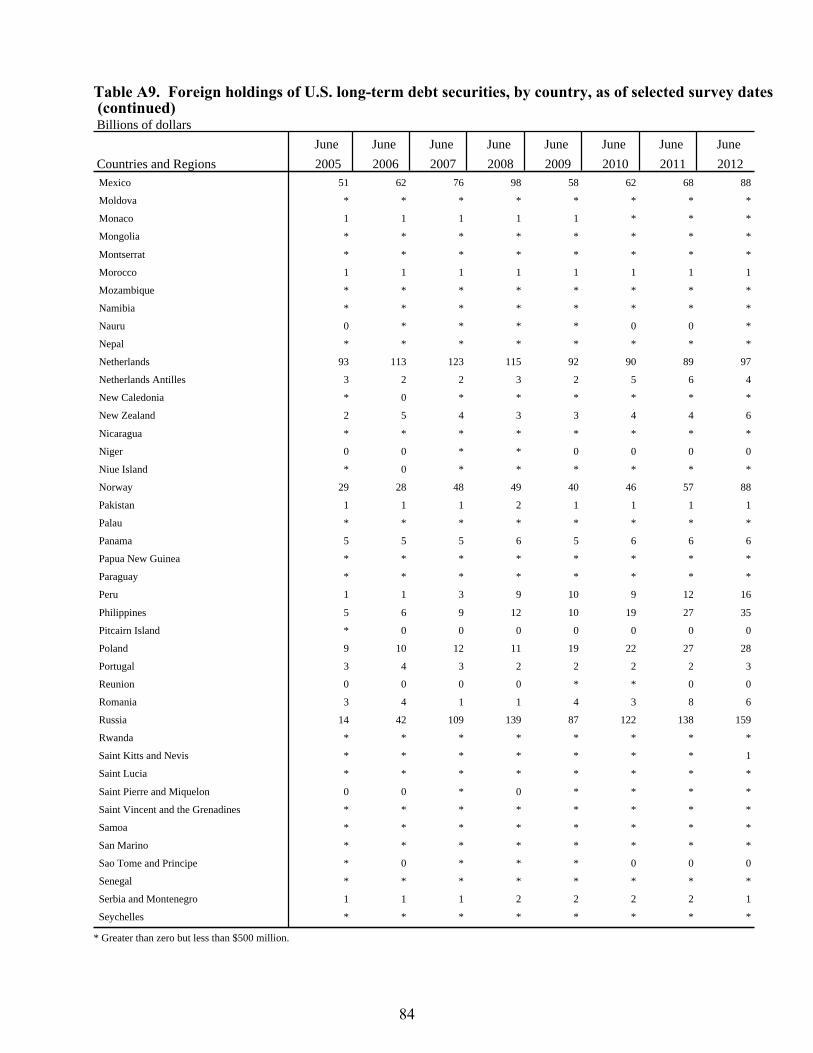
Table A9. Foreign holdings of U.S. long-term debt securities, by country, as of selected survey dates (continued) Billions of dollars
June June June June June June June June
Countries and Regions 2005 2006 2007 2008 2009 2010 2011 2012 Mexico 51 62 76 98 58 62 68 88
Moldova * * * * * * * *
Monaco 1 1 1 1 1 * * *
Mongolia * * * * * * * *
Montserrat * * * * * * * *
Morocco 1 1 1 1 1 1 1 1
Mozambique * * * * * * * *
Namibia * * * * * * * *
Nauru 0 * * * * 0 0 *
Nepal * * * * * * * *
Netherlands 93 113 123 115 92 90 89 97
Netherlands Antilles 3 2 2 3 2 5 6 4
New Caledonia * 0 * * * * * *
New Zealand 2 5 4 3 3 4 4 6
Nicaragua * * * * * * * *
Niger 0 0 * * 0 0 0 0
Niue Island * 0 * * * * * *
Norway 29 28 48 49 40 46 57 88
Pakistan 1 1 1 2 1 1 1 1
Palau * * * * * * * *
Panama 5 5 5 6 5 6 6 6
Papua New Guinea * * * * * * * *
Paraguay * * * * * * * *
Peru 1 1 3 9 10 9 12 16
Philippines 5 6 9 12 10 19 27 35
Pitcairn Island * 0 0 0 0 0 0 0
Poland 9 10 12 11 19 22 27 28
Portugal 3 4 3 2 2 2 2 3
Reunion 0 0 0 0 * * 0 0
Romania 3 4 1 1 4 3 8 6
Russia 14 42 109 139 87 122 138 159
Rwanda * * * * * * * *
Saint Kitts and Nevis * * * * * * * 1
Saint Lucia * * * * * * * *
Saint Pierre and Miquelon 0 0 * 0 * * * *
Saint Vincent and the Grenadines * * * * * * * *
Samoa * * * * * * * *
San Marino * * * * * * * *
Sao Tome and Principe * 0 * * * 0 0 0
Senegal * * * * * * * *
Serbia and Montenegro 1 1 1 2 2 2 2 1
Seychelles * * * * * * * *
* Greater than zero but less than $500 million.
84
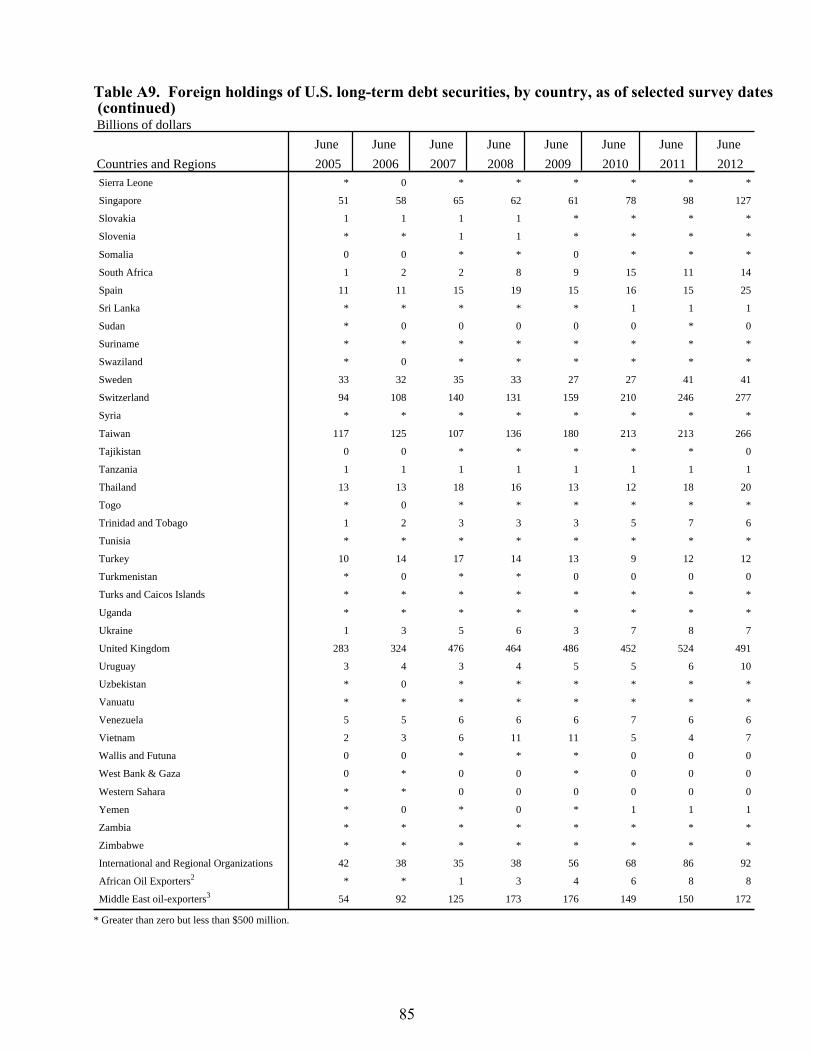
Table A9. Foreign holdings of U.S. long-term debt securities, by country, as of selected survey dates (continued) Billions of dollars
June June June June June June June June
Countries and Regions 2005 2006 2007 2008 2009 2010 2011 2012 Sierra Leone * 0 * * * * * *
Singapore 51 58 65 62 61 78 98 127
Slovakia 1 1 1 1 * * * *
Slovenia * * 1 1 * * * *
Somalia 0 0 * * 0 * * *
South Africa 1 2 2 8 9 15 11 14
Spain 11 11 15 19 15 16 15 25
Sri Lanka * * * * * 1 1 1
Sudan * 0 0 0 0 0 * 0
Suriname * * * * * * * *
Swaziland * 0 * * * * * *
Sweden 33 32 35 33 27 27 41 41
Switzerland 94 108 140 131 159 210 246 277
Syria * * * * * * * *
Taiwan 117 125 107 136 180 213 213 266
Tajikistan 0 0 * * * * * 0
Tanzania 1 1 1 1 1 1 1 1
Thailand 13 13 18 16 13 12 18 20
Togo * 0 * * * * * *
Trinidad and Tobago 1 2 3 3 3 5 7 6
Tunisia * * * * * * * *
Turkey 10 14 17 14 13 9 12 12
Turkmenistan * 0 * * 0 0 0 0
Turks and Caicos Islands * * * * * * * *
Uganda * * * * * * * *
Ukraine 1 3 5 6 3 7 8 7
United Kingdom 283 324 476 464 486 452 524 491
Uruguay 3 4 3 4 5 5 6 10
Uzbekistan * 0 * * * * * *
Vanuatu * * * * * * * *
Venezuela 5 5 6 6 6 7 6 6
Vietnam 2 3 6 11 11 5 4 7
Wallis and Futuna 0 0 * * * 0 0 0
West Bank & Gaza 0 * 0 0 * 0 0 0
Western Sahara * * 0 0 0 0 0 0
Yemen * 0 * 0 * 1 1 1
Zambia * * * * * * * *
Zimbabwe * * * * * * * *
International and Regional Organizations 42 38 35 38 56 68 86 92
African Oil Exporters2 * * 1 3 4 6 8 8
Middle East oil-exporters3 54 92 125 173 176 149 150 172
* Greater than zero but less than $500 million.
85
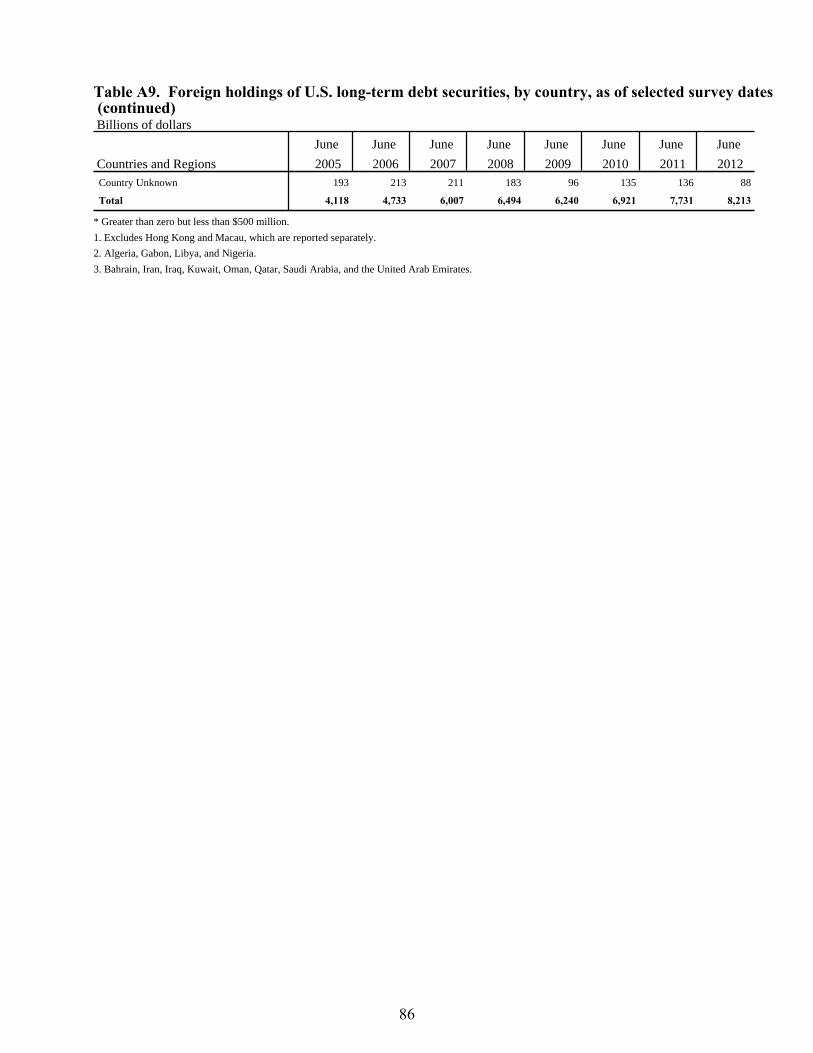
Table A9. Foreign holdings of U.S. long-term debt securities, by country, as of selected survey dates (continued) Billions of dollars
June June June June June June June June
Countries and Regions 2005 2006 2007 2008 2009 2010 2011 2012 Country Unknown 193 213 211 183 96 135 136 88
Total 4,118 4,733 6,007 6,494 6,240 6,921 7,731 8,213
* Greater than zero but less than $500 million.
1. Excludes Hong Kong and Macau, which are reported separately.
2. Algeria, Gabon, Libya, and Nigeria.
3. Bahrain, Iran, Iraq, Kuwait, Oman, Qatar, Saudi Arabia, and the United Arab Emirates.
86
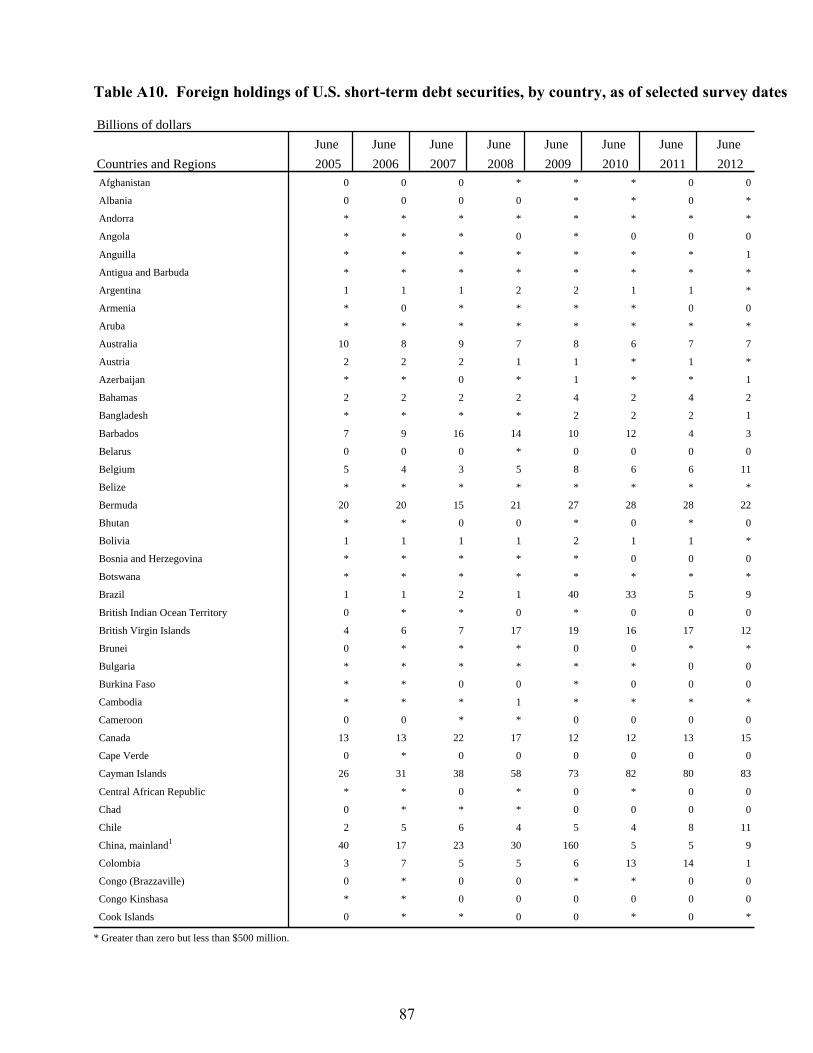
Table A10. Foreign holdings of U.S. short-term debt securities, by country, as of selected survey dates
Billions of dollars
June June June June June June June June
Countries and Regions 2005 2006 2007 2008 2009 2010 2011 2012 Afghanistan 0 0 0 * * * 0 0
Albania 0 0 0 0 * * 0 *
Andorra * * * * * * * *
Angola * * * 0 * 0 0 0
Anguilla * * * * * * * 1
Antigua and Barbuda * * * * * * * *
Argentina 1 1 1 2 2 1 1 *
Armenia * 0 * * * * 0 0
Aruba * * * * * * * *
Australia 10 8 9 7 8 6 7 7
Austria 2 2 2 1 1 * 1 *
Azerbaijan * * 0 * 1 * * 1
Bahamas 2 2 2 2 4 2 4 2
Bangladesh * * * * 2 2 2 1
Barbados 7 9 16 14 10 12 4 3
Belarus 0 0 0 * 0 0 0 0
Belgium 5 4 3 5 8 6 6 11
Belize * * * * * * * *
Bermuda 20 20 15 21 27 28 28 22
Bhutan * * 0 0 * 0 * 0
Bolivia 1 1 1 1 2 1 1 *
Bosnia and Herzegovina * * * * * 0 0 0
Botswana * * * * * * * *
Brazil 1 1 2 1 40 33 5 9
British Indian Ocean Territory 0 * * 0 * 0 0 0
British Virgin Islands 4 6 7 17 19 16 17 12
Brunei 0 * * * 0 0 * *
Bulgaria * * * * * * 0 0
Burkina Faso * * 0 0 * 0 0 0
Cambodia * * * 1 * * * *
Cameroon 0 0 * * 0 0 0 0
Canada 13 13 22 17 12 12 13 15
Cape Verde 0 * 0 0 0 0 0 0
Cayman Islands 26 31 38 58 73 82 80 83
Central African Republic * * 0 * 0 * 0 0
Chad 0 * * * 0 0 0 0
Chile 2 5 6 4 5 4 8 11
China, mainland1 40 17 23 30 160 5 5 9
Colombia 3 7 5 5 6 13 14 1
Congo (Brazzaville) 0 * 0 0 * * 0 0
Congo Kinshasa * * 0 0 0 0 0 0
Cook Islands 0 * * 0 0 * 0 *
* Greater than zero but less than $500 million.
87
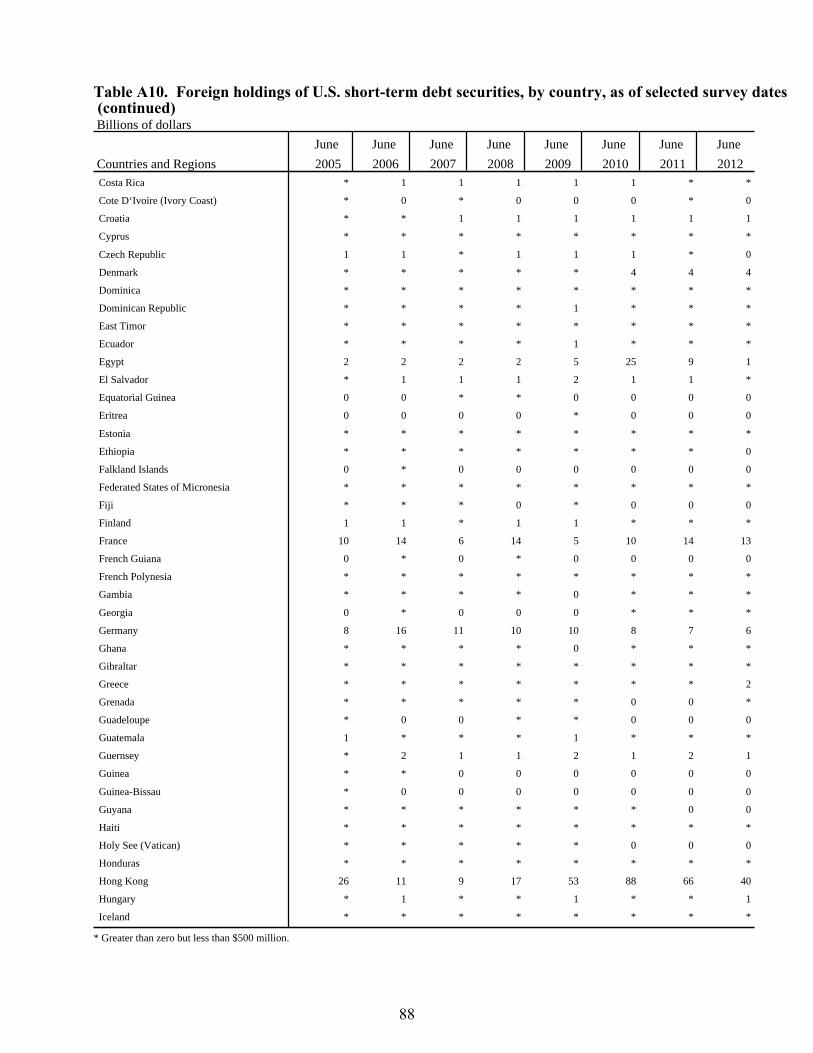
Table A10. Foreign holdings of U.S. short-term debt securities, by country, as of selected survey dates (continued) Billions of dollars
June June June June June June June June
Countries and Regions 2005 2006 2007 2008 2009 2010 2011 2012 Costa Rica * 1 1 1 1 1 * *
Cote D‘Ivoire (Ivory Coast) * 0 * 0 0 0 * 0
Croatia * * 1 1 1 1 1 1
Cyprus * * * * * * * *
Czech Republic 1 1 * 1 1 1 * 0
Denmark * * * * * 4 4 4
Dominica * * * * * * * *
Dominican Republic * * * * 1 * * *
East Timor * * * * * * * *
Ecuador * * * * 1 * * *
Egypt 2 2 2 2 5 25 9 1
El Salvador * 1 1 1 2 1 1 *
Equatorial Guinea 0 0 * * 0 0 0 0
Eritrea 0 0 0 0 * 0 0 0
Estonia * * * * * * * *
Ethiopia * * * * * * * 0
Falkland Islands 0 * 0 0 0 0 0 0
Federated States of Micronesia * * * * * * * *
Fiji * * * 0 * 0 0 0
Finland 1 1 * 1 1 * * *
France 10 14 6 14 5 10 14 13
French Guiana 0 * 0 * 0 0 0 0
French Polynesia * * * * * * * *
Gambia * * * * 0 * * *
Georgia 0 * 0 0 0 * * *
Germany 8 16 11 10 10 8 7 6
Ghana * * * * 0 * * *
Gibraltar * * * * * * * *
Greece * * * * * * * 2
Grenada * * * * * 0 0 *
Guadeloupe * 0 0 * * 0 0 0
Guatemala 1 * * * 1 * * *
Guernsey * 2 1 1 2 1 2 1
Guinea * * 0 0 0 0 0 0
Guinea-Bissau * 0 0 0 0 0 0 0
Guyana * * * * * * 0 0
Haiti * * * * * * * *
Holy See (Vatican) * * * * * 0 0 0
Honduras * * * * * * * *
Hong Kong 26 11 9 17 53 88 66 40
Hungary * 1 * * 1 * * 1
Iceland * * * * * * * *
* Greater than zero but less than $500 million.
88
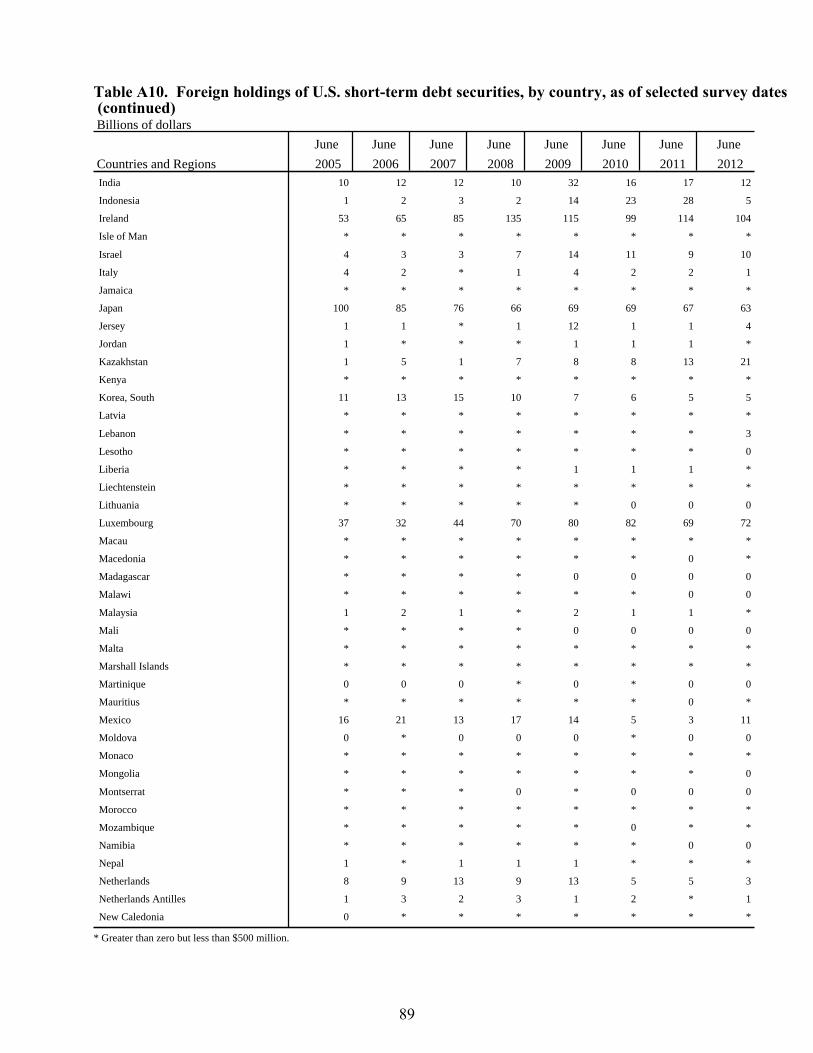
Table A10. Foreign holdings of U.S. short-term debt securities, by country, as of selected survey dates (continued) Billions of dollars
June June June June June June June June
Countries and Regions 2005 2006 2007 2008 2009 2010 2011 2012 India 10 12 12 10 32 16 17 12
Indonesia 1 2 3 2 14 23 28 5
Ireland 53 65 85 135 115 99 114 104
Isle of Man * * * * * * * *
Israel 4 3 3 7 14 11 9 10
Italy 4 2 * 1 4 2 2 1
Jamaica * * * * * * * *
Japan 100 85 76 66 69 69 67 63
Jersey 1 1 * 1 12 1 1 4
Jordan 1 * * * 1 1 1 *
Kazakhstan 1 5 1 7 8 8 13 21
Kenya * * * * * * * *
Korea, South 11 13 15 10 7 6 5 5
Latvia * * * * * * * *
Lebanon * * * * * * * 3
Lesotho * * * * * * * 0
Liberia * * * * 1 1 1 *
Liechtenstein * * * * * * * *
Lithuania * * * * * 0 0 0
Luxembourg 37 32 44 70 80 82 69 72
Macau * * * * * * * *
Macedonia * * * * * * 0 *
Madagascar * * * * 0 0 0 0
Malawi * * * * * * 0 0
Malaysia 1 2 1 * 2 1 1 *
Mali * * * * 0 0 0 0
Malta * * * * * * * *
Marshall Islands * * * * * * * *
Martinique 0 0 0 * 0 * 0 0
Mauritius * * * * * * 0 *
Mexico 16 21 13 17 14 5 3 11
Moldova 0 * 0 0 0 * 0 0
Monaco * * * * * * * *
Mongolia * * * * * * * 0
Montserrat * * * 0 * 0 0 0
Morocco * * * * * * * *
Mozambique * * * * * 0 * *
Namibia * * * * * * 0 0
Nepal 1 * 1 1 1 * * *
Netherlands 8 9 13 9 13 5 5 3
Netherlands Antilles 1 3 2 3 1 2 * 1
New Caledonia 0 * * * * * * *
* Greater than zero but less than $500 million.
89
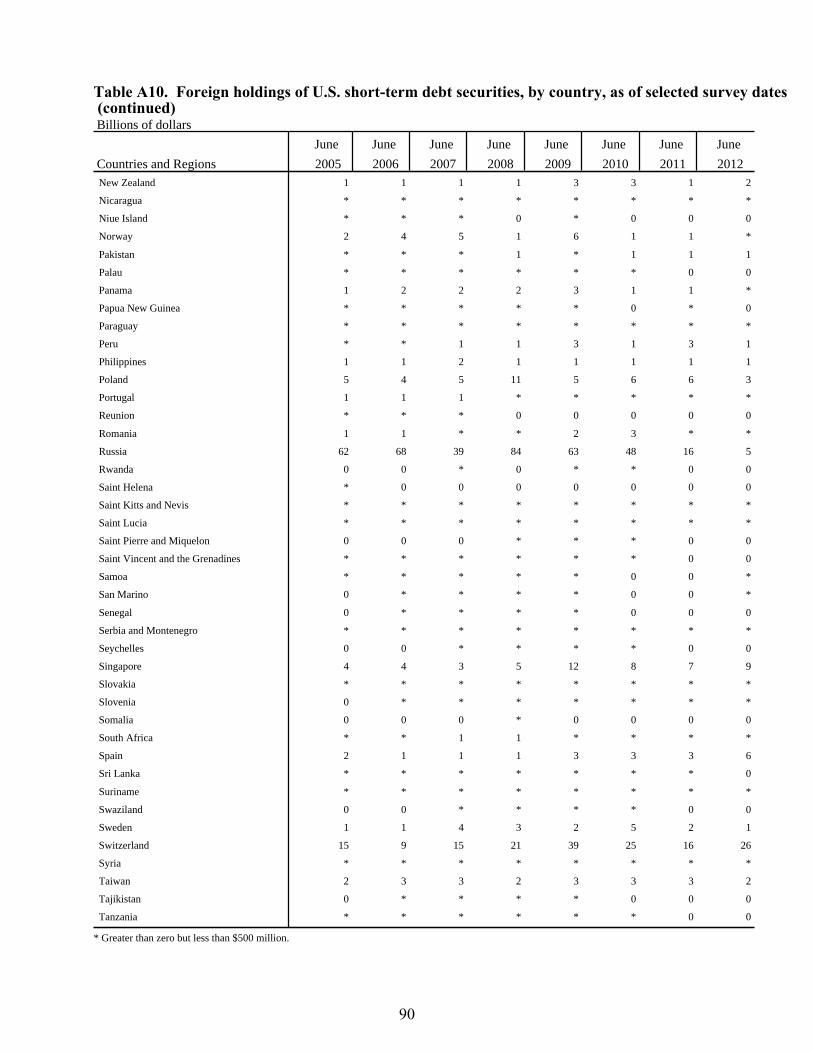
Table A10. Foreign holdings of U.S. short-term debt securities, by country, as of selected survey dates (continued) Billions of dollars
June June June June June June June June
Countries and Regions 2005 2006 2007 2008 2009 2010 2011 2012 New Zealand 1 1 1 1 3 3 1 2
Nicaragua * * * * * * * *
Niue Island * * * 0 * 0 0 0
Norway 2 4 5 1 6 1 1 *
Pakistan * * * 1 * 1 1 1
Palau * * * * * * 0 0
Panama 1 2 2 2 3 1 1 *
Papua New Guinea * * * * * 0 * 0
Paraguay * * * * * * * *
Peru * * 1 1 3 1 3 1
Philippines 1 1 2 1 1 1 1 1
Poland 5 4 5 11 5 6 6 3
Portugal 1 1 1 * * * * *
Reunion * * * 0 0 0 0 0
Romania 1 1 * * 2 3 * *
Russia 62 68 39 84 63 48 16 5
Rwanda 0 0 * 0 * * 0 0
Saint Helena * 0 0 0 0 0 0 0
Saint Kitts and Nevis * * * * * * * *
Saint Lucia * * * * * * * *
Saint Pierre and Miquelon 0 0 0 * * * 0 0
Saint Vincent and the Grenadines * * * * * * 0 0
Samoa * * * * * 0 0 *
San Marino 0 * * * * 0 0 *
Senegal 0 * * * * 0 0 0
Serbia and Montenegro * * * * * * * *
Seychelles 0 0 * * * * 0 0
Singapore 4 4 3 5 12 8 7 9
Slovakia * * * * * * * *
Slovenia 0 * * * * * * *
Somalia 0 0 0 * 0 0 0 0
South Africa * * 1 1 * * * *
Spain 2 1 1 1 3 3 3 6
Sri Lanka * * * * * * * 0
Suriname * * * * * * * *
Swaziland 0 0 * * * * 0 0
Sweden 1 1 4 3 2 5 2 1
Switzerland 15 9 15 21 39 25 16 26
Syria * * * * * * * *
Taiwan 2 3 3 2 3 3 3 2
Tajikistan 0 * * * * 0 0 0
Tanzania * * * * * * 0 0
* Greater than zero but less than $500 million.
90
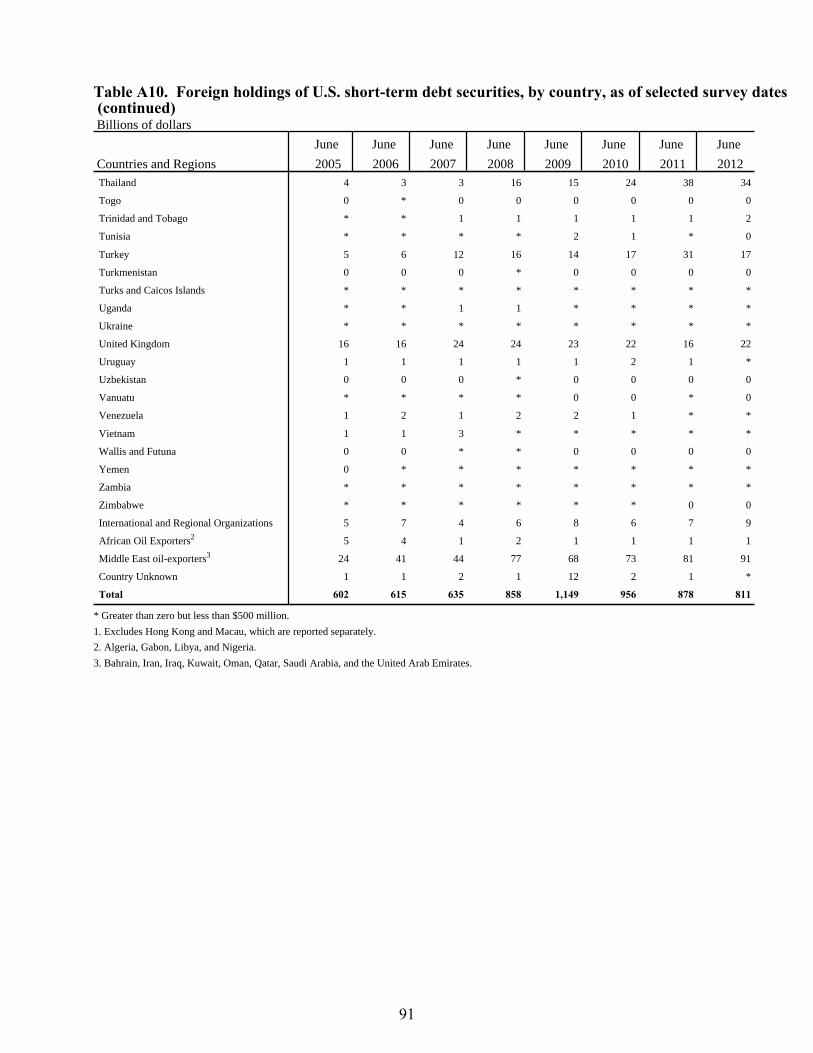
Table A10. Foreign holdings of U.S. short-term debt securities, by country, as of selected survey dates (continued) Billions of dollars
June June June June June June June June
Countries and Regions 2005 2006 2007 2008 2009 2010 2011 2012 Thailand 4 3 3 16 15 24 38 34
Togo 0 * 0 0 0 0 0 0
Trinidad and Tobago * * 1 1 1 1 1 2
Tunisia * * * * 2 1 * 0
Turkey 5 6 12 16 14 17 31 17
Turkmenistan 0 0 0 * 0 0 0 0
Turks and Caicos Islands * * * * * * * *
Uganda * * 1 1 * * * *
Ukraine * * * * * * * *
United Kingdom 16 16 24 24 23 22 16 22
Uruguay 1 1 1 1 1 2 1 *
Uzbekistan 0 0 0 * 0 0 0 0
Vanuatu * * * * 0 0 * 0
Venezuela 1 2 1 2 2 1 * *
Vietnam 1 1 3 * * * * *
Wallis and Futuna 0 0 * * 0 0 0 0
Yemen 0 * * * * * * *
Zambia * * * * * * * *
Zimbabwe * * * * * * 0 0
International and Regional Organizations 5 7 4 6 8 6 7 9
African Oil Exporters2 5 4 1 2 1 1 1 1
Middle East oil-exporters3 24 41 44 77 68 73 81 91
Country Unknown 1 1 2 1 12 2 1 *
Total 602 615 635 858 1,149 956 878 811
* Greater than zero but less than $500 million.
1. Excludes Hong Kong and Macau, which are reported separately.
2. Algeria, Gabon, Libya, and Nigeria.
3. Bahrain, Iran, Iraq, Kuwait, Oman, Qatar, Saudi Arabia, and the United Arab Emirates.
91
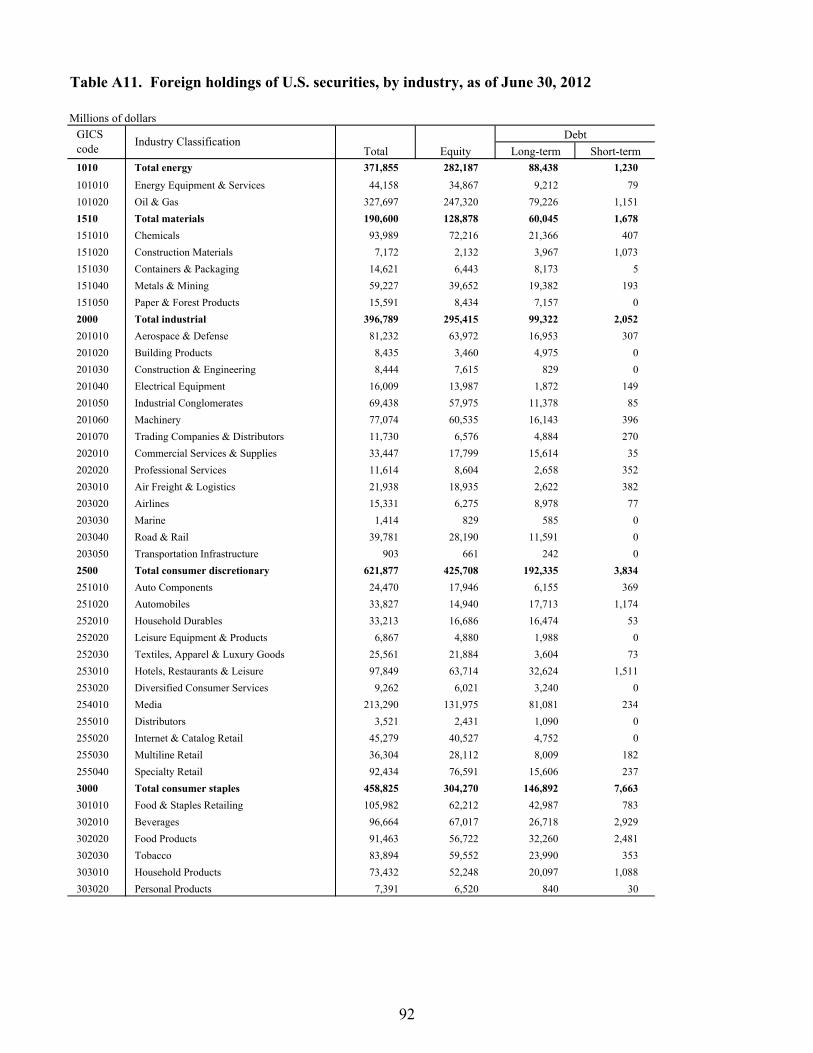
Millions of dollars
Long-term Short-term1010 Total energy 371,855 282,187 88,438 1,230101010 Energy Equipment & Services 44,158 34,867 9,212 79101020 Oil & Gas 327,697 247,320 79,226 1,1511510 Total materials 190,600 128,878 60,045 1,678151010 Chemicals 93,989 72,216 21,366 407151020 Construction Materials 7,172 2,132 3,967 1,073151030 Containers & Packaging 14,621 6,443 8,173 5151040 Metals & Mining 59,227 39,652 19,382 193151050 Paper & Forest Products 15,591 8,434 7,157 02000 Total industrial 396,789 295,415 99,322 2,052201010 Aerospace & Defense 81,232 63,972 16,953 307201020 Building Products 8,435 3,460 4,975 0201030 Construction & Engineering 8,444 7,615 829 0201040 Electrical Equipment 16,009 13,987 1,872 149201050 Industrial Conglomerates 69,438 57,975 11,378 85201060 Machinery 77,074 60,535 16,143 396201070 Trading Companies & Distributors 11,730 6,576 4,884 270202010 Commercial Services & Supplies 33,447 17,799 15,614 35202020 Professional Services 11,614 8,604 2,658 352203010 Air Freight & Logistics 21,938 18,935 2,622 382203020 Airlines 15,331 6,275 8,978 77203030 Marine 1,414 829 585 0203040 Road & Rail 39,781 28,190 11,591 0203050 Transportation Infrastructure 903 661 242 02500 Total consumer discretionary 621,877 425,708 192,335 3,834251010 Auto Components 24,470 17,946 6,155 369251020 Automobiles 33,827 14,940 17,713 1,174252010 Household Durables 33,213 16,686 16,474 53252020 Leisure Equipment & Products 6,867 4,880 1,988 0252030 Textiles, Apparel & Luxury Goods 25,561 21,884 3,604 73253010 Hotels, Restaurants & Leisure 97,849 63,714 32,624 1,511253020 Diversified Consumer Services 9,262 6,021 3,240 0254010 Media 213,290 131,975 81,081 234255010 Distributors 3,521 2,431 1,090 0255020 Internet & Catalog Retail 45,279 40,527 4,752 0255030 Multiline Retail 36,304 28,112 8,009 182255040 Specialty Retail 92,434 76,591 15,606 2373000 Total consumer staples 458,825 304,270 146,892 7,663301010 Food & Staples Retailing 105,982 62,212 42,987 783302010 Beverages 96,664 67,017 26,718 2,929302020 Food Products 91,463 56,722 32,260 2,481302030 Tobacco 83,894 59,552 23,990 353303010 Household Products 73,432 52,248 20,097 1,088303020 Personal Products 7,391 6,520 840 30
GICS code
Table A11. Foreign holdings of U.S. securities, by industry, as of June 30, 2012
Industry ClassificationTotal Equity
Debt
92
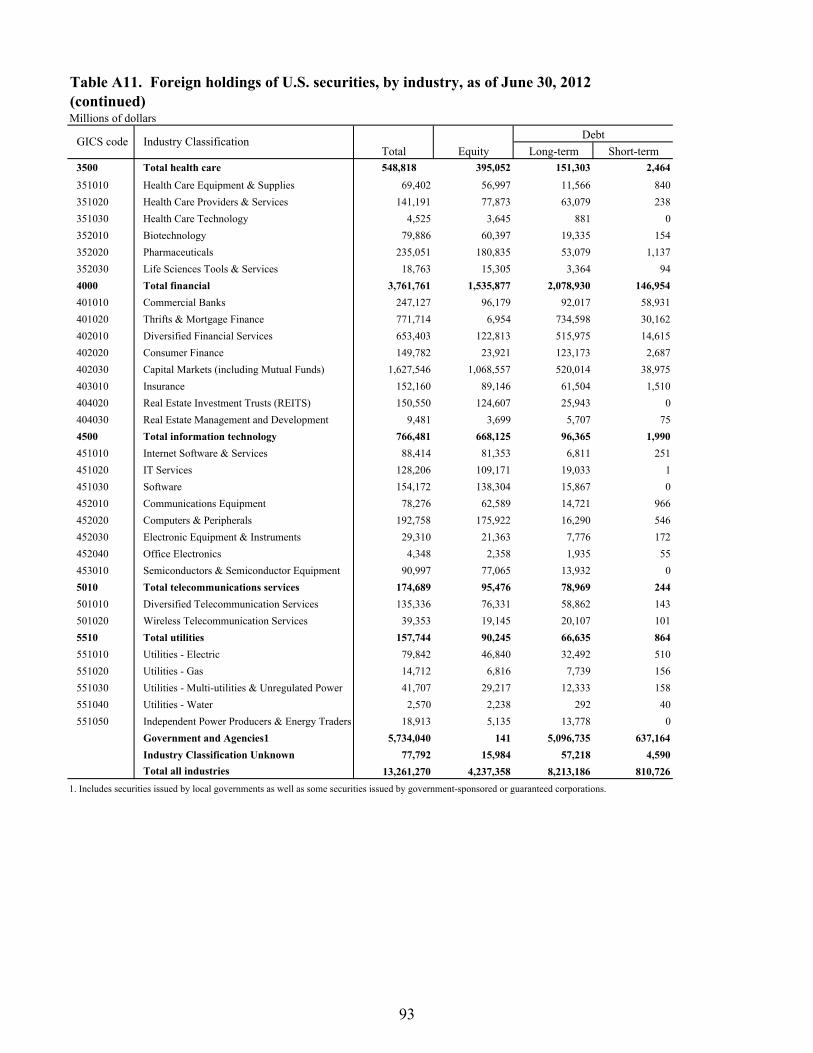
Millions of dollars
Long-term Short-term3500 Total health care 548,818 395,052 151,303 2,464351010 Health Care Equipment & Supplies 69,402 56,997 11,566 840351020 Health Care Providers & Services 141,191 77,873 63,079 238351030 Health Care Technology 4,525 3,645 881 0352010 Biotechnology 79,886 60,397 19,335 154352020 Pharmaceuticals 235,051 180,835 53,079 1,137352030 Life Sciences Tools & Services 18,763 15,305 3,364 944000 Total financial 3,761,761 1,535,877 2,078,930 146,954401010 Commercial Banks 247,127 96,179 92,017 58,931401020 Thrifts & Mortgage Finance 771,714 6,954 734,598 30,162402010 Diversified Financial Services 653,403 122,813 515,975 14,615402020 Consumer Finance 149,782 23,921 123,173 2,687402030 Capital Markets (including Mutual Funds) 1,627,546 1,068,557 520,014 38,975403010 Insurance 152,160 89,146 61,504 1,510404020 Real Estate Investment Trusts (REITS) 150,550 124,607 25,943 0404030 Real Estate Management and Development 9,481 3,699 5,707 754500 Total information technology 766,481 668,125 96,365 1,990451010 Internet Software & Services 88,414 81,353 6,811 251451020 IT Services 128,206 109,171 19,033 1451030 Software 154,172 138,304 15,867 0452010 Communications Equipment 78,276 62,589 14,721 966452020 Computers & Peripherals 192,758 175,922 16,290 546452030 Electronic Equipment & Instruments 29,310 21,363 7,776 172452040 Office Electronics 4,348 2,358 1,935 55453010 Semiconductors & Semiconductor Equipment 90,997 77,065 13,932 05010 Total telecommunications services 174,689 95,476 78,969 244501010 Diversified Telecommunication Services 135,336 76,331 58,862 143501020 Wireless Telecommunication Services 39,353 19,145 20,107 1015510 Total utilities 157,744 90,245 66,635 864551010 Utilities - Electric 79,842 46,840 32,492 510551020 Utilities - Gas 14,712 6,816 7,739 156551030 Utilities - Multi-utilities & Unregulated Power 41,707 29,217 12,333 158551040 Utilities - Water 2,570 2,238 292 40551050 Independent Power Producers & Energy Traders 18,913 5,135 13,778 0
Government and Agencies1 5,734,040 141 5,096,735 637,164Industry Classification Unknown 77,792 15,984 57,218 4,590Total all industries 13,261,270 4,237,358 8,213,186 810,726
1. Includes securities issued by local governments as well as some securities issued by government-sponsored or guaranteed corporations.
GICS code Industry Classification
Table A11. Foreign holdings of U.S. securities, by industry, as of June 30, 2012 (continued)
Total EquityDebt
93
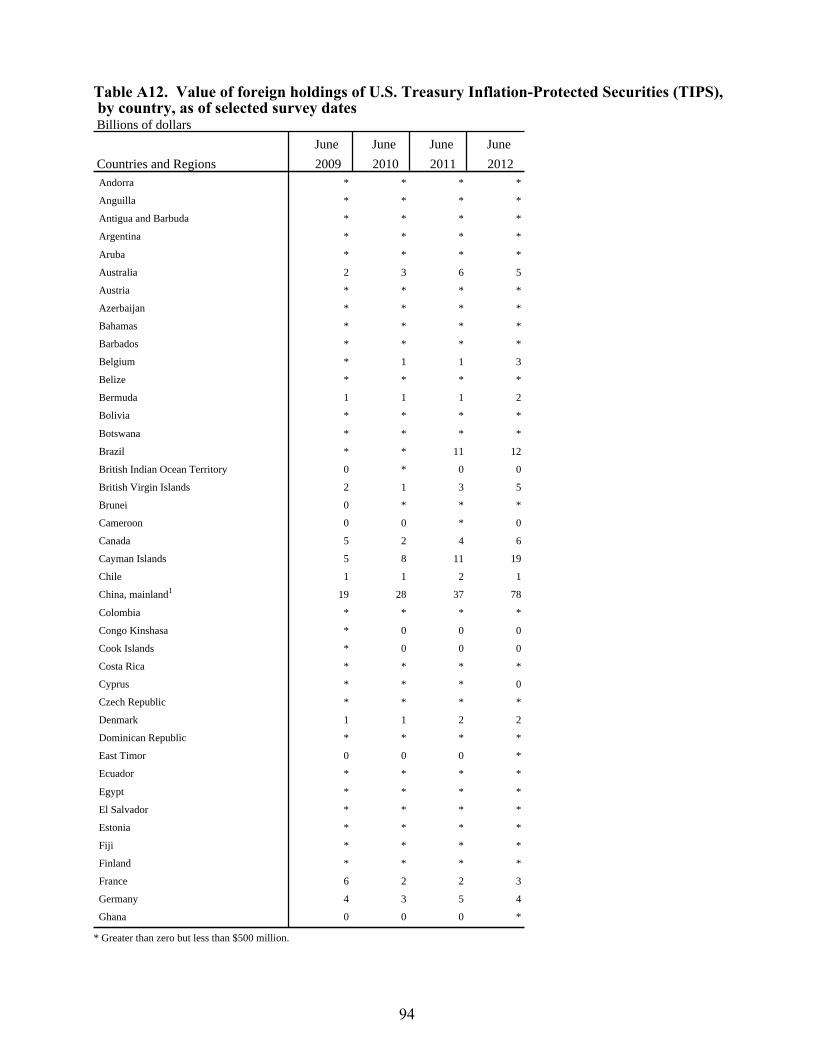
Table A12. Value of foreign holdings of U.S. Treasury Inflation-Protected Securities (TIPS), by country, as of selected survey dates Billions of dollars
June June June June
Countries and Regions 2009 2010 2011 2012 Andorra * * * *
Anguilla * * * *
Antigua and Barbuda * * * *
Argentina * * * *
Aruba * * * *
Australia 2 3 6 5
Austria * * * *
Azerbaijan * * * *
Bahamas * * * *
Barbados * * * *
Belgium * 1 1 3
Belize * * * *
Bermuda 1 1 1 2
Bolivia * * * *
Botswana * * * *
Brazil * * 11 12
British Indian Ocean Territory 0 * 0 0
British Virgin Islands 2 1 3 5
Brunei 0 * * *
Cameroon 0 0 * 0
Canada 5 2 4 6
Cayman Islands 5 8 11 19
Chile 1 1 2 1
China, mainland1 19 28 37 78
Colombia * * * *
Congo Kinshasa * 0 0 0
Cook Islands * 0 0 0
Costa Rica * * * *
Cyprus * * * 0
Czech Republic * * * *
Denmark 1 1 2 2
Dominican Republic * * * *
East Timor 0 0 0 *
Ecuador * * * *
Egypt * * * *
El Salvador * * * *
Estonia * * * *
Fiji * * * *
Finland * * * *
France 6 2 2 3
Germany 4 3 5 4
Ghana 0 0 0 *
* Greater than zero but less than $500 million.
94
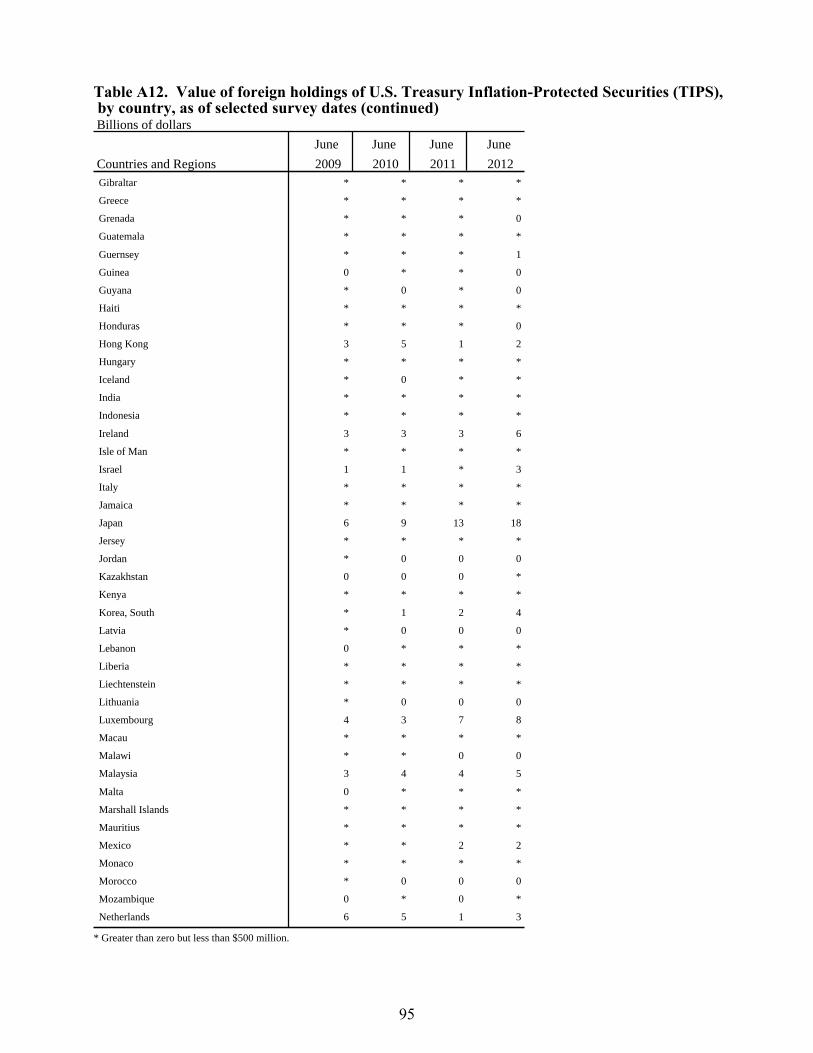
Table A12. Value of foreign holdings of U.S. Treasury Inflation-Protected Securities (TIPS), by country, as of selected survey dates (continued) Billions of dollars
June June June June
Countries and Regions 2009 2010 2011 2012 Gibraltar * * * *
Greece * * * *
Grenada * * * 0
Guatemala * * * *
Guernsey * * * 1
Guinea 0 * * 0
Guyana * 0 * 0
Haiti * * * *
Honduras * * * 0
Hong Kong 3 5 1 2
Hungary * * * *
Iceland * 0 * *
India * * * *
Indonesia * * * *
Ireland 3 3 3 6
Isle of Man * * * *
Israel 1 1 * 3
Italy * * * *
Jamaica * * * *
Japan 6 9 13 18
Jersey * * * *
Jordan * 0 0 0
Kazakhstan 0 0 0 *
Kenya * * * *
Korea, South * 1 2 4
Latvia * 0 0 0
Lebanon 0 * * *
Liberia * * * *
Liechtenstein * * * *
Lithuania * 0 0 0
Luxembourg 4 3 7 8
Macau * * * *
Malawi * * 0 0
Malaysia 3 4 4 5
Malta 0 * * *
Marshall Islands * * * *
Mauritius * * * *
Mexico * * 2 2
Monaco * * * *
Morocco * 0 0 0
Mozambique 0 * 0 *
Netherlands 6 5 1 3
* Greater than zero but less than $500 million.
95
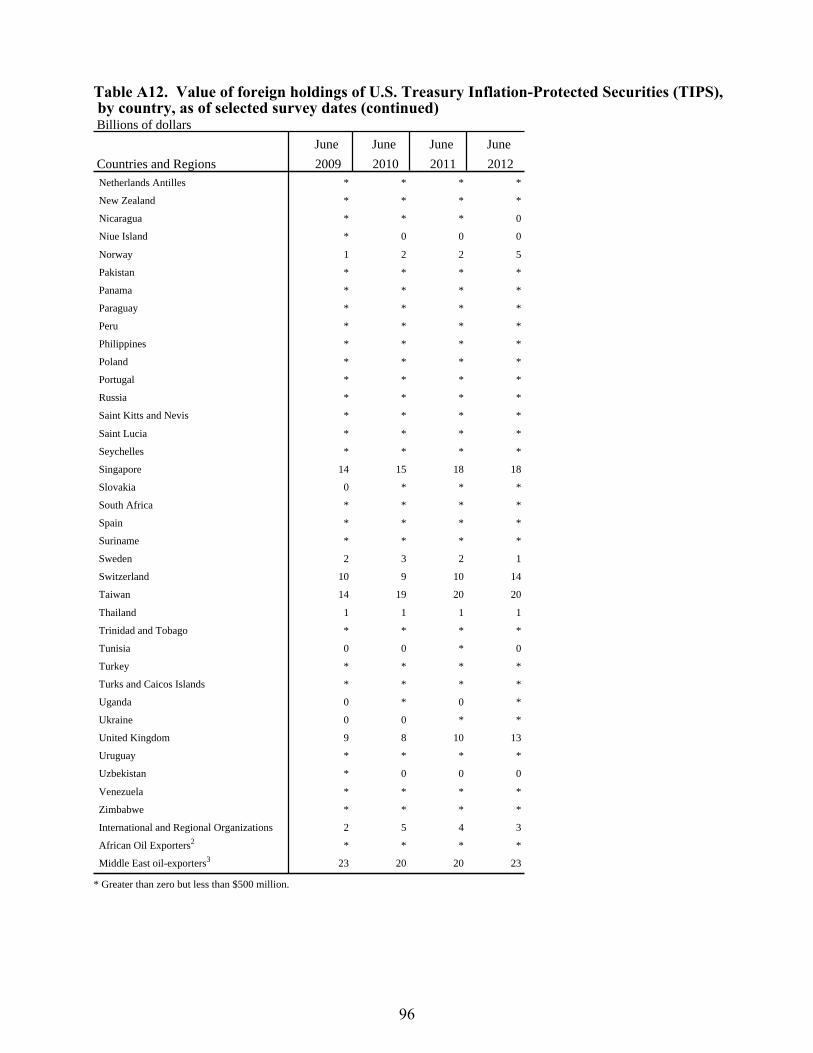
Table A12. Value of foreign holdings of U.S. Treasury Inflation-Protected Securities (TIPS), by country, as of selected survey dates (continued) Billions of dollars
June June June June
Countries and Regions 2009 2010 2011 2012 Netherlands Antilles * * * *
New Zealand * * * *
Nicaragua * * * 0
Niue Island * 0 0 0
Norway 1 2 2 5
Pakistan * * * *
Panama * * * *
Paraguay * * * *
Peru * * * *
Philippines * * * *
Poland * * * *
Portugal * * * *
Russia * * * *
Saint Kitts and Nevis * * * *
Saint Lucia * * * *
Seychelles * * * *
Singapore 14 15 18 18
Slovakia 0 * * *
South Africa * * * *
Spain * * * *
Suriname * * * *
Sweden 2 3 2 1
Switzerland 10 9 10 14
Taiwan 14 19 20 20
Thailand 1 1 1 1
Trinidad and Tobago * * * *
Tunisia 0 0 * 0
Turkey * * * *
Turks and Caicos Islands * * * *
Uganda 0 * 0 *
Ukraine 0 0 * *
United Kingdom 9 8 10 13
Uruguay * * * *
Uzbekistan * 0 0 0
Venezuela * * * *
Zimbabwe * * * *
International and Regional Organizations 2 5 4 3
African Oil Exporters2 * * * *
Middle East oil-exporters3 23 20 20 23
* Greater than zero but less than $500 million.
96
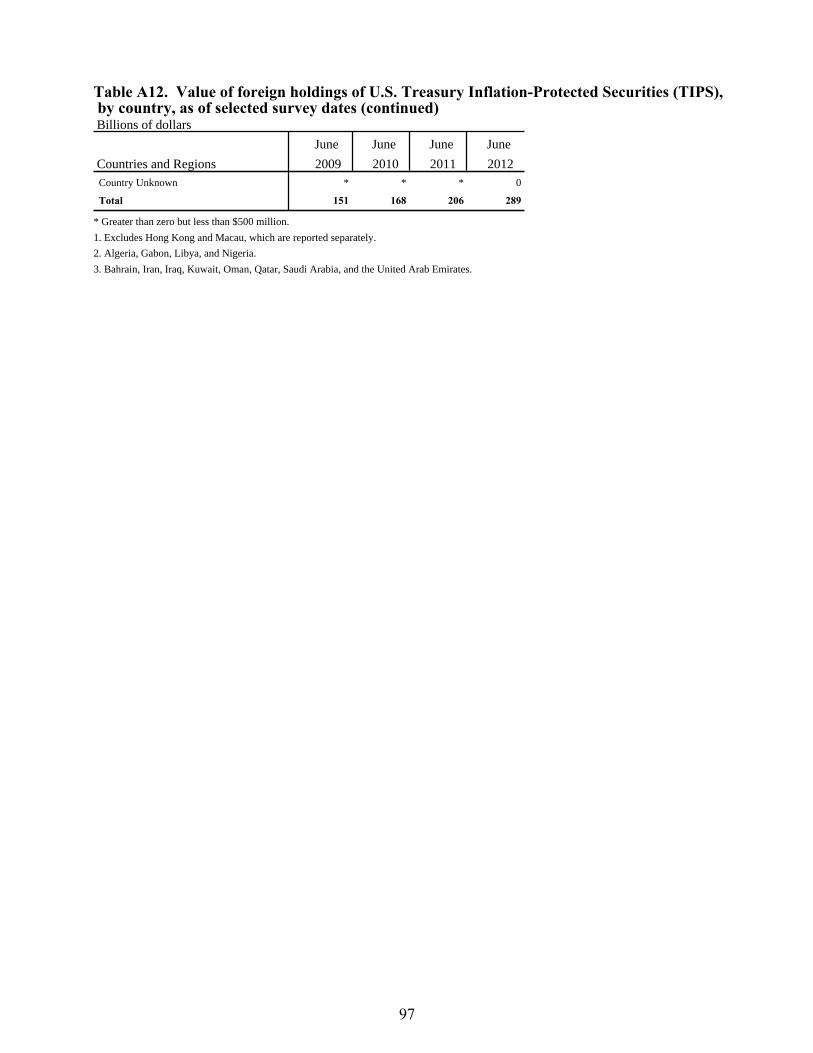
Table A12. Value of foreign holdings of U.S. Treasury Inflation-Protected Securities (TIPS), by country, as of selected survey dates (continued) Billions of dollars
June June June June
Countries and Regions 2009 2010 2011 2012 Country Unknown * * * 0
Total 151 168 206 289
* Greater than zero but less than $500 million.
1. Excludes Hong Kong and Macau, which are reported separately.
2. Algeria, Gabon, Libya, and Nigeria.
3. Bahrain, Iran, Iraq, Kuwait, Oman, Qatar, Saudi Arabia, and the United Arab Emirates.
97

98
Forms and Instructions
OMB NO. 1505-0123
Approval Expires: 6/30/2014
MANDATORY ANNUAL REPORT TO THE FEDERAL RESERVE BANK OF NEW YORK
FOREIGN-RESIDENTS’ HOLDINGS OF
U.S. SECURITIES,
INCLUDING SELECTED MONEY MARKET
INSTRUMENTS (SHLA) As of the last day of June
Mandatory Report
Response Required By Law
(22 U.S.C. 3101 et seq.)
Department of the Treasury
Federal Reserve Bank of New York
Board of Governors of the Federal Reserve System
June 8, 2010
TABLE OF CONTENTS
Page I. INTRODUCTION 1-3 A. PURPOSE B. AUTHORITY
1 1
C. CONFIDENTIALITY OF DATA REPORTED D. PENALITIES FOR FAILURE TO REPORT
2 2
E. PAPERWORK REDUCTION ACT NOTICE
2
II. GENERAL INSTRUCTIONS
4-7
A. WHO MUST REPORT B. CONSOLIDATION RULES
4 5
C. REPORTING DATES 5 D. SUBMISSION INSTRUCTIONS AND CONTACT INFORMATION
5
III. WHAT SECURITIES MUST BE REPORTED 8-18 A. FOREIGN-RESIDENT OWNERSHIP 8 B. REPORTABLE U.S. SECURITIES C. DO NOT REPORT D. ASSET-BACKED SECURITIES E. FUNDS AND RELATED EQUITY OWNERSHIP F. SECURITIES INVOLVED IN REPURCHASE AND SECURITIES LENDING
ARRANGEMENTS G. STRIPPED SECURITIES H. U.S. GOVERNMENT AGENCIES OR FEDERALLY SPONSORED ENTERPRISES I. DIRECT INVESTMENT J. SECURITIES HELD BY U.S. CENTRAL SECURITIES DEPOSITORIES K. LIMITED PARTNERSHIPS L. ACCOUNTING RULES, VALUATION OF SECURITIES, AND
CALCULATION OF U.S. DOLLAR VALUES M. DATA RETENTION PERIOD N. REVIEW OF DATA AND REQUEST FOR REVISED DATA
9 10 11 11 14 14 15 15 16 16 16 17 18
IV. LINE-BY-LINE INSTRUCTIONS FOR SCHEDULE 1-REPORTER 19-21 CONTACT INDENTIFICATION AND SUMMARY OF FINANCIAL INFORMATION
V. LINE-BY-LINE INSTRUCTIONS FOR SCHEDULE 2-DETAILS OF
22-27
SECURITIES
i
APPENDICES
A. SAMPLE REPORTING SCHEDULES SCHEDULE 1- REPORTER CONTACT IDENTIFICATION AND SUMMARY OF FINANCIAL INFORMATION SCHEDULE 2- DETAILS OF SECURITIES
28-33 Schedule 1, Page 1 of 3 Schedule 1, Page 2 of 3 Schedule 1, Page 3 of 3 Schedule 2, Page 1 of 2 Schedule 2, Page 2 of 2
B. FLOWCHARTS SHOWING REPORTING RESPONSIBILITY DETERMINING REPORTABLE SECURITIES
34-37 35-36 37
C. LIST OF COUNTRY CODES 38-42 D. LIST OF INTERNATIONAL AND REGIONAL ORGANIZATIONS E. LIST OF FOREIGN OFFICIAL INSTITUTIONS
43-45 46-61
F. LIST OF CURRENCY CODES 62-64 G. GLOSSARY 65-73 H. TECHNICAL INFORMATION FOR ELECTRONIC SUBMISSION I. LIST OF FEDERAL AGENCIES AND FEDERALLY SPONSORED ENTERPRISES
74-86 87-88
ii
1
I. INTRODUCTION
A. PURPOSE
The Department of the Treasury, with the assistance of the Board of Governors of the Federal Reserve
System and the Federal Reserve Bank of New York (FRBNY), is conducting a mandatory annual survey of
holdings of U.S. securities, including selected money markets instruments, by foreign residents as of June
30 of each year. The data will be collected by the FRBNY, acting as fiscal agent for the Department of the
Treasury. The data collected will be used by the U.S. Government in the computation of the U.S. balance
of payments accounts and the U.S. international investment position, and in the formulation of
international economic and financial policies. These data also will be used to provide aggregate
information to the public on these foreign portfolio investments and to meet international reporting
commitments.
In order to reduce reporting burden and costs to the government, there will be a substantial reduction in
the number of reporters in four out of every five years. A benchmark survey (Form SHL) of all significant
U.S.-resident custodians and issuers will continue to be held approximately every five years. In non-
benchmark years, the annual survey (Form SHLA) will require reports from only the very largest U.S.-
resident custodians and issuers. The data reported under these annual surveys (Form SHLA) will be used
in conjunction with the results of the previous benchmark survey to compute estimates for the non-
benchmark years. The next full Benchmark survey will be as of June 30, 2014.
The determination of who must report on the annual reports (Form SHLA) will be based upon the data
submitted during the previous benchmark survey. Designated U.S.-resident custodians and issuers will be
required to file detailed security data on Schedule 2, in the same manner as they did on the June 30,
2009 benchmark survey.
B. AUTHORITY
This mandatory survey is conducted under the authority of the International Investment and Trade in
Services Survey Act (22 U.S.C. 3101 et seq., [the Act] ) and Executive Order 11961 of January 19, 1977.
The Act specifies that the President has the authority to conduct a regular data collection program,
including such studies and reports as may be necessary and feasible, to secure current information on
2
international investment, including (but not limited to) such information as may be necessary for
computing and analyzing the balance of payments accounts and the international investment position of
the United States (22 U.S.C. 3103). In Executive Order 11961 §2, the President designated the Secretary
of the Treasury to be responsible for collecting data on portfolio investment required by the Act.
C. CONFIDENTIALITY OF DATA REPORTED
The information collected by this survey may be used only for analytical and statistical purposes and to
enforce the Act. Access to the information is available only to officials and employees (including
consultants and contractors and their employees) designated to perform functions under the Act. Persons
having access to individual company information submitted pursuant to the Act are subject to penalties
for unauthorized disclosure (22 U.S.C. §3104 and 18 U.S.C. §1905). The results of this survey will be
made available to the general public at an aggregated level so that neither the U.S. persons or
organizations providing information nor individual or organizational ownership of U.S. securities can be
identified.
D. PENALTIES FOR FAILURE TO REPORT
Reporting as directed in this package is mandatory for any U.S.-resident person or entity subject to the
reporting requirements set forth in the report instructions. Failure by an entity to provide timely and
accurate data can result in a civil penalty of not less than $2,500 and not more than $25,000, or
injunctive relief ordering such person to comply, or both (22 U.S.C. §3105 (a) and (b)).
Willfully failing to submit any required information under the Act can result in a fine of not more than
$10,000; and, if an individual, may result in imprisonment for not more than a year, or both. Any officer,
director, employee or agent who knowingly participates in such violation, upon conviction, may be
punished by a like fine, imprisonment, or both (22 U.S.C. §3105 (c)).
E. PAPERWORK REDUCTION ACT NOTICE
This report titled “Foreign Holdings of U.S. Securities, Including Selected Money Market Instruments” in
the Federal Register Notice of (need to add date when known) has been reviewed and approved by the
Office of Management and Budget in accordance with the Paperwork Reduction Act of 1995 and assigned
OMB Control Number 1505-0123. The purpose is to collect accurate and complete data that will enable
3
the Treasury Department to fulfill its responsibility under the Act. The estimated average burden
associated with this collection of information is 486 hours per report for each U.S.-resident custodian
reporting detailed information on Schedule 2, and 110 hours per report for each U.S.-resident issuer of
U.S. securities providing detailed information on Schedule 2. The amount of time required to complete
the report will vary depending on the amount of data to report. Comments concerning the accuracy of
these burden estimates and suggestions for reducing the reporting burden should be directed to:
Administrator, International Portfolio Investment Data Systems
U.S. Department of the Treasury
1500 Pennsylvania Avenue NW, Room 5422 MT
Washington, DC 20220
or
The Office of Management and Budget
Paperwork Reduction Project (1505-0123)
Washington, DC 20503
No person is required to respond to any U.S. Government collection of information unless it displays a
currently valid OMB control number.
4
II. GENERAL INSTRUCTIONS
A. WHO MUST REPORT
1. All U.S.-resident entities that been contacted by the Federal Reserve Bank of New York
must report, regardless of the size of their consolidated holdings
Reporters are generally determined by including those institutions that collectively report at least 95
percent of the market value of foreign holdings as measured by the preceding TIC SHL report.
Types of reporting entities include U.S.-resident custodians (including U.S.-resident central securities
depositories) and U.S.-resident issuers. Entities that provide multiple services (i.e., provide custodial
services and issue securities) should report securities that meet the reporting criteria for each role and
ensure that securities are not double counted.
• U.S.-resident custodians, including brokers and dealers, must report all U.S. securities they
hold in custody (or manage the safekeeping of) for the account of foreign residents (including their
own foreign branches, subsidiaries, and affiliates). These securities must be reported by the U.S.-
resident custodian even if the securities are in turn held at DTC, Euroclear, or another central
securities depository, since the central securities depository knows only that it is holding securities on
behalf of the U.S.-resident custodian, whereas the U.S.-resident custodian knows that it is holding
these securities on behalf of a foreign resident. However, if a U.S.-resident custodian uses a U.S.-
resident sub-custodian, the custodian should report if (and only if), it does not maintain separate
accounts at and disclose the clients to the sub-custodian. (If the custodian does maintain separate
accounts at and disclose the clients to the sub-custodian, it should not report, to prevent double
counting.)
• U.S.-resident central securities depositories, must report all U.S. securities they hold in custody
(or manage the safekeeping of) directly on behalf of foreign residents with which they have
established direct relationships, including foreign-resident brokers, dealers, exchanges, and central
securities depositories.
• U.S.-resident issuers, must report all securities issued by U.S.-resident units , which are:
1. owned by foreign residents for which neither a U.S.-resident custodian nor a U.S. resident
central securities depository is used. Transfer or paying agents should be able to provide the U.S.-
resident issuer with this information;
2. in book entry form that are held at a foreign-resident central securities depository; or
3. bearer securities.
5
Please refer to Section III, What Securities Must Be Reported, to identify reportable U.S. securities.
B. CONSOLIDATION RULES
U.S.-resident organizations, including bank holding companies (BHC) and financial holding companies
(FHC), should include all reportable securities for all U.S.-resident parts of their organization, including all
U.S.-resident branches and subsidiaries. U.S. residents include entities located in the Commonwealth of
Puerto Rico and the U.S. territories. Please see Appendix G for the complete definition of United States.
It is the responsibility of the U.S. parent entity in each organization to ensure that its report includes all
applicable entities within its organization.
Securities issued by U.S.-resident trusts and special purpose entities (SPEs) for which the reporter is the
trustee or primary beneficiary should be included. Shares of U.S.-resident funds that are managed by the
reporting entity should be included unless a U.S.-resident custodian other than the reporting entity is
used.
U.S. branches and agencies of a foreign bank located in the same state and within the same Federal
Reserve District should submit a consolidated report for these offices. U.S. branches and agencies of a
foreign bank that are located in either different states or different Federal Reserve Districts, should submit
separate reports.
C. REPORTING DATES
Report data as of the last business day of June. All data should be submitted to the Federal Reserve
Bank of New York no later than the last business day of August.
D. SUBMISSION INSTRUCTIONS AND CONTACT INFORMATION
If your organization is submitting 200 or more Schedule 2 records, the Schedule 2 data must be
submitted electronically. The format for submitting Schedule 1 data is dependent on how the Schedule 2
data are submitted.
Option 1:
• Submit both Schedules 1 and 2 data using the Federal Reserve System’s Internet Electronic
Submission (IESUB) system. IESUB is fast, easy to use and secure. IESUB provides a confirmation of
data receipt at the Federal Reserve Bank of New York and performs a number of validity checks of
6
your file format. For more information on how to submit data using the IESUB system, contact the
SHL staff at 212-720-6300 or at [email protected]. Alternatively, additional information and an
application to register for IESUB can be obtained at: http://www.treas.gov/tic/forms.html#benchmark.
Completed applications should be sent to:
Federal Reserve Bank of New York
Statistics Function, 4th Floor
33 Liberty Street
New York, NY 10045-0001
or faxed to 1-212-720-2598
Option 2:
• Submit Schedule 2 data on compact disk(s) CD(s) in the format specified in Appendix H. Schedule 1
must be filed on paper and must be submitted in the same package as the Schedule 2 data.
If your organization is submitting less than 200 Schedule 2 records, these records may be submitted using
the IESUB system on CD(s) using the format specified in Appendix H or on paper, using the form
contained in Appendix A.
Reports and CDs can be mailed or sent by courier to:
Federal Reserve Bank of New York
Statistics Function, 4th Floor
33 Liberty Street
New York, NY 10045-0001
Please contact FRBNY staff with questions pertaining to the report or if any of the following conditions
apply:
1. Your entity requires additional time to complete your report.
2. Your entity received a copy of the report booklet and is not the U.S. parent entity in your organization.
3. Your entity cannot submit a single report for its entire organization.
4. Your reporter contact information or technical contact information changes after you submit your
Schedule 1 report.
7
FRBNY staff can be reached at:
• Phone: 212-720-6300 or 646-720-6300
• Email: [email protected]
Additional copies of the reporting forms and instructions may be printed from the Internet at:
http://www.treas.gov/tic/forms.html#benchmark
8
III. WHAT SECURITIES MUST BE REPORTED
This report collects information on securities issued by U.S.-residents that are owned by foreign residents,
including U.S. equities, U.S. short-term debt securities (including selected money market instruments),
U.S. long-term debt securities, and U.S. asset-backed debt securities.
Reportable securities may be traded or issued in the United States or in foreign countries, and may be
denominated in any currency. Neither the country in which the securities are traded or issued, nor the
currency in which the securities are denominated, is relevant in determining whether the securities are
reportable. Securities held as part of a direct investment relationship should not be reported. (See
Section III.I.)
A. FOREIGN-RESIDENT OWNERSHIP
Securities are considered to be foreign owned if, according to the reporter's records, the holder of record
is not a resident of the United States. In addition, all outstanding bearer bonds should be assumed to be
owned by foreign residents and reported by the U.S.-resident issuer. Bearer bonds should also be
reported by U.S.-resident custodians, but only if the reporter’s records indicate a foreign-resident owner
(or foreign-resident custodian).
The following are considered to be foreign residents:
• Residents of foreign countries, including foreign-resident custodians and foreign-resident central
securities depositories. (These include residents of Canada, Mexico, and offshore centers.)
• International organizations with extra-territorial status (even if located in the United States), such as
the International Bank for Reconstruction and Development (World Bank), the International Monetary
Fund (IMF) and the Inter-American Development Bank. 1 (See Appendix D for a complete list of
these organizations.)
• Foreign subsidiaries of U.S. entities and foreign-resident branches of U.S. banks.
• Offshore and other non-U.S. funds.
• Entities or individuals that file an IRS Form W-8, indicating that they are foreign residents. Please note
that there may be exceptions (such as Puerto Rico). However, if an IRS Form is not available, the
mailing address can be used to determine residency.
1 Pension plans of international and regional organizations, if located in the United States, are U.S.-resident entities; therefore, any securities owned by these pension plans should be excluded from this report.
9
B. REPORTABLE U.S. SECURITIES
U.S. securities are securities issued by U.S.-resident entities, with the exception of Depositary Receipts
(DRs) that are backed by foreign securities and securities issued by international organizations that have
extra-territorial status, such as the World Bank and the Inter-American Development Bank. U.S. securities
can be issued in any country, denominated in any currency, and traded on any exchange.
U.S.-resident entities include U.S.-resident branches of foreign banks and U.S.-resident subsidiaries of
foreign companies. Securities issued by foreign branches or subsidiaries of U.S. entities are not U.S.
securities unless, due to merger, reorganization, or default, a U.S.-resident entity assumes direct
responsibility for the payment of a previously foreign security.
Reportable securities include:
Equity Securities
• Common stock
• Preferred stock (participating and nonparticipating preference shares)
• Restricted stock
• U.S.-resident fund shares (open-end and closed-end), REITS, money market mutual funds, index-
linked equity securities including unit investment trusts (including SPDRs, DIAMONDs, etc.)
• All other equity, including shares or units of ownership in unincorporated business enterprises, such as
limited partnerships
Debt Securities
• Debt, registered and bearer, including bonds and notes (unstripped and stripped) and bonds with
multiple call options
• Convertible debt and debt with attached warrants
• Zero-coupon debt and discount notes
• Index-linked debt securities (e.g., property index certificates)
• Commercial paper (including asset-backed commercial paper)
• Bankers' acceptances and trade acceptances
• Negotiable certificates of deposit, bank notes, and deposit notes
• Notes, including those issued under note issuance facilities and revolving underwriting facilities,
10
medium-term notes, promissory notes, deep-discounted, currency-linked (e.g., dual-currency),
floating rate notes (FRN), such as perpetual notes (PRN), variable rate notes (VRN), structured FRN,
reverse FRN, collared FRN, step up recovery FR (SURF), and range/corridor/accrual notes
• Asset-backed securities (see Section III.D)
• All other long-term and short-term debt securities
(Note: U.S. debt securities that are still outstanding as of June 30 should be reported even if
the maturity date has passed.)
C. DO NOT REPORT
Do not report any:
• Derivative contracts (including futures, forwards, swaps, options and warrants) meeting the definition
of a derivative under FAS 133. Embedded derivatives that are not bifurcated under FAS 133 should be
included in the value of the host contract. However, if an embedded derivative is bifurcated the
derivative should be excluded from the report.
• Securities which have been temporarily received as collateral under resale agreements or similar
financing agreements (see Section III.F)
• Loans and loan participation certificates
• Letters of credit
• Non-negotiable certificates of deposit
• Bank deposits, including time (except for negotiable CDs) and demand deposits
• Annuities, including variable rate annuities
• Foreign securities, including :
1. Depositary receipts (DRs) backed by foreign securities, including ADRs (American Depositary
Receipts), ADSs (American Depositary Shares), GDRs (Global Depositary Receipts), and IDRs
(International Depositary Receipts).
2. Securities issued by international and regional organizations with extra-territorial status, such as
the International Bank for Reconstruction and Development (IBRD or World Bank) or the Inter-
American Development Bank (IDB). (See Appendix D for a list of these organizations.)
3. Securities issued in the United States by foreign-resident entities (e.g., Canadian or Mexican
entities), even if they are denominated in U.S. dollars and traded on U.S. securities exchanges.
4. Securities issued by foreign subsidiaries of U.S. entities (e.g., GMAC Canada) or foreign branches
of U.S. banks, even if they are guaranteed by the U.S. parent company, or issued in the United
11
States.
5. Securities issued by foreign-resident entities under Section 144A of the SEC Act.
6. Securities issued by corporations that were incorporated outside of the United States by the report
as of date, including companies incorporated offshore in countries such as the Cayman Islands and
Bermuda.
D. ASSET-BACKED SECURITIES
Asset-backed securities (ABS) are securitized interests in a pool of assets, which give the purchaser a
claim against the cash flows generated by the underlying assets. Securities backed by revolving credits,
such as pools of credit card receivables, are reported as ABS if the return to the owner is based upon
these credits, (i.e., the credits do not merely serve as collateral). Foreign-owned ABS should be reported
if the issuer securitizing the assets is a U.S. resident. The underlying asset should not be used to
determine if the ABS are reportable.
Include as ABS all collateralized mortgage obligations (CMOs), collateralized bond obligations (CBOs),
collateralized loan obligations (CLOs), collateralized debt obligations (CDOs), and other securities backed
by pools of:
• mortgages;
• credit card receivables;
• automobile loans;
• consumer and personal loans;
• commercial and industrial loans and other whole loans; and
• other assets.
E. FUNDS AND RELATED EQUITY OWNERSHIP
1. Report foreign-residents’ ownership of shares/units of funds and investment trusts legally established
in the United States (U.S.-resident funds) as equity securities. All foreign-residents’ ownership of U.S.-
resident fund shares should be assigned security type = 3 (fund shares), and not categorized as a debt
security, regardless of the types of securities held by the fund.
For purposes of this report, funds include all investment vehicles that pool investors’ money and invest
12
the pooled money in one or more of a variety of assets. Funds include, but are not limited to:
• mutual funds (including both open-end and closed-end mutual funds);
• money market funds;
• investment trusts;
• index-linked funds;
• exchange-traded funds (ETFs);
• hedge funds; and
• common trust funds.
The determination of whether a fund’s shares are a U.S. security is based on the country in which the
fund is legally established, not based on the residence of the issuers of the securities the fund purchases.
For example, if a foreign resident owns shares in a fund organized in New York, these shares are
reportable U.S. securities, whether or not the fund purchases foreign securities. Conversely, foreign-
resident ownership of shares of “offshore” or other foreign-resident funds that purchase U.S. securities
should not be reported.
Many funds established outside of the United States have names that are similar to U.S.-resident fund
names. This often occurs when the fund is managed by a group that also manages many U.S.-resident
funds and therefore may be thought of as managing only U.S.-resident funds. If there is doubt as to
whether the investment should be classified as a fund or whether a fund is U.S. or foreign, please contact
FRBNY staff at 212-720-6300 or 646-720-6300.
2. Report the ownership of U.S. securities by foreign-resident funds.
Although ownership of shares of foreign-resident funds are excluded from this report, any U.S. securities
owned by foreign-resident funds for their portfolio are reportable. These are distinct investments and,
therefore, are not duplicate reporting. U.S. securities owned by foreign-resident funds should be
classified as either equity, debt, or asset-backed securities, as indicated in Section III.B.
3. Reporting guidelines for Hedge Funds and other alternative investments
Investment advisors, managers or similar types of legal entities that create master and feeder funds both outside and inside the U.S. should report as follows:
1. . Investments between the U.S. and foreigner entities (affiliates) that the investment manager
establishes, is portfolio investment and should be reported on this report.
13
Example 1
A U.S. investment manager creates a U.S. Master Fund, a Cayman Feeder Fund, and a U.S.
Feeder Fund. The investments between the manager and the foreign feeder funds are direct
investments. However, the investment that the foreign feeder fund has in the master fund is
portfolio investment and should be reported in the TIC system. Purchase and sales of the master
fund shares by the foreign feeder fund should be reported on the TIC S by the U.S. based master
fund and the master fund should report the ownership of their “shares” by the foreign feeder
funds as issuer of the “domestic security” on the TIC SHL (A) report. If a U.S. custodian is
involved in the holding the “domestic security” then the reporting responsibility would be on the
U.S. custodian to report on the TIC SHL (A).
Example 2
A foreign hedge fund creates a U.S. based Master Fund, a Cayman Feeder Fund, and a
U.S. Feeder Fund. The investments between the hedge fund and the U.S. feeder funds are direct
investments. However, the investment that the foreign feeder fund has in the master fund is
portfolio investment and should be reported in the TIC system. Purchase and sales of the master
fund shares by the foreign feeder fund should be reported on the TIC S by the U.S. based master
fund and the master fund should also report the ownership of their “shares” by the foreign feeder
funds as issuer of the “domestic security” on the TIC SHL (A) report. If a U.S. custodian is
involved in the holding the “domestic security” then the reporting responsibility would be on the
U.S. custodian to report on the TIC SHL (A).
2. Exclude any investment between the entity that formed the funds (as a general partner) and
all the entities it creates. These are direct investment and should be reported to the Bureau of
Economic Analysis
Note: The descriptions of the various examples are based on common master/feeder fund structures. It is
possible for there to be different types of structures when creating these funds and they may be called
different names by some entities. Ultimately, if the investment is not Direct Investment then it will fall into
the category of portfolio investment and needs to be reported as part of the TIC system.
14
F. SECURITIES INVOLVED IN REPURCHASE AND SECURITIES LENDING ARRANGEMENTS
A repurchase agreement (repo) is an arrangement involving the sale of securities at a specified price with
a commitment to repurchase the same or similar securities at a specified price on a future date. A
reverse repo is an agreement whereby a security is purchased at a specified price with a commitment to
resell the same or similar securities at a specified price on a specified future date. Securities
lending/borrowing arrangements are agreements whereby the ownership of a security is transferred in
return for collateral, usually another security or cash, under condition that the security or similar security
will revert to its original owner at a future date.
Securities "sold" by foreign residents under repurchase agreements or buy/sell back agreements, lent
under securities lending arrangements, or delivered out as collateral as part of a reverse repurchase
agreement or security borrowing agreement should be reported as if the securities were continuously held
by the foreign resident. That is, the security lender’s U.S. custodian should report the U.S. security as if
no repurchase agreement or buy/sell back agreement occurred.
Securities temporarily acquired by foreign residents as collateral under reverse repurchase agreements,
securities lending or borrowing arrangements, or buy/sell back agreements should NOT be reported. That
is, the security borrower’s U.S. custodian should exclude the U.S. security as if no resale agreement or
buy/sell back agreement occurred.
However, if cash was temporarily received as collateral and was used to purchase securities, those
securities should be reported.
G. STRIPPED SECURITIES
Separate Trading of Registered Interest and Principal Securities (STRIPS) and other similar instruments
are securities that have been transformed from a principal amount with periodic interest coupons into a
series of zero-coupon securities, with the range of maturities matching the coupon payment dates and the
redemption date of the principal amount.
The residency of the STRIPS and similar instruments is the residence of the entity that issued the stripped
security. However, the type of issuer of STRIPS and similar instruments is based upon the type of issuer
of the underlying security. For example, U.S. Treasury STRIPS should be classified as U.S. Treasury
securities even though the Treasury does not issue or sell STRIPS directly to investors. In addition, all
15
CATS, TIGRS, COUGARS, and LIONS should also be classified as U.S. Treasury securities.
Foreign holdings of stripped securities where the underlying security is not an ABS, both the interest-only
(IO) component and the principal-only (PO) component, should be reported as security type = 10 (bond
or note, stripped).
Foreign holdings of stripped securities where the underlying security is an ABS, tranches of stripped ABS,
any IO component, and any PO component, should be reported as security type = 12 (asset-backed
security).
H. U.S. GOVERNMENT AGENCIES OR FEDERALLY SPONSORED ENTERPRISES
Securities that are issued by U.S. government agencies or federally sponsored enterprises and owned by
foreign residents are reportable. In addition, foreign owned securities that are issued by a U.S.-resident
entity and guaranteed by U.S. government agencies or federally sponsored enterprises are reportable.
For purposes of Schedule 2, item 9 (type of issuer), all these securities should be coded as type 2
(agencies). For example, securities that are guaranteed by the Government National Mortgage
Association (GNMA) or the Small Business Administration (SBA) should be reported as U.S. government
agency securities.
I. DIRECT INVESTMENT
A direct investment relationship exists when a U.S. company owns 10% or more of the voting equity
securities of an incorporated foreign business (or an equivalent interest in an unincorporated foreign
business, including a branch), or when a foreign company owns 10% or more of the voting equity
securities of an incorporated U.S. business (or an equivalent interest in an unincorporated U.S. business,
including a branch). Limited partners in a limited partnership do not have voting rights and therefore
cannot have direct investment. (See Section III.K) If a direct investment relationship exists, then in
general, all financial positions between the firms are considered direct investment. If a direct investment
relationship exists between non-banking entities, all securities held by the parent entity that were issued
by the affiliate of the parent are considered direct investment. However, if one of the entities is a
banking or securities brokerage firm, the inter-company holdings are considered direct
investment only if they provide permanent capital. All holdings known to be direct investment
should be excluded from this report.
16
J. SECURITIES HELD BY U.S. CENTRAL SECURITIES DEPOSITORIES
U.S.-resident central securities depositories must report all U.S. securities they are holding in custody (or
managing the safekeeping of) directly on behalf of foreign residents, such as foreign-resident brokers
and dealers who may be members of the depository, or foreign-resident securities exchanges or
depositories that have established direct relationships with the U.S.-resident central securities depository.
U.S.-resident custodians should report all U.S. securities that are shown on their records as being owned
by foreign residents (or held in custody by its foreign-resident custodian) even if the safekeeping or
settlement of the security is done at a U.S.-resident central securities depository.
K. LIMITED PARTNERSHIPS
Foreign-resident limited partner ownership interests in U.S.-resident limited partnerships should be
reported as security type = 4 (other equity). Limited partners’ ownership interests do not carry voting
rights; therefore, all ownership interests, even those greater than 10%, are reportable. The Number of
Shares field on Schedule 2 (item 18) should be defaulted to the value reported in the US$ Market Value
field (item 16) because limited partnerships do not issue shares.
General partner ownership interests are always considered to be direct investment and all such interests
should be excluded from this report.
L. ACCOUNTING RULES, VALUATION OF SECURITIES, AND CALCULATION OF U.S. DOLLAR
VALUES
Accounting Rules
All securities should be reported using settlement date accounting. Gross long positions should be
reported. Do not net any short positions from long positions. Do not enter decimals or negative values in
any cells.
Valuation of Securities
Report the fair value of securities as of close of business on the last business day of June. The fair value
17
follows the definition of FAS 157.
U.S.-resident custodians should, at a minimum, report the fair value to the extent that it is available as
part of the services provided to their customers, even if the price available is for a date prior to the last
business day of June. If there is doubt as to whether to report the available fair value or to report a fair
value of zero, please contact FRBNY report staff at 212-720-6300 or 646-720-6300.
For ABS, the value of the unpaid principal amount outstanding at close of business on the last business
day of June should be reported; if principal has been repaid, this value will not be the same as the
original face value, revalued at end-period market prices.
Foreign Currency Denominated Securities – CALCULATION OF U.S. DOLLAR VALUES
If the security is not denominated in U.S. dollars (US$) and a U.S. dollar fair (market) value is not
available in your system, convert the foreign currency denominated fair (market) value into US$ using the
spot exchange rate as of the close of business on the last business day of June. If you need assistance
locating an exchange rate, please contact FRBNY staff at 212-720-6300 or 646-720-6300.
If the exchange rate is normally quoted in units of foreign currency per US$, such as ¥105.75/US$, divide
foreign currency values by the foreign exchange rate to obtain the US$ values. For example, if the value
of a U.S. security issued in Japan is ¥ 200,000, and the exchange rate is ¥105.75/US$, divide ¥ 200,000
by 105.75 to obtain US$ 1,891.
If the exchange rate is normally quoted in US$ per units of the foreign currency, such as US$1.75/UK£,
multiply foreign currency values by the US$ exchange rate value of the foreign currency to obtain the US$
values. For example, if the value of a U.S. security issued in the United Kingdom is UK £1,000 and the
exchange rate is US$1.75/UK£, multiply UK £1,000 by 1.75 to obtain US$ 1,750.
M. DATA RETENTION PERIOD
All data used to create this report must be retained by the reporter for a period of 36 months from the
date of the report's submission.
18
N. REVIEW OF DATA AND REQUEST FOR REVISED DATA
Data submitted on the reporting schedules are reviewed by FRBNY staff. As a result of this review, the
reporter may be asked by FRBNY staff to provide supplemental information, including reasons for
significant data changes between reporting periods, or corrected data. In addition, FRBNY staff may
request: (1) information to ensure that all reportable U.S. securities have been reported; (2) information
to ensure that all reported U.S. securities are owned by foreign residents (or held by foreign-resident
custodians or foreign-resident central securities depositories); or (3) other information that helps to
explain or corroborate the submitted data.
Reporters filing data on electronic media that are not formatted per the specifications in Appendix H will
be required to resubmit the data in the proper format.
Each quarter, FRBNY staff obtains a list of debt securities issued abroad by U.S. companies. Experience
has shown that most such issues are largely or completely foreign held. FRBNY staff will compare this
information with the reports submitted by U.S.-resident issuers of foreign placed debt securities to ensure
that foreign-issued securities are being properly reported. FRBNY will ask the issuers of such securities
for additional information in cases of apparent under- or over-reporting.
19
IV. LINE-BY-LINE INSTRUCTIONS FOR SCHEDULE 1- REPORTER CONTACT IDENTIFICATION
AND SUMMARY OF FINANCIAL INFORMATION
A Schedule 1 must be completed by all entities that receive this report booklet. This schedule is used to
provide basic identifying information and summaries of data reported on Schedule 2 records. Please type
or print all information.
(Please enter your ten-digit Reporter Identification Number at the top of each page of
Schedule 1.)
REPORTER CONTACT IDENTIFICATION AND SUMMARY OF FINANCIAL INFORMATION
1. Reporter Identification Number - Enter the ten-digit Reporter Identification Number that is
printed on the top of the mailing label on your institution's report booklet. If you do not know the
Reporter Identification Number for your entity, please contact FRBNY staff at 212-720-6300 or 646-
720-6300.
2. Organization Name and Address - Include the full legal name and mailing address of the reporting
entity.
3. Reporting Status - Select “1” only if your parent organization has received authorization to file an
unconsolidated report but you are exempt (meaning you have no reportable securities in custody or
have not issued any reportable securities) . All other entities should select "2" and file the
appropriate Schedule 2 records.
4. Reporter Type - Enter one of the following that best describes your organization
1 = Bank 2 = Mutual fund or investment trust 3 = Insurance company
4 = Other financial organization 5 = Non-financial organization 6 = Foundation, trust, estate
7 = Institution of higher learning (e.g., university) 8 = Other (not listed above)
A Bank is any depository institution (i.e., an institution that takes deposits), a bank holding company, or a
financial holding company organized under Regulation Y of the Federal Reserve Act.
An Other Financial Organization is any other entity that acts as a financial intermediary or financial service
organization, such as a finance company or a broker/dealer, which is operated separately from an entity
in one of the other categories listed above.
A Non-Financial Organization is an entity that conducts commercial, industrial, or trade activities.
20
5. Name of Contact - Enter the name of the person who will be the primary contact for this report and
can answer questions about the data reported.
6-9. Enter the job title, telephone number, fax number, and email address of the primary contact identified
in item 5.
10. Name of Service Provider or Vendor Used - If a service provider or vendor was used to prepare
the data reported, enter the name of the service provider.
11. Name of Technical Contact Person - Enter the name of a person who will serve as a contact
should any technical issues, such as incorrect file formats, arise.
12-14. Enter the job title, telephone number, and email address of the technical contact person identified
in item 11.
15. Valuation Technique - For each reporting unit, describe the valuation technique(s) used to
calculate the reported market values. If securities are automatically valued at zero after a specified time
period of inactivity, please specify the time period and whether this applies to the security or to the
client’s holdings of the security. Also, please specify how securities not actively traded on the report date
and those with internally generated security identification numbers are valued. If your organization has
more than four reporting units, please attach additional copies of Schedule 1, page 2, with item 15
completed.
SUMMARY OF SCHEDULE 2 INFORMATION
This section contains summary data for the information reported on Schedule 2 records. If your entity
submits Schedule 2 data on multiple media, the summary Schedule 2 data should represent aggregate
data across all media for the same reporter identification number.
16. Total Number of Schedule 2 records Submitted - Enter the total number of Schedule 2 records
submitted.
17.Total U.S. $ Fair (Market) Value of All Equity Securities reported on Schedule 2 records -
Enter the sum of the U.S.$ fair (market) value of all equity security records (records with Schedule 2,
Item 10 = 1, 2, 3, or 4), rounded to the nearest U.S. dollar.
18. Total U.S. $ Fair (Market) Value of All Short-Term Debt Securities (excluding asset-backed
securities) reported on Schedule 2 records - Enter the sum of the U.S. $ fair (market) value of
all such security records (records with Schedule 2, Item 10 = 5, 6, 7, 8, 9, 10, or 11 and Schedule 2,
Item 12 = 1), rounded to the nearest U.S. dollar.
21
19. Total U.S. $ Fair (Market) Value of All Long-Term Debt Securities (excluding asset-backed
securities) reported on Schedule 2 records - Enter the sum of the U.S. $ fair (market) value of
all such security records (records with Schedule 2, Item 10 = 5, 6, 7, 8, 9, 10, or 11 and Schedule 2,
Item 12 = 2), rounded to the nearest U.S. dollar.
20. Total U.S. $ Fair (Market) Value of All Asset-Backed Securities reported on Schedule 2
records - Enter the sum of the U.S. $ fair (market) value of all such security records (records with
Schedule 2, Item 10 = 12), rounded to the nearest U.S. dollar.
CERTIFICATION INFORMATION
This section must be completed by all reporters.
By signing and dating the certification, the Certifier acknowledges that:
• He/she has read and understood the reporting requirements of this report;
• He/she is aware that both civil and criminal penalties may be imposed for filing a false report; and
• He/she is sufficiently knowledgeable about the activities and functions of this entity that he/she can
knowingly and with reasonable confidence certify that the information provided in this report is both
accurate and complete.
21-24. Enter the name, job title, telephone number, and email address of the person in your organization
who certifies that the information provided is complete and accurate. Also sign and date the form.
22
V. LINE-BY-LINE INSTRUCTIONS FOR SCHEDULE 2 - DETAILS OF SECURITIES
(Please enter your ten-digit Reporter Identification Number at the top of each page of
Schedule 2.)
1. Reporter Identification Number - Enter the ten-digit Reporter Identification Number that is printed
on the mailing label on the report booklet. If you do not know the Reporter Identification Number for
your entity, please contact FRBNY staff at 212-720-6300 or 646-720-63002. Sequence Number - Enter
the sequence number of this record, right justified. The first record should be assigned sequence number
1 and each subsequent Schedule 2 record should be sequentially numbered.
3. Reporting Unit Code - If data being submitted are collected from multiple databases or reporting
systems, please report an internal code that will enable you to identify the database or system from
which the information on this Schedule 2 came. This information will greatly reduce the costs of
identifying and fixing any reporting errors that may occur.
3a. Name of Reporting Unit - Enter a description or name of the reporting unit or area that
corresponds to the code reported in item 3.
4. Custodian/Issuer Code - Enter "1" if your entity did not issue this security. Enter "2" for issuer if
your entity issued this security (even if you are also acting as the custodian).
5. Security ID - Enter the security ID code used to identify the security reported on this Schedule 2.
CUSIP codes are strongly preferred. If the CUSIP is not available, please try to provide the ISIN,
CINS, or Common code. Do not use internally generated codes unless this security has not
been assigned a code by any recognized numbering agency (e.g., limited partnerships).
Records for securities for which a portion is restricted and a portion is not restricted should be
reported with the numbering agency code assigned to the unrestricted portion. If excessive internal
codes are used, we may have to contact your institution to help identify characteristics of certain
individual securities. Please include the security ID’s check digit and exclude any internal
coding characters added to the CUSIP or other numbering agency code.
6. Security ID System - Select the appropriate number from the list shown on the form. For example,
if the security ID number entered in Item 5 is a CUSIP number, enter “1”; if it is a CINS, enter “3.”
If the security ID system used is not listed, enter a code of "9" (Other) and provide the name of the
organization generating the code in item 6a.
6a. Comment Line - If you entered a code of "9" (Other) in item 6 you must provide the name of the
organization generating the security ID code.
7. Security Description - Briefly describe the security, providing any relevant descriptive information
available. Ideally, this would include the type of security, the maturity date if debt or ABS, and: (a)
23
for preferred stock the annual dividend; (b) for debt securities, the interest rate; (c) for floating rate
notes, how the interest rate is calculated (e.g., Libor plus 1.5); and (d) for stripped securities the type
of security/tranche. This information is particularly important for securities with an internally
generated or other security ID not generated by a recognized numbering agency, (i.e., security ID
system codes = 8 or 9).
8. Name of Issuer - Enter the name of the entity that issued the security. Please try to provide the full
legal name of the issuer. For branches of banks, please provide the location of the branch.
9. Type of Issuer - Enter “1” if the security was issued by the United States government. Enter “2” if
the security was issued or guaranteed by a federal agency (e.g., Government National Mortgage
Association (GNMA)) or issued by or guaranteed by a federally sponsored enterprise (e.g., Federal
National Mortgage Association (FNMA)). See Appendix I for a list of these entities. Enter "3" if the
security was issued by a state or local government (e.g., New York State bonds). Enter "4"
otherwise.
10. Security Type - Enter the security type code from the list below that most closely describes the type
of security being reported. See the glossary for definitions of these security types.
Equity Debt (excluding asset-backed securities) Asset-backed securities 1. Common stock 5. Commercial paper 9. Bond or note, unstripped 12. Asset-backed security 2. Preferred stock 6. Negotiable CD 10. Bond or note, stripped 3. Fund shares 7. Convertible debt security 11. All other debt 4. All other equity 8. Zero-coupon bond or note
Type 1 should be used to report all common stock, including restricted common shares.
Type 2 should be used to report all preferred stock, including participating preference shares,
nonparticipating preference shares, convertible preferred stock, and restricted preferred shares.
Type 3 should be used to report all shares of funds, including funds that invest primarily or exclusively
in money market instruments and in long-term debt, exchange traded funds, open-end and closed-
end mutual funds, and unit investment trusts. (See Section III.E)
Type 4 should be used to report all other types of equity, including foreign-resident limited partner
ownership of U.S.-resident limited partnerships and any other form of equity not specified in security
types 1, 2, and 3.
Type 5 should be used to report all commercial paper, including asset-backed commercial paper.
24
Type 6 should be used to report long-term and short-term negotiable certificates of deposits, including
negotiable bank notes and negotiable deposit notes issued by U.S. institutions, including U.S.
branches of U.S. or foreign banks. Non-negotiable certificates of deposit are not reportable.
Type 7 should be used to report all convertible debt securities, including convertible bonds and zero-
coupon convertible debt. However, non-convertible debt securities with embedded warrants or
options should be reported as either type 8 (if a zero-coupon bond or note) or type 9.
Type 8 should be used to report bonds and notes that do not provide interest payments, such as
discount notes. However: (1) zero-coupon convertible debt should be reported as type 7; (2) stripped
non-asset-backed securities, both the interest-only (IO) and principal-only (PO) components, should
be reported as type 10; (3) U.S. Treasury bills should be reported as type 11; and (4) stripped asset-
backed securities, the tranches, and the IO and PO components, should be reported as type 12.
Type 9 should be used to report bonds or notes that: (1) cannot be converted to equity securities, (2)
provide interest payments, (3) have not been stripped (i.e., not an IO or PO), and (4) do not give the
owner a claim against the cash flows generated by the underlying assets (i.e., ABS). These bonds and
notes are commonly referred to as “straight debt.”
Type 10 should be used to report all components of stripped securities, including the IO and PO
components. However, all tranches of stripped asset-backed securities should be reported as type 12.
Type 11 should include all debt other than asset-backed securities that is not covered in types 5-10,
including U.S. Treasury bills.
Type 12 should include only short-term and long-term securities that represent securitized interests in
a pool of assets and give the investor a claim against the cash flows generated by the underlying
assets. All tranches of stripped asset-backed securities, as well as unstripped asset-backed securities,
should be reported as type 12. Debt which is collateralized by assets (real or financial), but only give
the investor a claim against the underlying interest if the issuer defaults, should be reported as types
5-11, as appropriate.
11. Intentionally Left Blank
12. Term Indicator (debt, including ABS, only; based on original maturity) - Enter "1" (short-
term) if the period from the issue date to the maturity date is one year or less. Enter "2" if the period
from the security issue date to the maturity date is more than one year. If there are multiple issue
25
dates or redemption dates, enter "2" (long-term) if the period between the initial issue date and the
longest redemption date is more than one year. Perpetual debt should also be classified as long-term.
13. Currency of Denomination - Enter the ISO code from Appendix F that corresponds to the currency
in which the security is denominated.
14. Country of Foreign Holder - Enter the country code from Appendix C that corresponds to the
country of residence of the owner of the security. If the country of residence of the owner is not
known, report the country of residence of the foreign-resident custodian or foreign-resident central
securities depository. Positions of international and multinational regional organizations, whether
located in the United States or elsewhere, should be reported opposite the classification
“International,” if worldwide, or opposite the classifications “European,” “Latin American,” “Caribbean,”
“Asian,” “African,” or “Middle Eastern” regional organizations as indicated in Appendix D. If no
country information is available (as will often be the case with bearer bonds), enter code 88862. If an
excessive number of "country unknowns" is reported for securities other than bearer bonds, we will
contact your institution for further information.
15. Type of Foreign Holder
Enter "1" if the owner is an official institution (see Appendix D or E) even if the account is held in the
name of a foreign custodian or other foreign nominee.
Enter "2" if the account is in the name of one or more individuals (natural persons).
Enter “3” for all other owners, including personal trusts and other investment vehicles even if the
beneficial owner is an individual.
16. U.S. $ Fair (Market) Value of Foreign Owned U.S. Security - Enter the U.S. $ fair (market)
value of foreign-residents' ownership of this security, rounded to the nearest U.S. dollar. (See Section
III.L, Valuation of Securities, for more information on how to calculate the fair (market) value.)
16a.Fair (Market) Value in Currency of Denomination of Foreign Owned U.S. Security - Enter
the fair (market) value of foreign-residents' ownership of this security, rounded to the nearest
currency unit. For ABS, the fair (market) value should be calculated based on the remaining principal
outstanding (item 23) rather than the original face value. If the currency of issue is US$, report the
same value as in item 16. (See Section III.L, Valuation of Securities, for more information on how to
calculate the fair (market) value.)
17. Intentionally Left Blank
26
FOR EQUITY TYPE SECURITIES ONLY
18. Number of Shares - Enter the number of shares owned by foreigners, including fractional shares,
rounded to the nearest share. Wherever possible, combine partial shares with other ownership shares
of the same security to reduce reporting disparities introduced by rounding partial shares. Securities
for which the amount foreign owned is zero should not be reported.
FOR SHORT-TERM AND LONG-TERM DEBT SECURITIES EXCLUDING ASSET-BACKED
SECURITIES
19. Face Value in Currency of Denomination - For both short-term and long-term securities, enter
the face value owned by foreigners in the currency of denomination, rounded to the nearest whole
currency unit. If a security is traded in units, then calculate the face value as: (face value of each
unit) * (the number of units) and report the result in this field. Securities for which the amount
foreign owned is zero should not be reported.
20. Issue Date - Enter the issue date of this security in MMDDYYYY format. For example, if the security
was issued on October 4, 1985, enter 10041985. If there are multiple issue dates, enter the first such
issue date.
21. Maturity Date - Enter the final maturity date (when all remaining principal and interest are due) of
this security in MMDDYYYY format. For example, if the security's final maturity date is January 5,
2010, enter 01052010. For perpetual debt, report a maturity date of 12319999.
FOR SHORT-TERM AND LONG-TERM ASSET-BACKED SECURITIES ONLY
22. Original Face Value in Currency of Denomination - Enter the original face value owned by
foreigners in the currency of denomination, rounded to the nearest whole currency unit. This is the
value that is (would have been) outstanding if no principal has been (had been) repaid. If a security
is traded in units, then calculate the original face value as: (original face value of each unit) * (the
number of units) and report the result in this field.
23. Remaining Principal Outstanding in Currency of Denomination - Enter the remaining principal
outstanding owned by foreigners as of last business day of June in the currency of denomination,
rounded to the nearest whole currency unit. This will equal the original face value if no principal has
been repaid.
27
The remaining principal outstanding should be calculated by multiplying the original face value (item
22) by the factor value as of June 30, 2004. If a security is traded in units, then calculate the
remaining principal outstanding as: (original face value of each unit) * (the number of units) * (factor
value). If the factor value is not available as of the last business day of June, use the closest factor
value prior to the last business day of June. Securities for which the amount foreign owned is zero
should not be reported.
24. Issue Date - Enter the issue date of this security in MMDDYYYY format. For example, if the security
was issued on October 4, 1985, enter 10041985. If there are multiple issue dates, enter the first such
issue date.
25. Maturity Date - Enter the final maturity date (when all remaining principal and interest are due) of
this security in MMDDYYYY format. For example, if the security's final maturity date is January 5,
2010, enter 01052010.
28
AAPPPPEENNDDIIXX AA
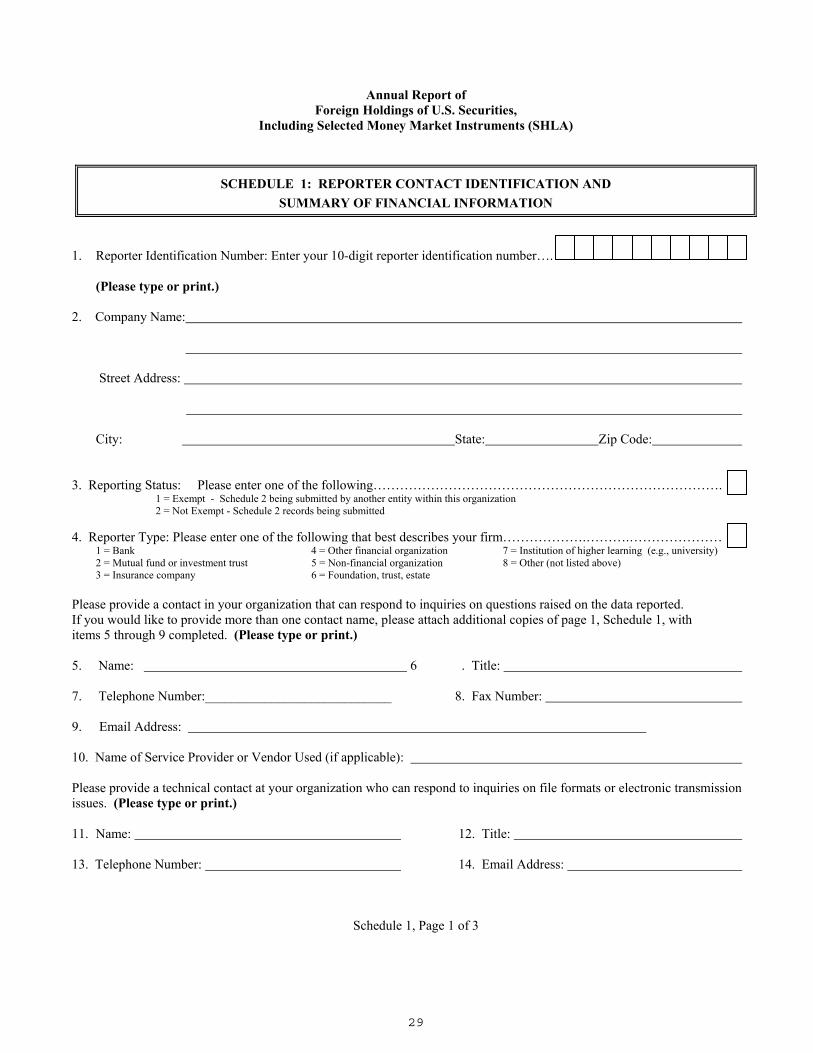
29
Annual Report of
Foreign Holdings of U.S. Securities, Including Selected Money Market Instruments (SHLA)
SCHEDULE 1: REPORTER CONTACT IDENTIFICATION AND
SUMMARY OF FINANCIAL INFORMATION 1. Reporter Identification Number: Enter your 10-digit reporter identification number….
(Please type or print.) 2. Company Name:
Street Address: City: State: Zip Code: 3. Reporting Status: Please enter one of the following……………………………………………………………………. 1 = Exempt - Schedule 2 being submitted by another entity within this organization 2 = Not Exempt - Schedule 2 records being submitted 4. Reporter Type: Please enter one of the following that best describes your firm……………….……….………………… 1 = Bank 4 = Other financial organization 7 = Institution of higher learning (e.g., university) 2 = Mutual fund or investment trust 5 = Non-financial organization 8 = Other (not listed above) 3 = Insurance company 6 = Foundation, trust, estate Please provide a contact in your organization that can respond to inquiries on questions raised on the data reported. If you would like to provide more than one contact name, please attach additional copies of page 1, Schedule 1, with items 5 through 9 completed. (Please type or print.)
5. Name: 6 . Title: 7. Telephone Number:____________________________ 8. Fax Number: 9. Email Address: 10. Name of Service Provider or Vendor Used (if applicable): Please provide a technical contact at your organization who can respond to inquiries on file formats or electronic transmission issues. (Please type or print.)
11. Name: 12. Title: 13. Telephone Number: 14. Email Address:
Schedule 1, Page 1 of 3
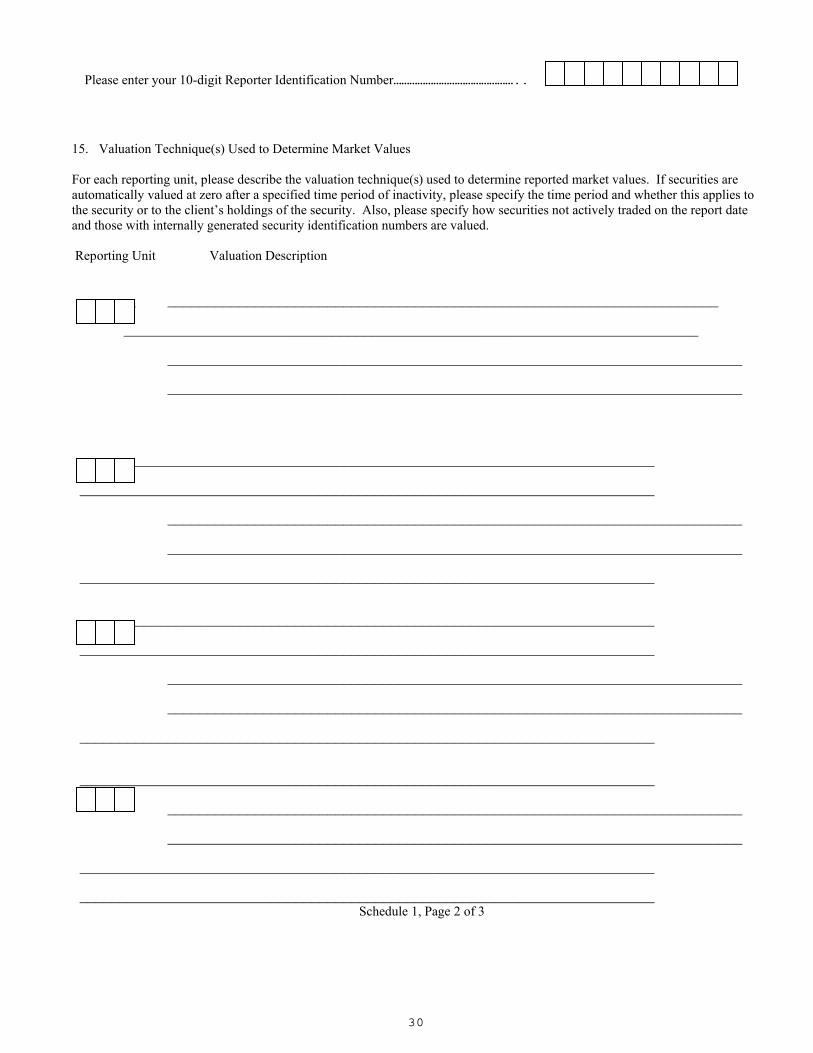
30
Please enter your 10-digit Reporter Identification Number………………………………………..
15. Valuation Technique(s) Used to Determine Market Values For each reporting unit, please describe the valuation technique(s) used to determine reported market values. If securities are automatically valued at zero after a specified time period of inactivity, please specify the time period and whether this applies to the security or to the client’s holdings of the security. Also, please specify how securities not actively traded on the report date and those with internally generated security identification numbers are valued. Reporting Unit Valuation Description
__ _____________________________________________________________________
________________________________________________________________________
________________________________________________________________________
________________________________________________________________________
________________________________________________________________________
________________________________________________________________________
________________________________________________________________________
________________________________________________________________________
________________________________________________________________________
________________________________________________________________________
________________________________________________________________________
________________________________________________________________________
________________________________________________________________________
________________________________________________________________________
________________________________________________________________________
________________________________________________________________________
________________________________________________________________________
________________________________________________________________________
________________________________________________________________________ Schedule 1, Page 2 of 3
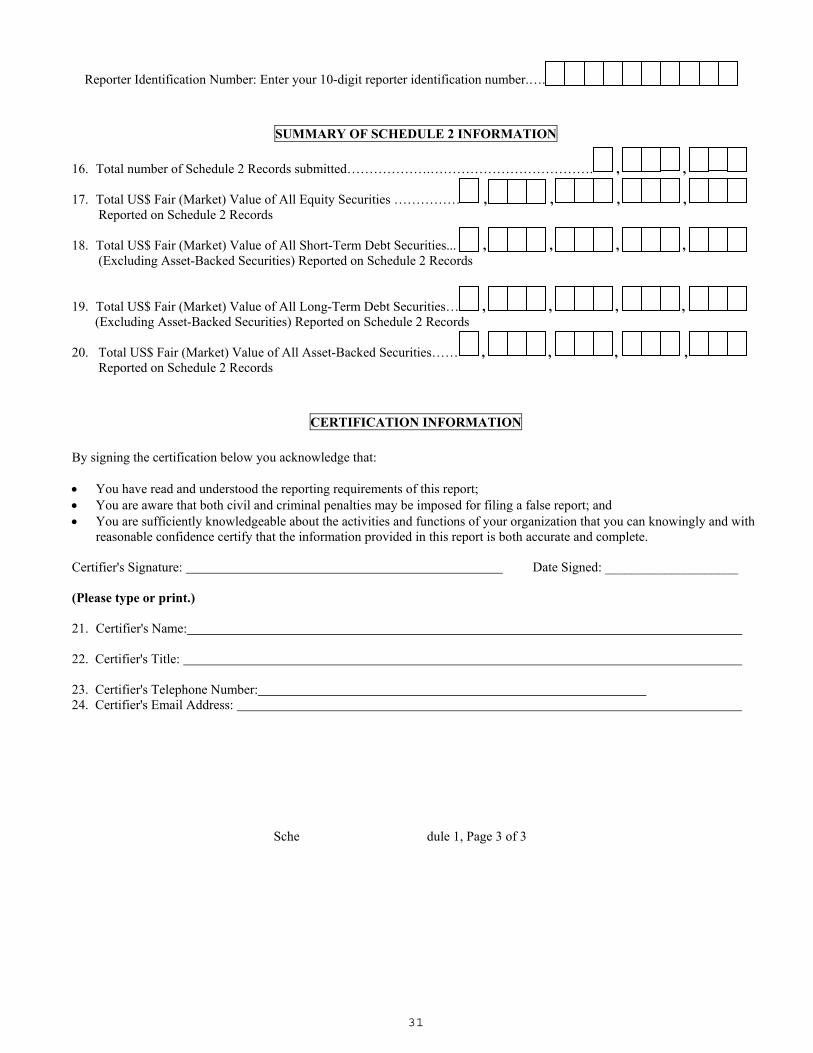
31
Reporter Identification Number: Enter your 10-digit reporter identification number.…...
SUMMARY OF SCHEDULE 2 INFORMATION 16. Total number of Schedule 2 Records submitted……………….………………………………. , , 17. Total US$ Fair (Market) Value of All Equity Securities …………… , , , , Reported on Schedule 2 Records 18. Total US$ Fair (Market) Value of All Short-Term Debt Securities... , , , , (Excluding Asset-Backed Securities) Reported on Schedule 2 Records
19. Total US$ Fair (Market) Value of All Long-Term Debt Securities… , , , , (Excluding Asset-Backed Securities) Reported on Schedule 2 Records 20. Total US$ Fair (Market) Value of All Asset-Backed Securities…… , , , , Reported on Schedule 2 Records
CERTIFICATION INFORMATION
By signing the certification below you acknowledge that: • You have read and understood the reporting requirements of this report; • You are aware that both civil and criminal penalties may be imposed for filing a false report; and • You are sufficiently knowledgeable about the activities and functions of your organization that you can knowingly and with
reasonable confidence certify that the information provided in this report is both accurate and complete. Certifier's Signature: Date Signed: ____________________ (Please type or print.) 21. Certifier's Name: 22. Certifier's Title: 23. Certifier's Telephone Number: 24. Certifier's Email Address: Sche dule 1, Page 3 of 3
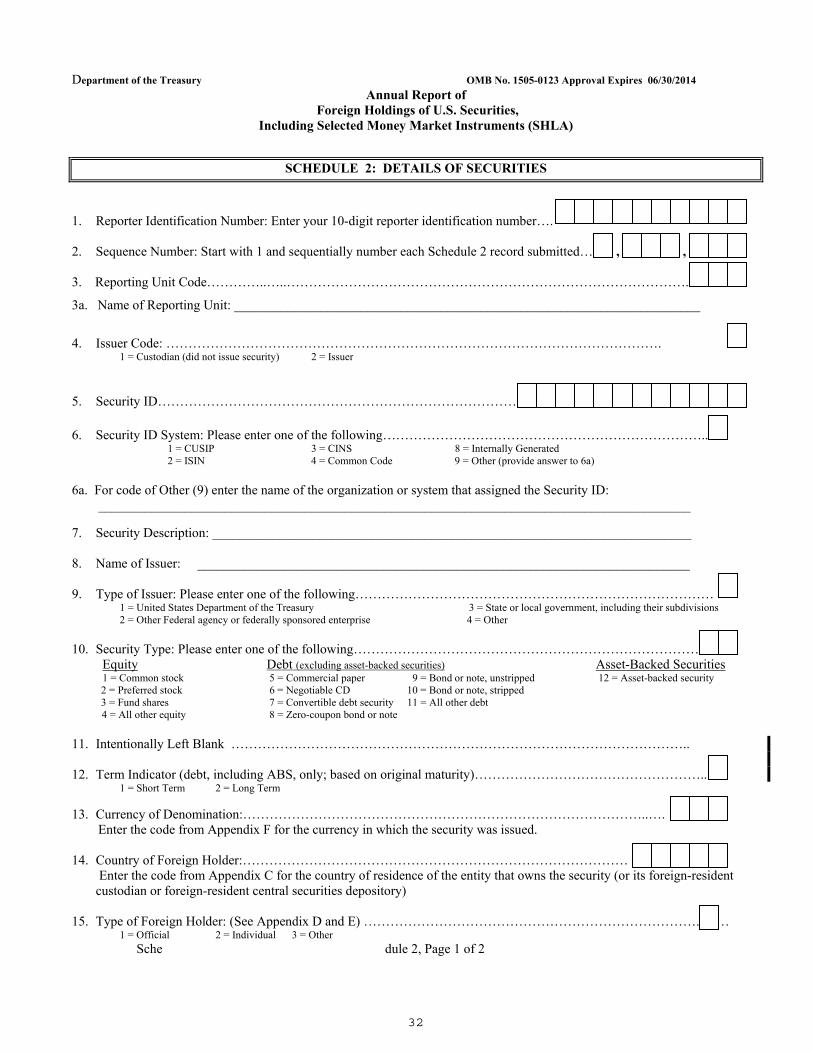
32
Department of the Treasury OMB No. 1505-0123 Approval Expires 06/30/2014 Annual Report of
Foreign Holdings of U.S. Securities, Including Selected Money Market Instruments (SHLA)
SCHEDULE 2: DETAILS OF SECURITIES 1. Reporter Identification Number: Enter your 10-digit reporter identification number…. 2. Sequence Number: Start with 1 and sequentially number each Schedule 2 record submitted… , , 3. Reporting Unit Code…………..…..……………………………………………………………………………….
3a. Name of Reporting Unit: ______________________________________________________________________
4. Issuer Code: …………………………………………………………………………………………………. 1 = Custodian (did not issue security) 2 = Issuer 5. Security ID………………………………………………………………………
6. Security ID System: Please enter one of the following……………………………………………………………….. 1 = CUSIP 3 = CINS 8 = Internally Generated 2 = ISIN 4 = Common Code 9 = Other (provide answer to 6a) 6a. For code of Other (9) enter the name of the organization or system that assigned the Security ID: _________________________________________________________________________________________ 7. Security Description: ________________________________________________________________________ 8. Name of Issuer: __________________________________________________________________________ 9. Type of Issuer: Please enter one of the following………………………………………………………………………
1 = United States Department of the Treasury 3 = State or local government, including their subdivisions 2 = Other Federal agency or federally sponsored enterprise 4 = Other 10. Security Type: Please enter one of the following…………………………………………………………………… Equity Debt (excluding asset-backed securities) Asset-Backed Securities 1 = Common stock 5 = Commercial paper 9 = Bond or note, unstripped 12 = Asset-backed security 2 = Preferred stock 6 = Negotiable CD 10 = Bond or note, stripped 3 = Fund shares 7 = Convertible debt security 11 = All other debt 4 = All other equity 8 = Zero-coupon bond or note 11. Intentionally Left Blank ………………………………………………………………………………………….. 12. Term Indicator (debt, including ABS, only; based on original maturity)……………………………………………... 1 = Short Term 2 = Long Term 13. Currency of Denomination:………………………………………………………………………………..…. Enter the code from Appendix F for the currency in which the security was issued. 14. Country of Foreign Holder:……………………………………………………………………………
Enter the code from Appendix C for the country of residence of the entity that owns the security (or its foreign-resident custodian or foreign-resident central securities depository)
15. Type of Foreign Holder: (See Appendix D and E) …………………………………………………………………..…… 1 = Official 2 = Individual 3 = Other Sche dule 2, Page 1 of 2
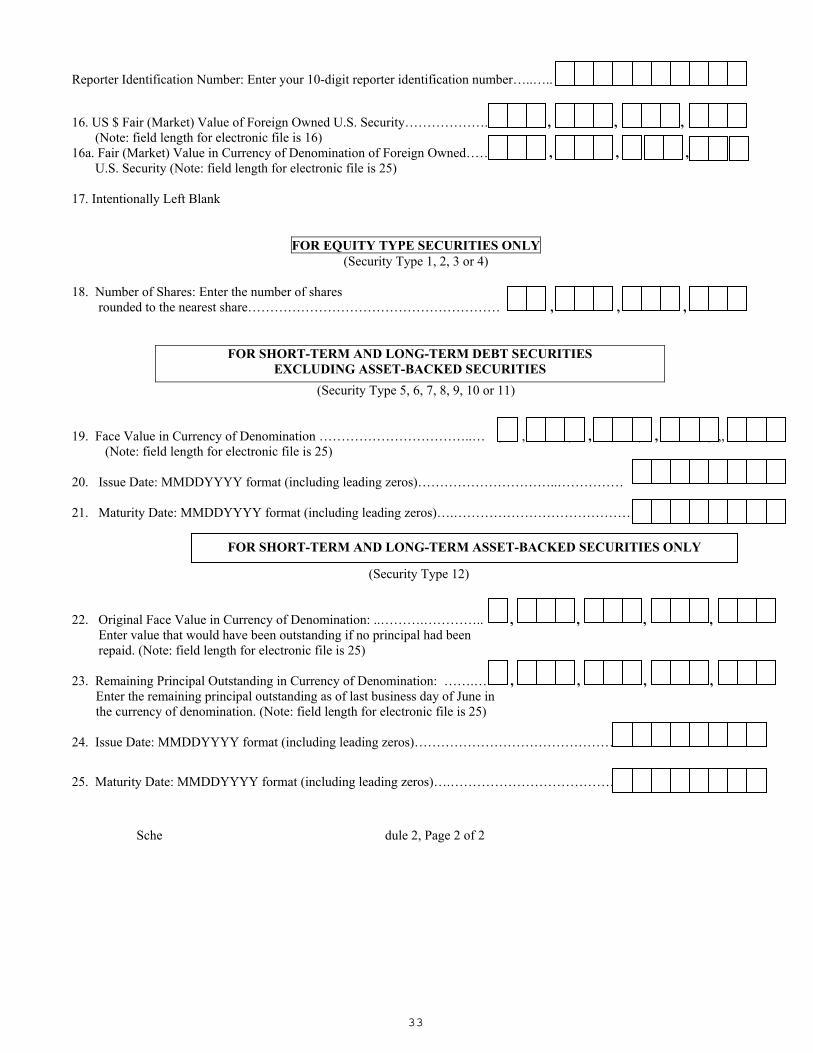
33
Reporter Identification Number: Enter your 10-digit reporter identification number…..…..
16. US $ Fair (Market) Value of Foreign Owned U.S. Security………………. , , , (Note: field length for electronic file is 16) 16a. Fair (Market) Value in Currency of Denomination of Foreign Owned…… , , , U.S. Security (Note: field length for electronic file is 25) 17. Intentionally Left Blank
FOR EQUITY TYPE SECURITIES ONLY (Security Type 1, 2, 3 or 4)
18. Number of Shares: Enter the number of shares rounded to the nearest share………………………………………………… , , ,
FOR SHORT-TERM AND LONG-TERM DEBT SECURITIES EXCLUDING ASSET-BACKED SECURITIES
(Security Type 5, 6, 7, 8, 9, 10 or 11)
19. Face Value in Currency of Denomination ……………………………..… , , , , , , , ,, (Note: field length for electronic file is 25) 20. Issue Date: MMDDYYYY format (including leading zeros)…………………………..…………… 21. Maturity Date: MMDDYYYY format (including leading zeros)….……………………………………………………………
ASSET BACKED SECURITIES ONLY
(Security Type 12)
22. Original Face Value in Currency of Denomination: ..……….………….. , , , , Enter value that would have been outstanding if no principal had been repaid. (Note: field length for electronic file is 25) 23. Remaining Principal Outstanding in Currency of Denomination: …….… , , , ,
Enter the remaining principal outstanding as of last business day of June in the currency of denomination. (Note: field length for electronic file is 25)
24. Issue Date: MMDDYYYY format (including leading zeros)……………………………………………………………….. 25. Maturity Date: MMDDYYYY format (including leading zeros)….………………………………………………………… Sche dule 2, Page 2 of 2
FOR SHORT-TERM AND LONG-TERM ASSET-BACKED SECURITIES ONLY
34
AAPPPPEENNDDIIXX BB
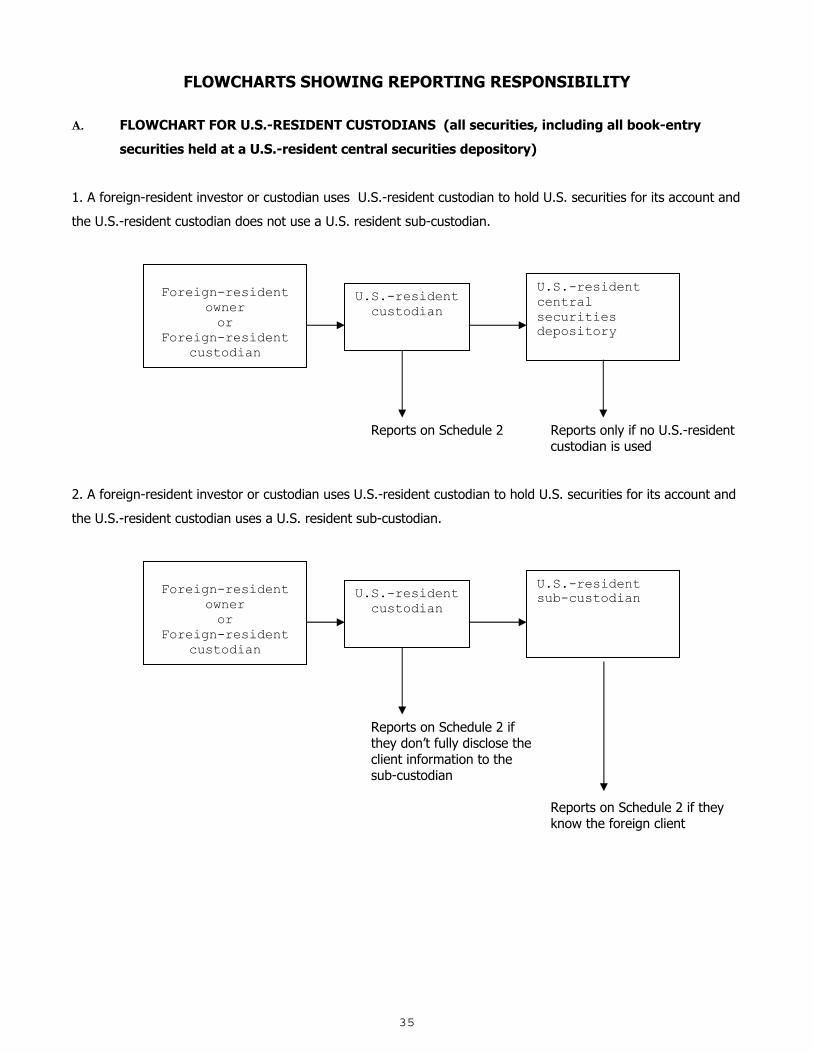
35
FLOWCHARTS SHOWING REPORTING RESPONSIBILITY
A. FLOWCHART FOR U.S.-RESIDENT CUSTODIANS (all securities, including all book-entry
securities held at a U.S.-resident central securities depository)
1. A foreign-resident investor or custodian uses U.S.-resident custodian to hold U.S. securities for its account and
the U.S.-resident custodian does not use a U.S. resident sub-custodian.
Reports on Schedule 2 Reports only if no U.S.-resident custodian is used
2. A foreign-resident investor or custodian uses U.S.-resident custodian to hold U.S. securities for its account and
the U.S.-resident custodian uses a U.S. resident sub-custodian.
Reports on Schedule 2 if they don’t fully disclose the client information to the sub-custodian
Reports on Schedule 2 if they know the foreign client
Foreign-resident
owner or
Foreign-resident custodian
U.S.-resident custodian
U.S.-resident central securities depository
Foreign-resident
owner or
Foreign-resident custodian
U.S.-resident custodian
U.S.-resident sub-custodian
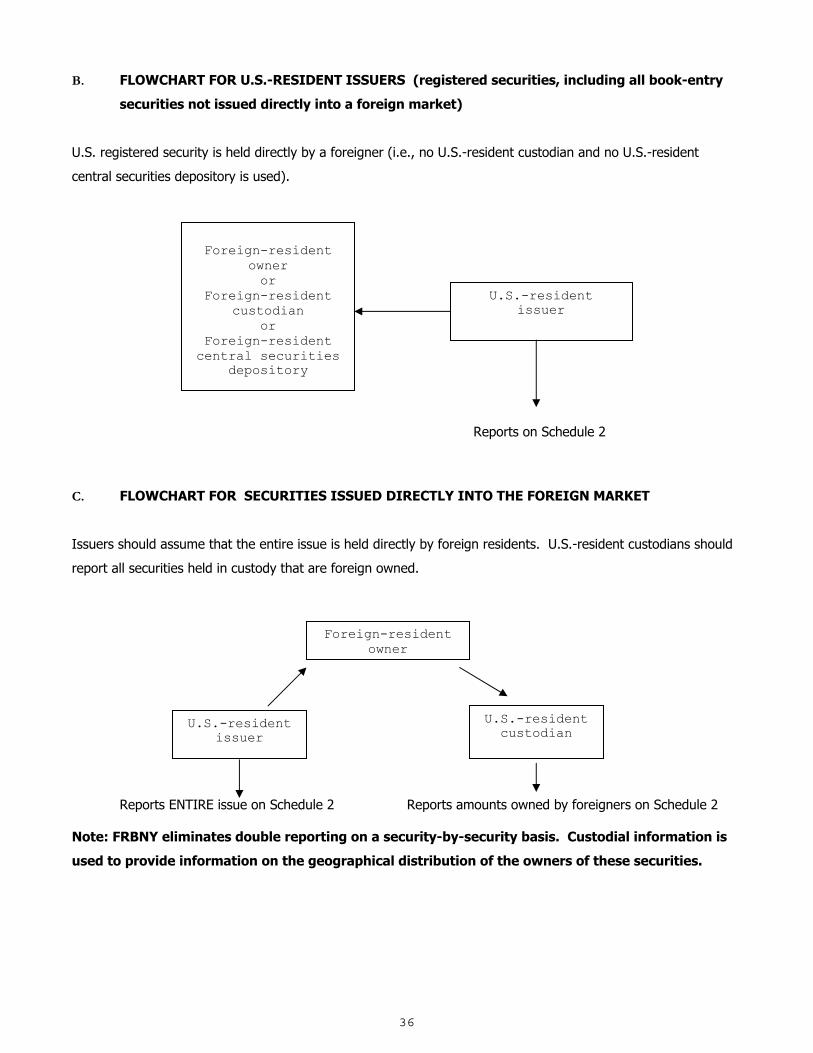
36
B. FLOWCHART FOR U.S.-RESIDENT ISSUERS (registered securities, including all book-entry
securities not issued directly into a foreign market)
U.S. registered security is held directly by a foreigner (i.e., no U.S.-resident custodian and no U.S.-resident
central securities depository is used).
Reports on Schedule 2
C. FLOWCHART FOR SECURITIES ISSUED DIRECTLY INTO THE FOREIGN MARKET
Issuers should assume that the entire issue is held directly by foreign residents. U.S.-resident custodians should
report all securities held in custody that are foreign owned.
↓ ↓
Reports ENTIRE issue on Schedule 2 Reports amounts owned by foreigners on Schedule 2 Note: FRBNY eliminates double reporting on a security-by-security basis. Custodial information is
used to provide information on the geographical distribution of the owners of these securities.
Foreign-resident owner
U.S.-resident issuer
U.S.-resident custodian
Foreign-resident
owner or
Foreign-resident custodian
or Foreign-resident central securities
depository
U.S.-resident issuer
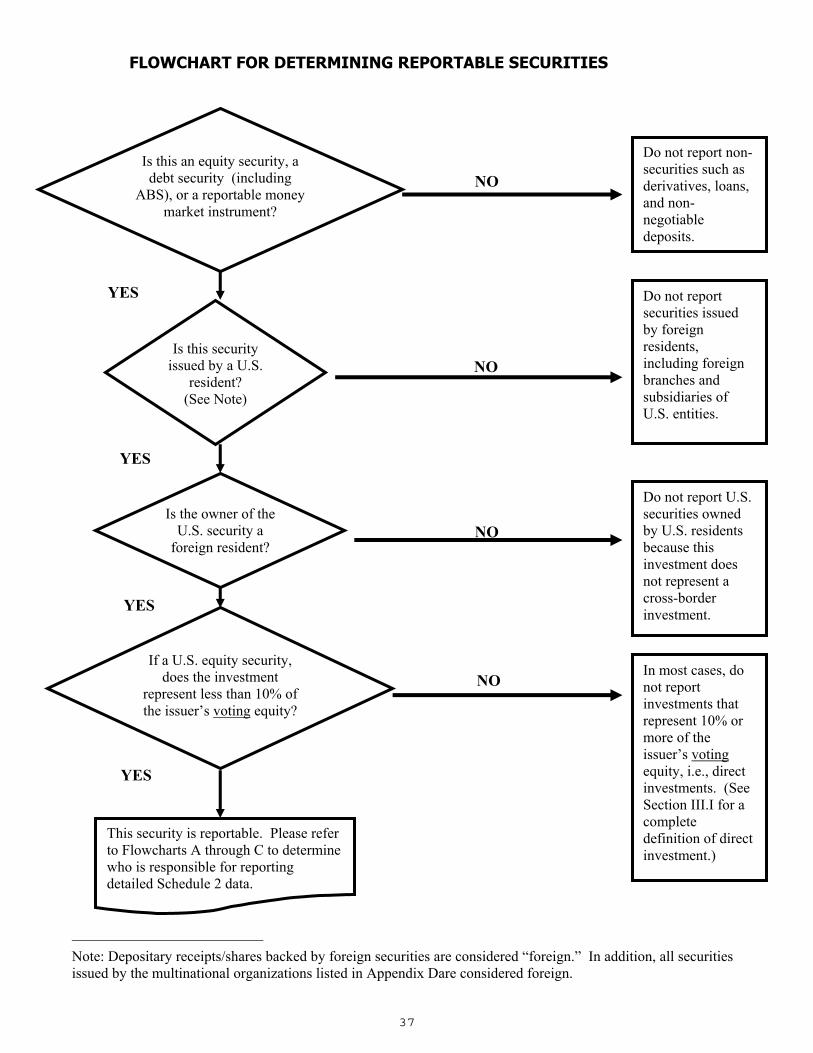
37
NO
YES
NO3
YES
NO
YES
N NO
YES
Note: Depositary receipts/shares backed by foreign securities are considered “foreign.” In addition, all securities issued by the multinational organizations listed in Appendix Dare considered foreign.
Is this an equity security, a debt security (including
ABS), or a reportable money market instrument?
Do not report non-securities such as derivatives, loans, and non-negotiable deposits.
Is this security issued by a U.S.
resident? (See Note)
Do not report securities issued by foreign residents, including foreign branches and subsidiaries of U.S. entities.
FLOWCHART FOR DETERMINING REPORTABLE SECURITIES
If a U.S. equity security, does the investment
represent less than 10% of the issuer’s voting equity?
In most cases, do not report investments that represent 10% or more of the issuer’s voting equity, i.e., direct investments. (See Section III.I for a complete definition of direct investment.)
Is the owner of the U.S. security a
foreign resident?
Do not report U.S. securities owned by U.S. residents because this investment does not represent a cross-border investment.
This security is reportable. Please refer to Flowcharts A through C to determine who is responsible for reporting detailed Schedule 2 data.
Revised April 18, 2006 38
AAPPPPEENNDDIIXX CC
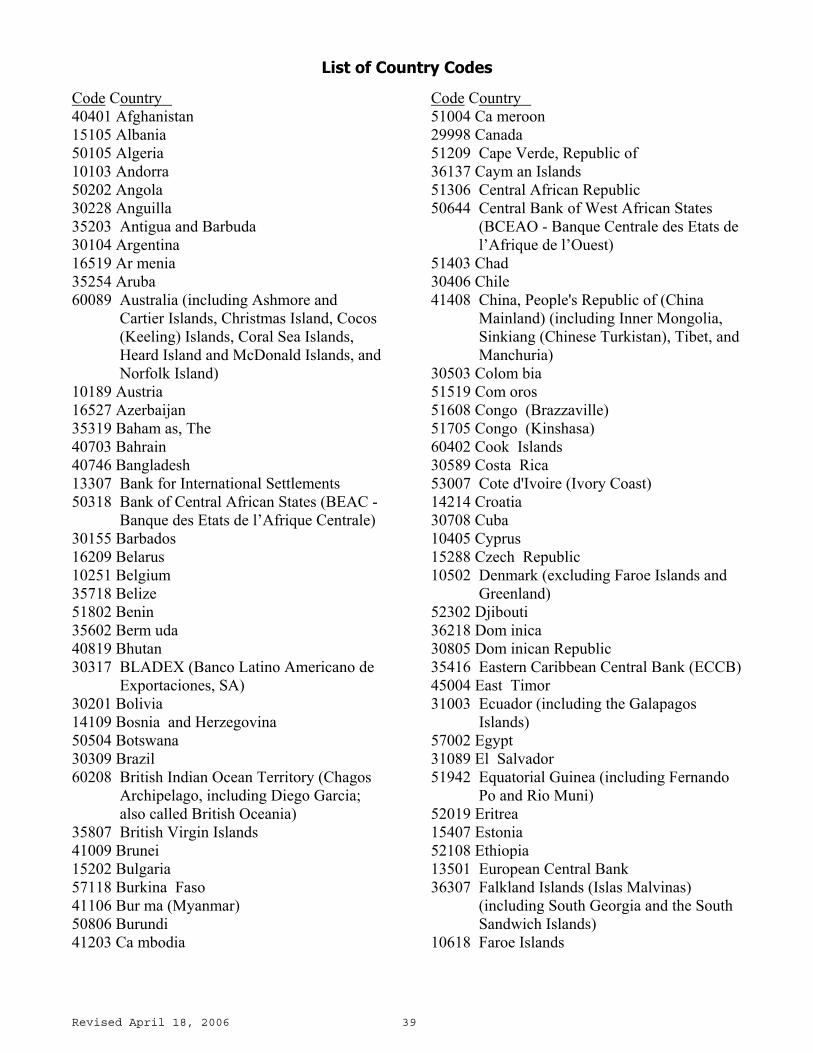
Revised April 18, 2006 39
List of Country Codes
Code Country 40401 Afghanistan 15105 Albania 50105 Algeria 10103 Andorra 50202 Angola 30228 Anguilla 35203 Antigua and Barbuda 30104 Argentina 16519 Ar menia 35254 Aruba 60089 Australia (including Ashmore and
Cartier Islands, Christmas Island, Cocos (Keeling) Islands, Coral Sea Islands, Heard Island and McDonald Islands, and Norfolk Island)
10189 Austria 16527 Azerbaijan 35319 Baham as, The 40703 Bahrain 40746 Bangladesh 13307 Bank for International Settlements 50318 Bank of Central African States (BEAC -
Banque des Etats de l’Afrique Centrale) 30155 Barbados 16209 Belarus 10251 Belgium 35718 Belize 51802 Benin 35602 Berm uda 40819 Bhutan 30317 BLADEX (Banco Latino Americano de Exportaciones, SA) 30201 Bolivia 14109 Bosnia and Herzegovina 50504 Botswana 30309 Brazil 60208 British Indian Ocean Territory (Chagos
Archipelago, including Diego Garcia; also called British Oceania)
35807 British Virgin Islands 41009 Brunei 15202 Bulgaria 57118 Burkina Faso 41106 Bur ma (Myanmar) 50806 Burundi 41203 Ca mbodia
Code Country 51004 Ca meroon 29998 Canada 51209 Cape Verde, Republic of 36137 Caym an Islands 51306 Central African Republic 50644 Central Bank of West African States
(BCEAO - Banque Centrale des Etats de l’Afrique de l’Ouest)
51403 Chad 30406 Chile 41408 China, People's Republic of (China
Mainland) (including Inner Mongolia, Sinkiang (Chinese Turkistan), Tibet, and Manchuria)
30503 Colom bia 51519 Com oros 51608 Congo (Brazzaville) 51705 Congo (Kinshasa) 60402 Cook Islands 30589 Costa Rica 53007 Cote d'Ivoire (Ivory Coast) 14214 Croatia 30708 Cuba 10405 Cyprus 15288 Czech Republic 10502 Denmark (excluding Faroe Islands and Greenland) 52302 Djibouti 36218 Dom inica 30805 Dom inican Republic 35416 Eastern Caribbean Central Bank (ECCB) 45004 East Timor 31003 Ecuador (including the Galapagos Islands) 57002 Egypt 31089 El Salvador 51942 Equatorial Guinea (including Fernando
Po and Rio Muni) 52019 Eritrea 15407 Estonia 52108 Ethiopia 13501 European Central Bank 36307 Falkland Islands (Islas Malvinas)
(including South Georgia and the South Sandwich Islands)
10618 Faroe Islands
Revised April 18, 2006 40
Code Country 60305 Federated States of Micronesia 60607 Fiji 10707 Finland (including Ahvenanamaa (Aland Islands)) 10804 France (excluding Andorra, French Guiana, Guadeloupe, Martinique, Mayotte, Monaco, Reunion, & St. Pierre, & Miquelon) 36404 French Guiana 60704 French Polynesia (including Tahiti and
Clipperton Island) 52418 Gabon 52507 Ga mbia, The 16535 Georgia 11002 Germany (Comprises the Federal Republic of Germany and the former German Democratic Republic) 52604 Ghana 11088 Gibraltar 11207 Greece (including the Aegean Islands (Khios, Kikladhes, Evvoia, Lesvos, Samos, Samothraki, etc.), the Dodecanese Islands (and Rhodes), the Ionian Islands, and Crete) 10545 Greenland 36706 Grenada 36803 Guadeloupe (including islands of Marie-
Galante, La Desirade, Iles des Saintes, Saint Barthelemy, and northern Saint Martin)
31208 Guatem ala 13006 Guernsey (including islands of
Alderney, Herm, Sark, and nearby smaller islands)
52701 Guinea 54402 Guinea-Bissau 31305 Guyana, Co-Operative Republic of 31402 Haiti 13102 Holy See (Vatican City) 31488 Honduras 42005 Hong Kong (including Kowloon and the New Territories) 15504 Hungary 11304 Iceland 42102 India (including Sikkim, Andaman and
Nicobar Islands, Goa, and Laccadive Islands (Union Territory of Lakshadweep))
42218 Indonesia (including Timor (Western) and West New Guinea)
Code Country 42307 Iran 42404 Iraq 11401 Ireland 13008 Isle of Man 42501 Israel 11509 Italy (excluding San Marino) 31607 Jam aica 42609 Japan 13007 Jersey 42706 Jordan 16543 Kazakhstan 53104 Kenya 60526 Kiribati 44407 Korea, North 43001 Korea, South 43109 Kuwait 16551 Kyrgyzstan 43303 Laos 15601 Latvia 43419 Lebanon 53155 Lesotho 53201 Liberia 53309 Libya 11606 Liechtenstein 15709 Lithuania 11703 Luxem bourg 43508 Macau 14419 Macedonia, The Former Yugoslav
Republic of 53406 Madagascar 53503 Malawi 43605 Malaysia (including Labuan, Sabah
(North Borneo) and Sarawak and former Federation of Malaya)
43702 Maldives 53589 Mali 11819 Malta (including Gozo) 61204 Marshall Islands 37001 Martinique 53708 Mauritania 53805 Mauritius 54518 Mayotte 31704 Mexico (including Cozumel and
Revillagigedo Islands) 16306 Moldova 12009 Monaco
Revised April 18, 2006 41
Code Country 43818 Mongolia 37109 Montserrat 54003 Morocco (including Tangier and Ifni) 54089 Mozam bique 54127 Na mibia 61301 Nauru 44202 Nepal 12106 Netherlands 37206 Netherlands Antilles (the islands of
Curacao, Bonaire, Saba, Sint Eustatius, and Sint Maarten (southern St. Martin)
61409 New Caledonia 61689 New Zealand 31801 Nicaragua 54208 Niger 54305 Nigeria 61808 Niue 12203 Norway (including Bouvet Island, Jan
Mayen, and Svalbard) 44105 Oman (including Muscat) 44709 Pakistan 62502 Palau 31887 Panama (including Canal Zone) 61751 Papua New Guinea 32107 Paraguay 32204 Peru 44806 Philipp ines 62103 Pitcairn Islands 15768 Poland 12319 Portugal (including Azores and Madeira Islands) 45101 Qatar 54607 Reunion (including islands of Bassas de
India, Europa Island, Glorioso Island, Juan de Nova Island, and Tromelin Island)
15806 Rom ania 16101 Russia 55018 Rwanda 55107 Saint Helena (includes Ascension Island
and Island group of Tristan de Cunha) 37303 Saint Kitts and Nevis 37508 Saint Lucia 62219 Saint Pierre and Miquelon 37605 Saint Vincent and the Grenadines 62618 Samoa (formerly Western Samoa) 12408 San Marino 55204 Sao Tome and Principe
Code Country 45608 Saudi Arabia 55301 Senegal 13218 Serbia and Montenegro (formerly
Yugoslavia) 55409 Seychelles 55506 Sierra Leone 46019 Singapore 15318 Slovakia 14338 Slovenia 62308 Solom on Islands 55603 Som alia 55719 South Africa 12505 Spain (including Canary Islands) 41319 Sri Lanka 56103 Sudan 37702 Surinam e 56219 Swaziland 12602 Sweden 12688 Switzerland (excluding Liechtenstein) 46205 Syria 46302 Taiwan 16578 Tajikistan 56405 Tanzania (including Zanzibar) 46418 Thailand 56502 Togo 62405 Tokelau 62448 Tonga 32409 Trinidad and Tobago 56707 Tunisia 12807 Turkey (including Aegean Islands of
Imbros and Bozcaada (Tenedos)) 16616 Turkm enistan 37818 Turks and Caicos Islands 60518 Tuvalu 56804 Uganda 16403 Ukraine 46604 United Arab Emirates (including Abu
Dhabi, Ajman, Dubai, Fujairah, Ras al Khaimah, Sharjah (including Kalbah), and Umm al Qaiwain)
13005 United Kingdom (including England, Northern Ireland, Scotland, Wales, Hebrides, Orkney Islands, and Shetland Islands)
32603 Uruguay 16705 Uzbekistan 61603 Vanuatu
Revised April 18, 2006 42
Code Country Vatican City (see Holy See) 32719 Venezuela 46906 Vietnam 60119 Wallis and Futuna 47201 West Bank and Gaza 56006 Western Sahara 47104 Yemen (Comprises the former Yemen
Arab Republic and the former People’s Democratic Republic of Yemen)
57207 Zam bia 54704 Zim babwe 72907 International Organizations1
Code Country 73903 European Regional Organizations1 74918 Latin American Regional Organizations1 74942 Caribbean Regional Organizations1 75906 Asian Regional Organizations1 76902 African Regional Organizations1 77909 Middle Eastern Regional Organizations1 88862 Country Unknown 1 See Appendix D for a list of International and Regional Organizations.
Special cases for this report:
This note applies to the following five geographic areas; they are without permanent occupants and/or are areas claimed/occupied by different countries: Antarctica; French Southern and Antarctic Lands (includes Ile Amsterdam, Ile Saint-Paul, Ile Crozet and Iles Kerguelen in southern Indian Ocean); the Paracel Islands; South Georgia and South Sandwich Islands; and the Spratly Islands.
Survey respondents should allocate such holdings to the TIC country-code used by the holders for tax purposes, or alternatively, the nationality of the holder.

43
AAPPPPEENNDDIIXX DD
44
List of International and Regional Organizations The institutions listed below should be classified as option 1 (Official) on item 15 of Schedule 2.
INTERNATIONAL ORGANIZATIONS (country code 72907)
Food and Agriculture Organization (FAO) Franc Zone International Organization for Migration International Atomic Energy Agency International Bank for Reconstruction and
Development (IBRD) (part of World Bank) United Nations Children's Fund (UNICEF) International Civil Aviation Organization International Criminal Court International Development Association (IDA)
(part of World Bank) International Finance Corporation (IFC) International Fund for Agricultural Development International Labor Organization (ILO) International Monetary Fund (IMF) International Red Cross Multilateral Investment Guaranty Agency (MIGA) Preparatory Commission for the Comprehensive Nuclear-Test-Ban Treaty Organization United Nations (UN), and Specialized Agencies and
Commissions Universal Postal Union World Health Organization (WHO) World Intellectual Property Organization (WIPO) World Trade Organization (WTO)
AFRICAN REGIONAL ORGANIZATIONS (country code 76902)
African Development Bank (AfDB) African Union (formerly Organization of African
Unity) Arab Bank for Economic Development in Africa
(BADEA) Conseil de l'Entente East African Common Service Organization East African Community East African Development Bank Organisation Commune Africaine et Mauricienne
(OCAM) Special Arab Fund for Africa Union des Etats de l'Afrique Centrale Union Douaniere des Etats de l'Afrique de l'Ouest Union Douaniere et Economique de l'Afrique
Centrale (UDEAC) (Customs and Economic Union of Central Africa)
Union Monetaire Ouest-Africaine (UMOA) (West African Monetary Union)
ASIAN REGIONAL ORGANIZATIONS
(country code 75906) Asian Development Bank (ADB) Association of Southeast Asian Nations (ASEAN) Central Treaty Organizations (CENTO)
Colombo Plan for Co-Operative Econ omic and Social Development in Asia and the Pacific
CARIBBEAN REGIONAL ORGANIZATIONS (country code 74942)
Caribbean Community and Common Market
(CARICOM) Caribbean Development Bank Caribbean Investment Corporation Caribbean Regional Development Agency East Caribbean Development Bank Organization of Eastern Caribbean States (OECS)
EUROPEAN REGIONAL ORGANIZATIONS (country code 73903)
Council of Europe Eurocontrol Eurofima European Atomic Energy Community (Euratom) European Bank for Reconstruction and Development
(EBRD) European Development Fund (EDF) European Free Trade Association (EFTA) European Investment Bank (EIB) European Investment Fund European Union (EU) (includes the EC) Nordic Investment Bank North Atlantic Treaty Organization (NATO) Organization for Economic Cooperation and
Development (OECD)
45
LATIN AMERICAN REGIONAL ORGANIZATIONS (country code 74918)
Andean Development Corporation Andean Community of Nations (CAN) (formerly
Andean Group) Banco Latino Americano De Exportaciones, SA
(BLADEX) Central American Bank of Economic Integration
(CABEI; Banco Centralamericano de Integracion Economica (BCIE))
Central American Common Market (CACM) Inter-American Development Bank (IDB) Inter-American Investment Corporation Inter-American Savings and Loan Bank Latin American Integration Association Latin American Reserve Fund (FLAR)
(formerly Andean Reserve Fund) North American Development Bank (NADBank) Organization of American States (OAS) (Pan
American Union) and affiliated organizations Organization of Central American States (OCAS) Pan American Health Organization (Pan American
Sanitary Bureau) Permanent Secretariat of the General Treaty on
Central American Economic Integration River Plate Basin Commission Sistema Economico Latinamericano (SELA)
(Latin American Economic System)
MIDDLE EASTERN REGIONAL ORGANIZATIONS (country code 77909)
Arab Authority for Agricultural Investment and
Development Arab Fund for Economic and Social Development
(AFESD) Arab Fund for Technical Assistance to Arab and
African Countries Arab Investment Company Arab Joint Investment Company (U.A.E.- Egypt
Investment Company) Arab Monetary Fund Arab Petroleum Investment Company Cooperation Council for the Arab States of the Gulf
(also Gulf Cooperation Council (GCC)) Gulf Investment Corporation Inter-Arab Investment Guarantee Corporation Islamic Development Bank Islamic Solidarity Fund Muslim World League OPEC Special Fund Organization of Arab Petroleum Exporting
Countries (OAPEC) Fund for Arab Oil Importing Countries OAPEC Oil Facility OAPEC Special Account Special Fund for Arab Non-oil Producers Organization of the Islamic Conference Saudi-Egyptian Industrial Investment Company Saudi-Egyptian Reconstruction Company Solidarity Fund for Economic and Social
Development in Non-aligned Countries United Arab Shipping Company
Revised: June 2008
46
APPENDIX E
NOT FOR PUBLICATION Department of The Treasury January 2001, Revised Aug. 2002, May 2004, May 2005, July 2006, June 2007, June 2008
List of certain Foreign Institutions classified as Official for purposes of
reporting on the Treasury International Capital (TIC) forms
The attached list does not purport to be exhaustive; it only includes the major foreign official institutions which have come to the attention of the Federal Reserve Banks and the Department of the Treasury. For any questions on whether an institution is considered a "Foreign Official Institution" for TIC reporting purposes, please contact your Federal Reserve Bank analyst. It should be noted that the list does not in every case include all alternative names applying to the same institution. For example, the list does not include all the administrative departments of the foreign central governments nor all special or sub accounts of foreign official institutions, although all are to be treated as official. In cases in which legations have been changed to embassies, the embassy is shown on the list; reporting institutions continuing to hold an account in the name of the legation, however, should consider it as official. AFGHANISTAN Afghan Permanent Mission to the United Nations The Central Bank of Afghanistan (Da Afghanistan Bank) Consulate of Afghanistan Embassy of Afghanistan Republic of Afghanistan ALBANIA Albanian Permanent Mission to the United Nations Bank of Albania (Banka e Shtetit Shqiperise) Consulate of the Republic of Albania Embassy of the Republic of Albania Ministry of Finance Ministry of Foreign Affairs Republic of Albania ALGERIA Algerian Permanent Mission to the United Nations Bank of Algeria (Banque d'Algerie) Consular Office People’s Democratic Republic of Algeria Economic and Administrative Office Embassy of the People's Democratic Republic of Algeria Militar y Office Revenue Regulation Fund (Fond de Regulation des Recettes) ANDORRA Embassy of Andorra Government of Andorra Ministeri de Finances i Interior Principality of Andorra ANGOLA Angolan Permanent Mission to the United Nations Consulate of the Republic of Angola Embassy of the Republic of Angola National Bank of Angola (Banco Nacional de Angola) Republic of Angola T rade Office
ANGUILLA Governm ent of Anguilla Ministry of Finance ANTIGUA and BARBUDA Consulate of Antigua and Barbuda Embassy of Antigua and Barbuda Ministry of Finance Government of Antigua and Barbuda ARGENTINA Argentine Government Purchasing Missions Argentine Permanent Mission to the United Nations Argentine Republic Banco Central de la Republica Argentina (Central Bank of Argentine Republic) Comision de Adquisiciones Aeronauticas en Canada y los Estados Unidos Consular, Cultural, Accounting Offices Consulate of the Argentine Republic Embassy of the Argentine Republic Instituto Argentino de Promocion del Intercambio (IAPI) Ministry of Finance Office of Air Attache Office of Argentine Trade Office of Financial Attache Office of Military Attache Office of Naval Attache Office of Tourism ARMENIA Central Bank of Armenia Consulate of the Republic of Armenia Embassy of the Republic of Armenia Republic of Armenia
47
ARUBA Centrale Bank van Aruba (Central Bank of Aruba) Department of Economic Affairs, Commerce and Industry Government of Aruba AUSTRALIA Australian Imperial Force Australian Permanent Mission to the United Nations Australian State Annuation Board Commonwealth of Australia Consulate of Australia Embassy of Australia Future Fund (Commonwealth of Australia) Office of Air Attache Reserve Bank of Australia Reserve Bank of Australia Senior Trade Commission AUSTRIA Oesterrei chische Nationalbank (Austrian National Bank) Austrian Permanent Mission to the United Nations Consulate of Austria Office of Austrian Press and Information Office of Austrian Trade Commission Office of Commercial Attache Office of Defense, Military, Naval and Air Attache Embassy of Austria Republic of Austria Trustee of the Austrian Government 1923 43 Bonds AZERBAIJAN Consulate of the Republic of Azerbaijan Embassy of the Republic of Azerbaijan National Bank of Azerbaijan Republic of Azerbaijan State Oil Fund (SOFAZ) BAHAMAS Bahamas Monetary Authority Bahamian Permanent Mission to the United Nations Central Bank of the The Bahamas Commonwealth of the Bahamas Consulate of the Commonwealth of the Bahamas Embassy of the Commonwealth of the Bahamas BAHRAIN Bahrain Monetary Agency Bahrain Permanent Mission to the United Nations Consulate of the Kingdom of Bahrain Embassy of the Kingdom of Bahrain Ministry of Finance and National Economy State of Bahrain BANGLADESH Banglad esh Bank Bangladesh Permanent Mission to the United Nations Consulate of the People's Republic of Bangladesh Embassy of the People's Republic of Bangladesh People's Republic of Bangladesh BANK FOR INTERNATIONAL SETTLEMENTS BANK OF CENTRAL AFRICAN STATES (BEAC; Banque des Etats de l'Afrique Centrale)
BARBADOS Barbados Permanent Mission to the United Nations Central Bank of Barbados Consulate of Barbados Embassy of Barbados Government of Barbados BELARUS Consulate of the Republic of Belarus Embassy of the Republic of Belarus National Bank of the Republic of Belarus Republic of Belarus BELGIUM Belgian Economic Mission (Mission Economique Belge) Belgian Information Center Belgian Permanent Mission to the United Nations Commercial Counselor of Belgium Consulate of Belgium Embassy of Belgium Kingdom of Belgium Nationale Bank van Belgie -- Banque Nationale de Belgique (National Bank of Belgium) Office of Belgian Agricultural Attache Office of Military Attache BELIZE Central Bank of Belize Consulate of Belize Embassy of Belize Government of Belize BENIN Benin Permanent Mission to the United Nations Consulate of the Republic of Benin Embassy of the Republic of Benin Ministry of Development, Economy, and Finance Republic of Benin BERMUDA Bermuda Monetary Authority Government of Bermuda Ministry of Finance BHUTAN Bank of Bhutan Bhutan Permanent Mission to the United Nations Consulate of the Kingdom of Bhutan Kingdom of Bhutan Royal Monetary Authority of Bhutan BOLIVIA Banco Central de Bolivia (Central Bank of Bolivia) Bolivian Army Purchasing Commission Bolivian Government Central Purchasing Agency Bolivian Permanent Mission to the United Nations Consulate of Bolivia Embassy of the Republic of Bolivia Ministry of Finance Office of Military, Naval and Air Attache Republic of Bolivia
48
BOSNIA AND HERZEGOVINA Central Bank of Bosnia and Herzegovina Consulate of Bosnia and Herzegovina Embassy of Bosnia and Herzegovina Government of Bosnia and Herzegovina BOTSWANA Bank of Botswana Botswana Permanent Mission to the United Nations Consulate of the Republic of Botswana Embassy of the Republic of Botswana Pula Fund Republic of Botswana BRAZIL Banco Central do Brasil (Central Bank of Brazil) Banco do Brasil Brazilian Aeronautical Commission Brazilian Air Force Office Brazilian Army Commission Brazilian Consulate (Consulate of Brazil) Brazilian Delegation to the Pan American Union Brazilian Embassy (Embassy of Brazil) Brazilian Naval Commission Brazilian Navy Fund Brazilian Permanent Mission to the United Nations Brazilian Treasury Delegation Comissao Mixta Ferroviaria Brasilieiro Boliviano Federative Republic of Brazil Office of the Financial Counselor BRUNEI Brunei Currency and Monetary Board Brunei Investment Agency Brunei Investment Authority Embassy of the State of Brunei Darussalam General Reserve Fund Government of Negara Brunei Darussalam Ministry of Finance BULGARIA Bulgarian Permanent Mission to the United Nations Bulgarian National Bank (Bulgarska Narodna Banka) Consulate of the Republic of Bulgaria Embassy of the Republic of Bulgaria Legation of the Republic of Bulgaria Office of Armed Forces Attache Office of Commercial Counselor Republic of Bulgaria BURKINA-FASO Burkina Faso Permanent Mission to the United Nations Consulate of Burkina Faso Embassy of Burkina Faso Government of Burkina Faso Ministry of Economy and Development BURMA (MYANMAR) Central Bank of Myanmar Central Treasury Office Consulate of Union of Burma Embassy of Union of Burma Office of Defense, Military, Naval & Air Attache Union of Burma
Union of Burma Permanent Mission to the United Nations BURUNDI
Bank of the Republic of Burundi (Ibanki ya Republika y'Uburundi)
Burundi Permanent Mission to the United Nations Consulate of the Republic of Burundi Embassy of the Republic of Burundi Republic of Burundi CAMBODIA Cambodian Permanent Mission to the United Nations Kingdom of Cambodia National Bank of Cambodia (Banque Nationale du Cambodge) Royal Consulate of Cambodia Royal Embassy of Cambodia CAMEROON Cameroon Permanent Mission to the United Nations Consulate of the Republic of Cameroon Embassy of the Republic of Cameroon Ministry of Economy and Finance Republic of Cameroon CANADA Bank of Canada – Banque du Canada Canadian Army Staff Canadian Joint Staff Canadian Naval Staff Canadian Permanent Mission to the United Nations Consulate General of Canada Department of Trade and Commerce of Canada Government of Canada Dominion of Canada Embassy of Canada Exchange Funds Account Minister of Finance and Receiver General of Canada Office of the Commercial Counselor of Canada CAPE VERDE Banco de Cabo Verde (Bank of Cape Verde) Consulate of the Republic of Cape Verde Embassy of the Republic of Cape Verde Republic of Cape Verde CAYMAN ISLANDS Cayman Islands Monetary Authority Department of Treasury Government of Cayman Islands CENTRAL AFRICAN REPUBLIC Central African Republic
Central African Republic Permanent Mission to the United Nations
Consulate of Central African Republic Embassy of Central African Republic Ministry of Finance and Budget CENTRAL BANK OF WEST AFRICAN STATES (BCEAO; Banque Centrale des Etats de l'Afrique de l'Ouest)
49
CHAD Chad Permanent Mission to the United Nations Embassy of the Republic of Chad Ministry of Economy and Finance Republic of Chad CHILE Banco Central de Chile (Central Bank of Chile) Caja Autonoma de Amortizacion de la Deuda Publica de Chile Chilean Permanent Mission to the United Nations Consulate of the Republic of Chile Economic and Social Stabilization Fund Embassy of the Republic of Chile Ministry of Finance Office of Air Attache Office of Military Attache Office of Naval Attache Pension Reserve Fund Republic of Chile Superintendencia de la Casa de Moneda y Especies Valorades CHINA, MAINLAND Central Huijin Investment China Hueijing Holding Company China Investment Corporation China Jianyin Investment Chinese Permanent Mission to the United Nations
Consulate of the People's Republic of China, and other consular offices in the U.S.
Embassy of the People's Republic of China (including all its offices)
Ministry of Finance Ministry of Foreign Affairs Ministry of Foreign Economic Relations and Trade The People's Bank of China People's Republic of China
State Administration of Foreign Exchange (SAFE) (formerly State Administration for Exchange Control (SAEC))
COLOMBIA Banco de la Republica (Bank of the Republic) Colombian Permanent Mission to the United Nations Consulate of Colombia Embassy of Colombia Republic of Colombia COMOROS Central Bank of the Comoros (Banque Centrale des Comores) Embassy of the Union of Comoros Federal Islamic Republic of the Comoros CONGO (BRAZZAVILLE) Consulate of the Republic of the Congo Embassy of the Republic of the Congo Office of Defense Attache Ministry of Economy, Finance, and Budget Republic of the Congo CONGO (KINSHASA) Banque Centrale du Congo (Central Bank of Congo) Bank of the Democratic Republic of Congo Consulate of the Democratic Republic of the Congo Democratic Republic of the Congo Embassy of the Democratic Republic of the Congo
COOK ISLANDS Consular Office Government of the Cook Islands Ministry of Finance and Economic Management COSTA RICA Banco Central de Costa Rica (Central Bank of Costa Rica) Com mercial Office Consulate of Costa Rica Costa Rican Permanent Mission to the United Nations Embassy of Costa Rica Republic of Costa Rica COTE D’IVOIRE (IVORY COAST) Consulate of the Republic of Cote d’Ivoire Embassy of the Republic of Cote d’Ivoire Ivory Coast Permanent Mission to the United Nations Ministry of Economy and Finance Republic of the Ivory Coast (Republique de Cote d'Ivoire) CROATIA Consulate of the Republic of Croatia Embassy of the Republic of Croatia Croatian National Bank Republic of Croatia CUBA Banco Central de Cuba (Central Bank of Cuba) Consulate of Cuba Cuban Interests Section, Embassy of Switzerland Cuban Permanent Mission to the United Nations Embassy of Cuba Republic of Cuba CYPRUS Central Bank of Cyprus Consulate of the Republic of Cyprus Cypriot Permanent Mission to the United Nations Embassy of the Republic of Cyprus Maritim e Office Republic of Cyprus Tourist Office CZECH REPUBLIC Com mercial Office Consulate of the Czech Republic (including Consulate General in Los Angeles) Ceska Narodni Banka (Czech National Bank) Czech Republic Office of the Defense Attache of the Czech Republic Embassy of the Czech Republic
Permanent Mission of the Czech Republic to the United Nations
DENMARK Danish Permanent Mission to the United Nations Kingdom of Denmark Ministry of Finance Danmarks Nationalbank (National Bank of Denmark) Office of Defense, Military, Naval and Air Attache Royal Danish Consulate (Consulate of Denmark) Royal Danish Embassy (Embassy of Denmark)
50
DJIBOUTI Djibouti Permanent Mission to the United Nations Embassy of the Republic of Djibouti National Bank of Djibouti (Banque Nationale de Djibouti) Republic of Djibouti Tresor National de la Republique de Djibouti DOMINICA Common wealth of Dominica Consulate of the Commonwealth of Dominica Embassy of the Commonwealth of Dominica Ministry of Finance DOMINICAN REPUBLIC Banco Central de la Republica Dominicana (Central Bank of the Dominican Republic) Consulate of the Dominican Republic Dominican Republic Permanent Mission to the United Nations Embassy of the Dominican Republic Government of the Dominican Republic EAST TIMOR Banking and Payments Authority (BPA) Central Fiscal Authority (CFA) Democratic Republic of East Timor Embassy of the Democratic Republic of Timor Leste Petroleum Fund of Timor-Leste EASTERN CARIBBEAN CENTRAL BANK (ECCB) ECUADOR Banco Central del Ecuador (Central Bank of Ecuador) Consulate of Ecuador Ecuadorian Permanent Mission to the United Nations Embassy of Ecuador
Gobierno del Ecuador, Programa de Mantenimiento de Carreteras
National Monetary Board (Junta Monetaria Nacional) Office of the Air Attache Office of Military Attache Office of the Naval Attache Office of Police Attache Republic of Ecuador EGYPT Arab Republic of Egypt Central Bank of Egypt Com mercial Office Consulate of the Arab Republic of Egypt Cultural and Educational Bureau Egyptian Permanent Mission to the United Nations Embassy of the Arab Republic of Egypt Office of Commercial and Economic Affairs Office of the Defense, Military, Naval and Air Attache Office of Press and Information Office of Procurement EL SALVADOR The Central Reserve Bank of El Salvador (Banco Central Reserva de El Salvador) Consulate of El Salvador Embassy of El Salvador
Office of Counselor for Economic, Financial & Commercial Affairs
Office of Defense Attache
Republic of El Salvador Salvadoran Permanent Mission to the United Nations EQUATORIAL GUINEA Embassy of the Republic of Equatorial Guinea Equatorial Guinea Permanent Mission to the United Nations Ministry of Finance Republic of Equatorial Guinea ERITREA Consulate of the State of Eritrea Embassy of the State of Eritrea National Bank of Eritrea S tate of Eritrea ESTONIA Consulate of Estonia Embassy of Estonia Eesti Pank (Bank of Estonia) Legation of Estonia Republic of Estonia Stabilization Reserve Fund ETHIOPIA Consulate of Ethiopia Embassy of Ethiopia Ethiopian Government Department Ethiopian Permanent Mission to the United Nations National Bank of Ethiopia Office of Economic, Financial and Trade P eople's Democratic Republic of Ethiopia EUROPEAN CENTRAL BANK (ECB) FALKLAND ISLANDS (ISLAS MALVINAS) The Commissioner of Currency Government of the Falkland Islands (Islas Malvinas) Treasur y Department FAROE ISLANDS Governmental Bank of the Faroe Islands Government of the Faroe Islands Ministry of Finance FIJI Consulate of the Republic of Fiji Islands Embassy of the Republic of Fiji Islands Reserve Bank of Fiji Republic of Fiji FINLAND Consulate of Finland Embassy of Finland Finnish Permanent Mission to the United Nations Office of Defense, Military, Naval and Air Attache Office of National Technology Agency of Finland Office of Trade and Finance Republic of Finland Suomen Pankki (Bank of Finland) (Finlands Bank)
51
FRANCE Banque de France (Bank of France) The Caisse Francaise de Developpement Commercial Office, Trade Commission of France Consulate of France Credit National Cultural Services Office of France Cultural and Scientific Office of France Embassy of France Financial Service (French Treasury Office) French Permanent Mission to the United Nations F rench Republic French Republic, General Treasury Invest in France Agency Office Press Section Office of France Social Service Office of France Tourism Office of France Trade Office of France Visa Section of France Stabilization Fund of the Republic of France FRENCH GUIANA Caisse Centrale de Cooperation Economique Department of French Guiana, French Republic L'agence de l'IEDOM à la Guyane (IEDOM – Institut d'Emission des Departements d'Outre mer) Office des Changes de Guyane FRENCH POLYNESIA L'agence de l'IEOM à Polynésie française (IEOM – Institut d'Emission d'Outre mer) Ministry of Finance and Tourism Territory of French Polynesia GABON Consulate of the Gabonese Republic Embassy of the Gabonese Republic Gabonese Permanent Mission to the United Nations Gabonese Republic Ministry of Economy, Finance, Budget, and Privatization GAMBIA Central Bank of The Gambia Consulate of The Gambia Embassy of The Gambia Gambian Permanent Mission to the United Nations Republic of The Gambia GEORGIA Consulate of the Republic of Georgia Embassy of the Republic of Georgia Office of Information and Culture National Bank of Georgia Republic of Georgia GERMANY Deutsche Bundesbank (Central Bank of the Federal Republic of Germany) Combined Travel Board Consulate of the Federal Republic of Germany Embassy of the Federal Republic of Germany Federal Republic of Germany German Permanent Mission to the United Nations Joint Export Import Agency Trustees of German External Loan
GHANA Bank of Ghana Consulate of Ghana Embassy of Ghana Ghana Permanent Mission to the United Nations Republic of Ghana GIBRALTAR City of Gibraltar The Commissioner of Currency Department of Government Finance Government of Gibraltar GREECE Bank of Greece Consulate of Greece Economic and Commercial Office of Greece Embassy of Greece Greek Permanent Mission to the United Nations Greek Seamens' Pension Fund Greek Supply Council Greek Tourist Office of Greece Hellen ic Republic Office of the Commercial Counselor Office of Defense, Military, Naval and Air Attache Office of Educational Affairs of Greece Office of Mercantile Marine of Greece GREENLAND Greenland Exchequer Government of Greenland (Home Rule Government) Ministry of Finances and Foreign Affairs GRENADA Consulate of Grenada Embassy of Grenada Government of Grenada Ministry of Finance GUADELOUPE Department of Guadeloupe, French Republic L'agence de l'IEDOM à la Guadeloupe (IEDOM – Institut d'Emission des Departements d'Outre mer) Office des Changes de la Guadeloupe GUATEMALA Banco de Guatemala (Bank of Guatemala) Consulate of Guatemala Embassy of Guatemala Guatemalan Government Agencies Guatemalan Permanent Mission to the United Nations Office of Commercial Attache Office of Defense, Military, Naval and Air Attache Republic of Guatemala Secretaria de Hacienda y Credito Publico de Guatemala GUERNSEY Bailiwick of Guernsey (includes States of Alderney, States of Guernsey, and Seigneur of Sark) Guernsey Financial Services Commission The Treasurer, States of Guernsey Treasury and Resources Department
52
GUINEA Central Bank of the Republic of Guinea (Banque Centrale de la Republique de Guinee) Consulate of the Republic of Guinea Embassy of the Republic of Guinea Guinea Permanent Mission to the United Nations Republic of Guinea GUINEA BISSAU Embassy of the Republic of Guinea-Bissau Guinea Bissau Permanent Mission to the United Nations Ministry of Finance Republic of Guinea Bissau GUYANA Bank of Guyana Consulate of Guyana Cooperative Republic of Guyana Embassy of Guyana Guyanan Permanent Mission to the United Nations HAITI Central Bank of Haiti Consulate of the Republic of Haiti Embassy of the Republic of Haiti Haitian Permanent Mission to the United Nations Office of Commercial Attache Office of Military Attache Republic of Haiti HOLY SEE (VATICAN CITY) Accounts in the name of "His Holiness, the Pope" Amministrazione dei Beni Della Santa Sede Amministrazione Speciale Della Santa Sede Apostolic Delegation Apostolic Nunciature Hol y See Istituto per le Opere di Religione (IOR) (Institute for Works of Religion) Mission for the Society of Jesus Vatican Account The Permanent Observer Mission of the Holy See to the United Nations Patrimony of the Holy See Pontificia opera Assistenza Comitato Economico Prefecture for Economic Affairs Sacra Congregazione de Propaganda Fide, Vatican City State of the Vatican City Vatican City Amministrazione Patrimonio HONDURAS Banco Central de Honduras (Central Bank of Honduras) Consul General of Honduras Embassy of Honduras Honduran Exchange Control Commission Honduran Permanent Mission to the United Nations Ministerio de Hacienda Credito Publico y Comercio Republic of Honduras HONG KONG Exchang e Fund Hong Kong Government Treasury Hong Kong Monetary Authority (HKMA)
Hong Kong Monetary Authority (HKMA) Investment Portfolio
Hong Kong Special Administrative Region (or Hong Kong (S.A.R.))
State Administration of Foreign Exchange (SAFE) Investment Company HUNGARY Com mercial Office Consulate of the Republic of Hungary Embassy of the Republic of Hungary Hungarian Foreign Trade Bank Ltd. (Magyar Kulkereskedelmi Bank Rt) Hungarian Permanent Mission to the United Nations Hungarian Tourist Board Legation of Hungary Magyar Nemzeti Bank (National Bank of Hungary) Ministry of Finance Ministry of Foreign Affairs Ministry of Foreign Trade Office of Military and Air Attache Republic of Hungary ICELAND Central Bank of Iceland (Sedlabanki Islands) Consulate of Iceland Counselor of Iceland Embassy of Iceland Icelandic Permanent Mission to the United Nations Republic of Iceland INDIA Commercial and Supply Office Consulate of India Embassy of India Government of India Education Department Government of India Information Services Indian Permanent Mission to the United Nations Passport and Visa Section Republic of India Reserve Bank of India INDONESIA Bank Indonesia Consulate of the Republic of Indonesia Embassy of the Republic of Indonesia Indonesia Supply Mission Indonesian Permanent Mission to the United Nations Republic of Indonesia Trade Promotion Center of Indonesia IRAN The Central Bank of the Islamic Republic of Iran (Bank Markazi Jomhouri Islami Iran ) Foreign Exchange Reserve Account Islamic Republic of Iran Iranian Permanent Mission to the United Nations Iranian Interests Section, Embassy of Pakistan Oil Stabilization Fund IRAQ Central Bank of Iraq Embassy of the Republic of Iraq Iraqi Fund for Foreign Development (IFFD) Iraqi Permanent Mission to the United Nations Republic of Iraq
53
IRELAND Central Bank and Financial Services Authority of Ireland (Banc Ceannais na hEireann) Consulate of Ireland Department of External Affairs, Ireland Embassy of Ireland Irish Government Departments Irish Permanent Mission to the United Nations Ministry of Finance Republic of Ireland ISLE OF MAN Isle of Man Financial Supervision Commission Government of Isle of Man The Treasurer, Isle of Man Government Treasur y Department ISRAEL Bank of Israel Consulate of Israel Defense Procurement Mission of Israel Economic Mission of Israel Embassy of Israel Israeli Permanent Mission to the United Nations Israeli Supply Mission Ministry of Finance Office of Tourism Mission of Israel State of Israel Treasury for the State of Israel ITALY Banca d'Italia (Bank of Italy) Com mercial Office Consulate of Italy Embassy of Italy Istituto Nazionale per i Cambi con 1'Estero Italian Cultural Institute Italian Government Departments Italian Permanent Mission to the United Nations Italian Technical Delegation Italian Tourist Information Service, Inc. Office of Italian Air Attache Office of Cultural Attache Office of Defense Attache Office of Italian Military Attache Office of Italian Naval Attache Office of Science Attache Republic of Italy Trade Promotion Section of Italy Ufficio Italiano dei Cambi CANTIBEL (Exchange Control Office) JAMAICA Bank of Jamaica Consulate of Jamaica Embassy of Jamaica Government of Jamaica Jamaican Permanent Mission to the United Nations Ministry of Finance & Planning JAPAN Bank of Japan (Nippon Ginko) Consulate of Japan Embassy of Japan Government of Japan
Japanese Permanent Mission to the United Nations Ministry of Finance Ministry of International Trade and Industry (MITI) Ministry of Posts and Telecommunications JERSEY Bailiwick of Jersey (includes the States of Jersey) State of Jersey Financial Services Commission The Treasurer, States of Jersey Treasury and Resources Department JORDAN Central Bank of Jordan Consulate of Hashemite Kingdom of Jordan Embassy of Hashemite Kingdom of Jordan Hashemite Kingdom of Jordan Jordanian Permanent Mission to the United Nations Office of Information Bureau Office of Military, Air and Naval Attache KAZAKHSTAN Consulate of the Republic of Kazakhstan Embassy of the Republic of Kazakhstan Ministry of Finance National Bank of Kazakhstan (National Bank of the Republic of Kazakhstan) National Fund of Republic of Kazakhstan Republic of Kazakhstan KENYA Central Bank of Kenya Consulate of the Republic of Kenya Embassy of the Republic of Kenya Kenya Permanent Mission to the United Nations Republic of Kenya KIRIBATI Bank of Kiribati Consulate of the Republic of Kiribati Ministry of Finance Republic of Kiribati Revenue Equalization Reserve Fund KOREA, NORTH Central Bank of Korea Democratic People's Republic of Korea Democratic People’s Rep. of Korea Permanent Mission to the United Nations Ministry of Finance Ministry of Foreign Trade KOREA, SOUTH Bank of Korea Consulate of the Republic of Korea Embassy of the Republic of Korea Foreign Exchange Stabilization Fund Korea Investment Corporation Ministry of Finance and Economy Office of Education Office of Information Office of Defense and Logistics Republic of Korea Republic of Korea Permanent Mission to the United Nations Special Representative of the Republic of Korea
54
KUWAIT Central Bank of Kuwait Consulate of the State of Kuwait Cultural, University, Liaison Offices Embassy of the State of Kuwait General Reserve Fund Kuwait Currency Board Kuwait Fund for Arab Economic Development (KFAED) Kuwait Investment Authority Kuwait Investment Office Kuwaiti Permanent Mission to the United Nations Ministry of Finance and Oil Office of Health Office of Information Public Institution for Social Security Future Generations Fund State of Kuwait KYRGYZSTAN Consulate of the Kyrgyz Republic Embassy of the Kyrgyz Republic National Bank of the Kyrgyz Republic Republic of Kyrgyzstan LAOS Banque du Commerce Exterieur Lao Embassy of the Lao People's Democratic Republic (Embassy of Laos) Lao People's Democratic Republic Laotian Permanent Mission to the United Nations Ministry of Finance Bank of the Lao People’s Democratic Republic (Bank of Lao PDR) (Banque de la RDP Lao) LATVIA Bank of Latvia (Latvijas Banka) Consulate of Latvia Embassy of Latvia Department of State Economy Latvian Ministry of Finance Legation of Latvia Republic of Latvia LEBANON Banque du Liban (Central Bank of Lebanon) Consulate of Lebanon Embassy of Lebanon Lebanese Permanent Mission to the United Nations Ministry of Defense Republic of Lebanon LESOTHO Central Bank of Lesotho Consulate of the Kingdom of Lesotho Embassy of the Kingdom of Lesotho Kingdom of Lesotho Lesotho Permanent Mission to the United Nations LIECHTENSTEIN Embassy of the Principality of Liechtenstein Principality of Liechtenstein State Bank of Liechtenstein (Liechtensteinische Landesbank)
LIBERIA Consulate of the Republic of Liberia Embassy of the Republic of Liberia Liberian Permanent Mission to the United Nations Ministry of Finance National Bank of Liberia Republic of Liberia LIBYA Central Bank of Libya Embassy of Libya Lib yan Liaison Office Libyan Permanent Mission to the United Nations Socialist People's Libyan Arab Jamahiriya Libyan Investment Authority Libyan Arab Foreign Investment Company LITHUANIA Consulate of the Republic of Lithuania Embassy of the Republic of Lithuania Lietuvos Bankas (Bank of Lithuania) Lithuan ian Legation Republic of Lithuania LUXEMBOURG
Banque Centrale du Luxembourg (Central Bank of Luxembourg)
Consulate of the Grand Duchy of Luxembourg Embassy of the Grand Duchy of Luxembourg Grand Duchy of Luxembourg Institut Monetaire Luxembourgeois Luxembourg Permanent Mission to the United Nations MACAU Macau Special Administrative Region (Macau (S.A.R.)
Monetary Authority of Macau (Authoridade Monetaria de Macau)
Secretariat for Economy and Finance MACEDONIA, REPUBLIC OF Consulate of the Republic of Macedonia Embassy of the Republic of Macedonia National Bank of the Republic of Macedonia (Narodna Banka na Makesdonija) Republic of Macedonia MADAGASCAR Central Bank of Madagascar (Banque Centrale de Madagascar) Consulate of the Republic of Madagascar Democratic Republic of Madagascar Embassy of the Republic of Madagascar Madagascar Permanent Mission to the United Nations MALAWI Embassy of Malawi Malawi Permanent Mission to the United Nations Republic of Malawi Reserve Bank of Malawi
55
MALAYSIA Bank Negara Malaysia (Central Bank of Malaysia) Consulate of Malaysia Embassy of Malaysia Government of Malaysia Khazanah Nasional Berhad Malayan Permanent Mission to the United Nations Malaysian Rubber Export Promotion Council Ministry of Finance (Treasury Malaysia) Office of Defense, Military, Naval and Air Attache Office of Economic Counselor Office of Malaysian Students Office of Mara Students Office of Scientific Attache MALDIVES Embassy of the Republic of Maldives Maldives Monetary Authority Maldives Permanent Mission to the United Nations Republic of Maldives MALI Consulate of the Republic of Mali Embassy of the Republic of Mali Mali Permanent Mission to the United Nations Ministry of Finance Republic of Mali MALTA Central Bank of Malta Consulate of Malta Embassy of Malta Maltese Permanent Mission to the United Nations Republic of Malta MARSHALL ISLANDS Compact Trust Fund Consulate of the Republic of the Marshall Islands Embassy of the Republic of the Marshall Islands Marshall Islands Nuclear Claims Tribunal Ministry of Finance Republic of the Marshall Islands MARTINIQUE Department of Martinique, French Republic Institut d'Emission des Departements d'Outre mer (IEDOM) (L'agence de l'IEDOM à la Martinique) Office des Changes de la Martinique MAURITANIA Central Bank of Mauritania (Banque Centrale de Mauritanie) Embassy of the Islamic Republic of Mauritania Islamic Republic of Mauritania Mauritania Permanent Mission to the United Nations National Fund for Hydrocarbon Resources MAURITIUS Bank of Mauritius Consulate of Republic of Mauritius Embassy of Republic of Mauritius Mauritius Permanent Mission to the United Nations Republic of Mauritius
MAYOTTE L'agence de l'IEDOM à Mayotte (IEDOM – Institut d'Emission des Departements d'Outre mer) Territorial Collectivity of Mayotte MEXICO Banco de Mexico (Bank of Mexico) Commercial Office of Mexico Consulate of Mexico Delegacion Fiscal Mexico Embassy of Mexico Foreign Trade Institute of Mexico Mexican Permanent Mission to the United Nations Office of Agriculture and Forestry Minister Office of Defense, Military and Air Attache Office of Financial Counselor Office of Naval Attache Office of Attorney General of Mexico Office of Tourism Minister Office of Trade Minister Office of Trade Negotiations Oil Income Stabilization Fund Tourism Board of Mexico United Mexican States MICRONESIA, FEDERATED STATES OF Compact Trust Fund Consulate of the Federated States of Micronesia Embassy of the Federated States of Micronesia Federated States of Micronesia Banking Board Federated States of Micronesia Finance Ministry Federated States of Micronesia Social Security Administration Federated States of Micronesia MOLDOVA Consulate of the Republic of Moldova Embassy of the Republic of Moldova The National Bank of Moldova Republic of Moldova MONGOLIA The Bank of Mongolia Consulate of Mongolia Embassy of Mongolia Government of Mongolia Mongolian Permanent Mission to the United Nations MONACO Consulate of the Principality of Monaco Département des Finances et de l'Economie Principality of Monaco MOROCCO Bank Al-Maghrib (Banque Al Maghrib) Consulate of the Kingdom of Morocco Embassy of the Kingdom of Morocco Kingdom of Morocco Moroccan Permanent Mission to the United Nations MOZAMBIQUE Bank of Mozambique (Banco de Mozambique) Embassy of the Republic of Mozambique Mozambique Permanent Mission to the United Nations Republic of Mozambique
56
NAMIBIA Bank of Namibia Consulate of the Republic of Namibia Embassy of the Republic of Namibia Republic of Namibia NAURU Bank of Nauru Consulate of the Republic of Nauru Embassy of the Republic of Nauru Republic of Nauru NEPAL Ro yal Nepalese Consulate Royal Nepalese Embassy (Embassy of Nepal) Kingdom of Nepal Ministry of Finance Nepalese Permanent Mission to the United Nations Nepal Rastra Bank (Central Bank of the Kingdom of Nepal) NETHERLANDS Auditor General of the Netherlands Government De Nederlandsche Bank (Netherlands Bank) Departments of the Government of the Netherlands Dutch Permanent Mission to the United Nations Kingdom of the Netherlands Ministry of Finance Netherlands Economic Mission Netherlands Government Netherlands Government Food Purchasing Bureau
Netherlands Ministry of Traffic, Directorate General of Shipping
Netherlands Purchasing Commission Office of Netherlands Naval Attache Royal Netherlands Consulate (Consulate of the Netherlands) Royal Netherlands Embassy (Embassy of the Netherlands) Royal Netherlands Navy The Netherlands Information Bureau NETHERLANDS ANTILLES
Bank van de Nederlandse Antillen (Bank of the Netherlands Antilles)
Government of the Netherlands Antilles Ministry of Finance NEW CALEDONIA L'agence de l'IEOM à la Nouvelle-Calédonie (IEOM – Institut d'Emission d'Outre mer) Ministry of Economy and Finance Territory of New Caledonia and Dependencies NEW ZEALAND Consulate of New Zealand Dominion of New Zealand Embassy of New Zealand New Zealand Permanent Mission to the United Nations New Zealand Superannuation Fund New Zealand Trade Commission New Zealand Treasury Office of Commercial Attache Reserve Bank of New Zealand NICARAGUA Banco Central de Nicaragua (Central Bank of Nicaragua) Consulate of the Republic of Nicaragua
Corporation of Nicaragua (Corporacion Financiera de Nicaragua (CORFIN)) Embassy of the Republic of Nicaragua High Comissioner of the Republic of Nicaragua Ministry of Treasury and Public Credit Nicaraguan Permanent mission to the United Nations Office of Military Attache to the Nicaraguan Embassy Republic of Nicaragua Republic of Nicaragua Collector General of Customs NIGER Embassy of the Republic of Niger Niger Permanent Mission to the United Nations Ministry of Finance Republic of Niger NIGERIA Central Bank of Nigeria Consulate of the Federal Republic of Nigeria Embassy of the Federal Republic of Nigeria Excess Crude Account Federal Republic of Nigeria Nigerian Permanent Mission to the United Nations NIUE Treasur y Department Government of Niue NORWAY Government Pension Fund (former State Petroleum Fund) Government Petroleum Insurance Fund Kingdom of Norway Ministry of Finance Norges Bank (Central Bank of Norway) Norwegian Permanent Mission to the United Nations Norwegian Purchasing Commission Norwegian Shipping and Trade Commission Royal Norwegian Air Force Royal Norwegian Commerce Department Royal Norwegian Consulate (Consulate of Norway) Royal Norwegian Embassy (Embassy of Norway) Royal Norwegian Information Service OMAN (MUSCAT AND OMAN) Central Bank of Oman Consulate of Oman Defense Office Embassy of the Sultanate of Oman Muscat Currency Authority Oil Fund Oman Permanent Mission to the United Nations State General Reserve Fund Sultanate of Oman PAKISTAN Consulate of Pakistan Embassy of Pakistan Islamic Republic of Pakistan Office of Defense Procurement Attache Office of Educational and Cultural Attache Pakistan Trade Office Pakistani Permanent Mission to the United Nations State Bank of Pakistan State of Pakistan
57
PANAMA Consulate of the Republic of Panama Embassy of the Republic of Panama Ministerio de Hacienda y Tesoro National Bank of Panama (Banco Nacional de Panama) Panamian Permanent Mission to the United Nations Republic of Panama PALAU Compact Trust Fund Consulate of the Republic of Palau Embassy of the Republic of Palau Ministry of Finance Republic of Palau Social Security System Republic of Palau PAPUA NEW GUINEA Bank of Papua New Guinea Consulate of Papua New Guinea Embassy of Papua New Guinea Independent State of Papua New Guinea Ministry of Finance and Treasury PARAGUAY Banco Central del Paraguay (Central Bank of Paraguay) Consulate of Paraguay Embassy of Paraguay Paraguayan Permanent Mission to the United Nations Office of Commercial and Economic Affairs Office of Defense Attache Office of Press and Information Affairs Office of Visa and Consular Affairs Republic of Paraguay PERU
Banco Central de Reserva del Peru (Central Reserve Bank of Peru)
Consulate of Peru Embassy of Peru Office of Air Attache to the Peruvian Embassy Office of Joint Fight Against Drugs Office of Military Attache Office of Peruvian Naval Commissioner & Attache Peruvian Permanent Mission to the United Nations Republic of Peru PHILIPPINES Bangko Sentral ng Pilipinas (Central Bank of the Philippines) Com mercial Office Consulate of the Republic of the Philippines Embassy of the Republic of the Philippines Office of Armed Forces of the Philippines Attache (Procurement Mission Fund) Office of Commercial Counselor Philippine Constabulary Philippine Permanent Mission to the United Nations Philippine Purchasing Agency Philippine Relief and Trade Rehabilitation Administration Republic of the Philippines Tourism Office of the Philippines POLAND Com mercial Office Consulate of the Republic of Poland Embassy of the Republic of Poland
Ministry of Finance Ministry of Foreign Affairs Ministry of Foreign Trade Ministry of Maritime Economy National Bank of Poland (Narodowy Bank Polski) Office of Defense Attache Office of Economic and Financial Counselor Polish American Supply Corporation Republic of Poland Polish Permanent Mission to the United Nations PORTUGAL Agencia Financial de Portugal Banco de Portugal (Bank of Portugal) Casa de Portugal Com mercial Office Consulate of Portugal Embassy of Portugal Office of Defense, Military, Naval and Air Attache Portuguese Permanent Mission to the United Nations Portuguese Republic QATAR Consulate of the State of Qatar Embassy of the State of Qatar Ministry of Finance Offices of Medical, Cultural & Military Attache Qatar Central Bank Qatar Investment Authority Qatar Permanent Mission to the United Nations State of Qatar REUNION Department of Reunion, French Republic L'agen ce de l'IEDOM à la Reunion (IEDOM – Institut d'Emission des Departements d'Outre mer) ROMANIA Consulate of Romania Embassy of Romania Government of Romania National Bank of Romania Office of Defense, Military, Naval and Air Attache Office of Economic Counselor Romanian Permanent Mission to the United Nations RUSSIA Central Bank of Russia (Bank Russii) Consulate of the Russian Federation Embassy of the Russian Federation Ministry of Finance National Wealth Fund Office of Defense, Military, Naval and Air Attache Office of Fisheries Attache Office of Information Office of Trade Office of Trade Representative of the Russian Federation Reserve Fund Russian Cultural Centre Russian Federation Stabilization Fund of the Russian Federation
58
RWANDA Banque Nationale du Rwanda (National Bank of Rwanda) Consulate of the Republic of Rwanda Embassy of the Republic of Rwanda Republic of Rwanda Rwanda Permanent Mission to the United Nations ST. HELENA Commissioners of Currency Currency Fund Department of Finance Government of Saint Helena ST. KITTS AND NEVIS Consulate of St. Kitts and Nevis Embassy of St. Kitts and Nevis Federation of Saint Kitts and Nevis Ministry of Finance ST. LUCIA Consulate of Saint Lucia Embassy of Saint Lucia Government of Saint Lucia Ministry of Finance, International Financial Services and Economic Affairs ST. PIERRE AND MIQUELON L'agence de l'IEDOM à Saint-Pierre et Miquelon (IEDOM – Institut d'Emission des Departements d'Outre mer) Territorial Collectivity of Saint Pierre and Miquelon ST. VINCENT AND THE GRENADINES Consulate of Saint Vincent and the Grenadines Embassy of Saint Vincent and the Grenadines Government of Saint Vincent and the Grenadines Ministry of Finance SAMOA (formerly WESTERN SAMOA) Bank of Samoa Central Bank of Samoa Consulate of the Independent State of Samoa Embassy of the Independent State of Samoa Independent State of Samoa Monetary Board of Samoa SAN MARINO Central Bank of the Republic of San Marino Consulate of the Republic of San Marino Republic of San Marino San Marinese Institute of Credit SAO TOME and PRINCIPE Central Bank of Sao Tome and Principe (Banco Central de Sao Tome e Principe)
Consulate of the Democratic Republic of Sao Tome and Principe
Democratic Republic of Sao Tome and Principe Sao Tome and Principe Permanent Mission to the United
Nations National Oil Account SAUDI ARABIA Com mercial Office Kingdom of Saudi Arabia M edical Office
Ministry of Finance Office of Defense and Armed Forces Attache Office of Saudi Arabian National Guard Public Investment Fund Royal Consulate of Saudi Arabia Royal Embassy of Saudi Arabia (Embassy of Saudi Arabia) Saudi Arabian Cultural Mission Saudi Arabian Monetary Agency (SAMA) Saudi Arabian Permanent Mission to the United Nations Saudi Fund for Development (SFD) SENEGAL Consulate of the Republic of Senegal Embassy of the Republic of Senegal Office of Defense, Air & Military Attache Ministry of Economy and Finance Republic of Senegal Senegalese Permanent Mission to the United States SERBIA and MONTENEGRO and KOSOVO Banking and Payment Authority of Kosovo Central Bank of Montenegro (Centrale banka crne gore) Consulate of Kosovo Consolate of Montenegro Consulate of Serbia Embassy of Kosovo Embassy of Montenegro Embassy of Serbia Ministry of Finance of the Republic of Kosovo Ministry of Finance of the Republic of Montenegro Ministry of Finance of the Republic of Serbia National Bank of Serbia (Narodna banka Srbije) Republic of Kosovo Republic of Montenegro Republic of Serbia SEYCHELLES Central Bank of Seychelles Consulate of the Republic of Seychelles Embassy of the Republic of Seychelles Republic of Seychelles Seychelles Permanent Mission to the United Nations SIERRA LEONE Bank of Sierra Leone Embassy of Sierra Leone Republic of Sierra Leone Sierra Leone Permanent Mission to the United Nations SINGAPORE Board of Commissioners of Currency Consulate of the Republic of Singapore Embassy of the Republic of Singapore Government of Singapore Investment Corporation (GSIC) Ministry of Finance Monetary Authority of Singapore Republic of Singapore Singapore Permanent Mission to the United Nations Temasek Holdings
59
SLOVAKIA Consulate of the Slovak Republic Embassy of the Slovak Republic Government of the Slovak Republic Office of the Commercial Section National Bank of Slovakia (Narodna Banka Slovenska) (central bank) Slovak Permanent Mission to the United Nations SLOVENIA Bank of Slovenia Consulate of the Republic of Slovenia Embassy of the Republic of Slovenia Republic of Slovenia SOLOMON ISLANDS Central Bank of Solomon Islands Embassy of the Solomon Islands Ministry of Finance Republic of Solomon Islands SOMALIA Central Bank of Somalia (Bankiga Dhexe ee Soomaaliya) Embassy of Somali Republic Somali Republic Somalian Permanent Mission to the United Nations SOUTH AFRICA Agricultur al Office Department of Finance Embassy of the Republic of South Africa Office of Communication Section Office of Department of Trade and Industry Office of Public Affairs Republic of South Africa Republic of South Africa Department of Customs Republic of South Africa Government Supply Office South African Consulate General South African Permanent Mission to the United Nations South African Reserve Bank Technical Office SPAIN Banco de Espana (Bank of Spain) Consulate of Spain Cultural Office Economic & Commercial Office Embassy of Spain Financial Office Foreign Market Services (Servicios de Mercandos Extranjeros) Instituto Espanol de Moneda Extranjera Kingdom of Spain National Spanish Tourist Office Office of Air Attache Office of Defense Attache Office of Defense Cooperation Attache Office of Education Office of Information Office of Labor and Social Affairs Office of Military Attache Office of Naval Attache Spanish Agriculture Office Spanish Commercial Office Spanish Permanent Mission to the United Nations Spa nish State
SRI LANKA Central Bank of Sri Lanka Consulate of the Democratic Socialist Republic of Sri Lanka Democratic Socialist Republic of Sri Lanka Embassy of the Democratic Socialist Republic of Sri Lanka Sri Lanka Permanent Mission to the United Nations SUDAN Bank of Sudan Embassy of the Republic of the Sudan Office of the Cultural Counselor Office of Information Attache Oil Revenue Stabilization Account Republic of the Sudan Sudanese Permanent Mission to the United Nations SURINAME Central Bank van Suriname (Central Bank of Suriname) Consulate of the Republic of Suriname Embassy of the Republic of Suriname Republic of Suriname Suriname Permanent Mission to the United Nations SWAZILAND The Central Bank of Swaziland Embassy of the Kingdom of Swaziland Kingdom of Swaziland Monetary Authority of Swaziland Swaziland Permanent Mission to the United Nations SWEDEN Consulate of Sweden Embassy of Sweden Kingdom of Sweden Sveriges Riksbank (Bank of Sweden) Swedish Trade Council Swedish Office of Science and Technology Swedish Permanent Mission to the United Nations Swedish Travel Information Bureau, Inc. SWITZERLAND Consulate General of Switzerland Embassy of Switzerland Schweizer ische Nationalbank (Banque Nationale Suisse) (Swiss National Bank) S wiss Confederation Swiss Government Departments SYRIA Central Bank of Syria (Masrif Suriyah al-Markaz) Consulate of the Syrian Arab Republic Embassy of the Syrian Arab Republic Syrian Arab Republic Syrian Permanent Mission to the United Nations
60
TAIWAN Board of Supplies, Executive Yuban The Central Bank of China (Taiwan) China Defense Supplies incorporated Chinese Petroleum Corporation Joint Commission on Rural Reconstruction in Taiwan National Stabilisation Fund Ministry of Economic Affairs Ministry of Finance Republic of China Taipei Economic Culture and Representative Office (TECRO) TAJIKISTAN Consulate Republic of Tajikistan Embassy Republic of Tajikistan National Bank of the Republic of Tajikistan Republic of Tajikistan TANZANIA Bank of Tanzania Consulate of the United Republic of Tanzania Embassy of the United Republic of Tanzania Tanzanian Permanent Mission to the United Nations United Republic of Tanzania THAILAND Bank of Thailand Consulate of Thailand Cultural Office Embassy of Thailand (Royal Thai Embassy) Kingdom of Thailand Office of Air Attache Office of Commercial Affairs Office of Economic and Financial Affairs Office of Education Affairs Office of Education Counselor Office of Industrial Affairs Office of Information Office of Military Attache Office of Naval Attache Office of Science and Technology Siamese Fund Thai Permanent Mission to the United Nations TOGO Consulate of the Republic of Togo Embassy of the Republic of Togo Ministry of Economy, Finance and Privatization Republic of Togo TONGA Consulate of the Kingdom of Tonga Embassy of the Kingdom of Tonga Kingdom of Tonga National Reserve Bank of Tonga TRINIDAD AND TOBAGO Central Bank of Trinidad and Tobago Consulate of the Republic of Trinidad and Tobago Embassy of the Republic of Trinidad and Tobago Heritage and Stabilization Fund Republic of Trinidad and Tobago Trinidad and Tobago Permanent Mission to the United Nations
TUNISIA Banque Centrale de Tunisie (Central Bank of Tunisia) Consulate of Tunisia Emba ssy of Tunisia Office of Defense Armed Forces Attache Republic of Tunisia Tunisian Information Office Tunisian Permanent Mission to the United Nations TURKEY Consulate of the Republic of Turkey Embassy of the Republic of Turkey Office of Agricultural Counselor Office of Commercial Counselor Office of Defense Attache Office of Defense, Air, Military & Naval Attache Office of Economic Counselor Office of Educational Counselor Office of Financial and Customs Counselor Office of Planning Office of Press Counselor Office of Social Affairs Office of Tourism Counselor Republic of Turkey Republic of Turkey Purchasing Delegation Turkish Economic Mission Turkish Permanent Mission to the United Nations Turkiye Cumhuriyet Merkez Bankasi (Central Bank of the Republic of Turkey) TURKMENISTAN Central Bank of Turkmenistan Consulate of Turkmenistan Embassy of Turkmenistan Republic of Turkmenistan TUVALU Government of Tuvalu Ministry of Finance, Economic Planning & Industry National Bank of Tuvalu UGANDA Bank of Uganda Embassy of the Republic of Uganda Poverty Action Fund Republic of Uganda Ugandan Permanent Mission to the United Nations UKRAINE Consulate of Ukraine Embassy of Ukraine National Bank of Ukraine Government of Ukraine
61
UNITED ARAB EMIRATES Abu Dhabi Fund for Arab Economic Development (ADFAED) Abu Dhabi International Petroleum Investment Company Abu Dhabi Investment Authority Abu Dhabi Investment Company Abu Dhabi Investment Council Central Bank of United Arab Emirates Cultural Office Dubai Holding Dubai International Capital Dubai International Financial Center Embassy of the United Arab Emirates Government of Abu Dhabi Government of Dubai Government of United Arab Emirates Investment Corporation of Dubai Istithm ar M edical Office Mubadala Development Company Office of Defense, Military, Naval and Air Attache Ras Al Khaimah Minerals and Metals Investments (RMMI) Ras Al Khaimah Investment Authority United Arab Emirates Currency Board
United Arab Emirates Permanent Mission to the United Nations
UNITED KINGDOM Bank of England British Army Services British Army Staff British Embassy British Joint Services Mission British Merchant Navy Committee British Ministry of Pensions British Ministry of Transport British Naval Welfare Fund British Permanent Mission to the United Nations British Supply Office Consulate of Britain Crown Agents HM Treasury Office of British Naval Staff Office of Civil Aviation and Mission to the FAA Office of Northern Ireland Bureau R. A.F. Delegation United Kingdom of Great Britain and Northern Ireland United Kingdom Payments Office United Kingdom Treasury and Supply Delegation URUGUAY Banco Central del Uruguay (Central Bank of Uruguay) Consulate of Uruguay Direccion de Credito Publico Embassy of Uruguay Office of Financial Affairs Office of Military, Naval and Air Attache Office of Trade Bureau Oriental Republic of Uruguay Uruguayan Permanent Mission to the United Nations UZBEKISTAN Central Bank of the Republic of Uzbekistan Consulate of the Republic of Uzbekistan Embassy of the Republic of Uzbekistan Republic of Uzbekistan
VANUATU Consulate of the Republic of Vanuatu Republic of Vanuatu Reserve Bank of Vanuatu VENEZUELA Banco Central de Venezuela (Central Bank of Venezuela) Consulate of the Bolivarian Republic of Venezuela Embassy of the Bolivarian Republic of Venezuela
Banco de Desarrollo Economico Y Social de Venezuela (BANDES)
Macroeconomic Stabilization Fund (FIEM) Ministerio de Obras Publicas National Development Fund (Fondon) Office of Military and Air Attache Office of Defense and Naval Attache Office of Information Service Republic of Venezuela Venezuelan Permanent Mission to the United Nations VIETNAM Consulate of Vietnam Embassy of Vietnam Ministry of Finance Ministry of Foreign Trade Office of Defense Attache Office of Trade Socialist Republic of Vietnam State Bank of Vietnam (Viet Bank) Vietnamese Permanent Mission to the United Nations VIRGIN ISLANDS, BRITISH Commissioner of Currency (British Virgin Islands) Ministry of Finance Government of British Virgin Islands WALLIS AND FUTUNA Department of Economic and Development Affairs L'agence de l'IEOM à le Territoire des Îles Wallis et Futuna (IEOM -- Institut d’Emission d’Outre-Mer) Territory of the Wallis and Futuna Islands YEMEN Central Bank of Yemen Consulate of the Republic of Yemen Embassy of the Republic of Yemen Republic of Yemen Republic of Yemen Permanent Mission to the United Nations ZAMBIA Bank of Zambia Embassy of the Republic of Zambia Republic of Zambia Zambian Permanent Mission to the United Nations ZIMBABWE Embassy of Republic of Zimbabwe Republic of Zimbabwe Reserve Bank of Zimbabwe Zimbabwe Permanent Mission to the United Nations
62
AAPPPPEENNDDIIXX FF
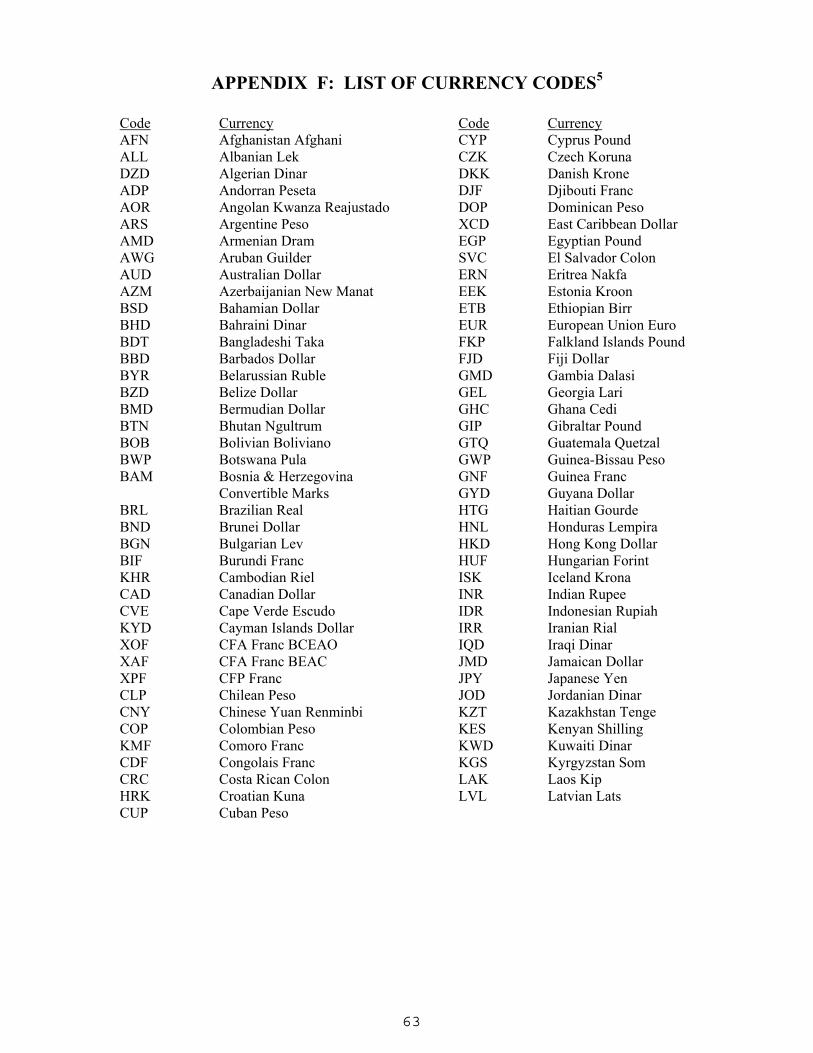
63
APPENDIX F: LIST OF CURRENCY CODES5
Code AFN ALL DZD ADP AOR ARS AMD AWG AUD AZM BSD BHD BDT BBD BYR BZD BMD BTN BOB BWP BAM BRL BND BGN BIF KHR CAD CVE KYD XOF XAF XPF CLP CNY COP KMF CDF CRC HRK CUP
Currency Afghanistan Afghani Albanian Lek Algerian Dinar Andorran Peseta Angolan Kwanza Reajustado Argentine Peso Armenian Dram Aruban Guilder Australian Dollar Azerbaijanian New Manat Bahamian Dollar Bahraini Dinar Bangladeshi Taka Barbados Dollar Belarussian Ruble Belize Dollar Bermudian Dollar Bhutan Ngultrum Bolivian Boliviano Botswana Pula Bosnia & Herzegovina Convertible Marks Brazilian Real Brunei Dollar Bulgarian Lev Burundi Franc Cambodian Riel Canadian Dollar Cape Verde Escudo Cayman Islands Dollar CFA Franc BCEAO CFA Franc BEAC CFP Franc Chilean Peso Chinese Yuan Renminbi Colombian Peso Comoro Franc Congolais Franc Costa Rican Colon Croatian Kuna Cuban Peso
Code CYP CZK DKK DJF DOP XCD EGP SVC ERN EEK ETB EUR FKP FJD GMD GEL GHC GIP GTQ GWP GNF GYD HTG HNL HKD HUF ISK INR IDR IRR IQD JMD JPY JOD KZT KES KWD KGS LAK LVL
Currency Cyprus Pound Czech Koruna Danish Krone Djibouti Franc Dominican Peso East Caribbean Dollar Egyptian Pound El Salvador Colon Eritrea Nakfa Estonia Kroon Ethiopian Birr European Union Euro Falkland Islands Pound Fiji Dollar Gambia Dalasi Georgia Lari Ghana Cedi Gibraltar Pound Guatemala Quetzal Guinea-Bissau Peso Guinea Franc Guyana Dollar Haitian Gourde Honduras Lempira Hong Kong Dollar Hungarian Forint Iceland Krona Indian Rupee Indonesian Rupiah Iranian Rial Iraqi Dinar Jamaican Dollar Japanese Yen Jordanian Dinar Kazakhstan Tenge Kenyan Shilling Kuwaiti Dinar Kyrgyzstan Som Laos Kip Latvian Lats
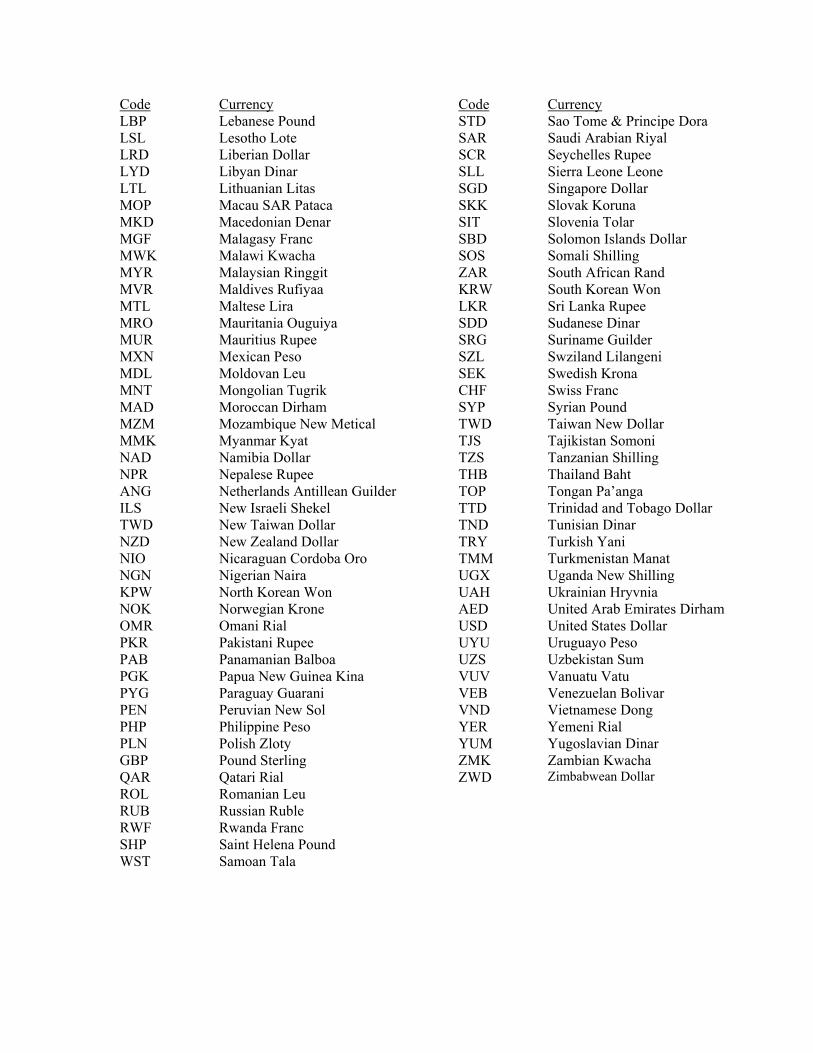
Code LBP LSL LRD LYD LTL MOP MKD MGF MWK MYR MVR MTL MRO MUR MXN MDL MNT MAD MZM MMK NAD NPR ANG ILS TWD NZD NIO NGN KPW NOK OMR PKR PAB PGK PYG PEN PHP PLN GBP QAR ROL RUB RWF SHP WST
Currency Lebanese Pound Lesotho Lote Liberian Dollar Libyan Dinar Lithuanian Litas Macau SAR Pataca Macedonian Denar Malagasy Franc Malawi Kwacha Malaysian Ringgit Maldives Rufiyaa Maltese Lira Mauritania Ouguiya Mauritius Rupee Mexican Peso Moldovan Leu Mongolian Tugrik Moroccan Dirham Mozambique New Metical Myanmar Kyat Namibia Dollar Nepalese Rupee Netherlands Antillean Guilder New Israeli Shekel New Taiwan Dollar New Zealand Dollar Nicaraguan Cordoba Oro Nigerian Naira North Korean Won Norwegian Krone Omani Rial Pakistani Rupee Panamanian Balboa Papua New Guinea Kina Paraguay Guarani Peruvian New Sol Philippine Peso Polish Zloty Pound Sterling Qatari Rial Romanian Leu Russian Ruble Rwanda Franc Saint Helena Pound Samoan Tala
Code STD SAR SCR SLL SGD SKK SIT SBD SOS ZAR KRW LKR SDD SRG SZL SEK CHF SYP TWD TJS TZS THB TOP TTD TND TRY TMM UGX UAH AED USD UYU UZS VUV VEB VND YER YUM ZMK ZWD
Currency Sao Tome & Principe Dora Saudi Arabian Riyal Seychelles Rupee Sierra Leone Leone Singapore Dollar Slovak Koruna Slovenia Tolar Solomon Islands Dollar Somali Shilling South African Rand South Korean Won Sri Lanka Rupee Sudanese Dinar Suriname Guilder Swziland Lilangeni Swedish Krona Swiss Franc Syrian Pound Taiwan New Dollar Tajikistan Somoni Tanzanian Shilling Thailand Baht Tongan Pa’anga Trinidad and Tobago Dollar Tunisian Dinar Turkish Yani Turkmenistan Manat Uganda New Shilling Ukrainian Hryvnia United Arab Emirates Dirham United States Dollar Uruguayo Peso Uzbekistan Sum Vanuatu Vatu Venezuelan Bolivar Vietnamese Dong Yemeni Rial Yugoslavian Dinar Zambian Kwacha Zimbabwean Dollar

65
AAPPPPEENNDDIIXX GG
66
GLOSSARY
AMERICAN DEPOSITARY RECEIPT (ADR) - Negotiable certificates, typically issued by a U.S.-
resident company and backed by shares of stock issued by a foreign corporation. ADRs that
represent ownership of foreign securities are considered foreign securities and should not be
reported, even if issued by a U.S.-resident company.
ASSET-BACKED SECURITIES - Securitized interests in a pool of assets, which give the purchaser
a claim against the cash flows generated by the underlying assets. These pools may be derived
from mortgage loans, auto loans, credit card receivables, vehicle and equipment leases, consumer
loans, commercial loans or other assets. All asset-backed securities, including CMOs, CLOs, CBOs,
CDOs, and stripped asset-backed securities are reported as security type = 12 (asset-backed
security). (See Section III.D of the reporting instructions.)
BEARER BOND - Securities that are not registered in the name of their owner. The owner collects
interest and dividends upon presentation of detachable coupons to a bank or fiduciary agent.
Bearer bonds are reported as long-term debt securities, security type = 9 (bond or note,
unstripped).
BEARER BOOK-ENTRY SECURITIES - See Bearer Global Notes/Certificates.
BEARER GLOBAL NOTES/CERTIFICATES - Bearer notes issued to one or more dealers that are
represented by a single global note in bearer form and are intended to be the backing for
registered securities issued by the central security depository. (See global certificates.) Bearer
global notes/certificates held at a foreign-resident central securities depository are reportable. The
entire amount of the issue minus any amount known to be owned by U.S. residents should be
reported by the issuer as registered. If the identity of the beneficial foreign owner is not known, the
country of the foreign central securities depository should be reported in Schedule 2, item 14 and
the type of foreign holder should be reported as Other in Schedule 2, item 15.
CERTIFICATE OF DEPOSIT - See Negotiable Certificates of Deposit.
COLLATERALIZED MORTGAGE OBLIGATION (CMO) - Mortgage-backed securities, which give
the purchaser a claim against the cash flows generated by the underlying mortgages. CMOs are
usually characterized by a multi-tranche or multi-class serialized structure. Collateralized Mortgage
Obligations (CMOs) should be reported as security type = 12 (asset-backed security).
67
COMMERCIAL PAPER - A promissory note, either unsecured or backed by assets such as loans or
mortgages. They are usually sold at a discount and customarily having a fixed maturity of 270 days
or less. All commercial paper should be reported as security type = 5 (commercial paper).
COMMINGLED ACCOUNT - An account in which the investment funds of individual clients are
pooled, with each client owning portions of the pooled account. U.S. securities held in foreign-
resident commingled accounts should be reported.
COMMON STOCK - A security representing equity ownership in a corporation. Common stock
claims are subordinate to the claims of bondholders, preferred stockholders, and general creditors.
Common stocks are reported as security type = 1 (common stock).
CONVERTIBLE BOND - A bond that can be exchanged at a set price for equity securities by the
holder under certain conditions. Convertible debt securities issued by U.S.-residents that are
owned by foreigners are reported as security type = 7 (convertible debt security).
CUSTODIAN - A bank or other entity that manages or administers the custody or safekeeping of
stock certificates, debt securities, or other assets for institutional or private investors.
DEPOSITARY RECEIPTS - See American Depositary Receipts (ADR). Related types of depositary
receipts, such as Global Depositary Receipts, that are backed by foreign securities are considered
foreign securities and should not be reported.
DEPOSIT NOTES - A debt security issued by a bank, backed by federal deposit insurance up to
$100,000 in principal and interest. They pay a fixed rate of interest and can be issued in book
entry or certificate form. Deposit notes are reported as security type = 6 (negotiable CD).
DEPOSITORY - An entity that holds securities, either in certificated or uncertificated
(dematerialized) form, to enable the transfer of ownership of securities. Depositories are not
necessarily custodians, since they may be responsible only for registering and settling security
transactions. The major U.S. depository is Depository Trust and Clearing Corporation (DTCC).
68
DERIVATIVE CONTRACT - Financial instrument or other contract with all three of the following
characteristics:
1. (a) One or more underlyings; (b) one or more notional amounts; and (c)
payment provisions. These terms determine the amount of the settlement or
settlements, and, in some cases, whether or not a settlement is required.
2. Requires no initial investment, or an initial investment that is much smaller than
would be required for other types of contracts that would be expected to have a
similar response to changes in market factors.
3. The terms require or permit net settlement, it can readily be settled net by a
means outside the contract, or it provides for delivery of an asset that puts the
recipient in a position not substantially different from net settlement.
Derivative contracts are excluded from this report. Embedded derivatives that are not bifurcated
from the host contract should be included in the value of the host contract. However, if the
embedded derivative is bifurcated from the host contract, the derivative should be excluded from
this report.
DIRECT INVESTMENT - A direct investment relationship exists when a U.S. company owns 10%
or more of the voting equity securities of an incorporated foreign business (or an equivalent
interest in an unincorporated foreign business, including a branch), or when a foreign company
owns 10% or more of the voting equity securities of an incorporated U.S. business (or an
equivalent interest in an unincorporated U.S. business, including a branch). Limited partners in a
limited partnership do not have voting rights and therefore cannot have direct investment. (See
Section III.K.) If a direct investment relationship exists, then in general, all financial positions
between the firms are considered direct investment. If a direct investment relationship exists
between non-banking entities, all securities held by the parent entity that were issued by the
affiliate of the parent are considered direct investment. However, if one of the entities is a
banking or securities brokerage firm, the inter-company holdings are considered direct
investment only if they provide permanent capital. All holdings known to be direct
investment should be excluded from this report.
FOREIGN BANK - A bank located in a foreign country and organized under the laws of that
country.
69
FOREIGN-RESIDENT (FOREIGN, FOREIGNER) - Any individual, corporation, or other entity
legally established outside of the United States, regardless of the actual center of economic activity
of the entity. Thus, a corporation incorporated outside of the United States is a foreign resident
even if it has no physical presence outside the United States. Foreigners/foreign residents include:
1. Individuals, including citizens of the United States, residing outside of the United States. (This
includes individuals that have filed an IRS Form W-8, indicating that the individual is a
nonresident alien. However, if an IRS Form is not available, the mailing address can be used to
determine residency.)
2. Any corporation or other entity legally established outside of the United States, including
branches, subsidiaries and other affiliates of U.S. entities located abroad.
3. Foreign governments and any subdivision, agency or instrumentality thereof, including all
foreign official nonbanking institutions, even if located in the United States (e.g., an embassy,
consulate, or other diplomatic establishment of a foreign country).
4. Official international or regional organizations or subordinate or affiliated agencies thereof,
created by treaty or convention between sovereign states, even if located in the United States,
including the International Bank for Reconstruction and Development (IBRD or World Bank), the
International Monetary Fund (IMF), and the United Nations (UN). (See Appendix D for a list of
international and regional organizations.)
FOREIGN SECURITIES - See Section III.C.
FOREIGN-RESIDENT CUSTODIAN - A custodian located outside the United States, including a
foreign affiliate of a U.S.-resident custodian. Reporters should determine the location of a
custodian according to the country in which the custodian is incorporated, or otherwise legally
established, not according to the country of the custodian’s parent firm, and not according to the
location of the custodian’s operations center.
FOREIGN-RESIDENT SUBCUSTODIAN - A foreign institution that holds in custody or safekeeps
foreign securities for U.S.-resident custodians.
FUNDS - Pooled, separate and general investment accounts, including mutual funds (open and
closed end), country funds, exchange traded funds, unit investment trusts, collective-investment
trusts, hedge funds, and all other similarly pooled, commingled investment funds. Foreign
ownership of shares of U.S.-resident funds are reported as security type = 3 (fund shares),
regardless of the types of securities held by the fund. U.S. securities held for foreign-resident
funds should be reported in the same manner as the holdings of other foreign residents. (See
70
Section III.E for the correct reporting of funds.)
GLOBAL NOTES/CERTIFICATES - Notes issued to one or more dealers that are represented by
a single global note and are intended to be the backing for registered securities issued by the
central security depository. Global notes/certificates held at a foreign-resident central securities
depository are reportable. The entire amount of the issue minus any amount known to be owned
by U.S. residents should be reported. If the identity of the beneficial foreign owner is not known,
the country of the foreign central securities depository should be reported in Schedule 2, item 14
and the type of foreign holder should be reported as Other in Schedule 2, item 15.
INDIVIDUALS - Natural persons. On item 15 on Schedule 2, enter 2 if the foreign holder of the
U.S. security is a natural person who does not use a foreign custodian. That is, the reporter is
holding the security directly for the individual.
INVESTMENT TRUST SHARE - A share of a company bound by a trust deed issued in registered
form, formed to invest in specific types of securities. Shares in an investment trust can usually be
bought and sold only through the stock exchange. Sometimes referred to as a ‘closed-end’ fund.
Foreign ownership of U.S. investment trust shares are reported as security type = 3 (fund shares),
regardless of the types of securities held by the trust.
LONG-TERM - No contractual maturity or an original maturity of more than one year.
MUNICIPAL BONDS - Debt securities issued by state and local governments. Municipal bonds
are reportable.
NEGOTIABLE CERTIFICATE OF DEPOSIT - Deposits evidence by a negotiable instrument, or a
deposit in book entry form evidence by a receipt or similar acknowledgement issued by a bank,
which provides on its face that the amount of such deposit is payable to the bearer or any specified
person. Report as security type = 6 (negotiable CD).
PREFERRED STOCK - Equity securities with preferences to the common stock of the issuer.
Preferred stock is usually entitled to dividends stated as a fixed dollar amount or as a percentage of
par value before any dividend can be paid on the common stock and have priority over common
shares in the event of liquidation. Preferred stock are reported as security type = 2 (preferred
stock).
71
REPURCHASE AGREEMENT (REPO) - A transaction involving the sale of financial assets by one
party to another, subject to an agreement for the seller to repurchase the assets at a specified
price on a future date. A resale agreement (also known as a reverse repurchase agreement) is the
same transaction viewed from the opposite perspective. Securities sold or purchased under
repurchase (resale) agreements should be reported as if the transaction had not occurred. (See
Section III. F of the reporting instructions.)
SECURITY - Any bill, note, bond, debenture, stock, negotiable money market instrument, or
similar instrument that is commonly referred to as a security. See Section III.B for a list of
reportable U.S. securities.
SETTLEMENT DATE - The date a security is delivered to the purchaser.
SETTLEMENT DATE ACCOUNTING - Under settlement date accounting the purchase and sale of
assets are not recorded until the settlement date. Settlement date accounting should be used for
purposes of this report.
SHORT-TERM - Original maturity of one year or less.
STATE OR LOCAL GOVERNMENT - The fifty states of the United States and the District of
Columbia, Puerto Rico and the U.S. territories and possessions, and their political subdivisions,
including counties, municipalities, school districts, irrigation districts, and drainage and sewer
districts.
STRIPS - An acronym for Separately Traded Registered Interest and Principal Securities. These
securities are created by "stripping" coupon payments from securities and treating these coupons
as separate securities from the principal. Stripped non-asset-backed securities are reported as
security type = 10 (bond or note, stripped). Stripped asset-backed securities are reported as
security type = 12 (asset-backed security).
STRUCTURED NOTE OR BOND - A financial instrument created specifically to meet the needs of
one or a small number of investors. Some of the more common structures include: step-up bonds,
index-amortizing notes, dual index notes, deleveraged bonds, range bonds, and inverse floaters.
Structured notes or bonds are reportable.
72
SUBSIDIARY - A company in which another company (parent) owns 50 percent or more of the
voting securities or an equivalent interest, or meets the consolidation requirement of U.S. GAAP.
U.S. TREASURY SECURITIES - Debt instruments that are direct obligations of the United States
Treasury. These instruments include Treasury bills that have an original maturity of one year or
less, Treasury notes that are intermediate-term (original maturity of 1-10 years) and Treasury
bonds that have an original maturity of 10 years or more. U.S. Treasury securities are reportable.
UNITED STATES - The fifty (50) States of the United States, the District of Columbia, the
Commonwealth of Puerto Rico, the Commonwealth of the Northern Mariana Islands, and the
following: American Samoa, Baker Island, Guam, Howland Island, Jarvis Island, Johnston Atoll,
Kingman Reef, Midway Islands, Navassa Island, Palmyra Atoll, the U.S. Virgin Islands, and Wake
Island.
UNIT INVESTMENT TRUST - A fixed portfolio of securities that are assembled by an underwriter
sponsor and upon completion of the underwriting, are deposited with an independent trustee. Unit
investment trusts have a definite termination date, usually between 6 months and 10 years. Unit
investment trust securities are reported as security type = 3 (fund shares), regardless of the
maturity date or the types of securities purchased. U.S. securities held for foreign-resident unit
investment trusts should also be reported. (See Section III.E for the correct reporting of unit
investment trusts.)
U.S. RESIDENT - Any individual, corporation, or other entity incorporated or otherwise legally
established in the United States, including branches, subsidiaries and affiliates of foreign entities
located in the United States. Corporations incorporated in the United States are considered to be
U.S. residents even if they have a de minimus "physical presence" in the United States.
U.S.-RESIDENT CUSTODIAN - A custodian located in the United States, including a U.S.-resident
affiliate of a foreign custodian.
U.S.-RESIDENT ISSUER - Any individual, corporation, or other entity located in the United States
that issues securities in its own name, including U.S.-resident affiliates of foreign entities.
ZERO-COUPON SECURITY - Bonds that do not provide interest payments. Zero-coupon bonds
usually have an issue price well below 100% of the face value with repayment on maturity at face
value or par. The investors’ return is the difference between the issue price and redemption value.
73
Zero-coupon bonds and notes are reported as security type = 8 (zero-coupon bond or note).

74
AAPPPPEENNDDIIXX HH
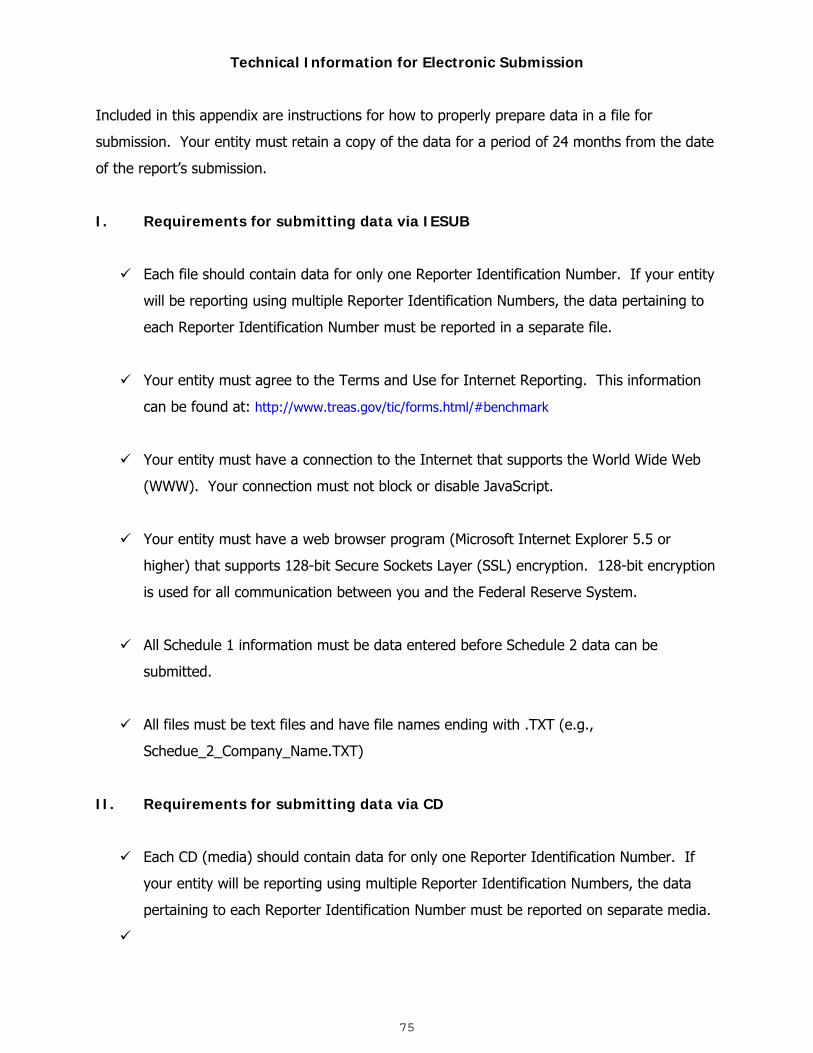
75
Technical Information for Electronic Submission
Included in this appendix are instructions for how to properly prepare data in a file for
submission. Your entity must retain a copy of the data for a period of 24 months from the date
of the report’s submission.
I. Requirements for submitting data via IESUB
Each file should contain data for only one Reporter Identification Number. If your entity
will be reporting using multiple Reporter Identification Numbers, the data pertaining to
each Reporter Identification Number must be reported in a separate file.
Your entity must agree to the Terms and Use for Internet Reporting. This information
can be found at: http://www.treas.gov/tic/forms.html/#benchmark
Your entity must have a connection to the Internet that supports the World Wide Web
(WWW). Your connection must not block or disable JavaScript.
Your entity must have a web browser program (Microsoft Internet Explorer 5.5 or
higher) that supports 128-bit Secure Sockets Layer (SSL) encryption. 128-bit encryption
is used for all communication between you and the Federal Reserve System.
All Schedule 1 information must be data entered before Schedule 2 data can be
submitted.
All files must be text files and have file names ending with .TXT (e.g.,
Schedue_2_Company_Name.TXT)
II. Requirements for submitting data via CD
Each CD (media) should contain data for only one Reporter Identification Number. If
your entity will be reporting using multiple Reporter Identification Numbers, the data
pertaining to each Reporter Identification Number must be reported on separate media.
76
Each media for a particular Reporter Identification Number must be accompanied by a
paper format Schedule 1.
A dump or print out that includes at least the first ten detail records should accompany
each media.
Include a printout of the command string used to create the file if the file was created
directly from the mainframe.
Include any special instructions on how to unload the file.
All Schedule 2 data must be provided in a standard DOS, ASCII flat file the following
media:
• Standard 700 MB CD(s)
Data must be submitted by August 31, 2009 to:
Federal Reserve Bank of New York
Statistics Function, 4th Floor
33 Liberty Street
New York, NY 10045-0001
Should you have any questions concerning the instructions in this appendix, please contact the
FRBNY automation staff at 212-720-1989 or 646-720-1989.
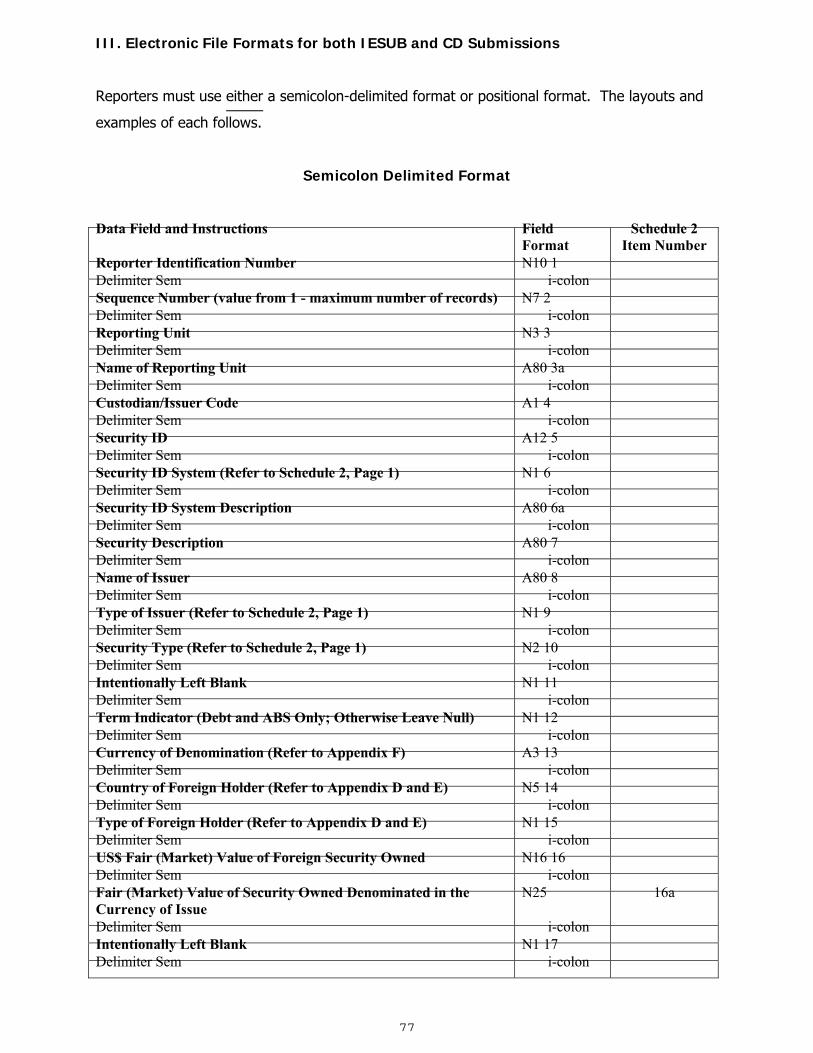
77
III. Electronic File Formats for both IESUB and CD Submissions
Reporters must use either a semicolon-delimited format or positional format. The layouts and
examples of each follows.
Semicolon Delimited Format
Data Field and Instructions Field Format
Schedule 2 Item Number
Reporter Identification Number N10 1 Delimiter Sem i-colon Sequence Number (value from 1 - maximum number of records) N7 2 Delimiter Sem i-colon Reporting Unit N3 3 Delimiter Sem i-colon Name of Reporting Unit A80 3a Delimiter Sem i-colon Custodian/Issuer Code A1 4 Delimiter Sem i-colon Security ID A12 5 Delimiter Sem i-colon Security ID System (Refer to Schedule 2, Page 1) N1 6 Delimiter Sem i-colon Security ID System Description A80 6a Delimiter Sem i-colon Security Description A80 7 Delimiter Sem i-colon Name of Issuer A80 8 Delimiter Sem i-colon Type of Issuer (Refer to Schedule 2, Page 1) N1 9 Delimiter Sem i-colon Security Type (Refer to Schedule 2, Page 1) N2 10 Delimiter Sem i-colon Intentionally Left Blank N1 11 Delimiter Sem i-colon Term Indicator (Debt and ABS Only; Otherwise Leave Null) N1 12 Delimiter Sem i-colon Currency of Denomination (Refer to Appendix F) A3 13 Delimiter Sem i-colon Country of Foreign Holder (Refer to Appendix D and E) N5 14 Delimiter Sem i-colon Type of Foreign Holder (Refer to Appendix D and E) N1 15 Delimiter Sem i-colon US$ Fair (Market) Value of Foreign Security Owned N16 16 Delimiter Sem i-colon Fair (Market) Value of Security Owned Denominated in the Currency of Issue
N25
16a
Delimiter Sem i-colon Intentionally Left Blank N1 17 Delimiter Sem i-colon
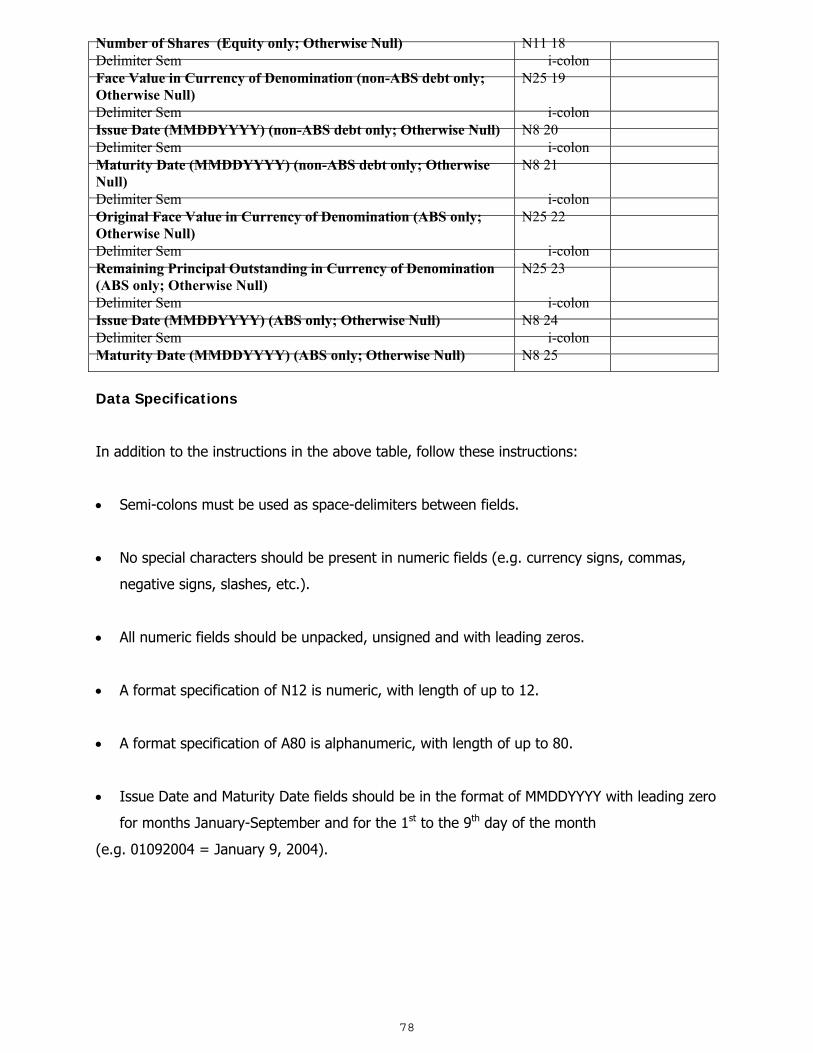
78
Number of Shares (Equity only; Otherwise Null) N11 18 Delimiter Sem i-colon Face Value in Currency of Denomination (non-ABS debt only; Otherwise Null)
N25 19
Delimiter Sem i-colon Issue Date (MMDDYYYY) (non-ABS debt only; Otherwise Null) N8 20 Delimiter Sem i-colon Maturity Date (MMDDYYYY) (non-ABS debt only; Otherwise Null)
N8 21
Delimiter Sem i-colon Original Face Value in Currency of Denomination (ABS only; Otherwise Null)
N25 22
Delimiter Sem i-colon Remaining Principal Outstanding in Currency of Denomination (ABS only; Otherwise Null)
N25 23
Delimiter Sem i-colon Issue Date (MMDDYYYY) (ABS only; Otherwise Null) N8 24 Delimiter Sem i-colon Maturity Date (MMDDYYYY) (ABS only; Otherwise Null) N8 25
Data Specifications
In addition to the instructions in the above table, follow these instructions:
• Semi-colons must be used as space-delimiters between fields.
• No special characters should be present in numeric fields (e.g. currency signs, commas,
negative signs, slashes, etc.).
• All numeric fields should be unpacked, unsigned and with leading zeros.
• A format specification of N12 is numeric, with length of up to 12.
• A format specification of A80 is alphanumeric, with length of up to 80.
• Issue Date and Maturity Date fields should be in the format of MMDDYYYY with leading zero
for months January-September and for the 1st to the 9th day of the month
(e.g. 01092004 = January 9, 2004).
79
External Label (Affix to media, not to cover)
Company Name
Reporter Identification Number as assigned by the FRBNY
Data Processing Contact Name and Telephone Number
CD Identification Number (as identified in your records)
Total Number of CD: 1 of __
Creation Date
Contents: 2009 Report of Foreign Holdings of U.S. Securities, Including Selected Money Market
Securities (SHL)
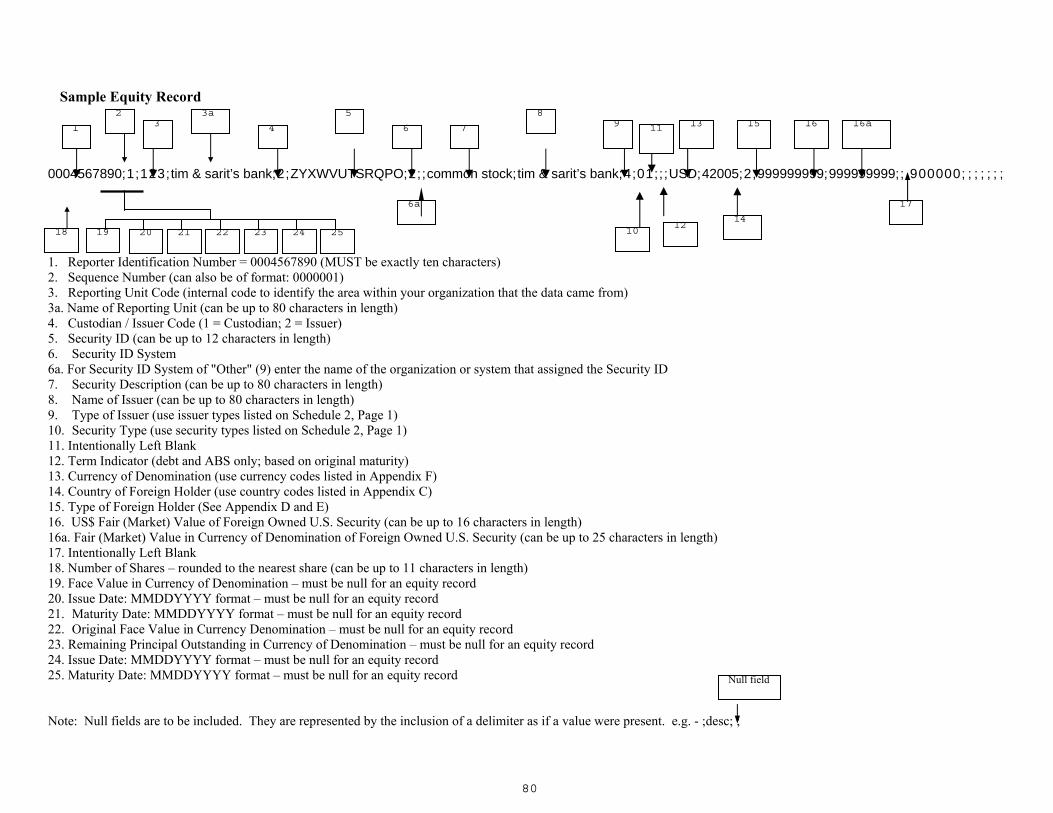
80
Sample Equity Record 0004567890;1;123;tim & sarit’s bank;2;ZYXWVUTSRQPO;2;;common stock;tim & sarit’s bank;4;01;;;USD;42005;2;999999999;999999999;; 900000; ; ; ; ; ; ; 1. Reporter Identification Number = 0004567890 (MUST be exactly ten characters) 2. Sequence Number (can also be of format: 0000001) 3. Reporting Unit Code (internal code to identify the area within your organization that the data came from) 3a. Name of Reporting Unit (can be up to 80 characters in length) 4. Custodian / Issuer Code (1 = Custodian; 2 = Issuer) 5. Security ID (can be up to 12 characters in length) 6. Security ID System 6a. For Security ID System of "Other" (9) enter the name of the organization or system that assigned the Security ID 7. Security Description (can be up to 80 characters in length) 8. Name of Issuer (can be up to 80 characters in length) 9. Type of Issuer (use issuer types listed on Schedule 2, Page 1) 10. Security Type (use security types listed on Schedule 2, Page 1) 11. Intentionally Left Blank 12. Term Indicator (debt and ABS only; based on original maturity) 13. Currency of Denomination (use currency codes listed in Appendix F) 14. Country of Foreign Holder (use country codes listed in Appendix C) 15. Type of Foreign Holder (See Appendix D and E) 16. US$ Fair (Market) Value of Foreign Owned U.S. Security (can be up to 16 characters in length) 16a. Fair (Market) Value in Currency of Denomination of Foreign Owned U.S. Security (can be up to 25 characters in length) 17. Intentionally Left Blank 18. Number of Shares – rounded to the nearest share (can be up to 11 characters in length) 19. Face Value in Currency of Denomination – must be null for an equity record 20. Issue Date: MMDDYYYY format – must be null for an equity record 21. Maturity Date: MMDDYYYY format – must be null for an equity record 22. Original Face Value in Currency Denomination – must be null for an equity record 23. Remaining Principal Outstanding in Currency of Denomination – must be null for an equity record 24. Issue Date: MMDDYYYY format – must be null for an equity record 25. Maturity Date: MMDDYYYY format – must be null for an equity record Note: Null fields are to be included. They are represented by the inclusion of a delimiter as if a value were present. e.g. - ;desc; ;
1 3 4 6 7 9 13 16a 2 3a 5 8
6a
10 14
15 16
Null field
17
19 20 21 22 23 24 25 12
11
18
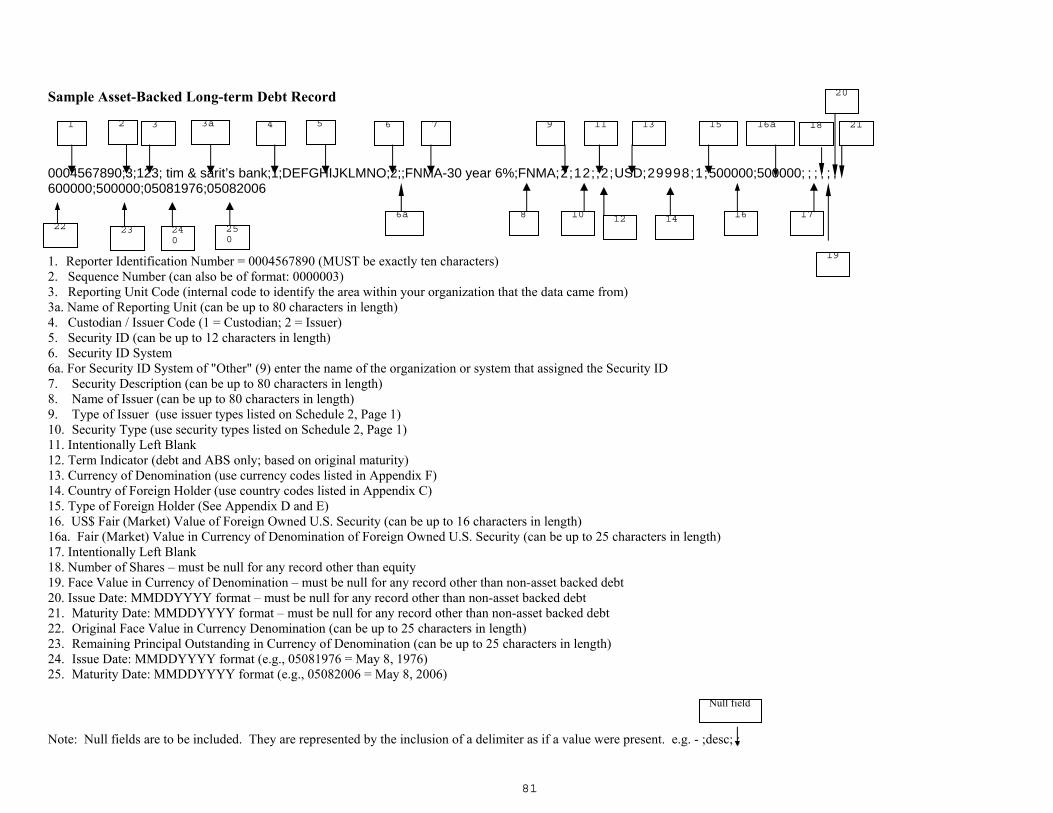
81
Sample Asset-Backed Long-term Debt Record 0004567890;3;123; tim & sarit’s bank;1;DEFGHIJKLMNO;2;;FNMA-30 year 6%;FNMA;2;12;;2;USD;29998;1;500000;500000; ; ; ; ; ; 600000;500000;05081976;05082006
1. Reporter Identification Number = 0004567890 (MUST be exactly ten characters) 2. Sequence Number (can also be of format: 0000003) 3. Reporting Unit Code (internal code to identify the area within your organization that the data came from) 3a. Name of Reporting Unit (can be up to 80 characters in length) 4. Custodian / Issuer Code (1 = Custodian; 2 = Issuer) 5. Security ID (can be up to 12 characters in length) 6. Security ID System 6a. For Security ID System of "Other" (9) enter the name of the organization or system that assigned the Security ID 7. Security Description (can be up to 80 characters in length) 8. Name of Issuer (can be up to 80 characters in length) 9. Type of Issuer (use issuer types listed on Schedule 2, Page 1) 10. Security Type (use security types listed on Schedule 2, Page 1) 11. Intentionally Left Blank 12. Term Indicator (debt and ABS only; based on original maturity) 13. Currency of Denomination (use currency codes listed in Appendix F) 14. Country of Foreign Holder (use country codes listed in Appendix C) 15. Type of Foreign Holder (See Appendix D and E) 16. US$ Fair (Market) Value of Foreign Owned U.S. Security (can be up to 16 characters in length) 16a. Fair (Market) Value in Currency of Denomination of Foreign Owned U.S. Security (can be up to 25 characters in length) 17. Intentionally Left Blank 18. Number of Shares – must be null for any record other than equity 19. Face Value in Currency of Denomination – must be null for any record other than non-asset backed debt 20. Issue Date: MMDDYYYY format – must be null for any record other than non-asset backed debt 21. Maturity Date: MMDDYYYY format – must be null for any record other than non-asset backed debt 22. Original Face Value in Currency Denomination (can be up to 25 characters in length) 23. Remaining Principal Outstanding in Currency of Denomination (can be up to 25 characters in length) 24. Issue Date: MMDDYYYY format (e.g., 05081976 = May 8, 1976) 25. Maturity Date: MMDDYYYY format (e.g., 05082006 = May 8, 2006) Note: Null fields are to be included. They are represented by the inclusion of a delimiter as if a value were present. e.g. - ;desc; ;
1 3 4 6 7 9 11 13 15 2 3a
10 12 14 16
16a
6a
5
8 17
18
23 24 0
20
19
22
21
Null field
25 0
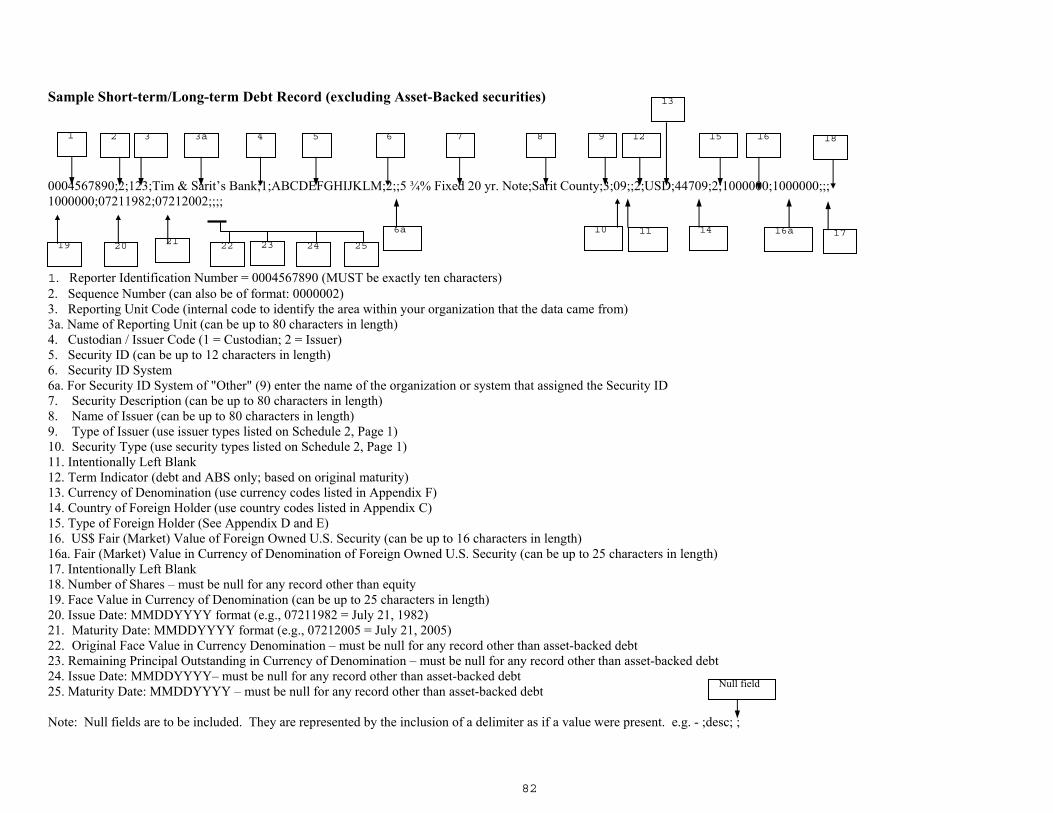
82
Sample Short-term/Long-term Debt Record (excluding Asset-Backed securities) 0004567890;2;123;Tim & Sarit’s Bank;1;ABCDEFGHIJKLM;2;;5 ¾% Fixed 20 yr. Note;Sarit County;3;09;;2;USD;44709;2;1000000;1000000;;; 1000000;07211982;07212002;;;;
1. Reporter Identification Number = 0004567890 (MUST be exactly ten characters) 2. Sequence Number (can also be of format: 0000002) 3. Reporting Unit Code (internal code to identify the area within your organization that the data came from) 3a. Name of Reporting Unit (can be up to 80 characters in length) 4. Custodian / Issuer Code (1 = Custodian; 2 = Issuer) 5. Security ID (can be up to 12 characters in length) 6. Security ID System 6a. For Security ID System of "Other" (9) enter the name of the organization or system that assigned the Security ID 7. Security Description (can be up to 80 characters in length) 8. Name of Issuer (can be up to 80 characters in length) 9. Type of Issuer (use issuer types listed on Schedule 2, Page 1) 10. Security Type (use security types listed on Schedule 2, Page 1) 11. Intentionally Left Blank 12. Term Indicator (debt and ABS only; based on original maturity) 13. Currency of Denomination (use currency codes listed in Appendix F) 14. Country of Foreign Holder (use country codes listed in Appendix C) 15. Type of Foreign Holder (See Appendix D and E) 16. US$ Fair (Market) Value of Foreign Owned U.S. Security (can be up to 16 characters in length) 16a. Fair (Market) Value in Currency of Denomination of Foreign Owned U.S. Security (can be up to 25 characters in length) 17. Intentionally Left Blank 18. Number of Shares – must be null for any record other than equity 19. Face Value in Currency of Denomination (can be up to 25 characters in length) 20. Issue Date: MMDDYYYY format (e.g., 07211982 = July 21, 1982) 21. Maturity Date: MMDDYYYY format (e.g., 07212005 = July 21, 2005) 22. Original Face Value in Currency Denomination – must be null for any record other than asset-backed debt 23. Remaining Principal Outstanding in Currency of Denomination – must be null for any record other than asset-backed debt 24. Issue Date: MMDDYYYY– must be null for any record other than asset-backed debt 25. Maturity Date: MMDDYYYY – must be null for any record other than asset-backed debt Note: Null fields are to be included. They are represented by the inclusion of a delimiter as if a value were present. e.g. - ;desc; ;
1 3 4 6 7 8 9 12 15 2 3a 5
6a 10 11 14 16a
16
17
13
19
18
20 21
Null field
22 23 24 25
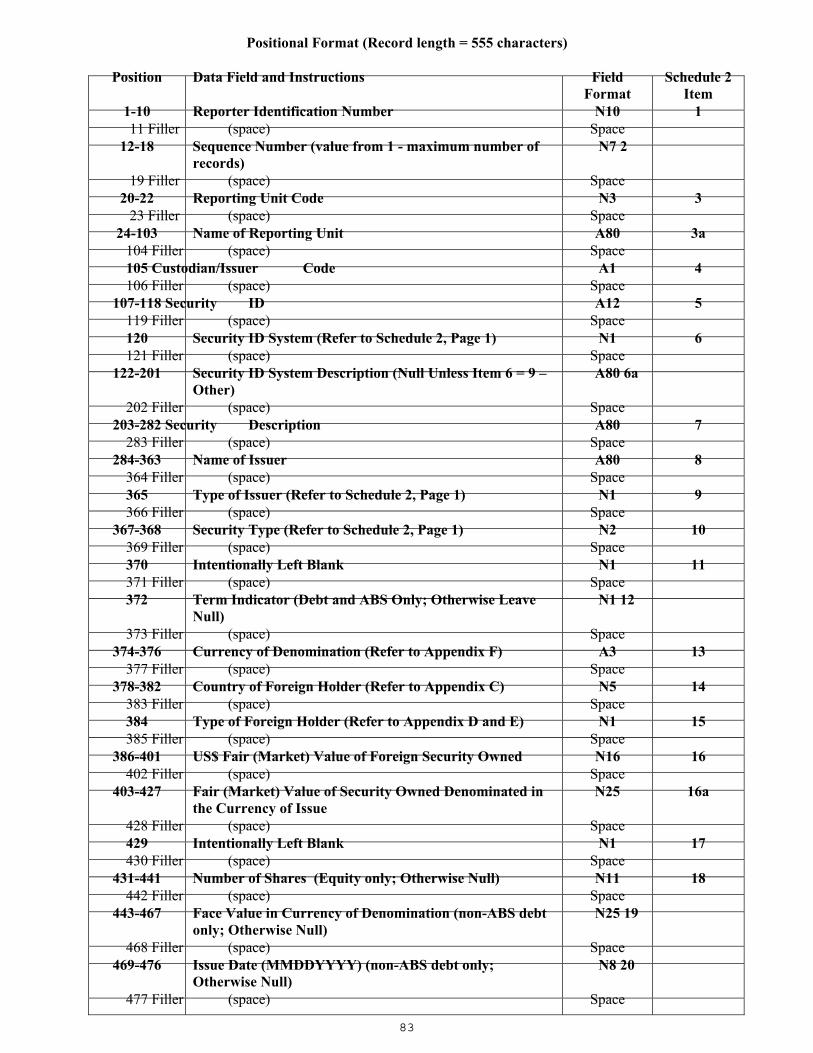
83
Positional Format (Record length = 555 characters)
Position Data Field and Instructions Field Format
Schedule 2 Item
1-10 Reporter Identification Number N10 1 11 Filler (space) Space
12-18 Sequence Number (value from 1 - maximum number of records)
N7 2
19 Filler (space) Space 20-22 Reporting Unit Code N3 3
23 Filler (space) Space 24-103 Name of Reporting Unit A80 3a
104 Filler (space) Space 105 Custodian/Issuer Code A1 4 106 Filler (space) Space
107-118 Security ID A12 5 119 Filler (space) Space 120 Security ID System (Refer to Schedule 2, Page 1) N1 6 121 Filler (space) Space
122-201 Security ID System Description (Null Unless Item 6 = 9 – Other)
A80 6a
202 Filler (space) Space 203-282 Security Description A80 7
283 Filler (space) Space 284-363 Name of Issuer A80 8
364 Filler (space) Space 365 Type of Issuer (Refer to Schedule 2, Page 1) N1 9 366 Filler (space) Space
367-368 Security Type (Refer to Schedule 2, Page 1) N2 10 369 Filler (space) Space 370 Intentionally Left Blank N1 11 371 Filler (space) Space 372 Term Indicator (Debt and ABS Only; Otherwise Leave
Null) N1 12
373 Filler (space) Space 374-376 Currency of Denomination (Refer to Appendix F) A3 13
377 Filler (space) Space 378-382 Country of Foreign Holder (Refer to Appendix C) N5 14
383 Filler (space) Space 384 Type of Foreign Holder (Refer to Appendix D and E) N1 15 385 Filler (space) Space
386-401 US$ Fair (Market) Value of Foreign Security Owned N16 16 402 Filler (space) Space
403-427 Fair (Market) Value of Security Owned Denominated in the Currency of Issue
N25
16a
428 Filler (space) Space 429 Intentionally Left Blank N1 17 430 Filler (space) Space
431-441 Number of Shares (Equity only; Otherwise Null) N11 18 442 Filler (space) Space
443-467 Face Value in Currency of Denomination (non-ABS debt only; Otherwise Null)
N25 19
468 Filler (space) Space 469-476 Issue Date (MMDDYYYY) (non-ABS debt only;
Otherwise Null) N8 20
477 Filler (space) Space
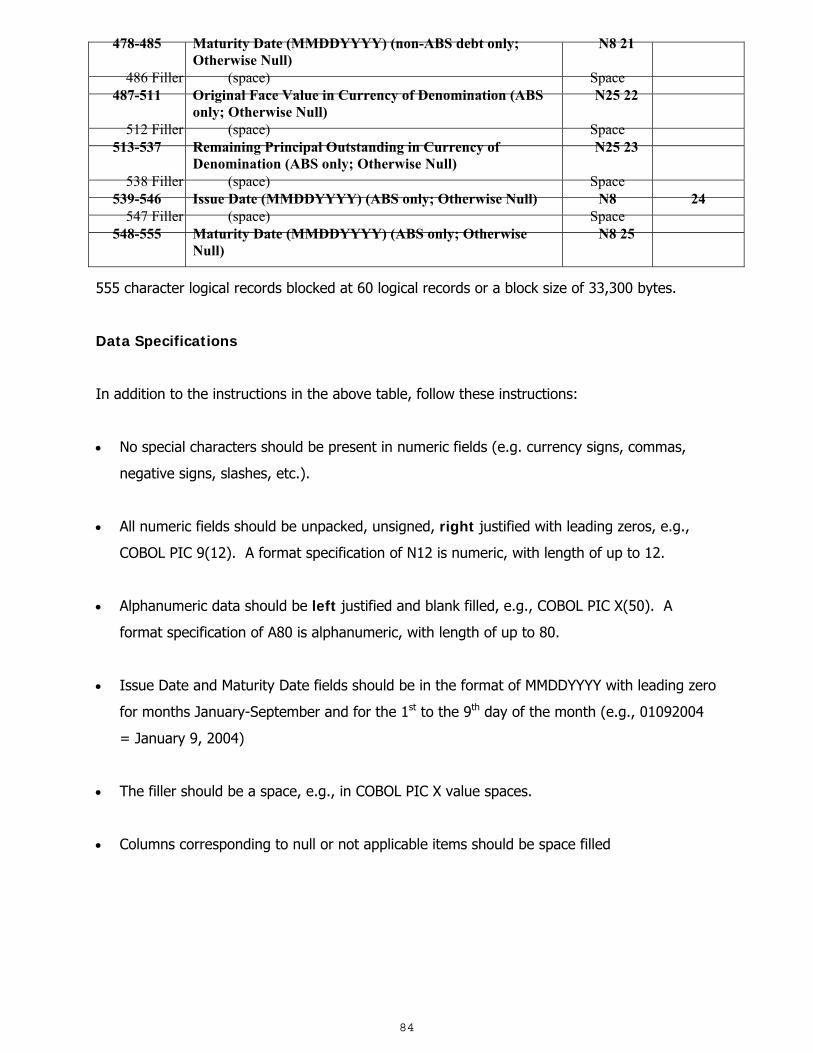
84
478-485 Maturity Date (MMDDYYYY) (non-ABS debt only; Otherwise Null)
N8 21
486 Filler (space) Space 487-511 Original Face Value in Currency of Denomination (ABS
only; Otherwise Null) N25 22
512 Filler (space) Space 513-537 Remaining Principal Outstanding in Currency of
Denomination (ABS only; Otherwise Null) N25 23
538 Filler (space) Space 539-546 Issue Date (MMDDYYYY) (ABS only; Otherwise Null) N8 24
547 Filler (space) Space 548-555 Maturity Date (MMDDYYYY) (ABS only; Otherwise
Null) N8 25
555 character logical records blocked at 60 logical records or a block size of 33,300 bytes.
Data Specifications
In addition to the instructions in the above table, follow these instructions:
• No special characters should be present in numeric fields (e.g. currency signs, commas,
negative signs, slashes, etc.).
• All numeric fields should be unpacked, unsigned, right justified with leading zeros, e.g.,
COBOL PIC 9(12). A format specification of N12 is numeric, with length of up to 12.
• Alphanumeric data should be left justified and blank filled, e.g., COBOL PIC X(50). A
format specification of A80 is alphanumeric, with length of up to 80.
• Issue Date and Maturity Date fields should be in the format of MMDDYYYY with leading zero
for months January-September and for the 1st to the 9th day of the month (e.g., 01092004
= January 9, 2004)
• The filler should be a space, e.g., in COBOL PIC X value spaces.
• Columns corresponding to null or not applicable items should be space filled
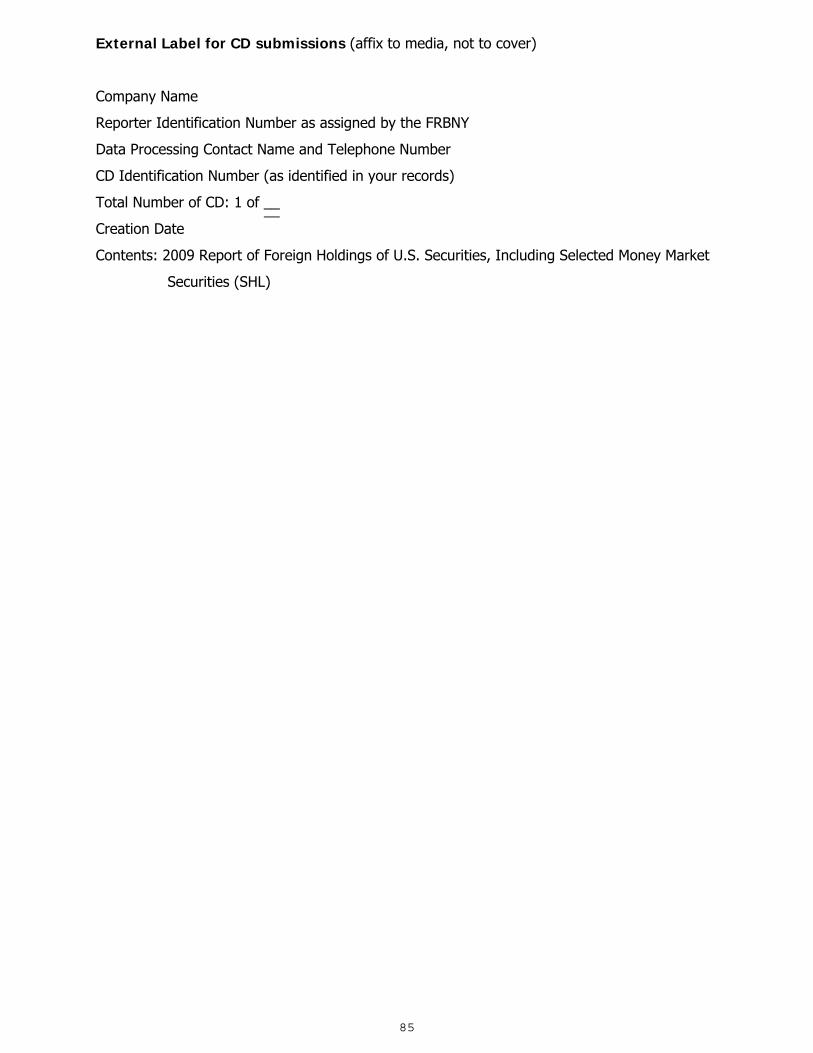
85
External Label for CD submissions (affix to media, not to cover)
Company Name
Reporter Identification Number as assigned by the FRBNY
Data Processing Contact Name and Telephone Number
CD Identification Number (as identified in your records)
Total Number of CD: 1 of __
Creation Date
Contents: 2009 Report of Foreign Holdings of U.S. Securities, Including Selected Money Market
Securities (SHL)
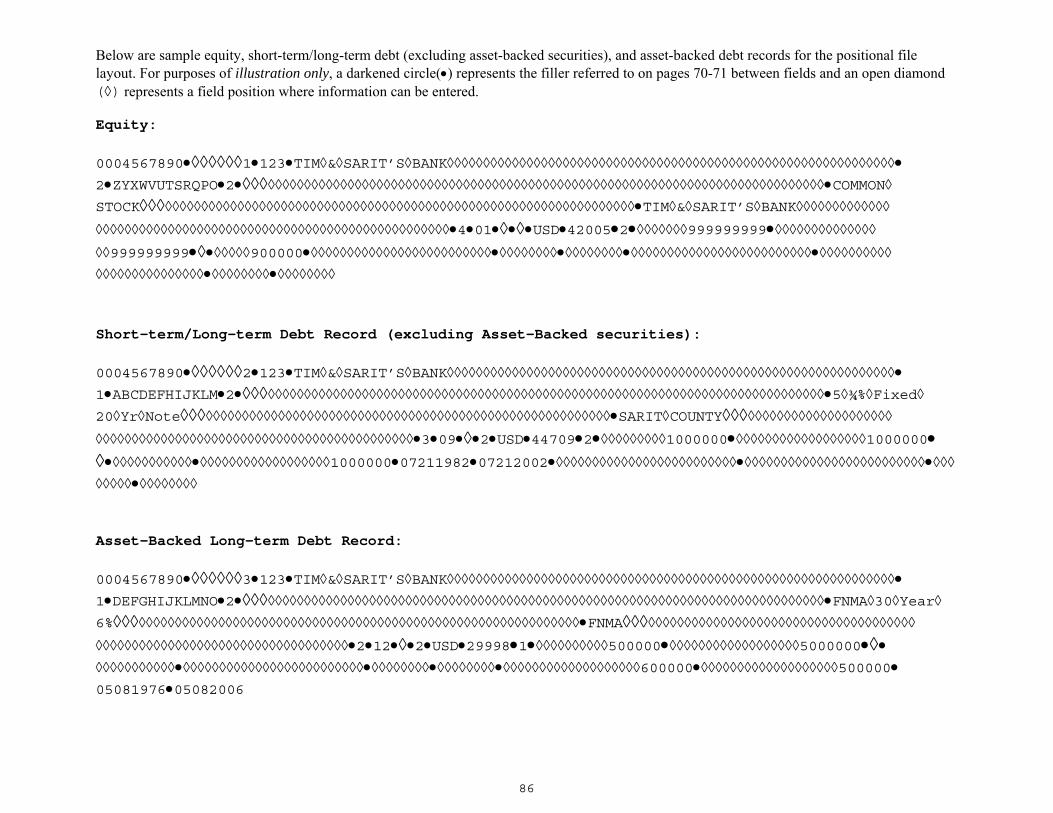
86
Below are sample equity, short-term/long-term debt (excluding asset-backed securities), and asset-backed debt records for the positional file layout. For purposes of illustration only, a darkened circle(•) represents the filler referred to on pages 70-71 between fields and an open diamond (◊) represents a field position where information can be entered. Equity:
0004567890•◊◊◊◊◊◊1•123•TIM◊&◊SARIT’S◊BANK◊◊◊◊◊◊◊◊◊◊◊◊◊◊◊◊◊◊◊◊◊◊◊◊◊◊◊◊◊◊◊◊◊◊◊◊◊◊◊◊◊◊◊◊◊◊◊◊◊◊◊◊◊◊◊◊◊◊◊◊◊◊• 2•ZYXWVUTSRQPO•2•◊◊◊◊◊◊◊◊◊◊◊◊◊◊◊◊◊◊◊◊◊◊◊◊◊◊◊◊◊◊◊◊◊◊◊◊◊◊◊◊◊◊◊◊◊◊◊◊◊◊◊◊◊◊◊◊◊◊◊◊◊◊◊◊◊◊◊◊◊◊◊◊◊◊◊◊◊◊◊◊•COMMON◊ STOCK◊◊◊◊◊◊◊◊◊◊◊◊◊◊◊◊◊◊◊◊◊◊◊◊◊◊◊◊◊◊◊◊◊◊◊◊◊◊◊◊◊◊◊◊◊◊◊◊◊◊◊◊◊◊◊◊◊◊◊◊◊◊◊◊◊◊◊◊•TIM◊&◊SARIT’S◊BANK◊◊◊◊◊◊◊◊◊◊◊◊◊ ◊◊◊◊◊◊◊◊◊◊◊◊◊◊◊◊◊◊◊◊◊◊◊◊◊◊◊◊◊◊◊◊◊◊◊◊◊◊◊◊◊◊◊◊◊◊◊◊◊•4•01•◊•◊•USD•42005•2•◊◊◊◊◊◊◊999999999•◊◊◊◊◊◊◊◊◊◊◊◊◊◊ ◊◊999999999•◊•◊◊◊◊◊900000•◊◊◊◊◊◊◊◊◊◊◊◊◊◊◊◊◊◊◊◊◊◊◊◊◊•◊◊◊◊◊◊◊◊•◊◊◊◊◊◊◊◊•◊◊◊◊◊◊◊◊◊◊◊◊◊◊◊◊◊◊◊◊◊◊◊◊◊•◊◊◊◊◊◊◊◊◊◊ ◊◊◊◊◊◊◊◊◊◊◊◊◊◊◊•◊◊◊◊◊◊◊◊•◊◊◊◊◊◊◊◊ Short-term/Long-term Debt Record (excluding Asset-Backed securities):
0004567890•◊◊◊◊◊◊2•123•TIM◊&◊SARIT’S◊BANK◊◊◊◊◊◊◊◊◊◊◊◊◊◊◊◊◊◊◊◊◊◊◊◊◊◊◊◊◊◊◊◊◊◊◊◊◊◊◊◊◊◊◊◊◊◊◊◊◊◊◊◊◊◊◊◊◊◊◊◊◊◊• 1•ABCDEFHIJKLM•2•◊◊◊◊◊◊◊◊◊◊◊◊◊◊◊◊◊◊◊◊◊◊◊◊◊◊◊◊◊◊◊◊◊◊◊◊◊◊◊◊◊◊◊◊◊◊◊◊◊◊◊◊◊◊◊◊◊◊◊◊◊◊◊◊◊◊◊◊◊◊◊◊◊◊◊◊◊◊◊◊•5◊¾%◊Fixed◊ 20◊Yr◊Note◊◊◊◊◊◊◊◊◊◊◊◊◊◊◊◊◊◊◊◊◊◊◊◊◊◊◊◊◊◊◊◊◊◊◊◊◊◊◊◊◊◊◊◊◊◊◊◊◊◊◊◊◊◊◊◊◊◊◊•SARIT◊COUNTY◊◊◊◊◊◊◊◊◊◊◊◊◊◊◊◊◊◊◊◊◊◊◊ ◊◊◊◊◊◊◊◊◊◊◊◊◊◊◊◊◊◊◊◊◊◊◊◊◊◊◊◊◊◊◊◊◊◊◊◊◊◊◊◊◊◊◊◊•3•09•◊•2•USD•44709•2•◊◊◊◊◊◊◊◊◊1000000•◊◊◊◊◊◊◊◊◊◊◊◊◊◊◊◊◊◊1000000• ◊•◊◊◊◊◊◊◊◊◊◊◊•◊◊◊◊◊◊◊◊◊◊◊◊◊◊◊◊◊◊1000000•07211982•07212002•◊◊◊◊◊◊◊◊◊◊◊◊◊◊◊◊◊◊◊◊◊◊◊◊◊•◊◊◊◊◊◊◊◊◊◊◊◊◊◊◊◊◊◊◊◊◊◊◊◊◊•◊◊◊◊◊◊◊◊•◊◊◊◊◊◊◊◊ Asset-Backed Long-term Debt Record:
0004567890•◊◊◊◊◊◊3•123•TIM◊&◊SARIT’S◊BANK◊◊◊◊◊◊◊◊◊◊◊◊◊◊◊◊◊◊◊◊◊◊◊◊◊◊◊◊◊◊◊◊◊◊◊◊◊◊◊◊◊◊◊◊◊◊◊◊◊◊◊◊◊◊◊◊◊◊◊◊◊◊• 1•DEFGHIJKLMNO•2•◊◊◊◊◊◊◊◊◊◊◊◊◊◊◊◊◊◊◊◊◊◊◊◊◊◊◊◊◊◊◊◊◊◊◊◊◊◊◊◊◊◊◊◊◊◊◊◊◊◊◊◊◊◊◊◊◊◊◊◊◊◊◊◊◊◊◊◊◊◊◊◊◊◊◊◊◊◊◊◊•FNMA◊30◊Year◊ 6%◊◊◊◊◊◊◊◊◊◊◊◊◊◊◊◊◊◊◊◊◊◊◊◊◊◊◊◊◊◊◊◊◊◊◊◊◊◊◊◊◊◊◊◊◊◊◊◊◊◊◊◊◊◊◊◊◊◊◊◊◊◊◊◊•FNMA◊◊◊◊◊◊◊◊◊◊◊◊◊◊◊◊◊◊◊◊◊◊◊◊◊◊◊◊◊◊◊◊◊◊◊◊◊◊◊◊ ◊◊◊◊◊◊◊◊◊◊◊◊◊◊◊◊◊◊◊◊◊◊◊◊◊◊◊◊◊◊◊◊◊◊◊•2•12•◊•2•USD•29998•1•◊◊◊◊◊◊◊◊◊◊500000•◊◊◊◊◊◊◊◊◊◊◊◊◊◊◊◊◊◊5000000•◊• ◊◊◊◊◊◊◊◊◊◊◊•◊◊◊◊◊◊◊◊◊◊◊◊◊◊◊◊◊◊◊◊◊◊◊◊◊•◊◊◊◊◊◊◊◊•◊◊◊◊◊◊◊◊•◊◊◊◊◊◊◊◊◊◊◊◊◊◊◊◊◊◊◊600000•◊◊◊◊◊◊◊◊◊◊◊◊◊◊◊◊◊◊◊500000• 05081976•05082006
87
AAPPPPEENNDDIIXX II
88
LIST OF FEDERAL AGENCIES AND FEDERALLY SPONSORED ENTERPRISES
A. U.S. FEDERAL GOVERNMENT AGENCIES and CORPORATIONS Architect of the Capital Commodity Credit Corporation (CCC) Department of Agriculture, including former Rural Electrification Administration (REA), and former Farmers Housing Administration (FmHA). Department of Defense and Military Services (e.g. Air Force) Department of Housing and Urban Development (HUD) Department of Interior Export-Import Bank of the United States (Ex-Im Bank) Federal Communication Commission (FCC) Farm Credit System Financial Assistance Corporation (FCSFAC) Federal Deposit Insurance Corporation (FDIC), including FSLIC Resolution Fund Federal Housing Administration (FHA) Financing Corporation (FICO) General Services Administration (GSA) Government National Mortgage Association (GNMA or Ginnie Mae) Maritime Administration National Archives and Records Administration (NARA) National Consumer Cooperative Bank Overseas Private Investment Corporation (OPIC) Resolution Funding Corporation (REFCORP) Rural Telephone Bank Small Business Administration (SBA) Tennessee Valley Authority (TVA), including lease obligations Washington Metropolitan Area Transit Authority (WMATA) B. FEDERALLY SPONSORED ENTERPRISES Farm Credit System:
Agricultural Credit Bank (ACB) Farm Credit Banks (FCB)
Federal Agricultural Mortgage Corporation (FAMC or Farmer Mac) Federal Home Loan Banks (FHLB) Federal Home Loan Mortgage Corporation (FHLMC or Freddie Mac) Federal National Mortgage Association (FNMA or Fannie Mae)