Embed Size (px)
Citation preview
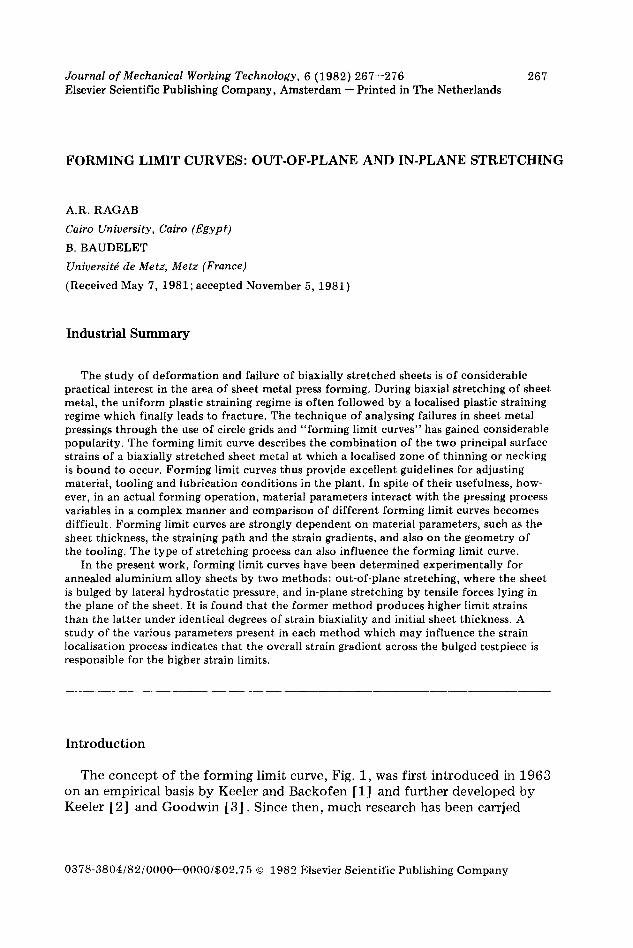
Journal of Mechanical Working Technology, 6 (1982) 267--276 267 Elsevier Scientific Publishing Company, Amsterdam -- Printed in The Netherlands
F O R M I N G L I M I T C U R V E S : O U T - O F - P L A N E A N D I N - P L A N E S T R E T C H I N G
A.R. RAGAB
Cairo University, Cairo (Egypt)
B. BAUDELET
Universitd de Metz, Metz (France)
(Received May 7, 1981; accepted November 5, 1981)
I n d u s t r i a l S u m m a r y
The study of deformation and failure of biaxially stretched sheets is of considerable practical interest in the area of sheet metal press forming. During biaxial stretching of sheet metal, the uniform plastic straining regime is often followed by a localised plastic straining regime which finally leads to fracture. The technique of analysing failures in sheet metal pressings through the use of circle grids and "forming limit curves" has gained considerable popularity. The forming limit curve describes the combination of the two principal surface strains of a biaxially stretched sheet metal at which a localised zone of thinning or necking is bound to occur. Forming limit curves thus provide excellent guidelines for adjusting material, tooling and lubrication conditions in the plant. In spite of their usefulness, how- ever, in an actual forming operation, material parameters interact with the pressing process variables in a complex manner and comparison of different forming limit curves becomes difficult. Forming limit curves are strongly dependent on material parameters, such as the sheet thickness, the straining path and the strain gradients, and also on the geometry of the tooling. The type of stretching process can also influence the forming limit curve.
In the present work, forming limit curves have been determined experimentally for annealed aluminium alloy sheets by two methods: out-of-plane stretching, where the sheet is bulged by lateral hydrostatic pressure, and in-plane stretching by tensile forces lying in the plane of the sheet. It is found that the former method produces higher limit strains than the latter under identical degrees of strain biaxiality and initial sheet thickness. A study of the various parameters present in each method which may influence the strain localisation process indicates that the overall strain gradient across the bulged testpiece is responsible for the higher strain limits.
I n t r o d u c t i o n
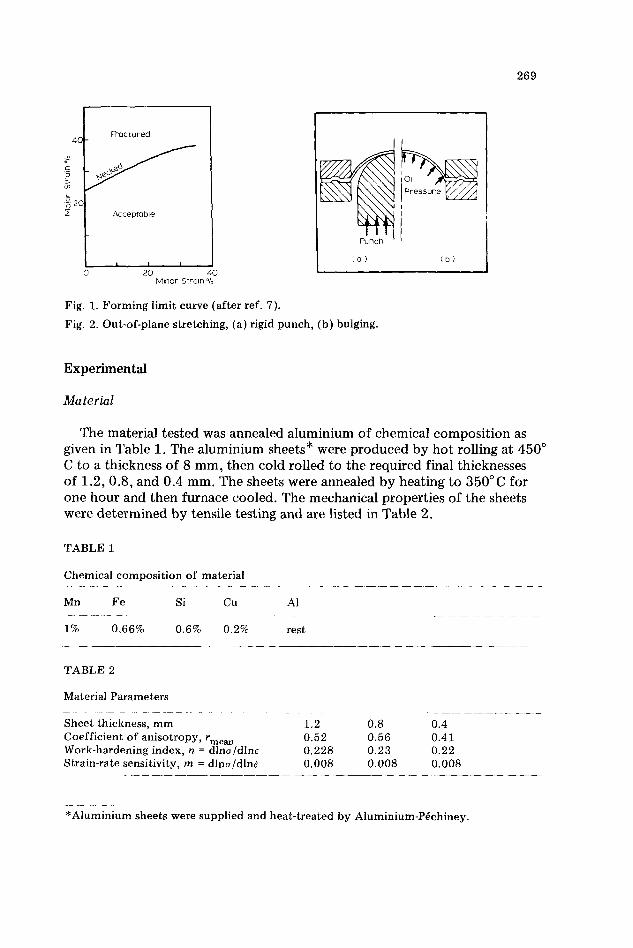
T h e c o n c e p t o f t h e f o r m i n g l i m i t curve , Fig. 1, was f i rs t i n t r o d u c e d in 1 9 6 3 o n a n e m p i r i c a l basis b y Kee l e r a n d B a c k o f e n [1] a n d f u r t h e r d e v e l o p e d b y Kee le r [2] a n d G o o d w i n [ 3 ] . S ince t h e n , m u c h resea rch has b e e n ca r r i ed
0378-3804/82/0000--0000/$02.75 © 1982 Elsevier Scientific Publishing Company
268
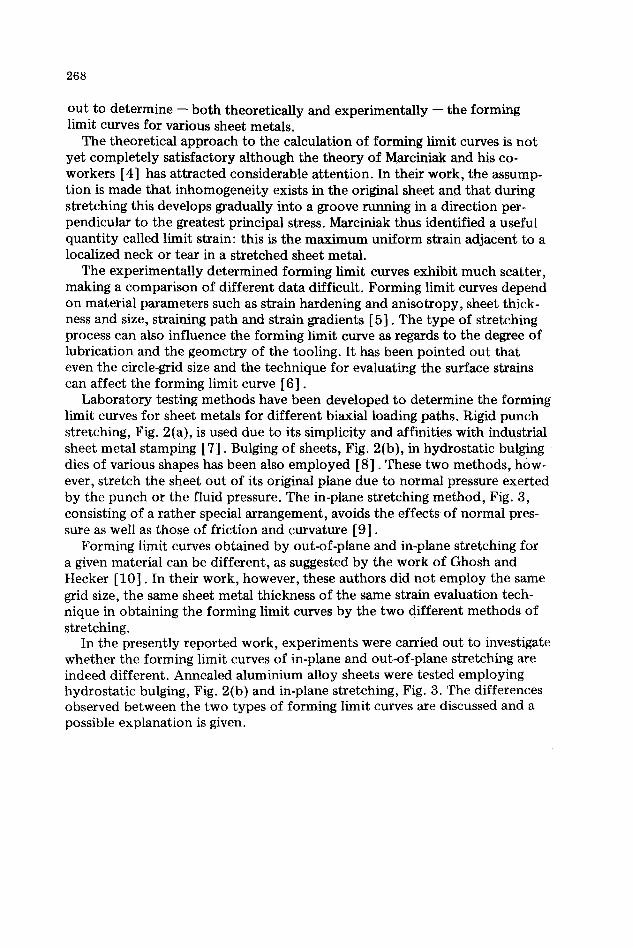
ou t to determine -- bo th theoretically and experimentally -- the forming limit curves for various sheet metals.
The theoretical approach to the calculation of forming limit curves is not yet completely satisfactory although the theory of Marciniak and his co- workers [4] has at tracted considerable attention. In their work, the assump- t ion is made that inhomogenei ty exists in the original sheet and that during stretching this develops gradually into a groove running in a direction per- pendicular to the greatest principal stress. Marciniak thus identified a useful quant i ty called limit strain: this is the maximum uniform strain adjacent to a localized neck or tear in a stretched sheet metal.
The experimentally determined forming limit curves exhibit much scatter, making a comparison of different data difficult. Forming limit curves depend on material parameters such as strain hardening and anisotropy, sheet thick- ness and size, straining path and strain gradients [5] . The type of stretching process can also influence the forming limit curve as regards to the degree of lubrication and the geometry of the tooling. It has been pointed out that even the circle-grid size and the technique for evaluating the surface strains can affect the forming limit curve [6] .
Labora tory testing methods have been developed to determine the forming limit curves for sheet metals for different biaxial loading paths. Rigid punch stretching, Fig. 2{a), is used due to its simplicity and affinities with industrial sheet metal stamping [ 7] . Bulging of sheets, Fig. 2{b), in hydrostat ic bulging dies of various shapes has been also employed [8] . These two methods, how- ever, stretch the sheet out of its original plane due to normal pressure exerted by the punch or the fluid pressure. The in-plane stretching method, Fig. 3, consisting of a rather special arrangement, avoids the effects of normal pres- sure as well as those of friction and curvature [9] .
Forming limit curves obtained by out-of-plane and in-plane stretching for a given material can be different, as suggested by the work of Ghosh and Hecker [10] . In their work, however, these authors did not employ the same grid size, the same sheet metal thickness of the same strain evaluation tech- nique in obtaining the forming limit curves by the two different methods of stretching.
In the presently reported work, experiments were carried out to investigate whether the forming limit curves of in-plane and out-of-plane stretching are indeed different. Annealed aluminium alloy sheets were tested employing hydrostat ic bulging, Fig. 2(b) and in-plane stretching, Fig. 3. The differences observed between the two types of forming limit curves are discussed and a possible explanation is given.
269
4C
c
°2C
Fractured
Acceptable
I. I I 20 40
Minor Strain %
Punch
(a ) (p)
Fig. 1. Forming l imit curve (after ref. 7).
Fig. 2. Out-of-plane stretching, (a) rigid punch, (b) bulging.
Experimental
Material
The material tested was annealed aluminium of chemical composition as given in Table 1. The aluminium sheets* were produced by hot rolling at 450 ° C to a thickness of 8 mm, then cold rolled to the required final thicknesses of 1.2, 0.8, and 0.4 mm. The sheets were annealed by heating to 350°C for one hour and then furnace cooled. The mechanical properties of the sheets were determined by tensile testing and are listed in Table 2.
TABLE I
Chemical c o m p o s i t i o n o f material
Mn Fe Si Cu A1
1% 0.66% 0.6% 0.2% rest
TABLE 2
Material Parameters
Shee t thickness , m m 1.2 0.8 0.4 Coeff ic ient o f anisotropy, rraea.n 0.52 0.56 0.41 Work-hardening index, n = d lna/d lnc 0.228 0.23 0.22 Strain-rate sensitivity, m = dlno/dln~ 0.008 0.008 0.008
*Alumin ium sheets were suppl ied and heat- treated by Aluminium-P~chiney.
270
Test-piece Preparation and Tooling Test-pieces for out-of-plane stretching -- i.e. hydrostat ic bulging -- were
cut f rom the original annealed aluminium sheets to the required dimensions and needed no further preparation. Only sheets of thickness 0.4 mm and 0.8 mm were bulged by oil pressure, employing die apertures of circular and elliptic forms, as described in Table 3.
Test-piece preparation for in-plane stretching involved metal removal across the thickness by the electrical spark erosion process using graphite tooling. The tool cutting face was shaped to produce areas -- "patches" -- of different geometries of reduced thickness at the centre of the test-piece. Patch thicknesses of 0.40 + 0.01 mm and 0.8 + 0.02 mm were produced in sheets of 0.8 and 1.2 mm original thickness, respectively. The different patch geometries as given in Table 4 were determined so as to give different strain- ing ratios upon stretching [9] . All patch corners -- bo th in the plane of the sheet and across its thickness -- were generously radiused. Before testing, the patches were hand-polished using different grades of abrasive paper, thus removing the hard surface layer resulting from the machining operation.
TABLE 3
Dimensions of Bulging dies
Die shape major × minor axis (ram) major axis/minor axis
Cireutar 300 X 300 1.0 Circular 150 x 150 1.0 Circular 80 × 80 1.0 Elliptical 150 × 130 1.15 Elliptical 150 x 100 1.5 Elliptical 150 x 75 2.0
TABLE 4
Patch shapes and dimensions
Patch shape Circular Elongated Elongated Elongated
L, (mm) 15 20 25 35 W, (mm) 15 15 15 15 L/W 1.0 1.33 1.67 2.33
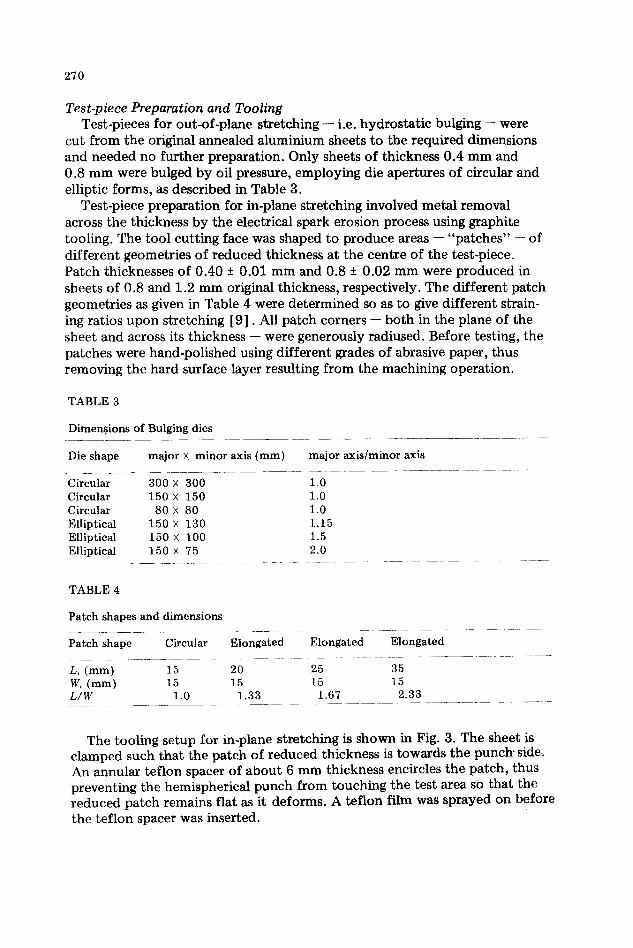
The tooling setup for in-plane stretching is shown in Fig. 3. The sheet is clamped such that the patch of reduced thickness is towards the punch side. An annular tef lon spacer of about 6 mm thickness encircles the patch, thus preventing the hemispherical punch from touching the test area so that the reduced patch remains flat as it deforms. A teflon film was sprayed on before the tef lon spacer was inserted.
271
P a t c h o f
m e t a l
Fig, 3. Tooling for in-plane stretching.
All test-pieces were tested such that the major axis of the bulging die or the elongated patch lay along the rolling direction of the original sheet.
Photo-Gridding and Strain Measurement Surfaces of test-pieces were gridded photographically for strain measure-
ment using the photo-sensitive-resist method. Grids of this type can be applied with great precision and do not affect the deformation. The grid pattern con- sisted of an array of non-touching circles, each of 1.06 mm diameter. For the in-plane stretching test-pieces the grid was printed on the unmachined surface. Since fracture always occurred along the rolling direction of the sheet, the grid pattern was arranged so that surface strains could be measured along the rolling and transverse directions.
All bulging and in-plane stretching experiments were conducted such that tearing of the sheet occurred at a low strain-rate (tests were completed in about 4 minutes: hence at an average strain-rate of 0.05--0.1 min 1). Surface strains were calculated from measurements of distorted grids using a travelling microscope with a built-in vernier having an accuracy of -+0.01 mm and a magnification of 25 X.
Experimental determination of forming limit curves There are several techniques that can be used to determine the limit strains
which define the forming limit curves [11--13] . Heeker [7] proposed a simple method which consists of measuring three types of deformed grid circles (ellipses) both close to and within necked or fractured areas of the sheet. These three types of ellipses can be classified as: type 1, fractured (the fracture passes through the ellipse); type 2, necked or fracture-affected (the ellipse lies either within a necked area or within the fracture-affected zone identifiable by heavy surface granulation); type 3, acceptable (the el- lipse falls outside the area affected by necking or fracture). The forming limit curve is thus constructed to fall above points representing strain measure-
272
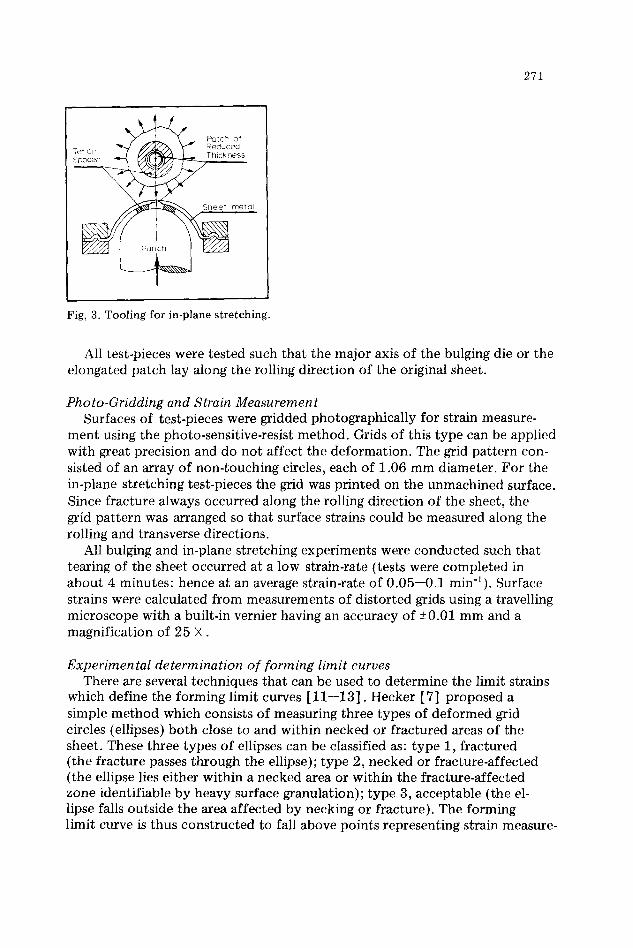
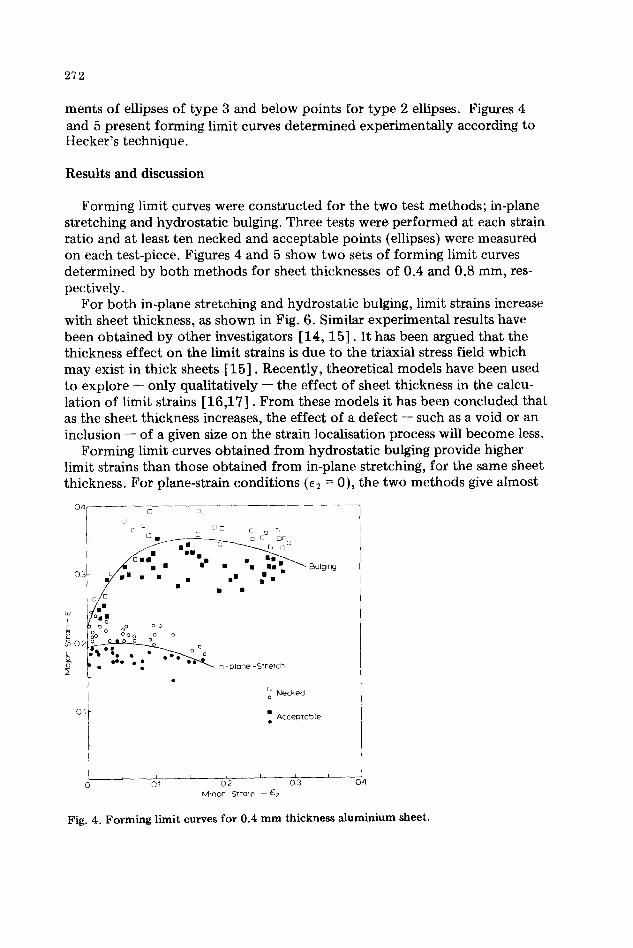
ments of ellipses of type 3 and below points for type 2 ellipses. Figures 4 and 5 present forming limit curves determined experimentally according to Hecker 's technique.
Results and discussion
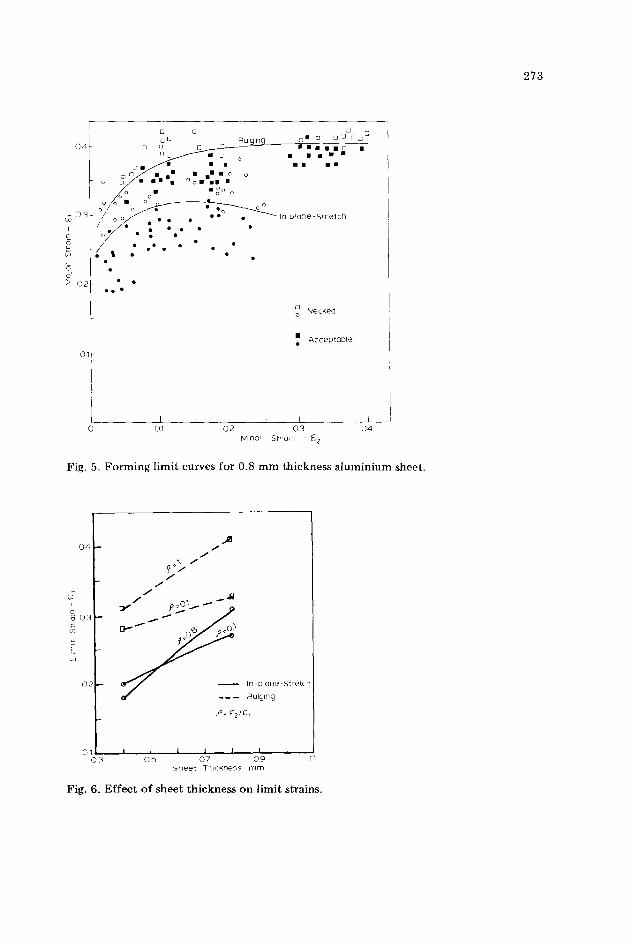
Forming limit curves were constructed for the two test methods; in-plane stretching and hydrostat ic bulging. Three tests were performed at each strain ratio and at least ten necked and acceptable points (ellipses) were measured on each test-piece. Figures 4 and 5 show two sets of forming limit curves determined by bo th methods for sheet thicknesses of 0.4 and 0.8 mm, res- pectively.
For both in-plane stretching and hydrostat ic bulging, limit strains increase with sheet thickness, as shown in Fig. 6. Similar experimental results have been obtained by other investigators [14, 15] . It has been argued that the thickness effect on the limit strains is due to the triaxial stress field which may exist in thick sheets [15 ]. Recently, theoretical models have been used to explore -- only qualitatively -- the effect of sheet thickness in the calcu- lation of limit strains [16 ,17] . From these models it has been concluded that as the sheet thickness increases, the effect of a defect -- such as a void or an inclusion -- of a given size on the strain localisation process will become less.
Forming limit curves obtained from hydrostat ic bulging provide higher limit strains than those obtained from in-plane stretching, for the same sheet thickness. For plane-strain condit ions (e2 = 0), the two methods give almost
O4I 0 O DD
Om o OOOOO ~
O ~ • • •
mm o- • • o , ,
7 I n - p l a n e -St
°4[ : Acceo,oO,o
o o'i o'2 0'5 o~ Mino r St ra in -- E2
Fig. 4. Forming limit curves for 0.4 mm thickness aluminium sheet.
273
04
~ O E
i c 2
• 02
0 1
c o J -"
I IiO • o o 0
n° • ] o • • • • •
~ I • • • i I i I OL] • i I I i I • o o _q • I I • ° o I i I • ° o ° • Go°° o
, o ~ O
W ' . : " ," " "
• e o • • • •
o e ° o •
o Necked o
Acceptoble
I i L ~ I I I
01 02 03 04 Minor S t ra in - ~2
Fig. 5. Forming l imit curves for 0.8 m m thickness a luminium sheet.
04
i
~o3
E
O~
f ',, f
J f
f
~ O~O ~ £ ~ 0 "~
~ L In plape-Stretd Bulging
P = C 2 / E ~
01 I I I I I I I 03 05 07 09 11
Sheet Thickness tom
Fig. 6. Effect o f sheet thickness on l imit strains.
274
the same value of limit strain, which value is nearly equal to the strain-harden- ing exponent , n, of the material: this is more-or-less supported by Hill's theory of localised necking [18] . The predictions of a plane-strain limit approximate- ly equal to n is also obtained from the Marciniak analysis, by either assuming a very small initial thickness inhomogenei ty [9] or considering a small posi- tive strain-rate sensitivity with a larger thickness inhomogenei ty [19] .
Differences between the limit strains of the two test methods are observed as the degree of deformat ion biaxiality increases; the limit strain being higher for hydrostat ic bulging. This trend has been observed by Ghosh [10] in test- ing steel, brass and cold-rolled aluminium by the in-plane stretching method and by hemispherical rigid-punch stretching. Ghosh at tr ibuted the higher limit strains in rigid-punch stretching to a slower strain localisation process which may result from the sheet being in contact with the punch at all times. Such geometrical constraints does not exist in hydrostat ic bulging and in in-plane stretching. In both processes there is no metal-to-metal contact , thus excluding any effect of friction on the limit strain.
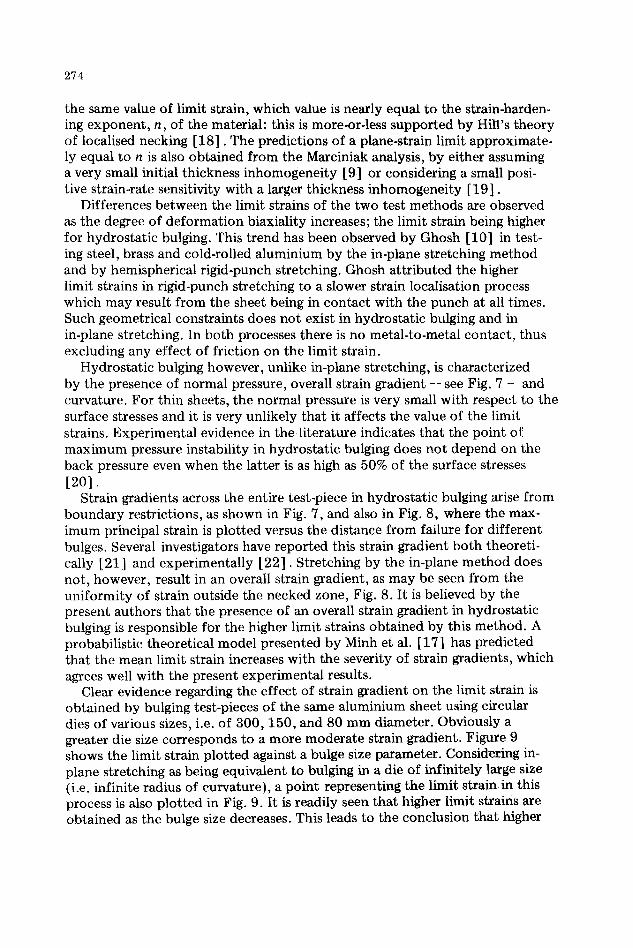
Hydrostat ic bulging however, unlike in-plane stretching, is characterized by the presence of normal pressure, overall strain gradient -- see Fig. 7 -- and curvature. For thin sheets, the normal pressure is very small with respect to the surface stresses and it is very unlikely that it affects the value of the limit strains. Experimental evidence in the literature indicates that the point of maximum pressure instability in hydrostat ic bulging does not depend on the back pressure even when the latter is as high as 50% of the surface stresses [20 l .
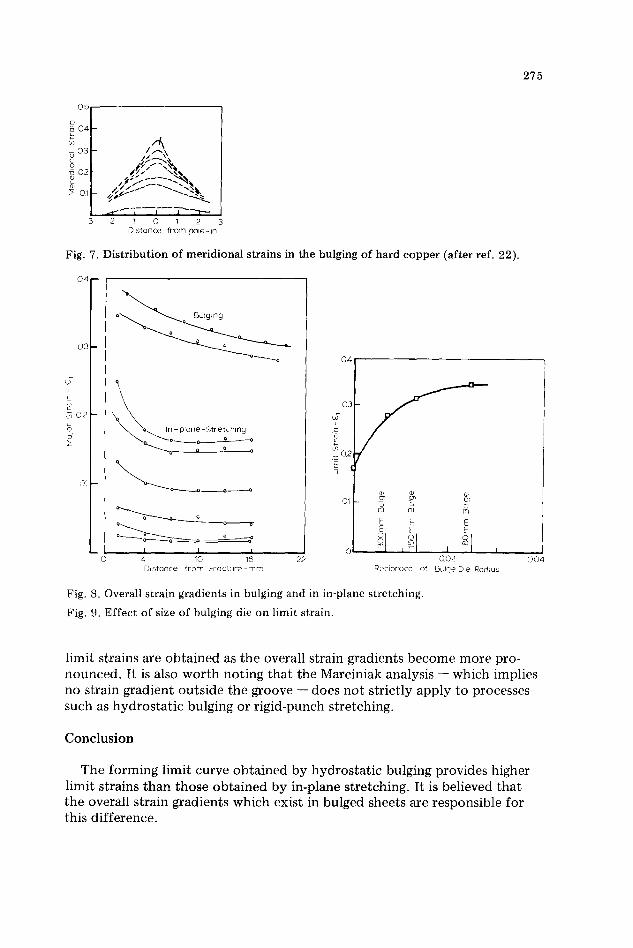
Strain gradients across the entire test-piece in hydrostat ic bulging arise from boundary restrictions, as shown in Fig. 7, and also in Fig. 8, where the max- imum principal strain is plot ted versus the distance from failure for different bulges. Several investigators have reported this strain gradient both theoreti- cally [21] and experimentally [22] . Stretching by the in-plane method does not, however, result in an overall strain gradient, as may be seen from the uniformity of strain outside the necked zone, Fig. 8. It is believed by the present authors that the presence of an overall strain gradient in hydrostat ic bulging is responsible for the higher limit strains obtained by this method. A probabilistic theoretical model presented by Minh et al. [17] has predicted that the mean limit strain increases with the severity of strain gradients, which agrees well with the present experimental results.
Clear evidence regarding the effect of strain gradient on the limit strain is obtained by bulging test-pieces of the same aluminium sheet using circular dies of various sizes, i.e. of 3 0 0 , 1 5 0 , and 80 mm diameter. Obviously a greater die size corresponds to a more moderate strain gradient. Figure 9 shows the limit strain plot ted against a bulge size parameter. Considering in- plane stretching as being equivalent to bulging in a die of infinitely large size {i.e. infinite radius of curvature), a point representing the limit strain in this process is also plot ted in Fig. 9. It is readily seen that higher limit strains are obtained as the bulge size decreases. This leads to the conclusion that higher
0 5
c. 04
ch ~ 0 3
02
:> 01
,.,.,,r " ~ i I I ~ - '1 " - - 2 1 0 1 2 3
Distance fr'0m pole- in
Fig. 7. Distribution of meridional strains in the bulging of hard copper (after ref. 22).
o4- I
0 3 -
0 1 - - f
I
- - l , 0
LO~
~ 0 2
I | ! 4 10 16 Distance f rom Frocture -mm
3~
03
D2
t
01
275
b b b 8 2~ E E E E E
1 I I 0 0 2
Reciprocal of Bulge Die Radius 22 0 0 4
Fig. 8. Overall strain gradients in bulging and in in-plane stretching.
Fig. 9. Effect of size of bulging die on limit strain.
l imit strains are o b t a i n e d as the overall strain gradients b e c o m e m o r e pro- n o u n c e d . It is also w o r t h no t ing that the Marciniak analysis - - w h i c h impl ies no strain gradient ou t s ide the groove - - d o e s n o t strict ly apply to processes such as h y d r o s t a t i c bulging or r ig id-punch stretching.
C o n c l u s i o n
The f o r m i n g l imit curve o b t a i n e d by hydros ta t i c bulging provides higher l imit strains than t h o s e o b t a i n e d by in-plane stretching. It is be l ieved that the overall strain gradients w h i c h exist in bulged sheets are respons ib le for this d i f ference .
276
Acknowledgement
A.R. Ragab wishes to thank the French Ministry of Universities for ap- pointing him in 1978 as visiting associate professor at the "Universit~ de Metz" where the present work was partly carried out.
References
1 S. Keeler and W. Backofen, Trans. Am. Soc. Met., 56(1963) 25. 2 S. Keeler, Sheet Met. Ind., 42 (1965) 683. 3 G.M. Goodwin, Society of Automot ive Engineers, paper 680093 (1968). 4 Z. Marciniak and K. Kuczynski, Int. J. Mech. Sci., 9 (1967) 609.
5 S. Keeler, Sagamore Conference, Raquet te Lake, N.Y. (1974). 6 E.J. Drewes, H. Henning, R. Pape and W. Wrede, IDDRG, Document DDR/WGI/21B/72. 7 S. Hecker, Sheet Met. Ind., 52 {1975) 671. 8 H. Van Minh, R. Sowerby and J.L. Duncan, Int. J. Mech. Sci., 16 (1974) 31. 9 M. Azrin and W.A. Backofen, MetaU. Trans., 1 (1970) 285.
10 A.K. Ghosh and S. Hecker, Metall. Trans., 5 (1974) 2161. 11 C. Veerman and P.F. Neve, Sheet Met. Ind., 49 (1972) 421. 12 A. Bragard, J.C0 Baret and H. Bonnarens, IDDRG, Document DDR/WGI/21 P/72. 13 T. Kobayashi, K. Murata and H. Ishigaki, J. Japan Soc. Technol. Plasticity, 10 (1969)
793. 14 M.J. Painter and R. Pearce, IDDRG meeting, Diisseldorf, W. Germany (1975). 15 A. Haberfield and M. Boyles, Sheet Met. Ind., 22 (1973) 400. 16 J.M. Jalinier and B. Baudelet, Proc. IDDRG Meeting, Warwick, England (1978), Port-
cullis Press, Redhill, Surrey (19¥8) p. 133. 17 H. Van Minh, R. Sowerby and J.L. Duncan, Int. J. Mech. Sci., 17 (1975) 339. 18 R. Hill, J. Mech. Phys. Solids, 1 (1952) 19. 19 Z. Marciniak, Aspects of Material Formabi l i ty , McMaster Univ., Hamilton, Ont., Canada
(1974). 20 G. Kular and R. Sowerby, Int. J. Mech. Sci., 15 (1973) 349. 21 N. Wang and M. Shammamy, J. Mech. Phys. Solids, 17 (1969) 43. 22 W. Brown and G. Sachs, Trans ASME, 70 {1948) 241.