Embed Size (px)
Citation preview

1
2
Forward looking statements
This presentation contains forward-looking statements. Forward-looking statements often include words such as “anticipate", "expect", "intend", "plan", "believe“ , “continue” or similar words in connection with discussions of future operating or financial performance.
The forward-looking statements are based on management's and directors’ current expectations and assumptions regarding Air New Zealand’s businesses and performance, the economy and other future conditions, circumstances and results. As with any projection or forecast, forward-looking statements are inherently susceptible to uncertainty and changes in circumstances. Air New Zealand’s actual results may vary materially from those expressed or implied in its forward-looking statements.
The Company, its directors, employees and/or shareholders shall have no liability whatsoever to any person for any loss arising from this presentation or any information supplied in connection with it. The Company is under no obligation to update this presentation or the information contained in it after it has been released.
Nothing in this presentation constitutes financial, legal, tax or other advice.
3
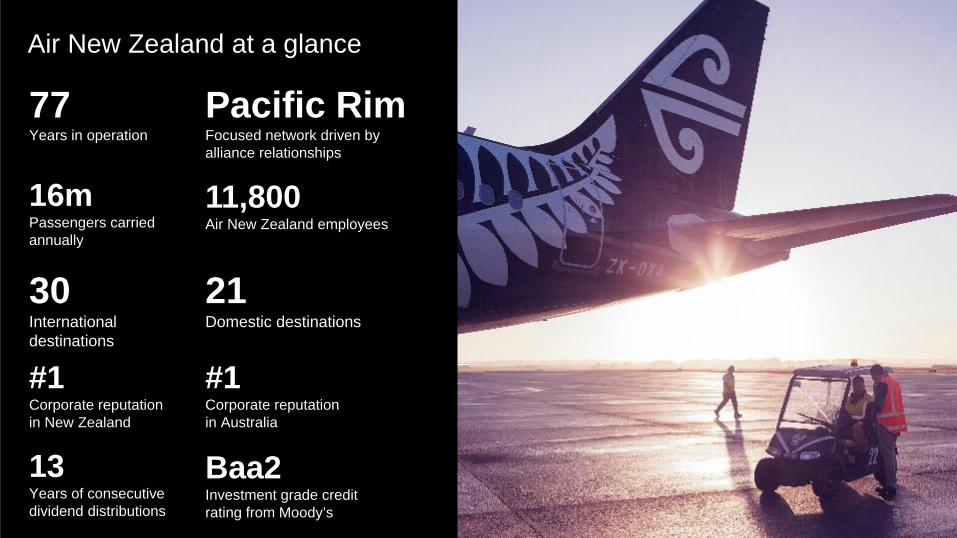
77 Years in operation
Pacific RimFocused network driven by alliance relationships
30International destinations
21Domestic destinations
16m Passengers carried annually
11,800 Air New Zealand employees
#1Corporate reputation in New Zealand
#1Corporate reputation in Australia
Baa2Investment grade credit rating from Moody’s
13Years of consecutive dividend distributions
Air New Zealand at a glance
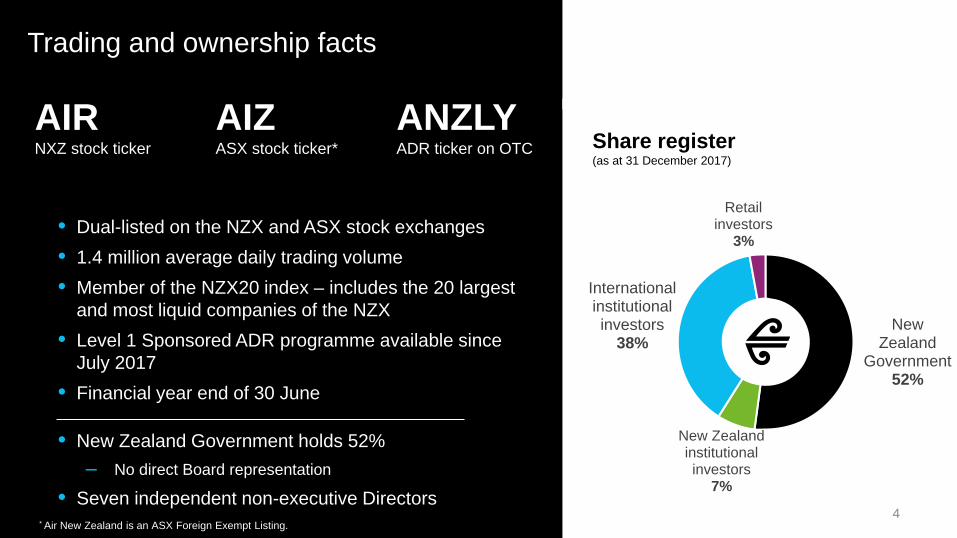
New Zealand
Government52%
New Zealand institutional investors
7%
International institutional investors
38%
Retail investors
3%
Trading and ownership facts
• Dual-listed on the NZX and ASX stock exchanges• 1.4 million average daily trading volume• Member of the NZX20 index – includes the 20 largest
and most liquid companies of the NZX• Level 1 Sponsored ADR programme available since
July 2017• Financial year end of 30 June
• New Zealand Government holds 52%– No direct Board representation
• Seven independent non-executive Directors
Share register(as at 31 December 2017)
AIRNXZ stock ticker
AIZASX stock ticker*
ANZLYADR ticker on OTC
4* Air New Zealand is an ASX Foreign Exempt Listing.
5
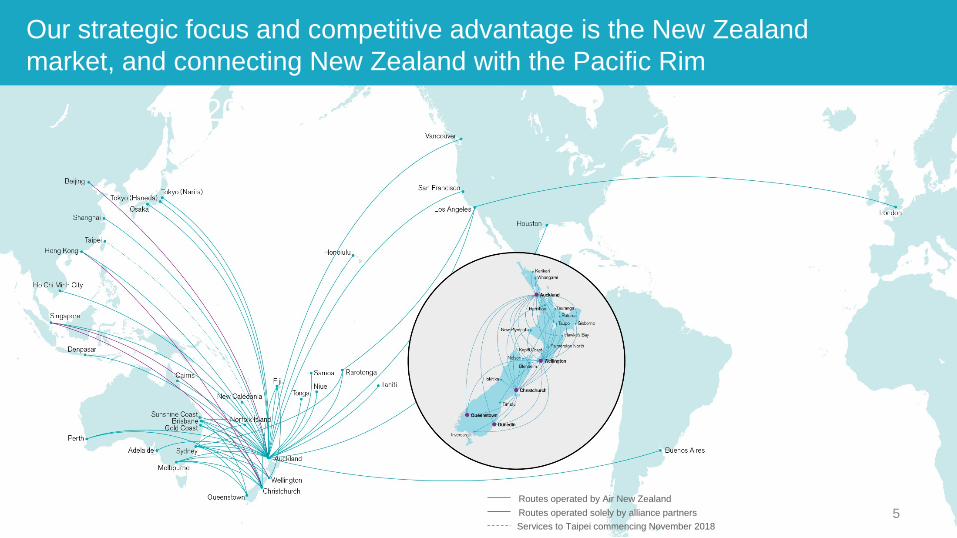
Our strategic focus and competitive advantage is the New Zealand market, and connecting New Zealand with the Pacific Rim
2012 2017
Routes operated solely by alliance partnersServices to Taipei commencing November 2018
Routes operated by Air New Zealand
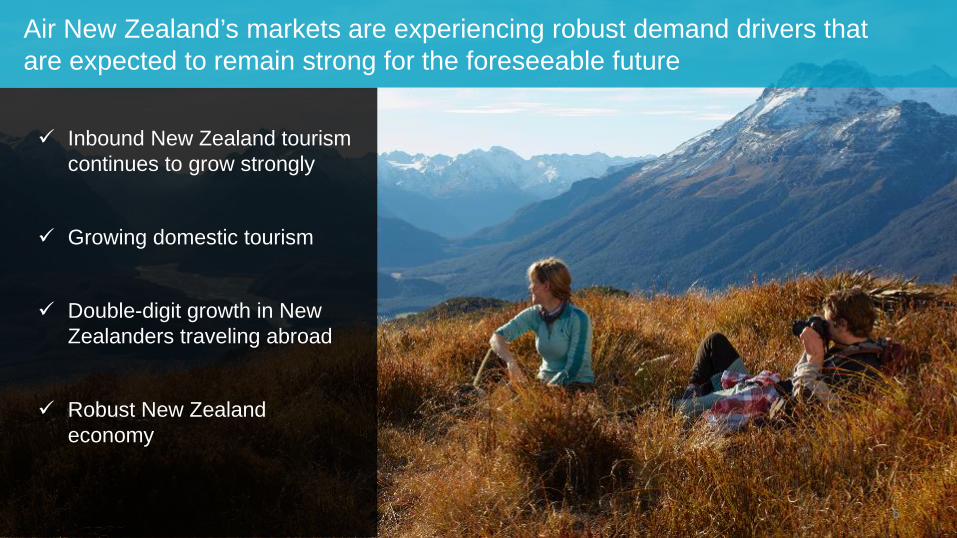
Air New Zealand’s markets are experiencing robust demand drivers that are expected to remain strong for the foreseeable future
Inbound New Zealand tourism continues to grow strongly
Growing domestic tourism
Double-digit growth in New Zealanders traveling abroad
Robust New Zealand economy
6
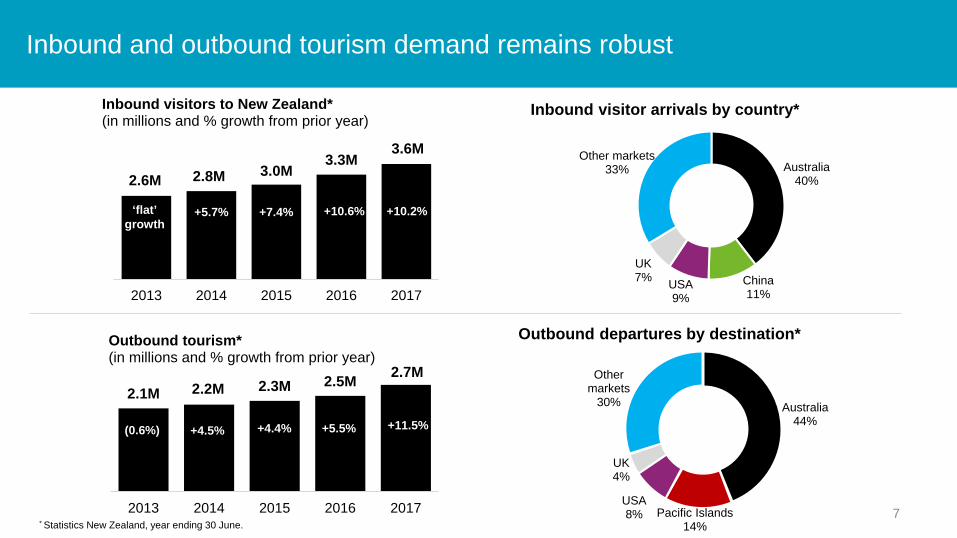
Inbound and outbound tourism demand remains robust
2.6M 2.8M 3.0M3.3M
3.6M
2013 2014 2015 2016 2017
Inbound visitors to New Zealand*(in millions and % growth from prior year)
2.1M 2.2M 2.3M 2.5M 2.7M
2013 2014 2015 2016 2017
Outbound tourism*(in millions and % growth from prior year)
Australia44%
Pacific Islands14%
USA8%
UK4%
Other markets
30%
* Statistics New Zealand, year ending 30 June.
Australia40%
China11%
USA9%
UK7%
Other markets33%
Inbound visitor arrivals by country*
+10.2%+10.6%+7.4%+5.7%‘flat’ growth
+11.5%+5.5%+4.4%+4.5%(0.6%)
Outbound departures by destination*
7
of consecutive profitability*
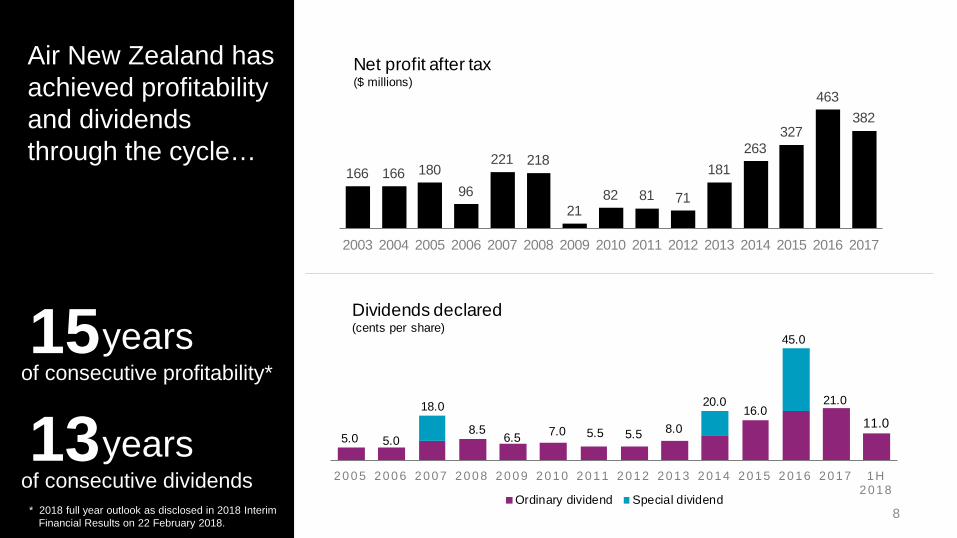
Air New Zealand has achieved profitability and dividends through the cycle…
15years
of consecutive dividends13years
8* 2018 full year outlook as disclosed in 2018 Interim Financial Results on 22 February 2018.
166 166 18096
221 218
2182 81 71
181263
327
463382
2003 2004 2005 2006 2007 2008 2009 2010 2011 2012 2013 2014 2015 2016 2017
Net profit after tax($ millions)
5.0 5.08.5 6.5 7.0 5.5 5.5 8.0
16.021.0
11.018.0 20.0
45.0
2005 2006 2007 2008 2009 2010 2011 2012 2013 2014 2015 2016 2017 1H 2018
Ordinary dividend Special dividend
Dividends declared(cents per share)

89%
468%
116%
1 year 5 year 10 year
Air New Zealand
NZX50
ASX200
Bloomberg WorldAirlines Index
S&P500
* Total shareholder return includes share price changes and dividends received over the period (assuming dividends are reinvested in shares on ex dividend date).
Source: Bloomberg, period ended as at 30 June 2017.
Total shareholder return*
…and have demonstrated our ability to generate strong shareholder returns that exceed the major indices
9
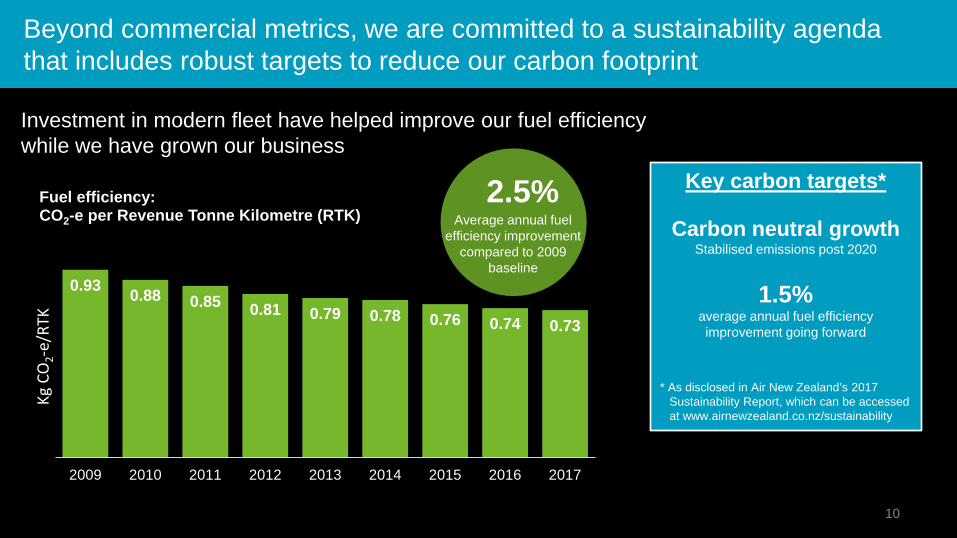
Beyond commercial metrics, we are committed to a sustainability agenda that includes robust targets to reduce our carbon footprint
0.93 0.88 0.85 0.81 0.79 0.78 0.76 0.74 0.73
2009 2010 2011 2012 2013 2014 2015 2016 2017
Kg C
O2-
e/RT
K
Fuel efficiency: CO2-e per Revenue Tonne Kilometre (RTK) Average annual fuel
efficiency improvement compared to 2009
baseline
2.5%
10
Investment in modern fleet have helped improve our fuel efficiency while we have grown our business
Key carbon targets*
Carbon neutral growthStabilised emissions post 2020
1.5%average annual fuel efficiency improvement going forward
* As disclosed in Air New Zealand’s 2017 Sustainability Report, which can be accessed at www.airnewzealand.co.nz/sustainability
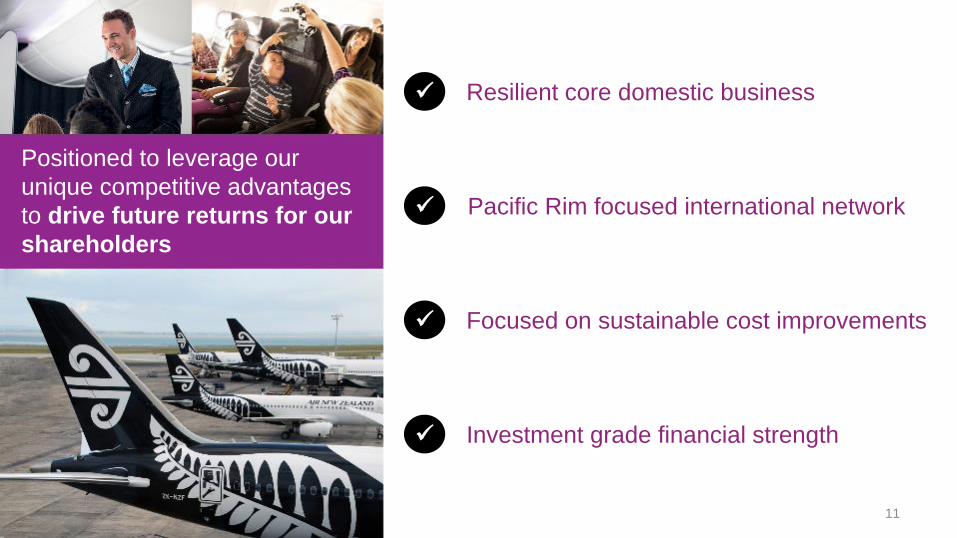
Resilient core domestic business
Pacific Rim focused international network
Focused on sustainable cost improvements
Investment grade financial strength
Positioned to leverage our unique competitive advantages to drive future returns for our shareholders
11
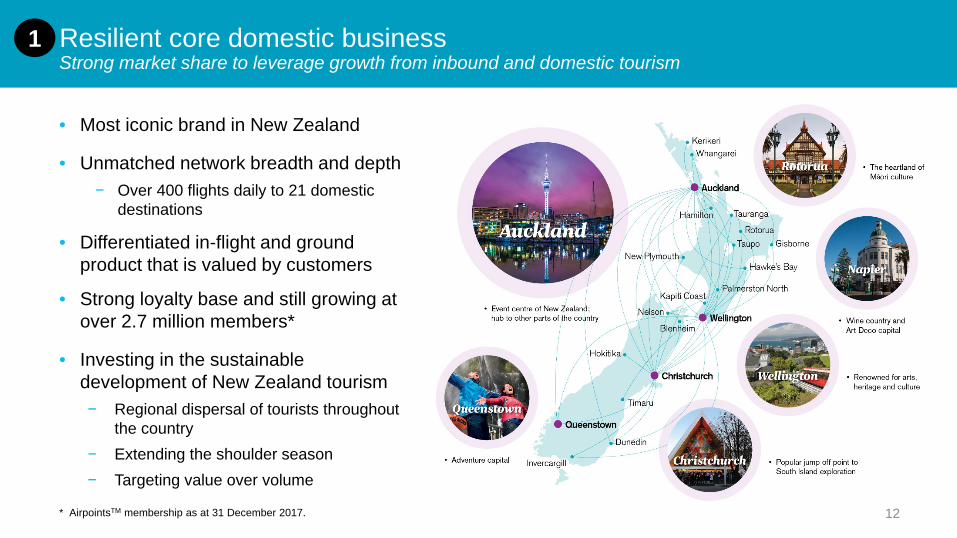
• Most iconic brand in New Zealand
• Unmatched network breadth and depth− Over 400 flights daily to 21 domestic
destinations
• Differentiated in-flight and ground product that is valued by customers
• Strong loyalty base and still growing at over 2.7 million members*
• Investing in the sustainable development of New Zealand tourism− Regional dispersal of tourists throughout
the country− Extending the shoulder season− Targeting value over volume
* AirpointsTM membership as at 31 December 2017.
Strong market share to leverage growth from inbound and domestic tourism1 Resilient core domestic business
12
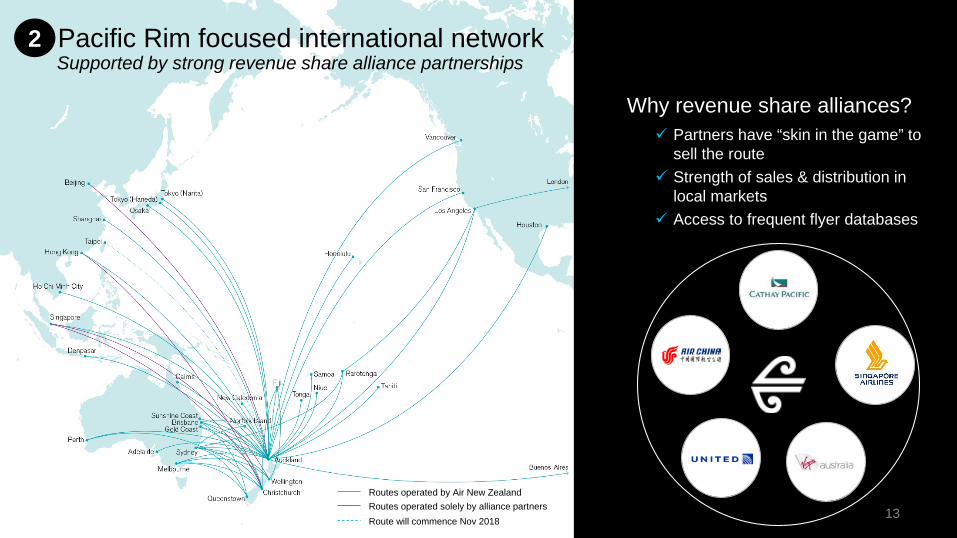
Supported by strong revenue share alliance partnerships
Why revenue share alliances? Partners have “skin in the game” to
sell the route Strength of sales & distribution in
local markets Access to frequent flyer databases
Routes operated solely by alliance partnersRoutes operated by Air New Zealand
Pacific Rim focused international network2
13Route will commence Nov 2018
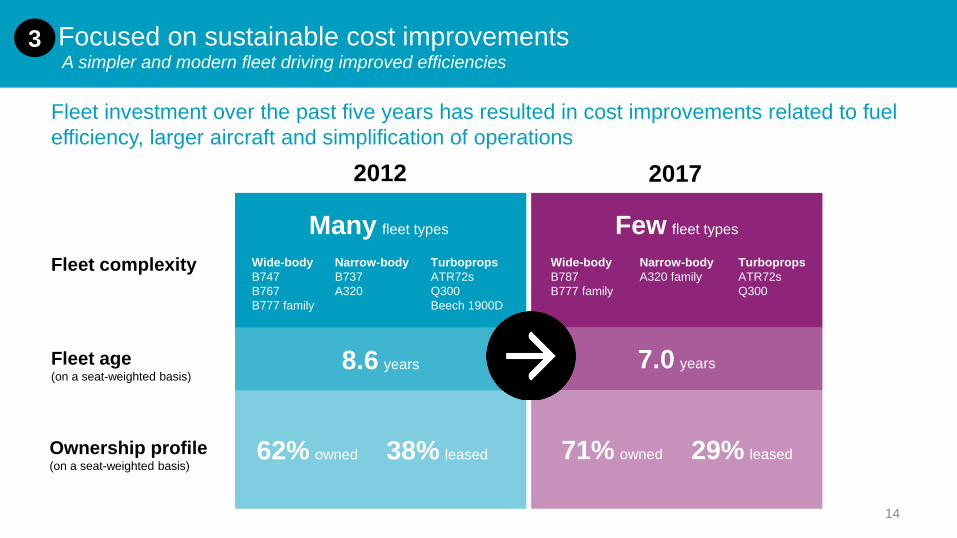
A simpler and modern fleet driving improved efficienciesFocused on sustainable cost improvements3
14
Fleet investment over the past five years has resulted in cost improvements related to fuel efficiency, larger aircraft and simplification of operations
2012 2017
Fleet complexity
Fleet age(on a seat-weighted basis)
Ownership profile(on a seat-weighted basis)
Wide-bodyB747B767B777 family
Narrow-bodyB737A320
TurbopropsATR72sQ300Beech 1900D
Many fleet types Few fleet types
Wide-bodyB787B777 family
Narrow-bodyA320 family
TurbopropsATR72sQ300
8.6 years 7.0 years
38% leased62% owned 29% leased71% owned
0
200
400
600
800
1,000
2015 2016 2017 2018 2019 2020 2021
$ m
illio
ns
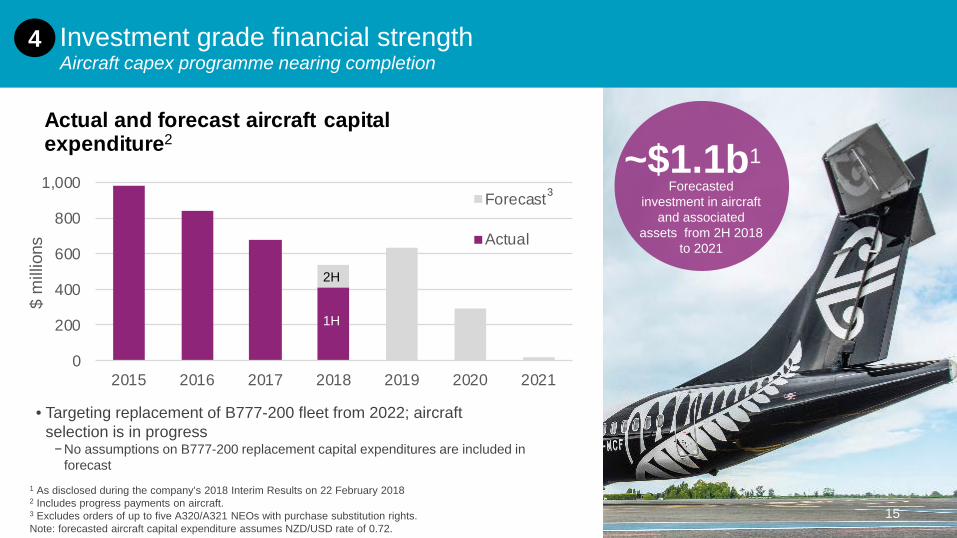
Actual and forecast aircraft capital expenditure2
Forecast
Actual
1 As disclosed during the company’s 2018 Interim Results on 22 February 20182 Includes progress payments on aircraft.3 Excludes orders of up to five A320/A321 NEOs with purchase substitution rights.Note: forecasted aircraft capital expenditure assumes NZD/USD rate of 0.72.
Forecasted investment in aircraft
and associated assets from 2H 2018
to 2021
~$1.1b1
Aircraft capex programme nearing completionInvestment grade financial strength4
15
1H
2H
3
• Targeting replacement of B777-200 fleet from 2022; aircraft selection is in progress−No assumptions on B777-200 replacement capital expenditures are included in
forecast
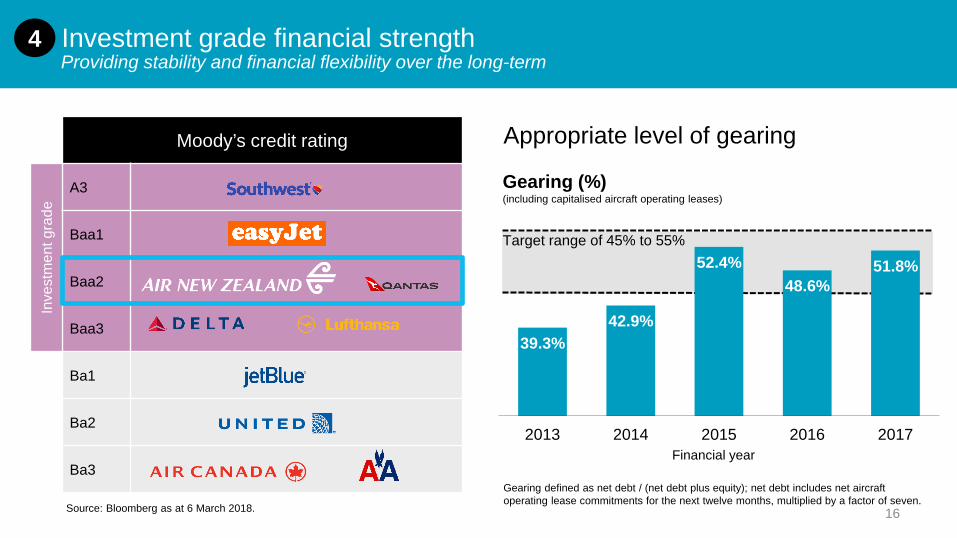
Appropriate level of gearing
Gearing defined as net debt / (net debt plus equity); net debt includes net aircraft operating lease commitments for the next twelve months, multiplied by a factor of seven.
Target range of 45% to 55%
Providing stability and financial flexibility over the long-termInvestment grade financial strength
Moody’s credit rating
Inve
stm
ent g
rade
A3
Baa1
Baa2
Baa3
Ba1
Ba2
Ba3
Source: Bloomberg as at 6 March 2018.
4
16
39.3%42.9%
52.4%48.6%
51.8%
2013 2014 2015 2016 2017Financial year
Gearing (%)(including capitalised aircraft operating leases)

5.0 5.0
8.0 8.56.5 7.0
5.5 5.5
8.010.0
16.0
20.021.0
Ordinary dividends paid(cents per share)
• We target consistently distributing dividends to our shareholders each period
• Dividend is not linked to a pay-out ratio
• Looking beyond short-term peaks and troughs in the earnings profile when determining dividend
A sustainable business positioned to deliver strong dividends for our shareholders
17
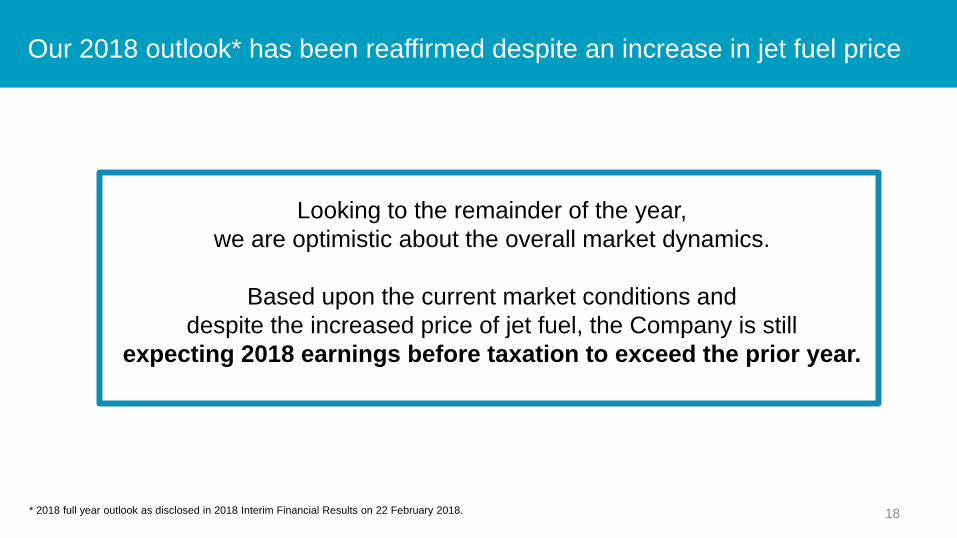
Looking to the remainder of the year, we are optimistic about the overall market dynamics.
Based upon the current market conditions and despite the increased price of jet fuel, the Company is still
expecting 2018 earnings before taxation to exceed the prior year.
Our 2018 outlook* has been reaffirmed despite an increase in jet fuel price
18* 2018 full year outlook as disclosed in 2018 Interim Financial Results on 22 February 2018.
19
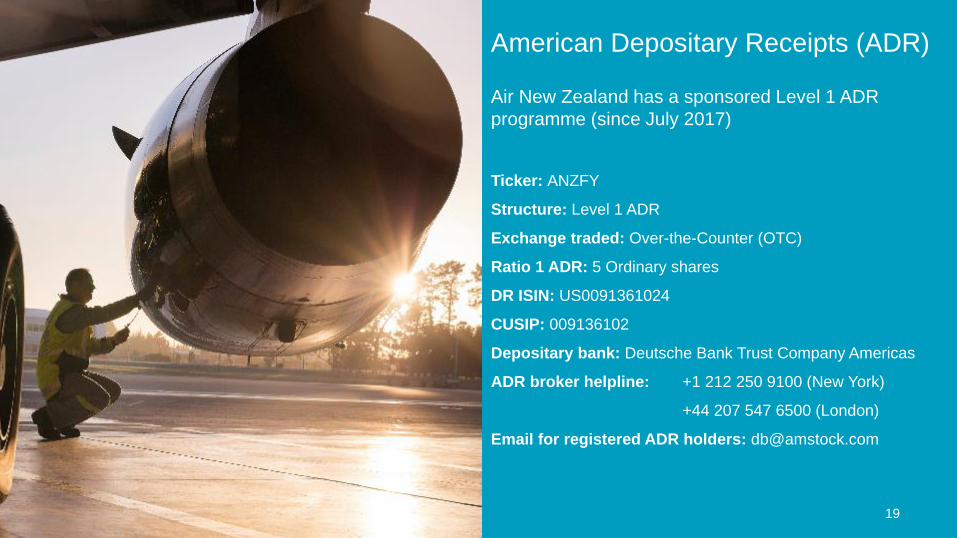
Air New Zealand American Depositary Receipts (ADR)
Ticker: ANZFY
Structure: Level 1 ADR
Exchange traded: Over-the-Counter (OTC)
Ratio 1 ADR: 5 Ordinary shares
DR ISIN: US0091361024
CUSIP: 009136102
Depositary bank: Deutsche Bank Trust Company Americas
ADR broker helpline: +1 212 250 9100 (New York)
+44 207 547 6500 (London)
Email for registered ADR holders: [email protected]
Air New Zealand has a sponsored Level 1 ADR programme (since July 2017)
20
Resources
Contact information
Email: [email protected]
Share registrar: [email protected]
Investor website: www.airnewzealand.co.nz/investor-centre
Monthly traffic updates: www.airnewzealand.co.nz/monthly-operating-data
Quarterly fuel hedging disclosure: www.airnewzealand.co.nz/fuel-hedging-announcements
Corporate governance: www.airnewzealand.co.nz/corporate-governance
Sustainability: https://www.airnewzealand.co.nz/sustainability
Investor relations information20


22