Embed Size (px)
Citation preview
AN EVALUATION OF FOULING POTENTIAL AND METHODS TO CONTROL FOULING IN MICROFILTRATION MEMBRANES FOR SECONDARY
WASTEWATER EFFLUENT
Shannon R. Holman, PE* and Kurt N. Ohlinger, PE, PhD** *URS Corporation
615 Piikoi Street, Honolulu, HI **Office of Water Programs, Sacramento State University, CA
ABSTRACT
The use of reclaimed water has become an option to reduce the demand for potable water. In the past, membrane technology has not always been economically feasible for this application due to high energy requirements needed to maintain membrane performance (i.e. flux). An increase in energy requirements and a reduction in throughput are a direct result of membrane fouling because the pressure requirements increase as particulate matter accumulates on the membrane surface. Membrane fouling is dependent on the type of constituents found in the feedstream, therefore there are different methods to reverse these types of fouling. To evaluate and study fouling potential and methods for limiting/reversing membrane fouling for the production of reclaimed water, three plant-scale experiments were conducted at a California wastewater treatment plant using secondary effluent from a high-purity oxygen, activated sludge/secondary clarifier process. The results of the experiments help establish the best methods for limiting/reversing fouling based on operating parameters (i.e. flux), production methods, and membrane configuration.
The first experiment series was used to evaluate the impacts of flux on fouling and determined the effectiveness of backwashing and chemical maintenance washes on a membrane operating under a cross-flow configuration with 10% re-circulation. To determine the best method to limit/reverse fouling on two different membrane process/operating configurations, a second experiment was conducted that evaluated the average permeability decrease between backwashes and maintenance washes. Selected maintenance wash processes were conducted in a third experiment to determine which method was the most effective in permeability recovery (e.g. reducing irreversible fouling).
KEYWORDS
Membranes, fouling, permeability recovery, irreversible fouling, and chemical cleaning
INTRODUCTION
The purpose of this study is to demonstrate the various mechanisms used to control fouling for microfiltation (MF) membrane systems and to determine the most effective method for reducing fouling potential based on given feedwater characteristics. Methods investigated include chemical cleaning, hydraulic cleaning, and pretreatment (includes the addition of chemicals to feedwater). In addition, the impact of membrane flux rate on fouling is also evaluated to determine the effectiveness of the investigated fouling control mechanisms.
6417
WEFTEC®.07
Copyright 2007 Water Environment Federation. All Rights Reserved©
The specific objectives of this study are as follows:
• Determine the impact on fouling when the flux increases and evaluate the effectiveness of the fouling control mechanisms
• Compare and determine the most effective method to control fouling during the membrane production period.
• Compare two backwashing regimes and determine which method is the most effective in controlling fouling.
• Compare two maintenance wash regimes and determine which method is the most effective in controlling fouling.
Although high costs of low-pressure membranes have limited the number of applications in the past, in recent years microfiltration (MF) membranes have been more widely used in municipal wastewater treatment and reuse and drinking water production. Within the next 15 years, membranes may eventually replace the use of conventional treatment, such as pulse bed filters and secondary clarifiers, due to the need to remove resistant organic constituents and the increasing interest in reuse for industrial process water, groundwater recharge, and irrigation (Freeman and Morin, 1995). In addition, membrane technology has increased due to more stringent regulatory requirements and the development of new membranes with lower costs (Tchobanoglous et al 2003).
Fouling of Membranes
Membrane fouling describes the deposition and accumulation of rejected contaminants from the feed stream on the membrane. The severity of membrane fouling is determined by the combined effect of various physical, chemical, and biological operating factors and can be impacted by the operating flux. In addition, “Materials accumulated on a membrane surface, which cannot be removed by cross-flow, backflushing, or backpulsing, can lead to irreversible adhesion, resulting in permanent permeability loss or membrane fouling”. (Escobar et al, 2005)
Flux and Transmembrane Pressure
Flux is one of the main parameters determining the economic viability of the membrane process (Vera et al, 2000) and is the single factor that dictates the size of the membrane plant (Liu et al, 2001). Flux is a measure of the rate at which permeate passes through the membrane per unit area. Unit area depends on the membrane configuration. Typically this parameter is reported in units of L/m2/hr (Lmh) or gal/ft2/day (gfd). Flux across the membrane varies as flow varies. Another term often used in membrane performance is permeability. Permeability is a calculated parameter of flux normalized against transmembrane pressure (TMP), and is expressed in units of gfd/psig (Flux/TMP). Trans-membrane pressure (TMP) is a measure of the differential pressure required to push or pull permeate through the membrane. Membrane systems are normally designed to maintain a constant flux, which dictates that TMP will increase over time due to membrane fouling. Therefore, TMP is a good indicator for determining fouling potential of membranes. As TMP increases due to accumulation of particulate matter on the membrane surface, more energy is required to push or pull permeate through the membrane. Because TMP
6418
WEFTEC®.07
Copyright 2007 Water Environment Federation. All Rights Reserved©
is a measurement of pressure and can also establish the backwash cycle frequencies, it can be a good predictor of energy consumption.
TMP and flux are performance parameters that are highly dependent on one another. There are three modes of operation for membranes when looking at TMP and flux. The first mode of operation is to operate at a constant flux and vary the TMP, which requires more pumping capacity to compensate for the increase in TMP as the membrane becomes dirtier. The second mode of operation consists of operating at a constant TMP and a varying flux. The last mode of operation exists when there are no controls resulting in both the TMP and flux varying. Most membrane systems operate in a constant flux mode.
When operating in constant flux mode, which is the case for this project, membrane backwashing and chemical cleaning can restore flux. Pretreatment, which includes the addition of chemicals in the feedwater and/or upstream filtration (strainers), will assist in preventing or controlling membrane fouling. A decrease in flux caused by gel/cake formation on the membrane surface is found to be more severe in wastewater with higher solids content and backwashing becomes less effective in removing the layer, resulting in an increase in TMP and fouling potential (Bourgeous et al, 2001). It has also been illustrated in pilot testing that the solids content in the feed stream has a direct impact on the flux, causing it to decrease during the production period (Bourgeous et al, 2001) if operating in the constant TMP mode. Membrane flux reduction that can be restored by mechanical or chemical means is termed reversible fouling (AWWARF 1996), while irreversible fouling is occurs when membrane flux cannot be restored. When flux rates are increased, fouling rates tend to increase because the increase in velocity causes a greater deposition of particulate matter whereby the shear stress on the membrane surface becomes inhibitive (Sheikholeslama, 1999)
Mechanisms of Fouling
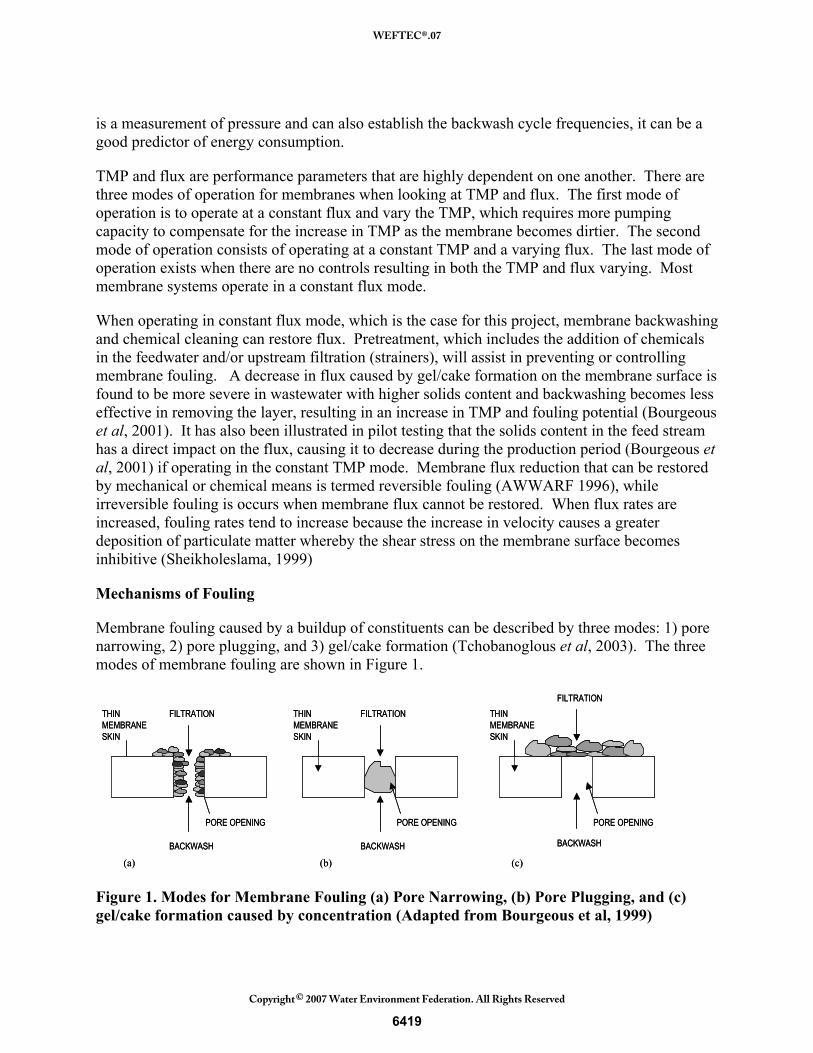
Membrane fouling caused by a buildup of constituents can be described by three modes: 1) pore narrowing, 2) pore plugging, and 3) gel/cake formation (Tchobanoglous et al, 2003). The three modes of membrane fouling are shown in Figure 1.
THIN MEMBRANESKIN
FILTRATION
BACKWASH
PORE OPENING
THIN MEMBRANESKIN
FILTRATION
BACKWASH
PORE OPENING
THIN MEMBRANESKIN
FILTRATION
BACKWASH
PORE OPENING
(a) (b) (c)
THIN MEMBRANESKIN
FILTRATION
BACKWASH
PORE OPENING
THIN MEMBRANESKIN
FILTRATION
BACKWASH
PORE OPENING
THIN MEMBRANESKIN
FILTRATION
BACKWASH
PORE OPENING
(a) (b) (c)
Figure 1. Modes for Membrane Fouling (a) Pore Narrowing, (b) Pore Plugging, and (c) gel/cake formation caused by concentration (Adapted from Bourgeous et al, 1999)
6419
WEFTEC®.07
Copyright 2007 Water Environment Federation. All Rights Reserved©
Pore narrowing and pore plugging will only occur when the particles in the feed stream are smaller than the pore size. Pore narrowing, also know as pore constriction, is a result of the adsorption of filtered species within the membrane pores. Pore narrowing and plugging are believed to create an increase in concentration polarization and therefore, promote gel/cake formation. Concentration polarization can be described as “the buildup of matter close to or on the membrane surface that causes an increase in resistance to solvent transport across the membrane” (Tchobanoglous et al, 2003). Concentration polarization can be amplified when treating concentrated feeds because pore size is reduced more rapidly, thereby causing an increase in fouling (Bourgeous et al, 2001). Fouling resulting from concentration polarization has been considered a loose reversible fouling layer (Abidine et al, 2005); however, if this layer reaches a critical concentration a condensed layer may form which can become irreversible. The gel/cake formation mode of fouling can be controlled by either preventing the particles from reaching the membrane or by flushing them out (backwashing) (Al Malack & Anderson, 1996). MF membranes, in general, foul due to the combined effects of pore blockage and cake formation (Katsoufidou et al, 2005).
The type of particulate matter removed by the membrane that can cause membrane fouling can be classified as inorganic (scaling) fouling, particulate/colloidal fouling, biological/microbial fouling, and organic fouling (Liu et al, 2001). Metal hydroxides and carbonates which precipitate onto and inside the membrane pores cause inorganic fouling, which results in pore narrowing. Inorganic fouling is less predominant in MF membranes but is most likely caused by the interaction of ions and other fouling material via chemical bonding. Suspended solids or colloids in the feedwater cause particulate fouling, which can cause pore narrowing, pore plugging or even cake formation. Irreversible fouling has happened in rare cases with particulate fouling when the particle size is smaller than that of the pore size, resulting in particles becoming trapped within the membrane structure matrix.
Fouling resulting from the formation of a biofilm is termed biological/microbial fouling, which typically causes a gel/cake formation on the membrane surface. Microbial fouling can occur more rapidly when the measurements of microbes and nutrient availability are high in the feed water. Biofilm formation is a result of nutrients being adsorbed by the membrane surface where bacteria will move to and begin to multiply and grow (Sheikholeslama, 1999). Factors than can impact biofouling include temperature, pH, oxygen concentration, available nutrients, substratum characteristics and flow conditions.
Organic fouling is caused by feedwaters containing natural organic matter (NOM), which also causes a gel/cake formation on the membrane surface. NOM primarily consists of humic substances and is measured by Total Organic Carbon (TOC) (Tchobanoglous et al, 2003) as well as UV Transmittance, which also measures other organic matter such as lignin and tannin. For feedwater high in NOM, organic fouling appears to be the most significant factor in increasing fouling potential (Liu et al, 2001) by forming NOM patches around the pores on the membrane surface that eventually expand to form a continuous gel layer (Chang and Benjamin, 2003). In addition, when there is an abundant source of oxygen, the hydrophilicity of NOM typically increases by increasing the charge density. This can impact the effectiveness of chemical cleaning because it use of chemicals is related to the chemicals ability to increase the charge
6420
WEFTEC®.07
Copyright 2007 Water Environment Federation. All Rights Reserved©
density of the foulants (Liu et al, 2001). Therefore, by increasing the charge density of the foulants, electrostatic repulsion is increased, which results in easier removal of the foulants.
Current studies have found that MF membranes are capable of treating both filtered and unfiltered secondary effluent. For instance, MF membrane systems, when treating filtered and unfiltered secondary effluents; can produce effluents equivalent to those of oxidized, coagulated, clarified and filtered wastewater as per Title 22 California Wastewater Reclamation Criteria (Bourgeous et al, 2001). However, as previously indicated, almost all constituents found in wastewater can affect the fouling potential in membranes. The following table summarizes the type of fouling potential that different constituents cause and their fouling mechanism.
Table 1. Fouling Wastewater Constituents that Impact Fouling Fouling Category Responsible Constituent Fouling Mechanism
Inorganic/Scaling
Metal Oxides Inorganic colloids
Calcium Sulfate, Carbonate and Fluoride
Barium Sulfate Silica
Pore narrowing Gel/Cake Formation
Particulate Fouling Suspended Solids
Colloids Biologically Inert Particles
Pore Narrowing Pore Plugging
Biological/Microbial Fouling
Bacteria Microorganisms
Concentration Polarization
Pore Narrowing Pore Plugging
Gel/Cake Formation – most prominent
Organic Fouling NOM Pore Narrowing Gel/Cake Formation
Fouling in the form of cake formation can be limited by controlling the constituents that cause this type of fouling. Scaling caused by the formation of chemical precipitates can be reduced by limiting salt content, adding acid to limit the formation of calcium carbonate, or by the addition of chemical such as antiscalants. If the water is hard (i.e. presence of calcium), then the membrane surface may form calcium carbonate.
Constituents found in wastewater such as colloids, particles, and dissolved organic matter typically have a negative charge. Therefore, membranes, which appear to have a neutral to negative net surface charge, tend to have a hydrophilic interaction or electrostatic repulsion with these constituents. However, natural organic matter (NOM) tends to have a hydrophobic adhesion towards membrane material and therefore fouling potential is greater with this constituent.
Methods to Control Fouling
Although many attempts have been made to control membrane fouling, it is still the principal limitation of membrane performance. In addition to proper design parameters, fouling potential
6421
WEFTEC®.07
Copyright 2007 Water Environment Federation. All Rights Reserved©
can be controlled by other selected mechanisms, including chemical cleaning, hydraulic cleaning, and pretreatment (i.e. chemical addition in feed stream). The methods to reverse or prevent fouling are dependent on the type of fouling (as outlined in Table 1). Table 2 summarizes the mechanism to control fouling for the different types of fouling.
Table 2. Methods to Reverse and/or Control Fouling Fouling Category Method to Reverse and/or Control Fouling
Inorganic/Scaling Pretreatment with a coagulant (alum) or oxidant (NaOCl) Chemical Cleaning (with acids)
Particulate Fouling Hydraulic Cleaning Chemical Cleaning
Biological/Microbial Fouling
Pretreatment with an oxidant (Cl or NaOCl) Hydraulic Cleaning
Chemical Cleaning (Cl or NaOCl)
Organic Fouling Pretreatment with an oxidant (Cl or NaOCl) or coagulant (alum) Chemical cleaning (caustic soda)
Chemical Cleaning
Chemical cleaning involves the mass transfer of chemicals to the fouling layer and the reaction products back to the bulk liquid phase, allowing the fouling layer to be removed in a solution (Liu et al, 2001). For MF systems, chemical cleaning is conducted in conjunction with maintenance washes. Maintenance washes, are conducted while the membrane is online, while clean-in-place (CIP) washes are conducted while the membrane is offline. Selection of chemicals used in maintenance washes and CIPs is dependent on the type of fouling experienced by the membrane, as outlined in. In addition, increasing the temperature during chemical cleaning will generally promote better membrane cleaning (Liu et al, 2001).
Table 3. Chemicals used based on Fouling Category Fouling Category Chemical
Inorganic/Scaling Citric Acid, Nitric Acid
Biological/Microbial Fouling
Sodium Hydroxide (NaOH) Sodium Hypochlorite (NaOCl)
Hydrogen Peroxide (H2O2)
Organic Fouling Sodium Hydroxide (NaOH)
Sodium Hypochlorite (NaOCl) Hydrogen Peroxide (H2O2)
Caustic soda is good for hydrolyzing organic materials such as polysaccharides, proteins, fats and oils. It also increases the negative charges of humic substances, which increases their solubility, creating a loose fouling layer that allows chemicals to penetrate the inner portion of the fouling layer (Liu et al, 2001). Sodium hypochlorite and hydrogen peroxide are oxidants that reduce the adhesion of fouling materials to the membrane surface. Citric acid is effective in the removal of scaling and metal dioxides from fouling layers. The “salt bridge” effect (the coexistence of divalent cations and NOM), which creates a denser and more adhesive fouling
6422
WEFTEC®.07
Copyright 2007 Water Environment Federation. All Rights Reserved©
layer, can be reduced with the use of citric acid. Citric acid can also improve the cleaning of membranes fouled by organic foulants (Hong and Elimelch, 1997).
Hydraulic Cleaning
Hydraulic cleaning consists of backwashing with and without air. Backwashing in conjunction with air scrubbing and scouring is also effective in removing fouling material and assists in reducing biogrowth on the membrane (Reith and Birkenhead, 1998). A review of published literature has indicated that the rate at which backwashing is required is dictated not only by the membrane itself but also by design parameters such as flux, TMP, and fouling. Backwashing rates increase as flux rates increase or as TMP increases because there is a higher rate of accumulation of particles on the membrane surface.
Because backwashing is not as effective in reducing fouling caused by pore narrowing, irreversible fouling will occur if chemical cleaning is not implemented. Irreversible fouling occurs when solids accumulate on or within the membrane surface and are not completely dislodged during the backwash period. After the backwashing period, the system begins at a higher TMP, which over time results in the maximum flux no longer being achieved without exceeding the allowable TMP. Damage to the membrane eventually occurs.
Permeate is used in many membrane systems for backwash water, therefore it is important that permeate is of high quality. Ammonia found in permeate water used for backwash can reduce the effectiveness of chemical backwashing because it converts hypochlorite into less active chloramine species (Tchobanoglous et al, 1998). Determining the appropriate backwashing rates for MF technology is essential. Optimizing the backwashing frequency not only reduces energy costs, but also ensures the integrity of the membrane and thereby will continue to provide high quality effluent.
Pretreatment with Chemicals
Chemical pretreatment is performed on the feedwater stream by adding the chemical to a feed water tank to allow for mixing of the solution. Similar to chemical cleaning, the selection of a chemical is dependent on the type of fouling being controlled. Chemical pretreatment will assist in controlling the substances causing fouling, thereby enabling the membrane to operate for a longer production period. However, the associated cost should not outweigh the benefit of the additional contaminants being removed. Chemicals typically added as pretreatment include sodium hypochlorite, which is effective in reducing NOM, or a coagulant such as alum, which is effective in reducing scaling and NOM.
EXPERIMENTAL DESIGN AND METHODOLOGY
Three experiments were conducted to assess the effects of varying selected operational and maintenance parameters on fouling propensities of membranes used for wastewater reclamation. To study the effects of the operational and maintenance parameters, two membrane pilot units were operated in parallel at a California wastewater treatment plant. Secondary effluent from the treatment plant served as the influent feed to the membrane pilot units, which were selected by
6423
WEFTEC®.07
Copyright 2007 Water Environment Federation. All Rights Reserved©
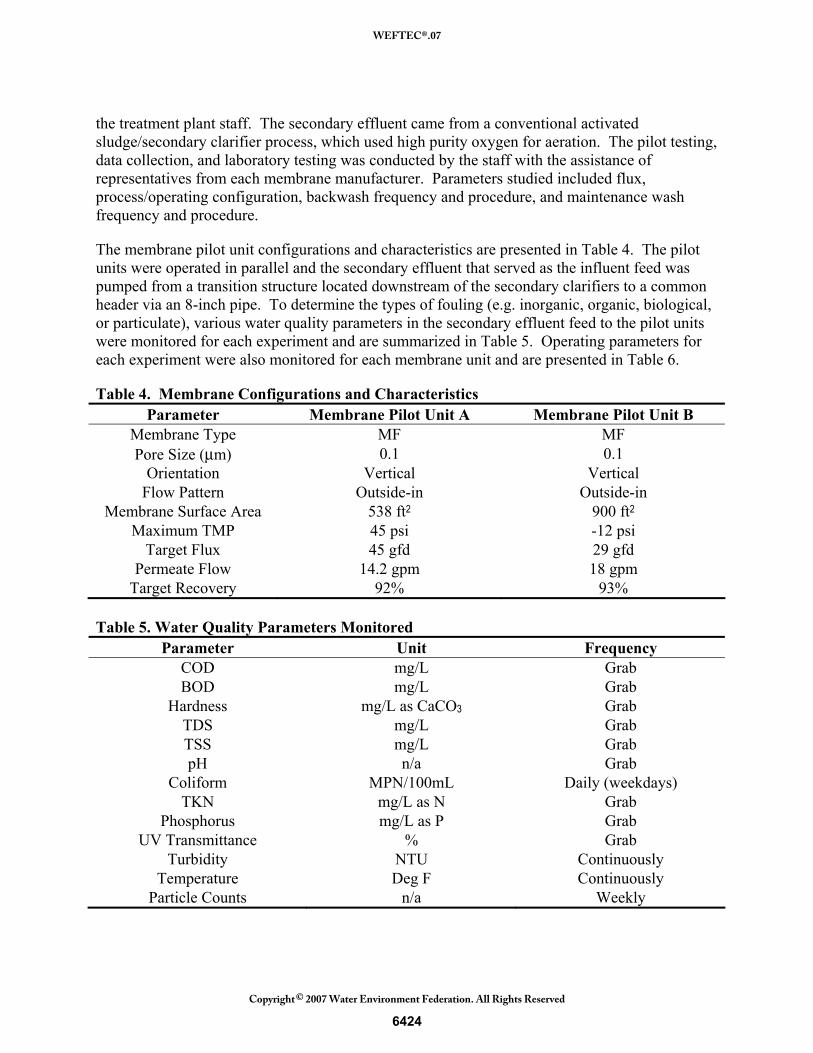
the treatment plant staff. The secondary effluent came from a conventional activated sludge/secondary clarifier process, which used high purity oxygen for aeration. The pilot testing, data collection, and laboratory testing was conducted by the staff with the assistance of representatives from each membrane manufacturer. Parameters studied included flux, process/operating configuration, backwash frequency and procedure, and maintenance wash frequency and procedure.
The membrane pilot unit configurations and characteristics are presented in Table 4. The pilot units were operated in parallel and the secondary effluent that served as the influent feed was pumped from a transition structure located downstream of the secondary clarifiers to a common header via an 8-inch pipe. To determine the types of fouling (e.g. inorganic, organic, biological, or particulate), various water quality parameters in the secondary effluent feed to the pilot units were monitored for each experiment and are summarized in Table 5. Operating parameters for each experiment were also monitored for each membrane unit and are presented in Table 6.
Table 4. Membrane Configurations and Characteristics Parameter Membrane Pilot Unit A Membrane Pilot Unit B
Membrane Type MF MF Pore Size (μm) 0.1 0.1
Orientation Vertical Vertical Flow Pattern Outside-in Outside-in
Membrane Surface Area 538 ft2 900 ft2 Maximum TMP 45 psi -12 psi
Target Flux 45 gfd 29 gfd Permeate Flow 14.2 gpm 18 gpm
Target Recovery 92% 93% Table 5. Water Quality Parameters Monitored
Parameter Unit Frequency COD mg/L Grab BOD mg/L Grab
Hardness mg/L as CaCO3 Grab TDS mg/L Grab TSS mg/L Grab pH n/a Grab
Coliform MPN/100mL Daily (weekdays) TKN mg/L as N Grab
Phosphorus mg/L as P Grab UV Transmittance % Grab
Turbidity NTU Continuously Temperature Deg F Continuously
Particle Counts n/a Weekly
6424
WEFTEC®.07
Copyright 2007 Water Environment Federation. All Rights Reserved©
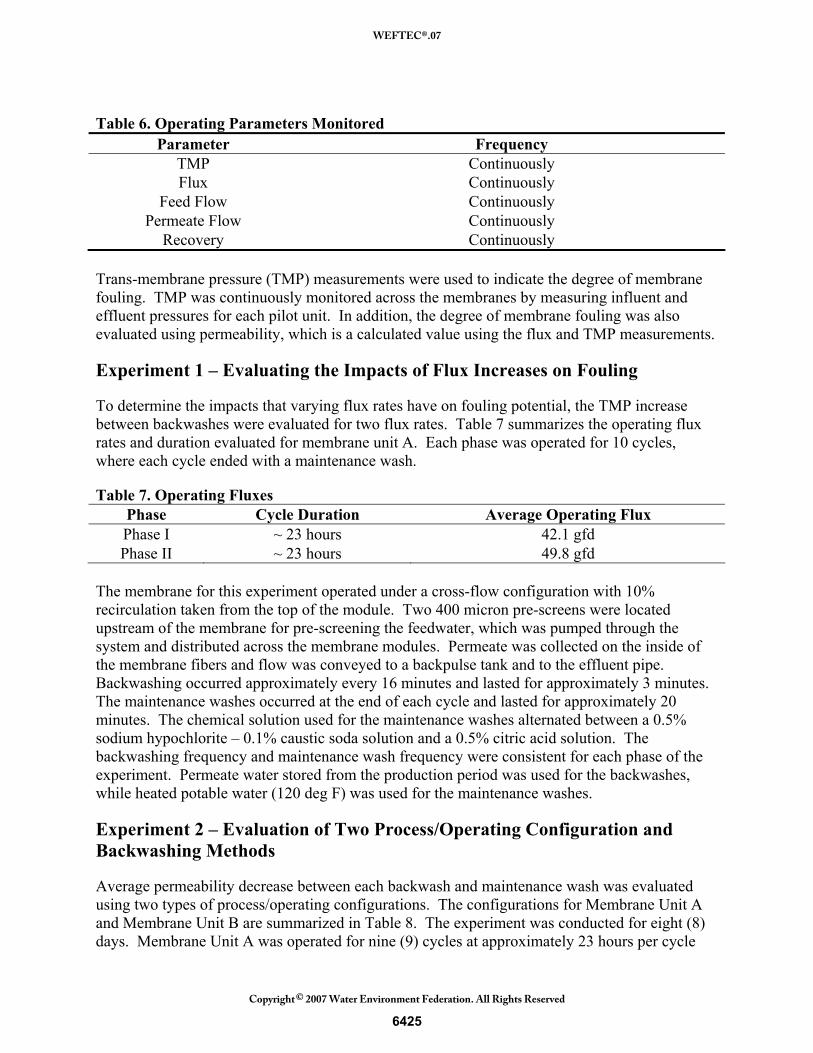
Table 6. Operating Parameters Monitored Parameter Frequency
TMP Continuously Flux Continuously
Feed Flow Continuously Permeate Flow Continuously
Recovery Continuously Trans-membrane pressure (TMP) measurements were used to indicate the degree of membrane fouling. TMP was continuously monitored across the membranes by measuring influent and effluent pressures for each pilot unit. In addition, the degree of membrane fouling was also evaluated using permeability, which is a calculated value using the flux and TMP measurements.
Experiment 1 – Evaluating the Impacts of Flux Increases on Fouling
To determine the impacts that varying flux rates have on fouling potential, the TMP increase between backwashes were evaluated for two flux rates. Table 7 summarizes the operating flux rates and duration evaluated for membrane unit A. Each phase was operated for 10 cycles, where each cycle ended with a maintenance wash.
Table 7. Operating Fluxes Phase Cycle Duration Average Operating Flux Phase I ~ 23 hours 42.1 gfd Phase II ~ 23 hours 49.8 gfd
The membrane for this experiment operated under a cross-flow configuration with 10% recirculation taken from the top of the module. Two 400 micron pre-screens were located upstream of the membrane for pre-screening the feedwater, which was pumped through the system and distributed across the membrane modules. Permeate was collected on the inside of the membrane fibers and flow was conveyed to a backpulse tank and to the effluent pipe. Backwashing occurred approximately every 16 minutes and lasted for approximately 3 minutes. The maintenance washes occurred at the end of each cycle and lasted for approximately 20 minutes. The chemical solution used for the maintenance washes alternated between a 0.5% sodium hypochlorite – 0.1% caustic soda solution and a 0.5% citric acid solution. The backwashing frequency and maintenance wash frequency were consistent for each phase of the experiment. Permeate water stored from the production period was used for the backwashes, while heated potable water (120 deg F) was used for the maintenance washes.
Experiment 2 – Evaluation of Two Process/Operating Configuration and Backwashing Methods
Average permeability decrease between each backwash and maintenance wash was evaluated using two types of process/operating configurations. The configurations for Membrane Unit A and Membrane Unit B are summarized in Table 8. The experiment was conducted for eight (8) days. Membrane Unit A was operated for nine (9) cycles at approximately 23 hours per cycle
6425
WEFTEC®.07
Copyright 2007 Water Environment Federation. All Rights Reserved©
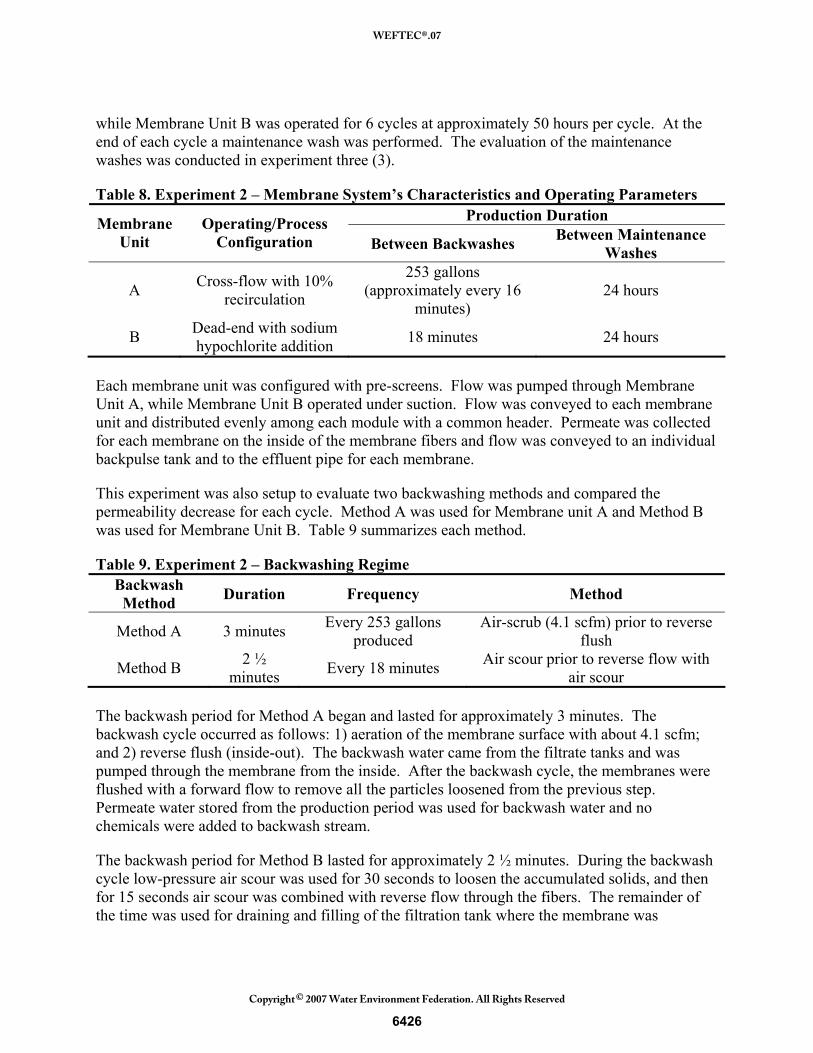
while Membrane Unit B was operated for 6 cycles at approximately 50 hours per cycle. At the end of each cycle a maintenance wash was performed. The evaluation of the maintenance washes was conducted in experiment three (3).
Table 8. Experiment 2 – Membrane System’s Characteristics and Operating Parameters Production Duration Membrane
Unit Operating/Process
Configuration Between Backwashes Between Maintenance Washes
A Cross-flow with 10% recirculation
253 gallons (approximately every 16
minutes) 24 hours
B Dead-end with sodium hypochlorite addition 18 minutes 24 hours
Each membrane unit was configured with pre-screens. Flow was pumped through Membrane Unit A, while Membrane Unit B operated under suction. Flow was conveyed to each membrane unit and distributed evenly among each module with a common header. Permeate was collected for each membrane on the inside of the membrane fibers and flow was conveyed to an individual backpulse tank and to the effluent pipe for each membrane.
This experiment was also setup to evaluate two backwashing methods and compared the permeability decrease for each cycle. Method A was used for Membrane unit A and Method B was used for Membrane Unit B. Table 9 summarizes each method.
Table 9. Experiment 2 – Backwashing Regime Backwash Method Duration Frequency Method
Method A 3 minutes Every 253 gallons produced
Air-scrub (4.1 scfm) prior to reverse flush
Method B 2 ½ minutes Every 18 minutes Air scour prior to reverse flow with
air scour The backwash period for Method A began and lasted for approximately 3 minutes. The backwash cycle occurred as follows: 1) aeration of the membrane surface with about 4.1 scfm; and 2) reverse flush (inside-out). The backwash water came from the filtrate tanks and was pumped through the membrane from the inside. After the backwash cycle, the membranes were flushed with a forward flow to remove all the particles loosened from the previous step. Permeate water stored from the production period was used for backwash water and no chemicals were added to backwash stream.
The backwash period for Method B lasted for approximately 2 ½ minutes. During the backwash cycle low-pressure air scour was used for 30 seconds to loosen the accumulated solids, and then for 15 seconds air scour was combined with reverse flow through the fibers. The remainder of the time was used for draining and filling of the filtration tank where the membrane was
6426
WEFTEC®.07
Copyright 2007 Water Environment Federation. All Rights Reserved©
immersed. Permeated water stored from the production period was also used for backwash water for this method and no chemicals were added to the backwash stream.
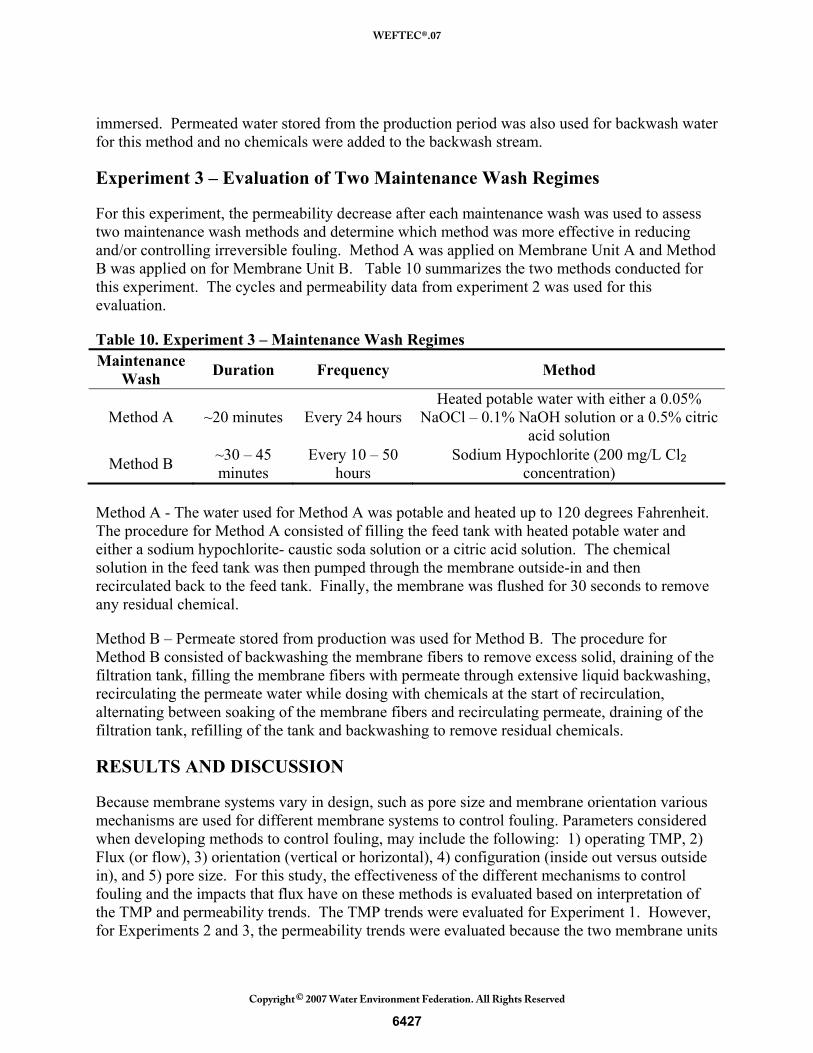
Experiment 3 – Evaluation of Two Maintenance Wash Regimes
For this experiment, the permeability decrease after each maintenance wash was used to assess two maintenance wash methods and determine which method was more effective in reducing and/or controlling irreversible fouling. Method A was applied on Membrane Unit A and Method B was applied on for Membrane Unit B. Table 10 summarizes the two methods conducted for this experiment. The cycles and permeability data from experiment 2 was used for this evaluation.
Table 10. Experiment 3 – Maintenance Wash Regimes Maintenance
Wash Duration Frequency Method
Method A ~20 minutes Every 24 hours Heated potable water with either a 0.05%
NaOCl – 0.1% NaOH solution or a 0.5% citric acid solution
Method B ~30 – 45 minutes
Every 10 – 50 hours
Sodium Hypochlorite (200 mg/L Cl2 concentration)
Method A - The water used for Method A was potable and heated up to 120 degrees Fahrenheit. The procedure for Method A consisted of filling the feed tank with heated potable water and either a sodium hypochlorite- caustic soda solution or a citric acid solution. The chemical solution in the feed tank was then pumped through the membrane outside-in and then recirculated back to the feed tank. Finally, the membrane was flushed for 30 seconds to remove any residual chemical.
Method B – Permeate stored from production was used for Method B. The procedure for Method B consisted of backwashing the membrane fibers to remove excess solid, draining of the filtration tank, filling the membrane fibers with permeate through extensive liquid backwashing, recirculating the permeate water while dosing with chemicals at the start of recirculation, alternating between soaking of the membrane fibers and recirculating permeate, draining of the filtration tank, refilling of the tank and backwashing to remove residual chemicals.
RESULTS AND DISCUSSION
Because membrane systems vary in design, such as pore size and membrane orientation various mechanisms are used for different membrane systems to control fouling. Parameters considered when developing methods to control fouling, may include the following: 1) operating TMP, 2) Flux (or flow), 3) orientation (vertical or horizontal), 4) configuration (inside out versus outside in), and 5) pore size. For this study, the effectiveness of the different mechanisms to control fouling and the impacts that flux have on these methods is evaluated based on interpretation of the TMP and permeability trends. The TMP trends were evaluated for Experiment 1. However, for Experiments 2 and 3, the permeability trends were evaluated because the two membrane units
6427
WEFTEC®.07
Copyright 2007 Water Environment Federation. All Rights Reserved©
used for each experiment were operated at different flux rates (i.e permeability normalizes the flux rates and TMP).
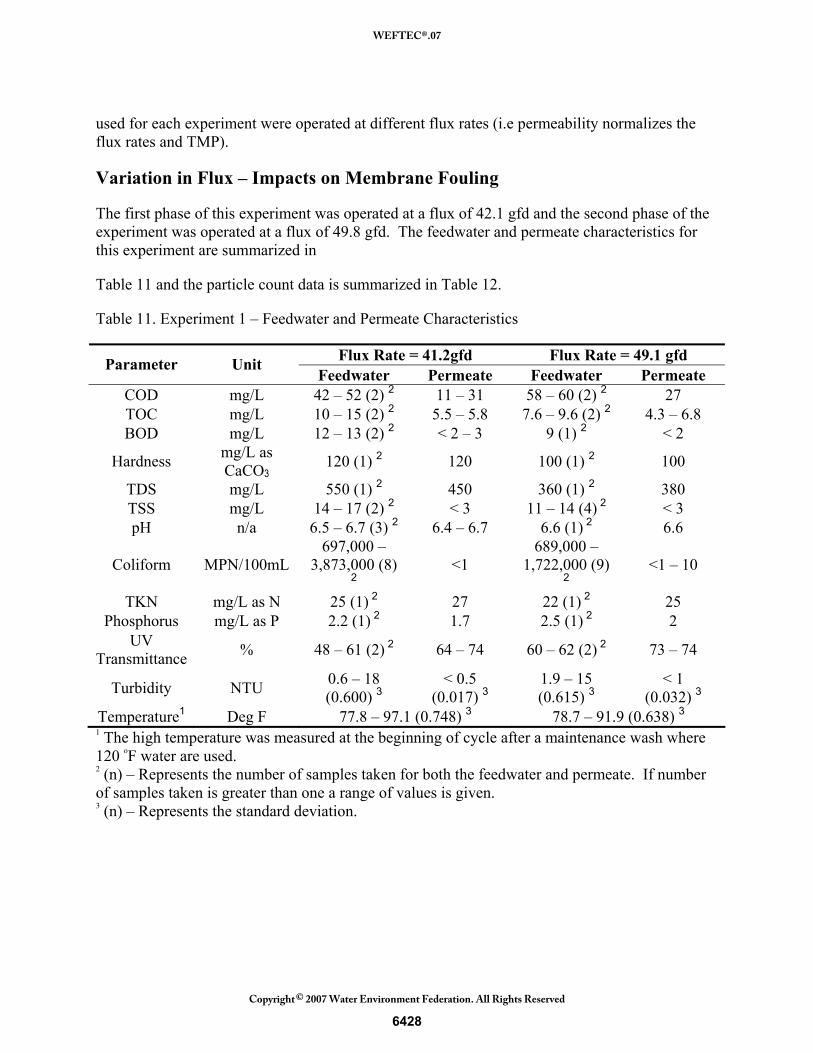
Variation in Flux – Impacts on Membrane Fouling
The first phase of this experiment was operated at a flux of 42.1 gfd and the second phase of the experiment was operated at a flux of 49.8 gfd. The feedwater and permeate characteristics for this experiment are summarized in
Table 11 and the particle count data is summarized in Table 12.
Table 11. Experiment 1 – Feedwater and Permeate Characteristics
Flux Rate = 41.2gfd Flux Rate = 49.1 gfd Parameter Unit Feedwater Permeate Feedwater Permeate
COD mg/L 42 – 52 (2) 2 11 – 31 58 – 60 (2) 2 27 TOC mg/L 10 – 15 (2) 2 5.5 – 5.8 7.6 – 9.6 (2) 2 4.3 – 6.8 BOD mg/L 12 – 13 (2) 2 < 2 – 3 9 (1) 2 < 2
Hardness mg/L as CaCO3
120 (1) 2 120 100 (1) 2 100
TDS mg/L 550 (1) 2 450 360 (1) 2 380 TSS mg/L 14 – 17 (2) 2 < 3 11 – 14 (4) 2 < 3 pH n/a 6.5 – 6.7 (3) 2 6.4 – 6.7 6.6 (1) 2 6.6
Coliform MPN/100mL 697,000 –
3,873,000 (8)
2 <1
689,000 – 1,722,000 (9)
2 <1 – 10
TKN mg/L as N 25 (1) 2 27 22 (1) 2 25 Phosphorus mg/L as P 2.2 (1) 2 1.7 2.5 (1) 2 2
UV Transmittance % 48 – 61 (2) 2 64 – 74 60 – 62 (2) 2 73 – 74
Turbidity NTU 0.6 – 18 (0.600) 3
< 0.5 (0.017) 3
1.9 – 15 (0.615) 3
< 1 (0.032) 3
Temperature1 Deg F 77.8 – 97.1 (0.748) 3 78.7 – 91.9 (0.638) 3 1 The high temperature was measured at the beginning of cycle after a maintenance wash where 120 oF water are used. 2 (n) – Represents the number of samples taken for both the feedwater and permeate. If number of samples taken is greater than one a range of values is given. 3 (n) – Represents the standard deviation.
6428
WEFTEC®.07
Copyright 2007 Water Environment Federation. All Rights Reserved©
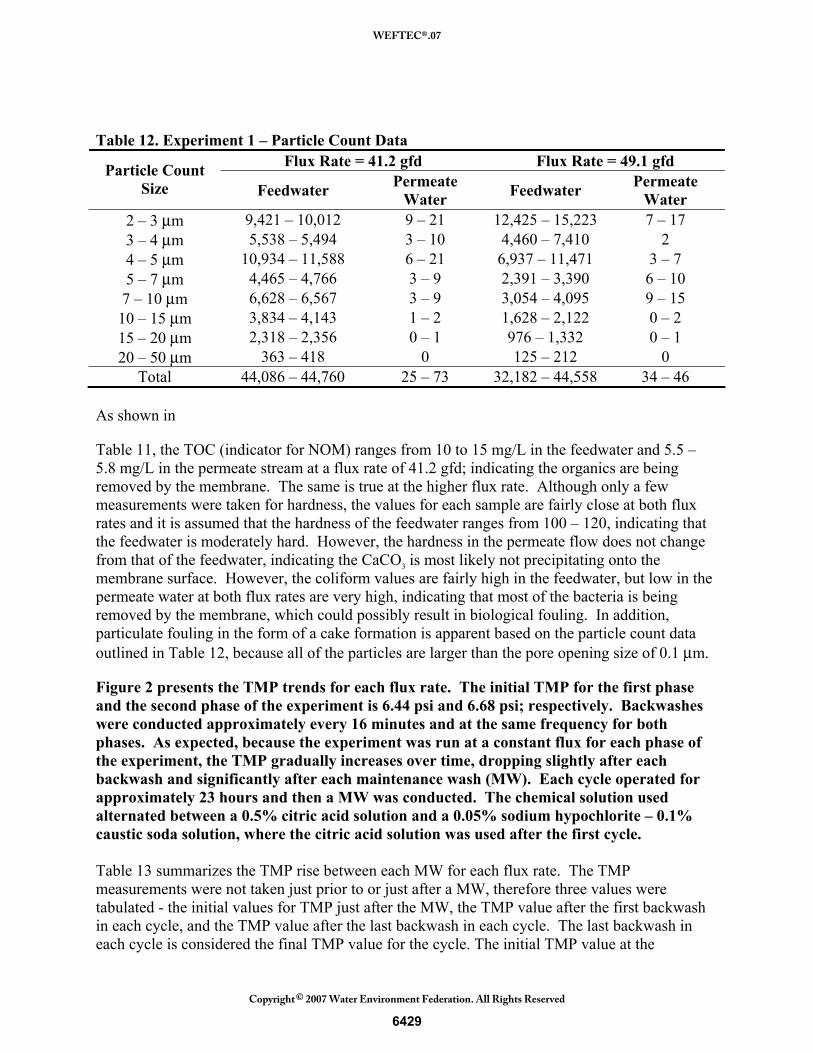
Table 12. Experiment 1 – Particle Count Data
Flux Rate = 41.2 gfd Flux Rate = 49.1 gfd Particle Count Size Feedwater Permeate
Water Feedwater Permeate Water
2 – 3 μm 9,421 – 10,012 9 – 21 12,425 – 15,223 7 – 17 3 – 4 μm 5,538 – 5,494 3 – 10 4,460 – 7,410 2 4 – 5 μm 10,934 – 11,588 6 – 21 6,937 – 11,471 3 – 7 5 – 7 μm 4,465 – 4,766 3 – 9 2,391 – 3,390 6 – 10 7 – 10 μm 6,628 – 6,567 3 – 9 3,054 – 4,095 9 – 15 10 – 15 μm 3,834 – 4,143 1 – 2 1,628 – 2,122 0 – 2 15 – 20 μm 2,318 – 2,356 0 – 1 976 – 1,332 0 – 1 20 – 50 μm 363 – 418 0 125 – 212 0
Total 44,086 – 44,760 25 – 73 32,182 – 44,558 34 – 46 As shown in
Table 11, the TOC (indicator for NOM) ranges from 10 to 15 mg/L in the feedwater and 5.5 – 5.8 mg/L in the permeate stream at a flux rate of 41.2 gfd; indicating the organics are being removed by the membrane. The same is true at the higher flux rate. Although only a few measurements were taken for hardness, the values for each sample are fairly close at both flux rates and it is assumed that the hardness of the feedwater ranges from 100 – 120, indicating that the feedwater is moderately hard. However, the hardness in the permeate flow does not change from that of the feedwater, indicating the CaCO3 is most likely not precipitating onto the membrane surface. However, the coliform values are fairly high in the feedwater, but low in the permeate water at both flux rates are very high, indicating that most of the bacteria is being removed by the membrane, which could possibly result in biological fouling. In addition, particulate fouling in the form of a cake formation is apparent based on the particle count data outlined in Table 12, because all of the particles are larger than the pore opening size of 0.1 μm.
Figure 2 presents the TMP trends for each flux rate. The initial TMP for the first phase and the second phase of the experiment is 6.44 psi and 6.68 psi; respectively. Backwashes were conducted approximately every 16 minutes and at the same frequency for both phases. As expected, because the experiment was run at a constant flux for each phase of the experiment, the TMP gradually increases over time, dropping slightly after each backwash and significantly after each maintenance wash (MW). Each cycle operated for approximately 23 hours and then a MW was conducted. The chemical solution used alternated between a 0.5% citric acid solution and a 0.05% sodium hypochlorite – 0.1% caustic soda solution, where the citric acid solution was used after the first cycle. Table 13 summarizes the TMP rise between each MW for each flux rate. The TMP measurements were not taken just prior to or just after a MW, therefore three values were tabulated - the initial values for TMP just after the MW, the TMP value after the first backwash in each cycle, and the TMP value after the last backwash in each cycle. The last backwash in each cycle is considered the final TMP value for the cycle. The initial TMP value at the
6429
WEFTEC®.07
Copyright 2007 Water Environment Federation. All Rights Reserved©
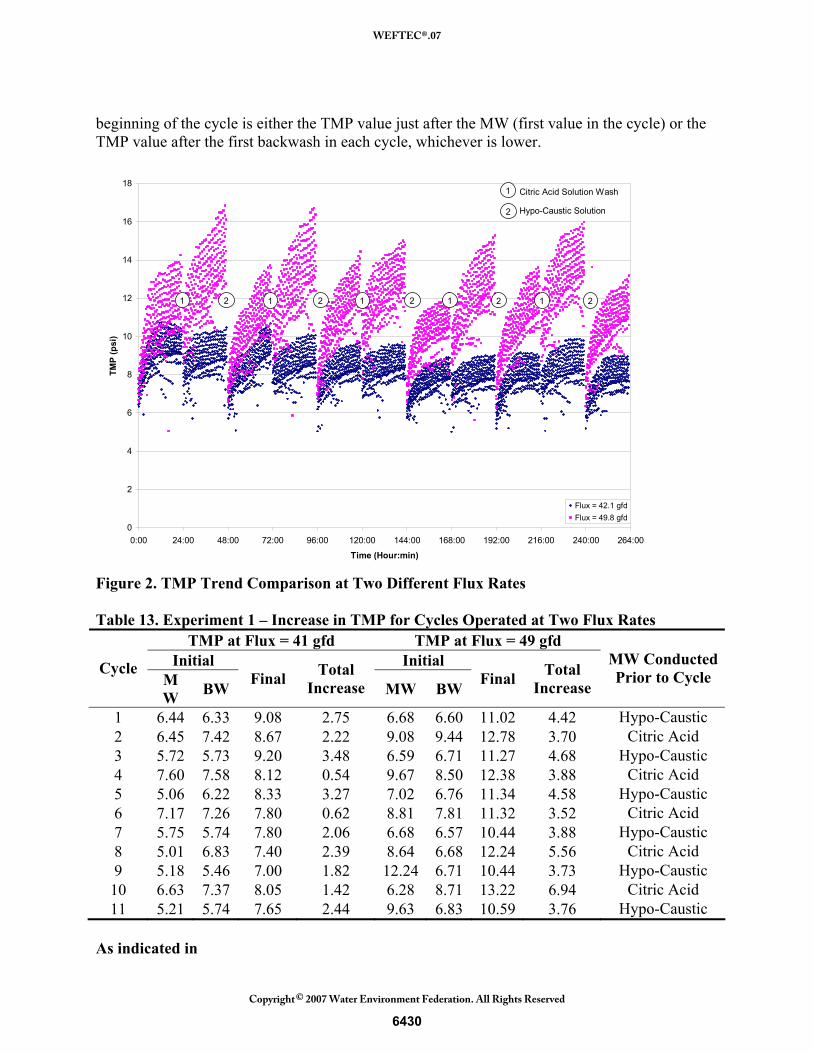
beginning of the cycle is either the TMP value just after the MW (first value in the cycle) or the TMP value after the first backwash in each cycle, whichever is lower.
0
2
4
6
8
10
12
14
16
18
0:00 24:00 48:00 72:00 96:00 120:00 144:00 168:00 192:00 216:00 240:00 264:00
Time (Hour:min)
TMP
(psi
)
Flux = 42.1 gfdFlux = 49.8 gfd
1 2 1 222 2111
Citric Acid Solution Wash
2
1
Hypo-Caustic Solution
Figure 2. TMP Trend Comparison at Two Different Flux Rates Table 13. Experiment 1 – Increase in TMP for Cycles Operated at Two Flux Rates
TMP at Flux = 41 gfd TMP at Flux = 49 gfd Initial Initial Cycle
MW BW Final Total
Increase MW BW Final Total Increase
MW Conducted Prior to Cycle
1 6.44 6.33 9.08 2.75 6.68 6.60 11.02 4.42 Hypo-Caustic 2 6.45 7.42 8.67 2.22 9.08 9.44 12.78 3.70 Citric Acid 3 5.72 5.73 9.20 3.48 6.59 6.71 11.27 4.68 Hypo-Caustic 4 7.60 7.58 8.12 0.54 9.67 8.50 12.38 3.88 Citric Acid 5 5.06 6.22 8.33 3.27 7.02 6.76 11.34 4.58 Hypo-Caustic 6 7.17 7.26 7.80 0.62 8.81 7.81 11.32 3.52 Citric Acid 7 5.75 5.74 7.80 2.06 6.68 6.57 10.44 3.88 Hypo-Caustic 8 5.01 6.83 7.40 2.39 8.64 6.68 12.24 5.56 Citric Acid 9 5.18 5.46 7.00 1.82 12.24 6.71 10.44 3.73 Hypo-Caustic 10 6.63 7.37 8.05 1.42 6.28 8.71 13.22 6.94 Citric Acid 11 5.21 5.74 7.65 2.44 9.63 6.83 10.59 3.76 Hypo-Caustic
As indicated in
6430
WEFTEC®.07
Copyright 2007 Water Environment Federation. All Rights Reserved©
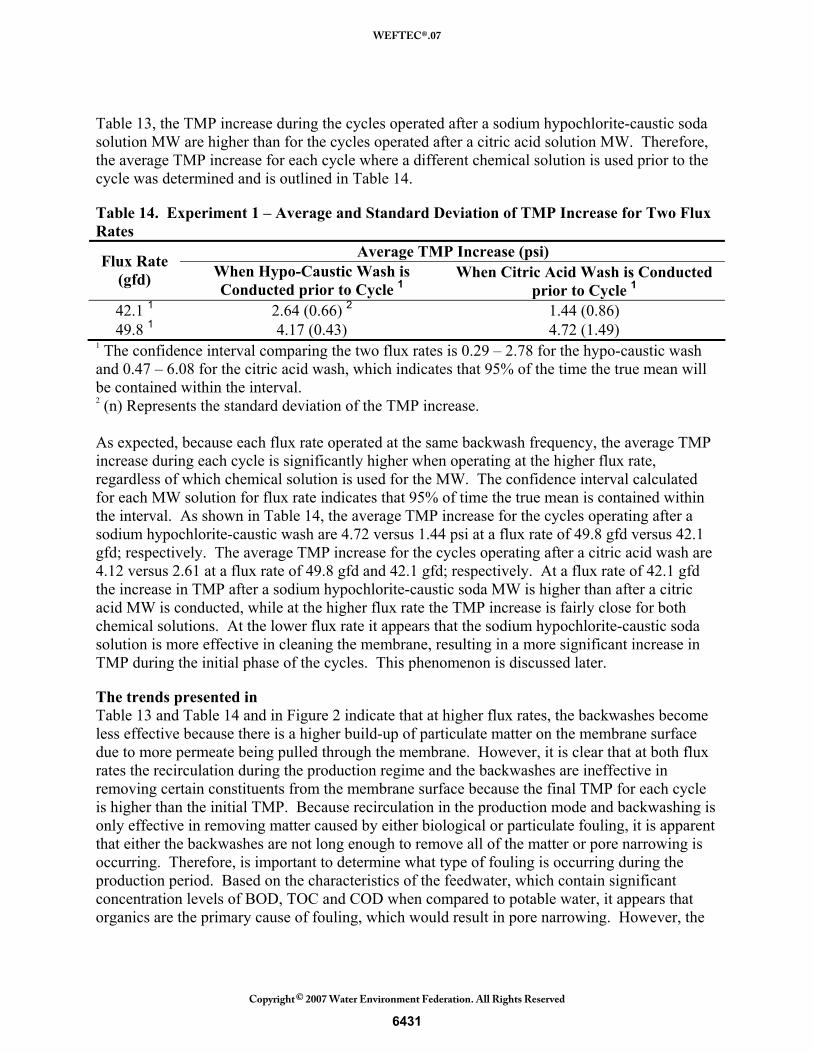
Table 13, the TMP increase during the cycles operated after a sodium hypochlorite-caustic soda solution MW are higher than for the cycles operated after a citric acid solution MW. Therefore, the average TMP increase for each cycle where a different chemical solution is used prior to the cycle was determined and is outlined in Table 14.
Table 14. Experiment 1 – Average and Standard Deviation of TMP Increase for Two Flux Rates
Average TMP Increase (psi) Flux Rate (gfd) When Hypo-Caustic Wash is
Conducted prior to Cycle 1 When Citric Acid Wash is Conducted
prior to Cycle 1 42.1 1 2.64 (0.66) 2 1.44 (0.86) 49.8 1 4.17 (0.43) 4.72 (1.49)
1 The confidence interval comparing the two flux rates is 0.29 – 2.78 for the hypo-caustic wash and 0.47 – 6.08 for the citric acid wash, which indicates that 95% of the time the true mean will be contained within the interval. 2 (n) Represents the standard deviation of the TMP increase. As expected, because each flux rate operated at the same backwash frequency, the average TMP increase during each cycle is significantly higher when operating at the higher flux rate, regardless of which chemical solution is used for the MW. The confidence interval calculated for each MW solution for flux rate indicates that 95% of time the true mean is contained within the interval. As shown in Table 14, the average TMP increase for the cycles operating after a sodium hypochlorite-caustic wash are 4.72 versus 1.44 psi at a flux rate of 49.8 gfd versus 42.1 gfd; respectively. The average TMP increase for the cycles operating after a citric acid wash are 4.12 versus 2.61 at a flux rate of 49.8 gfd and 42.1 gfd; respectively. At a flux rate of 42.1 gfd the increase in TMP after a sodium hypochlorite-caustic soda MW is higher than after a citric acid MW is conducted, while at the higher flux rate the TMP increase is fairly close for both chemical solutions. At the lower flux rate it appears that the sodium hypochlorite-caustic soda solution is more effective in cleaning the membrane, resulting in a more significant increase in TMP during the initial phase of the cycles. This phenomenon is discussed later.
The trends presented in Table 13 and Table 14 and in Figure 2 indicate that at higher flux rates, the backwashes become less effective because there is a higher build-up of particulate matter on the membrane surface due to more permeate being pulled through the membrane. However, it is clear that at both flux rates the recirculation during the production regime and the backwashes are ineffective in removing certain constituents from the membrane surface because the final TMP for each cycle is higher than the initial TMP. Because recirculation in the production mode and backwashing is only effective in removing matter caused by either biological or particulate fouling, it is apparent that either the backwashes are not long enough to remove all of the matter or pore narrowing is occurring. Therefore, is important to determine what type of fouling is occurring during the production period. Based on the characteristics of the feedwater, which contain significant concentration levels of BOD, TOC and COD when compared to potable water, it appears that organics are the primary cause of fouling, which would result in pore narrowing. However, the
6431
WEFTEC®.07
Copyright 2007 Water Environment Federation. All Rights Reserved©
backwashes may not be effective in removing the gel/cake formation layer on the membrane surface.
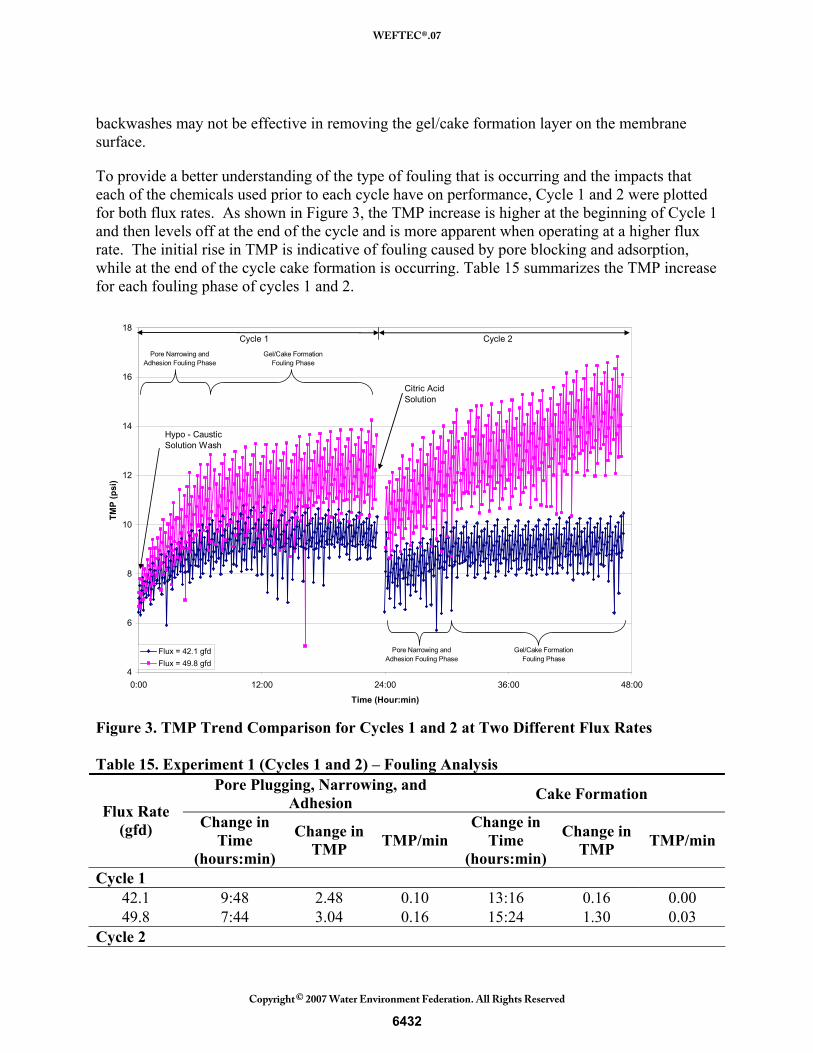
To provide a better understanding of the type of fouling that is occurring and the impacts that each of the chemicals used prior to each cycle have on performance, Cycle 1 and 2 were plotted for both flux rates. As shown in Figure 3, the TMP increase is higher at the beginning of Cycle 1 and then levels off at the end of the cycle and is more apparent when operating at a higher flux rate. The initial rise in TMP is indicative of fouling caused by pore blocking and adsorption, while at the end of the cycle cake formation is occurring. Table 15 summarizes the TMP increase for each fouling phase of cycles 1 and 2.
4
6
8
10
12
14
16
18
0:00 12:00 24:00 36:00 48:00
Time (Hour:min)
TMP
(psi
)
Flux = 42.1 gfdFlux = 49.8 gfd
Citric Acid Solution
Hypo - Caustic Solution Wash
Cycle 1 Cycle 2Pore Narrowing and
Adhesion Fouling PhaseGel/Cake Formation
Fouling Phase
Pore Narrowing and Adhesion Fouling Phase
Gel/Cake Formation Fouling Phase
Figure 3. TMP Trend Comparison for Cycles 1 and 2 at Two Different Flux Rates Table 15. Experiment 1 (Cycles 1 and 2) – Fouling Analysis
Pore Plugging, Narrowing, and Adhesion Cake Formation
Flux Rate (gfd) Change in
Time (hours:min)
Change in TMP TMP/min
Change in Time
(hours:min)
Change in TMP TMP/min
Cycle 1 42.1 9:48 2.48 0.10 13:16 0.16 0.00 49.8 7:44 3.04 0.16 15:24 1.30 0.03
Cycle 2
6432
WEFTEC®.07
Copyright 2007 Water Environment Federation. All Rights Reserved©
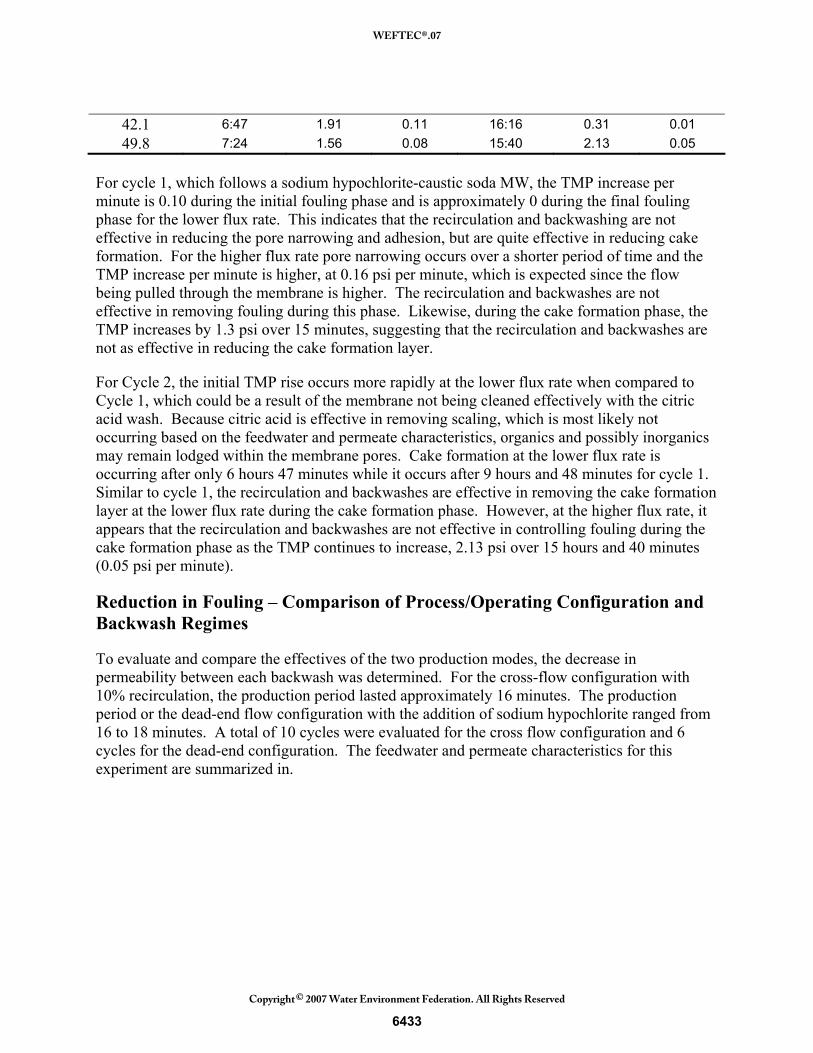
42.1 6:47 1.91 0.11 16:16 0.31 0.01 49.8 7:24 1.56 0.08 15:40 2.13 0.05
For cycle 1, which follows a sodium hypochlorite-caustic soda MW, the TMP increase per minute is 0.10 during the initial fouling phase and is approximately 0 during the final fouling phase for the lower flux rate. This indicates that the recirculation and backwashing are not effective in reducing the pore narrowing and adhesion, but are quite effective in reducing cake formation. For the higher flux rate pore narrowing occurs over a shorter period of time and the TMP increase per minute is higher, at 0.16 psi per minute, which is expected since the flow being pulled through the membrane is higher. The recirculation and backwashes are not effective in removing fouling during this phase. Likewise, during the cake formation phase, the TMP increases by 1.3 psi over 15 minutes, suggesting that the recirculation and backwashes are not as effective in reducing the cake formation layer.
For Cycle 2, the initial TMP rise occurs more rapidly at the lower flux rate when compared to Cycle 1, which could be a result of the membrane not being cleaned effectively with the citric acid wash. Because citric acid is effective in removing scaling, which is most likely not occurring based on the feedwater and permeate characteristics, organics and possibly inorganics may remain lodged within the membrane pores. Cake formation at the lower flux rate is occurring after only 6 hours 47 minutes while it occurs after 9 hours and 48 minutes for cycle 1. Similar to cycle 1, the recirculation and backwashes are effective in removing the cake formation layer at the lower flux rate during the cake formation phase. However, at the higher flux rate, it appears that the recirculation and backwashes are not effective in controlling fouling during the cake formation phase as the TMP continues to increase, 2.13 psi over 15 hours and 40 minutes (0.05 psi per minute).
Reduction in Fouling – Comparison of Process/Operating Configuration and Backwash Regimes
To evaluate and compare the effectives of the two production modes, the decrease in permeability between each backwash was determined. For the cross-flow configuration with 10% recirculation, the production period lasted approximately 16 minutes. The production period or the dead-end flow configuration with the addition of sodium hypochlorite ranged from 16 to 18 minutes. A total of 10 cycles were evaluated for the cross flow configuration and 6 cycles for the dead-end configuration. The feedwater and permeate characteristics for this experiment are summarized in.
6433
WEFTEC®.07
Copyright 2007 Water Environment Federation. All Rights Reserved©
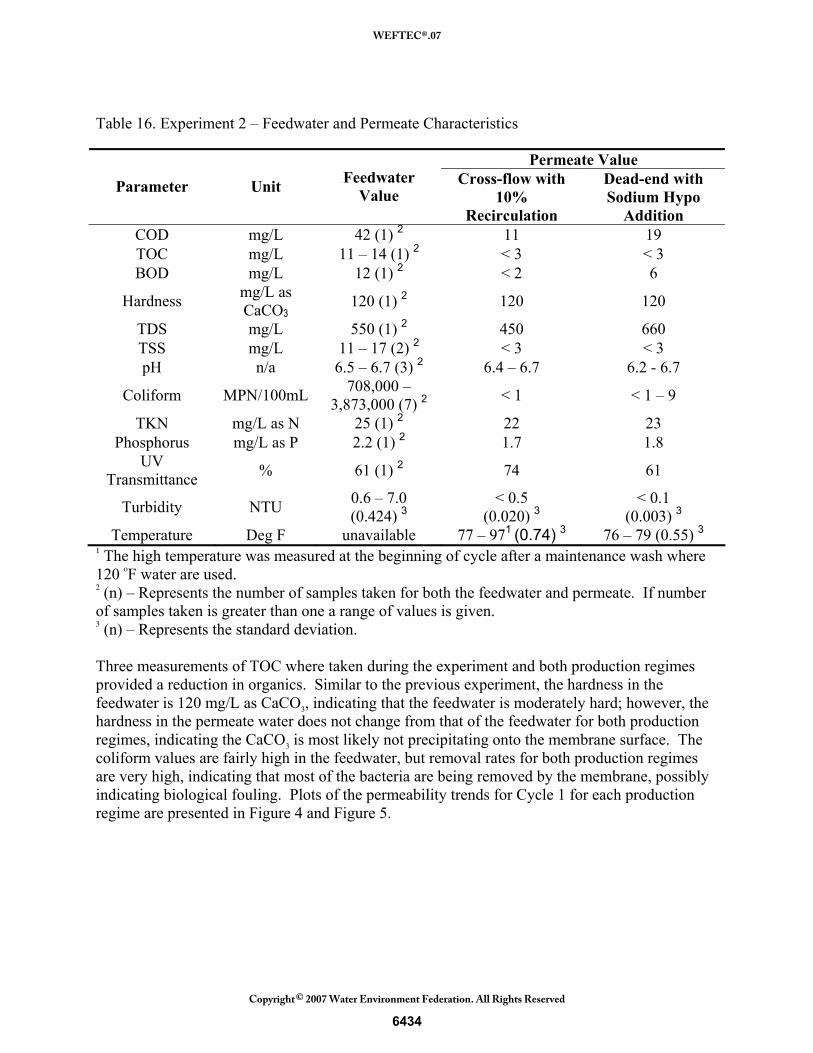
Table 16. Experiment 2 – Feedwater and Permeate Characteristics
Permeate Value
Parameter Unit Feedwater Value
Cross-flow with 10%
Recirculation
Dead-end with Sodium Hypo
Addition COD mg/L 42 (1) 2 11 19 TOC mg/L 11 – 14 (1) 2 < 3 < 3 BOD mg/L 12 (1) 2 < 2 6
Hardness mg/L as CaCO3
120 (1) 2 120 120
TDS mg/L 550 (1) 2 450 660 TSS mg/L 11 – 17 (2) 2 < 3 < 3 pH n/a 6.5 – 6.7 (3) 2 6.4 – 6.7 6.2 - 6.7
Coliform MPN/100mL 708,000 – 3,873,000 (7) 2 < 1 < 1 – 9
TKN mg/L as N 25 (1) 2 22 23 Phosphorus mg/L as P 2.2 (1) 2 1.7 1.8
UV Transmittance % 61 (1) 2 74 61
Turbidity NTU 0.6 – 7.0 (0.424) 3
< 0.5 (0.020) 3
< 0.1 (0.003) 3
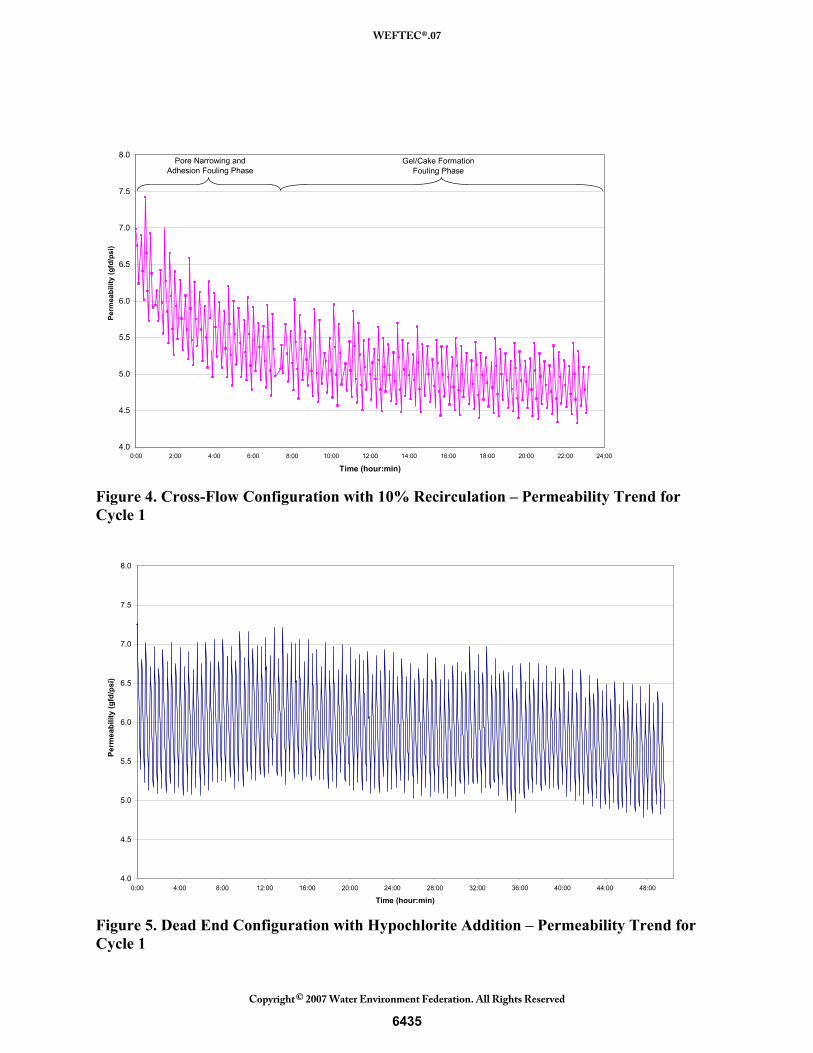
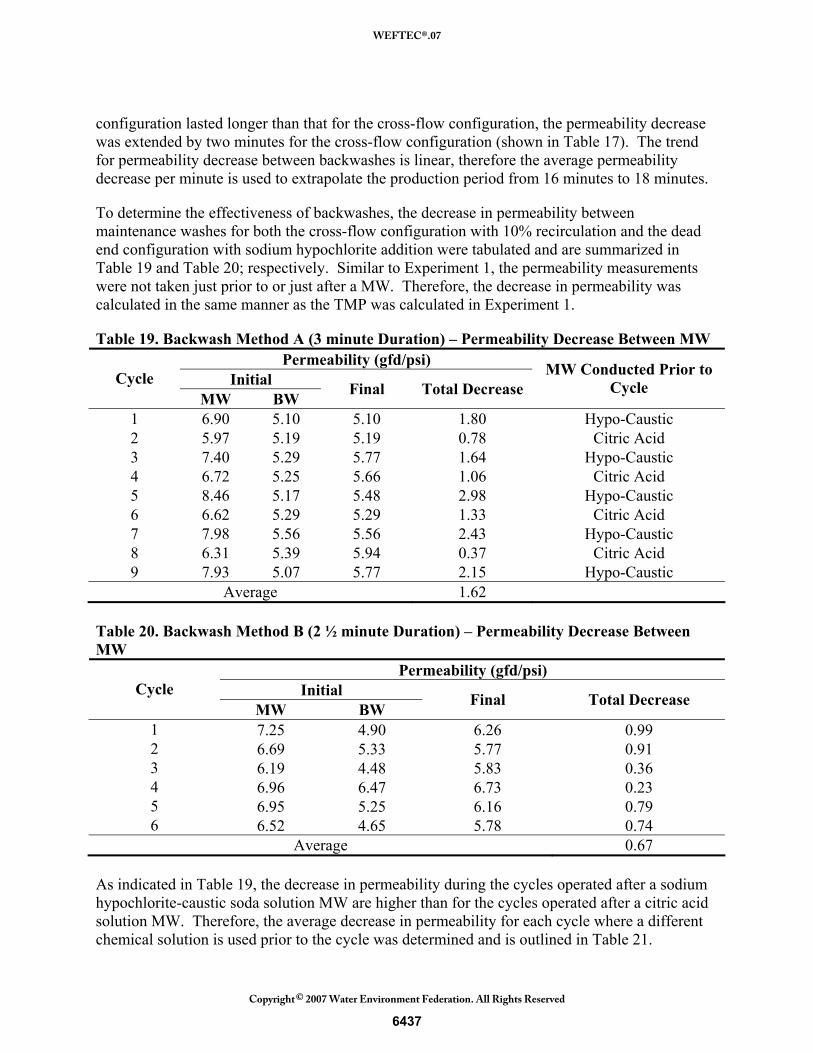
Temperature Deg F unavailable 77 – 971 (0.74) 3 76 – 79 (0.55) 3 1 The high temperature was measured at the beginning of cycle after a maintenance wash where 120 oF water are used. 2 (n) – Represents the number of samples taken for both the feedwater and permeate. If number of samples taken is greater than one a range of values is given. 3 (n) – Represents the standard deviation. Three measurements of TOC where taken during the experiment and both production regimes provided a reduction in organics. Similar to the previous experiment, the hardness in the feedwater is 120 mg/L as CaCO3, indicating that the feedwater is moderately hard; however, the hardness in the permeate water does not change from that of the feedwater for both production regimes, indicating the CaCO3 is most likely not precipitating onto the membrane surface. The coliform values are fairly high in the feedwater, but removal rates for both production regimes are very high, indicating that most of the bacteria are being removed by the membrane, possibly indicating biological fouling. Plots of the permeability trends for Cycle 1 for each production regime are presented in Figure 4 and Figure 5.
6434
WEFTEC®.07
Copyright 2007 Water Environment Federation. All Rights Reserved©
4.0
4.5
5.0
5.5
6.0
6.5
7.0
7.5
8.0
0:00 2:00 4:00 6:00 8:00 10:00 12:00 14:00 16:00 18:00 20:00 22:00 24:00
Time (hour:min)
Perm
eabi
lity
(gfd
/psi
)
Pore Narrowing and Adhesion Fouling Phase
Gel/Cake Formation Fouling Phase
Figure 4. Cross-Flow Configuration with 10% Recirculation – Permeability Trend for Cycle 1
4.0
4.5
5.0
5.5
6.0
6.5
7.0
7.5
8.0
0:00 4:00 8:00 12:00 16:00 20:00 24:00 28:00 32:00 36:00 40:00 44:00 48:00
Time (hour:min)
Perm
eabi
lity
(gfd
/psi
)
Figure 5. Dead End Configuration with Hypochlorite Addition – Permeability Trend for Cycle 1
6435
WEFTEC®.07
Copyright 2007 Water Environment Federation. All Rights Reserved©

As indicated in Figure 4 and Figure 5, the permeability decreases more rapidly over time for cross-flow configuration (Figure 4) than for dead-end configuration (Figure 5). Similar to Experiment 1, this is an indication that pore narrowing and adhesion are occurring for the cross-flow configuration. However, the average permeability decrease between backwashes for this regime is less than that for the dead end configuration as summarized in Table 17 and Table 18. These two trends indicate that for cross-flow configuration 1) pore narrowing is occurring, 2) the production mode reduces the amount of fouling in the form of a gel/cake layer by applying a 10% recirculation during the cake formation phase, and 3) backwashes are not effective in removing all of the particulate matter. For the dead end configuration, fouling in the form of pore narrowing and adhesion is not apparent most likely due to the configuration. Dead end configuration typically results in the formation of cake layer at the beginning of the cycle. However, the addition of the sodium hypochlorite can also be is effective in reducing fouling caused by pore narrowing and adhesion.
Table 17. Cross-Flow Configuration (10% recirculation) – Average Permeability Decrease
Cycle Average Permeability Decrease between BW
Average Permeability decrease/min between
BW
Revised Average Permeability Decrease
between BW (extrapolated)1 0.88 0.099 1.08 2 0.87 0.097 1.06 3 0.83 0.092 1.01 4 0.93 0.101 1.13 5 0.95 0.104 1.15 6 1.00 0.109 1.22 7 1.00 0.111 1.22 8 1.01 0.113 1.24 9 0.91 0.101 1.11
Average 0.93 0.103 1.14 Table 18. Dead-End Configuration (Sodium Hypochlorite Addition) – Average Permeability Decrease
Cycle Average Permeability Decrease between BW 1 1.50 2 1.37 3 1.20 4 1.51 5 1.39 6 1.19
Average 1.36 Although the production period for the dead-end configuration was longer than for the cross-flow configuration, the permeability decrease trends indicate that operating for a longer production period does not impact the results. Because the production period for the dead-end
6436
WEFTEC®.07
Copyright 2007 Water Environment Federation. All Rights Reserved©
configuration lasted longer than that for the cross-flow configuration, the permeability decrease was extended by two minutes for the cross-flow configuration (shown in Table 17). The trend for permeability decrease between backwashes is linear, therefore the average permeability decrease per minute is used to extrapolate the production period from 16 minutes to 18 minutes.
To determine the effectiveness of backwashes, the decrease in permeability between maintenance washes for both the cross-flow configuration with 10% recirculation and the dead end configuration with sodium hypochlorite addition were tabulated and are summarized in Table 19 and Table 20; respectively. Similar to Experiment 1, the permeability measurements were not taken just prior to or just after a MW. Therefore, the decrease in permeability was calculated in the same manner as the TMP was calculated in Experiment 1.
Table 19. Backwash Method A (3 minute Duration) – Permeability Decrease Between MW Permeability (gfd/psi)
Initial Cycle MW BW Final Total Decrease
MW Conducted Prior to Cycle
1 6.90 5.10 5.10 1.80 Hypo-Caustic 2 5.97 5.19 5.19 0.78 Citric Acid 3 7.40 5.29 5.77 1.64 Hypo-Caustic 4 6.72 5.25 5.66 1.06 Citric Acid 5 8.46 5.17 5.48 2.98 Hypo-Caustic 6 6.62 5.29 5.29 1.33 Citric Acid 7 7.98 5.56 5.56 2.43 Hypo-Caustic 8 6.31 5.39 5.94 0.37 Citric Acid 9 7.93 5.07 5.77 2.15 Hypo-Caustic
Average 1.62 Table 20. Backwash Method B (2 ½ minute Duration) – Permeability Decrease Between MW
Permeability (gfd/psi) Initial Cycle
MW BW Final Total Decrease
1 7.25 4.90 6.26 0.99 2 6.69 5.33 5.77 0.91 3 6.19 4.48 5.83 0.36 4 6.96 6.47 6.73 0.23 5 6.95 5.25 6.16 0.79 6 6.52 4.65 5.78 0.74
Average 0.67 As indicated in Table 19, the decrease in permeability during the cycles operated after a sodium hypochlorite-caustic soda solution MW are higher than for the cycles operated after a citric acid solution MW. Therefore, the average decrease in permeability for each cycle where a different chemical solution is used prior to the cycle was determined and is outlined in Table 21.
6437
WEFTEC®.07
Copyright 2007 Water Environment Federation. All Rights Reserved©
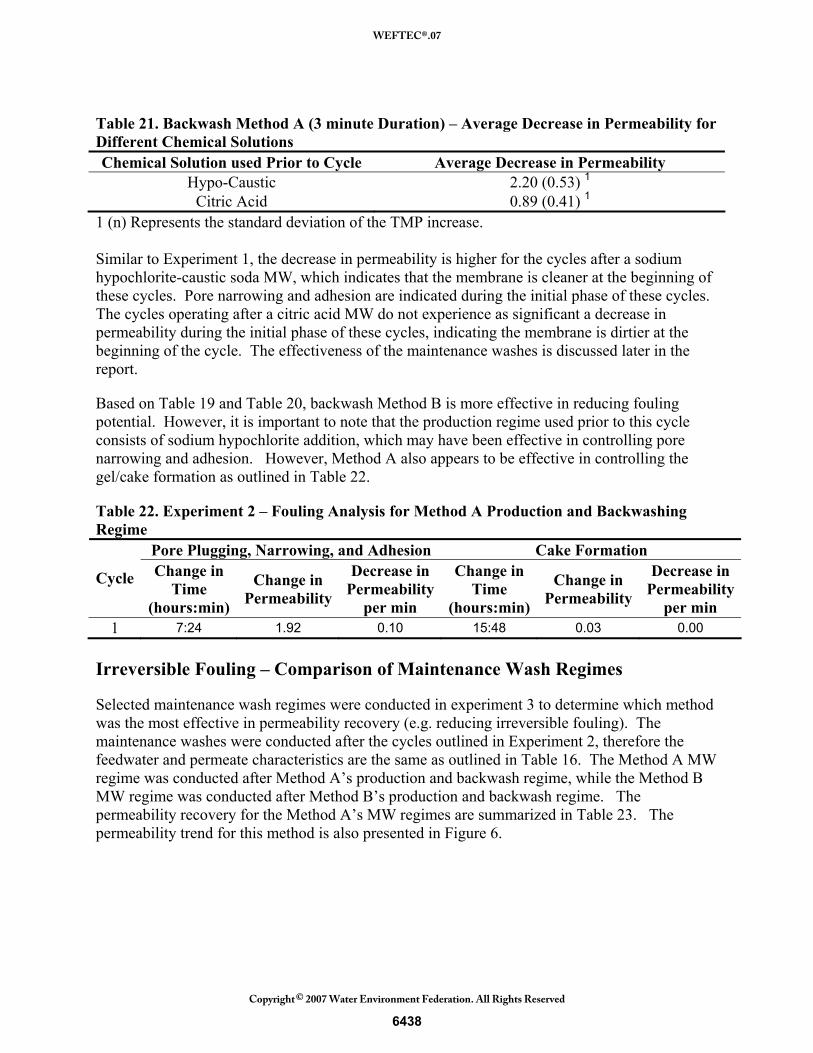
Table 21. Backwash Method A (3 minute Duration) – Average Decrease in Permeability for Different Chemical Solutions Chemical Solution used Prior to Cycle Average Decrease in Permeability
Hypo-Caustic 2.20 (0.53) 1 Citric Acid 0.89 (0.41) 1
1 (n) Represents the standard deviation of the TMP increase. Similar to Experiment 1, the decrease in permeability is higher for the cycles after a sodium hypochlorite-caustic soda MW, which indicates that the membrane is cleaner at the beginning of these cycles. Pore narrowing and adhesion are indicated during the initial phase of these cycles. The cycles operating after a citric acid MW do not experience as significant a decrease in permeability during the initial phase of these cycles, indicating the membrane is dirtier at the beginning of the cycle. The effectiveness of the maintenance washes is discussed later in the report.
Based on Table 19 and Table 20, backwash Method B is more effective in reducing fouling potential. However, it is important to note that the production regime used prior to this cycle consists of sodium hypochlorite addition, which may have been effective in controlling pore narrowing and adhesion. However, Method A also appears to be effective in controlling the gel/cake formation as outlined in Table 22.
Table 22. Experiment 2 – Fouling Analysis for Method A Production and Backwashing Regime
Pore Plugging, Narrowing, and Adhesion Cake Formation
Cycle Change in Time
(hours:min)
Change in Permeability
Decrease in Permeability
per min
Change in Time
(hours:min)
Change in Permeability
Decrease in Permeability
per min 1 7:24 1.92 0.10 15:48 0.03 0.00
Irreversible Fouling – Comparison of Maintenance Wash Regimes
Selected maintenance wash regimes were conducted in experiment 3 to determine which method was the most effective in permeability recovery (e.g. reducing irreversible fouling). The maintenance washes were conducted after the cycles outlined in Experiment 2, therefore the feedwater and permeate characteristics are the same as outlined in Table 16. The Method A MW regime was conducted after Method A’s production and backwash regime, while the Method B MW regime was conducted after Method B’s production and backwash regime. The permeability recovery for the Method A’s MW regimes are summarized in Table 23. The permeability trend for this method is also presented in Figure 6.
6438
WEFTEC®.07
Copyright 2007 Water Environment Federation. All Rights Reserved©
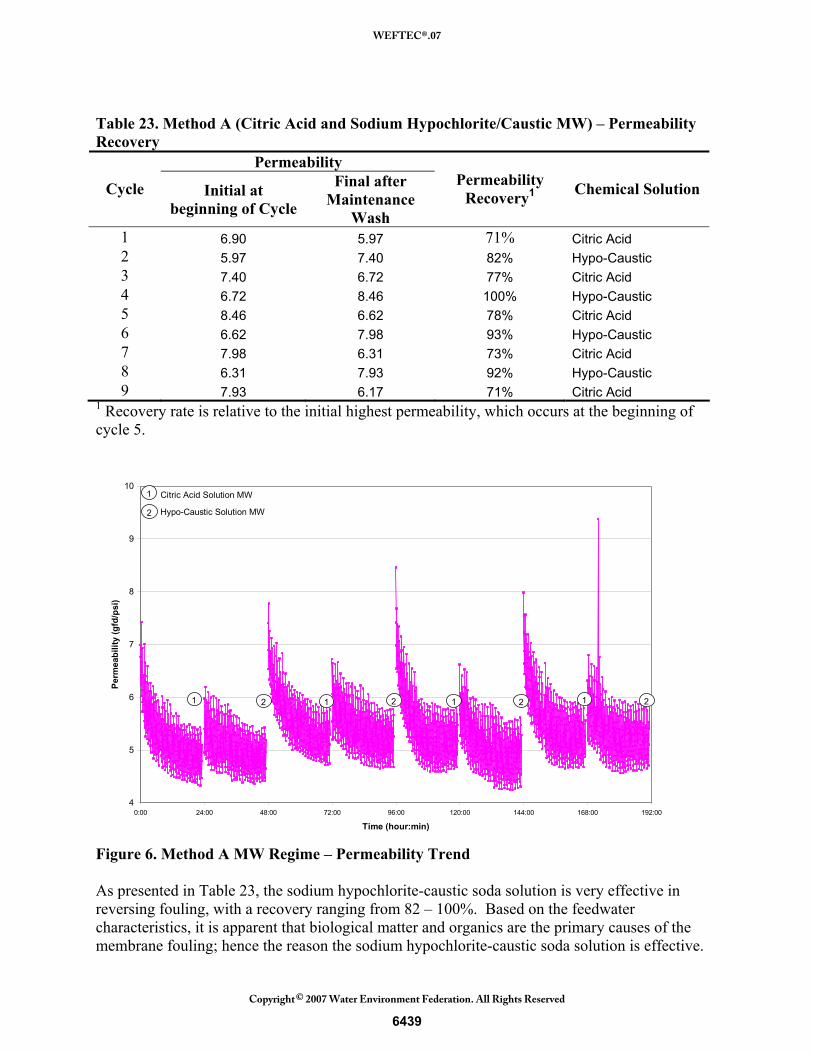
Table 23. Method A (Citric Acid and Sodium Hypochlorite/Caustic MW) – Permeability Recovery
Permeability
Cycle Initial at beginning of Cycle
Final after Maintenance
Wash
Permeability Recovery1 Chemical Solution
1 6.90 5.97 71% Citric Acid 2 5.97 7.40 82% Hypo-Caustic 3 7.40 6.72 77% Citric Acid 4 6.72 8.46 100% Hypo-Caustic 5 8.46 6.62 78% Citric Acid 6 6.62 7.98 93% Hypo-Caustic 7 7.98 6.31 73% Citric Acid 8 6.31 7.93 92% Hypo-Caustic 9 7.93 6.17 71% Citric Acid
1 Recovery rate is relative to the initial highest permeability, which occurs at the beginning of cycle 5.
4
5
6
7
8
9
10
0:00 24:00 48:00 72:00 96:00 120:00 144:00 168:00 192:00
Time (hour:min)
Perm
eabi
lity
(gfd
/psi
)
1 2
Citric Acid Solution MW
2
1
Hypo-Caustic Solution MW
1 2 1 2 1 2
Figure 6. Method A MW Regime – Permeability Trend As presented in Table 23, the sodium hypochlorite-caustic soda solution is very effective in reversing fouling, with a recovery ranging from 82 – 100%. Based on the feedwater characteristics, it is apparent that biological matter and organics are the primary causes of the membrane fouling; hence the reason the sodium hypochlorite-caustic soda solution is effective.
6439
WEFTEC®.07
Copyright 2007 Water Environment Federation. All Rights Reserved©
Although the citric acid washes are not as effective, with permeability recovery ranging from 71 – 78% (inorganic fouling caused by scaling is most likely not occurring), it appears that it could be reducing a “salt bridging” layer (the coexistence of divalent cations and NOM). This effect is allowing the sodium hypochlorite-caustic soda solution to better penetrate the fouling layer and remove organic fouling that has adsorbed within the membrane pores during the following maintenance wash.
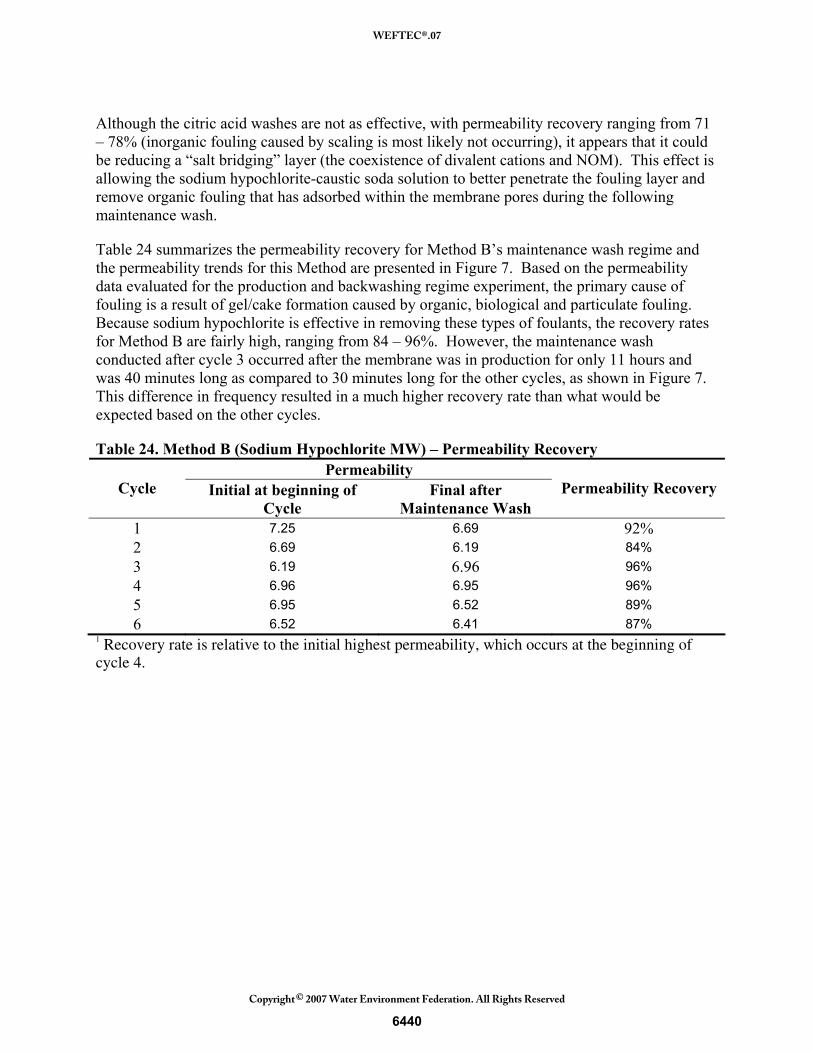
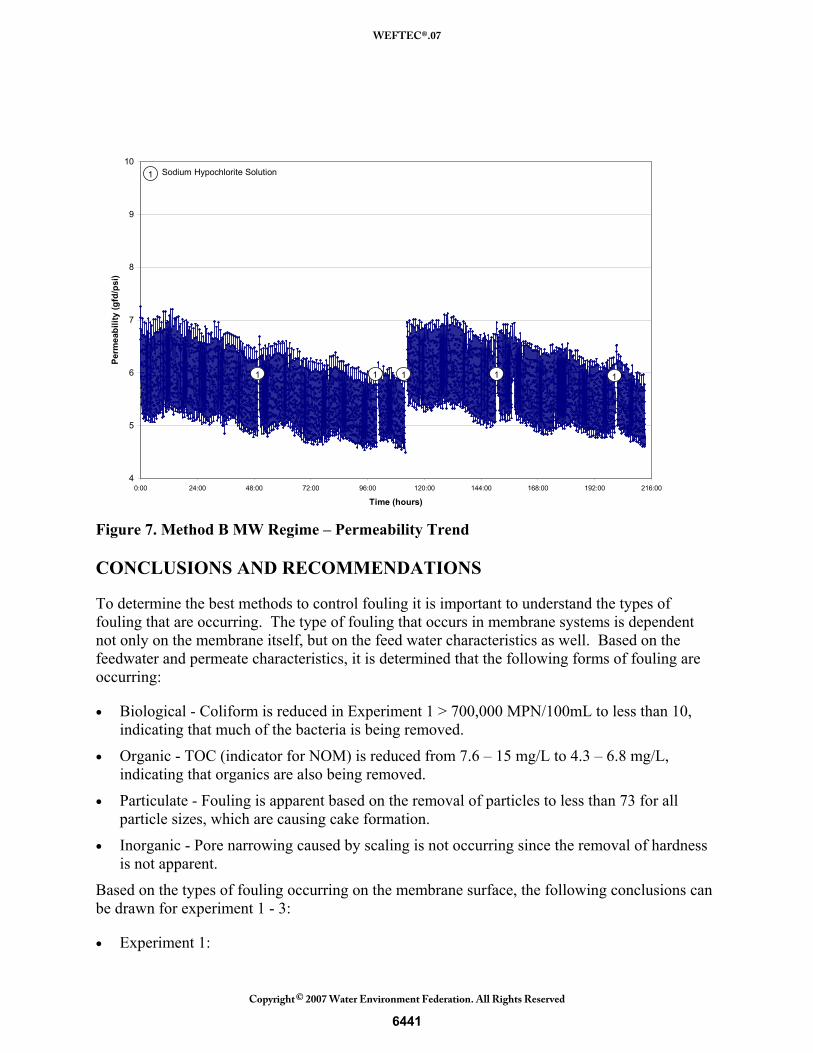
Table 24 summarizes the permeability recovery for Method B’s maintenance wash regime and the permeability trends for this Method are presented in Figure 7. Based on the permeability data evaluated for the production and backwashing regime experiment, the primary cause of fouling is a result of gel/cake formation caused by organic, biological and particulate fouling. Because sodium hypochlorite is effective in removing these types of foulants, the recovery rates for Method B are fairly high, ranging from 84 – 96%. However, the maintenance wash conducted after cycle 3 occurred after the membrane was in production for only 11 hours and was 40 minutes long as compared to 30 minutes long for the other cycles, as shown in Figure 7. This difference in frequency resulted in a much higher recovery rate than what would be expected based on the other cycles.
Table 24. Method B (Sodium Hypochlorite MW) – Permeability Recovery Permeability
Cycle Initial at beginning of Cycle
Final after Maintenance Wash
Permeability Recovery
1 7.25 6.69 92% 2 6.69 6.19 84% 3 6.19 6.96 96% 4 6.96 6.95 96% 5 6.95 6.52 89% 6 6.52 6.41 87%
1 Recovery rate is relative to the initial highest permeability, which occurs at the beginning of cycle 4.
6440
WEFTEC®.07
Copyright 2007 Water Environment Federation. All Rights Reserved©
4
5
6
7
8
9
10
0:00 24:00 48:00 72:00 96:00 120:00 144:00 168:00 192:00 216:00
Time (hours)
Perm
eabi
lity
(gfd
/psi
)
1 111 1
Sodium Hypochlorite Solution 1
Figure 7. Method B MW Regime – Permeability Trend CONCLUSIONS AND RECOMMENDATIONS
To determine the best methods to control fouling it is important to understand the types of fouling that are occurring. The type of fouling that occurs in membrane systems is dependent not only on the membrane itself, but on the feed water characteristics as well. Based on the feedwater and permeate characteristics, it is determined that the following forms of fouling are occurring:
• Biological - Coliform is reduced in Experiment 1 > 700,000 MPN/100mL to less than 10, indicating that much of the bacteria is being removed.
• Organic - TOC (indicator for NOM) is reduced from 7.6 – 15 mg/L to 4.3 – 6.8 mg/L, indicating that organics are also being removed.
• Particulate - Fouling is apparent based on the removal of particles to less than 73 for all particle sizes, which are causing cake formation.
• Inorganic - Pore narrowing caused by scaling is not occurring since the removal of hardness is not apparent.
Based on the types of fouling occurring on the membrane surface, the following conclusions can be drawn for experiment 1 - 3:
• Experiment 1:
6441
WEFTEC®.07
Copyright 2007 Water Environment Federation. All Rights Reserved©
• When operating at two different flux rates the maximum TMP is never exceeded when backwashing every 16 minutes and using a 10% recirculation during production.
• The TMP increase for each cycle (between each MW) is significantly higher when increasing the flux from 41.2 to 49.8 gfd and the increase in TMP occurs more rapidly during the pore narrowing and adhesion fouling phase.
• Recirculation and backwashes are not effective in removing fouling caused by pore narrowing and adhesion.
• At lower flux rates, cake formation occurs more rapidly after a sodium hypochlorite – caustic soda solution MW (after approximately 13 hours) than after a citric acid solution MW (after approximately 16 hours). Backwashes and recirculation are effective in removing the cake layer for both cycles.
• At higher flux rates, cake formation occurs more slowly after a sodium hypochlorite – caustic soda solution MW (after approximately 15 hours) when compared to the lower flux rate. The backwashes are fairly effective in cleaning the membrane, but there is a higher increase in TMP between backwashes when compared to lower flux rates. This indicates the 10% recirculation is not as effective in controlling fouling when operating at a higher flux rate.
• At higher flux rates, cake formation occurs after approximately 16 hours after a citric acid MW, similar to the lower flux rate. However, the TMP continues to increase during the cake formation phase, indicating that both the 10% recirculation and the backwash regimes are not effective in controlling fouling. In addition, the citric acid MW’s are not as effective (less than 100% recovery) because biological and organic fouling are the primary causes of fouling. This results in a more significant increase in TMP during the next cycle because the membrane is dirtier at the beginning of the cycle
• Alternating between a sodium hypochlorite-caustic soda solution maintenance wash and a citric acid solution maintenance wash is more effective at the lower flux rate.
• Experiment 2
• For cross-flow configuration, pore narrowing and adhesion is apparent, while for dead-end configuration it is not.
• Permeability decreases more rapidly in cross-flow configuration when compared to dead-end configuration.
• The decrease in permeability is higher for cycles operating after a sodium hypochlorite – caustic soda MW because the membranes are cleaner.
• Experiment 3:
• When operating with a dead-end configuration and a production mode using sodium hypochlorite addition, it is apparent that the sodium hypochlorite solution maintenance wash is not as effective in cleaning the membrane. However, when the maintenance wash is conducted at a frequency alternating between 50 hours and 11 hours, with the maintenance wash lasting for 40 minutes after the 11-hour cycle, the maintenance wash restores permeability by 96%.
6442
WEFTEC®.07
Copyright 2007 Water Environment Federation. All Rights Reserved©
• The sodium hypochlorite – caustic soda solution is more effective than the citric acid solution MW.
The following is a list of recommendations based on the results of the experiments and the feedwater characteristics:
• When operating in a cross-flow configuration with 10% recirculation at higher flux rates:
• Backwash more frequently if there is a cost benefit or add chemicals to prevent the biofouling during production.
• Use a sodium hypochlorite – caustic soda solution rather than the citric acid solution MW.
• When operating in dead-end configuration:
• Conduct an experiment with and without sodium hypochlorite addition into the feedwater to determine how effective the chemical addition is in controlling fouling.
• Alternate the frequency of MW’s to occur after 50 hours and then after 11 hours. Conduct the MW for 30 minutes after the 50 hour cycle and for 40 minutes after the 11 hour cycle.
• When operating in cross-flow configuration with 10% recirculation:
• Conduct an experiment with the addition of sodium hypochlorite in the feedwater to determine if pore narrowing and adhesion can be reduced.
REFERENCES
Abidine, N., Bacchin, P., Bessiere, Y. (2005), “Low fouling conditions in dead-end filtration: Evidence for a critical filtered volume and interpretation using critical osmotic pressure”. J. of Mem. Sci. 264, 37-47.
AWWARF (1996), “Water Treatment Processes”. AWWA Research Foundation, Lyonnaise des Eaux, Water Research Commission of South Africa. McGraw Hill, NY.
Bourgeous, K., G. Tchobanoglous and J. Darby (1999), “Performance Evaluation of the Koch Ultrafiltration (UF) Membrane System for Wastewater Reclamation”. Center for Environmental and Water Resources Engineering, Department of Civil and Environmental Engineering, University of California, Davis.
Bourgeous, K., and J. Darby and G. Tchobanoglous (2001), “Ultrafiltration of wastewater: Effects of particles, mode of operation and backwash effectiveness”. Wat. Res. 35(1), 77-90.
Chang, Yu-Jung and Benjamin, Mark M. (2003), “Modeling formation of natural organic matter fouling layers on ultrafiltration membranes”. J. of Env. Eng., 129, 25-32.
Cheryan, M. (1998), “Ultrafiltration and Microfiltration Handbook”. Technomic Publishing Co. Inc., Lancaster, PA.
Escobar, I.C., Peng, Weihua, White, Donald B. (2005), “Effects of water chemistries and properties of membrane on the performance and fouling – a model development study”. J. of Mem. Sci. 238, 33-46.
6443
WEFTEC®.07
Copyright 2007 Water Environment Federation. All Rights Reserved©
Escobar, I.C., Sharp, M.M. (2006), “Effects of dynamic or secondary-layer coagulation on Ultrafiltration”. Desal. 186, 239-249.
Fan, Linhua et al. (2000), “Influence of the characteristics of natural organic matter on the fouling of microfiltration membranes”. Wat. Res. 35(18), 4455-4463.
Fane et al. (2002), “Submerged hollow fibre membrane module – Design options and operational considerations”. Desal. 146(1-3), 231-236.
Freeman, Scott D.N., Morin, O.J. (1995), “Recent developments in membrane water reuse projects”. Desal. 103, 19-30.
Hong, S. and Elimelech, M. (1997), “Chemical and physical aspects of natural organic matter (NOM) fouling of nanofiltration membranes”. J. Mem. Sci. 132, 159-181.
Katsoufidou, K. Yiantsios, S.G., Karabelas, A.J. (2005), “A study of ultafiltration membrane fouling by humic acids and flux recovery by backwashing: Experiments and modeling”. J. Mem. Sci. 266, 40-50.
Liu, C., Caothien, S., Hayes, J., Caohuy, T., and Otoyo, T. (2001), “Membrane Chemical Cleaning: From Art to Science”. Proceedings of Membrane Technology Conference, March 4-7, San Antonio, TX.
Lozier, J. (2000), “Two approaches to indirect potable reuse using membrane technology”. Wat. Sci. Tech. 41(10-11), 149-156.
Pall Corporation water treatment products page. http:/www.pall.com/water.asp (accessed February 2004 through April 2006).
Reith, Colin and Birkenhead, Brian (1998), “Membranes enabling the affordable and cost effective reuse of wastewater as an alternative water source”. Desal. 117, 203-210.
Sheikholeslami, R. (1999), “Composite fouling – Inorganic and biological: A review”. Environmental Progess 18 (2), 113-122.
Shim, Jin Kie, Yoo, Ik-Keun, Lee, Young Moo (2002), “Design and operation considerations for wastewater treatment using a flat submerged membrane bioreactor”. Process Biochemistry 38, 279-285.
Stephenson et al. (2000), “Membrane Bioreactors for Wastewater Treatment”. IWA Publishing. Tchobanoglous, G., J. Darby, K. Bourgeous, J. McArdle, P Genest, and M. Tylla (1998),
“Ultrafiltration as an advanced tertiary treatment process for municipal wastewater”. Desal. 119, 315-322.
Tchobanoglous, G., F. Burton and H. D. Sensel (2003), “Wastewater Engineering: Treatment and Reuse / Metcalf & Eddy, Inc. – 4th ed.”. McGraw-Hill, NY.
Thompson, M.A., et al. (1996), “Manual on Membrane Processes for Drinking Water Treatment, Revision 1.1”. Technical Publication for Malcolm Pirnie.
Vera, L., Villarroel, R., Delgado, S. and Elmaleh, S. (2000), “Enhancing microfiltration through an inorganic tubular membrane by gas sparging”. J. of Mem. Sci., 165, 47-57.
Wahval, Dattatray S. and Fisher, Ellen R. (2002), “Hydrophilic modification of polyethersulfone membranes by low temperature plasma-induced graft polymerization”. J. Mem. Sci. 209, 255-269.
Zydney, Andrew L and Ho, Chia-Chi (2003), “Effect of membrane morphology on system capacity during normal flow microfiltration”. Biotechnology and Bioengineering 83(5), 437-543.
6444
WEFTEC®.07
Copyright 2007 Water Environment Federation. All Rights Reserved©