Embed Size (px)
Citation preview
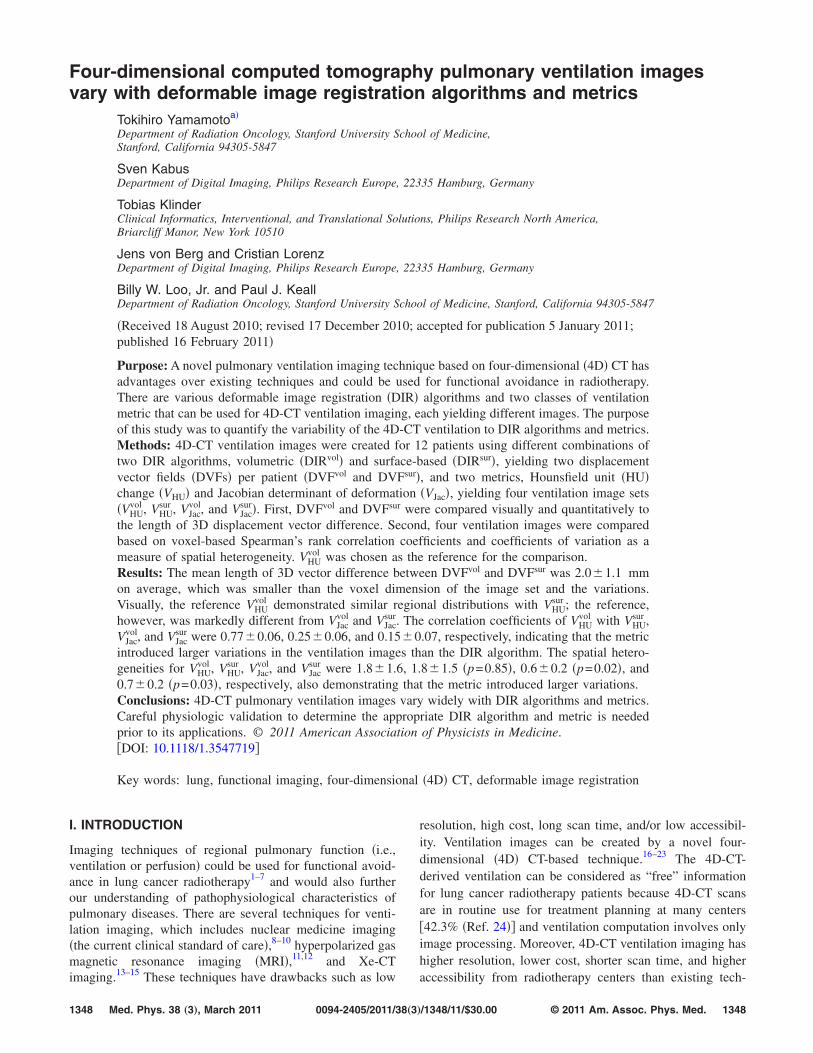
Four-dimensional computed tomography pulmonary ventilation imagesvary with deformable image registration algorithms and metrics
Tokihiro Yamamotoa!
Department of Radiation Oncology, Stanford University School of Medicine,Stanford, California 94305-5847
Sven KabusDepartment of Digital Imaging, Philips Research Europe, 22335 Hamburg, Germany
Tobias KlinderClinical Informatics, Interventional, and Translational Solutions, Philips Research North America,Briarcliff Manor, New York 10510
Jens von Berg and Cristian LorenzDepartment of Digital Imaging, Philips Research Europe, 22335 Hamburg, Germany
Billy W. Loo, Jr. and Paul J. KeallDepartment of Radiation Oncology, Stanford University School of Medicine, Stanford, California 94305-5847
!Received 18 August 2010; revised 17 December 2010; accepted for publication 5 January 2011;published 16 February 2011"
Purpose: A novel pulmonary ventilation imaging technique based on four-dimensional !4D" CT hasadvantages over existing techniques and could be used for functional avoidance in radiotherapy.There are various deformable image registration !DIR" algorithms and two classes of ventilationmetric that can be used for 4D-CT ventilation imaging, each yielding different images. The purposeof this study was to quantify the variability of the 4D-CT ventilation to DIR algorithms and metrics.Methods: 4D-CT ventilation images were created for 12 patients using different combinations oftwo DIR algorithms, volumetric !DIRvol" and surface-based !DIRsur", yielding two displacementvector fields !DVFs" per patient !DVFvol and DVFsur", and two metrics, Hounsfield unit !HU"change !VHU" and Jacobian determinant of deformation !VJac", yielding four ventilation image sets!VHU
vol , VHUsur , VJac
vol, and VJacsur". First, DVFvol and DVFsur were compared visually and quantitatively to
the length of 3D displacement vector difference. Second, four ventilation images were comparedbased on voxel-based Spearman’s rank correlation coefficients and coefficients of variation as ameasure of spatial heterogeneity. VHU
vol was chosen as the reference for the comparison.Results: The mean length of 3D vector difference between DVFvol and DVFsur was 2.0!1.1 mmon average, which was smaller than the voxel dimension of the image set and the variations.Visually, the reference VHU
vol demonstrated similar regional distributions with VHUsur ; the reference,
however, was markedly different from VJacvol and VJac
sur. The correlation coefficients of VHUvol with VHU
sur ,VJac
vol, and VJacsur were 0.77!0.06, 0.25!0.06, and 0.15!0.07, respectively, indicating that the metric
introduced larger variations in the ventilation images than the DIR algorithm. The spatial hetero-geneities for VHU
vol , VHUsur , VJac
vol, and VJacsur were 1.8!1.6, 1.8!1.5 !p=0.85", 0.6!0.2 !p=0.02", and
0.7!0.2 !p=0.03", respectively, also demonstrating that the metric introduced larger variations.Conclusions: 4D-CT pulmonary ventilation images vary widely with DIR algorithms and metrics.Careful physiologic validation to determine the appropriate DIR algorithm and metric is neededprior to its applications. © 2011 American Association of Physicists in Medicine.#DOI: 10.1118/1.3547719$
Key words: lung, functional imaging, four-dimensional !4D" CT, deformable image registration
I. INTRODUCTION
Imaging techniques of regional pulmonary function !i.e.,ventilation or perfusion" could be used for functional avoid-ance in lung cancer radiotherapy1–7 and would also furtherour understanding of pathophysiological characteristics ofpulmonary diseases. There are several techniques for venti-lation imaging, which includes nuclear medicine imaging!the current clinical standard of care",8–10 hyperpolarized gasmagnetic resonance imaging !MRI",11,12 and Xe-CTimaging.13–15 These techniques have drawbacks such as low
resolution, high cost, long scan time, and/or low accessibil-ity. Ventilation images can be created by a novel four-dimensional !4D" CT-based technique.16–23 The 4D-CT-derived ventilation can be considered as “free” informationfor lung cancer radiotherapy patients because 4D-CT scansare in routine use for treatment planning at many centers#42.3% !Ref. 24"$ and ventilation computation involves onlyimage processing. Moreover, 4D-CT ventilation imaging hashigher resolution, lower cost, shorter scan time, and higheraccessibility from radiotherapy centers than existing tech-
1348 1348Med. Phys. 38 „3…, March 2011 0094-2405/2011/38„3…/1348/11/$30.00 © 2011 Am. Assoc. Phys. Med.
niques and could potentially be used routinely for functionalavoidance.6,7 Its physiologic accuracy has been investigatedby comparison with the Xe-CT ventilation for anesthetizedsheep, which has demonstrated reasonablecorrelations.20,25,26 Also, the single photon emission CT!SPECT" ventilation has been used in another study for tho-racic cancer patients, which has reported low Dice similaritycoefficients but relatively high in low-functional regions.22
Physiologically accurate 4D-CT ventilation imaging has notbeen achieved in patients and further studies are necessary.
There are various deformable image registration !DIR"algorithms and two classes of ventilation metric that can beused for 4D-CT ventilation imaging.16–23 Several DIR algo-rithms are currently under investigation and have been de-veloped, of which the transformation model ranges in com-plexity from a simple extension of a global affinetransformation using higher order polynomials with rela-tively few parameters to a completely local or free formmodel with a number of parameters where each voxel in theimage can move independently. Also, there are two classes ofsimilarity metric commonly used for DIR: Geometry-basedand intensity-based. Recently, two multi-institution studieswere conducted to evaluate the accuracy of various DIR al-gorithms using the same CT images of a deformable thoraxphantom with plastic markers27 or a lung cancer patient.28
They compared the locations of the transformed and actuallandmarks, i.e., markers27 or bronchial bifurcations,28 andfound overall acceptable accuracy with the mean error rang-ing from 1.5 to 3.9 mm !vector length" for the phantom27 orfrom 0.7 to 1.9 mm #superior-inferior !SI" direction$ for thepatient.28 However, both studies showed large variations inthe maximum error ranging from 5.1 to 15.4 mm !vector" forthe phantom27 or from 2.0 to 7.8 mm !SI" for the patient.28
Furthermore, Kabus et al.29 demonstrated that six differentDIR algorithms, which had similar and small mean landmarkregistration errors ranging from 1.0 to 1.4 mm, yielded vary-ing displacement vector fields !DVFs" in regions apart fromthe landmarks. Such variations in the DIR results may influ-ence 4D-CT ventilation imaging.
Two classes of ventilation metric have been used for4D-CT ventilation imaging: Hounsfield unit !HU"change16,17,19,22,23,26,30 and Jacobian determinant ofdeformation.19,20,22,23,26,30 Both metrics are based on the as-sumptions that regional ventilation is proportional to the re-gional volume change. However, clear discrepancies be-tween the metrics have been reported by severalinvestigators.22,26,30 Recently, Castillo et al.22 demonstratedlow Dice similarity coefficients between the two metrics forthe segmented functional lung regions in thoracic cancer pa-tients. Castillo et al.22 and Yamamoto et al.30 demonstrated ahigher potential of the HU metric than the Jacobian metric incomparison with the SPECT ventilation and emphysematousvolume for patients, respectively. Moreover, Ding et al.26
proposed a hybrid metric combining the two metrics anddemonstrated consistently higher correlations with theXe-CT ventilation than the HU metric for anesthetizedsheep. These discrepancies between the metrics obviouslyinfluence 4D-CT ventilation imaging.
The purpose of this study was to quantify the variabilityof the 4D-CT ventilation to DIR algorithms and metrics.There has been no literature that has comprehensively quan-tified its variability to both DIR algorithms and metrics, eventhough there have been studies reporting the discrepanciesbetween the metrics as described above. We have comparedfour 4D-CT ventilation image sets computed with differentcombinations of two DIR algorithms, volumetric !DIRvol"and surface-based !DIRsur", that are fundamentally differentfrom each other and represent two broad classes of algorithmand two ventilation metrics, HU change !VHU" and JacobianVJac, that are the only two proposed classes of metric.
II. METHODS AND MATERIALS
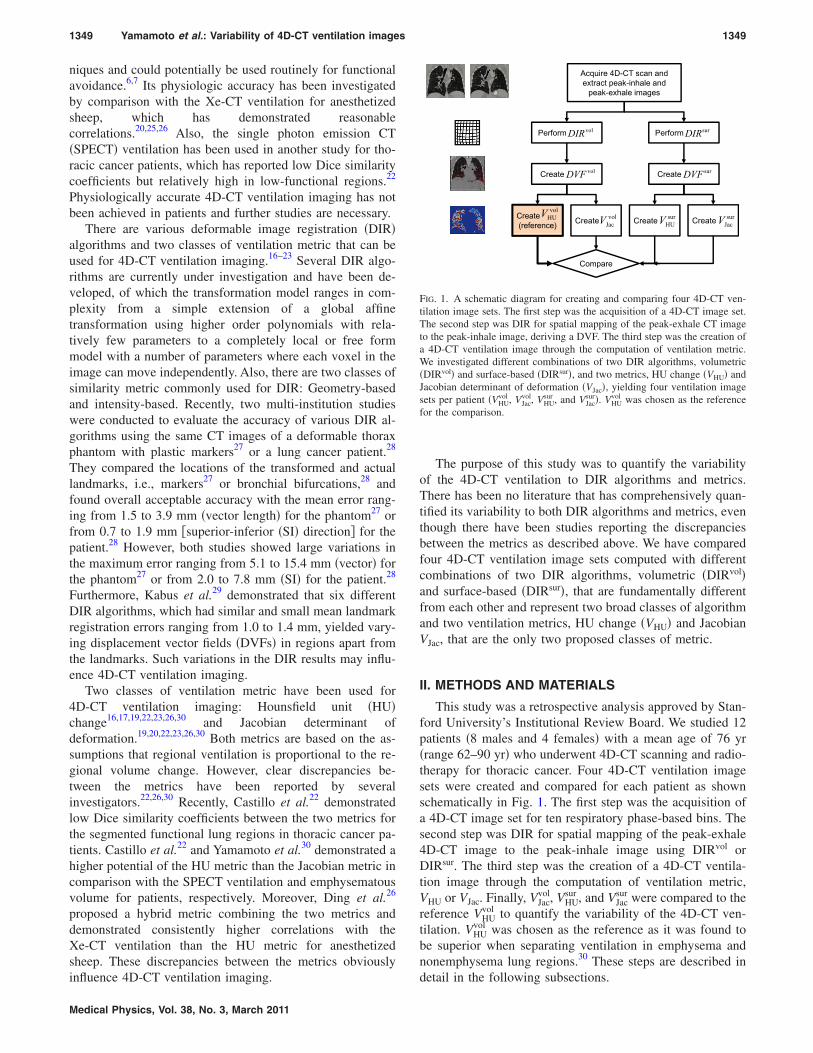
This study was a retrospective analysis approved by Stan-ford University’s Institutional Review Board. We studied 12patients !8 males and 4 females" with a mean age of 76 yr!range 62–90 yr" who underwent 4D-CT scanning and radio-therapy for thoracic cancer. Four 4D-CT ventilation imagesets were created and compared for each patient as shownschematically in Fig. 1. The first step was the acquisition ofa 4D-CT image set for ten respiratory phase-based bins. Thesecond step was DIR for spatial mapping of the peak-exhale4D-CT image to the peak-inhale image using DIRvol orDIRsur. The third step was the creation of a 4D-CT ventila-tion image through the computation of ventilation metric,VHU or VJac. Finally, VJac
vol, VHUsur , and VJac
sur were compared to thereference VHU
vol to quantify the variability of the 4D-CT ven-tilation. VHU
vol was chosen as the reference as it was found tobe superior when separating ventilation in emphysema andnonemphysema lung regions.30 These steps are described indetail in the following subsections.
Acquire 4D-CT scan andextract peak-inhale andpeak-exhale images
Perform Perform surDIRvolDIR
Create Create surDVFvolDVF
Create(reference) Create Create Createsur
HUVsurJacV
volHUV vol
JacV
Compare
FIG. 1. A schematic diagram for creating and comparing four 4D-CT ven-tilation image sets. The first step was the acquisition of a 4D-CT image set.The second step was DIR for spatial mapping of the peak-exhale CT imageto the peak-inhale image, deriving a DVF. The third step was the creation ofa 4D-CT ventilation image through the computation of ventilation metric.We investigated different combinations of two DIR algorithms, volumetric!DIRvol" and surface-based !DIRsur", and two metrics, HU change !VHU" andJacobian determinant of deformation !VJac", yielding four ventilation imagesets per patient !VHU
vol , VJacvol, VHU
sur , and VJacsur". VHU
vol was chosen as the referencefor the comparison.
1349 Yamamoto et al.: Variability of 4D-CT ventilation images 1349
Medical Physics, Vol. 38, No. 3, March 2011
II.A. 4D-CT scans
The first step of 4D-CT ventilation imaging was the ac-quisition of a 4D-CT image set for ten respiratory phase-based bins. At Stanford, 4D-CT scans are in routine use forthoracic and abdominal cancer. We acquired 4D-CT scans onthe Discovery ST multislice PET/CT scanner !GE MedicalSystems, Waukesha, WI" in cine mode with the real-timeposition management !RPM" system !Varian Medical Sys-tems, Palo Alto, CA" to record patient respiratory traces.Scan parameters were set as follows: 120 kVp, approxi-mately 100 mA s per slice, 0.5 s gantry rotation, 0.45 s cineinterval, and 2.5 mm slice thickness, as used clinically in ourradiation oncology department. The GE ADVANTAGE 4D soft-ware was used to create a 4D-CT image set by sorting raw4D-CT slices correlated with the RPM data into ten respira-tory phase-based bins !i.e., 0% to 90% at 10% intervals". Weused paired 4D-CT images at the peak-exhale and peak-inhale phases for ventilation computation.
II.B. DIR
The second step of 4D-CT ventilation imaging was DIRfor spatial mapping of the peak-exhale 4D-CT image to thepeak-inhale image, deriving a DVF. We investigated DIRvol
!Ref. 31" and DIRsur !Ref. 32" in this study. The rationale isthat these two algorithms are fundamentally different fromeach other and represent two broad classes of algorithm.DIRvol is based on a nonparametric transformation and triesto find a DVF that minimizes both a similarity function !i.e.,the sum of squared difference between the peak-inhale anddeformed peak-exhale images" and a regularizing term !i.e.,elastic regularizer" based on the Navier–Lamé equation. Theregistration problem is well-posed through the addition ofthe regularizing term. The elastic regularizer assumes thatthe underlying images can be characterized as an elastic andcompressible material. Further details on DIRvol have beendescribed by Kabus and Lorenz.31 DIRsur is based on a de-formable surface model that is applied to a fractal isosurfacegenerated in the peak-exhale domain to be propagated to thepeak-inhale domain by minimizing an energy term, which isfollowed by thin plate spline transformation to create a denseDVF. The energy term consists of the external and internalenergies. The external energy attracts the vertices of the sur-
face model to image gradients, while the internal energy pre-serves the shape similarity to the initial peak-exhale model.Further details on DIRsur have been described by von Berg etal.32 From a methodological point of view, it is therefore notexpected that the DVFs or ventilation images derived fromthese two DIR algorithms are similar to each other. Kabus etal.19 validated the geometric accuracy of DIRvol and DIRsur
by evaluating the distances between landmark positions !i.e.,vessel and bronchial bifurcations" at two different respiratoryphases with and without DIR for four thoracic CT data sets,which were reduced from 6.0!4.0 to 2.3!1.9 mm forDIRvol and to 2.5!2.2 mm for DIRsur. We also performedvalidation using a publicly available data set of five caseswith 300 landmarks for each.33 The distances were reducedfrom 6.5!2.4 to 1.3!0.3 mm for DIRvol and to1.4!0.3 mm for DIRsur !unpublished data". Note that DIRalgorithms with similar landmark registration errors do notnecessarily give similar DVFs or ventilation images. DIRvol
and DIRsur yielded varying DVFs in regions apart from thelandmarks, despite having similar and small mean landmarkregistration errors overall, which motivated the further inves-tigation of these two algorithms. The same algorithm param-eters used in the above validation studies were employed forboth DIRvol and DIRsur in the current study.
II.C. Ventilation metrics
The final step of 4D-CT ventilation imaging was the cre-ation of a ventilation image at the peak-exhale phase throughquantitative analysis of the DVF. We investigated the HUchange16,17,19,22,23,26,30 and Jacobian,19,20,22,23,26,30 which werethe only two classes of ventilation metric proposed previ-ously. Both metrics are based on the assumptions that re-gional ventilation is proportional to the regional volumechange, which is supported by the literature, i.e., the HUmetric25 and Jacobian metric20 were found to have reason-able correlations with Xe-CT-measured regional ventilationin sheep. For the HU metric, Simon34 originally derived arelationship between the local change in fractional air con-tent and local volume change, which was adapted to the re-lationship between the local HU density change and localvolume change by Guerrero et al.16 The exhale-to-inhale vol-ume change !"Vol" normalized by the exhale air volume!Volex
air" in the voxel at location !x ,y ,z" is given by
"Vol
Volexair!x,y,z"
= 1000HUin%x + ux!x,y,z",y + uy!x,y,z",z + uz!x,y,z"& ! HUex!x,y,z"
HUex!x,y,z"#HUin%x + ux!x,y,z",y + uy!x,y,z",z + uz!x,y,z"& + 1000$, !1"
where HU is the HU value and u is the displacement vector mapping the voxel at location !x ,y ,z" of the peak-exhale imageto the corresponding location of the peak-inhale image. Note that the air and tissue densities were assumed to be #1000 and0 HU, respectively. To date, Eq. !1" has been used as ventilation metric by many investigators.17,19,22,23,25,26 In this study,however, the value independent of the initial air volume was defined as the HU ventilation metric !VHU" to make a faircomparison with the Jacobian metric !VJac". The exhale air volume !Volex
air" in the voxel at location !x ,y ,z" can be estimated by
1350 Yamamoto et al.: Variability of 4D-CT ventilation images 1350
Medical Physics, Vol. 38, No. 3, March 2011
Volexair!x,y,z" = !
HUex!x,y,z"1000
Volexvoxel!x,y,z" , !2"
where Volexvoxel is the exhale voxel volume.35 Substitution of Eq. !2" into Eq. !1" yields
"Vol =HUex!x,y,z" ! HUin%x + ux!x,y,z",y + uy!x,y,z",z + uz!x,y,z"&
#HUin%x + ux!x,y,z",y + uy!x,y,z",z + uz!x,y,z"& + 1000$Volex
voxel!x,y,z" . !3"
Given that Volexvoxel is the same for all voxels, VHU was defined as
VHU!x,y,z" =HUex!x,y,z" ! HUin%x + ux!x,y,z",y + uy!x,y,z",z + uz!x,y,z"&
#HUin%x + ux!x,y,z",y + uy!x,y,z",z + uz!x,y,z"& + 1000$. !4"
A mass correction was applied to HUin to account for the difference in CT-derived lung mass, which would be due to thechanges in the blood distribution between exhale and inhale in the same manner as Guerrero et al.17 HUex and HUin at the samelocation of the deformed peak-exhale and peak-inhale images were used to compute VHU, which was mapped back to theoriginal peak-exhale image domain to create a 4D-CT ventilation image. Given that VHU was based on HU values andinfluenced by the statistical noise, the 4D-CT images were smoothed using an isotropic Gaussian filter kernel before computingVHU. For the Jacobian metric, the Jacobian determinant !J" of the displacement vector u is given by
J!x,y,z" = '1 +"ux!x,y,z"
"x
"ux!x,y,z""y
"ux!x,y,z""z
"uy!x,y,z""x
1 +"uy!x,y,z"
"y
"uy!x,y,z""z
"uz!x,y,z""x
"uz!x,y,z""y
1 +"uz!x,y,z"
"z
' . !5"
The volume of voxel deformed into the inhale phase!Volin
voxel" can be estimated by
Volinvoxel = Volex
voxelJ!x,y,z" . !6"
The exhale-to-inhale volume change !"Vol" is expressed as
"Vol = Volinvoxel ! Volex
voxel = Volexvoxel%J!x,y,z" ! 1& . !7"
Given that Volexvoxel is the same for all voxels, we defined the
Jacobian metric !VJac" as
VJac!x,y,z" = J!x,y,z" ! 1. !8"
For both VHU and VJac, a value of zero corresponds to localvolume preservation !i.e., zero ventilation". A value smallerthan zero indicates local contraction and a value larger thanzero indicates local expansion. Thus, four 4D-CT ventilationimage sets, VHU
vol , VJacvol, VHU
sur , and VJacsur, were created per patient
for 12 patients.The VHU or VJac values outside the segmented lung paren-
chyma volumes have been zeroed. The lung volume wassegmented by delineating lung voxels, of which the HU val-ues were smaller than a threshold of #600 in a similar man-ner to Shikata et al.,36 within the lung outlines generated bythe model-based segmentation of the Pinnacle3 treatmentplanning system !Philips Radiation Oncology Systems,Fitchburg, WI". Manual trimming of the central airways andgreat vessels was also performed where necessary. To inves-tigate the spatial characteristics of variability in the DVF and4D-CT ventilation, the segmented lung volumes were further
divided into the following subregions: Upper vs lower, cen-tral vs peripheral, or core vs rind. First, the midst level of thesegmented lung volume in the SI direction was identified andthen the volumes above and below this level were defined asthe upper and lower regions, respectively. Second, the midstlevel of the segmented lung volume in the left-right directionwas identified for each of the right and left lungs on the sliceclosest to the SI midst level and then the proximal and distalvolumes were defined as the central and peripheral regions,respectively. Third, the segmented lung volume were con-tracted by 1.5 cm to define the core region, which was sub-tracted from the original volume to define the rind region.
II.D. Variability quantification
First, DVFvol and DVFsur were compared visually andquantitatively with the length of 3D displacement vector dif-ference. Second, VJac
vol, VHUsur , and VJac
sur were compared to thereference VHU
vol to quantify the variability of the 4D-CT ven-tilation. We quantified the variability of the regional distribu-tion based on the voxel-based Spearman’s rank correlationcoefficients between VHU
vol and VJacvol, VHU
sur , or VJacsur. Also, we
quantified the variability of the spatial heterogeneity basedon the coefficient of variation !CoV", i.e., the ratio of thestandard deviation to the mean, of the 4D-CT ventilationvalues for each image. There has been an increasing need fora more comprehensive understanding of the functional het-erogeneity for pulmonary diseases, especially for asthma37
and chronic obstructive pulmonary disease,38 and CoV has
1351 Yamamoto et al.: Variability of 4D-CT ventilation images 1351
Medical Physics, Vol. 38, No. 3, March 2011
been used as a measure of heterogeneity by manyinvestigators.39–42 Statistical analyses were performed to testwhether CoV of VHU
vol is significantly different from that ofVJac
vol, VHUsur , or VJac
sur !p$0.05" using the two-tailed t-test. Fur-thermore, the spatial characteristics of variability in the DVFand 4D-CT ventilation were also investigated using the vol-umes of lung subregions.
III. RESULTS
III.A. Comparison between two DVFs and four 4D-CTventilation images for example patients
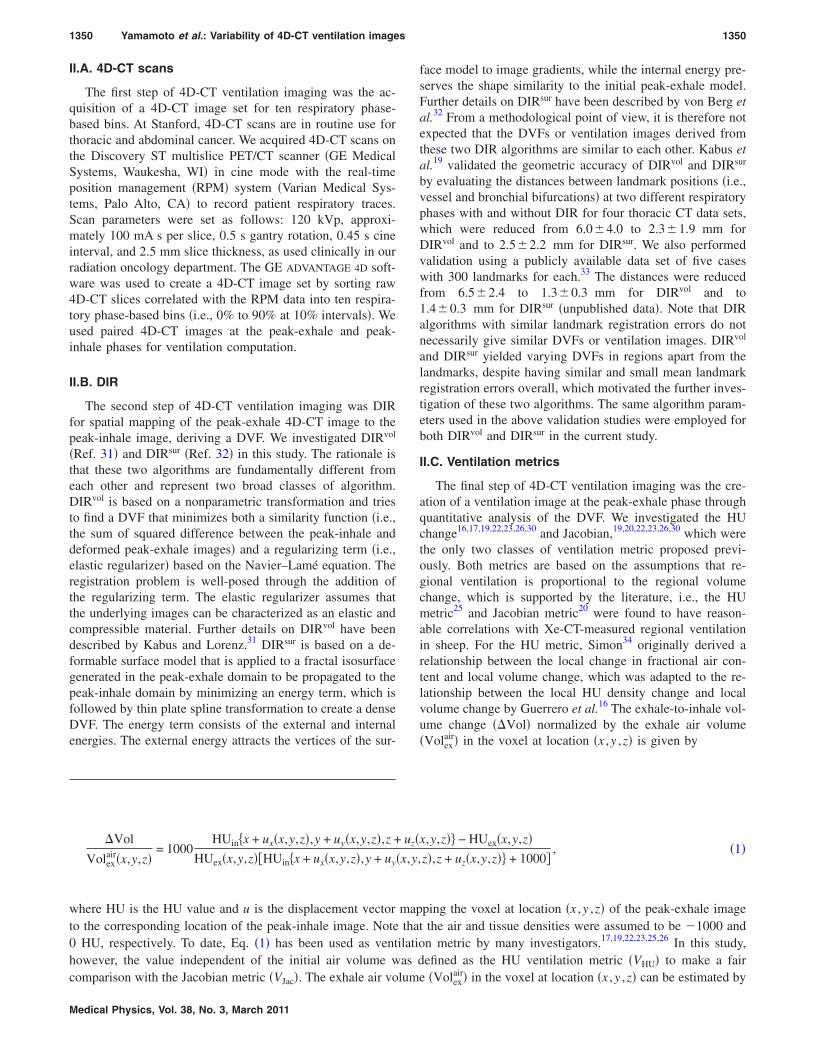
Figure 2 shows example images of the 4D-CT, DVFs, and4D-CT ventilation for patient 1, showing the second highestcorrelation between VHU
vol and VHUsur . From visual inspection,
(a)
1
1.5
bability
Difference
volDVF
(mm) (mm)
(b) surDVF
0 5 10 150
0.5
Vector length (mm)
Prob
volDVF surDVF(z-direction) (z-direction)
Difference(3D)
V(c)
volHUV
surHUV
volJacV
surJacV
volHU
surHU
surHU VV !=" vol
HUvolJac
volJac VV !=" vol
HUsurJac
surJac VV !="
1 1 1
volHUV
-1 -0.5 0 0.5 1-1
-0.5
0
0.5
r = 0.85-1 -0.5 0 0.5 1-1
-0.5
0
0.5
r = 0.19-1 -0.5 0 0.5 1-1
-0.5
0
0.5
r = 0.13
volJacV
surHUV
surJacV
FIG. 2. !a" Example coronal image of peak-exhale 4D-CT for patient 1, showing the second highest correlation between VHUvol and VHU
sur . !b" Two DVFs !DVFvol
and DVFsur" in the z-direction and length of 3D displacement vector difference between these two DVFs. Probability density functions are also shown. !c" Four4D-CT ventilation images !VHU
vol , VHUsur , VJac
vol, and VJacsur". The difference !"" from the reference !VHU
vol " and scatter plot for the voxel-based relationship with VHUvol
are also shown for each of VHUsur , VJac
vol, or VJacsur. All images correspond to the same level.
1352 Yamamoto et al.: Variability of 4D-CT ventilation images 1352
Medical Physics, Vol. 38, No. 3, March 2011
different DIR algorithms yielded similar DVFs with a meanlength of 3D displacement vector difference of 0.8!0.6 mm#Fig. 2!b"$. The vector differences showed spatial character-istics, e.g., the upper lung region demonstrated smaller dif-ferences !0.5!0.3 mm" than in the lower region!1.1!0.7 mm". Different DIR algorithms yielded spatiallysimilar 4D-CT ventilation images; however, different metricsyielded variant ventilation images #Fig. 2!c"$. Specifically, incomparing VHU
vol with VHUsur , the two images demonstrated simi-
lar regional distributions with a high Spearman voxel-basedcorrelation coefficient of 0.85. The ventilation differencesshowed no clear spatial characteristics !e.g., mean ventilationdifference, upper 0.11!1.15 vs lower 0.12!0.79", probablybecause most vector differences were smaller than the voxeldimension of the image set and did not manifest as remark-able differences in ventilation. The heterogeneities were alsocomparable, i.e., the CoV was 6.4 for VHU
vol and 6.0 for VHUsur .
In comparing VHUvol with VJac
vol, the two images demonstratedsignificantly different regional distributions with a low cor-relation coefficient of 0.19. There were some reasonableagreements in the right and left lower regions !medium tohigh ventilation", for example; however, disagreements weremore obvious and were observed throughout the lungs. VJac
vol
demonstrated a much lower heterogeneity !CoV=1.1" thanVHU
vol , which was reflected in less scattered distributions of thescatter plot. In comparing VHU
vol with VJacsur, the two images
demonstrated different regional distributions similarly to VJacvol
with the lowest correlation of 0.13. The difference image wasalso comparable to that of VJac
vol, indicating that different re-gional distributions of ventilation were dominated by the dif-ference in the metric rather than in the DIR algorithm. TheCoV of VJac
sur was 1.1. Figure 3 shows another example im-ages for patient 11, showing the second lowest correlationbetween VHU
vol and VHUsur . Visually, the ventilation difference
between VHUvol and VHU
sur #Fig. 3!c"$ was found to be similar tothe DVF difference #Fig. 3!b"$, unlike patient 1. Smaller dif-ferences were observed in the upper region !vector difference1.8!1.3 mm; ventilation difference 0.12!0.19" than in thelower region !4.4!3.2 mm; 0.19!0.20". Most DVF differ-ences in the lower region !especially the lower left" werelarger than the voxel dimension of the image set and hencewere considered to manifest as remarkable differences inventilation, indicating the need for accurate DIR algorithms.For VJac
vol and VJacsur, disagreements were found throughout the
lungs and the difference images were comparable to eachother similarly to patient 1. The differences between VHU
vol andVJac
sur in the lower left region were slightly smaller than thosebetween VHU
vol and VJacvol. This was attributed to the fact that
VHUsur and VJac
vol were smaller and larger, respectively, comparedto VHU
vol in the left lower region, which were canceled eachother out and manifested as relatively smaller differencesbetween VHU
vol and VJacsur.
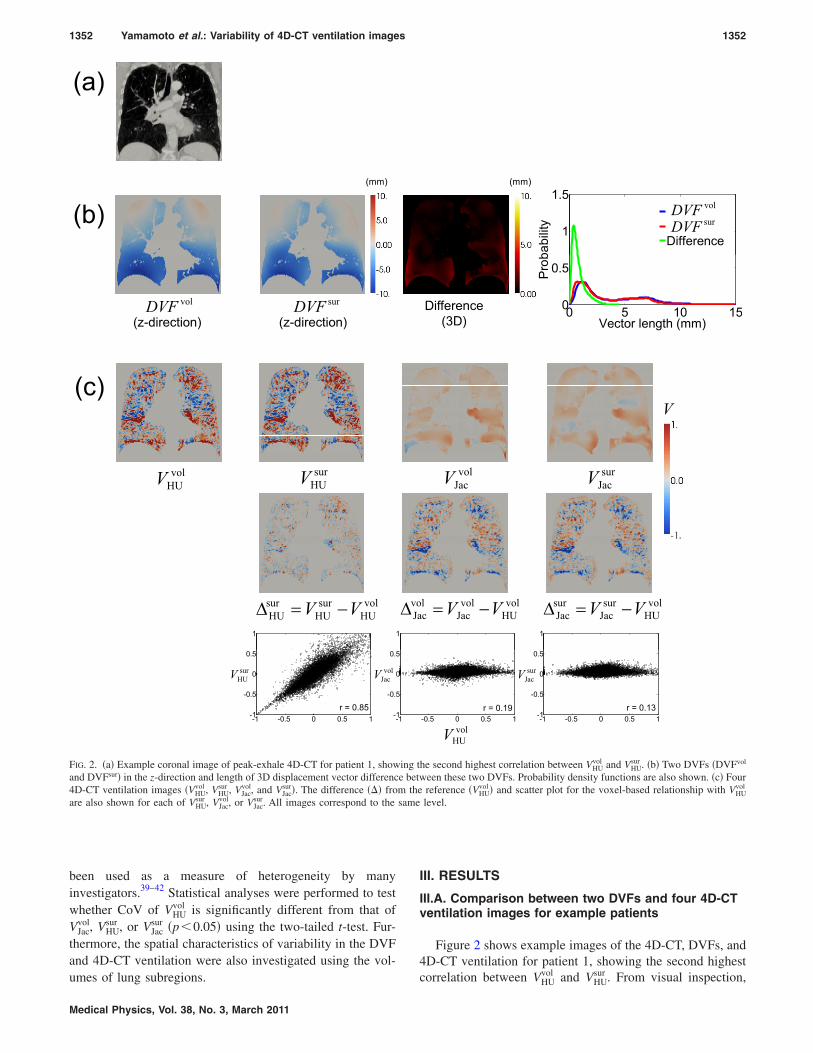
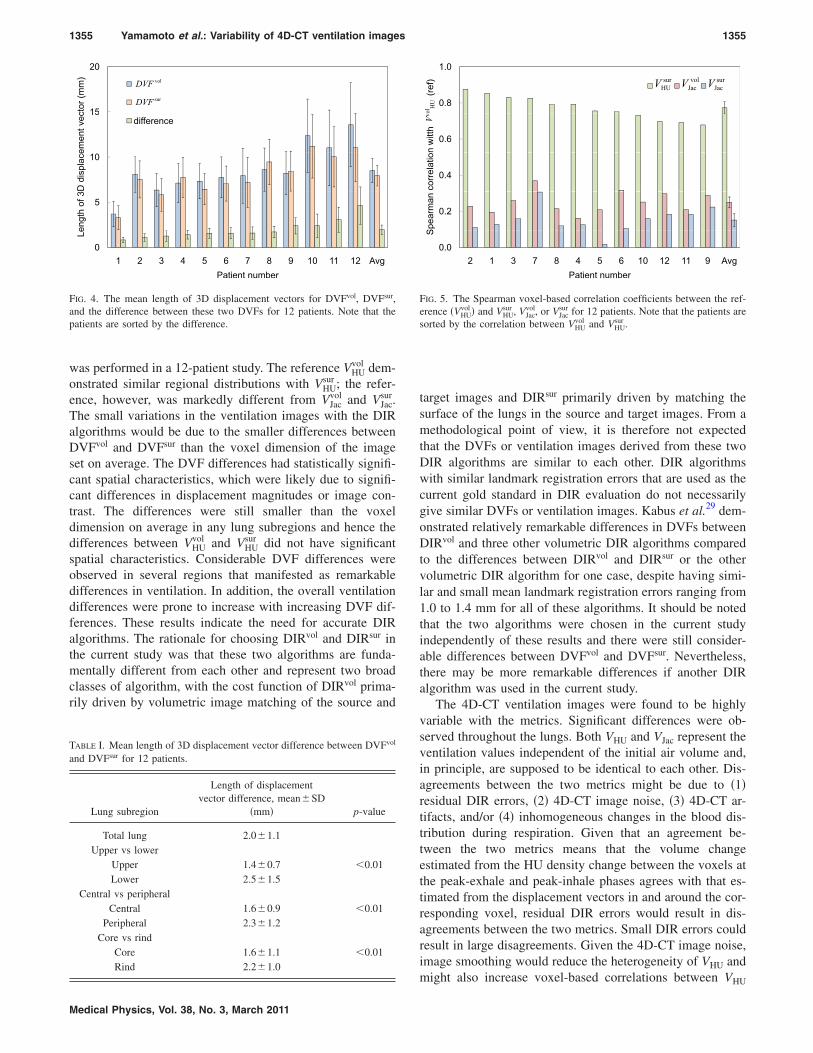
III.B. Differences between two DVFs for the 12-patientcohort
Figure 4 shows the mean length of 3D displacement vec-tors for DVFvol, DVFsur, and difference between these two
DVFs for 12 patients. On average, the vector difference was2.0!1.1 mm, i.e., both the mean and SD were smaller thanthe voxel dimension of the image set. Two patients demon-strated the mean differences larger than the voxel dimension,i.e., 3.1!2.8 mm for patient 11 and 4.6!4.1 mm for pa-tient 12. The differences were prone to increase with increas-ing displacement vectors as expected from large differencesbetween the peak-exhale and peak-inhale 4D-CT images tobe registered.
Table I shows the mean length of displacement vectordifference between DVFvol and DVFsur for each lung subre-gion. The lower, peripheral, or rind lung region demonstratedsignificantly larger difference compared to the upper, central,or core region, respectively; however, the differences weresmaller than the voxel dimension in any regions. The signifi-cant differences between the upper and lower regions andbetween the central and peripheral regions were likely due tosignificant differences in displacement magnitudes. Themean vector lengths for DVFvol were 5.2!1.8 mm in theupper region or 7.9!2.7 mm in the central region, whichwere significantly smaller than 12.5!3.9 mm in the lowerregion !p$0.01" or 9.0!2.7 mm in the peripheral region!p$0.01", respectively. The significant differences betweenthe core and rind regions were probably due to contrast dif-ferences. Pulmonary structures show a higher contrast in thecore regions, which enables DIR to find correct alignments,compared to the rind regions.
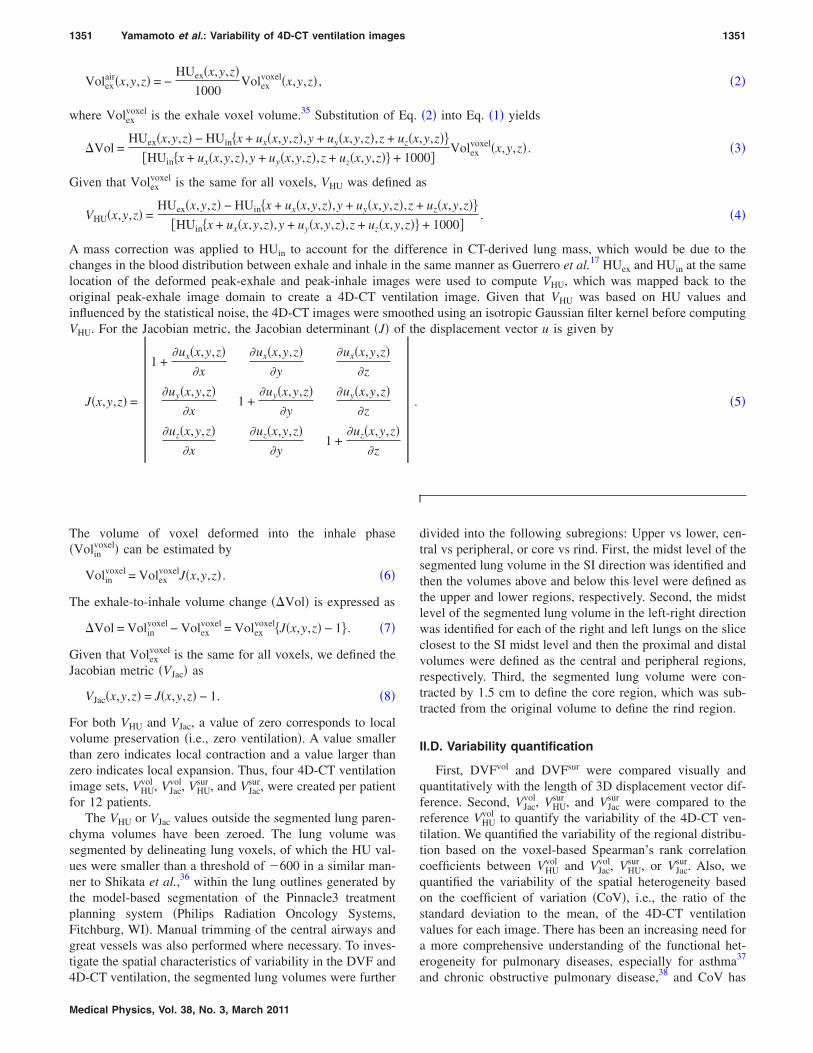
III.C. Voxel-based correlations between four 4D-CTventilation images for the 12-patient cohort
Figure 5 shows the Spearman voxel-based correlation co-efficients between VHU
vol and VHUsur , VJac
vol, or VJacsur for 12 patients.
The correlations with VHUsur !mean 0.77!0.06" were consis-
tently higher than those with VJacvol !0.25!0.06" for all pa-
tients. The correlations with VJacvol were also consistently
higher than those with VJacsur !0.15!0.07". These results indi-
cate that the regional distribution of 4D-CT ventilation im-ages was more variable with the metrics compared with theDIR algorithms investigated in this study. In general, thecorrelations with VHU
sur decreased with increasing displace-ment vector differences !note that small patient numbers rep-resent small vector differences as described in Fig. 4". How-ever, the correlations with VJac
vol or VJacsur were found to be
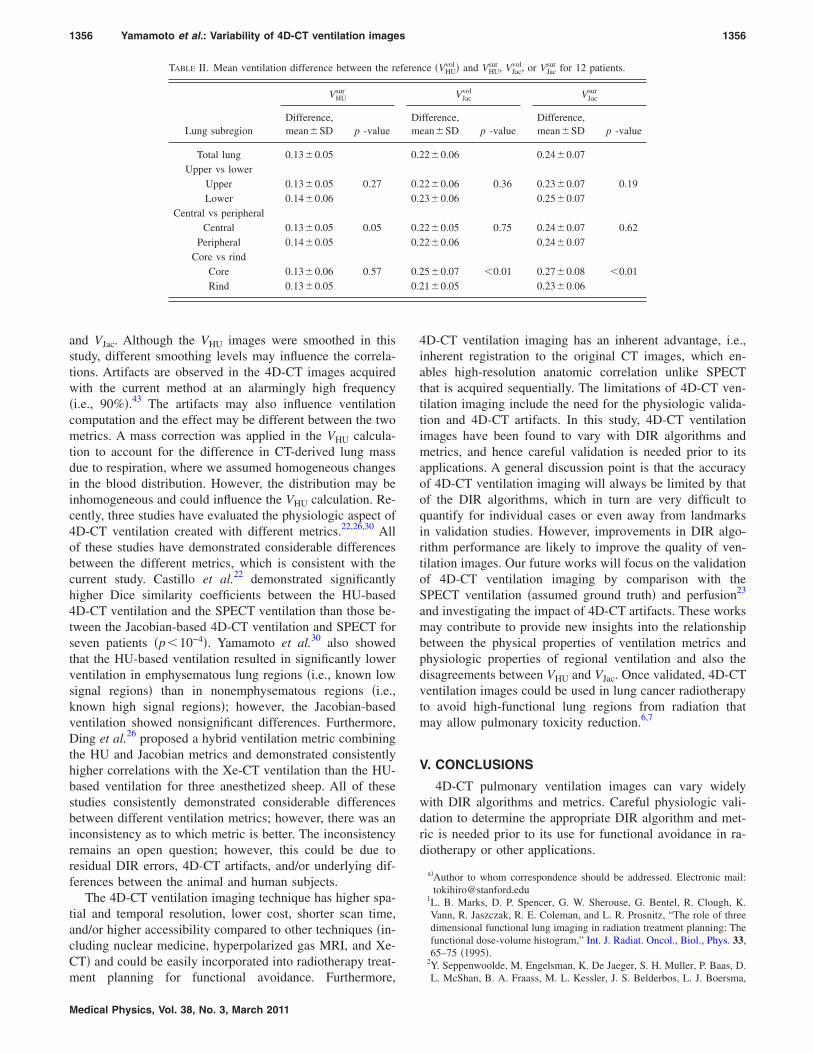
independent of the displacement vector differences.Table II shows the mean ventilation difference between
VHUvol and VHU
sur , VJacvol, or VJac
sur for each lung subregion. VJacsur dem-
onstrated consistently larger differences than VJacvol in any re-
gion and VJacvol also demonstrated larger differences than VHU
sur .The VHU
sur difference did not show any significant spatial char-acteristics, even though the DVF difference did as describedabove in Sec. III B. This would be due to smaller DVF dif-ferences on average than the voxel dimension. The differ-ences of VJac
vol and VJacsur were significantly larger in the core
region than in the rind region. The cause is unclear but mightbe due to residual DIR errors, 4D-CT artifacts, and/or inho-mogeneous changes in the blood distribution during respira-tion, which are discussed in detail below in Sec. IV.
1353 Yamamoto et al.: Variability of 4D-CT ventilation images 1353
Medical Physics, Vol. 38, No. 3, March 2011
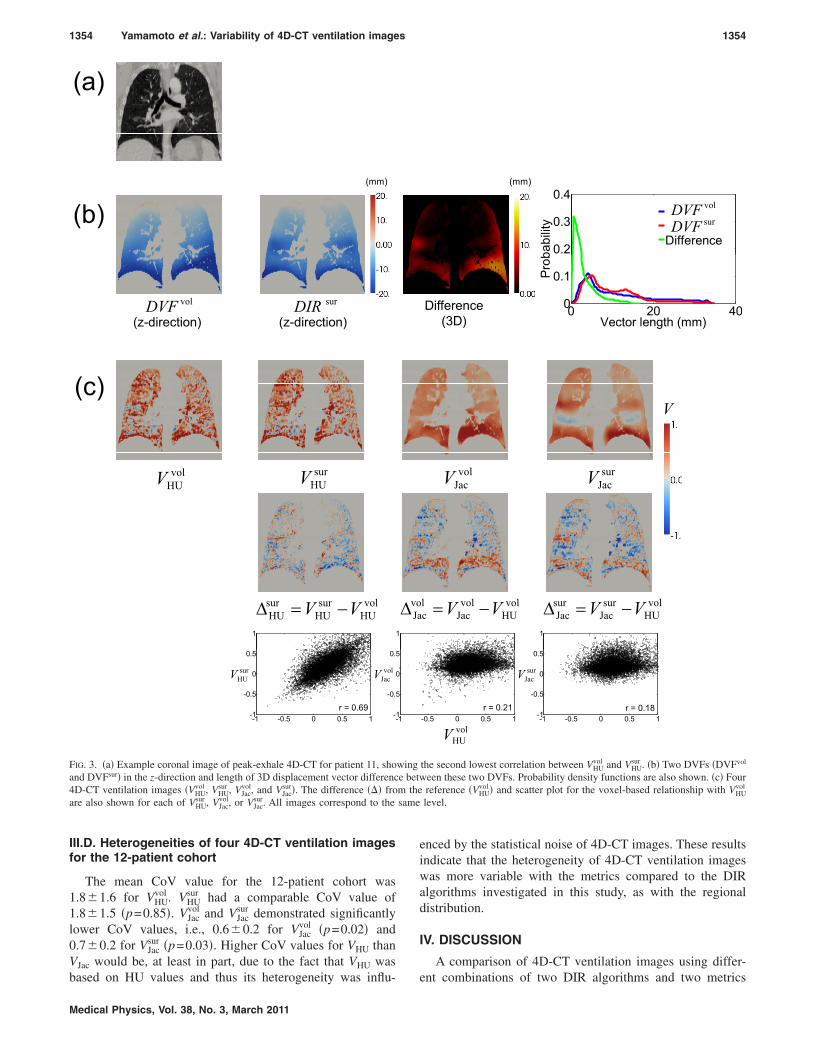
III.D. Heterogeneities of four 4D-CT ventilation imagesfor the 12-patient cohort
The mean CoV value for the 12-patient cohort was1.8!1.6 for VHU
vol . VHUsur had a comparable CoV value of
1.8!1.5 !p=0.85". VJacvol and VJac
sur demonstrated significantlylower CoV values, i.e., 0.6!0.2 for VJac
vol !p=0.02" and0.7!0.2 for VJac
sur !p=0.03". Higher CoV values for VHU thanVJac would be, at least in part, due to the fact that VHU wasbased on HU values and thus its heterogeneity was influ-
enced by the statistical noise of 4D-CT images. These resultsindicate that the heterogeneity of 4D-CT ventilation imageswas more variable with the metrics compared to the DIRalgorithms investigated in this study, as with the regionaldistribution.
IV. DISCUSSION
A comparison of 4D-CT ventilation images using differ-ent combinations of two DIR algorithms and two metrics
(a)
(mm) (mm)
0.2
0.3
0.4
bability
Difference
volDVFsurDVF(b)
volDVF surDIR(z-direction) (z-direction)
Difference(3D)
0 20 400
0.1
Vector length (mm)
Prob
V(c)
volHUV
surHUV
volJacV
surJacV
1 1 1
volHU
surHU
surHU VV !=" vol
HUvolJac
volJac VV !=" vol
HUsurJac
surJac VV !="
volHUV
-1 -0.5 0 0.5 1-1
-0.5
0
0.5
r = 0.69
surHUV
-1 -0.5 0 0.5 1-1
-0.5
0
0.5
r = 0.21
volJacV
-1 -0.5 0 0.5 1-1
-0.5
0
0.5
r = 0.18
surJacV
FIG. 3. !a" Example coronal image of peak-exhale 4D-CT for patient 11, showing the second lowest correlation between VHUvol and VHU
sur . !b" Two DVFs !DVFvol
and DVFsur" in the z-direction and length of 3D displacement vector difference between these two DVFs. Probability density functions are also shown. !c" Four4D-CT ventilation images !VHU
vol , VHUsur , VJac
vol, and VJacsur". The difference !"" from the reference !VHU
vol " and scatter plot for the voxel-based relationship with VHUvol
are also shown for each of VHUsur , VJac
vol, or VJacsur. All images correspond to the same level.
1354 Yamamoto et al.: Variability of 4D-CT ventilation images 1354
Medical Physics, Vol. 38, No. 3, March 2011
was performed in a 12-patient study. The reference VHUvol dem-
onstrated similar regional distributions with VHUsur ; the refer-
ence, however, was markedly different from VJacvol and VJac
sur.The small variations in the ventilation images with the DIRalgorithms would be due to the smaller differences betweenDVFvol and DVFsur than the voxel dimension of the imageset on average. The DVF differences had statistically signifi-cant spatial characteristics, which were likely due to signifi-cant differences in displacement magnitudes or image con-trast. The differences were still smaller than the voxeldimension on average in any lung subregions and hence thedifferences between VHU
vol and VHUsur did not have significant
spatial characteristics. Considerable DVF differences wereobserved in several regions that manifested as remarkabledifferences in ventilation. In addition, the overall ventilationdifferences were prone to increase with increasing DVF dif-ferences. These results indicate the need for accurate DIRalgorithms. The rationale for choosing DIRvol and DIRsur inthe current study was that these two algorithms are funda-mentally different from each other and represent two broadclasses of algorithm, with the cost function of DIRvol prima-rily driven by volumetric image matching of the source and
target images and DIRsur primarily driven by matching thesurface of the lungs in the source and target images. From amethodological point of view, it is therefore not expectedthat the DVFs or ventilation images derived from these twoDIR algorithms are similar to each other. DIR algorithmswith similar landmark registration errors that are used as thecurrent gold standard in DIR evaluation do not necessarilygive similar DVFs or ventilation images. Kabus et al.29 dem-onstrated relatively remarkable differences in DVFs betweenDIRvol and three other volumetric DIR algorithms comparedto the differences between DIRvol and DIRsur or the othervolumetric DIR algorithm for one case, despite having simi-lar and small mean landmark registration errors ranging from1.0 to 1.4 mm for all of these algorithms. It should be notedthat the two algorithms were chosen in the current studyindependently of these results and there were still consider-able differences between DVFvol and DVFsur. Nevertheless,there may be more remarkable differences if another DIRalgorithm was used in the current study.
The 4D-CT ventilation images were found to be highlyvariable with the metrics. Significant differences were ob-served throughout the lungs. Both VHU and VJac represent theventilation values independent of the initial air volume and,in principle, are supposed to be identical to each other. Dis-agreements between the two metrics might be due to !1"residual DIR errors, !2" 4D-CT image noise, !3" 4D-CT ar-tifacts, and/or !4" inhomogeneous changes in the blood dis-tribution during respiration. Given that an agreement be-tween the two metrics means that the volume changeestimated from the HU density change between the voxels atthe peak-exhale and peak-inhale phases agrees with that es-timated from the displacement vectors in and around the cor-responding voxel, residual DIR errors would result in dis-agreements between the two metrics. Small DIR errors couldresult in large disagreements. Given the 4D-CT image noise,image smoothing would reduce the heterogeneity of VHU andmight also increase voxel-based correlations between VHU
1.0
0.8
(ref) V V V
olHU
surHUV
volJacV
surJacV
0.6
nwitthVv
0.4
correlatio
0.2
Spearman
0.02 1 3 7 8 4 5 6 10 12 11 9 Avg
S
Patient number
FIG. 5. The Spearman voxel-based correlation coefficients between the ref-erence !VHU
vol " and VHUsur , VJac
vol, or VJacsur for 12 patients. Note that the patients are
sorted by the correlation between VHUvol and VHU
sur .
20
15ctor(mm)
DIRvol
DIRsur
volDVFsurDVF
15
ementvec difference
10
3Ddisplace
5
engthof3
01 2 3 4 5 6 7 8 9 10 11 12 Avg
Le
Patient number
FIG. 4. The mean length of 3D displacement vectors for DVFvol, DVFsur,and the difference between these two DVFs for 12 patients. Note that thepatients are sorted by the difference.
TABLE I. Mean length of 3D displacement vector difference between DVFvol
and DVFsur for 12 patients.
Lung subregion
Length of displacementvector difference, mean!SD
!mm" p-value
Total lung 2.0!1.1Upper vs lower
Upper 1.4!0.7 $0.01Lower 2.5!1.5
Central vs peripheralCentral 1.6!0.9 $0.01
Peripheral 2.3!1.2Core vs rind
Core 1.6!1.1 $0.01Rind 2.2!1.0
1355 Yamamoto et al.: Variability of 4D-CT ventilation images 1355
Medical Physics, Vol. 38, No. 3, March 2011
and VJac. Although the VHU images were smoothed in thisstudy, different smoothing levels may influence the correla-tions. Artifacts are observed in the 4D-CT images acquiredwith the current method at an alarmingly high frequency!i.e., 90%".43 The artifacts may also influence ventilationcomputation and the effect may be different between the twometrics. A mass correction was applied in the VHU calcula-tion to account for the difference in CT-derived lung massdue to respiration, where we assumed homogeneous changesin the blood distribution. However, the distribution may beinhomogeneous and could influence the VHU calculation. Re-cently, three studies have evaluated the physiologic aspect of4D-CT ventilation created with different metrics.22,26,30 Allof these studies have demonstrated considerable differencesbetween the different metrics, which is consistent with thecurrent study. Castillo et al.22 demonstrated significantlyhigher Dice similarity coefficients between the HU-based4D-CT ventilation and the SPECT ventilation than those be-tween the Jacobian-based 4D-CT ventilation and SPECT forseven patients !p$10!4". Yamamoto et al.30 also showedthat the HU-based ventilation resulted in significantly lowerventilation in emphysematous lung regions !i.e., known lowsignal regions" than in nonemphysematous regions !i.e.,known high signal regions"; however, the Jacobian-basedventilation showed nonsignificant differences. Furthermore,Ding et al.26 proposed a hybrid ventilation metric combiningthe HU and Jacobian metrics and demonstrated consistentlyhigher correlations with the Xe-CT ventilation than the HU-based ventilation for three anesthetized sheep. All of thesestudies consistently demonstrated considerable differencesbetween different ventilation metrics; however, there was aninconsistency as to which metric is better. The inconsistencyremains an open question; however, this could be due toresidual DIR errors, 4D-CT artifacts, and/or underlying dif-ferences between the animal and human subjects.
The 4D-CT ventilation imaging technique has higher spa-tial and temporal resolution, lower cost, shorter scan time,and/or higher accessibility compared to other techniques !in-cluding nuclear medicine, hyperpolarized gas MRI, and Xe-CT" and could be easily incorporated into radiotherapy treat-ment planning for functional avoidance. Furthermore,
4D-CT ventilation imaging has an inherent advantage, i.e.,inherent registration to the original CT images, which en-ables high-resolution anatomic correlation unlike SPECTthat is acquired sequentially. The limitations of 4D-CT ven-tilation imaging include the need for the physiologic valida-tion and 4D-CT artifacts. In this study, 4D-CT ventilationimages have been found to vary with DIR algorithms andmetrics, and hence careful validation is needed prior to itsapplications. A general discussion point is that the accuracyof 4D-CT ventilation imaging will always be limited by thatof the DIR algorithms, which in turn are very difficult toquantify for individual cases or even away from landmarksin validation studies. However, improvements in DIR algo-rithm performance are likely to improve the quality of ven-tilation images. Our future works will focus on the validationof 4D-CT ventilation imaging by comparison with theSPECT ventilation !assumed ground truth" and perfusion23
and investigating the impact of 4D-CT artifacts. These worksmay contribute to provide new insights into the relationshipbetween the physical properties of ventilation metrics andphysiologic properties of regional ventilation and also thedisagreements between VHU and VJac. Once validated, 4D-CTventilation images could be used in lung cancer radiotherapyto avoid high-functional lung regions from radiation thatmay allow pulmonary toxicity reduction.6,7
V. CONCLUSIONS
4D-CT pulmonary ventilation images can vary widelywith DIR algorithms and metrics. Careful physiologic vali-dation to determine the appropriate DIR algorithm and met-ric is needed prior to its use for functional avoidance in ra-diotherapy or other applications.
a"Author to whom correspondence should be addressed. Electronic mail:[email protected]
1L. B. Marks, D. P. Spencer, G. W. Sherouse, G. Bentel, R. Clough, K.Vann, R. Jaszczak, R. E. Coleman, and L. R. Prosnitz, “The role of threedimensional functional lung imaging in radiation treatment planning: Thefunctional dose-volume histogram,” Int. J. Radiat. Oncol., Biol., Phys. 33,65–75 !1995".
2Y. Seppenwoolde, M. Engelsman, K. De Jaeger, S. H. Muller, P. Baas, D.L. McShan, B. A. Fraass, M. L. Kessler, J. S. Belderbos, L. J. Boersma,
TABLE II. Mean ventilation difference between the reference !VHUvol " and VHU
sur , VJacvol, or VJac
sur for 12 patients.
Lung subregion
VHUsur VJac
vol VJacsur
Difference,mean!SD p -value
Difference,mean!SD p -value
Difference,mean!SD p -value
Total lung 0.13!0.05 0.22!0.06 0.24!0.07Upper vs lower
Upper 0.13!0.05 0.27 0.22!0.06 0.36 0.23!0.07 0.19Lower 0.14!0.06 0.23!0.06 0.25!0.07
Central vs peripheralCentral 0.13!0.05 0.05 0.22!0.05 0.75 0.24!0.07 0.62
Peripheral 0.14!0.05 0.22!0.06 0.24!0.07Core vs rind
Core 0.13!0.06 0.57 0.25!0.07 $0.01 0.27!0.08 $0.01Rind 0.13!0.05 0.21!0.05 0.23!0.06
1356 Yamamoto et al.: Variability of 4D-CT ventilation images 1356
Medical Physics, Vol. 38, No. 3, March 2011
and J. V. Lebesque, “Optimizing radiation treatment plans for lung cancerusing lung perfusion information,” Radiother. Oncol. 63, 165–177 !2002".
3J. A. Christian, M. Partridge, E. Nioutsikou, G. Cook, H. A. McNair, B.Cronin, F. Courbon, J. L. Bedford, and M. Brada, “The incorporation ofSPECT functional lung imaging into inverse radiotherapy planning fornon-small cell lung cancer,” Radiother. Oncol. 77, 271–277 !2005".
4S. M. McGuire, S. Zhou, L. B. Marks, M. Dewhirst, F. F. Yin, and S. K.Das, “A methodology for using SPECT to reduce intensity-modulatedradiation therapy !IMRT" dose to functioning lung,” Int. J. Radiat. Oncol.,Biol., Phys. 66, 1543–1552 !2006".
5Y. Shioyama, S. Y. Jang, H. H. Liu, T. Guerrero, X. Wang, I. W. Gayed,W. D. Erwin, Z. Liao, J. Y. Chang, M. Jeter, B. P. Yaremko, Y. O. Borgh-ero, J. D. Cox, R. Komaki, and R. Mohan, “Preserving functional lungusing perfusion imaging and intensity-modulated radiation therapy foradvanced-stage non-small cell lung cancer,” Int. J. Radiat. Oncol., Biol.,Phys. 68, 1349–1358 !2007".
6B. P. Yaremko, T. M. Guerrero, J. Noyola-Martinez, R. Guerra, D. G.Lege, L. T. Nguyen, P. A. Balter, J. D. Cox, and R. Komaki, “Reductionof normal lung irradiation in locally advanced non-small-cell lung cancerpatients, using ventilation images for functional avoidance,” Int. J. Radiat.Oncol., Biol., Phys. 68, 562–571 !2007".
7T. Yamamoto, S. Kabus, J. von Berg, C. Lorenz, and P. J. Keall, “Impactof four-dimensional computed tomography pulmonary ventilationimaging-based functional avoidance for lung cancer radiotherapy,” Int. J.Radiat. Oncol., Biol., Phys. 79, 279–288 !2011".
8P. O. Alderson and B. R. Line, “Scintigraphic evaluation of regionalpulmonary ventilation,” Semin Nucl. Med. 10, 218–242 !1980".
9K. Suga, “Technical and analytical advances in pulmonary ventilationSPECT with xenon-133 gas and Tc-99m-Technegas,” Ann. Nucl. Med.16, 303–310 !2002".
10R. S. Harris and D. P. Schuster, “Visualizing lung function with positronemission tomography,” J. Appl. Physiol. 102, 448–458 !2007".
11M. S. Albert, G. D. Cates, B. Driehuys, W. Happer, B. Saam, C. S.Springer, Jr., and A. Wishnia, “Biological magnetic resonance imagingusing laser-polarized 129Xe,” Nature !London" 370, 199–201 !1994".
12H. Kauczor, R. Surkau, and T. Roberts, “MRI using hyperpolarized noblegases,” Eur. Radiol. 8, 820–827 !1998".
13D. Gur, B. P. Drayer, H. S. Borovetz, B. P. Griffith, R. L. Hardesty, and S.K. Wolfson, “Dynamic computed tomography of the lung: Regional ven-tilation measurements,” J. Comput. Assist. Tomogr. 3, 749–753 !1979".
14C. Marcucci, D. Nyhan, and B. A. Simon, “Distribution of pulmonaryventilation using Xe-enhanced computed tomography in prone and supinedogs,” J. Appl. Physiol. 90, 421–430 !2001".
15J. K. Tajik, D. Chon, C. Won, B. Q. Tran, and E. A. Hoffman, “Subsecondmultisection CT of regional pulmonary ventilation,” Acad. Radiol. 9,130–146 !2002".
16T. Guerrero, K. Sanders, J. Noyola-Martinez, E. Castillo, Y. Zhang, R.Tapia, R. Guerra, Y. Borghero, and R. Komaki, “Quantification of re-gional ventilation from treatment planning CT,” Int. J. Radiat. Oncol.,Biol., Phys. 62, 630–634 !2005".
17T. Guerrero, K. Sanders, E. Castillo, Y. Zhang, L. Bidaut, T. Pan, and R.Komaki, “Dynamic ventilation imaging from four-dimensional computedtomography,” Phys. Med. Biol. 51, 777–791 !2006".
18G. E. Christensen, J. H. Song, W. Lu, I. El Naqa, and D. A. Low, “Track-ing lung tissue motion and expansion/compression with inverse consistentimage registration and spirometry,” Med. Phys. 34, 2155–2163 !2007".
19S. Kabus, J. von Berg, T. Yamamoto, R. Opfer, and P. J. Keall, “Lungventilation estimation based on 4D-CT imaging,” in Proceedings of theFirst International Workshop on Pulmonary Image Analysis, MICCAI2008, pp. 73–81, 2008 !unpublished".
20J. M. Reinhardt, K. Ding, K. Cao, G. E. Christensen, E. A. Hoffman, andS. V. Bodas, “Registration-based estimates of local lung tissue expansioncompared to xenon CT measures of specific ventilation,” Med. ImageAnal. 12, 752–763 !2008".
21T. Vik, S. Kabus, J. von Berg, K. Ens, S. Dries, T. Klinder, and C. Lorenz,“Validation and comparison of registration methods for free-breathing 4Dlung CT,” in Proceedings of SPIE: Medical Imaging, edited by J. M.Reinhardt and J. P. W. Pluim !SPIE, Bellingham, 2008", Vol. 6914, pp.69142P-69141–69142P-69110.
22R. Castillo, E. Castillo, J. Martinez, and T. Guerrero, “Ventilation fromfour-dimensional computed tomography: Density versus Jacobian meth-ods,” Phys. Med. Biol. 55, 4661–4685 !2010".
23T. Yamamoto, S. Kabus, J. von Berg, C. Lorenz, M. L. Goris, B. W. Loo,Jr., and P. J. Keall, “Evaluation of four-dimensional !4D" computed to-mography !CT" pulmonary ventilation imaging by comparison with singlephoton emission computed tomography !SPECT" scans for a lung cancerpatient,” in Proceedings of the Third International Workshop on Pulmo-nary Image Analysis, MICCAI 2010, pp. 117–128, 2010.
24D. R. Simpson, J. D. Lawson, S. K. Nath, B. S. Rose, A. J. Mundt, and L.K. Mell, “Utilization of advanced imaging technologies for target delin-eation in radiation oncology,” J. Am. Coll. Radiol. 6, 876–883 !2009".
25M. K. Fuld, R. B. Easley, O. I. Saba, D. Chon, J. M. Reinhardt, E. A.Hoffman, and B. A. Simon, “CT-measured regional specific volumechange reflects regional ventilation in supine sheep,” J. Appl. Physiol.104, 1177–1184 !2008".
26K. Ding, K. Cao, R. E. Amelon, G. E. Christensen, M. L. Raghavan, andJ. M. Reinhardt, “Comparison of intensity- and Jacobian-based estimatesof lung regional ventilation,” in Proceedings of the Third InternationalWorkshop on Pulmonary Image Analysis, MICCAI 2010, pp. 49–60,2010.
27R. Kashani, M. Hub, J. M. Balter, M. L. Kessler, L. Dong, L. Zhang, L.Xing, Y. Xie, D. Hawkes, J. A. Schnabel, J. McClelland, S. Joshi, Q.Chen, and W. Lu, “Objective assessment of deformable image registrationin radiotherapy: A multi-institution study,” Med. Phys. 35, 5944–5953!2008".
28K. K. Brock, “Results of a multi-institution deformable registration accu-racy study !MIDRAS",” Int. J. Radiat. Oncol., Biol., Phys. 76, 583–596!2009".
29S. Kabus, T. Klinder, K. Murphy, B. van Ginneken, C. Lorenz, and J. P.W. Pluim, “Evaluation of 4D-CT lung registration,” in Proceedings ofMICCAI 2009, edited by G. Z. Yang, D. J. Hawkes, D. Rueckert, J. A.Noble, and C. J. Taylor, London, United Kingdom, pp. 747–754, 2009.
30T. Yamamoto, S. Kabus, J. von Berg, T. Klinder, T. Blaffert, C. Lorenz,and P. J. Keall, “Physiological validation of 4D-CT-based ventilation im-aging in patients with chronic obstructive pulmonary disease !COPD",”Med. Phys. 36, 2821 !2009".
31S. Kabus and C. Lorenz, “Fast elastic image registration,” in Proceedingsof the Medical Image Analysis For The Clinic-A Grand Challenge,MICCAI 2010, pp. 81–89.
32J. von Berg, H. Barschdorf, T. Blaffert, S. Kabus, and C. Lorenz, “Surfacebased cardiac and respiratory motion extraction for pulmonary structuresfrom multi-phase CT,” in Proceedings of SPIE: Medical Imaging, editedby A. Manduca and X. P. Hu !SPIE, Bellingham, 2007", Vol. 6511, pp.65110Y.
33R. Castillo, E. Castillo, R. Guerra, V. E. Johnson, T. McPhail, A. K. Garg,and T. Guerrero, “A framework for evaluation of deformable image reg-istration spatial accuracy using large landmark point sets,” Phys. Med.Biol. 54, 1849–1870 !2009".
34B. A. Simon, “Non-invasive imaging of regional lung function usingx-ray computed tomography,” J. Clin. Monit Comput. 16, 433–442!2000".
35E. A. Hoffman and E. L. Ritman, “Effect of body orientation on regionallung expansion in dog and sloth,” J. Appl. Physiol. 59, 481–491 !1985".
36H. Shikata, E. A. Hoffman, and M. Sonka, “Automated segmentation ofpulmonary vascular tree from 3D CT images,” in Proceedings of SPIE:Medical Imaging, edited by A. A. Amini and A. Manduca !SPIE, Bell-ingham, 2004", Vol. 5369, pp. 107.
37Y. S. Tzeng, K. Lutchen, and M. Albert, “The difference in ventilationheterogeneity between asthmatic and healthy subjects quantified usinghyperpolarized 3He MRI,” J. Appl. Physiol. 106, 813–822 !2009".
38M. F. Vidal Melo, T. Winkler, R. S. Harris, G. Musch, R. E. Greene, andJ. G. Venegas, “Spatial heterogeneity of lung perfusion assessed with!13"N PET as a vascular biomarker in chronic obstructive pulmonarydisease,” J. Nucl. Med. 51, 57–65 !2010".
39M. N. Melsom, J. Kramer-Johansen, T. Flatebo, C. Muller, and G. Nico-laysen, “Distribution of pulmonary ventilation and perfusion measuredsimultaneously in awake goats,” Acta Physiol. Scand. 159, 199–208!1997".
40M. Mure, K. B. Domino, S. G. Lindahl, M. P. Hlastala, W. A. Altemeier,and R. W. Glenny, “Regional ventilation-perfusion distribution is moreuniform in the prone position,” J. Appl. Physiol. 88, 1076–1083 !2000".
41J. Xu, M. Moonen, A. Johansson, A. Gustafsson, and B. Bake, “Quanti-tative analysis of inhomogeneity in ventilation SPET,” Eur. J. Nucl. Med.28, 1795–1800 !2001".
1357 Yamamoto et al.: Variability of 4D-CT ventilation images 1357
Medical Physics, Vol. 38, No. 3, March 2011
42H. T. Robertson, T. C. Kreck, and M. A. Krueger, “The spatial and tem-poral heterogeneity of regional ventilation: Comparison of measurementsby two high-resolution methods,” Respir. Physiol. Neurbiol. 148, 85–95!2005".
43T. Yamamoto, U. Langner, B. W. Loo, Jr., J. Shen, and P. J. Keall, “Ret-rospective analysis of artifacts in four-dimensional CT images of 50 ab-dominal and thoracic radiotherapy patients,” Int. J. Radiat. Oncol., Biol.,Phys. 72, 1250–1258 !2008".
1358 Yamamoto et al.: Variability of 4D-CT ventilation images 1358
Medical Physics, Vol. 38, No. 3, March 2011